
Methane Hydrate Formation in Marine Sediment from South China Sea with Different Water Saturations
by
 and
and
Yu Zhang
1,2,3,4, 
Xiaosen Li
1,2,3,4,*,
Yi Wang
1,2,3,4,
Zhaoyang Chen
1,2,3,4 and
Gang Li
1,2,3,4 1
Guangzhou Institute of Energy Conversion, Chinese Academy of Sciences, Guangzhou 510640, China
2
CAS Key Laboratory of Gas Hydrate, Guangzhou 510640, China
3
Guangdong Provincial Key Laboratory of New and Renewable Energy Research and Development, Guangzhou 510640, China
4
Guangzhou Center for Gas Hydrate Research, Chinese Academy of Sciences, Guangzhou 510640, China
*
Author to whom correspondence should be addressed.
Energies 2017, 10(4), 561; https://doi.org/10.3390/en10040561
Submission received: 22 December 2016
/
Revised: 28 March 2017
/
Accepted: 5 April 2017
/
Published: 20 April 2017
(This article belongs to the Special Issue Methane Hydrate Research and Development)
Abstract
:The kinetics of methane hydrate formation in marine sediments with different water saturations are important to assess the feasibility of the hydrate production and understand the process of the secondary hydrate formation in the gas production from hydrate reservoir. In this paper, the behaviors of methane hydrate formation in marine sediments from the South China Sea at different water saturation levels were experimentally studied in isobaric conditions. The marine sediments used in the experiments have the mean pore diameter of 12.178 nm, total pore volume of 4.997 × 10⁻² mL/g and surface area of 16.412 m2/g. The volume fraction of water in the marine sediments ranges from 30% to 50%. The hydrate formation rate and the final water conversion increase with the decrease of the formation temperature at the water saturation of 40%. At the same experimental conditions, the hydrate formation rate decreases with the increase of the water saturation from 40% to 50% due to the reduction of the gas diffusion speed. At the water saturation of 30%, the hydrate formation rate is lower than that at the water saturation of 40% due to the effect of the equilibrium hydrate formation pressure, which increases with the decrease of the water saturation. The final water conversion is shown to increase with the increase of the water saturation, even the formation process at higher water did not end. The experiments at low water saturation show a better repeatability than that at high water saturation.
1. Introduction
Natural gas hydrates (NGHs) are widely distributed in earth and have been recognized as a potential energy resource [1]. Currently, the explored and proven NGH reservoirs mainly distribute in the ocean and permafrost, and the reserve in the ocean is far larger than the total reserve in the permafrost [2,3]. It is well-known that most of the naturally gas hydrates exist in the form of inclusions within sediment (contains silica sand, sand stone, clays, etc.), with only six percent of NGHs occur in the form of bulk hydrates in nature [3]. In order to recover natural gas hydrate from seabed sediments, it is important to understand the kinetics of gas hydrate formation and decomposition in marine sediments. The hydrate formation behaviors in porous media are important for the reliable assessment of the feasibility of producing natural gas from the earth’s gas hydrate reservoir and the application of the hydrate formation method. In addition, the secondary hydrate formation was observed in the gas production from hydrate reservoir through numerical simulation. The secondary hydrates play a role in reducing the effective permeability, resulting in the gas accumulation and a low gas production rate [4,5,6]. This is caused by the gas and water flow toward the upper well in the gas production process, in which the water saturation may change rapidly. Therefore, it is important to study the hydrate formation behaviors in marine sediments with different water saturations.
In regard to the kinetics of bulk hydrate systems, the formation kinetics of the hydrate in the sediments are affected by many factors, including not only the pressure, temperature and the rate constant, but also the specific surface area and the characteristics of host sediment, etc. [7,8,9,10]. Zhou et al. [11] measured hydrate formation data in the water-saturated silica sand and achieved a comparatively low conversion (only 11%) of the water to hydrate. They found that particle size distribution plays an important role in hydrate formation, and available void spaces (which are not filled with water) also affect the hydrate formation kinetics. Linga et al. [12] also reported the data of hydrate formation in silica sand bed (particle size 329 µm) and they achieved 74% water to hydrate conversion in a (spatially) heterogeneous manner. Liu et al. [13] found that the methane hydrate formed in silica sands has the similar characteristics regarding cage occupancy and hydration number with bulk hydrate. The particle size does not have influence on the hydrate composition. Katsuki et al. [14] observed that the crystal morphology in the porous medium filled with the methane-saturated liquid water depends upon the magnitude of the mass transfer of the methane molecules in the liquid water. Babu et al. [15] observed a clear hydrate front moving across the bed in a 50% water saturated silica sand bed during the hydrate formation process, and hydrate crystals were observed to form in the interstitial pore space available between the silica sand particles. The water content of the sediments was found to have a significant impact on the formation behaviors of gas hydrates. Fitzgerald et al. [16] studied the formation behaviors of methane hydrate in the pore space of glass beads at various water saturations. They observed that the hydrate formation displays multistage formation behavior and the hydrate growth rate is higher for systems with the lower initial water saturation. Bagherzadeh et al. [17] investigated the formation kinetics of methane hydrate in different water saturated silica sand beds (100%, 75%, 50%, and 25%) through magnetic resonance imaging techniques. Faster hydrate formation in a bed with lower water content was observed, which shows that there is a better contact of hydrate forming gas with available water due to the void spaces available in a partially saturated bed, thus resulting in higher water to hydrate conversion. Kumar et al. [18] studied the effects of different ratios of the silica sand and clay, and the different water saturation on hydrate formation behaviors. It was proven that the presence of the clay reduces the hydrate formation kinetics significantly, and lower water saturation leads to the higher conversion rate of water to hydrate in both of the pure sand bed and the sand-clay mixture bed.
In 2007, China announced the first time to recover gas hydrate samples at the water depth 1500 m and 200 m below seafloor level in the Shenhu area, south of the Pearl River Mouth Basin [19]. Sun et al. [20] found that the equilibrium temperature of methane hydrate in the sediment sample from the South China Sea with in situ pore water was decreased compared to the bulk hydrate, and it was controlled by the pore water ions. In our previous work, the equilibrium formation conditions of methane hydrate in different samples of marine sediments were measured. It was found that the equilibrium hydrate formation pressure increases with the decrease of the water saturation in the sediments at a given temperature [21]. Till now, compared to the studies of the equilibrium conditions, most of the studies of the hydrate formation kinetics were carried out in pure silica sand and glass beads in the lab. There is few studies on the hydrate formation behaviors in marine sediments.
In the present work, to provide the experimental data for using in future hydrate exploitation from marine sediments, and to gain a better understanding of the hydrate formation properties in marine sediments with different water saturations, we have performed experiments and investigated the formation behaviors of methane hydrates in marine sediments from the South Sea of China. The experiments were carried out in the temperature range of 274.15–281.15 K and the initial formation pressure of 14.4 MPa.
2. Experimental Section
2.1. Apparatus
The details of the experimental apparatus have been reported in our previous work [22,23]. As shown in Figure 1, the experimental apparatus consists of the high-pressure hydrate crystallizer (CR), the supply vessel (SV), the gas/liquid supply system, the temperature-controlled water bath and the data acquisition system. The effective maximum volume of the cell of the crystallizer and the supply vessel is 416 and 1091 cm3, respectively. The cell of crystallizer is volume-variable with a movable piston The Proportion Integration Differentiation (PID) regulator and the pressure (P) controller are used to control the pressure in the high-pressure hydrate crystallizer (CR). Two pressure (P) transducers (MBS3000, Danfoss, Copenhagen, Denmark) are employed for pressure measurement, with a maximum certainty of 0.01% of the span (0–25 MPa). A Pt1000 thermoprobe (JM6081, JinMing, Tianjin, China) is used to measure the temperature in the crystallizer within a precision of ±0.05 K. The crystallizer temperature is controlled by a temperature-controlled water bath within a range of 263.15–303.15 K and with an uncertainty of 0.1 K. The signals of the pressure and the temperature are continuously monitored and recorded by a data acquisition system coupled with a computer [22,23].
2.2. Materials
The methane with the purity of 99.9% was supplied by Foshan Hua Te Gas Co. The marine sediments from the Shenhu Area in the South China Sea were supplied by Guangzhou Geological Survey. The physical properties of the sediment samples are listed in Table 1. The density of the dry samples was measured by the true density meter (VPY-30, Quantachrome, Boynton Beach, FL, USA). The particle diameter distributions of the dry samples were measured by the Mastersizer 2000 particle size analyzer (Malvern Instruments. Ltd., Worcestershire, UK), as shown in Table 2. It can be seen that the distributions of particle sizes consist of silty sand level (69.79%), fine sand level (15.51%), medium sand level (2.73%), clay level (2.48%), coarse sand level (0.3%) and gravel level (0). The measured particle diameter distributions are also shown in Figure 2. Specific surface area and pore size analyzer (ASIQMO002-2, Quantachrome, Boynton Beach, FL, USA) was used to measure the distributions of pore volume and the specific surface area of the samples. The measured results of pore surface area and pore volume are shown in Table 3.
2.3. Experimental Procedure
The procedure for the sample preparation is as follows. In order to remove the influence of the salt, the sediments were first washed by the deonized water three times. Then the samples were dried at 373.15 K for 24 h and subsequently weighed to determine the dry samples at the room temperature. To obtain the desired water content samples, the water and the dried sediments were mixed in the beaker and stirred sufficiently. The water saturation was determined using the volume ratio of water to the dry marine sediments, as shown in the equation below:
where Vw = mw/ρw is the water volume in the sample, mw is the mass of the added water, ρw is the density of water with the value of 1 g/cm3, and Vb = mb/ρb is the bulk volume of the dry sediments. Here, mb is the mass and ρb is the bulk density of the dry sediments. A known quantity of prepared marine sediments were loaded into the crystallizer. In order to ensure the sameness of the gas–water ratio in all the experiments, the water weight and the volume of the gas in the crystallizer were kept constantly for different experiments by adjusting the effective volume through the piston in the crystallizer under the conditions of different water saturations. In this work, the weight of water used was 47.3 g and the volume of the gas in the crystallizer was 281.0 mL for different experiments. After the samples were loaded, the crystallizer was installed and purged by a vacuum pump to remove the remaining air. The crystallizer was cooled to the desired value of the formation temperature by adjusting the water bath. Once the temperature of the system was stabilized, methane gas was charged into the crystallizer and pressured up to the desired formation pressure. The pressure change in the crystallizer with time was observed and recorded. When the pressure drop in the crystallizer was less than 0.01 MPa over 3 h, the formation of hydrate was assumed to be complete. The moles of methane consumed at time t were calculated using the Equation (2) on basis of the measured data of pressure and temperature:
where P is the system pressure at time t; P0 is the initial formation pressure; T is system temperature at time t; T0 is the initial system temperature; V is the volume of the gas space in the crystallizer, which is specified to be a constant for all tests. The compressibility factor Z was calculated from the Soave-Redlich-Kwong (SRK) equation [24]. Assuming that there is 6.10 mol of water in 1 mol of methane hydrate, the water conversion can be calculated by the methane consumption [25].
The rate of hydrate formation was calculated every 10 min by forward differentiation
Subsequently, the average rate for every 10 min period was calculated.
3. Results and Discussion
Table 4 summarizes the experimental conditions and results in detail, including the hydrate formation pressure, formation temperature, water saturation, moles of methane enclosed into the hydrate, and water to hydrate conversion at the end of the experiments. The experiments were performed in marine sediments with the water saturation of 30%, 40%, 45% and 50% in isochoric conditions.
Figure 3 represents the data of the pressure drop and the temperature change for methane hydrate formation conducted in the marine sediments with the water saturation of 40% at different formation temperatures under the initial formation pressure of 14.4 MPa (experiments 4, 5a, 6 and 7). Figure 4 gives the comparison of gas uptake (water to hydrate conversion) corresponding to the experiments given in Figure 3. As shown in Figure 3 and Figure 4, the gas uptake rate and the final gas uptake increase with the decrease of the formation temperature, and the formation duration decreases with the decrease of the formation temperature. It is also worth noticing that the pressure curves exhibit a smoother trend. No multistage was observed in the hydrate formation process at the water saturation of 40%. Because the equilibrium hydrate formation pressure increases and the driving force of the hydrate formation decreases as the temperature increases, it should be caused by the difference of the driving force for the hydrate formation [24]. As shown in Table 4, the final water conversion in the experiments at the water saturation of 40% only ranges from 35.98% to 48.98%. As shown in Figure 3, the stable pressure for experiments 4, 5a, 6 and 7 are 12.44, 12.50, 12.52 and 12.75 MPa respectively. As calculated by Li et al. [24], the equilibrium formation pressure for bulk methane hydrate at the temperature of 276.15 K is only 3.50 MPa. It can be seen that, the pressure inside the crystallizer gradually decreases and reaches stable at a higher pressure than the equilibrium hydrate formation pressure for bulk hydrate, resulting in a relatively lower water conversion to hydrate. The final water conversion in these experiments is much lower than that in the work of Linga et al. [12], in which more than 74.0% of water conversion to hydrate was achieved in all experiments conducted in silica sand bed at 4.0 and 1.0 °C. The low water conversion in these experiments may be due to the higher equilibrium hydrate formation pressure in marine sediments than that in silica sand. In porous media, the water has three states, which are bulk water, bound water and surface water in confined space. It was found that the bound water and surface water have lower activity than bulk water, resulting in the higher equilibrium hydrate formation pressure [26]. In the study of Linga et al. [12], the silica sands with the BET surface area of 0.3499 cm2/g and an average diameter of 329 µm were used in the experiments. It has been found that the equilibrium hydrate formation pressure in silica sands is same to bulk hydrate [27]. In this study, the surface area of the marine sediments is 16.412 m2/g, which is much larger than that of silica sands. Because the specific surface area of the marine sediments is very large and consequently more water should contact with the surface of the marine sediments, resulting in the formation depression of the hydrate in sediments [21,28]. In our previous work, the low conversion of water to hydrate was also found in silica gels with different pore diameters of 9.03, 12.95, 17.96 and 33.2 nm. The highest water conversion of 42.63% is obtained at the initial formation pressure of 9.4 MPa and the formation temperature of 276.15 K in the silica gels with the mean pore diameter of 33.2 nm [22]. It was found that the final conversion of water to hydrate increases with the increase of the pore size due to that the equilibrium hydrate formation pressure decreases with the increase of the pore size.
For the bulk hydrate, the equilibrium hydrate formation pressure is 2.90 and 4.24 MPa at the temperature of 274.15 and 278.15 K, respectively. Compared to the bulk hydrate, the final pressure the has a small increase with the increase of the formation temperature, as shown in Figure 3. A possibility is that the stable pressure increases with the increases of the hydrate saturation and the water conversion. Another possibility is the very slow solid body diffusion of methane through a gas hydrate layer that builds at the gas–water interface and will not allow measuring any further conversion on the timescale of lab experiments.
Figure 5 shows the hydrate formation rate in the experiments 4, 5a, and 6 calculated by using Equation (2). It can be found that the hydrate formation rate increases with the decrease of the formation temperature. For the experiments 4 and 5a, the hydrate formation rate is low at the beginning. From Figure 3, it can be seen that the temperature in the crystallizer is much higher than the bath temperature at the beginning due to the temperature increase in the gas injection process, may resulting in a low rate of the hydrate formation. In addition, the delay in oversaturation of gas in water to be reached and the stochastic nature of gas hydrate formation may result in the lower hydrate formation rate in the beginning stage. With the temperature decrease due to the heat transferred from the crystallizer to the water bath, the hydrate formation rate increases. Subsequently, the gas uptake rate in all experiments decreases gradually as the pressure decreases. As shown in Figure 5, the hydrate formation rate in different experiments drops sharply and gets down to zero at about 150 min. However, the hydrate formation duration is longer at the lower formation temperature, but the hydrate formation rate is very low in the later stage.
Figure 6 shows the gas uptake profiles during hydrate formation at various water saturations of 30%, 40%, 45% and 50% (experiments 2a, 5a, 9, and 12a) under the conditions of 14.4 MPa and 276.15 K, respectively. As observed, the gas uptake rate at the beginning in the experiments at different water saturations shows significant difference. The gas uptake rate at the water saturation of 45% and 50% is significantly lower than that at the water saturation of 30% and 40%. Both the hydrate formation rate and the final gas consumption at the water saturation of 40% are higher than those at the water saturation of 30%, but the formation duration is shorter. For the experiments at the water saturation of 45% and 50%, the hydrate formation process can be divided into two periods. It is different from that at the water saturation of 30% and 40%, which has no obvious multistage of the hydrate formation. For a typical example, the first period of experiment 9 is from the initial time to Point A. In the first period, the hydrate forms at a fast rate, which is consistent with that in marine sediments with water saturation of 30% and 40%. The second period is from Point A to the end of the experiment. In the second period, the hydrate formation rate is much lower than that in the first period and decreases gradually as the hydrate formation processes. It also can be found that the hydrate formation rate at the water saturation of 50% is lower than that at the water saturation of 45% in the second period. Because the hydrate formation duration is so long in the experiments at the water saturation of 45% and 50%, the formation processes were not over at the end of the experiments. However, it can be seen that the final gas consumption should be higher than that at the water saturation of 30% and 40%; this is due to the lower equilibrium hydrate formation pressure and higher driving force for the hydrate formation for the experiments at the water saturation of 45% and 50%.
Kumar et al. [18] and Chari et al. [29] have reported that the hydrate forms faster in the sediments with lower water saturation. The experiments of Kumar et al. [18] and Chari et al. [29] were performed in the silica sand with the size distribution of 30–400 µm and spherical silica particles with the diameter of 30–70 µm, respectively. The contact area between gas and water in sediments for the hydrate formation is reduced due to the higher proportion of water in the void space at the higher water saturation. The hydrate formation occurs firstly at the interface between gas and water, which presents a high hydrate formation rate in the first period. After the rapid formation stage, the gas should diffuse through the hydrate layer into the inner of the bed to form the hydrate with the water molecules in the second period. Higher water saturation means higher proportion of the free water and less void space and tortuous pathways in the marine sediments, resulting in lower diffusion speed of methane gas. Therefore, the hydrate formation rate decreases with the increase of the water saturation from 40% to 50%. The phenomena are same to that in the experiments of Kumar et al. [18] and Chari et al. [29]. However, different from the silica sand, the equilibrium hydrate formation pressure in marine sediment increases as the water saturation decreases for a given temperature [21]. In marine sediments with the water saturation of 30%, the gas diffusion speed in sediments is enough high, and the equilibrium hydrate formation pressure also affects the hydrate formation rate. Therefore, both the hydrate formation rate and the final gas consumption at the water saturation of 30% are lower than those at the water saturation of 40% due to the higher equilibrium hydrate formation pressure. It can be concluded that, for the equilibrium hydrate formation pressure and the gas diffusion speed, both affect the hydrate formation rate in marine sediments, and the hydrate formation in marine sediments at different water saturation levels presents different mechanisms.
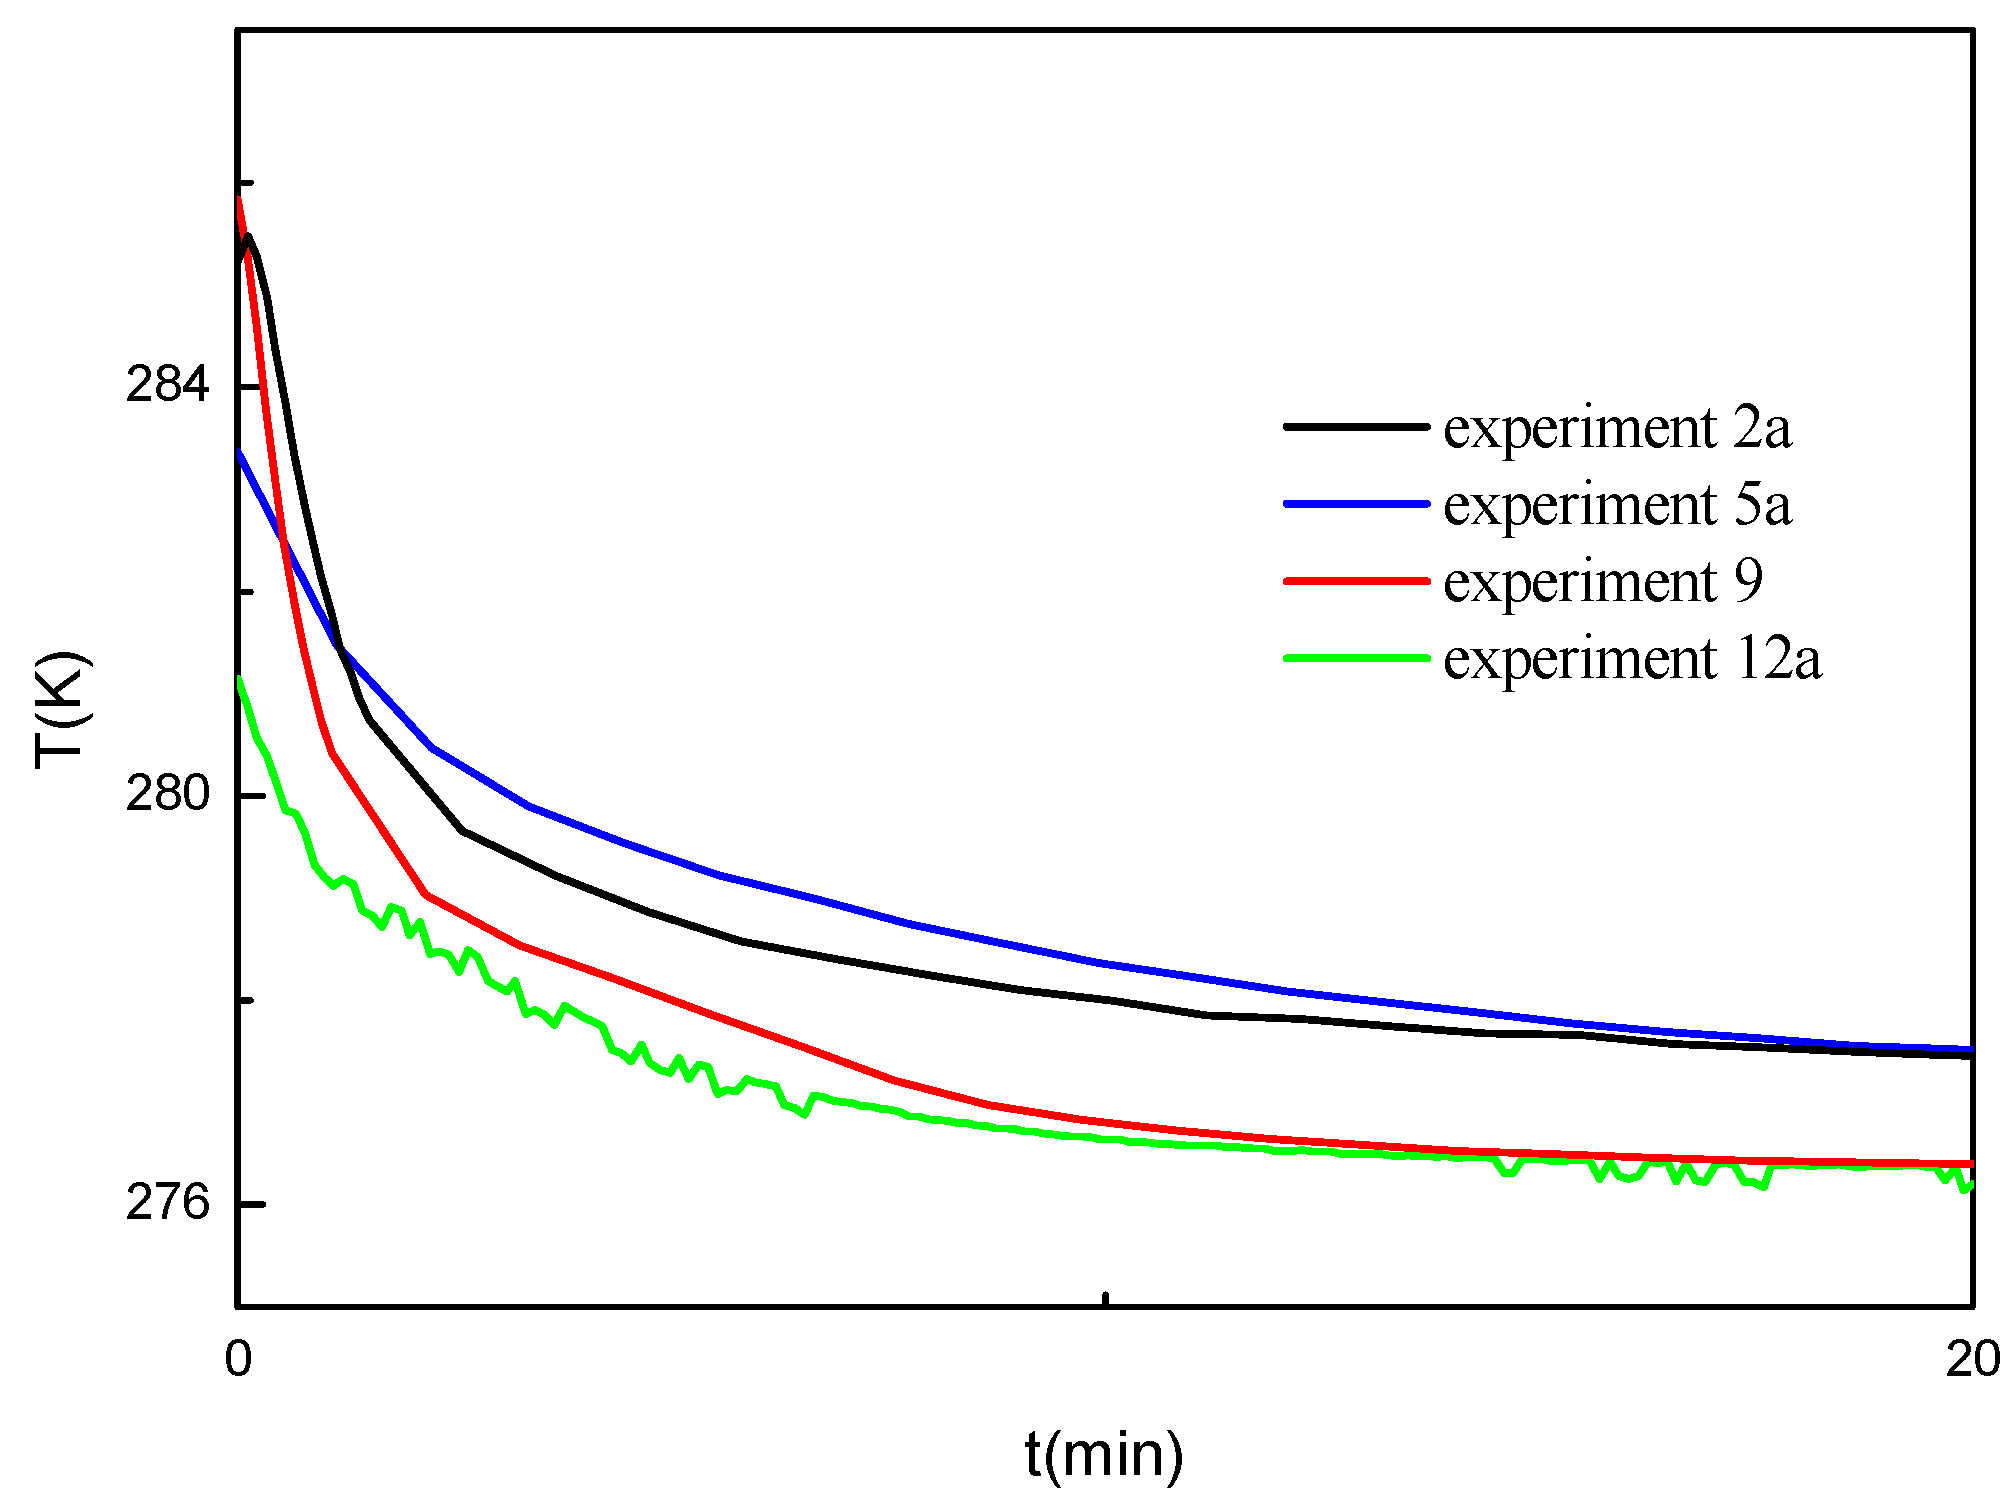
Figure 7 gives the temperature change profiles during the hydrate formation in the experiments shown in Figure 6. As shown in Figure 7, the temperature in the crystallizer is much higher than the bath temperature at the beginning of the experiments due to the temperature increase in the gas injection process. The initial temperature for different experiments shows some difference, which may be due to the different circumstance temperature and the gas injection rates. It can be seen that the temperature inside the crystallizer in the experiments at the water saturation of 40% decreases most slowly, even the initial temperature is lower than that in other experiments. It should be due to the fastest rate of the hydrate formation at the water saturation of 40%. The temperature inside the crystallizer decreases more slowly for the experiment with higher hydrate formation rate. It illustrates that the heat released from the hydrate formation has the significant effect on the temperature change in the sediments [12].
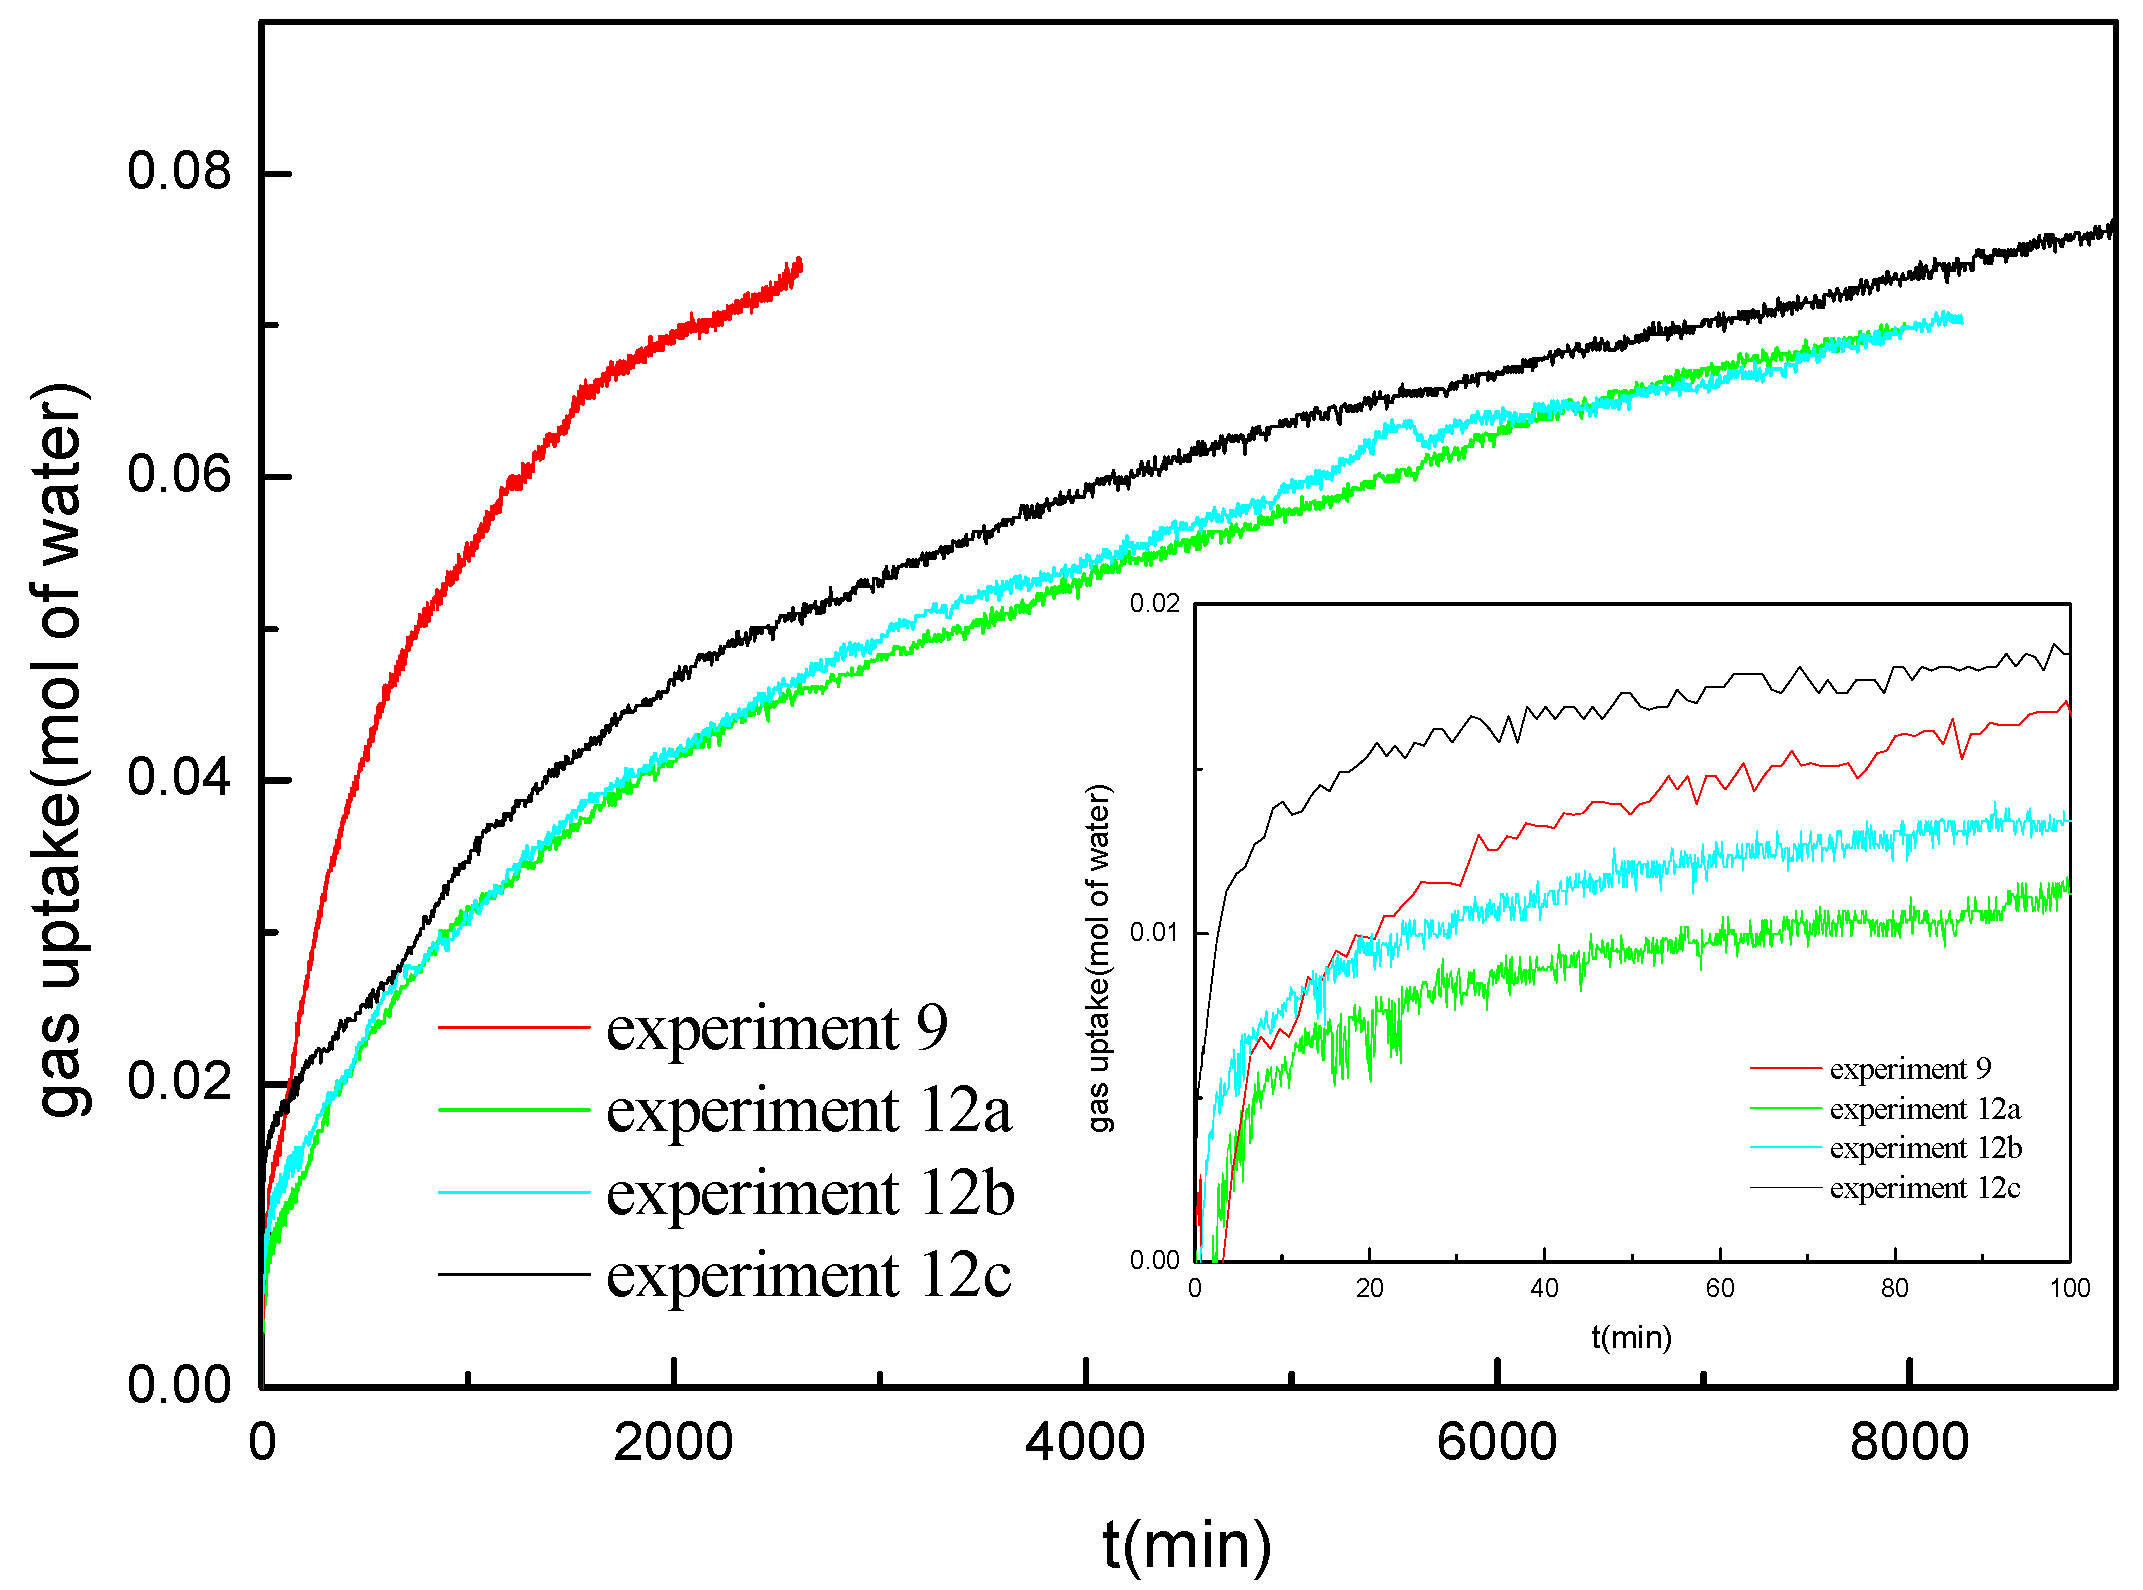
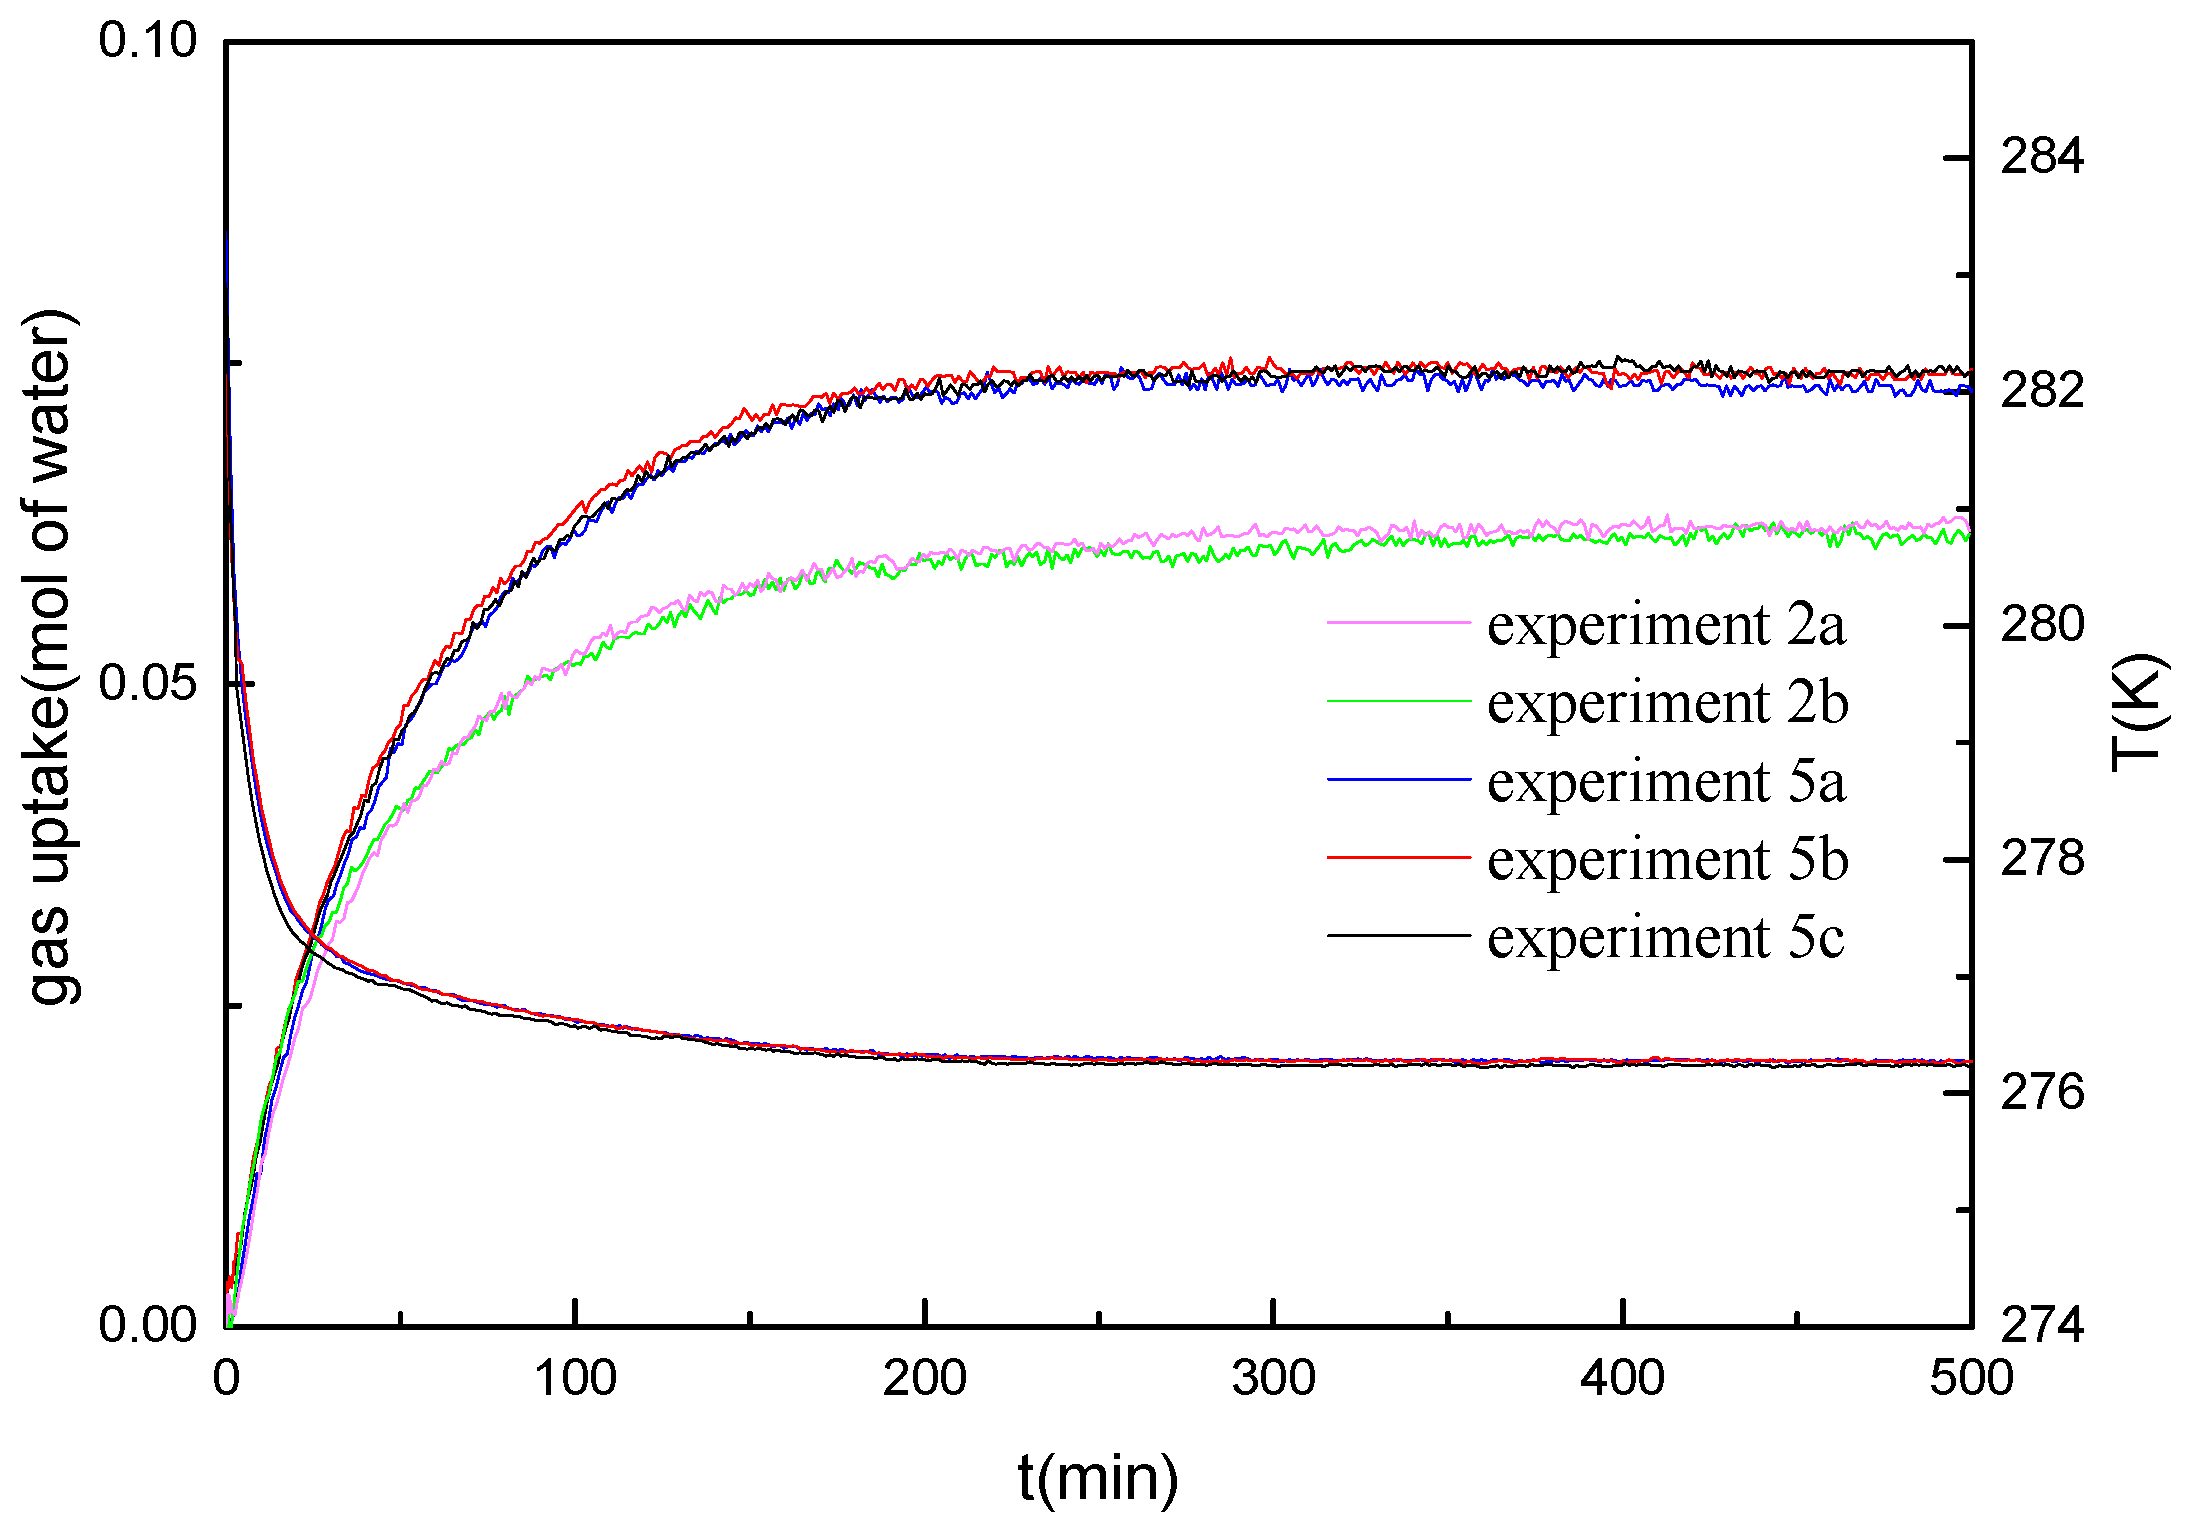
Figure 8 represents the gas uptake curves along with temperature profiles of the repeated experiments at the water saturation of 40%. The gas uptake curves of the repeated experiments at the water saturation of 30% is also given in Figure 8. The formation temperature and initial formation pressure are 276.15 K and 14.4 MPa, respectively. As shown, the pressure change and the gas consumption rate show a good repeatability of the hydrate formation experiments at the water saturation of 30% and 40%. Figure 9 represents the gas uptake curves of the experiments at the water saturation of 50%, the initial formation pressure and the formation temperature are 14.4 MPa and 276.15 K, respectively. As a comparison, the gas uptake curve of the experiment at the same pressure and temperature conditions at the water saturation of 45% is also given. As shown in Figure 9, the repeated experiments at the water saturation of 50% are not as good as that at the water saturation of 40%. The average standard deviations for the repeated experiments at the water saturation of 30%, 40% and 50% are 0.00053, 0.00069, and 0.00198 mole of water, respectively. A possible explanation is to consider water migration and redistribution which may occur during the hydrate formation and decomposition. As discussed above, for the high water saturation, more free water may present in the voids or interstitial spaces of marine sediments. The free water may transit in the voids or interstitial spaces in the sediments during the formation and decomposition processes, resulting in the change of the gas–water contact area and the tortuous paths in sediments for the gas diffusion. As shown in Figure 9, the gas consumption in the early rapid formation stage is significantly different for various experiments. It may be due to the free water transition, which changes the contact area of the free water and gas. However, even the hydrate formation rate displays differently in the experiments with the same formation conditions for the water saturation of 50%; it is also lower than that at the water saturation of 45%. The gas–water contact area still seems to be the controlling factor of the hydrate formation rate.
4. Conclusions
In this paper, the behaviors of methane hydrate formation in marine sediments with the water saturation of 30%, 40%, 45% and 50% were investigated. The experiments were carried out in the temperature range of 274.15–281.15 K and the initial formation pressure of 14.4 MPa. The final conversion of water to hydrate ranges from 34.36% to 50.61% in the experiments, which is much lower than that in silica sands due the higher equilibrium hydrate formation pressure in marine sediments [12]. The hydrate formation rate and the final water conversion increase with the decrease of the formation temperature at the water saturation of 40%, and an initial slow growth was observed due to the high temperature in the sediments. The hydrate formation rate increases with the increase of the water saturation from 30% to 40% due to the decrease of the equilibrium hydrate formation pressure in marine sediments. With the further increase of the water saturation, the formation process of methane hydrate at the water saturation of 45% and 50% can be divided into two periods. In the first period, the hydrate formation occurs at the interface between gas and water, and hydrate forms quickly. In the second, the gas should diffuse through the hydrate layer into the inner of the bed to form the hydrate with the water molecules. The hydrate formation rate at the water saturation of 45% and 50% is significantly lower than that at the water saturation of 30% and 40%, and decreases sharply with the increase of the water saturation due to the decrease of the gas diffusion speed. It was concluded that, if one wishes to model the rate of hydrate formation in marine sediments with different water saturations, the effects of the water saturation on the equilibrium hydrate formation pressure and the gas diffusion speed should be both taken into account. The experiments at the same pressure and temperature conditions show a better repeatability at low water saturation than those at high water saturation because the free water migrates in the hydrate formation and dissociation processes.
Acknowledgments
This work is supported by the National Natural Science Foundation of China (51476174, 51576202 51376183, and 51676190), and the Key Arrangement Programs of the Chinese Academy of Sciences (Grants KGZDEW-301-2), National Key Research and Development Plan of China (No. 2016YFC0304002), National Marine Geology Special program (GHZ2012006003), Scientific cooperative project by CNPC and CAS (2015A-4813), which are gratefully acknowledged.
Author Contributions
All of the authors contributed to publishing this paper. Yu Zhang and Xiaosen Li, Zhaoyang Chen conceived of and designed the experiments. Yu Zhang and Yi Wang performed the experiments and wrote the paper. Yu Zhang and Gang Li prepared the experiments and analyzed the data.
Conflicts of Interest
The authors declare no conflict of interest.
References
- Collett, T.S. Gas hydrates as a future energy resource. Geotimes 2004, 49, 24–27. [Google Scholar]
- Sloan, E.D.; Koh, C.A. Clathrate Hydrates of Natural Gases, 3rd ed.; CRC Press: Boca Raton, FL, USA, 2008. [Google Scholar]
- Handa, Y.P.; Stupin, D. Thermodynamic properties and dissociation characteristics of methane and propane hydrates in 70-angstrom-radius silica-gel pores. J. Phys. Chem. 1992, 96, 8599–8603. [Google Scholar] [CrossRef]
- Moridis, G.J.; Kowalsky, M.B.; Pruess, K. Depressurization-induced gas production from class 1 hydrate deposits. SPE Res. Eval. Eng. 2007, 10, 458–481. [Google Scholar] [CrossRef]
- Moridis, G.J.; Reagan, M.T.; Kim, S.J.; Seol, Y.; Zhang, K. Evaluation of the gas production potential of marine hydrate deposits in the Ulleung Basin of the Korean East Sea. SPE J. 2009, 14, 759–781. [Google Scholar] [CrossRef]
- Li, G.; Li, X.S.; Zhang, K.; Li, B.; Zhang, Y. Effects of impermeable boundaries on gas production from hydrate accumulations in the Shenhu Area of the South China Sea. Eneriges 2013, 6, 4078–4096. [Google Scholar] [CrossRef]
- Li, X.S.; Xu, C.G.; Zhang, Y.; Ruan, XK.; Li, G.; Wang, Y. Investigation into gas production from natural gas hydrate: A review. Appl. Energy 2016, 172, 286–322. [Google Scholar] [CrossRef]
- Zhang, P.; Wu, Q.; Yang, Y. Characteristics of methane hydrate formation in artificial and natural media. Energies 2013, 6, 1233–1240. [Google Scholar] [CrossRef]
- Jin, Y.; Konno, Y.; Nagao, J. Growth of methane clathrate hydrates in porous media. Energy Fuels 2012, 26, 2242–2247. [Google Scholar] [CrossRef]
- Klapproth, A.; Techmer, K.; Klapp, S.; Murshed, M.; Kuhs, W. Microstructure of gas hydrates in porous media. In Proceedings of the 11th International Conference on the Physics and Chemistry of Ice, Bremerhaven, Germany, 23–28 July 2006; pp. 321–328. [Google Scholar]
- Zhou, Y.; Castaldi, M.J.; Yegulalp, T.M. Experimental investigation of methane gas production from methane hydrate. Ind. Eng. Chem. Res. 2009, 48, 3142–3149. [Google Scholar] [CrossRef]
- Linga, P.; Haligva, C.; Nam, S.C.; Ripmeester, J.A.; Englezos, P. Gas hydrate formation in a variable volume bed of silica sand particle. Energy Fuels 2009, 23, 5496–5507. [Google Scholar] [CrossRef]
- Liu, C.; Lu, H.; Ye, Y.; Ripmeester, J.A.; Zhang, X. Raman spectroscopic observations on the structural characteristics and dissociation behavior of methane hydrate synthesized in silica sands with various sizes. Energy Fuels 2008, 22, 3986–3988. [Google Scholar] [CrossRef]
- Katsuki, D.; Ohmura, R.; Ebinuma, T.; Narita, H. Methane hydrate crystal growth in a porous medium filled with methane-saturated liquid water. Philos. Mag. 2007, 87, 1057–1069. [Google Scholar] [CrossRef]
- Babu, P.; Yee, D.; Linga, P.; Palmer, A.; Khoo, B.C.; Tan, T.S.; Rangsunvigi, P. Morphology of methane hydrate formation in porous media. Energy Fuels 2013, 27, 3364–3372. [Google Scholar] [CrossRef]
- Fitzgerald, G.C.; Castaldi, M.J.; Schicks, J.M. Methane Hydrate Formation and Thermal Based Dissociation Behavior in Silica Glass Bead Porous Media. Ind. Eng. Chem. Res. 2014, 53, 6840–6854. [Google Scholar] [CrossRef]
- Bagherzadeh, S.A.; Moudrakovski, I.L.; Ripmeester, J.A.; Englezos, P. Magnetic resonance imaging of gas hydrate formation in a bed of silica sand particles. Energy Fuels 2011, 25, 3083–3092. [Google Scholar] [CrossRef]
- Kumar, A.; Sakpal, T.; Roy, S.; Kumar, R. Methane hydrate formation in a test sediment of sand and clay at various levels of water saturation. Can. J. Chem. 2015, 93, 1–8. [Google Scholar] [CrossRef]
- Wu, N.Y.; Zhang, H.Q.; Yang, S.X.; Liang, J.Q.; Wang, H.B. Preliminary discussion on natural gas hydrate (NGH) reservoir system of Shenhu area, north slope of South China Sea. Nat. Gas Ind. 2007, 27, 1–6. [Google Scholar]
- Sun, S.C.; Ye, Y.G.; Liu, C.L.; Xiang, F.K.; Ma, Y. P-T stability conditions of methane hydrate in sediments from South China Sea. J. Nat. Gas Chem. 2011, 20, 531–536. [Google Scholar] [CrossRef]
- Zhang, Y.; Li, X.S.; Wang, Y.; Chen, Z.Y.; Yan, K.F. Decomposition conditions of methane hydrate in marine sediments from South China Sea. Fluid Phase Equilibr. 2016, 413, 110–115. [Google Scholar] [CrossRef]
- Zhang, Y.; Li, X.S.; Chen, Z.Y.; Li, G.; Wang, Y. Effects of particle and pore sizes on the formation behaviors of methane hydrate in porous silica gels. J. Nat. Gas Chem. 2016, 35, 1463–1471. [Google Scholar] [CrossRef]
- Li, X.S.; Zhang, Y. Study on dissociation behaviors of methane hydrate in porous media based on experiments and fractional dimension Shrinking-Core Model. Ind. Eng. Chem. Res. 2011, 50, 8263–8271. [Google Scholar] [CrossRef]
- Li, X.S.; Zhang, Y.; Li, G.; Chen, Z.Y.; Yan, K.F.; Li, Q.P. Gas hydrate equilibrium dissociation conditions in porous media using two thermodynamic approaches. J. Chem. Thermodyn. 2008, 40, 1464–1474. [Google Scholar] [CrossRef]
- Linga, P.; Daraboina, N.; Ripmeester, J.A.; Englezos, P. Enhanced rate of gas hydrate formation in a fixed bed column filled with sand compared to a stirred. Chem. Eng. Sci. 2012, 68, 617–623. [Google Scholar] [CrossRef]
- Hills, B.P.; Manning, C.E.; Ridge, Y.; Brocklehurst, T. NMR water relaxation, water activity and bacterial survival in porous media. J. Sci. Food Agric. 1996, 71, 185–194. [Google Scholar] [CrossRef]
- Li, X.S.; Zhang, Y.; Li, G.; Chen, Z.Y.; Wu, H.J. Experimental investigation into the production behavior of methane hydrate in porous sediment by depressurization with a novel three-dimensional cubic hydrate simulator. Energy Fuels 2011, 25, 4497–4505. [Google Scholar] [CrossRef]
- Liu, C.L.; Ye, Y.G.; Sun, S.C.; Chen, Q.; Meng, Q.G.; Hu, G.W. Experimental studies on the P-T stability conditions and influencing factors of gas hydrate in different system. Sci. China Earth Sci. 2013, 56, 594–600. [Google Scholar] [CrossRef]
- Chari, V.D.; Raju, B.; Prasad, P.S.R.; Rao, D.N. Methane hydrates in spherical silica matrix: Optimization of capillary water. Energy Fuels 2013, 277, 3679–3684. [Google Scholar] [CrossRef]
Figure 1.
Schematic of the experimental apparatus.
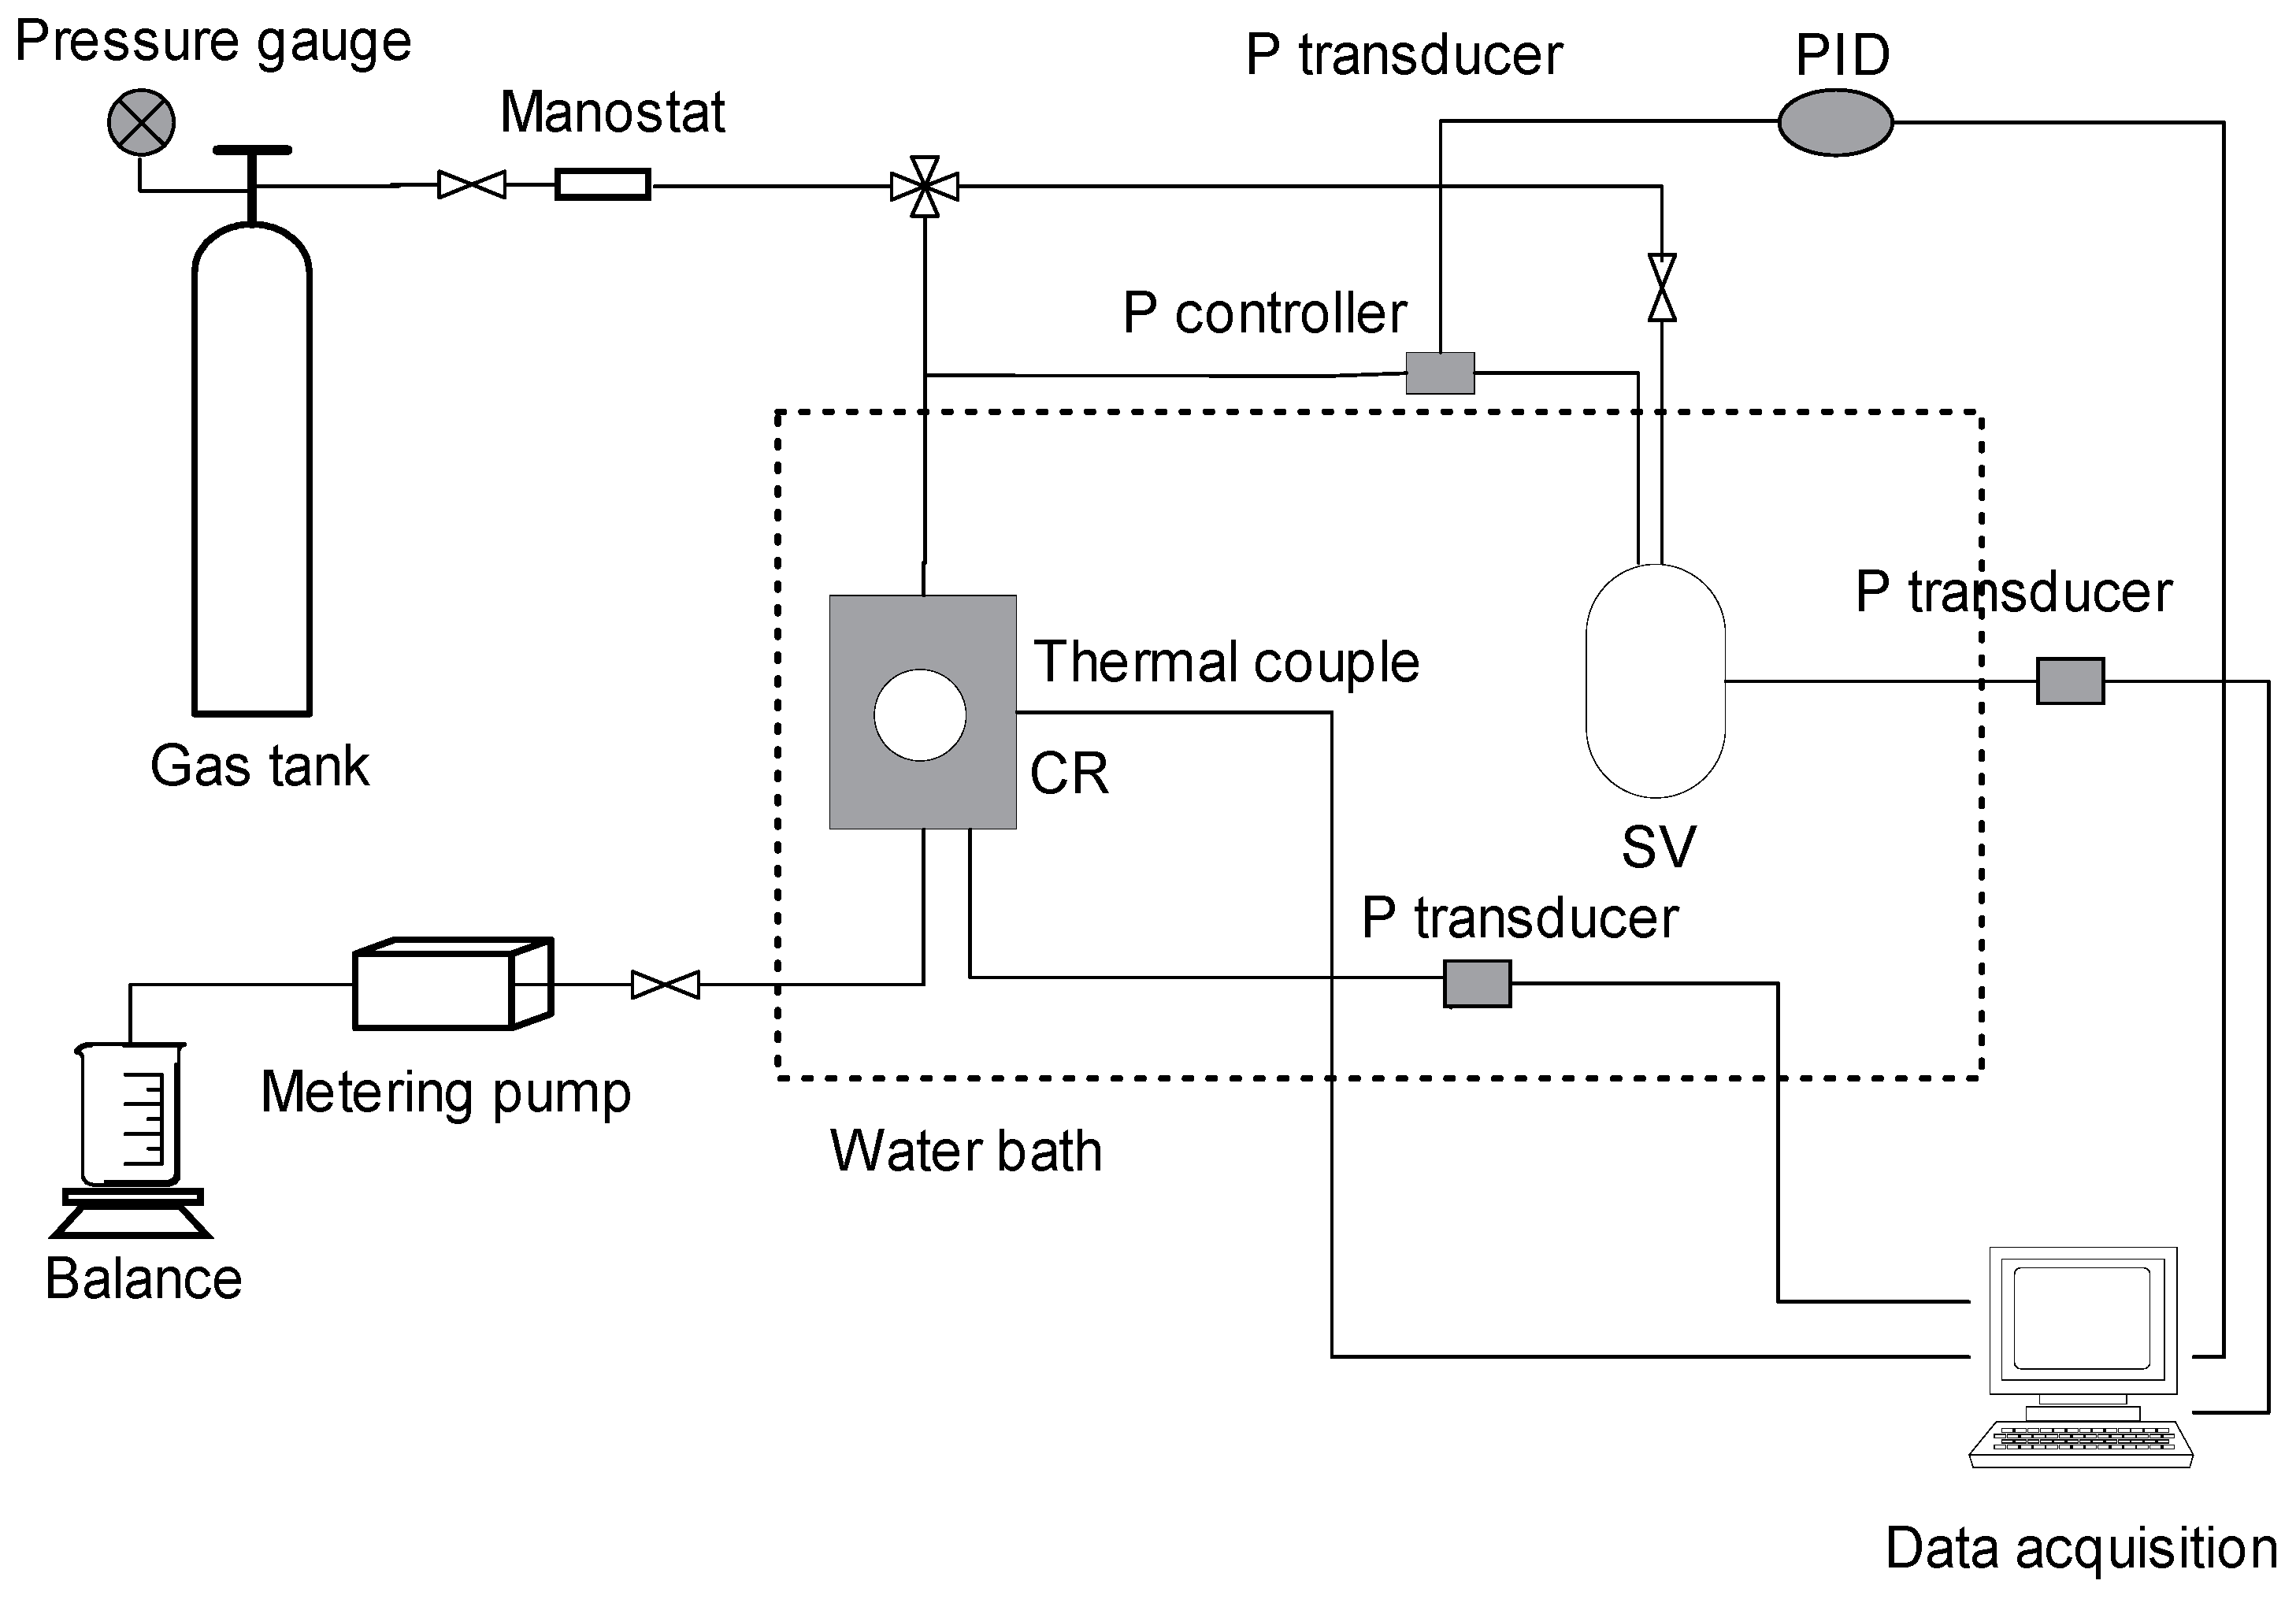
Figure 2.
Particle size distribution of the sample.
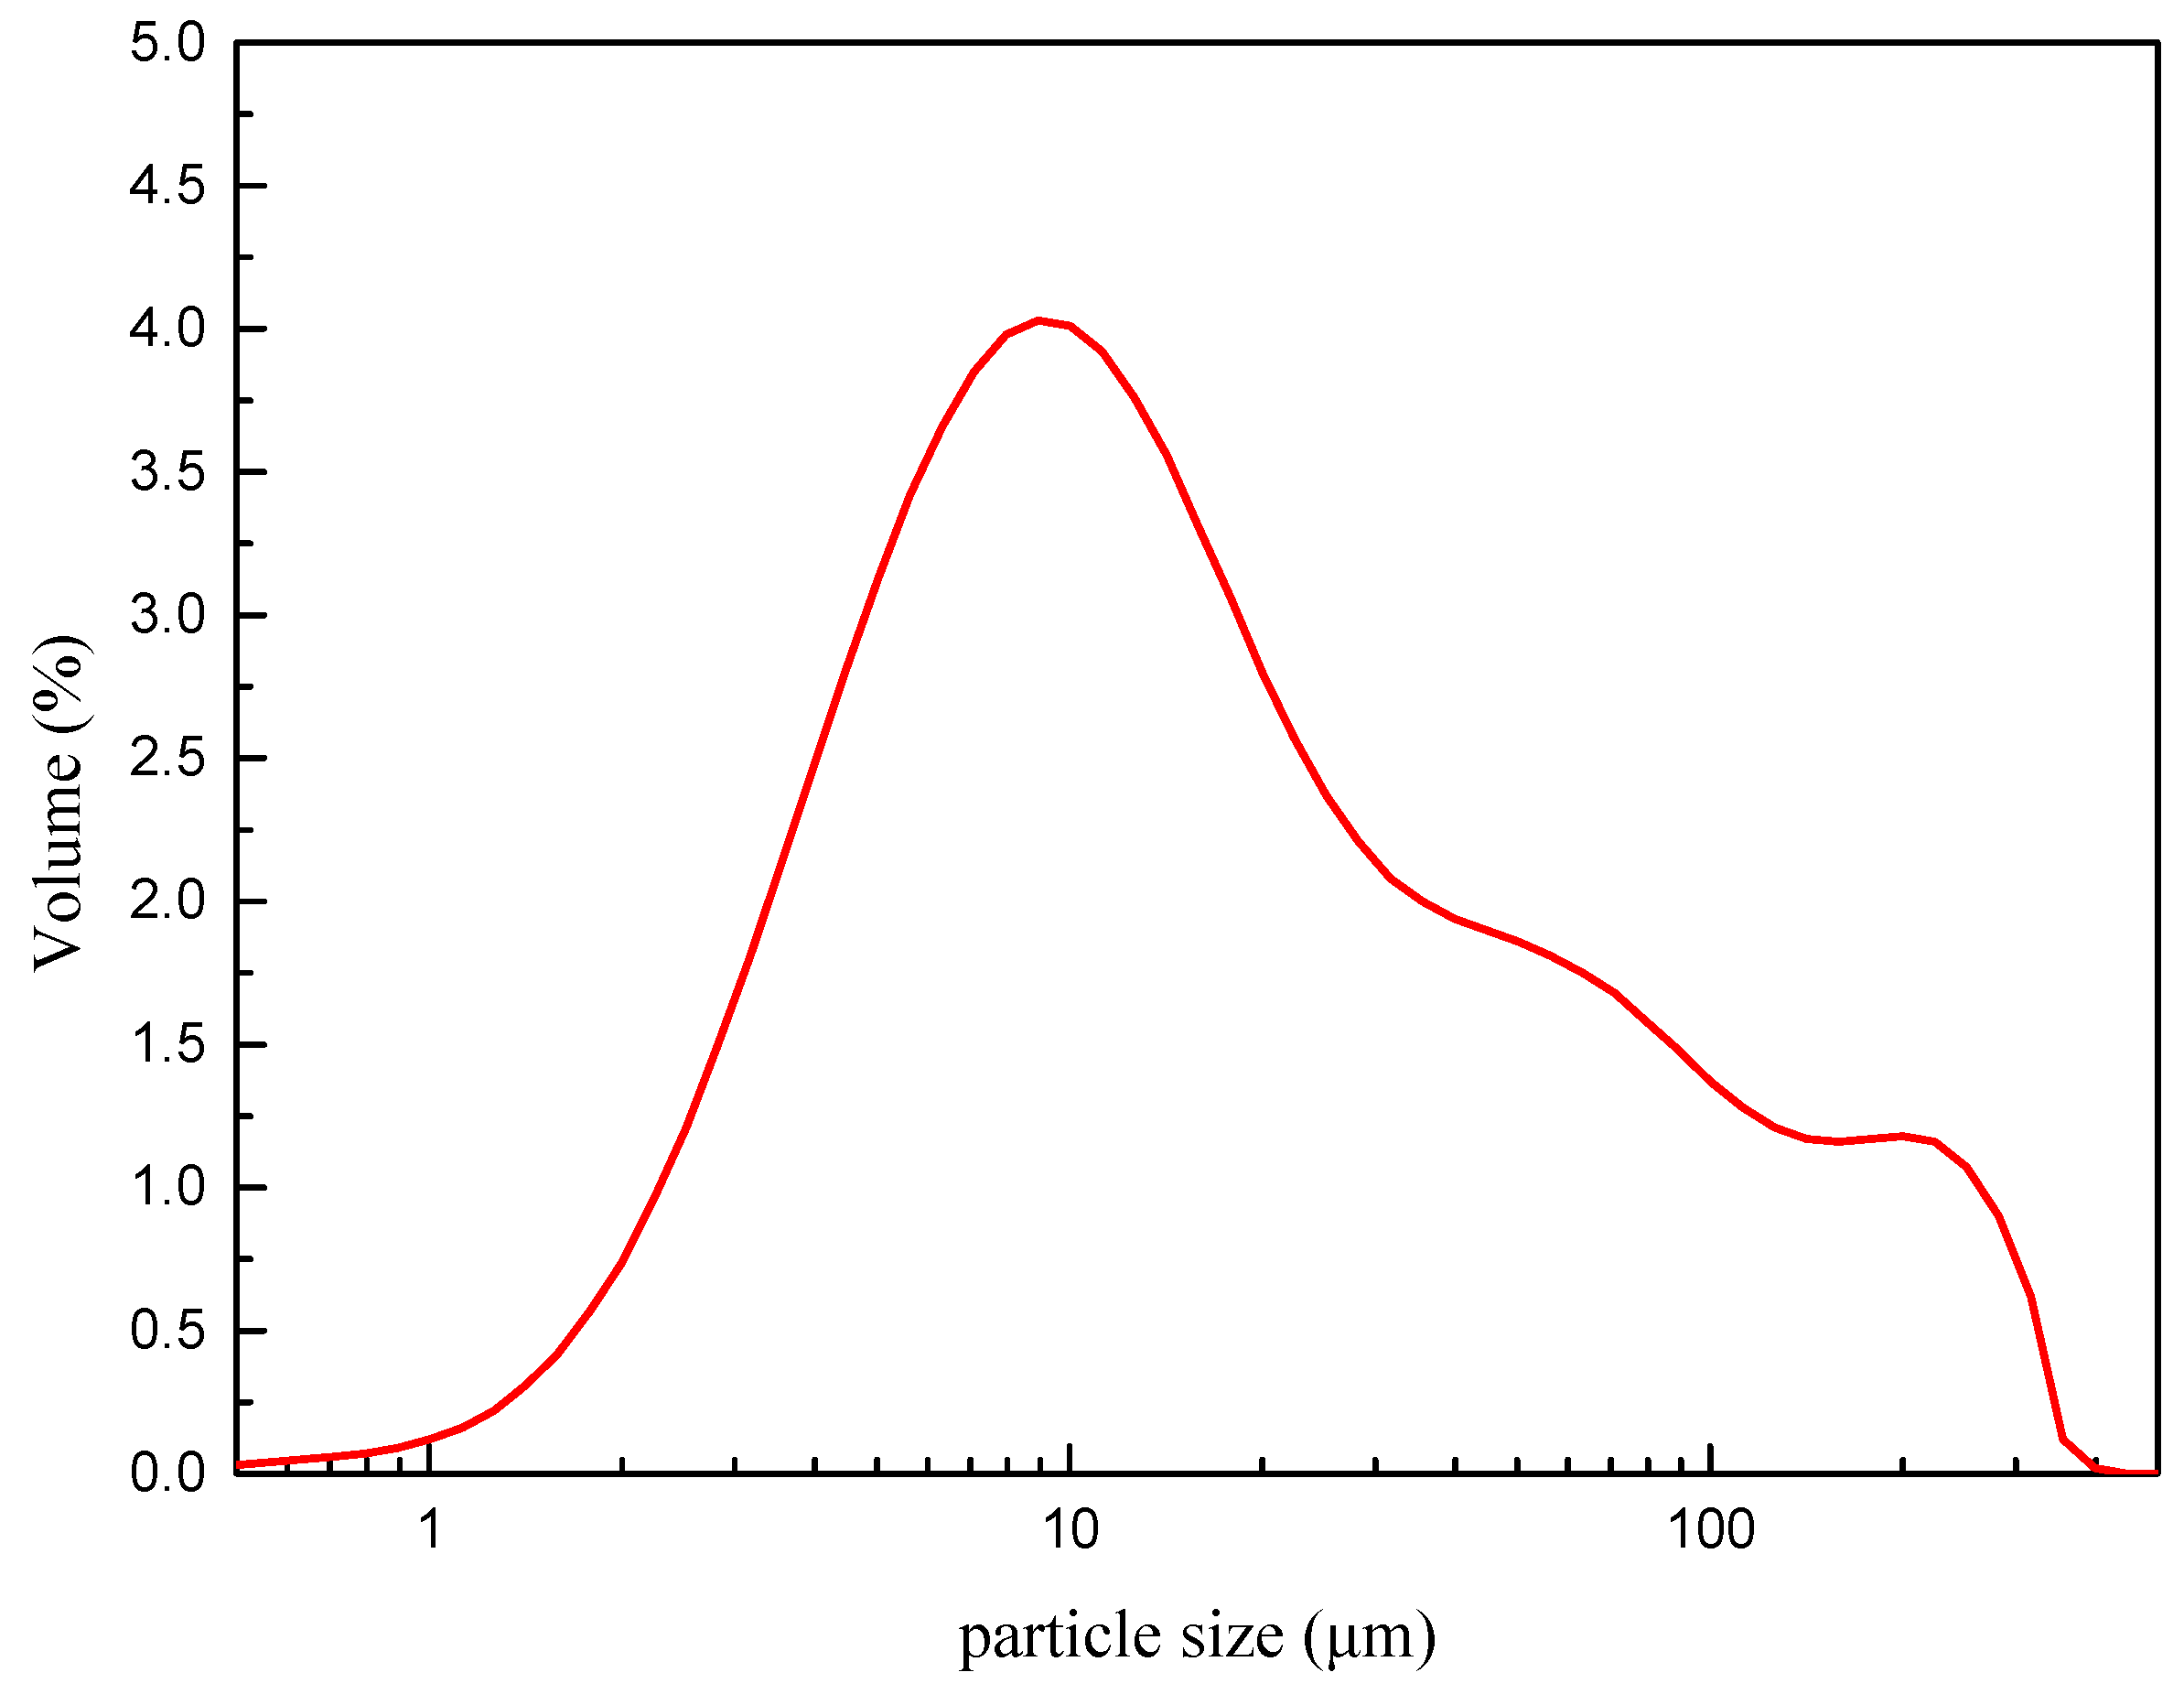
Figure 3.
Pressure and temperature changes with time for the experiments at various formation temperatures.
Figure 3.
Pressure and temperature changes with time for the experiments at various formation temperatures.
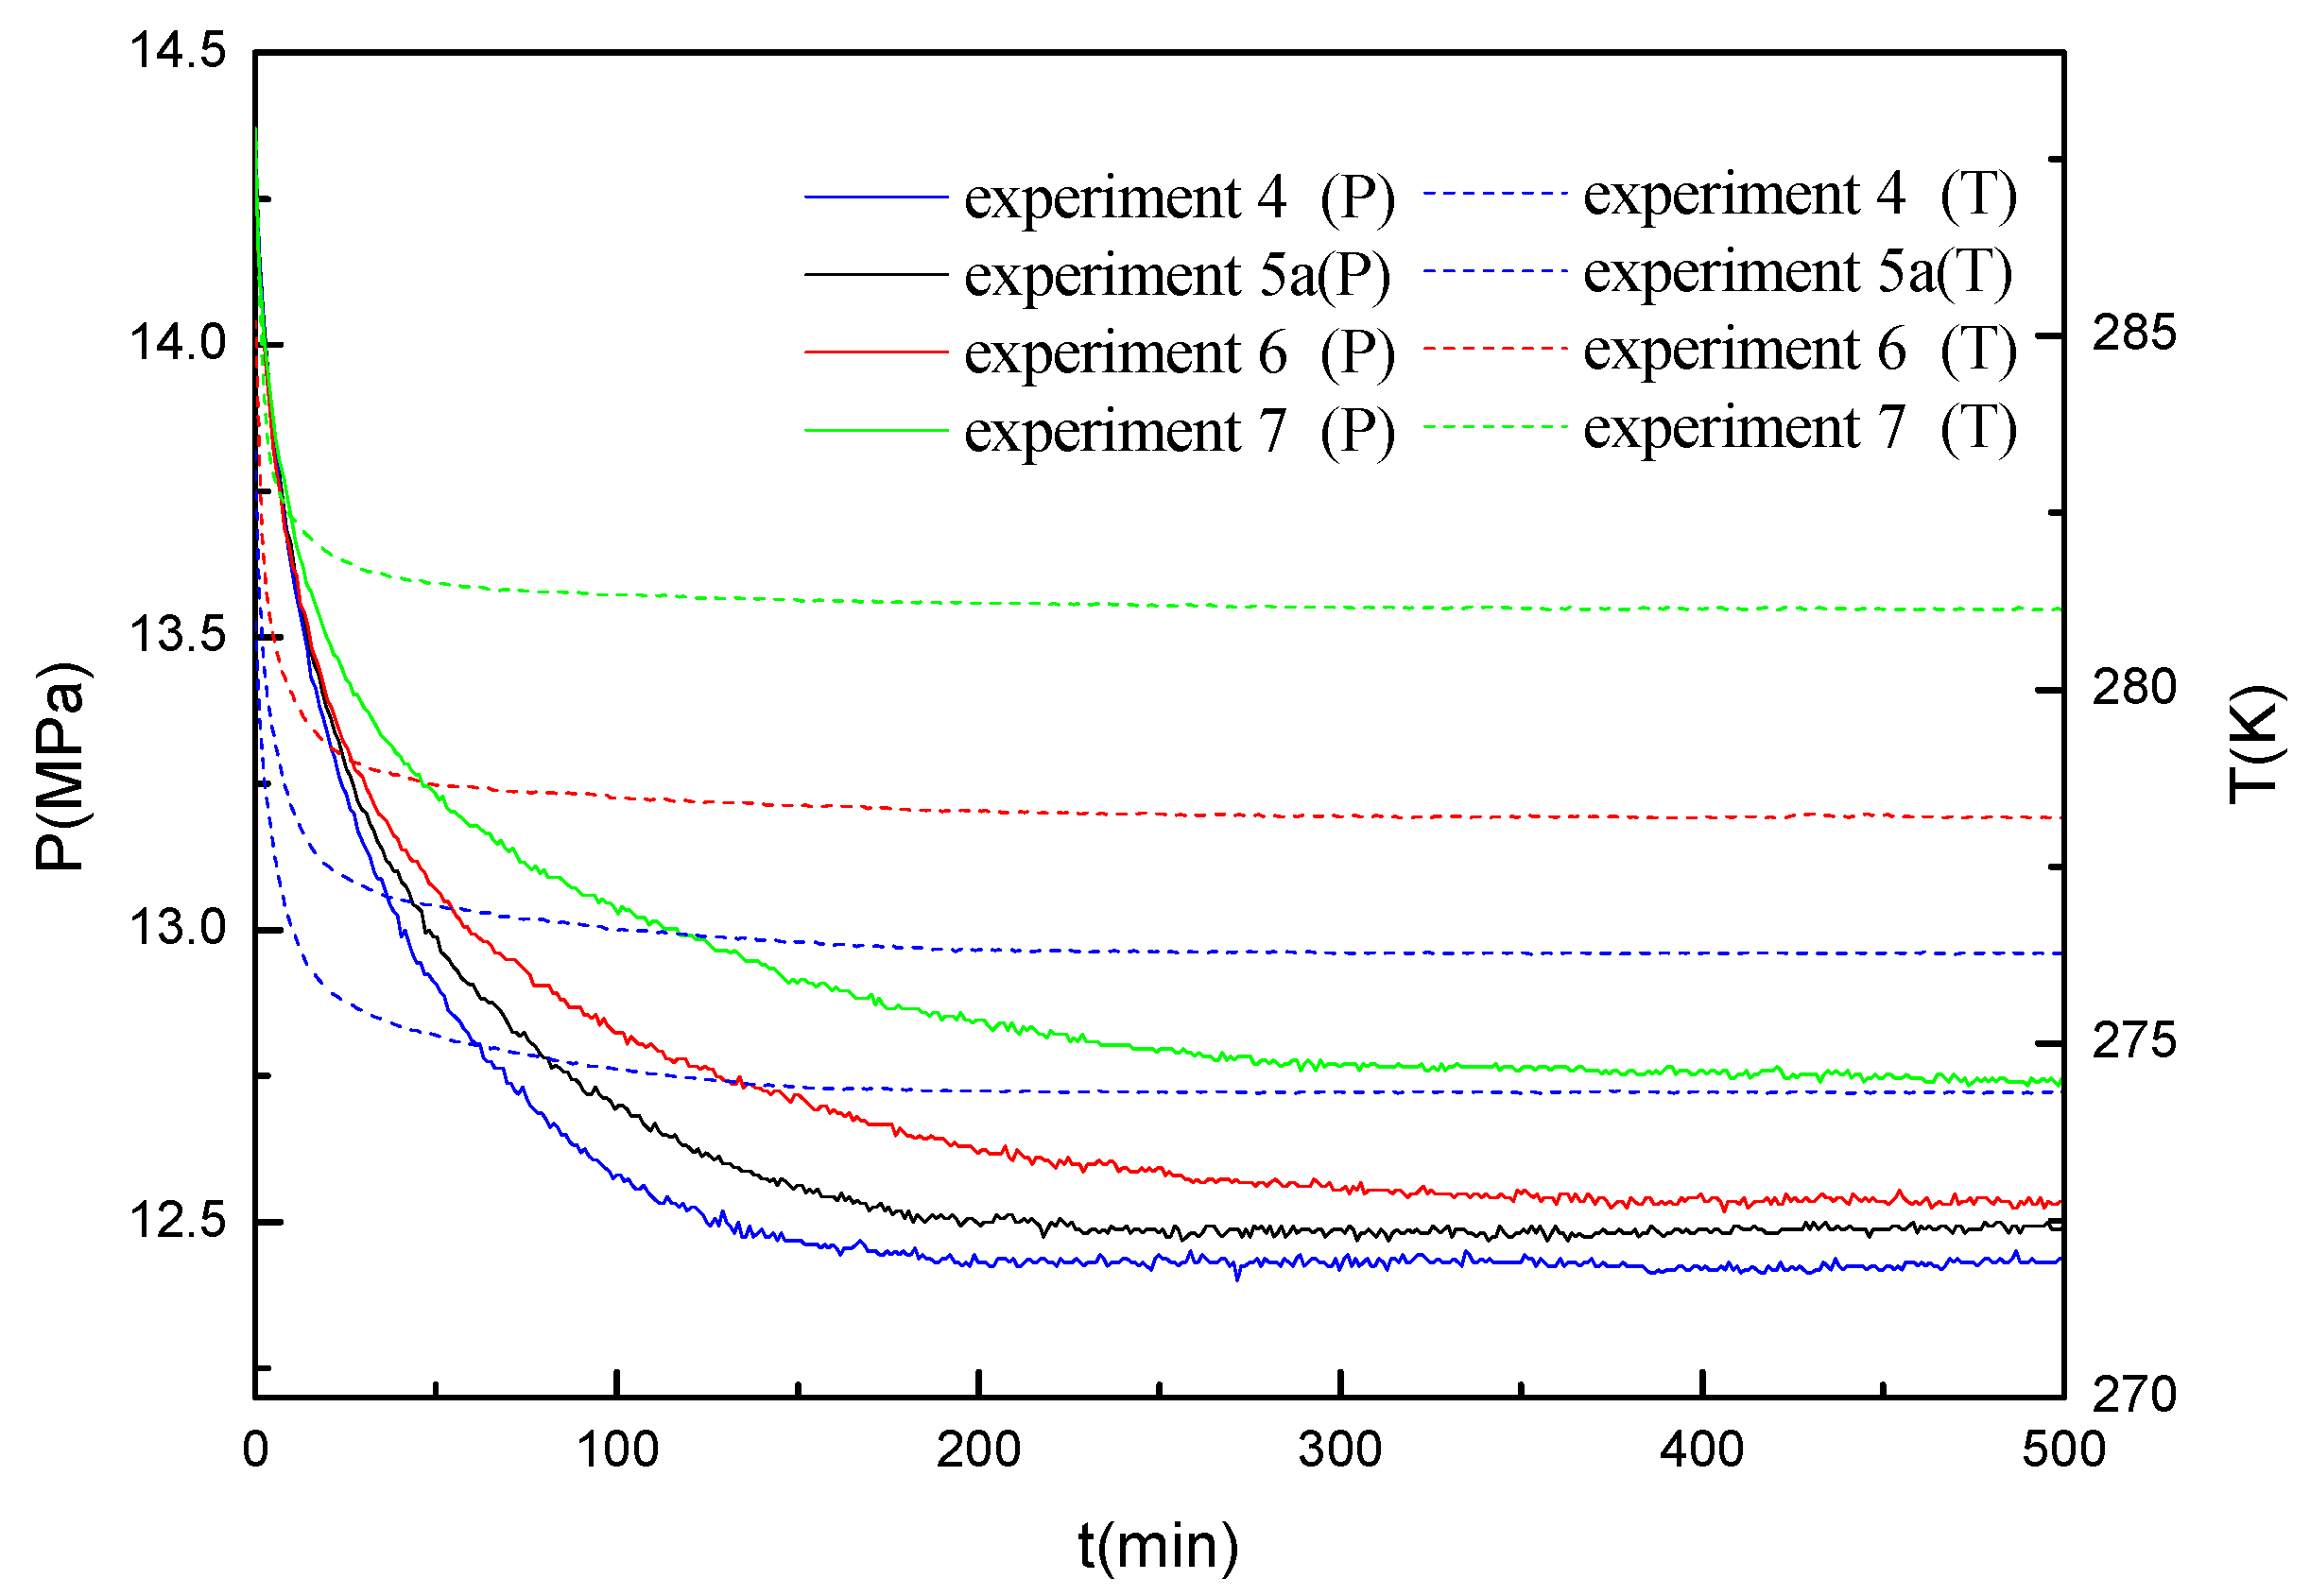
Figure 4.
Comparison of the gas uptake for the experiments at various formation temperatures.
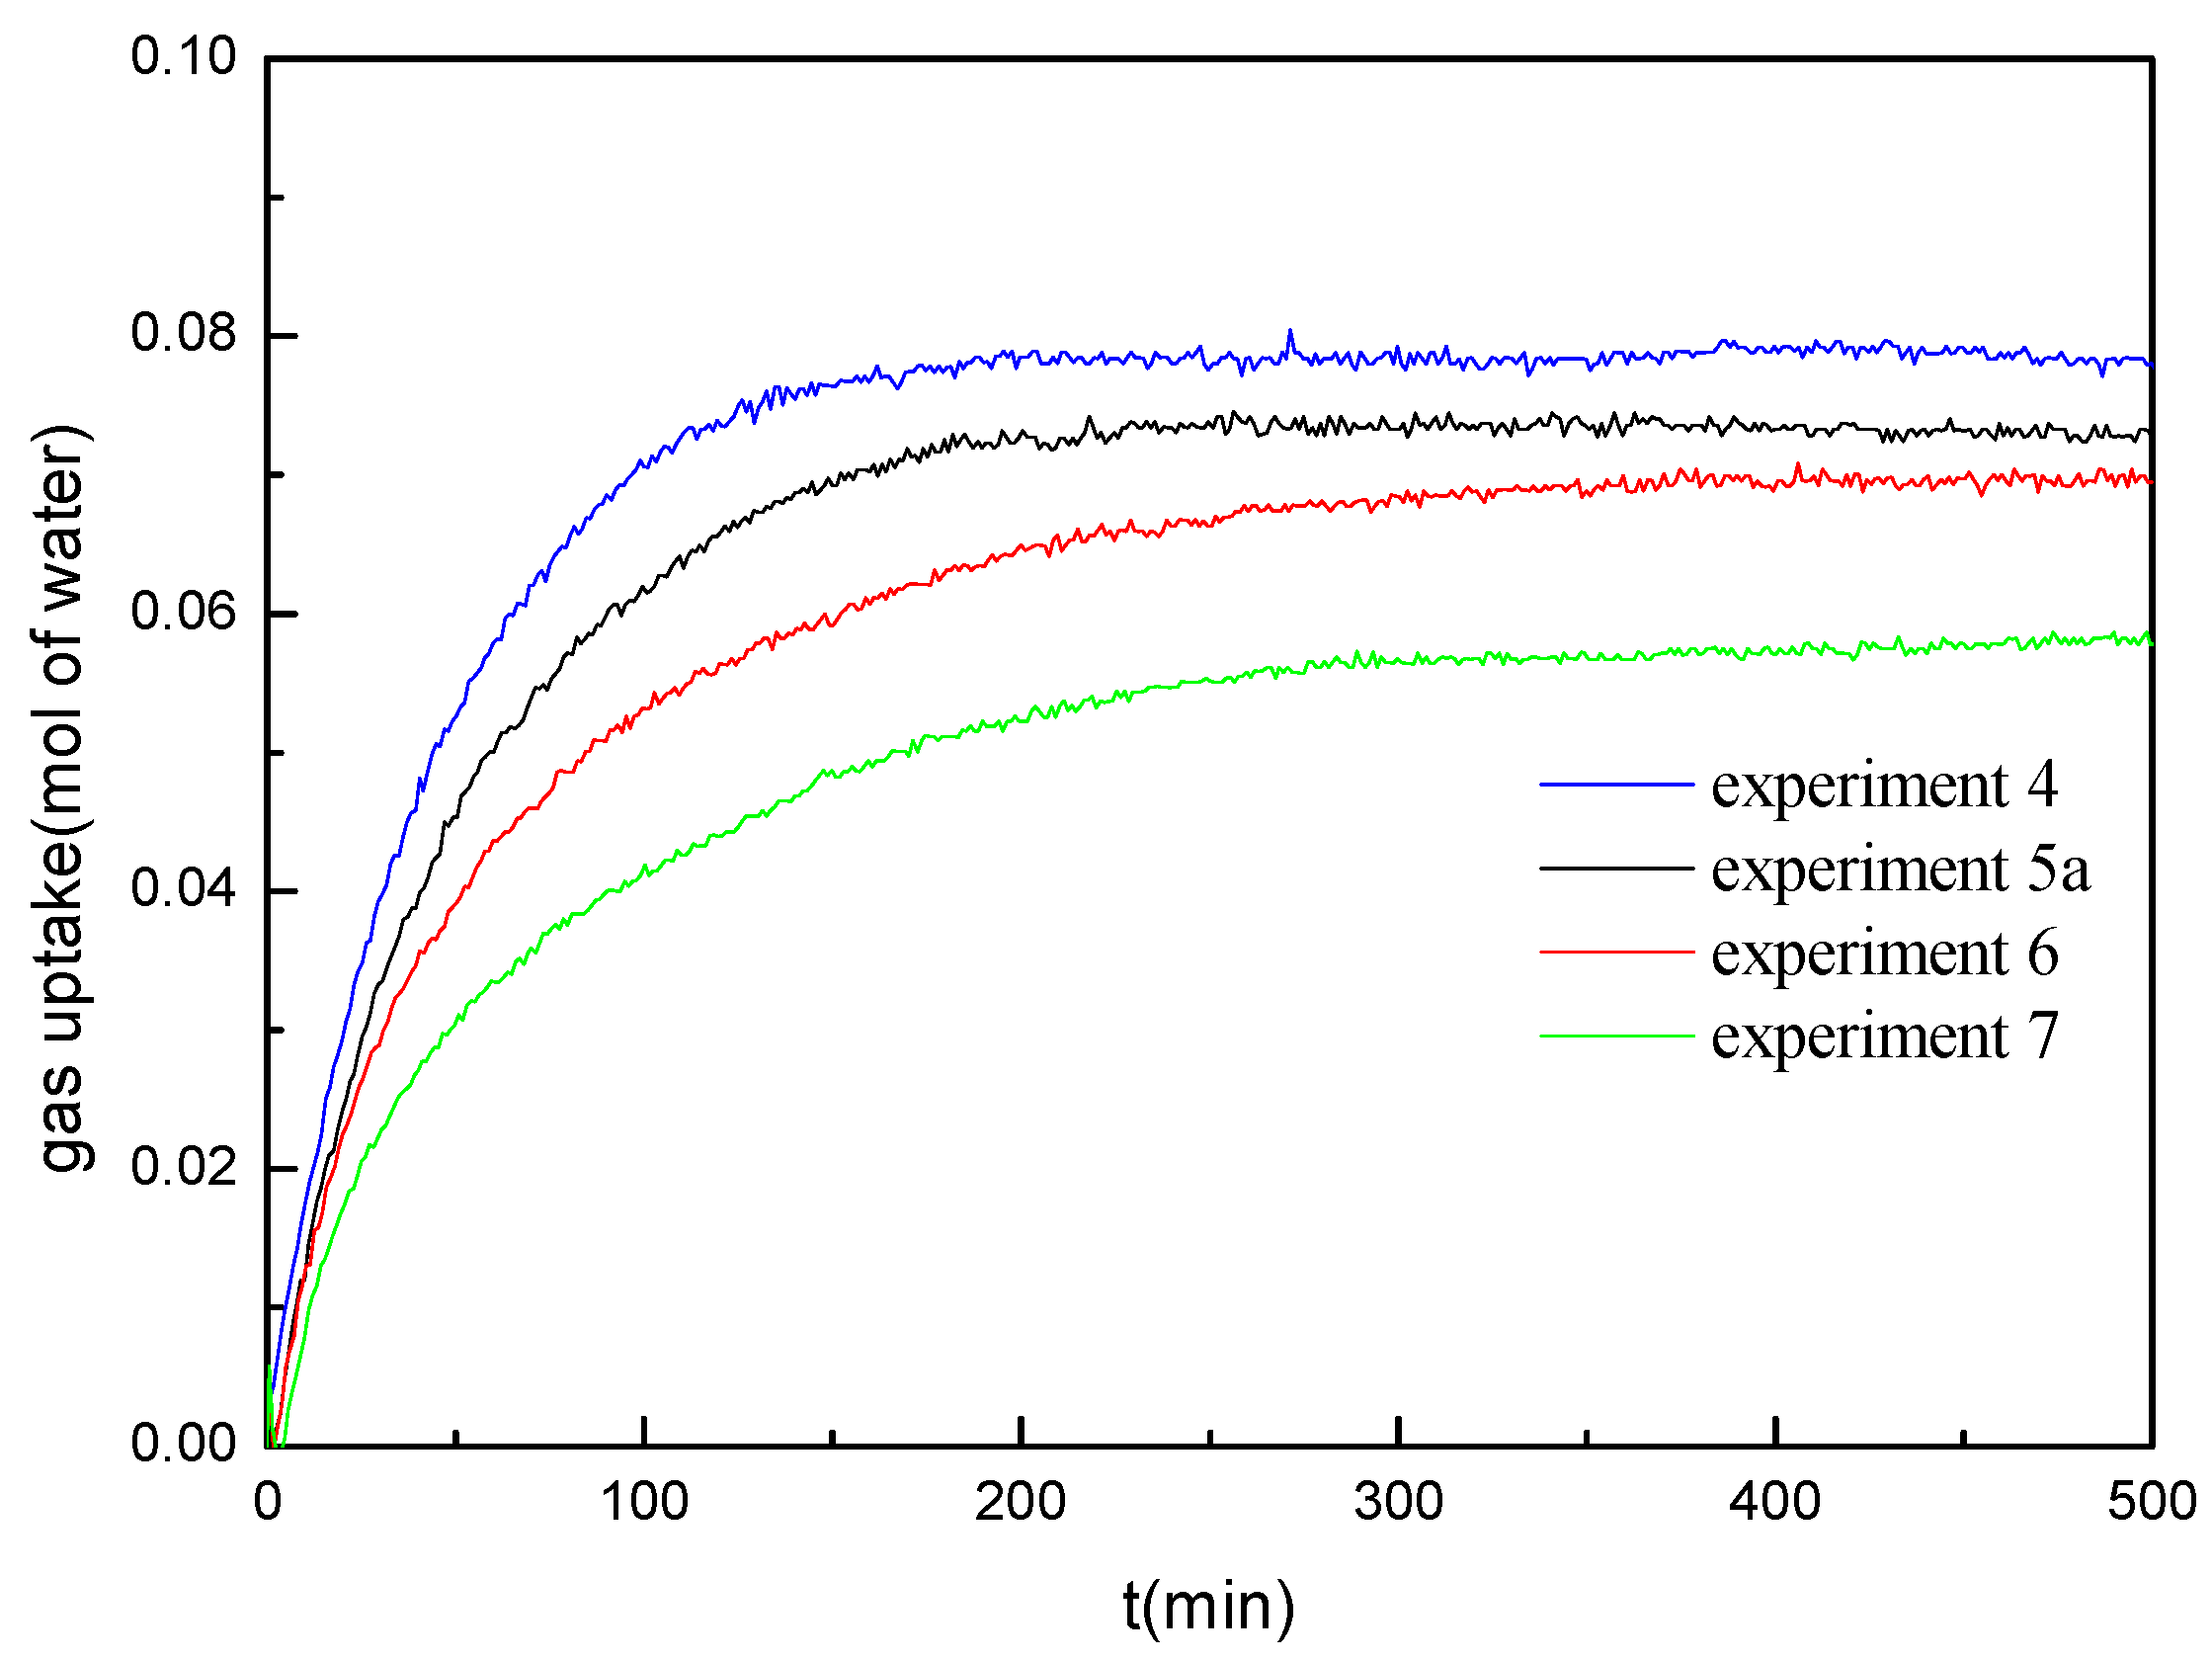
Figure 5.
Comparison of the gas uptake rate for the experiments at various formation temperatures.
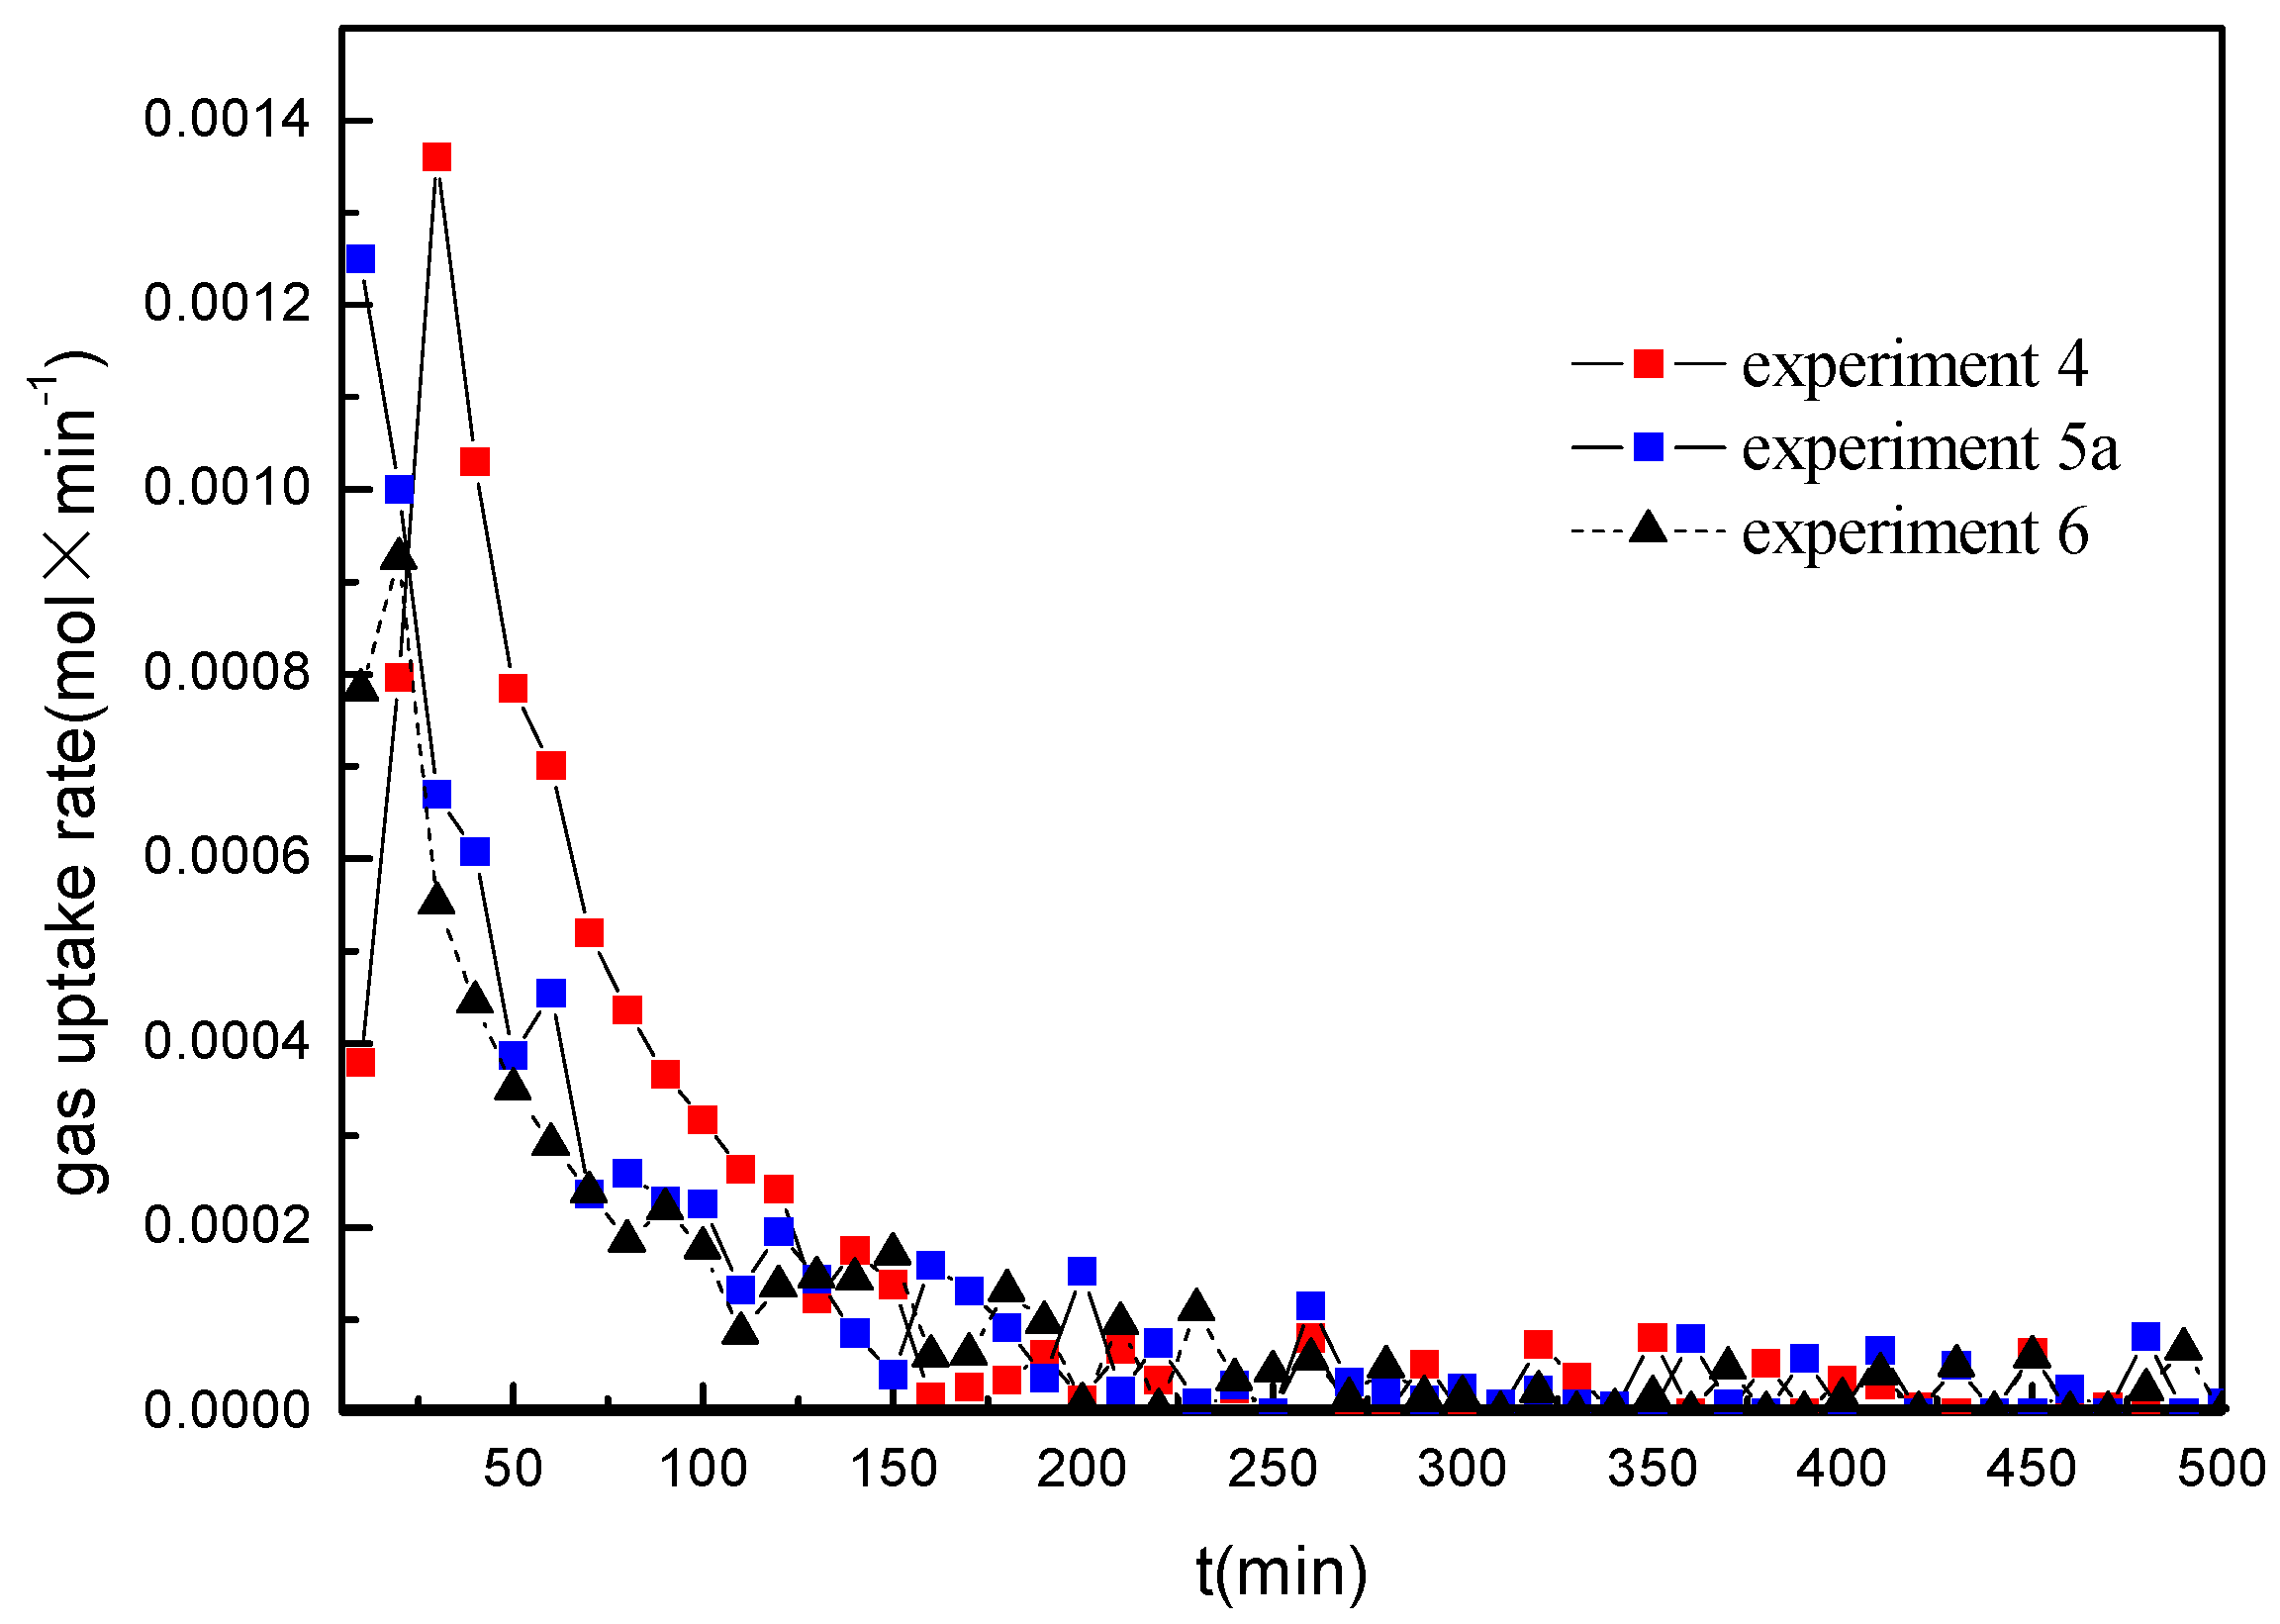
Figure 6.
Comparison of gas uptake for the experiments at different water saturations.
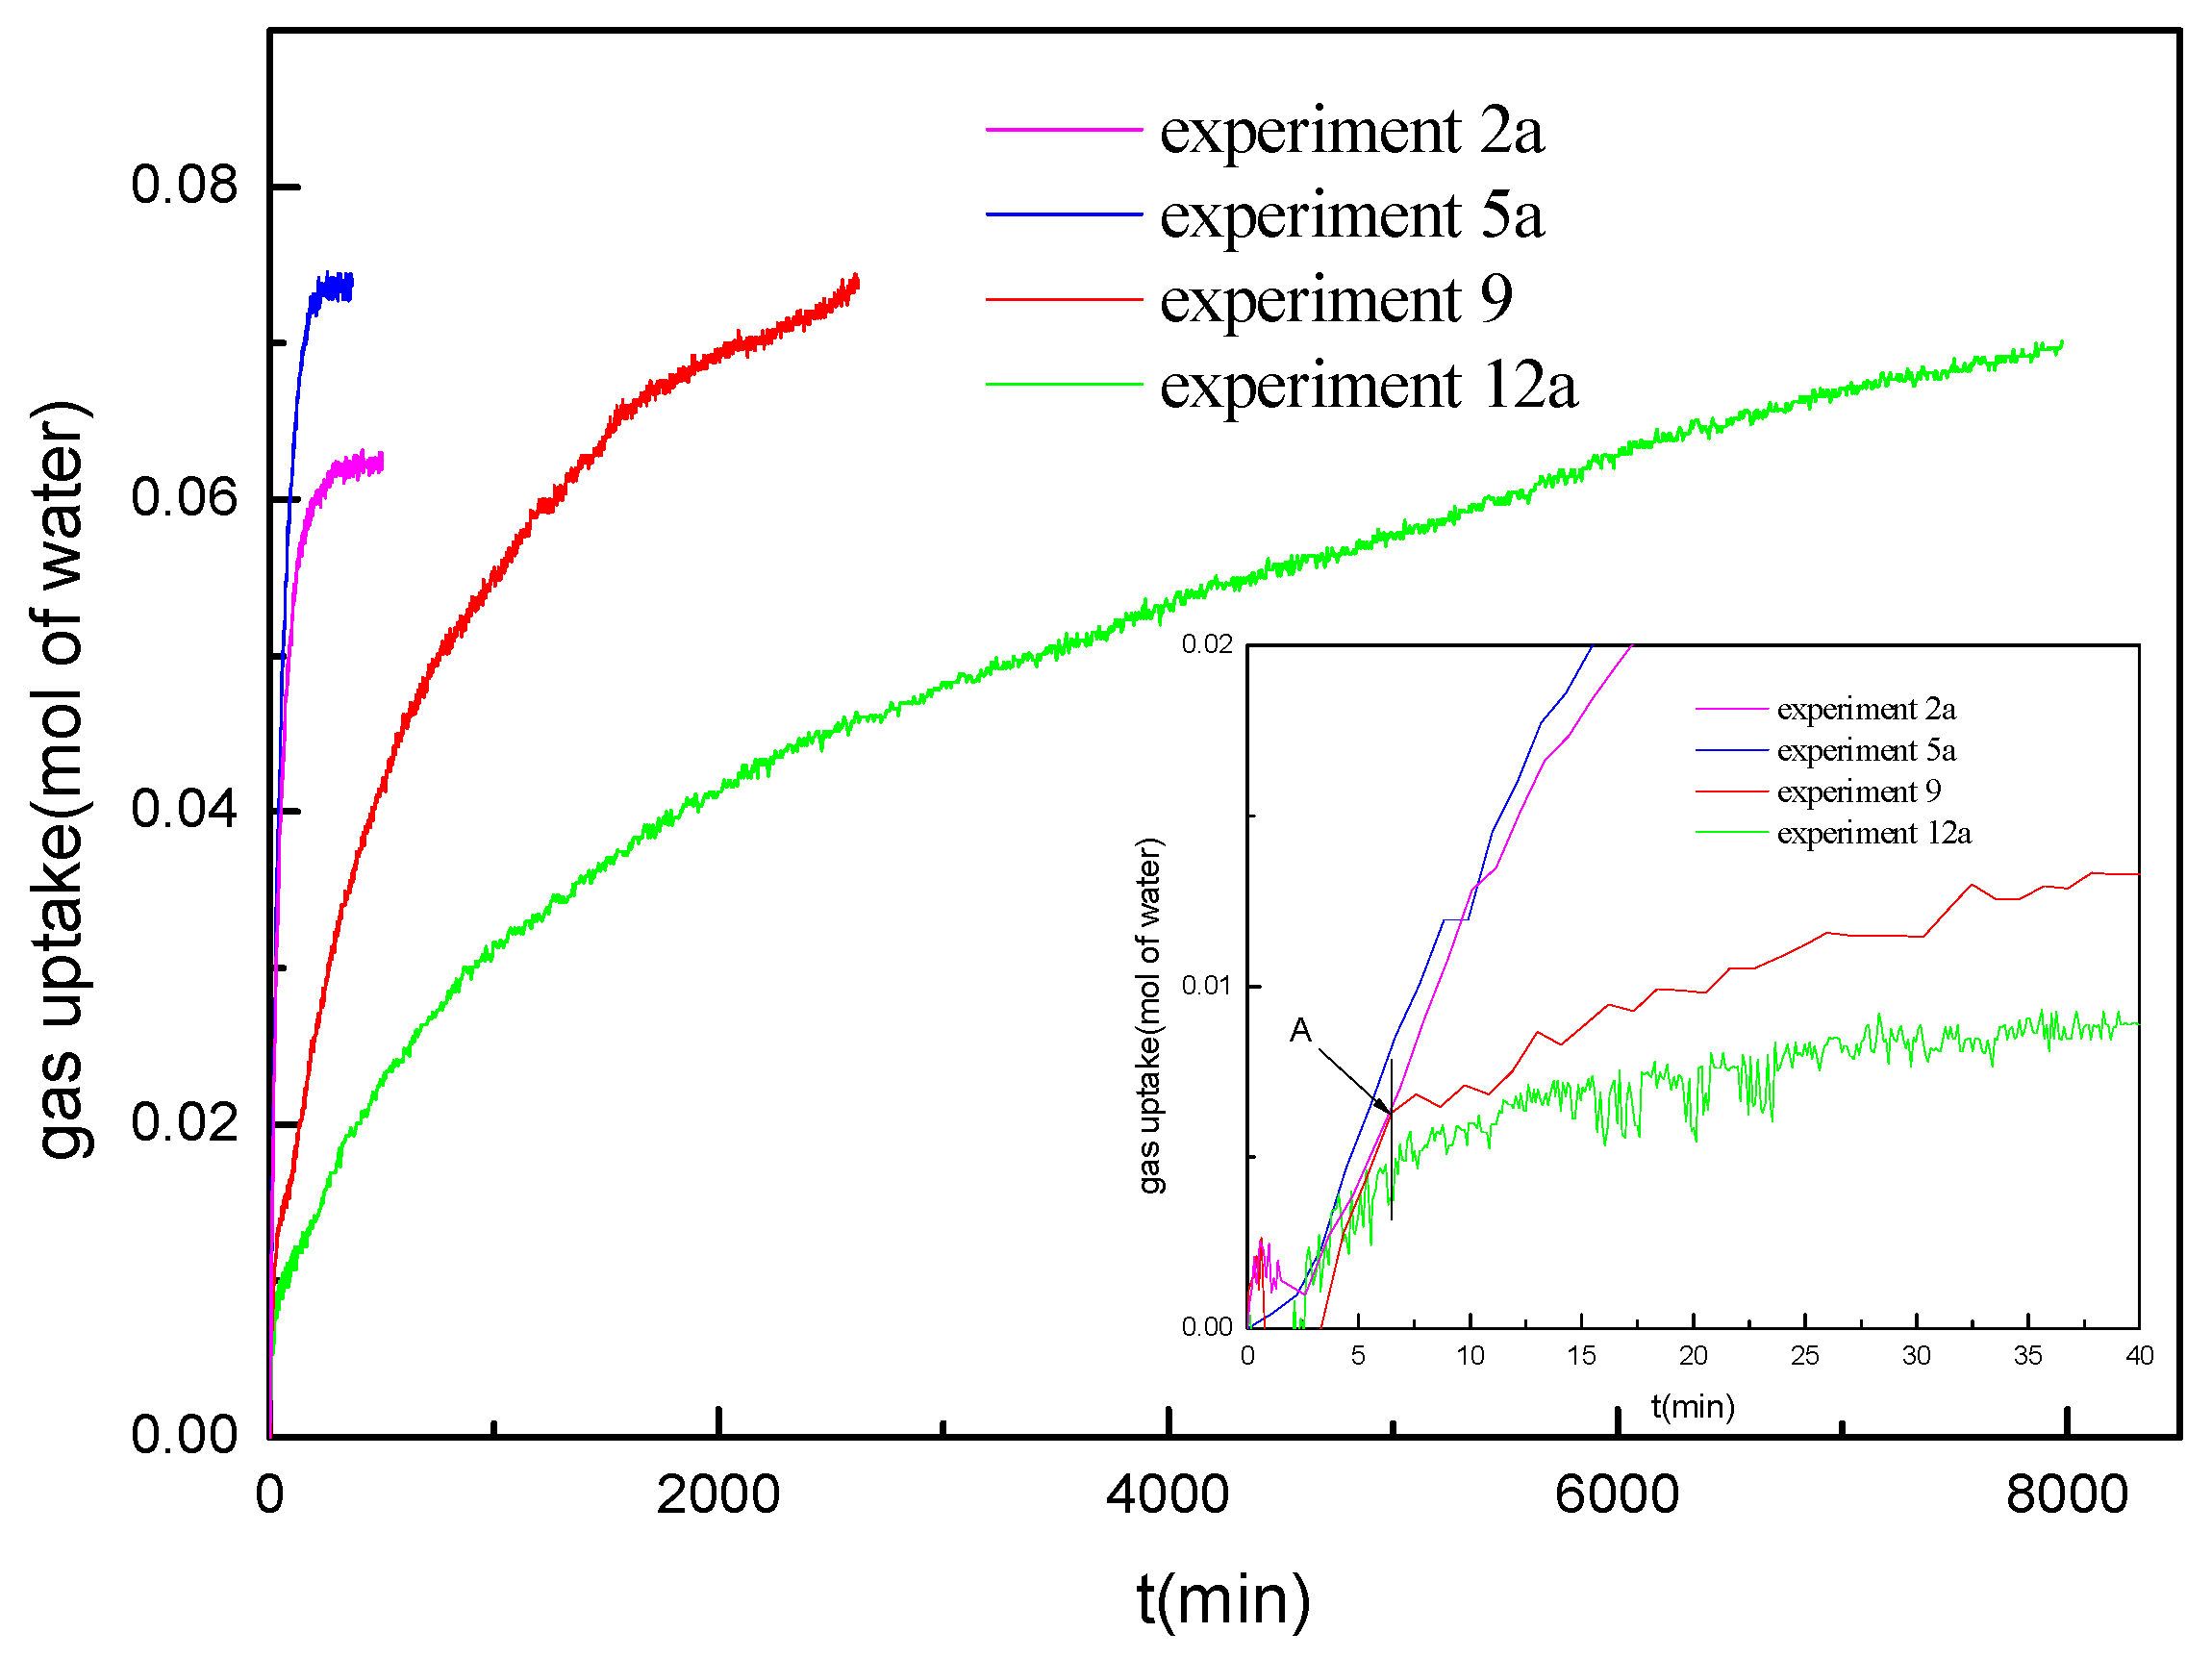
Figure 7.
Comparison of temperature change for the experiments at different water saturations.

Figure 8.
Temperature and gas uptake measurement curves of the repeated experiments at the water saturation of 40%.
Figure 8.
Temperature and gas uptake measurement curves of the repeated experiments at the water saturation of 40%.

Figure 9.
Gas uptake measurement curves of the repeated experiments at the water saturation of 50% and the experiment at the water saturation of 45%.
Figure 9.
Gas uptake measurement curves of the repeated experiments at the water saturation of 50% and the experiment at the water saturation of 45%.

Table 1.
Properties of the marine sediments.
| Depth (m) | Density (g/mL) | Surface Weighted Mean Diameter (µm) | Volume Weighted Mean Diameter (µm) | Specific Area (m2/g) | Average Pore Diameter (nm) | Pore Volume (mL/g) |
|---|---|---|---|---|---|---|
| 1600 | 2.81 | 7.898 | 37.488 | 16.412 | 12.178 | 0.04997 |
Table 2.
Specifications of the marine sediments used in experiments.
| Equivalent Component | Clay | Silty Sand | Fine Sand | Medium Sand | Coarse Sand |
|---|---|---|---|---|---|
| Size (µm) | <4 | 4–63 | 63–250 | 250–500 | 500–2000 |
| Percentage (%) | 2.48 | 69.79 | 15.51 | 2.73 | 0 |
Table 3.
Pore distribution of the marine sediments.
| Diameter (nm) | Pore Volume (mL/g) | Pore Surface Area (m2/g) | Incremental Pore Volume (mL/g) | Incremental Pore Area (m2/g) |
|---|---|---|---|---|
| 3.4213 | 0.00072964 | 0.85307 | 0.001906900 | 2.2294000 |
| 3.8340 | 0.00147650 | 1.63230 | 0.001686400 | 1.7595000 |
| 4.3183 | 0.00227560 | 2.37240 | 0.001520200 | 1.4081000 |
| 4.9012 | 0.00316220 | 3.09600 | 0.001384700 | 1.1301000 |
| 5.6302 | 0.00425290 | 3.87100 | 0.001333900 | 0.9476400 |
| 6.5595 | 0.00553890 | 4.65510 | 0.001235500 | 0.7534300 |
| 7.8177 | 0.00729260 | 5.55240 | 0.001188600 | 0.6081400 |
| 9.5842 | 0.00954130 | 6.49090 | 0.001092800 | 0.4560900 |
| 12.3107 | 0.01279800 | 7.54900 | 0.000959080 | 0.3116300 |
| 17.5049 | 0.01800300 | 8.73850 | 0.000744420 | 0.1701100 |
| 30.5583 | 0.02630200 | 9.82480 | 0.000434170 | 0.0568310 |
| 192.0735 | 0.04599400 | 10.23500 | 0.000064794 | 0.0013494 |
Table 4.
Experimental conditions and results.
| Items | Formation Temperature (K) | Initial Pressure (MPa) | Water Saturation (%) | Final Gas Consumption (mol) | Water Conversion (mol%) |
|---|---|---|---|---|---|
| 1 | 274.15 | 14.4 | 30 | 0.172 | 39.93 |
| 2a | 276.15 | 14.4 | 30 | 0.165 | 38.30 |
| 2b | 276.15 | 14.4 | 30 | 0.162 | 37.60 |
| 3 | 278.15 | 14.4 | 30 | 0.148 | 34.36 |
| 4 | 274.15 | 14.4 | 40 | 0.207 | 48.05 |
| 5a | 276.15 | 14.4 | 40 | 0.194 | 45.03 |
| 5b | 276.15 | 14.4 | 40 | 0.196 | 45.50 |
| 5c | 276.15 | 14.4 | 40 | 0.196 | 45.50 |
| 6 | 278.15 | 14.4 | 40 | 0.187 | 43.41 |
| 7 | 281.15 | 14.4 | 40 | 0.155 | 35.98 |
| 8 | 274.15 | 14.4 | 45 | 0.218 | 50.61 |
| 9 | 276.15 | 14.4 | 45 | 0.194 | 45.03 |
| 10 | 278.15 | 14.4 | 45 | 0.178 | 41.32 |
| 11 | 274.15 | 14.4 | 50 | 0.198 | 45.96 |
| 12a | 276.15 | 14.4 | 50 | 0.184 | 42.71 |
| 12b | 276.15 | 14.4 | 50 | 0.185 | 42.95 |
| 12c | 276.15 | 14.4 | 50 | 0.201 | 46.66 |
| 13 | 278.15 | 14.4 | 50 | 0.166 | 38.53 |
© 2017 by the authors. Licensee MDPI, Basel, Switzerland. This article is an open access article distributed under the terms and conditions of the Creative Commons Attribution (CC BY) license (http://creativecommons.org/licenses/by/4.0/).
Share and Cite
MDPI and ACS Style
Zhang, Y.; Li, X.; Wang, Y.; Chen, Z.; Li, G. Methane Hydrate Formation in Marine Sediment from South China Sea with Different Water Saturations. Energies 2017, 10, 561. https://doi.org/10.3390/en10040561
AMA Style
Zhang Y, Li X, Wang Y, Chen Z, Li G. Methane Hydrate Formation in Marine Sediment from South China Sea with Different Water Saturations. Energies. 2017; 10(4):561. https://doi.org/10.3390/en10040561
Chicago/Turabian StyleZhang, Yu, Xiaosen Li, Yi Wang, Zhaoyang Chen, and Gang Li. 2017. "Methane Hydrate Formation in Marine Sediment from South China Sea with Different Water Saturations" Energies 10, no. 4: 561. https://doi.org/10.3390/en10040561
Note that from the first issue of 2016, this journal uses article numbers instead of page numbers. See further details here.