1. Introduction
Carbon dioxide from fossil fuels and industrial processes constitutes almost 65% of global greenhouse gas emissions [
1]. The 2030 energy and climate framework set by the European commission has set a binding target of reduction in greenhouse emissions by 40% from 1990 levels in European territory [
2]. Carbon dioxide capture and storage (CCS) is one of the major Europe Union (EU) initiatives to reduce greenhouse gas emissions [
3]. One of the effective ways of achieving CCS is post combustion capture of CO
2 (PCCC) which involves capturing CO
2 from flue gases emitted by large point sources, mainly from combustion of fossil fuels and biomass.
Various technologies such as cryogenic separation, membrane filtration and reactive absorption have been suggested in literature as post combustion capture technologies [
4,
5,
6,
7]. These technologies can be readily retrofitted to a range of industries other than power plants [
8]. Amine based reactive absorption-desorption system is one of the most practical, preferred and mature technological pathways for PCCC [
9].
Degradation of the amine solvent is a serious problem for large-scale applicability of these absorption-desorption system. The exposure of an amine solvent to the flue gas induces solvent degradation and subsequently enhanced corrosion, decreased solvent capacity and significant ammonia emissions [
10,
11,
12,
13,
14]. Solvent degradation can be categorized as oxidative degradation or thermal degradation. Thermal degradation occurs principally at high temperatures in the stripper (>120 °C) in the presence of an abundance of CO
2 [
15,
16]. Contrary to this, oxidative degradation is a catalytic mechanism occurring at temperature conditions of 40–55 °C and in the presence of oxygen. Such conditions are observed in the absorber and in the cross lean/rich heat exchanger (HEX) [
16]. Oxidative degradation is known to be the dominant degradation pathway for 2-ethanolamine (MEA) in a PCCC plant [
17,
18]. A pilot campaign with a capturing capacity of 1 ton/h has reported MEA losses to be as high as 2.4 kg of MEA/ton of CO
2 captured [
19].
Various kinetic models have been suggested to understand and quantify the oxidative degradation of MEA [
20,
21,
22]. Regardless of the reported catalytic effect of metals on the oxidative degradation mechanism, no kinetic model, to our knowledge, explicitly recognizes the effect of metals [
23]. Additionally, the kinetic parameters of all the available models are regressed on measurements made from laboratory experimentations. In these laboratory scale experiments, the solvent is exposed to relatively constant operating conditions as compared to the dynamic cycling of the solvent in a PCCC plant. Thus, these accelerated laboratory studies fail to replicate the utility scale plant [
24]. Due to the aforementioned factors, these kinetic models are insufficient in predicting industrial scale degradation of solvent [
25].
The objective of this work was to develop a kinetic model which could act as a tool to quantify the oxidative degradation of MEA in a PCCC plant. The observations and measurements from four different pilot plants: (i) EnBW’s capture plant at Heilbronn, Germany (EnBW); (ii) TNO’s PCCC plant at Maasvlakte, The Netherlands (TNO); (iii) CSIRO’s PCCC plant at Loy Yang Power, Australia (CSIRO); and (iv) DONG Energy’s capture plant at the Esbjerg power plant, Denmark (DONG) are investigated to arrive at an understanding of a common degradation mechanism taking place in these capture units. The measurements from these pilot plants also point towards an existence of a correlation between dissolved metals and ammonia emissions. The reaction scheme of the proposed kinetic model is based on methodology suggested by Leonard et al. [
26]. Besides, to avoid the discrepancy between lab-scale degradation and amine oxidation during pilot scale PCCC, the kinetic parameters are based on regression of measurements from the EnBW pilot plant campaign. The kinetic model is validated by predicting metal concentration and ammonia emissions for the other three pilot plant campaigns. Other relevant parameters such as SO
2/O
2 contaminants in flue gas, pilot plant material, etc. are also present in the system, however their quantitative influence on the mechanism is not straightforward and thus, is not considered.
2. Overview of Pilot Plants and Campaigns
All the pilot plant studies mentioned above are differ considerably in operating condition capacities and campaign duration. Although these pilot plants have been previously described in the literature, they are discussed briefly in this study with a focus on highlighting the differences in the plant designs and the different operating parameters of the respective campaigns [
27,
28,
29,
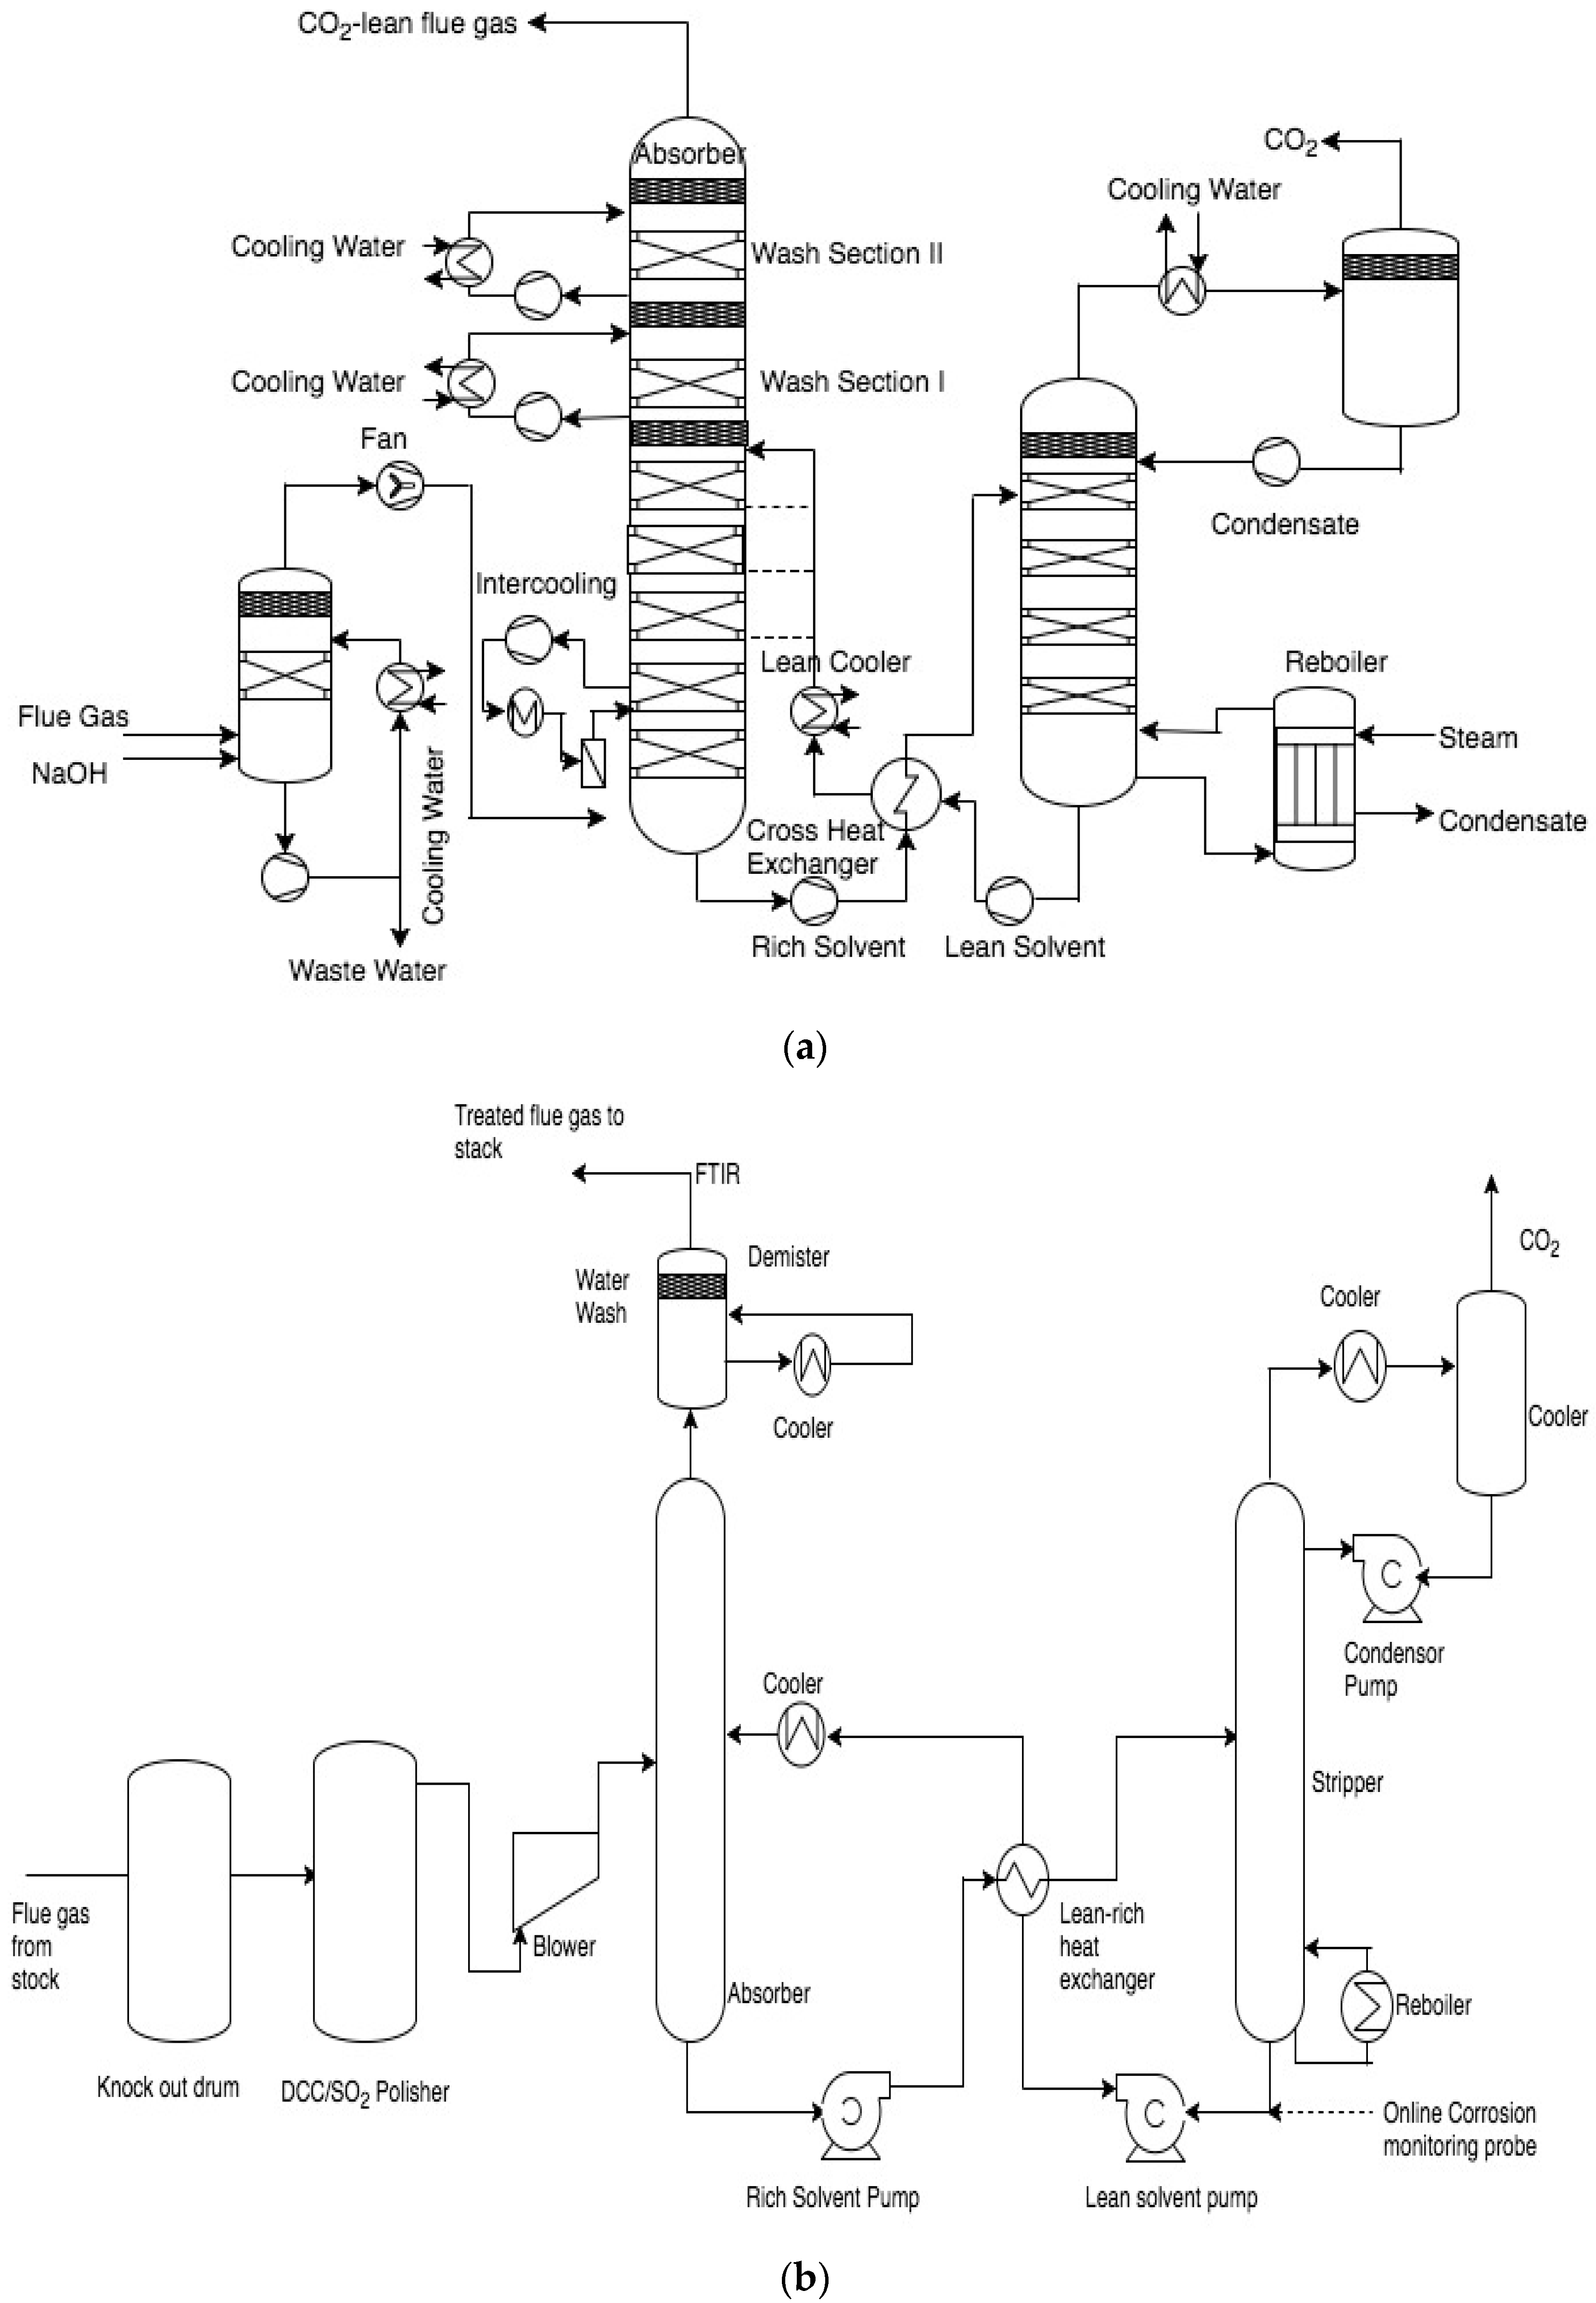
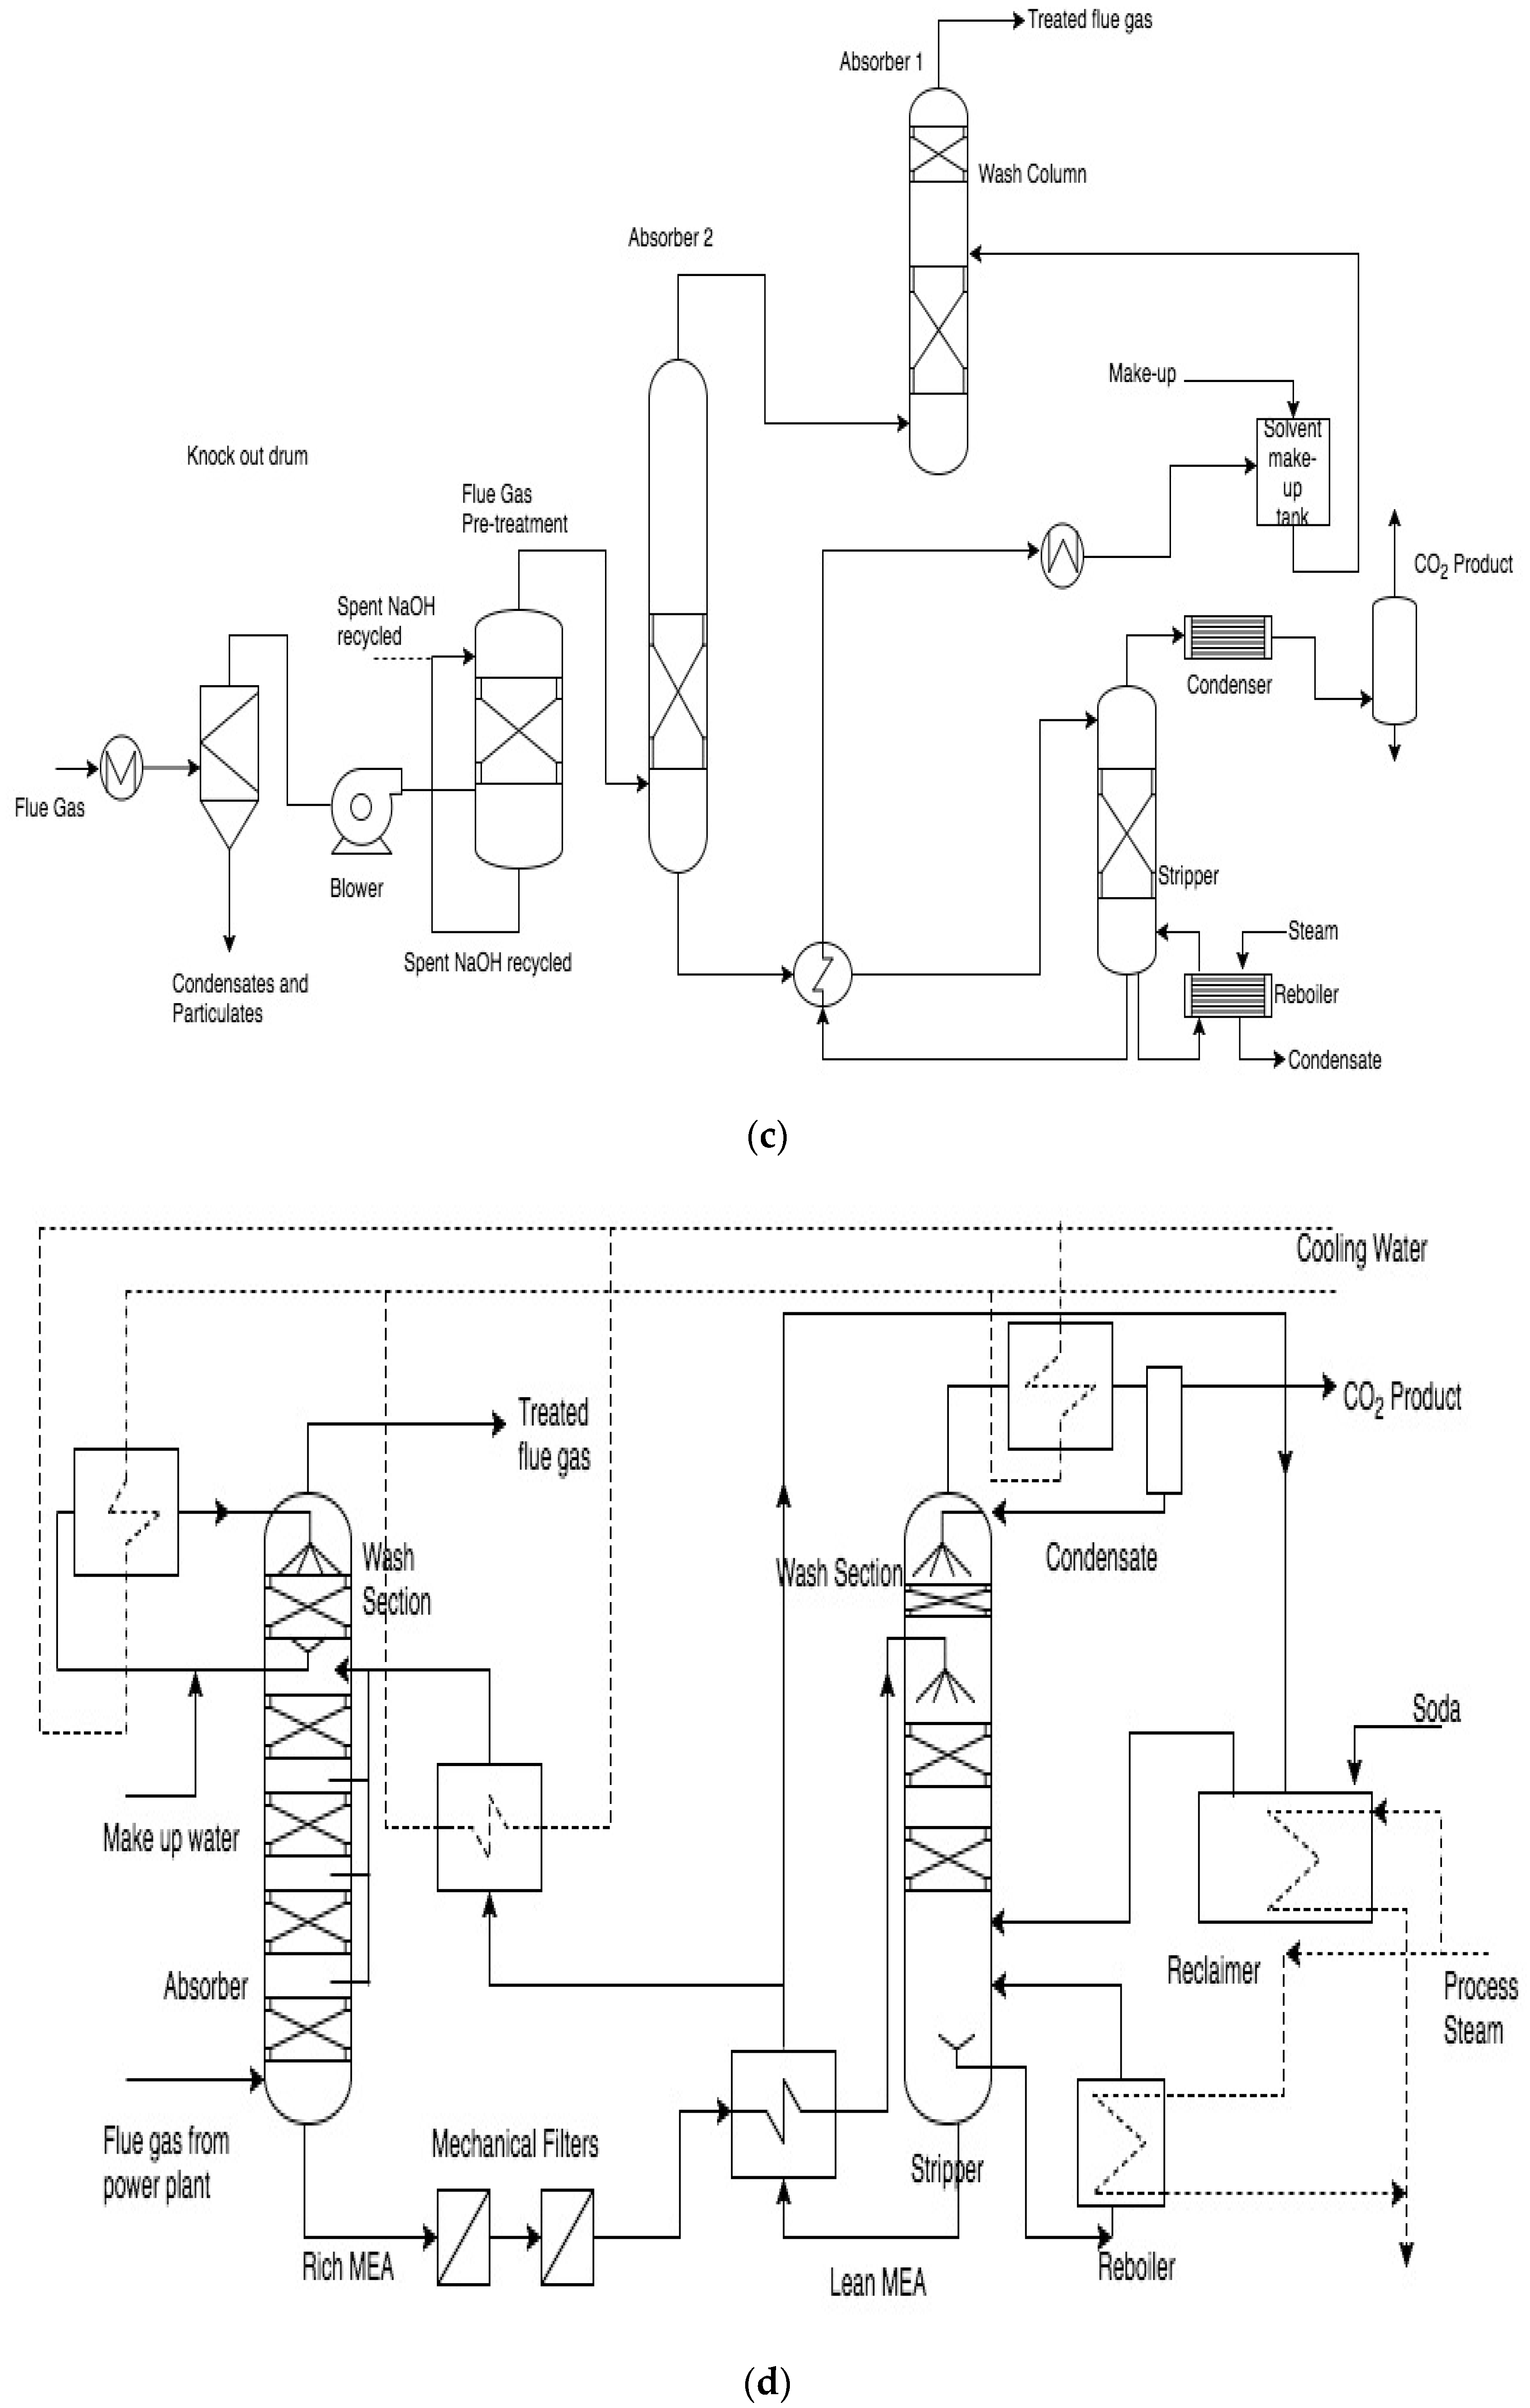
30]. The process flow scheme for the pilot plants is shown in
Figure 1.
EnBW’s CO
2 capture pilot plant consists of a pre-scrubber for flue gas cooling and deep SO
2 removal, an absorber for capturing CO
2 and a steam driven stripper for regeneration of the aqueous amine solvent. An inter-cooler section is located between the lowest two beds as shown in
Figure 1a. The absorber tower includes two packed beds at the top to act as water washing section and an acid wash section. Along with the absorber and stripper sumps, the solvent is stored in a tank in the inter-cooling line. The absorber section is made up of fiber reinforced polymer (FRP) pipes with polypropylene in liner. The rest of the plant is made up of SS316L.
At TNO’s CO
2 capture plant (
Figure 1b), the flue gas passes through a SO
2 scrubber to remove SO
x from the flue gas stream before entering the absorber. The SO
2 removal step is combined with cooling of the flue gas obtained from the power plant. The absorber tower has an integrally mounted water wash section at the top which minimizes the loss of the absorption solvent. The principal materials for equipment of pilot plant equipment are SS 304L and SS 316L.
CSIRO’s pilot plant (
Figure 1c) consists of a flue gas pre-treatment section, two absorber columns and one stripper column. The pilot plant is operated with two absorbers in series to facilitate transport by keeping the plant compact. The pre-treatment scrubber column removes SO
x, NO
x and particulates from the flue gas with sodium hydroxide. The top packed bed in the second absorber acts as the water wash section. The absorber and stripper section is made of 200 DN and 150 DN stainless steel, respectively [
31]. The PCC pilot plant at Loy Yang was operated with a previously aged MEA solvent. This solvent was exposed to normal PCC conditions for 639 h at the Tarong power station pilot plant and was further stored in an intermediate bulk container (IBC) for 12 months before being shipped to the pilot plant at Loy Yang [
32]. However, no nitrogen blanketing, UV-exclusion, cooling or other storage precautions were undertaken.
At DONG’s pilot plant (
Figure 1d), the flue gas undergoes selective catalytic reduction (SCR), DeNOx, electrostatic precipitators (ESP) and flue gas desulfurization (FGD) processes to clean the flue gas before CO
2 treatment, however no additional flue gas cooling was conducted before being supplied to the CO
2 absorber. The top packed bed in the absorber acts as a water wash functioning in a closed loop.
2.1. Operating Parameters of Campaigns
All the pilot campaigns received their flue gas from coal-based power plants and used 30 wt % MEA as the capture solvent.
Table 1 summarizes the different operating parameters during each pilot campaign. The operating parameters shown in
Table 1 are all expected to have a significant effect on oxidative degradation of the solvent.
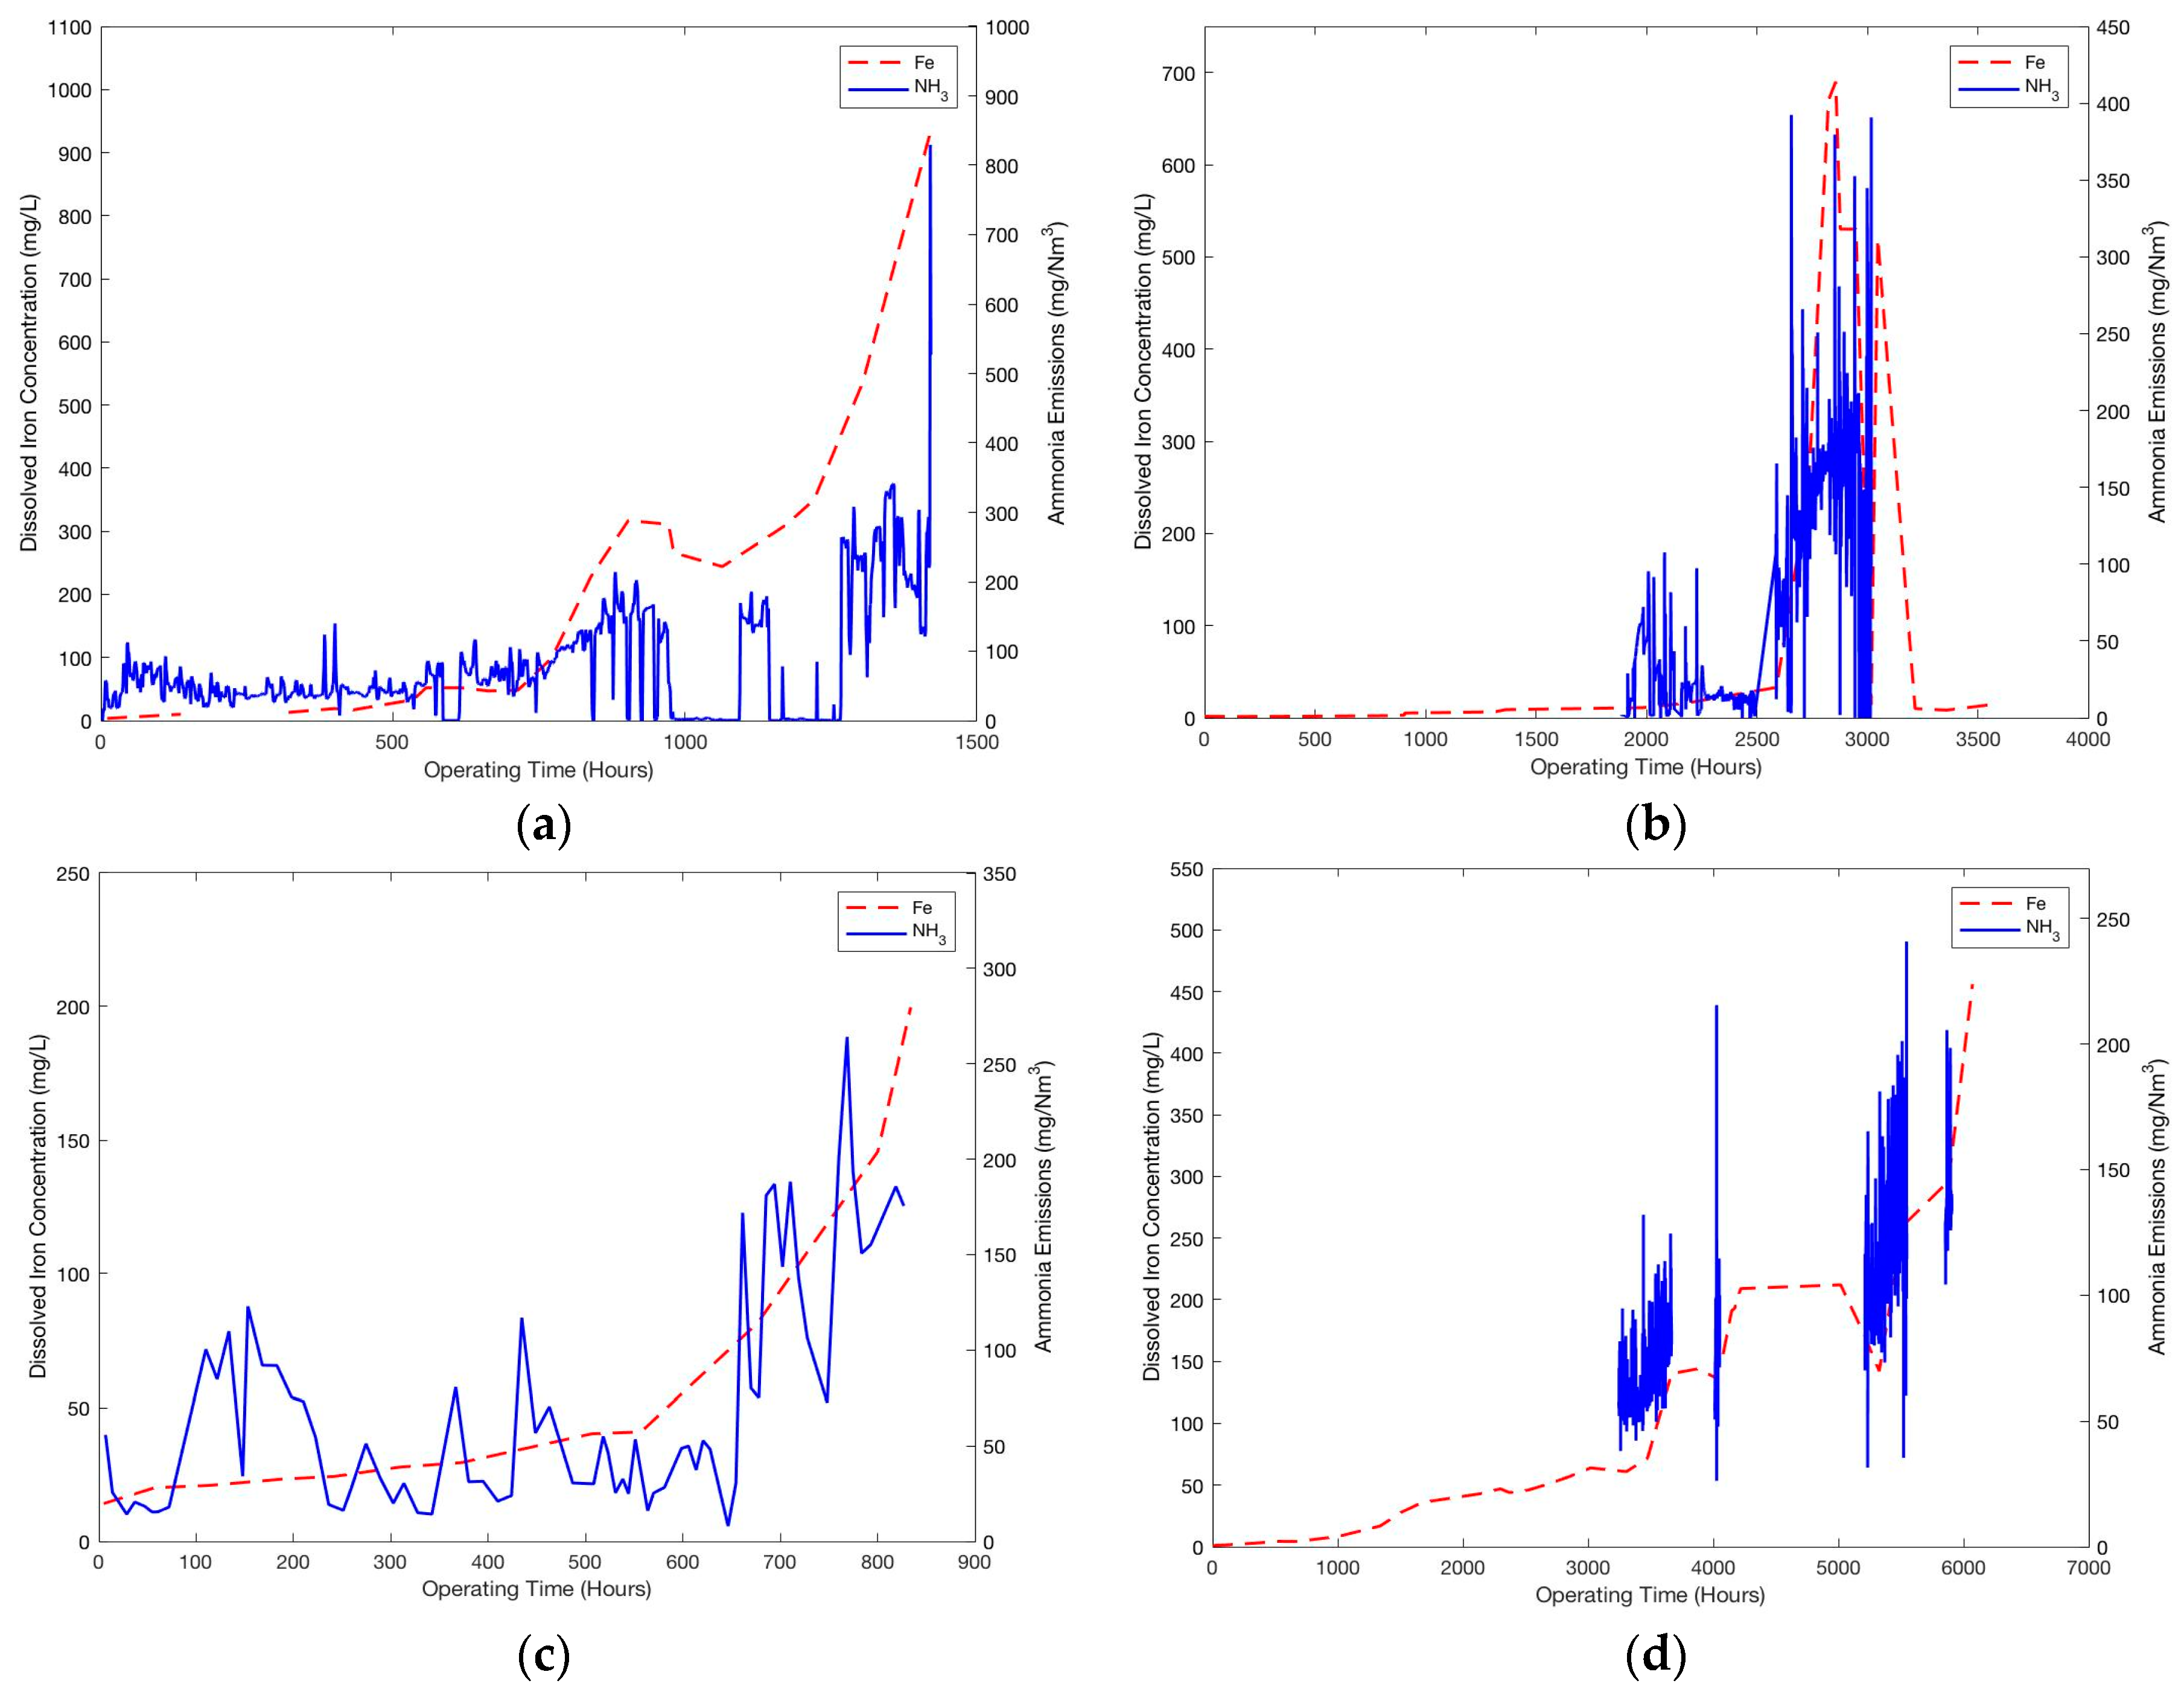
2.2. Ammonia Emissions and Dissolved Iron Concentration
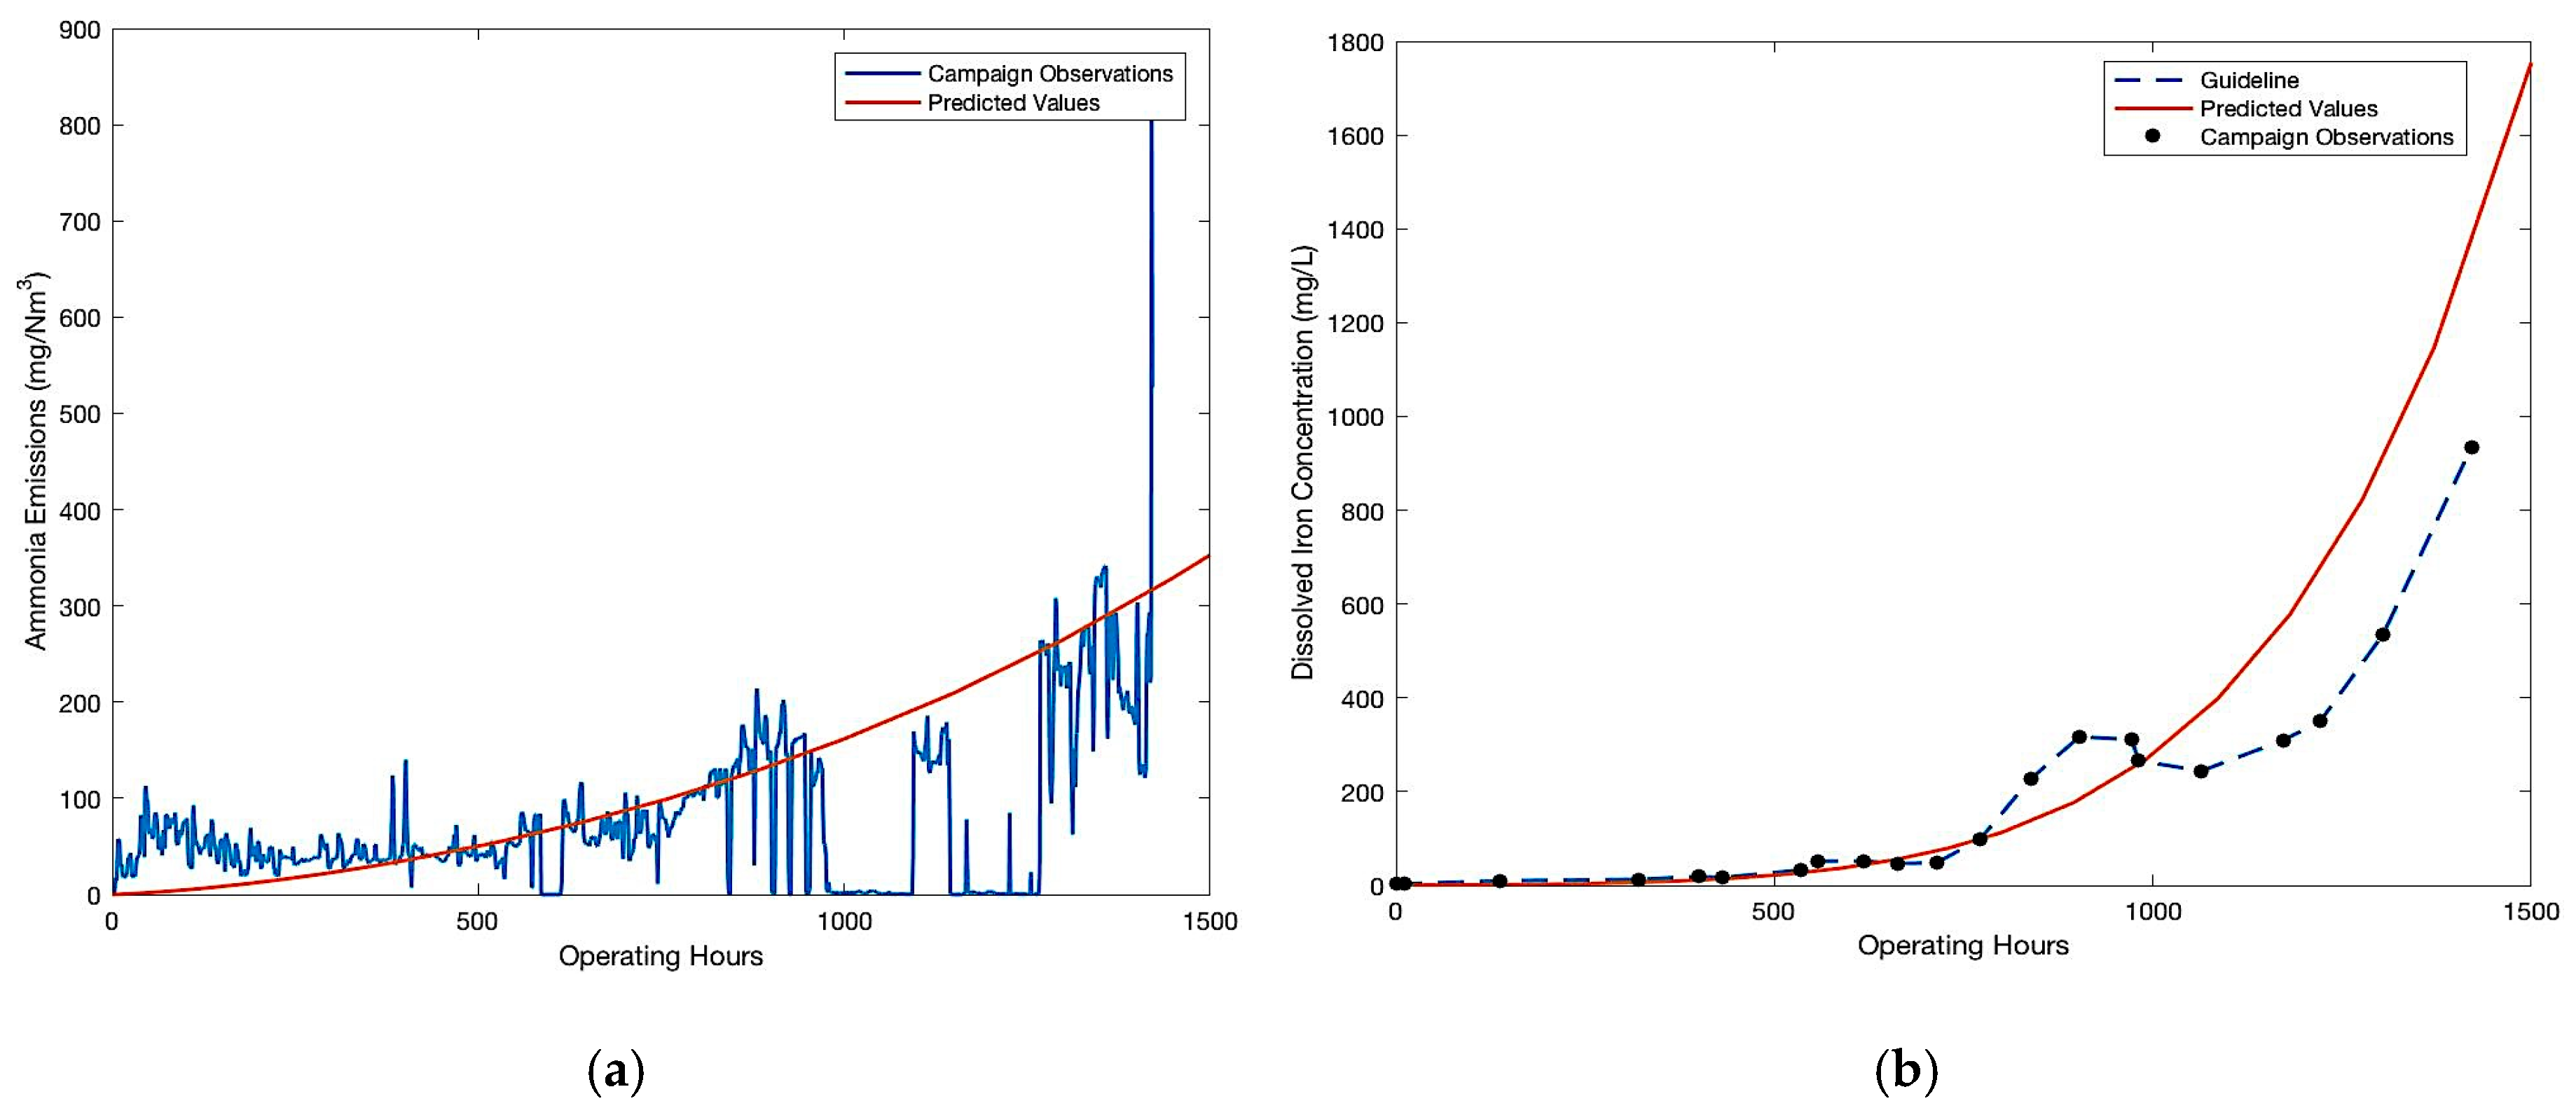
Ammonia is an oxidative degradation product of MEA. Being highly volatile at the operating pH, it is stripped from the solvent with the lean flue gas and ammonia emissions are measured at all four pilot plants. Additionally, increasing dissolved iron concentration is representative of leaching of iron from fly ash and corroded equipment. The measurements of ammonia emissions and dissolved iron concentration are indirectly representative of oxidative degradation and corrosion taking place in large scale CO2 capture units respectively.
From
Figure 2, the trends in all the campaigns are remarkably similar. Initially, ammonia emissions and iron concentrations remained steady and then increased rapidly after certain operating hours until the end of the campaign. Regardless of the differences in the design and operating parameters of these pilot campaigns and the absolute values of measurements, similar trends suggest a strong correlation between these degradation products and a common mechanism of oxidative degradation taking place in these large scale CO
2 capture units. The trends can be viewed as a combination of linear and exponential increase in the solvent degradation, which is peculiar of a self-sustaining auto-catalytic reaction mechanism. For this reason, in the following sections an auto catalytic reaction mechanism and a corresponding kinetic model of oxidative degradation is discussed.
3. Auto-Catalytic Mechanism and Kinetic Model
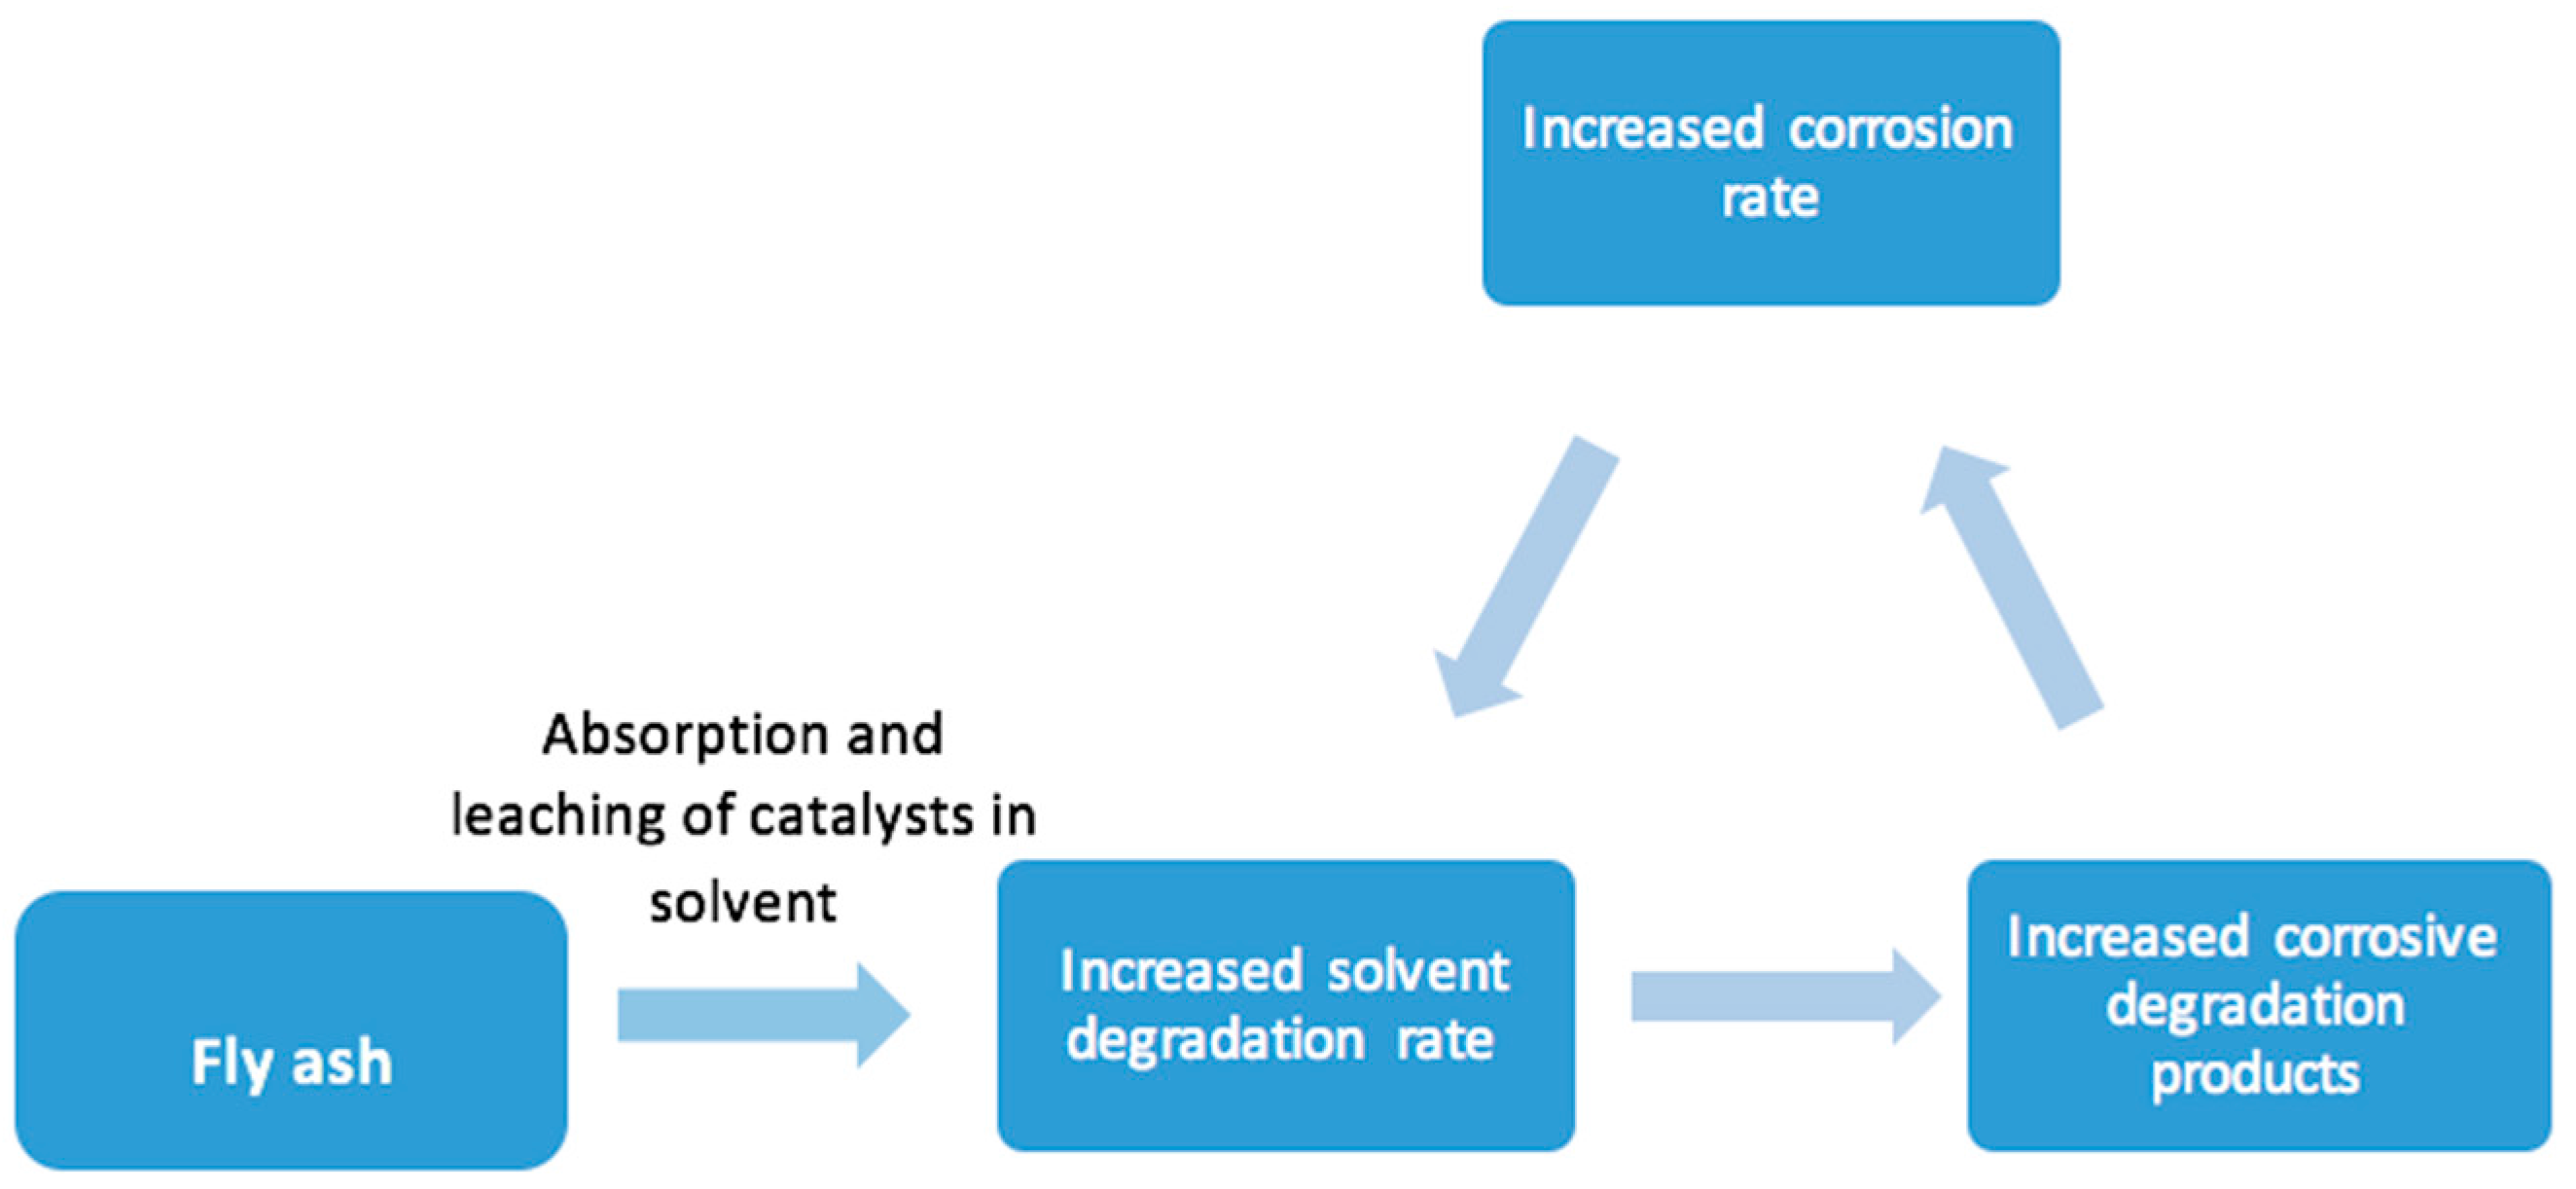
Broadly, oxidative degradation follows a free radical mechanism and presence of metal ions accelerates the degradation of solvent [
23]. The two main sources of leaching of metals in the solvent system are fly ash and corrosion of equipment [
33]. Schallert et al. [
34] reported that fly ash particulate matter undergoes leaching with MEA solutions to a small but significant extent. This leaching of metals from fly ash leads to increased rate of oxidative solvent degradation and formation of heat stable salts, which enhances the corrosion of the equipment, and consequently, leaching of more metals [
35]. This increasing dissolution of metal ions in the solvent system is represented schematically as in
Figure 3.
Owing to the complexity of the degradation kinetics, the exact reaction chemistry of oxidative degradation is not determined. Leonard et al. adopted a methodology to propose an apparent reaction mechanism for oxidative degradation [
26]. In the present work, the auto-catalytic reaction mechanism is developed on the same methodology. For the ease of the reader, the reaction mechanism and corresponding kinetic model proposed by Leonard et al. is explained briefly, followed by the auto-catalytic kinetic model.
3.1. Kinetic Model by Leonard et al.
The model proposed by Leonard et al. explains the degradation of MEA in the presence of oxygen through the overall balanced reaction Equation (1) [
26]:
In Equation (1),
N-(2-hydroxyethyl)imidazole (HEI) and 4-(2-hydroxyethyl) piperazin-2-one (HEPO) are important secondary degradation products [
36]. Formic acid is the acidic formate form, and it is included to account for the formation of heat stable salts. The approach takes advantage of the fact that the exact reaction mechanism of the degradation products is unknown and suggests a reaction balance based on the experimentally observed distribution of degradation products. The reaction rate of MEA degradation is given by Equation (2) where kinetic parameters were determined using a series of laboratory experiments [
26]:
The model proposed by Leonard et al. assumes that both MEA and CO2 are present in excess in the bulk and their effects on the degradation kinetics are independent of their concentration. Finally, the dissolved oxygen concentration in the solvent has been determined from Henry’s law for oxygen in water at saturation.
3.2. Auto-Catalytic Kinetic Model
As shown in Equation (3), the catalytic effect of metals is introduced to the degradation reaction mechanism of Equation (1). Additionally, the effect of heat stable salts on enhanced corrosion is accounted through Equation (4):
The formulation of rate equations for the auto-catalytic reaction mechanism is based on following set of four assumptions:
Firstly, dissolved iron content and formic acid concentration are used as measures of total dissolved metals and total HSS anions, respectively. These species are chosen because iron is typically the most abundant metal while formate anions are typically the most abundant HSS based on pilot plant measurements [
25]. Iron is also known to have a more potent catalytic effect than some of the other metals present such as vanadium, chromium and nickel [
37]. It is important to note that no distinction is made between the ferrous and ferric ions, since the measurements available from the pilot plant are total dissolved iron content. Similarly, formate anions have been shown to increase the corrosion rate of the system by almost 12% which is significantly more than other majorly occurring HSS anions such as acetate and glycolate [
36,
38].
Secondly, it is assumed that the corrosion rate is dependent on temperature and formate anion concentration through the Arrhenius law. The corrosion rate in a PCC unit can be influenced by many other factors such as nature of the plant material, section of the plant, amine concentration, CO
2 concentration and dissolved oxygen [
38]. Moreover, HSS concentration is dependent on dissolved oxygen concentration through Equation (3). It is important to consider that these pilot plants were built without minimizing the capital expenditure (CAPEX) in terms of design and built-quality. This may not be the case for full scale plants, where certain decisions on used materials and unit operations design will be based on lowest CAPEX. Due to differences in the properties of equipment materials, different susceptibility to corrosion can be expected. However, temperature and HSS concentration act as the main limiting parameters of corrosion.
Thirdly, to incorporate the self-sustaining effect of dissolved metals, it is assumed that the rate of MEA degradation is dependent on the iron concentration as shown in Equations (5) and (6). Lastly, the dissolved oxygen concentration is calculated from measurements reported by Wang et al. [
39]. These measurements also take into account the effect of CO
2 loading on the dissolved oxygen concentration in MEA/H
2O system, which otherwise was not accounted in the model reported by Leonard et al. [
26]:
where
and
represent rate constant for degradation of MEA and formation of iron respectively.
and
represent the reaction orders for iron ions and formate anions, respectively. Equation (6) can be derived from the stoichiometry of Equation (3).
4. Kinetic Parameters
Several experimental studies report an increase in degradation rates due to concentrations of dissolved metals [
35,
37,
38,
40]. However, no work has explicitly quantified this relationship. Also, owing to the difficulty of developing a laboratory set-up which could be a representation of large scale capture units, in this work the parameters for the suggested kinetics were regressed based on pilot plant observations instead of degradation rates measured in the laboratory experimentations. Oxidative degradation is likely to occur in the absorber sump, absorber packing and rich side of the cross HEX [
16]. Since oxidative degradation is oxygen-mass transfer controlled, the relatively high residence in the sump provides sufficient time for degradation reactions to proceed to completion [
41]. The estimated rates of degradation in the sump and rich side of HEX in absence of metal ions are compared using Equation (2). The comparison in
Table 2 is based on average temperatures and dissolved concentration of oxygen observed in these locations at EnBW’s plant. Even higher degradation would be expected in the presence of metals.
It is evident that with a higher residence time, the absorber sump is responsible for almost 95% of MEA degradation. For this reason, the new kinetic parameters depicted in
Table 3 were determined by using the operating conditions experienced at the absorber sump. Measured ammonia emissions and dissolved metal concentrations data from EnBW’s pilot campaign were used to determine the new kinetic parameters of Equations (5)–(7) by minimising the squared error in pilot plant observations and predicted values. This procedure was executed using MATLAB’s optimisation toolbox.
The regressed parameters for the new auto-catalytic model are compared with those published by Leonard et al. in
Table 3. The new energy of activation has a lower value compared to the parameters of the model presented by Leonard et al., which is consistent with the assumption of a catalytic model. Similarly, ammonia formation was estimated to be less than first order in iron concentration, which is consistent with the results reported by Chi and Rochelle [
11].
The model fit is such that it predicts the iron concentration and ammonia emissions within the same order of magnitude as shown in
Figure 4. Although, there are large deviations between the predicted values and campaign measurements (
R2Ammonia = 0.34,
R2Fe = 0.53), the model accurately predicts the onset of the sudden increase of ammonia emissions and iron concentration.
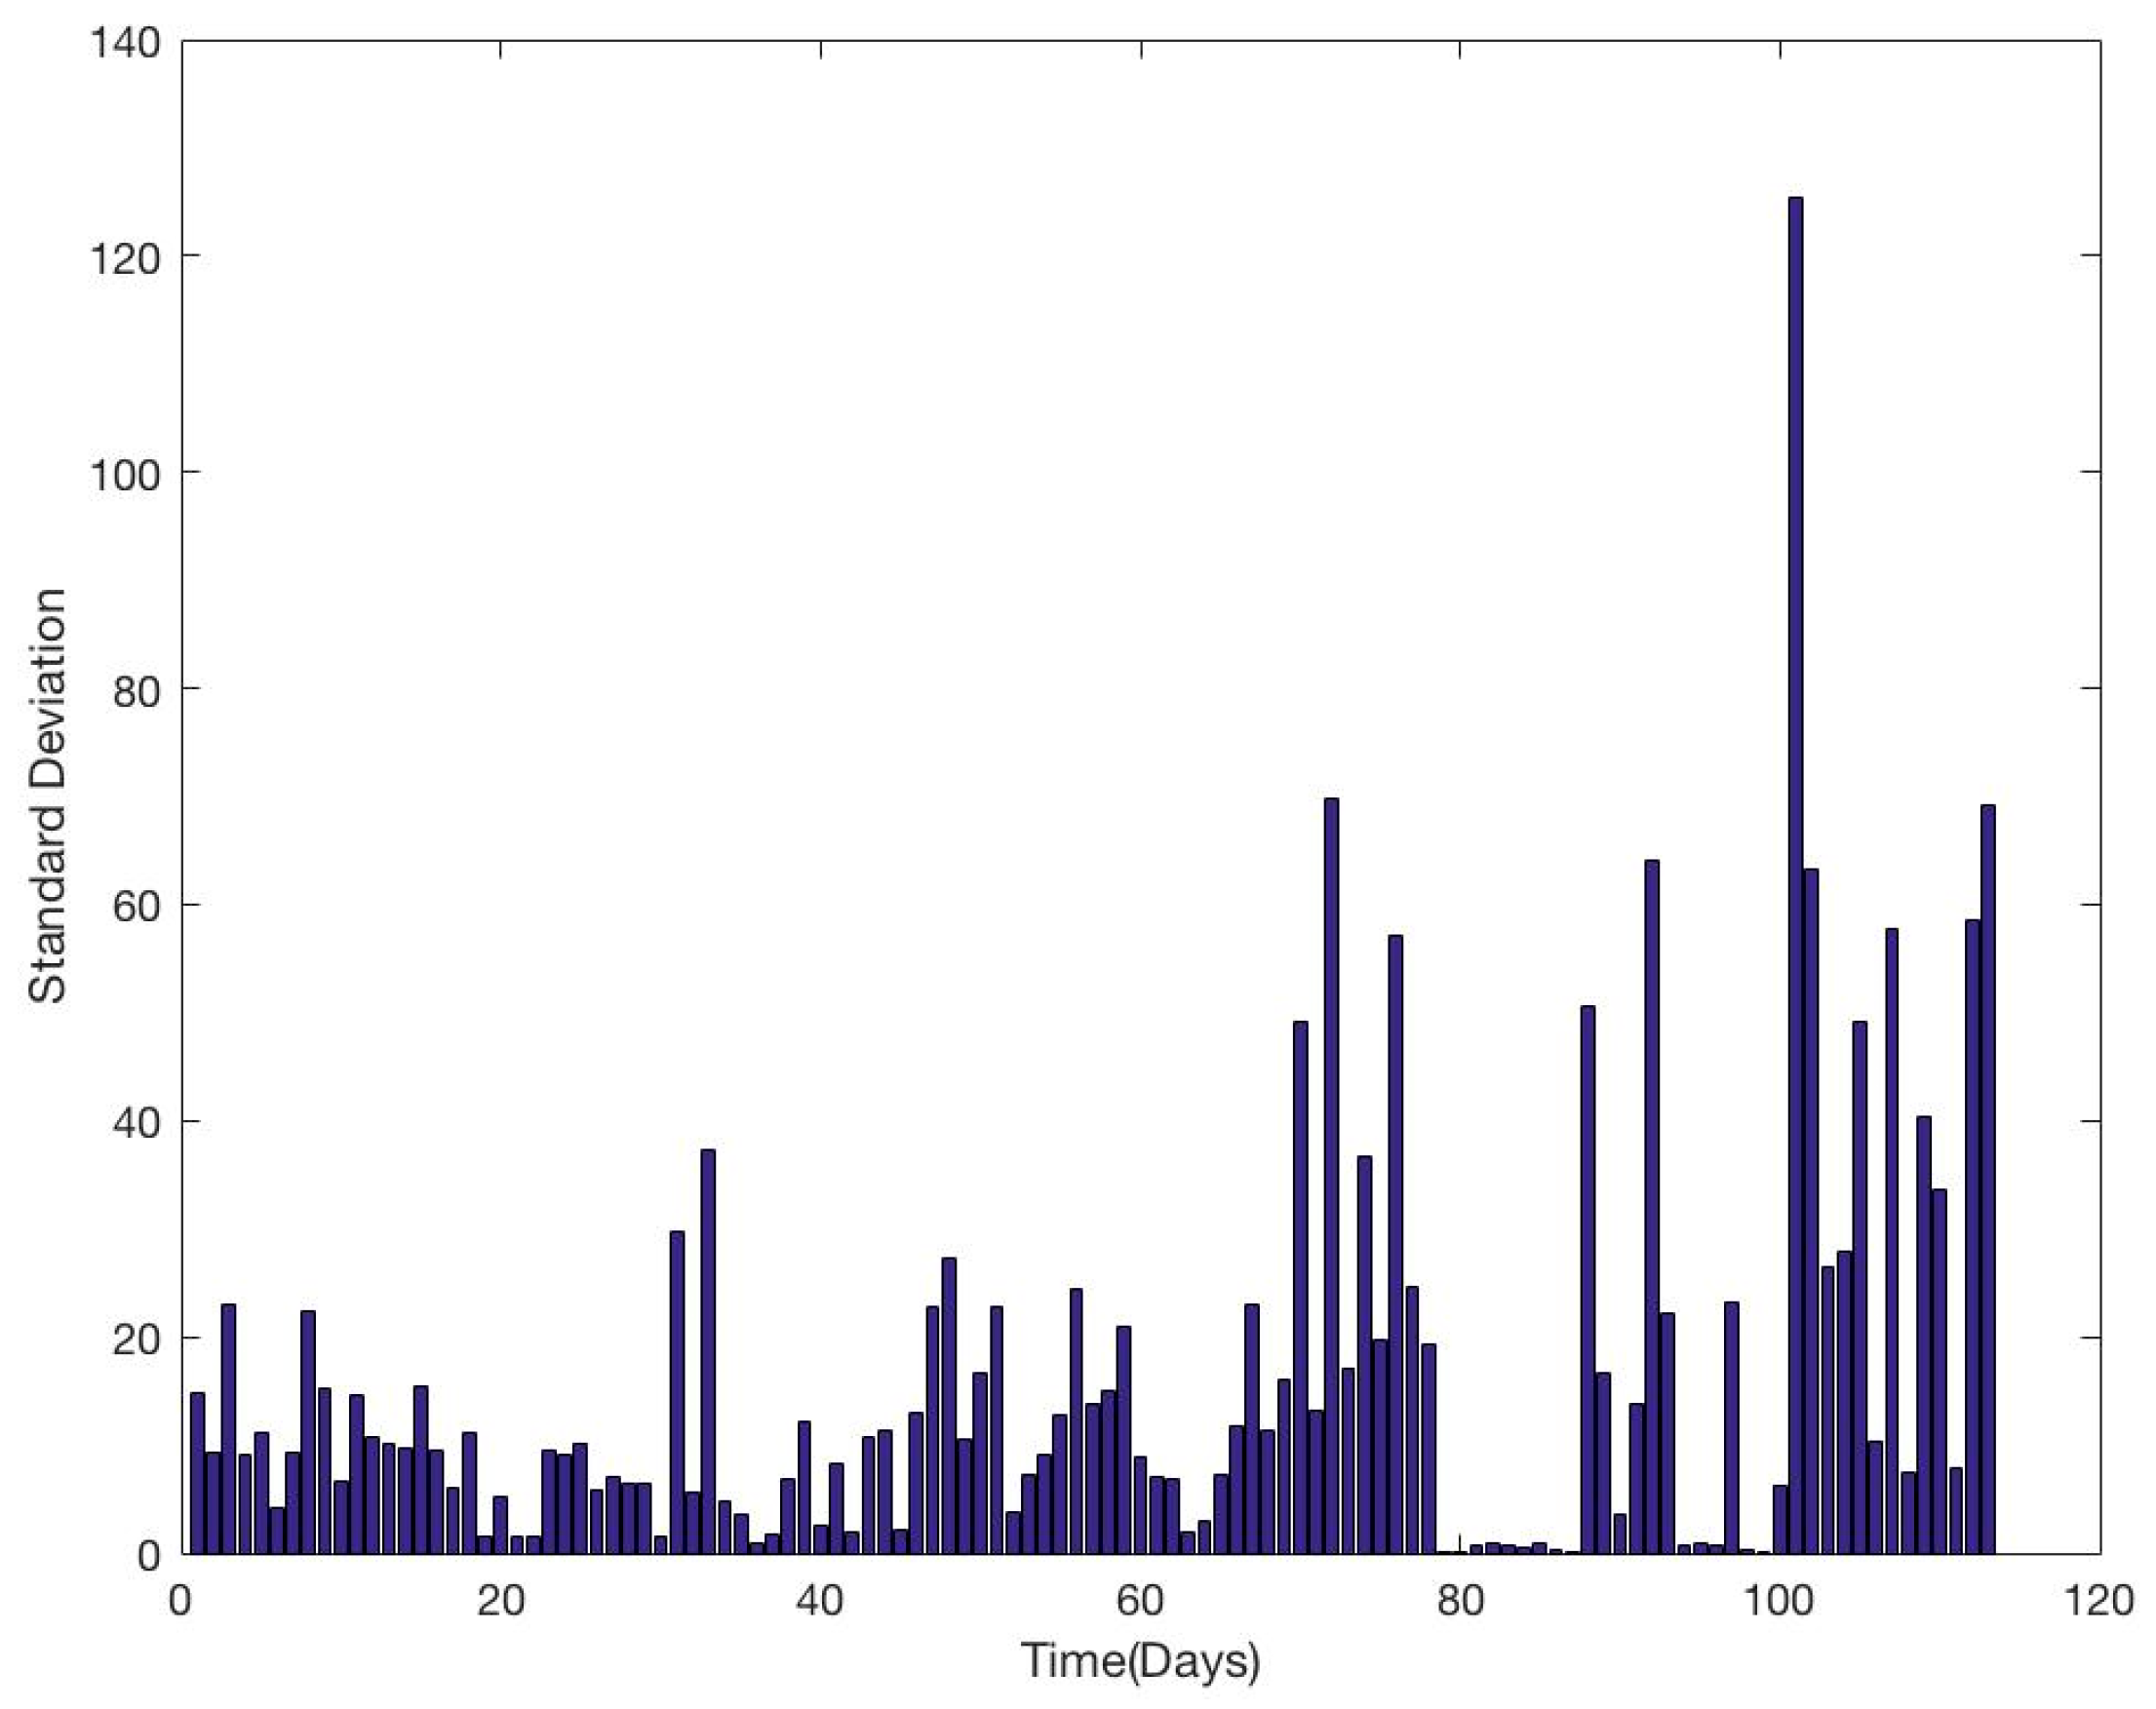
The large deviations could be rooted to the fact that the kinetic parameters are regressed on a pilot plant data set with high deviations. As shown in
Figure 5, deviations ranged from 1% to 125% were observed for daily ammonia emissions during the EnBW campaign.
5. Model Validation
In this section, the model is validated with results from pilot plant campaigns at TNO, DONG and CSIRO. The auto-catalytic model and its parameters were validated using measurements of ammonia emissions and iron concentrations from different pilot plants. The rate equations were solved using the ode15 solver of MATLAB R2016a (MathWorks, Inc., Natick, MA, USA). The program structure of MATLAB computed oxidative degradation taking place at the operating conditions of absorber sump iteratively, where each iteration represents a cycle of absorber-desorber set-up. This was done to include the effect of residence time and operating hours of the different campaigns in the kinetic model. The computation loop is initiated with initial measured concentration for all the chemical species except dissolved oxygen. The dissolved oxygen concentration is set to its original value upon the start of each iteration.
Resetting the dissolved oxygen concentration at the beginning of each iteration is consistent with dissolved oxygen being replenished every time the lean solvent contacts the flue gas in the absorber. This model also assumes that no oxidative degradation takes place in the stripper sump and HEX. Since at the high temperatures of the stripper, most of the dissolved oxygen is stripped off and very little oxidative degradation takes place in HEX as compared to the absorber sump. The computation loop quits iterating upon reaching the final number of cycles.
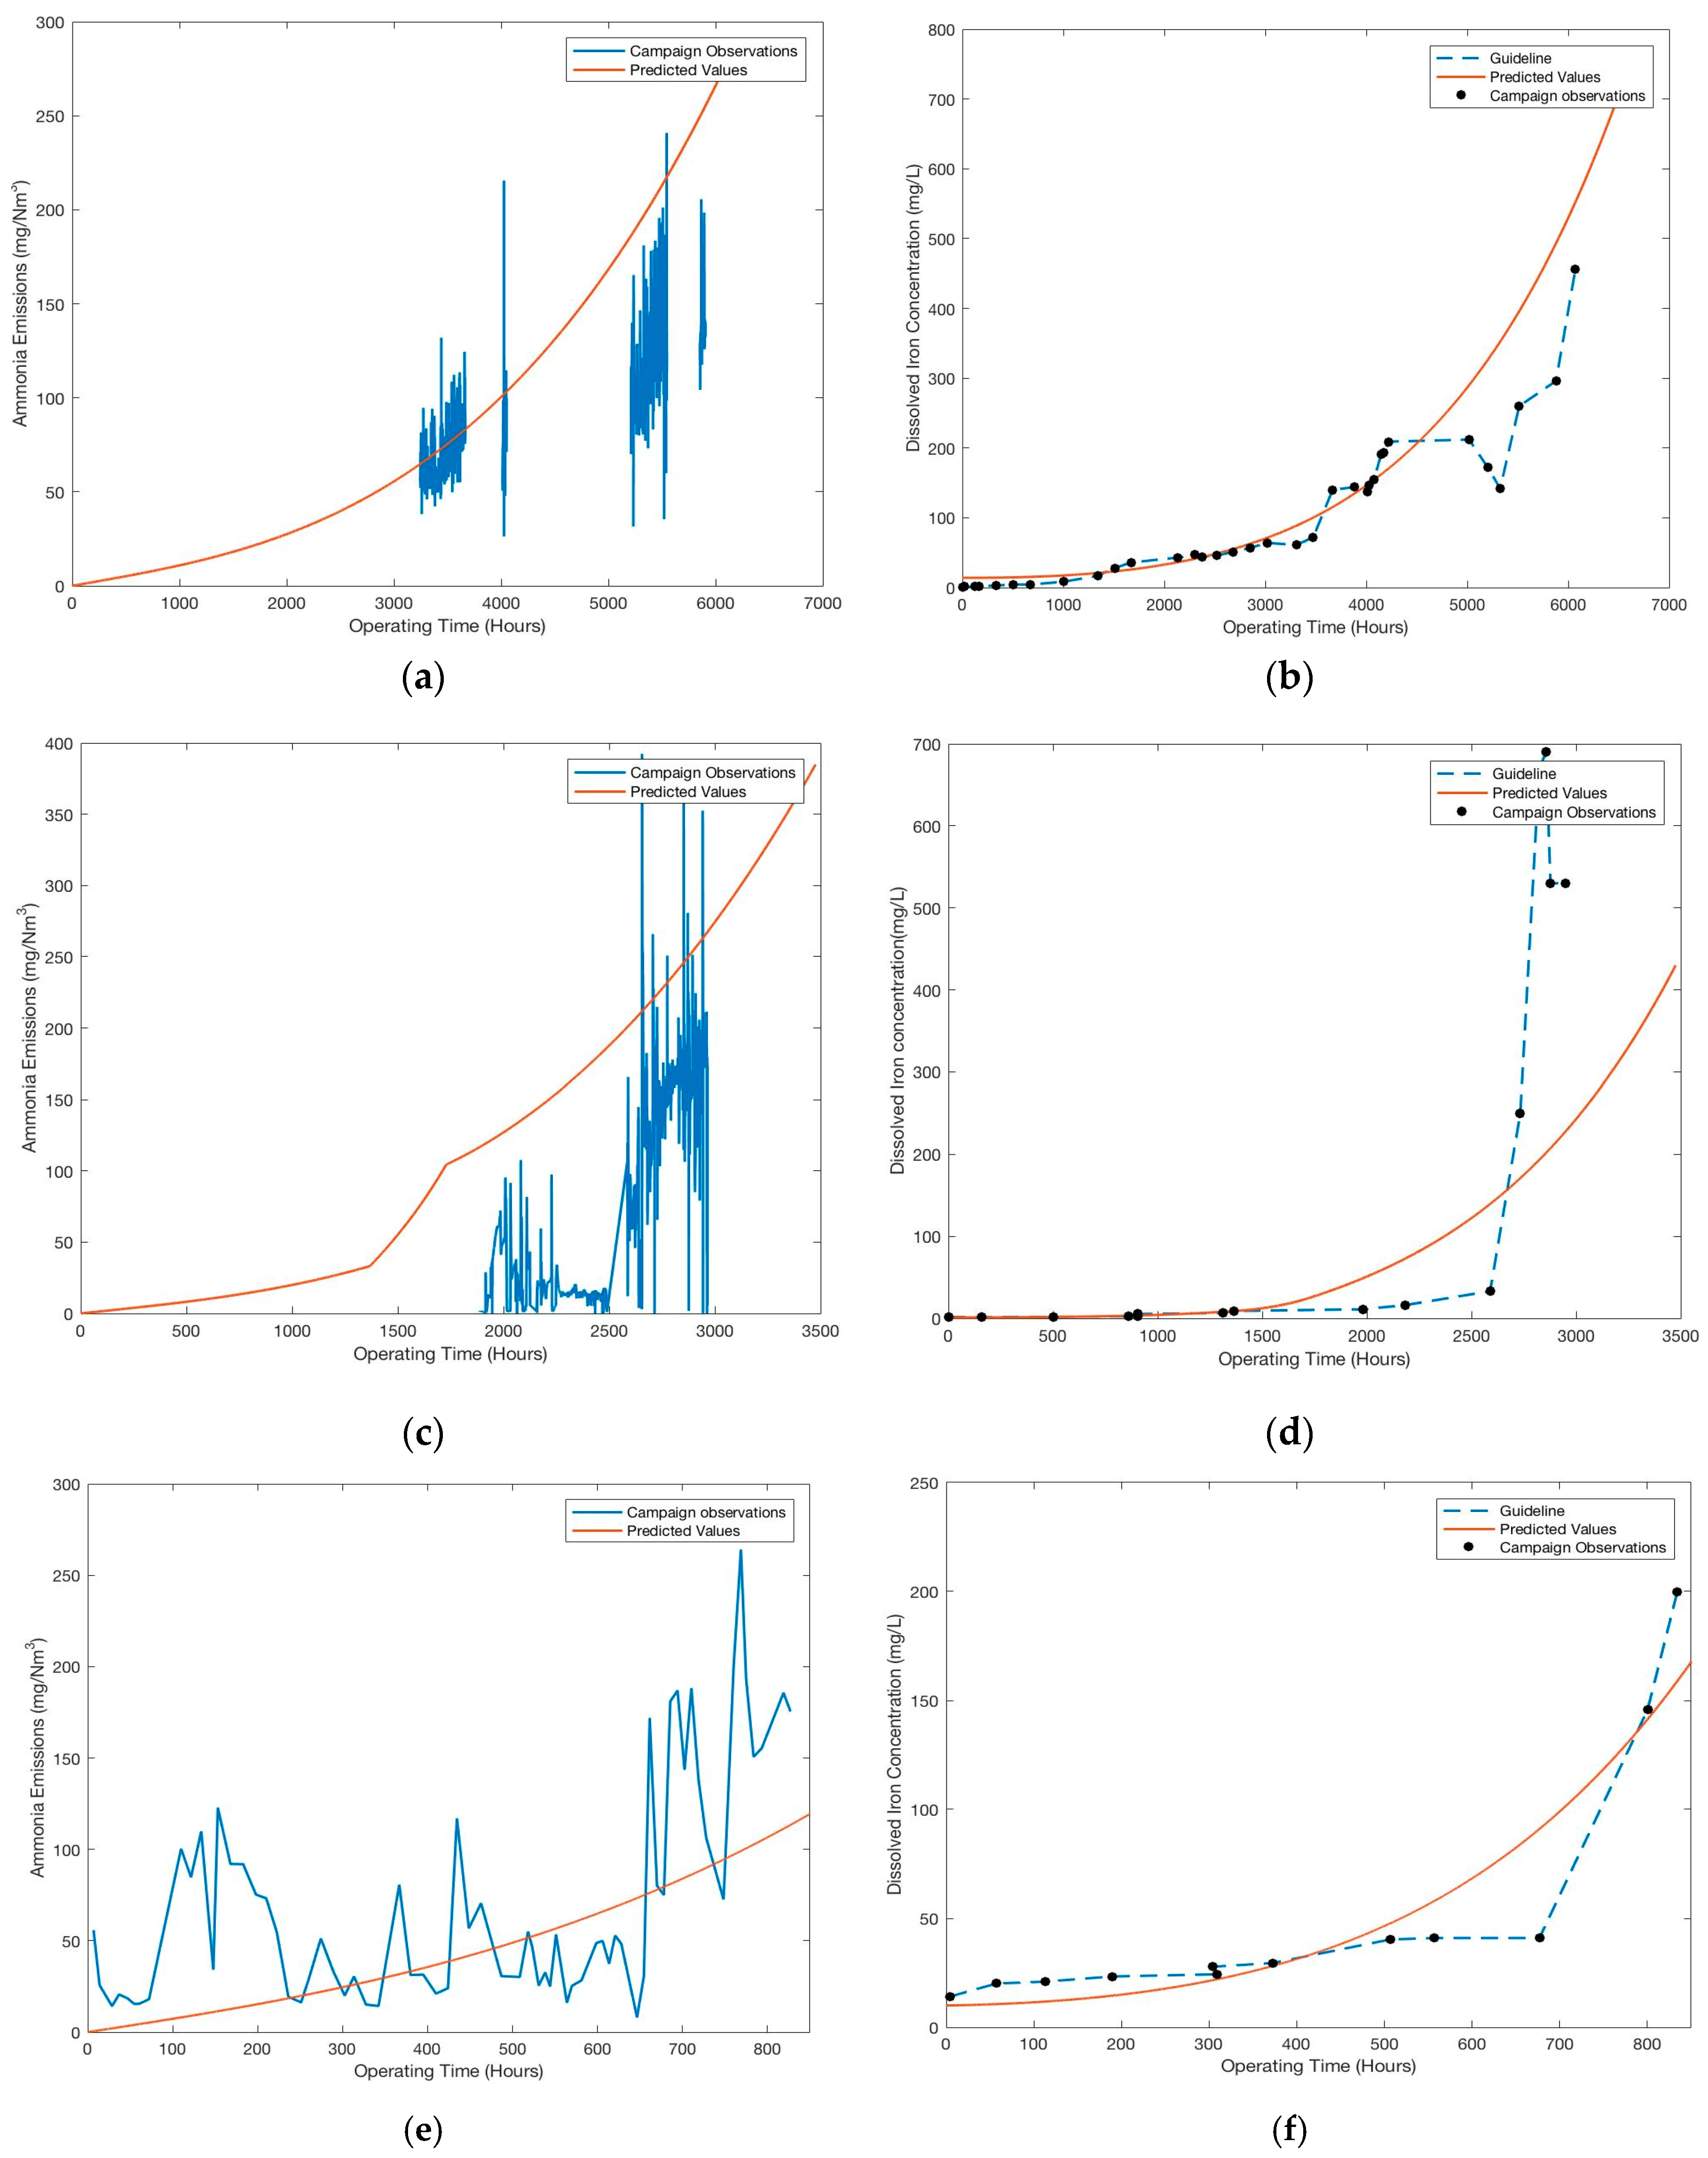
Figure 6 shows the predicted iron concentrations and ammonia emissions against measured results during the four different pilot plant campaigns. The model predicts the dissolved iron content with good accuracy in the linear range of the measurements. It also predicts the onset of rapid increase in dissolved iron concentration for all the campaigns. However, there are some differences observed in the predicted trends for the last few hundred hours for all the campaigns. The comparison of the predicted values and measured values for ammonia emissions is more difficult owing to limited data set and inherent large deviations in the measurements (
Figure 2 and
Figure 4). In general, ammonia emissions are predicted with a deviation of less than 50% for most part of the campaign. To facilitate the comparison and assess the accuracy of the model predictions for the widely different pilot campaigns, average deviations (AD) and absolute average deviations (AAD) for both dissolved iron and ammonia emissions were calculated for the entire campaign duration, as shown in
Table 4. Moreover, deviations for the dissolved iron content were calculated for the first and last 15% of the campaign, as shown in
Table 5.
The maximum AAD for the entire campaign for dissolved iron is 55%, a maximum of 33% and 25% for the first and last 15% of the campaign duration, respectively. Larger deviations are observed during the last 15% of the campaign as compared to the first 15%. The model also predicts the maximum metal ions concentrations achieved within each pilot plant campaign to the same order of magnitude. Thus, the model can predict dissolved iron concentration with good accuracy, with more accurate predictions for lower degradation rates as compared to higher degradation rates.
Although, the predicted trend in ammonia emissions fits well for all the campaigns large deviations (>50%) are observed for the TNO and DONG campaign. Due to unavailability of consistent and sufficient data set for all the campaigns, the deviations for the different time periods of the campaign could not be calculated.
This uncertainty reflects upon the lack of consistent data set across all the campaigns. It is also important to consider that the kinetic parameters for the auto-catalytic model are based on pilot plant observations, wherein the operating conditions and the measurements themselves have large deviations. The validation is based on pilot campaigns which are diverse in terms of design, operating capacities and conditions. Given the simplicity of the model and its application to four different pilot plants, the deviations shown in
Table 4 and
Table 5 are reasonable. Importantly, the model shows the potential to explain and predict the sudden rise of solvent degradation.
6. Conclusions
An alternative modelling approach to oxidative degradation kinetics, in this case for MEA, based on an apparent auto-catalytic reaction mechanism between solvent degradation, corrosion and ammonia emissions is presented. Experimental measurements from pilot plant campaign of EnBW are used to regress the parameters for the model. Results from TNO, CSIRO and DONG pilot campaigns were used to validate the model. The model predicts the dissolved iron content with a maximum AAD of 55% with higher accuracy at lower degradation rates. The overall trend in ammonia emissions are predicted well, however, large AAD are observed, especially for the TNO and DONG campaigns. The large AAD can be attributed to large inherent deviations in the data set used for regression and validation (maximum of 125% in the case of daily ammonia emissions for EnBW campaign). The proposed model can predict the overall trend, i.e. combination of linear and exponential trends observed in the pilot plant measurements. Moreover, the onset of rapid increase in the ammonia emissions and dissolved iron concentrations can also be predicted. This model also demonstrates that the residence time and temperature of the absorber sump has a more significant contribution to oxidative degradation than the lean-rich heat exchanger.
Considering the different scale, construction, design, operating conditions and measured experimental values for the different pilot campaigns, the proposed modelling approach and assumptions can be considered to be representative of a PCCC process. This is the first kinetic model for PCCC that incorporates the role of metal ions in solvent degradation.
7. Recommendations
The ability of this PCCC-based kinetic model to predict trends in MEA degradation during campaigns at widely different PCCC pilot plants indicates the potential of the approach. Further efforts to develop this modelling approach by means such as use of a larger data set for regression and validation are warranted. The model predictions could certainly be improved by limiting its validation to pilot plants similar in flue gas source, design, construction material, and operating conditions. Reducing differences in the control software as well as methods to measure input parameters (such as residence times, absorber sump temperatures and chemical species concentration) would also improve the quality of the predictions. Based on this study, two clear operational recommendations can be made. Firstly, minimizing the residence time of the solvent in the sump to limit the rate of oxidative degradation in a full scale capture plant. Secondly, the dissolved metal content should be kept at a minimum using suitable strategies to avoid the catalytic regime of degradation kinetics.
Author Contributions
Sanjana Dhingra improved on the alternative kinetic modelling approach, analyzed the data, regressed the model parameters and prepared the manuscript. Purvil Khakharia improved on the alternative kinetic modelling approach was responsible for the campaign at TNO, analyzed the data, and helped in preparation of the manuscript. Alexander Rieder was responsible for the campaign at EnBW, helped in interpretation of the results and reviewed the manuscript. Ashleigh Cousins was involved in the campaign at CSIRO, helped in interpretation of the results and reviewed the manuscript. Alicia Reynolds, helped in interpretation of the results, reviewed the manuscript and made language related corrections in the review of the manuscript. Jacob Knudsen was responsible for the campaign at DONG, helped in interpretation of the results and reviewed the manuscript. Jimmy Andersen was responsible for the campaign at DONG, helped in interpretation of the results and reviewed the manuscript. Robin Irons helped in interpretation of the results and reviewed the manuscript. Jan Mertens was involved in the measurements at the campaign of DONG and TNO. He has helped in in interpretation of the results and reviewed the manuscript. Mohammad Abu Zahra helped in interpretation of the results and reviewed the manuscript. Peter Van Os was involved in the campaign at TNO and and reviewed the manuscript. Earl Goetheer was involved in the campaign at TNO, proposed the alternative kinetic modelling approach, helped in interpretation of the results and reviewed the manuscript.
Conflicts of Interest
The authors declare no conflict of interest.
References
- Broutin Paul, L.E.; Lecomte, F. Technologies to Reduce Greenhouse Gas Emissions; Technip & Ophrys Editions: Paris, France, 2010. [Google Scholar]
- Europe Commission. Climate and Energy Framework. Available online: http://ec.europa.eu/clima/policies/strategies//indexen (accessed on 25 October 2016).
- Europe Union. Eurostat Statistics Explained. Available online: http://ec.europa.eu/eurostat/statistics-explained/index.php/Greenhouse_gas_emission_statistics (accessed on 25 October 2016).
- Safdarnejad, S.M.; Hedengren, J.D.; Baxter, L.L. Plant level dynamic optimization of Cryogenic Carbon Capture with conventional and renewable power sources. Appl. Energy 2015, 149, 354–366. [Google Scholar] [CrossRef]
- Belaissaoui, B.; Cabot, G.; Cabot, M.S.; Wilson, D.; Favre, E. CO2 capture for gas turbines an integrated energyefficient process combining combustion in oxygenenriched air flue gas recirculation and membrane separation. Chem. Eng. Sci. 2013, 97, 256–263. [Google Scholar] [CrossRef]
- Gopan, A.; Kumfer, B.M.; Phillips, J.; Thimsen, D.; Axelbaum, R.L. Process design and performance analysis of a Staged Pressurized Oxy-Combustion (SPOC) power plant for carbon capture. Appl. Energy 2014, 125, 179–188. [Google Scholar] [CrossRef]
- Liang, Z.; Rongwong, W.; Liu, H.; Fu, K.; Gao, H.; Cao, F.; Zhang, R.; Sema, T.; Henni, A.; Sumon, K.; et al. Recent progress and new developments in post-combustion carbon-capture technology with amine based solvents. Int. J. Greenh. Gas Control 2015, 40, 26–54. [Google Scholar] [CrossRef]
- IPCC Special Report on Carbon Dioxide Capture and Storage. Available online: http://www.ipcc.ch/publications_and_data/_reports_carbon_dioxide.htm (accessed on 25 October 2016).
- Rochelle, G.T. Amine scrubbing for CO2 capture. Science 2009, 325, 1652–1654. [Google Scholar] [CrossRef] [PubMed]
- Chakma, A.; Meisen, A. Corrosivity of diethanolamine solutions and their degradation products. Ind. Eng. Chem. Res. Dev. 1986, 25, 627–630. [Google Scholar] [CrossRef]
- Chi, S.; Rochelle, G.T. Oxidative degradation of Monoethanolamine. Ind. Eng. Chem. Res. 2002, 41, 4178–4186. [Google Scholar] [CrossRef]
- Khakharia, P.; Brachert, L.; Mertens, J.; Anderlohr, C.; Huizinga, A.; Fernandez, E.S.; Schallert, B.; Schaber, K.; Vlugt, T.J.; Goetheer, E. Understanding aerosol based emissions in a Post Combustion CO2 Capture process: Parameter testing and mechanisms. Int. J. Greenh. Gas Control 2015, 34, 63–74. [Google Scholar] [CrossRef]
- Khakharia, P.; Brachert, L.; Mertens, J.; Anderlohr, C.; Huizinga, A.; Fernandez, E.S.; Schallert, B.; Schaber, K.; Vlugt, T.J.; Goetheer, E. Investigations of areosol based emission of MEA due to sulphuric acid aerosol and soot in a Post Combustion CO2 capture process. Int. J. Greenh. Gas Control 2013, 19, 138–144. [Google Scholar] [CrossRef]
- Mertens, J.; Lepaumier, H.; Desagher, D.; Thielens, M.L. Understanding ethanolamine (MEA) and ammonia emissions from amine based post combustion carbon capture: Lessons learned from field tests. Int. J. Greenh. Gas Control 2013, 13, 72–77. [Google Scholar] [CrossRef]
- Rochelle, G.T. Thermal degradation of amines for CO2 capture. Curr. Opin. Chem. Eng. 2012, 1, 183–190. [Google Scholar] [CrossRef]
- Kohl, A.L.; Nielsen, R.B. Gas Purification, 5th ed.; Gulf Professional Publishing: Houston, TX, USA, 1997. [Google Scholar]
- Da Silva, E.F.; Lepaumier, H.; Grimstvedt, A.; Vevelstad, S.J.; Einbu, A.; Vernstad, K.; Svendsen, H.F.; Zahlsen, K. Understanding 2-Ethanolamine Degradation in Postcombustion CO2 Capture. Ind. Eng. Chem. Res. 2012, 51, 13329–13338. [Google Scholar] [CrossRef]
- Lepaumier, H.; Da Silva, E.F.; Einbu, A.; Grimstvedt, A.; Knudsen, J.N.; Zahlsen, K.; Svendsen, H.F. Comparison of MEA degradation in pilot-scale with lab-scale experiments. Energy Procedia 2011, 4, 1652–1659. [Google Scholar] [CrossRef]
- Knudsen, J.N.; Jensen, J.N.; Vilhelmsen, P.J.; Biede, O. First year operation experience with a 1 t/h CO2 absorption pilot plant at Esbjerg coal-fired power plant. In Proceedings of the European Congress of Chemical Engineering (ECCE-6), Copenhagen, Denmark, 16–20 September 2007. [Google Scholar]
- Pinto, D.D.; Brodtkorb, T.W.; Vevelstad, S.J.; Knuutila, H.; Svendsen, H.F. Modeling of oxidative MEA degradation. Energy Procedia 2014, 63, 940–950. [Google Scholar] [CrossRef]
- Supap, T.; Idem, R.; Tontiwachwuthikul, P.; Saiwan, C. Kinetics of sulfur dioxide and oxygen-induced degradation of aqueous monoethanolamine solution during CO2 absorption from power plant flue gas streams. Int. J. Greenh. Gas Control 2009, 3, 133–142. [Google Scholar] [CrossRef]
- Uyanga, I.J.; Idem, R.O. Studies of SO2 and O2 Induced Degradation of during CO2 Capture from Power Plant Flue Gas Streams. Ind. Eng. Chem. Res. 2007, 46, 2558–2566. [Google Scholar] [CrossRef]
- Bedell, S.A. Oxidative degradation mechanisms for amines in flue gas capture. Energy Procedia 2009, 1, 771–778. [Google Scholar] [CrossRef]
- Brian, R.; Strazisar, R.R.A.; Curt, M. White, Degradation Pathways for Monoethanolamine in a CO2 Capture Facility. Energy Fuels 2003, 17, 1034–1039. [Google Scholar]
- Rieder, A.; Dhingra, S.; Khakharia, P.; Zangrilli, L.; Schallert, B.; Irons, R.; Untenberger, S.; Os, P.V.; Goetheer, E. Undertsanding Solvent Degradation A Study from Three Different Pilot Plants within the OCTAVIUS Project. Available online: https://az659834.vo.msecnd.net/eventsairwesteuprod/production-ieaghg-public/4f36f3a0eca94bbe834e156b0dbaec30 (accessed on 15 February 2017).
- Leonard, G.; Toye, D.; Heyen, G. Expermiental study and kinetic model of monoethanolamine oxidative and thermal degradation for post combustion CO2 capture. Int. J. Greenh. Gas Control 2014, 30, 171–178. [Google Scholar] [CrossRef]
- Rieder, A.; Uuterberger, S. EnBWs PostCombustion Capture Pilot Plant at HeilbronnResults of the First Years Testing Programme. Energy Procedia 2013, 37, 6464–6472. [Google Scholar] [CrossRef]
- Khakharia, P.; Mertens, J.; Huizinga, A.; de Vroey, S.; Fernandez, E.; Srinivasan, S.; Vlugt, T.; Goetheer, E. Online corrosion monitoring in a post combustion CO2 capture pilot plant and its relation to solvent degradation and ammonia emissions. Ind. Eng. Chem. Res. 2015, 54, 5336–5344. [Google Scholar] [CrossRef]
- Artanto, Y.; Jansen, J.; Pearson, P.; Do, T.; Cottrell, A.; Meuleman, E.; Feron, P. Performance of MEA and amineblends in the CSIRO PCC pilot plant at Loy Yang Power in Australia. Fuel 2012, 101, 264–275. [Google Scholar] [CrossRef]
- Knudsen, J.N.; Jensen, J.N.; Vilhelmsen, P.J.; Biede, O. Experience with CO2 capture from coal flue gas in pilotscale: Testing of different amine solvents. Energy Procedia 2009, 1, 783–790. [Google Scholar] [CrossRef]
- Bui, M.; Gunawan, I.; Verheyen, T.V.; Meuleman, E.; Feron, P. Dynamic Operation of Post-combustion CO2 Capture in Australian Coal-fired Power Plants. Energy Procedia 2014, 63, 1368–1375. [Google Scholar] [CrossRef]
- Azzi, M.; Tibbett, A.; Halliburton, B.; Element, A.; Artanto, Y.; Meuleman, E.; Feron, P. Assessing Atmospheric Emissions from Amine Based CO2 Post-Combustion Capture Processes and Their Impacts on the Environment—A Case Study; CSIRO: Canberra, Australia, 2014. [Google Scholar]
- Reynolds, A.J.; Verheyen, T.V.; Adeloju, S.B.; Chaffee, A.; Meuleman, E. Primary sources and accumulation rates of inorganic anions and dissolved metals in a MEA absorbent during PCC at a brown coal-fired power station. Int. J. Greenh. Gas Control 2015, 41, 239–248. [Google Scholar] [CrossRef]
- Schallert, B.; Neuhaus, S.; Satterley, C.J. Is Fly Ash boosting amine losses in carbon capture from coal? Energy Procedia 2014, 63, 1944–1956. [Google Scholar] [CrossRef]
- Tanthapanichakoon, W.; Veawab, A.; McGarvey, B. Electrochemical Investigation on the Effect of Heatstable Salts on Corrosion in CO2 Capture Plants Using Aqueous Solution of MEA. Ind. Eng. Chem. Res. 2005, 8, 2586–2593. [Google Scholar]
- Andrew, J.; Sexton, G.T.R. Reaction Products from the Oxidative Degradation of Monoethanolamine. Ind. Eng. Chem. Res. 2011, 50, 667–673. [Google Scholar]
- Sexton, A.J.; Rochelle, G.T. Catalysts and inhibitors for oxidative degradation of monoethanolamine. Int. J. Greenh. Gas Control 2009, 3, 704–711. [Google Scholar] [CrossRef]
- Chandan, P.; Richburg, L.; Bhatnagar, S.; Remias, J.E.; Liu, K. Impact of fly ash on monoethanolamine degradation during CO2 capture. Int. J. Greenh. Gas Control 2014, 25, 102–108. [Google Scholar] [CrossRef]
- Wang, M.; Ledoux, A.; Estel, L. Oxygen Solubility Measurements in a MEA/H2O/CO2 Mixture. J. Chem. Eng. Data 2013, 58, 117–1121. [Google Scholar] [CrossRef]
- Fytianos, G.; Ucar, S.; Grimstvedt, A.; Hyldbakk, A.; Svendsen, H.F.; Knuutila, H.K. Corrosion and degradation in MEA based post-combustion CO2 capture. Int. J. Greenh. Gas Control 2016, 46, 48–56. [Google Scholar] [CrossRef]
- Goff, G.S.; Rochelle, G.T. Monoethanolamine Degradation: O2 Mass Transfer Effects under CO2 Capture Conditions. Ind. Eng. Chem. Res. 2004, 43, 6400–6408. [Google Scholar] [CrossRef]
© 2017 by the authors. Licensee MDPI, Basel, Switzerland. This article is an open access article distributed under the terms and conditions of the Creative Commons Attribution (CC BY) license (http://creativecommons.org/licenses/by/4.0/).


 ,
, 


