Article

Numerical Investigation of the Effects of Split Injection Strategies on Combustion and Emission in an Opposed-Piston, Opposed-Cylinder (OPOC) Two-Stroke Diesel Engine

1
College of Mechatronic Engineering, North University of China, University Road No. 3, Taiyuan 030051, China
2
School of Mechanical and Power Engineering, North University of China, University Road No. 3, Taiyuan 030051, China
*
Author to whom correspondence should be addressed.
Energies 2017, 10(5), 684; https://doi.org/10.3390/en10050684
Submission received: 28 December 2016 / Revised: 10 April 2017 / Accepted: 28 April 2017 / Published: 12 May 2017

Abstract

:
In opposed-piston, opposed-cylinder (OPOC) two-stroke diesel engines, the relative movement rules of opposed-pistons, combustion chamber components and injector position are different from those of conventional diesel engines. In this study, the combustion and emission characteristics of the OPOC which is equipped with a common-rail injection system are investigated by experimental and numerical simulation. Different split injection strategies involving different pilot injection/fuel mass ratios and injection intervals were compared with a single injection strategy. The numerical simulation was applied to calculate and analyze the effect of split injection strategies on the combustion and emission after validation with the same experimental result (single injection strategy). Results showed that using split injection had a significant beneficial effect on the combustion process, because of the acceleration effect that enhances the air-fuel mixture. Additionally, the temperature of the split injection strategies was higher than that of single strategy, leading to the nitrogen oxides (NOx) increasing and soot decreasing. In addition, it has been found that the split injection condition with a smaller pilot injection/fuel mass ratio and a medium injection interval performed better than the single injection condition in terms of the thermo-atmosphere utilization and space utilization.

1. Introduction

Facing the energy crisis and environmental pollution, researchers and manufacturers have studied effective energy-saving and emission reduction methods for diesel engines. Meanwhile, they have focused their study on advances in high-efficiency, low-emission and new types of diesel engines [1,2,3]. The unique engine structure of opposed-piston, opposed-cylinder (OPOC) two-stroke engines gives them the advantages of improved fuel efficiency and power density over conventional diesel engines, and balances performance [4,5]. The OPOC engine concept consists of two types of engine. One is the opposed-piston engine, known as the opposed-piston two-stroke (OP2S) diesel engine, which is known for its high power density and high efficiency and low indicated-specific fuel consumption [6]. Compared with conventional diesel engines, the OP2S diesel engine removes the cylinder head and valve, thus making the engine structure simple and lightweight; additionally, heat loss is lower because OP2S has no cylinder head, which increases thermal efficiency [4]. At the same time, the stroke is divided between two pistons reciprocating in the same cylinder, which enables a higher crankshaft speed without excessive mean piston speeds. With the movement of rule opposed-pistons, the heat release process of the OP2S engine has more significant isochoric and isobaric combustion compared with conventional diesel engines [3]. Therefore, the OP2S diesel engine can achieve a greater power output compared to a conventional engine of the same displacement. Moreover, because of the larger combustion volume, the opposed-piston engine is characterized by a rapid heat release rate and short combustion duration (CD) [7]. The other design is the opposed-cylinder engine, known as a boxer engine, which has one crankshaft, making the structure compact and flat [4,8]. Taking the advantages of both engine concepts, the OPOC has only one crankshaft with two cylinders on the opposite sides of the crankshaft engine, and the force generated on the pistons are transmitted to it via a common bearing and there is no cylinder head, thus making the engine structure simple and lightweight, compatible, and efficient. Therefore, the OPOC engine has drawn increasing attention [5,7,8].
OPOC engines have the potential for higher power density and lower emission than four-stroke engines if the combustion is well organized. Similar to conventional diesel engines, combustion in an OPOC diesel engine starts at the dynamic injection point and includes four phases: the ignition delay, premixed combustion, diffusion combustion and late combustion. Initially, fuel injects into the combustion chamber and mixes with air to form a combustible mixture. Then, the air-fuel mixture burns rapidly in a few crank angle degrees after the ignition delay. During this phase, the fuel which becomes ready for burning and then burns is added into the burning mixture. Once the premixing mixture is exhausted, the combustion is in diffusive mode and the burning rate is controlled by the air-fuel vapor mixing process. Owning to nonuniformity and mixing of cylinder charge at the late combustion phase, the combustibles—such as unburnt fuel, and soot fuel-rich combustion products—are burned again [9,10]. However, they are different to conventional diesel engines, in that the OPOC engine uses side injection due to moving pistons on either side. To facilitate good combustion, many methods (e.g., combustion chamber design [5], ultra-high injection pressure [11], and split/multiple injection [12,13]) have to be rigorously studied to improve the air‒fuel mixture. A strategy that improves the air-fuel mixture, and combustion process, and decreases all soot emissions except for the nitrous oxide (NOx) emission could still be widely accepted, because NOx emission can be reduced by after-treatment [14]. Therefore, this study focused on improving combustion performance except for NOx emission.
With its flexible injection strategy, split injection is an effective method for improving the air-fuel mixture, which plays an important role in improving thermal efficiency and reducing emission and fuel consumption [15]. D’Ambrosio and Ferrari [16] found that the combustion of the pilot injection significantly promoted fuel atomization, mix, and by increasing the in-cylinder temperature, which provided a thermo-atmosphere for the main injection. Nehmer and Reitz [17] studied the effect of split injection in a heavy-duty diesel engine by varying the quantity of the first injection fuel from 10% to 75% of the total quantity of fuel. He found that split injection better utilized the air charge and allowed combustion to continue later into the power stroke compared with a single injection case, without increasing levels of soot production. Li et al. [18,19] found that a split injection strategy with a small quantity of pilot injection (5% of the total quantity of fuel) with short injection interval of split injection could improve air-fuel mixture in a double swirl combustion system diesel engine. Cung et al. [20] studied the effect of injection interval on the secondary flow-induced air-fuel mixture formation and combustion in a constant volume combustion chamber. He found that injection interval was shorter, and the ignition delay of the second injection was shorter. Similar results were found by Park et al. [21], who studied the effect of split injection in a diesel engine. He also found that by decreasing the dwell time of split injection, the second injection developed faster and the combustion pressure for the split injection was higher than for single injection.
Split injection strategies have been studied in conventional diesel engines, and there have been few split injection strategies studied in OPOC engines. However, it is necessary to study split injection strategies applied in OPOC engines to improve combustion performance by improving the mixing process. Thus, in this paper, the objective is to investigate the effect of two split injection parameters—the injection interval of split injection and the quantity of injection fuel—on the combustion and emission characteristics in an OPOC engine with a common-rail injection system. The detailed explanation and definition for split injection strategies are described in Section 3 and the numerical results for the combustion were first validated against the experimental results and then further used for split injection investigation. These results were used to conduct a comparison and analysis of the combustion and emission characteristics under various split injection conditions.

2. Engineering Configuration of the OPOC

As shown in Figure 1, the OPOC engine architecture comprises only one crankshaft with two cylinders on opposite sides of the crankshaft; all the forces generated on the piston are transmitted to this one crankshaft. Due to the piston motion of the OPOC engine, two opposing injectors are mounted at the center of the cylinder wall for each cylinder. At the same time, each cylinder has gas ports, intake ports on one side, and exhaust ports on the other side. The intake ports are used to deliver fresh air into the cylinder, and the exhaust ports are used to deliver burned gas out from cylinder. Two pistons are placed in the horizontal liner; a combustion chamber is formed when two pistons move to the most closed position; as shown in Figure 2a. Regarding scavenging flow, the intake and exhaust pistons are distinguished from each other in their design. The intake piston is round and the exhaust piston has a shallow pit on the surface. Two injectors are placed on opposite sides of the cylinder liner, and the spray direction was shown in Figure 2b.

3. Experimental Setups

To investigate the effect of multiple injection strategies, the combustion and emission characteristics of OPOC diesel engine were measured and analyzed. Detailed specifications and dimensions of the OPOC engine are provided in Table 1.
The experimental apparatus consisted of a test engine, a fuel injection system, a dynamometer with control systems, and a combustion analyzer, as shown in Figure 3. The engine load and speed were controlled using a direct-current (DC) dynamometer (WS1200F, HORIBA, Kyoto, Japan) system. The in-cylinder pressure was measured using a piezo-electric pressure transducer (PTX7517, GE Measurement & Control Solutions, Billerica, MA, USA) coupled to a charge amplifier (2854A111, Kistler, Winterthur, Switzerland), using a DAQ board (DEWE5000-CA, AVL, Graz, Austria) to measure ignition timing and phasing of the heat release. All tests were conducted under a constant engine speed of 2800 rpm, and the excess air coefficient was 3.4. The coolant and oil temperatures were maintained at 70 ± 1 °C, and the injection pressure of the test fuel was fixed at a constant pressure of 140 MPa. The detailed test conditions for experimental and numerical modeling are listed in Table 2. In order to ensure the validity of the experimental data, all of the tests were repeated three times in each operating condition.
Figure 4 shows the injection strategies for single and split injection. Split injection means that two injections have different injection quantities. The first injection (pilot injection) quantity is smaller than the second injection (main injection) quantity. They also have a different injection interval in terms of fixed second injection timing to specific timing, which is called the after top dead center (ATDC), and is −15 deg. For example, the split strategy of 5%-20 deg means the pilot injection quantity is 5% of the total mass and the injection interval is 20 deg. These values are taken from the start of injection (SOI) of the pilot injection (which is −35 deg ATDC) to the SOI of the main injection.

4. Numerical Simulations

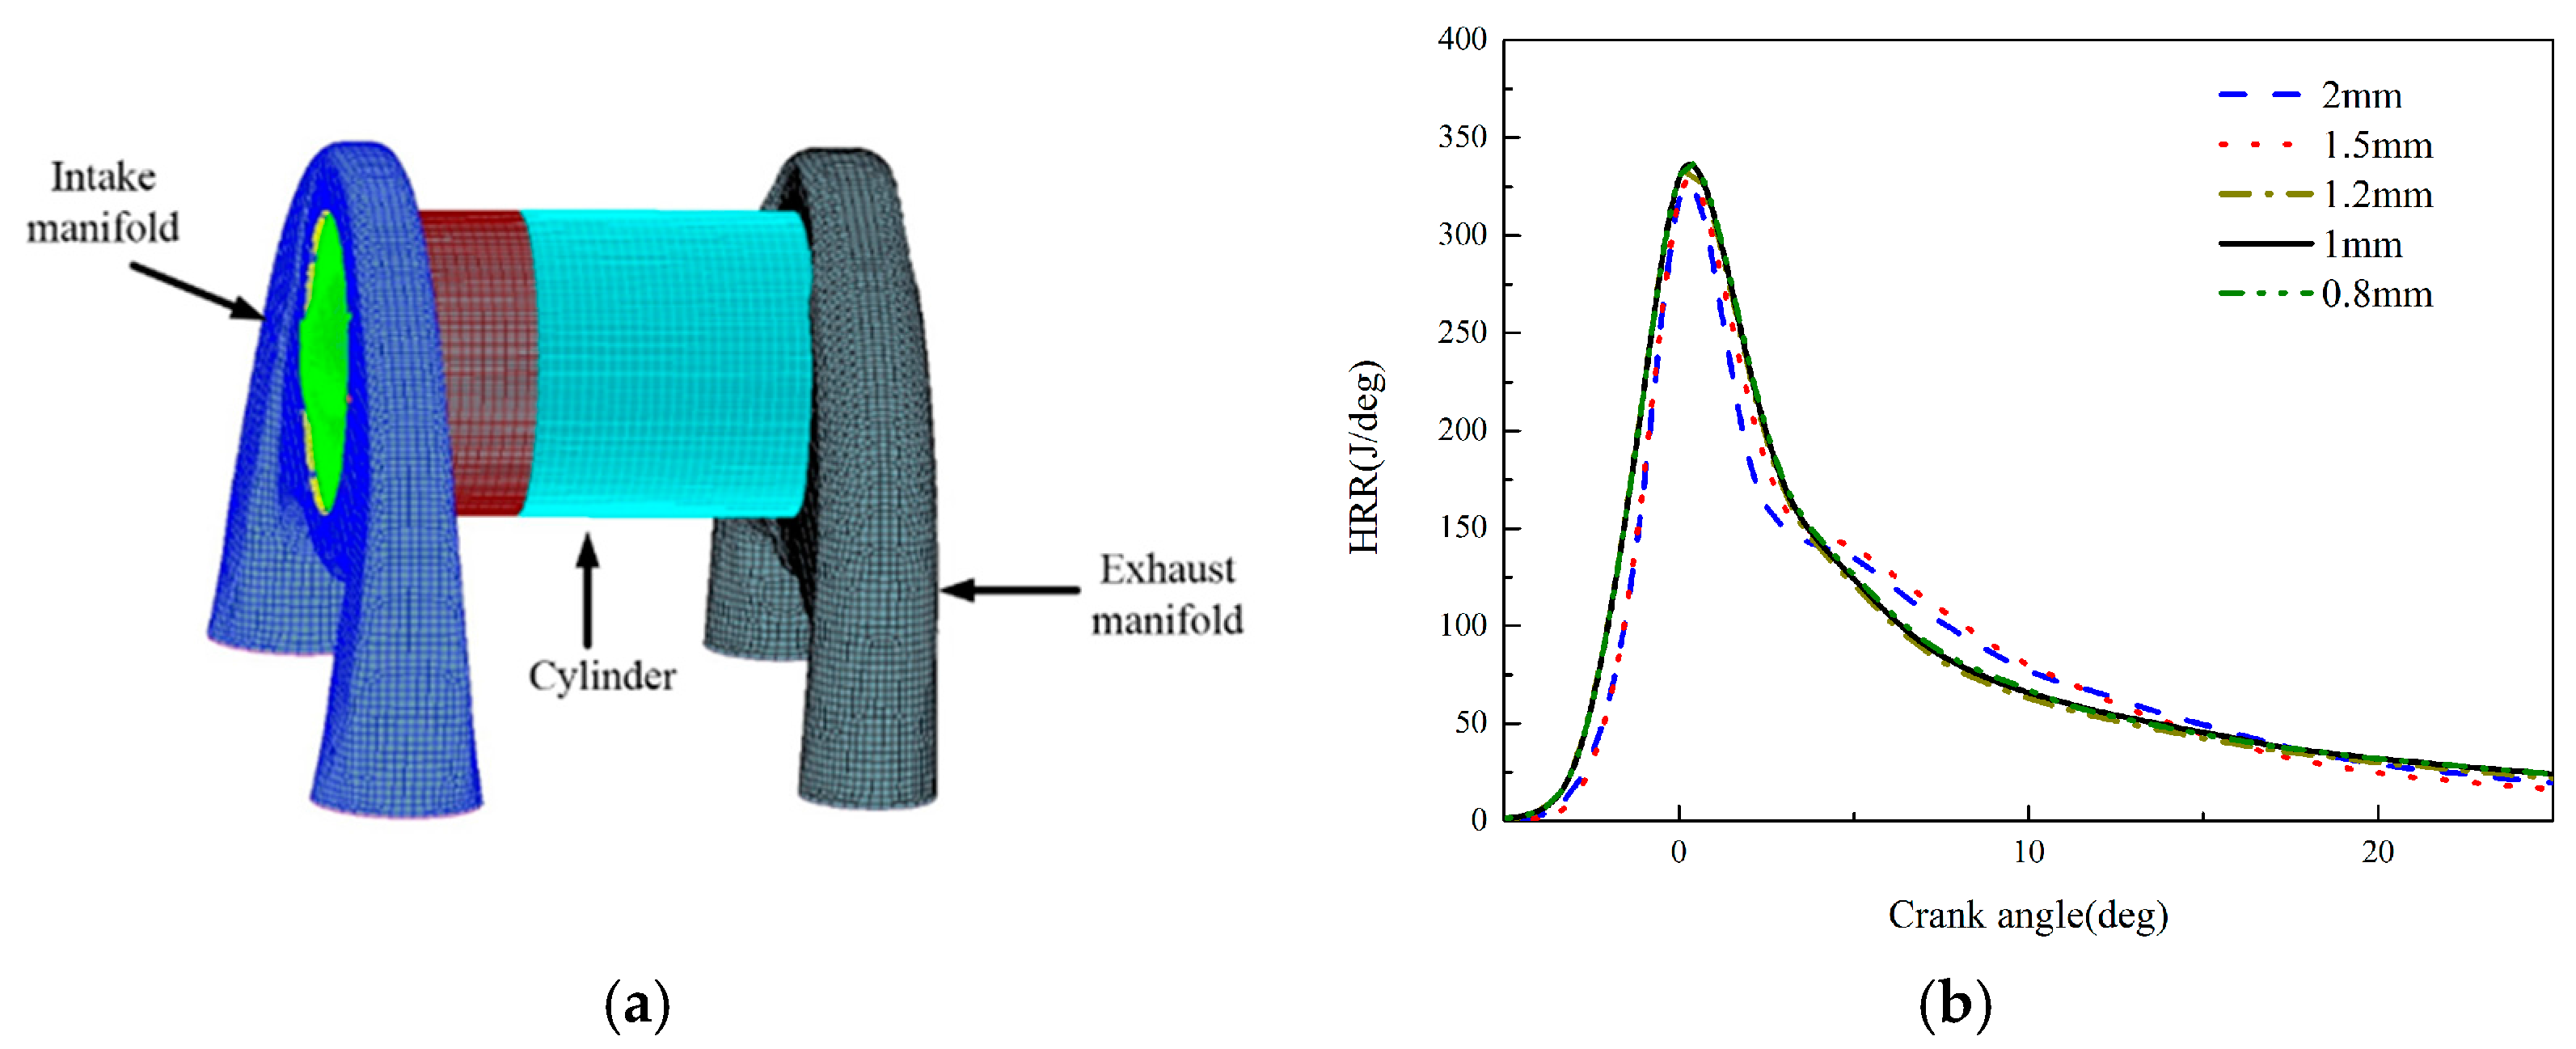
4.1. Computational Fluid Dynamics (CFD) Model and Setup

The AVL-Fire software was used to build the CFD model for the combustion and emission characteristics of various split injection conditions, which has been used to simulate the combustion process and the formation of emissions in an engine [22]. The computational mesh was created by Fame Engine. Both port and cylinder geometries were included in the simulation, as shown in Figure 5a. The size of the grid meshes—which were adopted in the whole domain—was approximately 1 mm, because the heat release rate (HRR) simulation results of the meshes smaller than 1 mm varied little, especially near the pre-mixed combustion peak of the HRR, where the error between case 1 mm and case 0.8 mm was 0.15%, as shown Figure 5b. The number of cells of intake port, exhaust port, and cylinder was 52,936, 56,655 and 357,404, respectively [18,23]. The k ε model was used to account for turbulent effects in the cylinder [24]. During the injection timing, the Kelvin-Helmholtz and Rayleigh-Taylor (KH-RT) breakup model was used to calculate the spray and atomization characteristics of the droplets [25]. The DUKowicz model was used to treat the evaporation of droplets; it assumes that the droplet temperature is uniform [26]. The O’Rourke model was used to describe particle interaction process [27]. The Walljet1 model was applied to describe the formation of fuel film on the wall and the development of droplets, including the breakup process because of droplet impingement and the dispersion process of breakup. At the same time, it considered the influence of the temperature and pressure on droplet development [28]. The Shell auto-ignition model and 3-Zones Extended Coherent Flame Model (ECFM-3Z) model was used to analyze the auto-ignition and combustion phenomenon of the diesel spray in the cylinder [29,30]. The Shell auto-ignition model involves generic reactions for hydrocarbon fuel and six generic species, such as: oxidizer, radical pool, branching agent, intermediate species, and products. The ECFM-3Z model divides the air-fuel mixture and combustion process into three parts: the unmixed fuel zone, the mixed zone, and the unmixed air zone. The NOx formation process was modeled by thermal NO [31] and prompt NO [32] mechanism to predict the NOx emissions. The Hiroyasu model was used to anticipate the soot formation [33]. Generally, it was well accepted that the production of soot occurs in two main phases, soot formation and soot oxidization. These processes depend on the fuel composition, in-cylinder gas pressure, in-cylinder gas temperature, and local fuel and oxygen concentrations. The soot formation model implemented in the current study was based upon a combination of suitably extended and adapted joint chemical/physical rate expressions for the representation of the processes of particle nucleation, surface growth, and oxidation.

4.2. Model Validation

Figure 6 shows comparisons between the predicted and measured in-cylinder pressure and heat releases rates. The trend predicted by the model is reasonably close to experimental results, although there are some differences. This can be explained by the fact that the simulation slightly under-predicts the premixed combustion, and a uniform wall temperature may lead to inaccurate heat transfer loss.

5. Results and Discussion

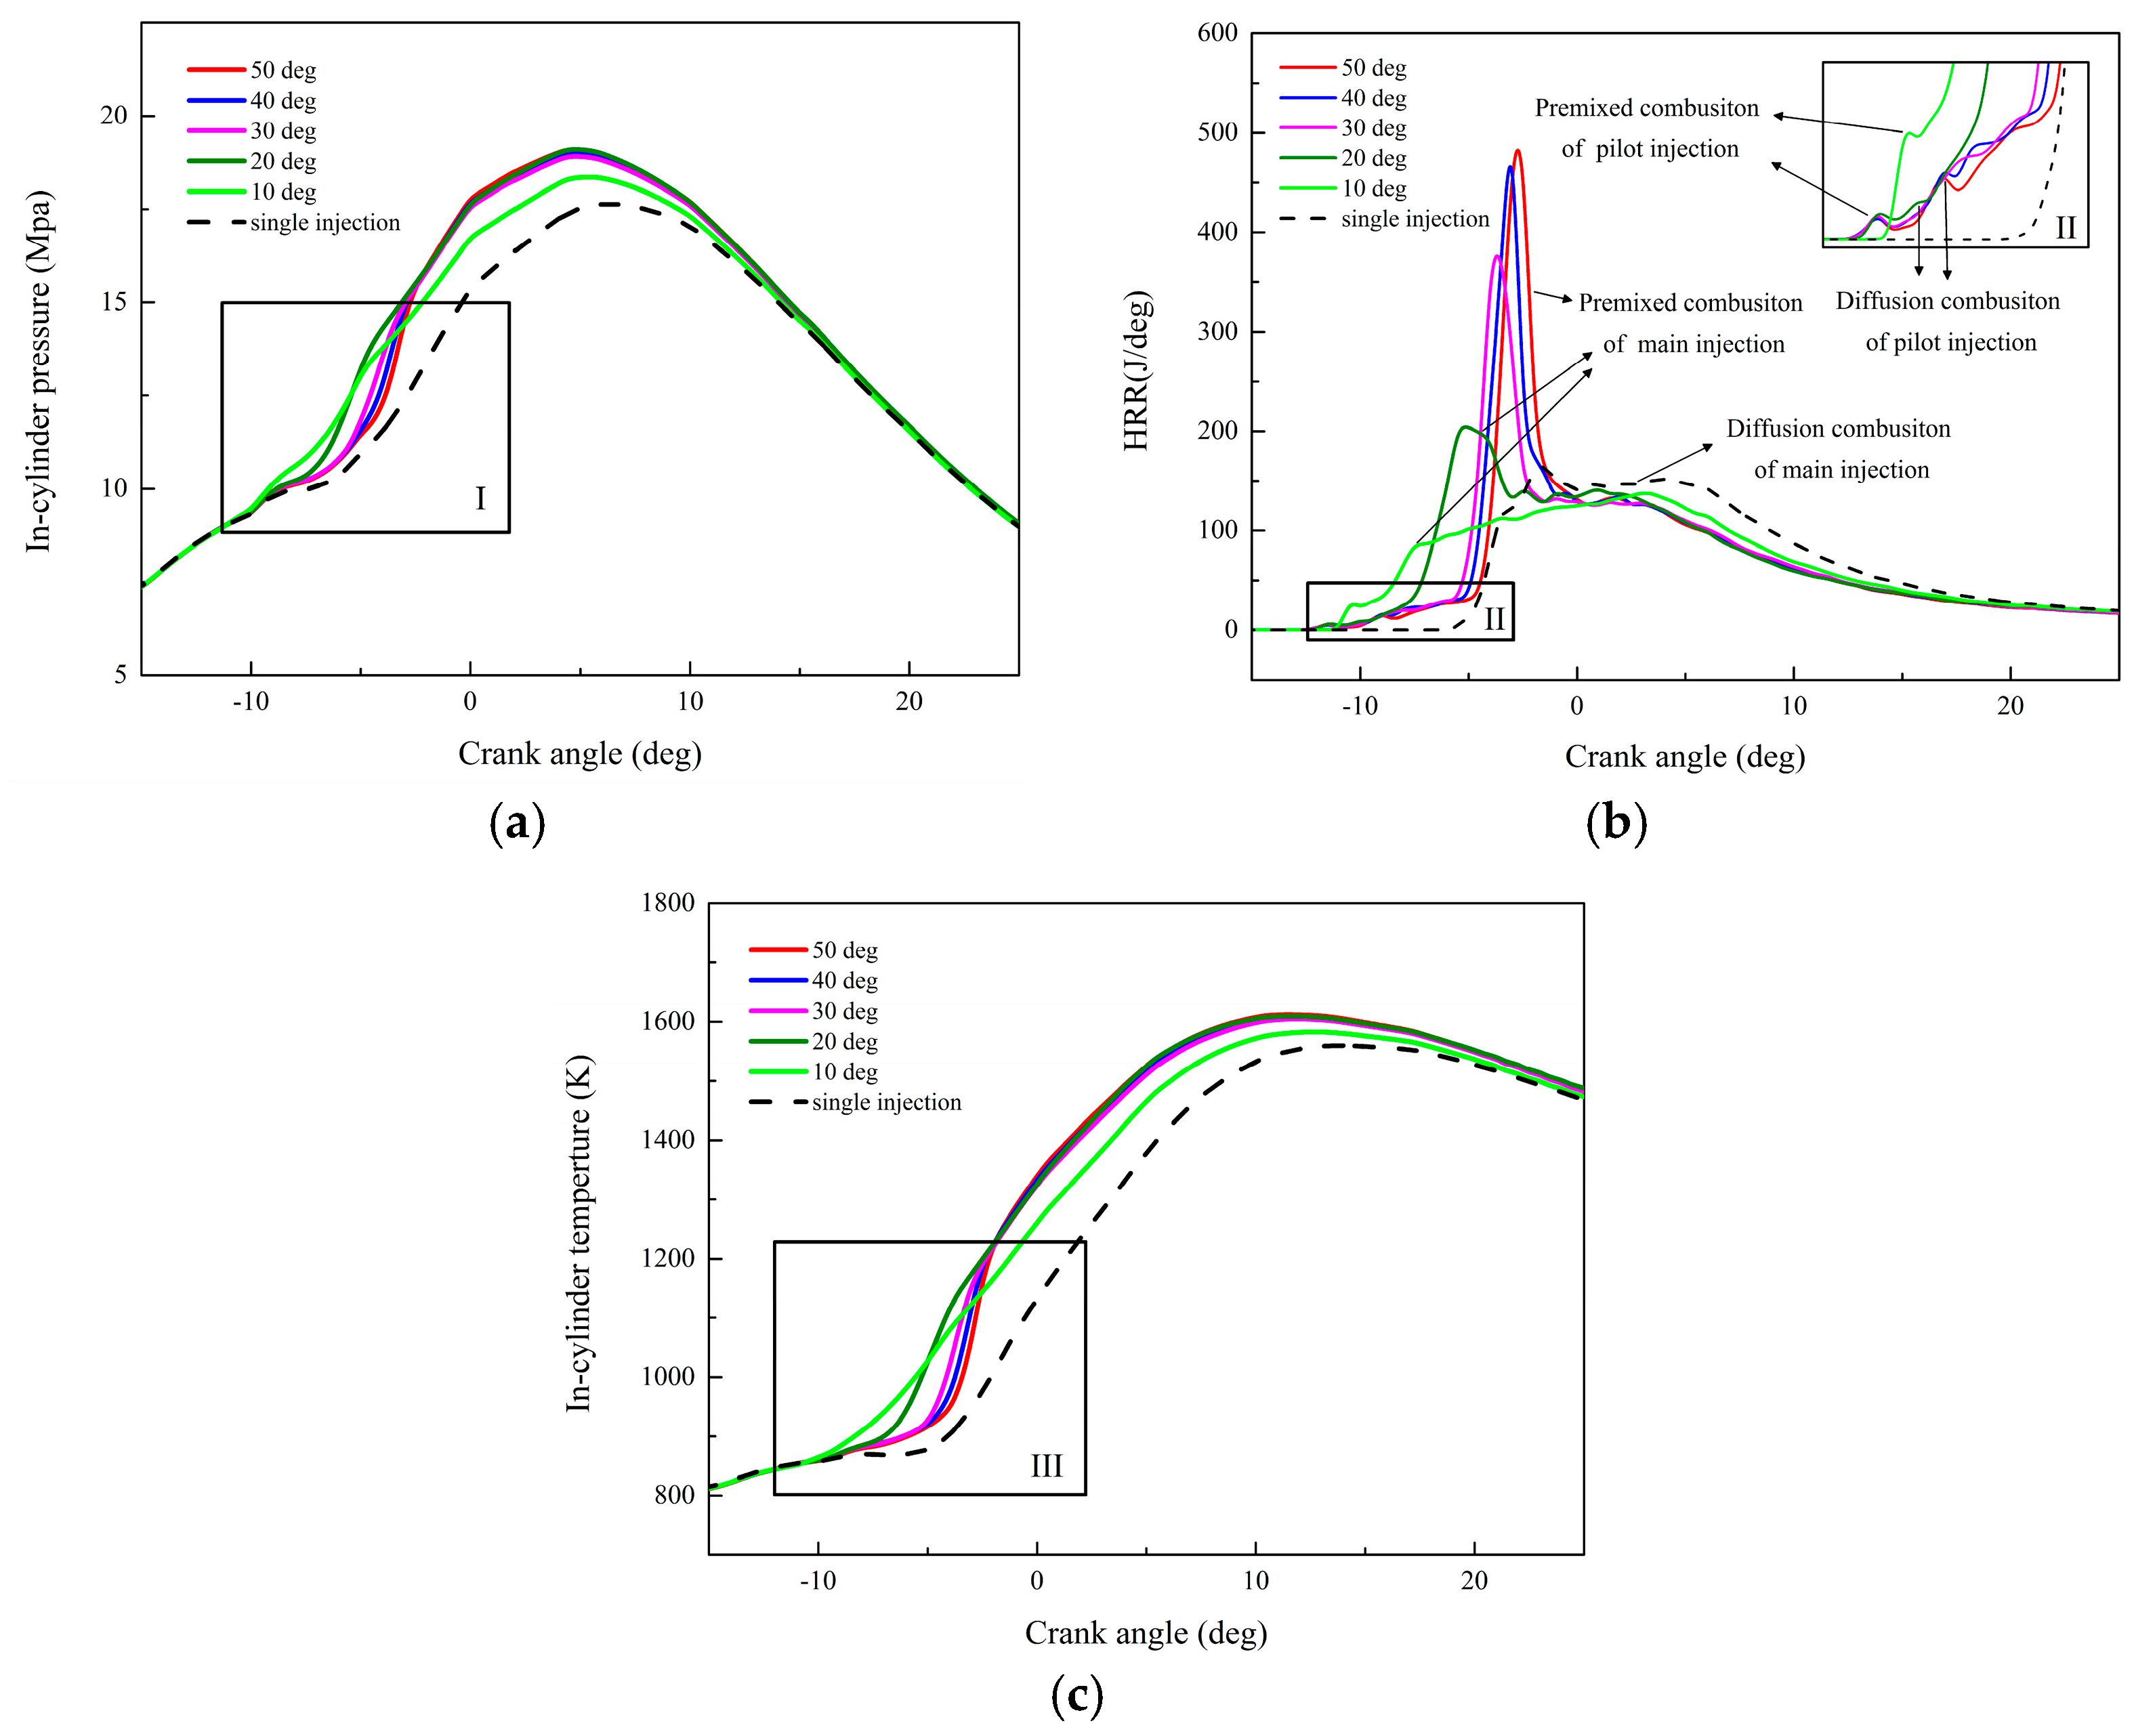
5.1. Influence of Split Injection on Combustion Performance

Figure 7 illustrates the in-cylinder pressure, in-cylinder temperature and heat release rate, which were calculated for split injection strategies with different injection intervals for 5% pilot injection/fuel mass ratio. For in-cylinder pressure, the difference occurred near the −11 deg ATDC, as shown in Figure 7a. The combustion pressure curve for the cases with the split injection were higher than single injection. The combustion pressure curve of the 10 deg injection interval were second highest, the combustion pressure curves of the injection interval from 20 deg to 50 deg were the same, which were the highest. As shown in Figure 7a-I, as the injection interval decreased, the in-cylinder pressure line separated from the compress line earlier.
As shown in Figure 7b, for the HRR curves, there existed four phases in the entire heat release process: (1) premixed combustion of the pilot injection; (2) diffusion combustion of the pilot injection; (3) premixed combustion of the main injection; and (4) diffusion combustion. As shown in Figure 7b-II, when the injection interval was shorter, the premixed combustion peak value of the pilot injection moved to the right. The diffusion combustion peak value of the pilot injection increased from 50 deg injection interval to 30 deg injection interval, then decreased from 20 deg injection interval to 10 deg injection interval, and even disappeared at the injection interval 10 deg. At the same time, the premixed combustion peak value of the main injection and the ignition delay period—which was the elapsed time from the start of main injection—decreased with a shorter injection interval. This indicates that a shorter injection interval strengthened the influence of the pilot combustion on the main combustion.
For the in-cylinder temperature, the tendencies of all curves with different pilot injection timings were almost same. However, as shown in Figure 7c-III, there was a slight difference. This illustrates that the in-cylinder temperature of the split injection was lower than single injection before −12 deg ATDC. This was because the pilot injection led to a decrease in the temperature as a result of the evaporation of fuel. From −12 deg ATDC to −3 deg ATDC—as shown in Figure 7c-III—the in-cylinder temperature of the split injection was higher than single injection. This suggests that the pilot injection supplied a thermo-atmosphere for main injection, which improved the fuel evaporation.
Figure 8 shows the effect of different pilot injection/fuel mass ratios under 20 deg injection interval on combustion performance. For the in-cylinder pressure, it was observed that the combustion pressure peak increased and the in-cylinder pressure line separated from the compress line earlier with the increase of pilot injection/fuel mass ratio. For the HRR, it was found that there were invariable three phases, including premixed combustion of the pilot injection, premixed combustion of the main injection, and diffusion combustion. As shown in Figure 8b, as the pilot injection/fuel mass ratio increased, the peak of the HRR of the premixed combustion of the pilot injection increased, but the ignition delays decreased. Meanwhile, the peak of the HRR of the premixed combustion of the main injection with 5%-20 deg strategy was higher than that of other strategies because of a better air-fuel mixing. For the in-cylinder temperature, the temperature with split injection was higher than that of single injection. Moreover, with the increase of pilot injection/fuel mass ration, the peak of temperature increased. However, the higher in-cylinder temperature did not always lead to more power and less emission, because temperature distribution—which influenced the formation of the ignitable mixture—may also have been different in the cylinder. Therefore, the temperature field results should be analyzed.

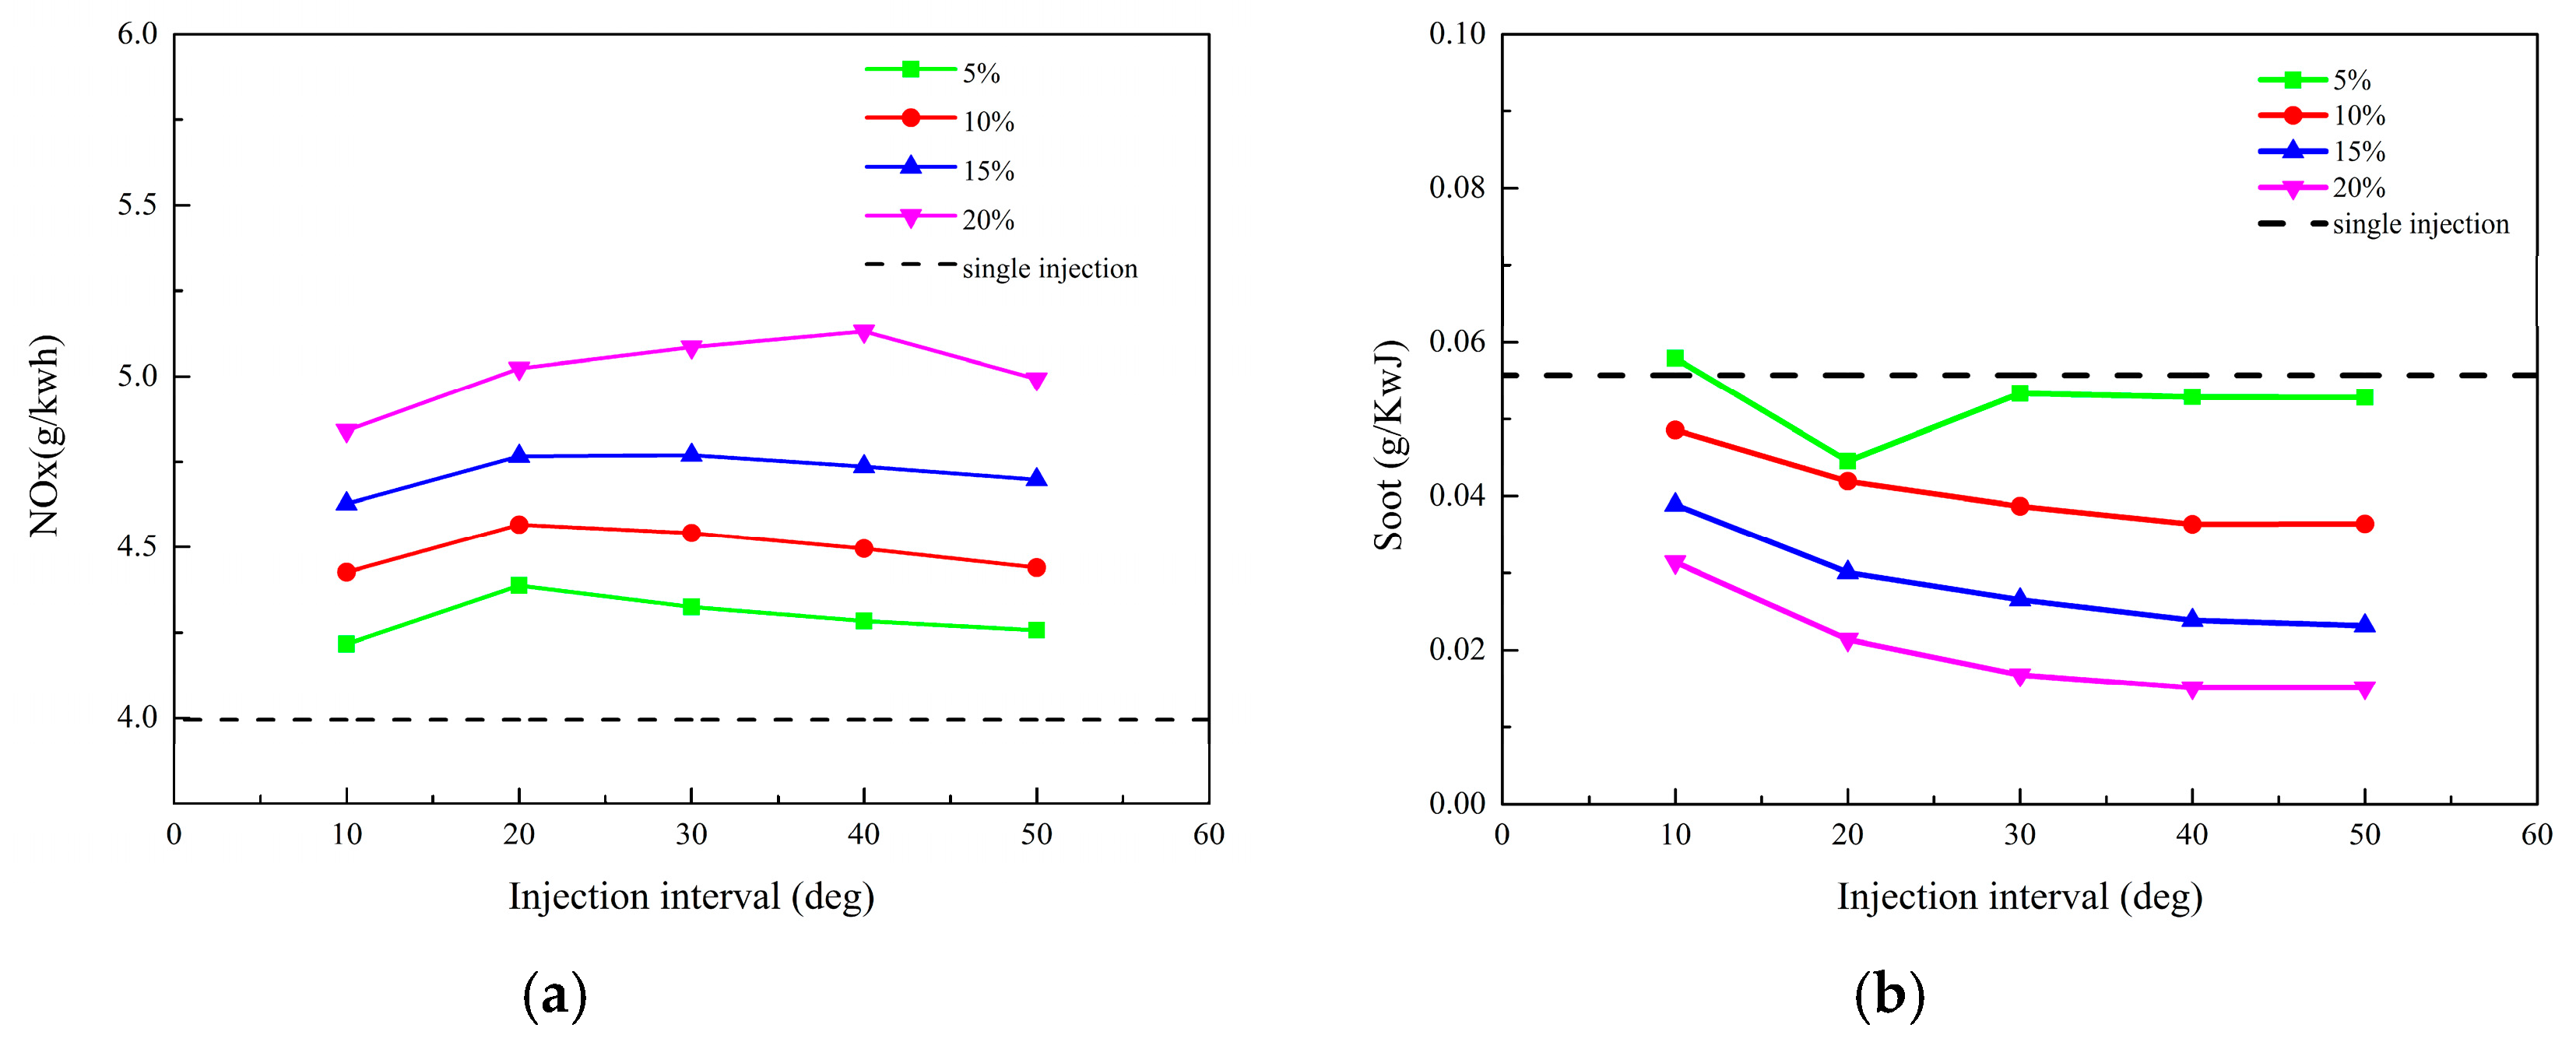
5.2. Influence of Split Injection on NOx and Soot Emission

The amount of soot and NOx emission for different injection strategies are presented in Figure 9. For the NOx emission, Figure 9a illustrates that the NOx emissions of the split injection strategies were greater than single injection, because the pilot injection provided higher in-cylinder temperature, as shown in Figure 7c and Figure 8c, which was a contributing factor to the NOx formation. The NOx emission increased with an increase in the mass of pilot injection, because greater pilot mass caused the in-cylinder temperature to increase. The NOx emissions from a 5% to 15% pilot injection/fuel mass ratios increased form 10 deg to 20 deg injection interval and reduced form 20 deg to 50 deg injection interval. The NOx emission of the 20% pilot injection/fuel mass ratios increased form 10 deg to 40 deg injection interval and decreased from 40 deg to 50 deg injection interval.
Figure 9b illustrates that the soot emission of the split injection strategies was smaller than that for single injection, except for the case with 5%-10 deg pilot injection, which showed a higher soot emission, because the short injection interval of the pilot and main injection caused a long diffusion combustion phase, as can be seen in Figure 7b, which played an important role in the formation of soot [12]. The soot emission of the 5% pilot injection/fuel mass ratios reduced from 10 deg to 20 deg injection interval, then increased at the 30 deg injection interval and slightly reduced from 30 deg to 50 deg injection interval. As the pilot mass increased, the soot emission reduced; this was because a lower formation of soot and soot oxidation led to the reduction of soot emission. Meanwhile, the soot emission of 10% to 20% pilot injection/fuel mass ratios decreased as the injection interval between the pilot and main injection reduced.

6. Analysis of the Mechanisms of the Split Injection Interactions

6.1. Temperature Field Results and Discussion

Figure 10 shows the temperature distributions of the single injection case and the five typical split injection strategies at −10 deg ATDC, −6 deg ATDC, and top dead center (TDC). Different temperature distributions in the cylinder were formed by different injection strategies, which was a vital factor for evaporation, mixture and emission of soot and NOx. For the single injection strategy at the −15 deg ATDC, two low temperature zones (LTZs) formed because of fuel evaporation. For the 5%-10 deg strategy, there were two LTZs and two higher temperature zones (HTZs) due to the pilot injection fuel oxidizing and releasing heat. With the fuel spraying, the LTZ was spread and passed through the HTZ. Thus, the HTZ provided a thermo-atmosphere that evaporated the fuel. For the 5%-20 deg strategy, there were two HTZs which were smaller than the 5%-10 deg strategy. As a result, the combustion temperature and pressure were lower, as shown in Figure 7. For the 5%-30 deg strategy, the HTZs were near the center of chamber and far from the LTZs. Therefore, the thermo-atmosphere utilization was worse. For the 10%-20 deg strategy, there were two HTZs and the entire chamber temperature was higher than the 5%-20 deg strategy due to more pilot injection fuel combustion. As a result, the temperature and pressure in the cylinder of the combustion were sufficiently high. Meanwhile, it was found that the entire chamber temperature of 20%-20 deg—with the largest HTZ at the center of chamber—was the highest. Thus, the fuel spray of the main injection evaporated and oxidized faster.
At −6 deg, for the impact of the pilot injection on the temperature distribution was observed more obviously. For the single injection, there existed two LTZs. For the 5%-20 deg strategy, the high temperature region covered the fuel spray. For the 5%-10 deg and 10%-20 deg strategy, the high temperature region covered the whole fuel spray uniformly, because the main spray went through the HTZ and was heated uniformly. There existed a high temperature region at the surface of the intake piston. For the 5%-30 deg strategy, the high temperature occurred only in the head of the fuel spray due to the effect of the HTZ near the center of chamber. For the 20%-20 deg strategy, the whole fuel spray was also covered by the higher temperature.
At TDC, the split injection strategies had a larger HTZ than the single injection. For the 20%-20 deg strategy, the HTZ was largest among all the split strategies. As for the 10%-20 deg strategy, the HTZ was second. The HTZ of the 5%-20 deg strategy was the third largest, which was larger than that of the 5%-30 deg strategy. Finally, the 5%-10 deg was last. Although the maximum temperature value of the 5%-20 deg strategy was smaller than that of the 5%-30 strategy, the HTZ of the 5%-20 deg strategy was greater than that of the 5%-20 deg strategy. This is why the NOx emission of the 5%-30 deg strategy was smaller than that of the 5%-30 deg strategy.

6.2. Equivalence Ratio Field Results and Discussion

At −6 deg ATDC, the fuel distribution area of the 20%-20 deg strategy was the largest. The fuel distribution area of the 10%-20 deg strategy was second largest. The 5%-20 deg strategy was third largest. The 5%-10 deg strategy was smaller than 5%-20 deg strategy, and the 5%-30 deg was smaller than the 5%-10 deg strategy. The single injection strategy was smallest

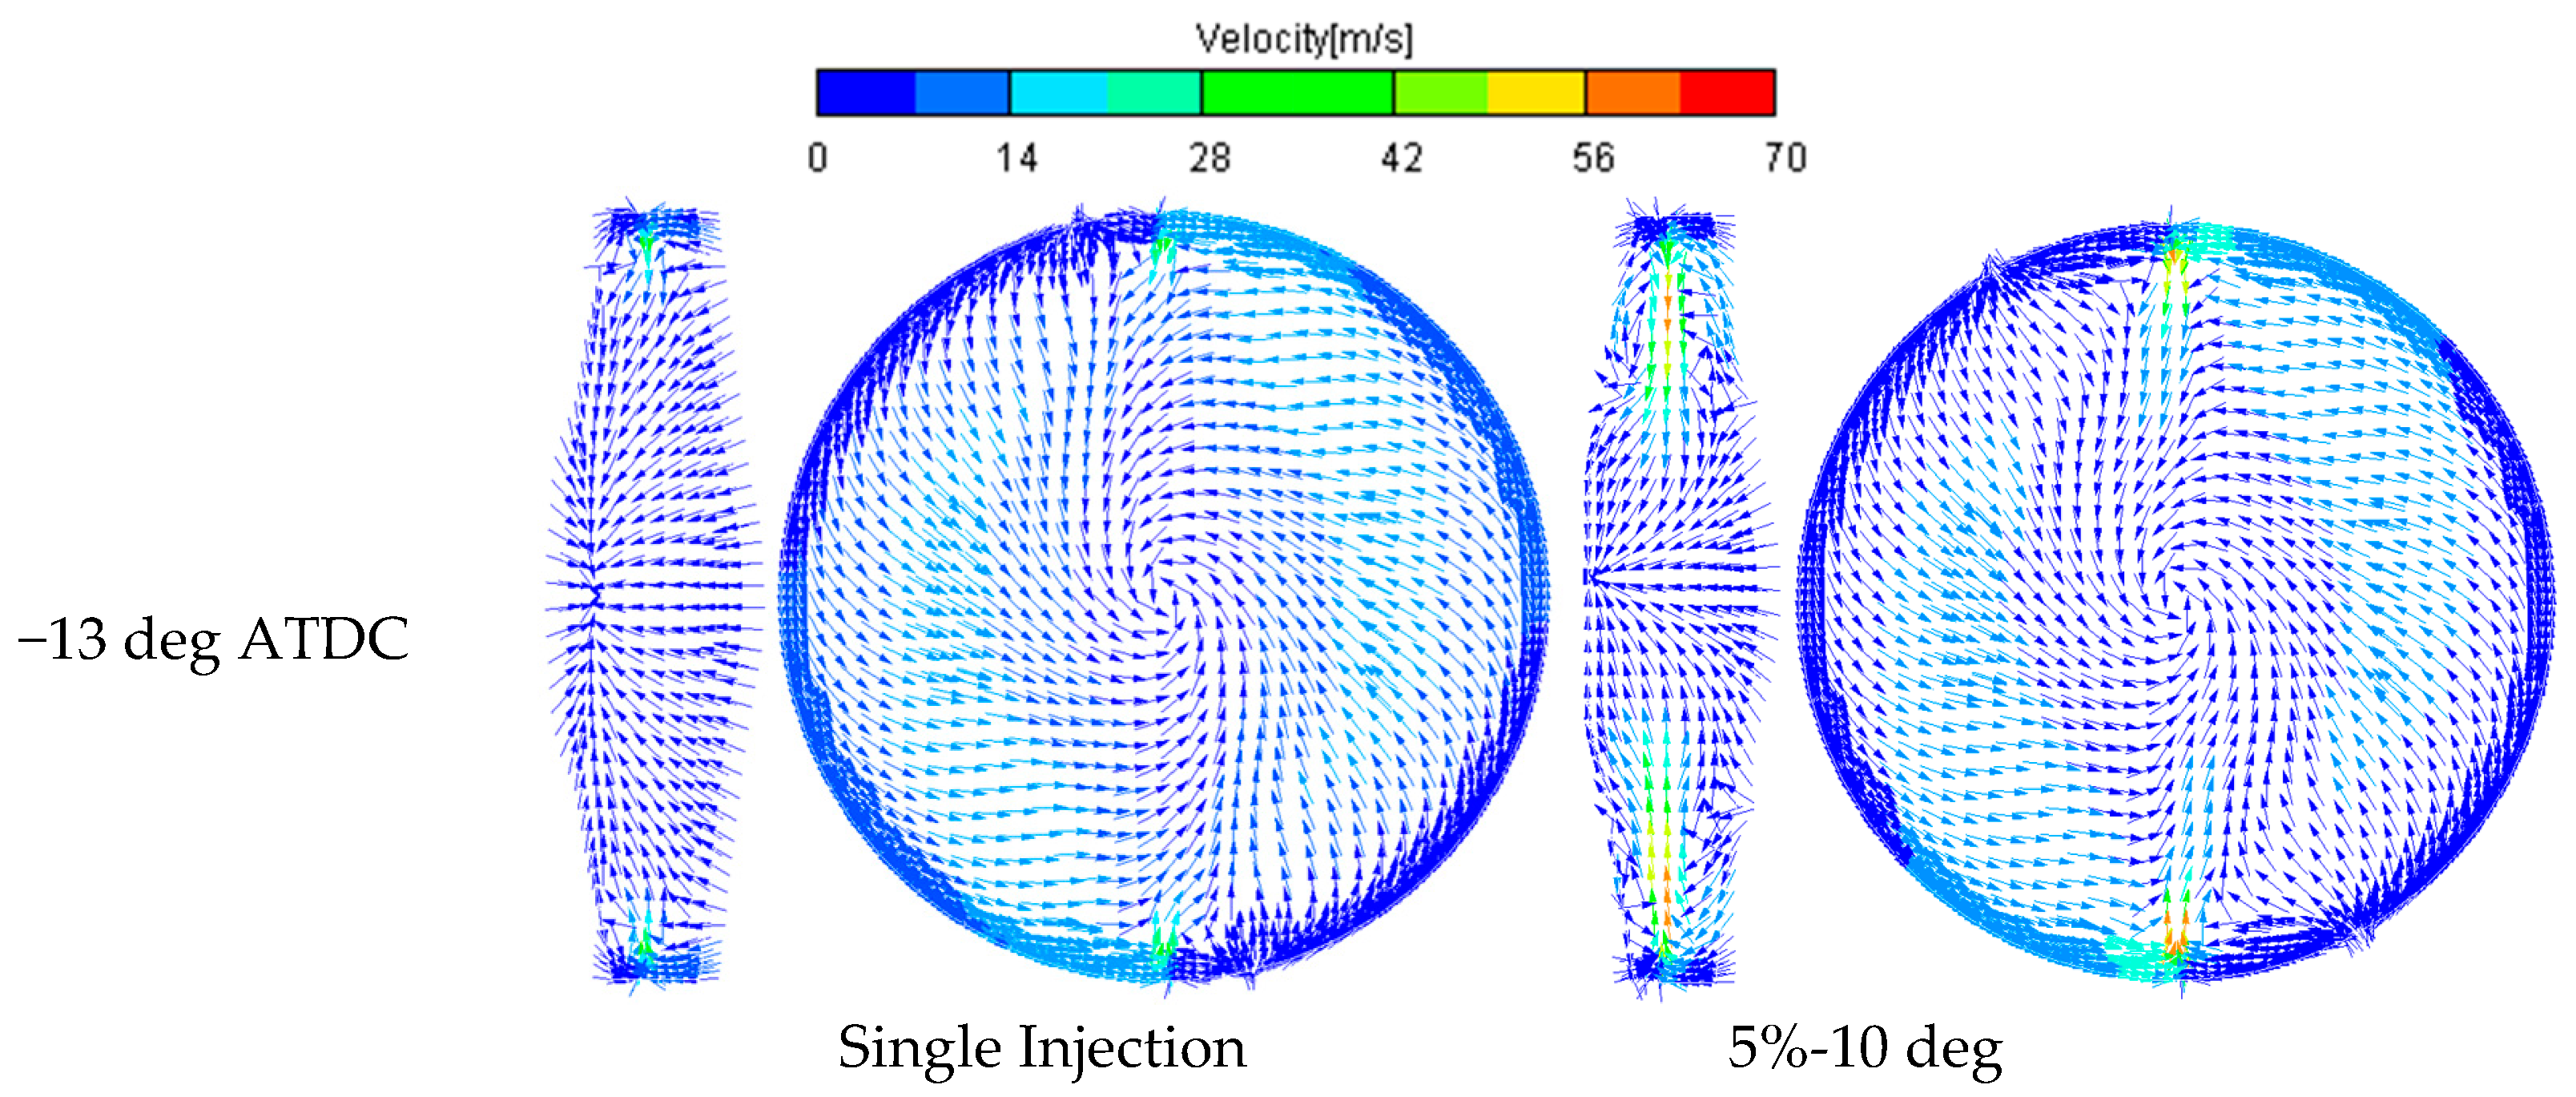
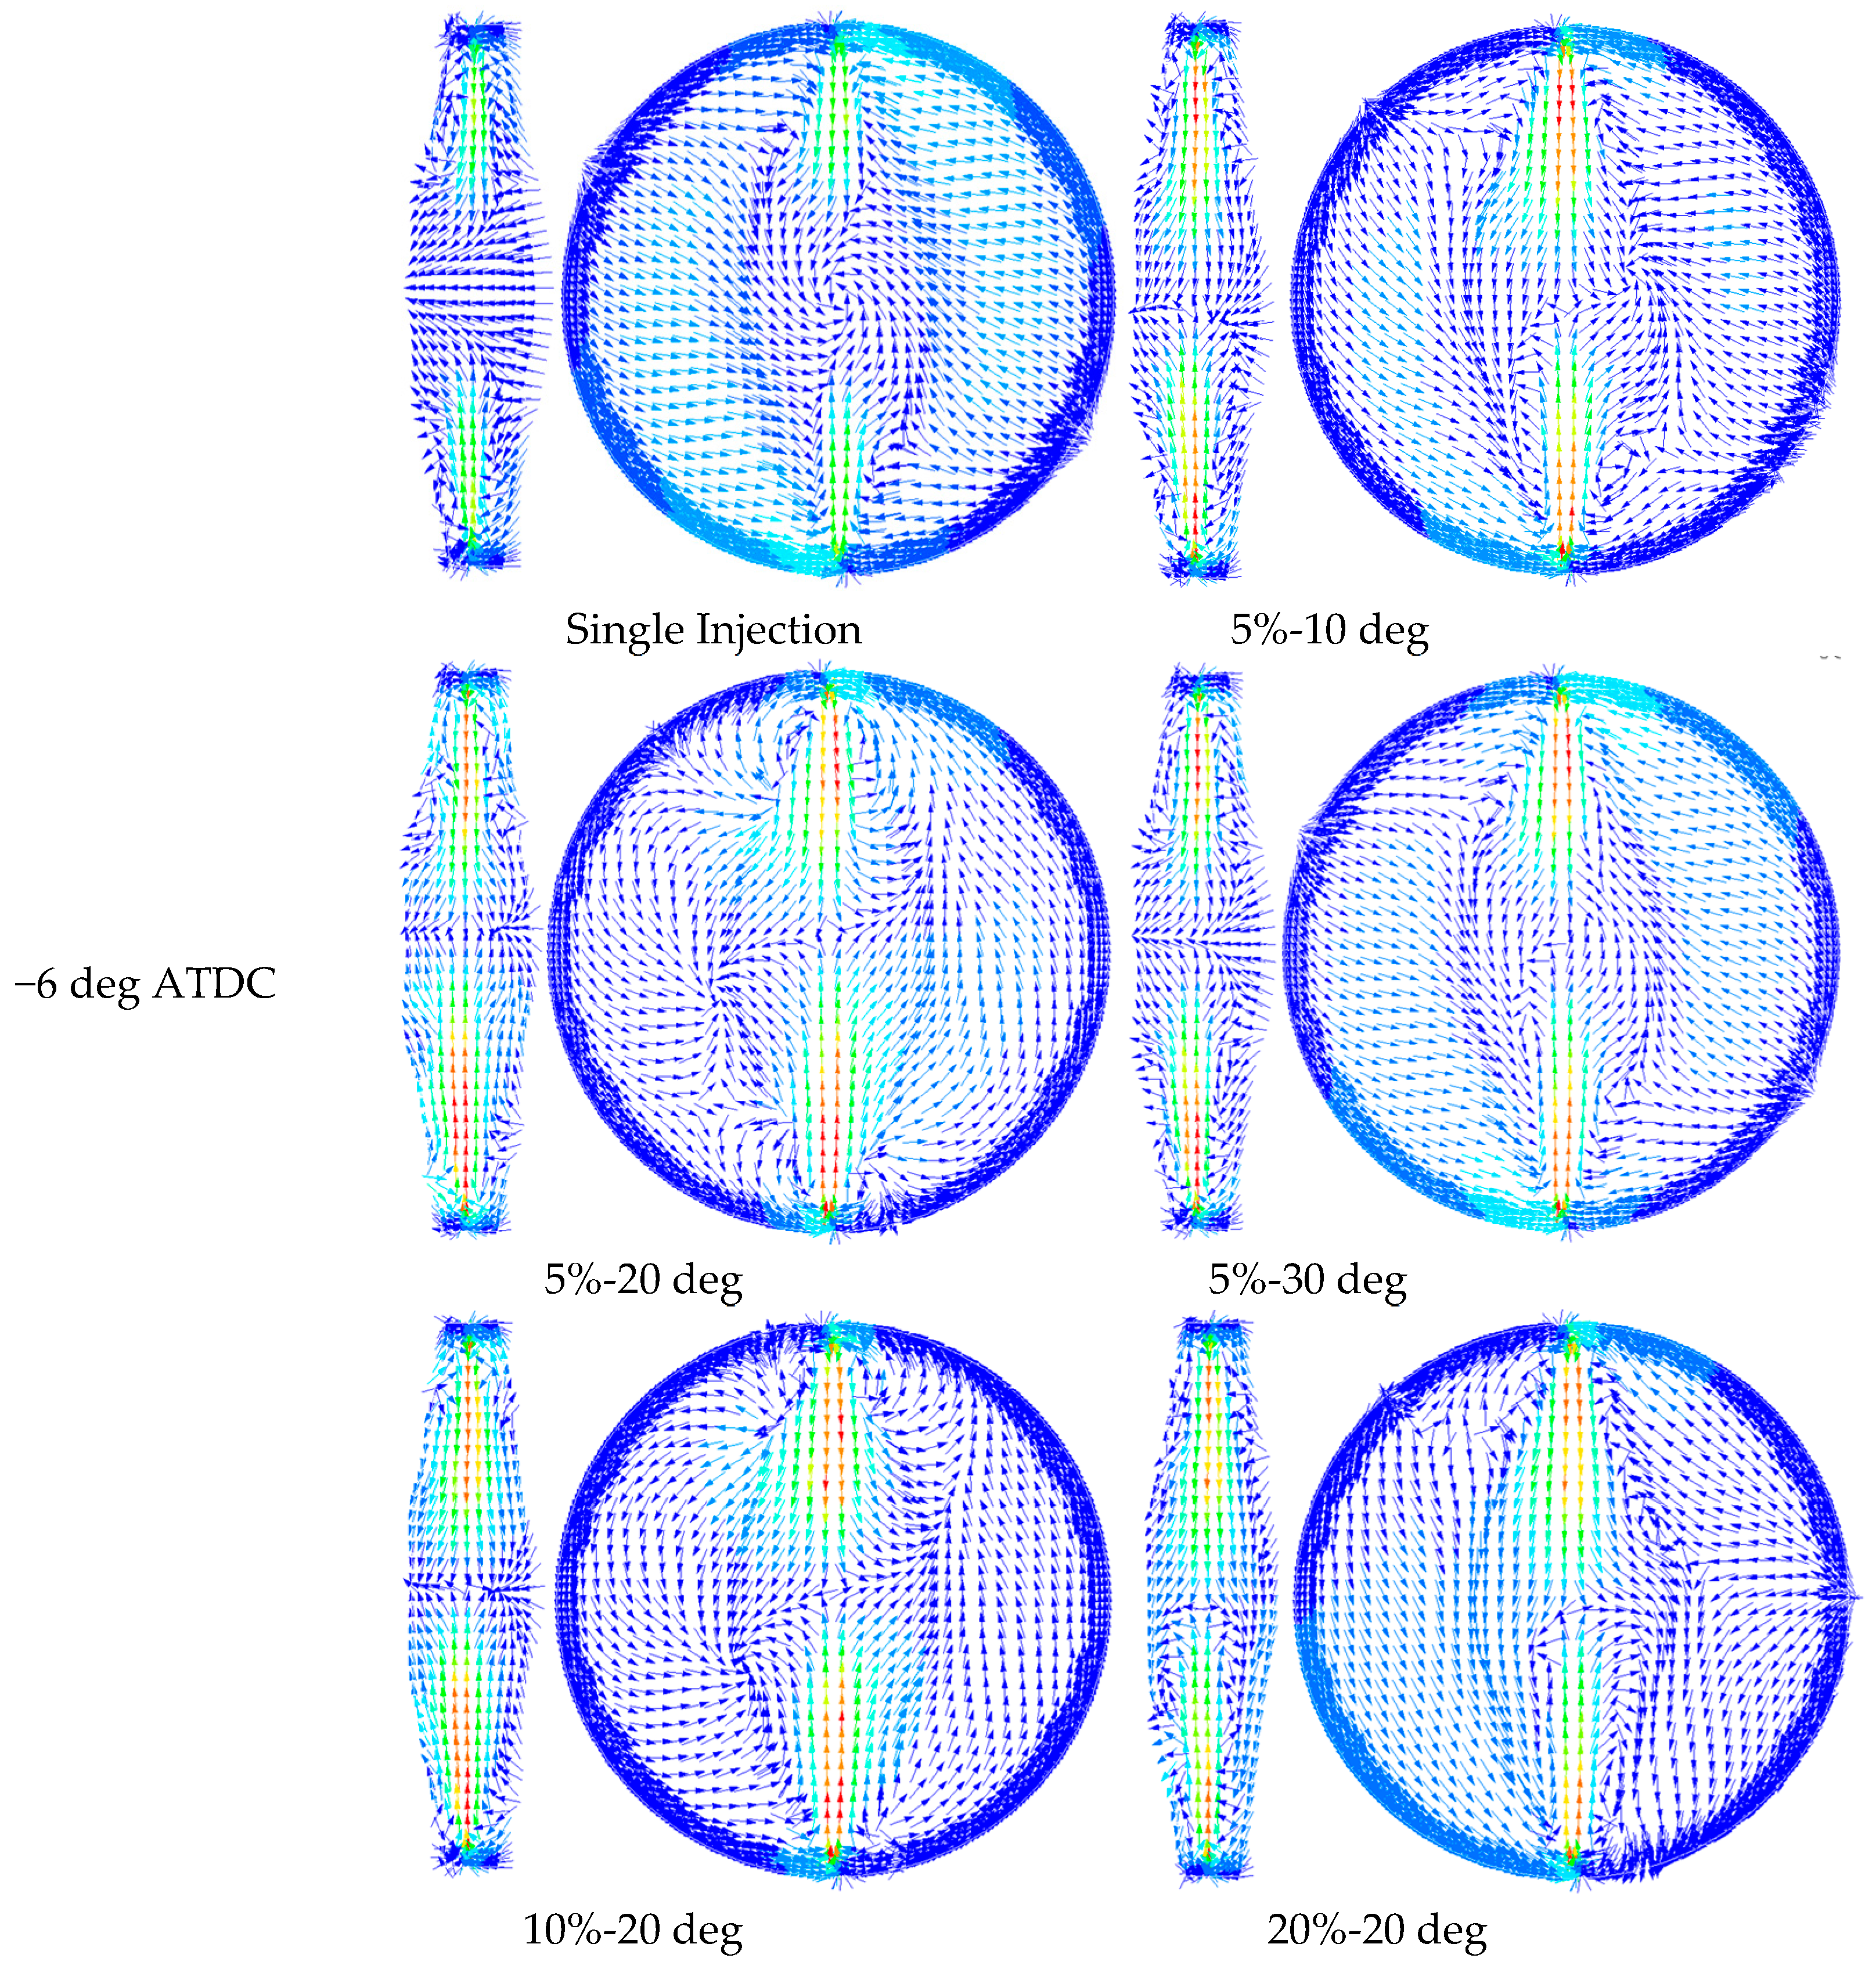
6.3. Velocity Field Results and Discussion

Figure 11 shows the equivalence ratio field of the six injection strategies at −10 deg ATDC and −6 deg ATDC. At −10 deg ATDC, the high equivalence ratio zones (HERZ)—in which the main injection fuel evaporated, mixed and spread with the in-cylinder air movement—of split injection strategies were larger than single injection strategy. This is because the thermo-atmosphere from the combustion of the pilot injection promoted the main injection fuel evaporation. For the single injection strategy, there were two HERZs due to two opposing injectors injecting simultaneously. For the 5%-10 deg strategy, we showed that there were two HERZs and two low equivalence ratio zones (LERZ) due to the complete and incomplete combustion products of the pilot injection fuel. The HERZs were larger than that of 5%-20 deg strategy and the 5%-30 deg strategy. The reason for this was that a better thermo-atmosphere utilization promoted the evaporation and diffusion of the main injection fuel. However, it was negative for the main injection combustion as the injection interval was too short for the main injection to contact with the air, hindering the well-mixing formation and leading to combustion deterioration and higher soot concentration. The space utilization deteriorated. For 5%-20 deg, although the thermo-atmosphere utilization became worse because of the LERZs being at the head of the main spray, there was enough time for air-fuel mixing. The space utilization became better. As for 5%-30 deg, the HERZs were smaller than in the 5%-20 deg strategy because the LERZs were near the center of the chamber, which slightly influenced the main injection. For the 10%-20 deg strategy, the HERZs were larger than the 5%-20 deg strategy due to the higher HTZs, as shown in Figure 9, caused by the combustion of more pilot injection fuel. However, it was negative for the main injection combustion as the complete and incomplete combustion products of the pilot injection fuel remained near the center of chamber where the main air-fuel mixture process occurred. The space utilization became worse. The 20%-20 deg strategy was similar to the 10%-20 deg strategy, but was a slight difference in that one LERZ remained near the center of chamber due to the large momentum of pilot fuel accelerating pilot injection fuel movement, but the thermo-atmosphere still affected most areas of the chamber.
Figure 12 shows the velocity field contours for six injection strategies at −13 deg ATDC, −10 deg ATDC, and −6 deg ATDC. At −13 deg ATDC, the main injection only began. For the 5%-30 deg strategy, the velocity field was similar to that of the single strategy, because the fast movement of the piston forced the weaker down-flow field to disappear. For the 5%-20 deg strategy, the jet velocity was faster than 5%-30 deg strategy. Meanwhile, the overall velocity direction was still the same as that of the single injection strategy. As for 5%-10 deg strategy, the jet velocity was the fastest in the 5% pilot injection/fuel mass ratio strategies. Hence, it can be inferred that a short injection interval generates the acceleration effect. For the 10%-20 deg strategy, the jet velocity was faster than 5%-30 deg strategy, and the overall velocity direction was the same as that of the single injection strategy. However, for the 20%-20 deg strategy, the velocity field changed, and more eddies were formed near the center of the chamber and the wall of the piston. Additionally, the jet velocity was faster than the 10%-20 deg strategy. It can be concluded that the strategy with a shorter dwell time or a larger pilot injection/fuel mass ratio may produce the acceleration. At −10 deg ATDC, the jet velocity of the 5%-20 deg strategy was slightly faster than that of the others, similar to −6 deg ATDC. This is because the space utilization and the thermo-atmosphere utilization was better than other strategies, due to compensation from the acceleration effect. According to the simulation results, the acceleration effect—which caused a faster velocity of the main injection jet—was still observed clearly in an in-cylinder turbulent flow condition.
The acceleration was observed first to interpret combustion performance and second to interpret NOx and soot emission. As shown in Figure 9a, for the same pilot injection/fuel mass ratio, the NOx emission first increased and then decreased with an increase in the injection interval, similar to the soot emission of 5% pilot injection/fuel mass ratio. One of the reasons for this was that the acceleration effect improved the air-fuel mixture for a medium injection interval.

6.4. Summary of the Mechanisms of the Split Injection Interactions

In a shorter injection interval, the fuel sprayed around the area of the border of the chamber far away from the center of the chamber, as shown in Figure 11 (e.g., the 5%-10 deg case). The thermo-atmosphere and the acceleration effect promoted more evaporation and ignition of main injection fuel, which led to a short ignition delay. The short ignition delay resulted in lower heat release rate peak and lower premixed combustion, as shown in Figure 7. When the main injection fuel sprayed into the area of thermo-atmosphere, there was not enough time for the fuel enveloped by the thermo-atmosphere to make contact with the air, and thus space utilization deteriorated, leading to a worse air-fuel mixture being formed. As a result, the combustion was incomplete and the soot concentration was higher. In a longer injection interval, the fuel sprayed around the area of the center of the chamber. Hence, the thermo-atmosphere promoted less evaporation and ignition of main injection fuel and the thermo-atmosphere utilization deteriorated, and there was no acceleration effect on the main injection (e.g., the 5%-30 deg case). This led to a long ignition delay, which resulted in higher heat release rate peak, and higher premixed combustion. When the main injection fuel moved into the thermo-atmosphere, the reduction of oxygen concentration by the thermo-atmosphere caused a higher soot concentration and a lower NOx concentration, as shown in Figure 9.
In a larger pilot ratio, compared with the same injection interval, because the large moment of pilot fuel accelerated its movement, the pilot fuel moved to the area around the center of the chamber. However, the thermo-atmosphere of the larger pilot ratio still affected most areas of the chamber, as shown in Figure 11 (for example the 20%-20 deg case), which better promoted the evaporation and combustion of the main injection fuel, and the ignition of the main injection fuel occurred earlier (as shown in Figure 8). The acceleration effect had a slight influence on the main injection. Although promoting the main combustion, the thermo-atmosphere consumed a large amount of oxygen. Meanwhile, the large pilot ratio released more heat, leading to a higher in-cylinder temperature. The main fuel sprayed into the thermo-atmosphere, in which the fuel was enveloped by the thermo-atmosphere and combusted immediately. As a result, the thermos constraint was formed, because the main injection fuel could not contact the air hindering the well-mixing formation and the combustion is deteriorated.
Atomization, evaporation and mixture are the main problems for OP engines. In this study, the pilot injected before the main injection, which provided thermo-atmosphere and acceleration to promote the evaporation of the main injection fuel and shorten the ignition delay of the main injection fuel. However, the pilot combustion also consumed a large amount of oxygen and the formation of ignitable mixture for main injection fuel consumed appropriate time, which had a great influence on the combustion process of the main injection fuel. Thus, these two pilot injection parameters should be considered when the split injection was optimized. According to the numerical results, the split injection strategy with a small pilot ratio and medium injection interval obtains the optimal effect. This strategy effectively utilizes the thermo-atmosphere and acceleration of the pilot injection. Contrarily, in a long injection interval, the main injection fuel cannot fully utilize the thermo-atmosphere and acceleration. In a short injection interval or a large pilot ratio, the main injection fuel better utilizes the thermo-atmosphere and acceleration, but cannot break through the thermo-atmosphere to mix with the air, and the main injection combustion deteriorates.

7. Conclusions

This study presented the results obtained from numerical investigation of the combustion and emission characteristics with split injection strategies at same operating points. The conclusions are summarized as follows:
The split injection strategy performs better in terms of the acceleration effect in OPOC diesel engine with short injection interval or the larger pilot injection/fuel mass ratio. If the pilot injection time is short enough or the pilot injection/fuel mass ratio is large enough, the pilot injection creates an acceleration effect for the main injection. Although a shorter injection interval helped to form the acceleration effect, it performed worse in terms of the space utilization and thermo-atmosphere utilization. Therefore, the shorter injection interval is not ideal.
The split injection strategy with either a small pilot injection/fuel mass ratio with medium injection interval or a larger pilot injection/fuel mass ratio performed better in terms of the thermo-atmosphere utilization and space utilization.
Compared to the single injection, an appropriate split injection strategy contributes to a reduction in soot emissions, but the emissions of NOx increase. The combustion pressure and temperature for the split injection is higher than that for the single injection.

Acknowledgments

The authors gratefully acknowledge the financial support by the National Natural Science Foundation of China.

Author Contributions

Lei Zhang and Fukang Ma designed the experimental set-up; Tiexiong Su, Yangang Zhang and Lei Zhang performed the experiments; Jinguan Yin, Yaonan Feng and Lei Zhang analyzed the data; Lei Zhang and Tiexiong Su contributed to the editing and reviewing of the document.

Conflicts of Interest

The authors declare no conflict of interest.

References

  1. Callahan, B.J.; Wahl, M.H.; Froelund, K. Oil Consumption Measurements for A Modern Opposed-Piston Two-Stroke Diesel Engine. In Proceedings of the ASME 2011 Internal Combustion Engine Division Fall Technical Conference, Morgantown, WV, USA, 2011; pp. 1019–1028. [Google Scholar]
  2. Kalebjian, C.; Redon, F.; Wahl, M. Low Emissions and Rapid Catalyst Light-Off Capability for Upcoming Emissions Regulations with an Opposed-Piston, Two-Stroke Diesel Engine; Global Automotive Management Council: Ypsilanti, MI, USA, 2012. [Google Scholar]
  3. Ma, F.; Zhao, C.; Zhang, F.; Zhao, Z.; Zhang, Z.; Xie, Z.; Wang, H. An Experimental Investigation on the Combustion and Heat Release Characteristics of an Opposed-Piston Folded-Cranktrain Diesel Engine. Energies 2015, 8, 6365–6381. [Google Scholar] [CrossRef]
  4. Hofbauer, P. Opposed Piston Opposed Cylinder (OPOC) Engine for Military Ground Vehicles; SAE Technical Paper: 2005-01-1548; SAE: Warrendale, PA, USA, 2005. [Google Scholar]
  5. Huo, M.; Huang, Y.; Hofbauer, P. Piston Design Impact on the Scavenging and Combustion in an Opposed-Piston, Opposed-Cylinder (OPOC) Two-Stroke Engine; SAE Technical Paper: 2015-01-1269; SAE: Warrendale, PA, USA, 2015. [Google Scholar]
  6. Herold, R.E.; Wahl, M.H.; Regner, G.; Lemke, J.U.; Foster, D.E. Thermodynamic Benefits of Opposed-Piston Two-Stroke Engines; SAE Technical Paper: 2011-01-2216; SAE: Warrendale, PA, USA, 2011. [Google Scholar]
  7. Naik, S.; Johnson, D.; Koszewnik, J.; Fromm, L.; Redon, F.; Regner, G.; Fuqua, K. Practical Applications of Opposed-Piston Engine Technology to Reduce Fuel Consumption and Emissions; SAE Technical Paper: 2013-01-2754; SAE: Warrendale, PA, USA, 2013. [Google Scholar]
  8. Franke, M.; Huang, H.; Liu, J.P.; Geistert, A. Opposed Piston Opposed Cylinder (opoc™) 450 hp Engine: Performance Development by CAE Simulations and Testing; SAE Technical Paper: 2006-01-0277; SAE: Warrendale, PA, USA, 2006. [Google Scholar]
  9. Heywood, J.B. Internal Combustion Engine Fundamentals; McGraw Hill International: New York, NY, USA, 1988. [Google Scholar]
  10. Ramos, J.I. Internal Combustion Engine Modeling; Hemisphere Publishing Corporation: New York, NY, USA, 1989. [Google Scholar]
  11. Wang, X.; Huang, Z.; Zhang, W.; Kuti, O.A.; Nishida, K. Effects of ultra-high injection pressure and micro-hole nozzle on flame structure and soot formation of impinging diesel spray. Appl. Energy 2011, 88, 1620–1628. [Google Scholar] [CrossRef]
  12. Brijesh, P.; Sreedhara, S. Experimental and numerical investigations of effect of split injection strategies and dwell between injections on combustion and emissions characteristics of a diesel engine. Clean Technol. Environ. Policy 2016, 18, 1–10. [Google Scholar] [CrossRef]
  13. Mathivanan, K.; Mallikarjuna, J.; Ramesh, A. Influence of multiple fuel injection strategies on performance and combustion characteristics of a diesel fuelled HCCI engine—An experimental investigation. Exp. Therm. Fluid Sci. 2016, 77, 337–346. [Google Scholar] [CrossRef]
  14. Herfatmanesh, M.R.; Lu, P.; Attar, M.A.; Zhao, H. Experimental investigation into the effects of two-stage injection on fuel injection quantity, combustion and emissions in a high-speed optical common rail diesel engine. Fuel 2013, 109, 137–147. [Google Scholar] [CrossRef]
  15. Mohan, B.; Yang, W.; Kiang Chou, S. Fuel injection strategies for performance improvement and emissions reduction in compression ignition engines—A review. Renew. Sustain. Energy Rev. 2013, 28, 664–676. [Google Scholar] [CrossRef]
  16. D’Ambrosio, S.; Ferrari, A. Potential of double pilot injection strategies optimized with the design of experiments procedure to improve diesel engine emissions and performance. Appl. Energy 2015, 155, 918–932. [Google Scholar] [CrossRef]
  17. Nehmer, D.A.; Reitz, R.D. Measurement of the Effect of Injection Rate and Split Injections on Diesel Engine Soot and NOx Emissions; SAE Technical Paper: 0148-7191; SAE: Warrendale, PA, USA, 1994. [Google Scholar]
  18. Li, X.; Gao, H.; Zhao, L.; Zhang, Z.; He, X.; Liu, F. Combustion and emission performance of a split injection diesel engine in a double swirl combustion system. Energy 2016, 114, 1135–1146. [Google Scholar] [CrossRef]
  19. Li, X.-R.; Yang, W.; Zhao, L.-M.; Liu, F.-S. The influence of pilot-main injection matching on DI diesel engine combustion using an endoscopic visualization system. Fuel 2017, 188, 575–585. [Google Scholar] [CrossRef]
  20. Cung, K.; Moiz, A.; Johnson, J.; Lee, S.Y.; Kweon, C.B.; Montanaro, A. Spray–Combustion interaction mechanism of multiple-injection under diesel engine conditions. Proc. Combust. Inst. 2015, 35, 3061–3068. [Google Scholar] [CrossRef]
  21. Park, S.H.; Kim, H.J.; Lee, C.S. Effect of Multiple Injection Strategies on Combustion and Emission Characteristics in a Diesel Engine. Energy Fuels 2016, 30, 810–818. [Google Scholar] [CrossRef]
  22. Mobasheri, R.; Peng, Z.; Mirsalim, S.M. Analysis the effect of advanced injection strategies on engine performance and pollutant emissions in a heavy duty DI-diesel engine by CFD modeling. Int. J. Heat Fluid Flow 2012, 33, 59–69. [Google Scholar] [CrossRef]
  23. Ma, F.; Zhao, C.; Zhang, F.; Zhao, Z.; Zhang, S. Effects of Scavenging System Configuration on In-Cylinder Air Flow Organization of an Opposed-Piston Two-Stroke Engine. Energies 2015, 8, 5866–5884. [Google Scholar] [CrossRef]
  24. Liu, A.B.; Mather, D.; Reitz, R.D. Modeling the Effects of Drop Drag and Breakup on Fuel Sprays; SAE Technical Paper: 930072; SAE: Warrendale, PA, USA, 1993. [Google Scholar]
  25. Patterson, M.A.; Reitz, R.D. Modeling the Effects of Fuel Spray Characteristics on Diesel Engine Combustion and Emission; SAE Technical Paper: 980131; SAE: Warrendale, PA, USA, 1998. [Google Scholar]
  26. DUKowicz, J. Quasi-Steady Droplet Change in the Presence of Convection; LA7997-MS; Scientific Laboratory of California: Los Alamos, NM, USA, 1979. [Google Scholar]
  27. O’Rourke, P.; Bracco, F. Modeling of drop interactions in thick sprays and a comParison with experiments. Proc. Inst. Mech. Eng. 1980, 9, 101–106. [Google Scholar]
  28. Jiro, S.; Kobayashi, M.; Iwashita, S.; Fujimoto, H. Modeling of Diesel Spray Impingement on a Flat Wall; SAE Technical Paper: 941894; SAE: Warrendale, PA, USA, 1994. [Google Scholar]
  29. Colin, O.; Benkenida, A. The 3-zones extended coherent flame model (ECFM3Z) for computing premixed/diffusion combustion. Oil Gas Sci. Technol. 2004, 59, 593–609. [Google Scholar] [CrossRef]
  30. Halstead, M.; Kirsch, L.; Quinn, C. The autoignition of hydrocarbon fuels at high temperatures and pressures—fitting of a mathematical model. Combust. Flame 1977, 30, 45–60. [Google Scholar] [CrossRef]
  31. Bowman, C. Chemistry of Gaseous Pollutant Formation and Destruction. Fossil Fuel Combussion; John Wiley & Sons: New York, NY, USA, 1991; Volume 250. [Google Scholar]
  32. Fenimore, C. Formation of nitric oxide in premixed hydrocarbon flames. Symp. Combust. 1971, 13, 373–380. [Google Scholar] [CrossRef]
  33. Nishida, K.; Hiroyasu, H. Simplified Three-Dimensional Modeling of Mixture Formation and Combustion in a DI Diesel Engine; SAE Technical Paper: 890269; SAE: Warrendale, PA, USA, 1989. [Google Scholar]
Figure 1. Concept of opposed-piston, opposed-cylinder (OPOC) diesel engine.
Energies 10 00684 g001
Figure 2. (a) OPOC diesel engine combustion chamber and injector position; (b) Injector spraying direction. The x-y plane is the center plane of combustion chamber, the x-z plane being perpendicular to the x-y plane is the cutting plane of chamber. The direction of the x-axis is between the position of injector A to the position of injector B. The angle basing on the x-y plane, which is between the projection line projected by the injector spraying direction on the x-y plane to the direction of y-axis, is θ . The angle basing on the x-z plane, which is between the projection line projected by the injector spraying direction on the x-z plane to the direction of x-axis at the point of the position of injector, is 7°.
Energies 10 00684 g002
Figure 3. Opposed-piston, opposed-cylinder (OPOC) diesel engine experimental set-up.
Energies 10 00684 g003
Figure 4. Injection strategies for single and split injection. SOI: start of injection.
Energies 10 00684 g004
Figure 5. Calculation meshes and sensitivity analysis results of the mesh size. (a) Simulation mesh specification of 1.0 mm; and (b) heat release rate (HRR) results with different mesh sizes.
Energies 10 00684 g005
Figure 6. Comparison of calculated and measured in-cylinder pressure and heat release rate.
Energies 10 00684 g006
Figure 7. The in-cylinder pressure, in-cylinder temperature and heat release rate of injection interval for the 5% pilot injection/fuel mass ratio. (a) In-cylinder pressure of different injection intervals for the 5% pilot injection/fuel mass ratio; (b) HRR of different injection intervals for the 5% pilot injection/fuel mass ratio; and (c) In-cylinder temperature of different injection intervals for the 5% pilot injection/fuel mass ratio.
Energies 10 00684 g007
Figure 8. In-cylinder pressure, HRR and in-cylinder temperature of different pilot injection/fuel mass ration with the 20 deg injection interval. (a) In-cylinder pressure of different pilot injection/fuel mass ratios with the 20 deg injection interval; (b) HRR of different pilot injection/fuel mass ratios with the 20 deg injection interval; and (c) In-cylinder temperature of different pilot injection/fuel mass ratios with the 20 deg injection interval.
Energies 10 00684 g008
Figure 9. NOx and soot emission of different injection strategies. (a) Nitrous oxide (NOx) emission of different injection strategies; and (b) Soot emission of different injection strategies.
Energies 10 00684 g009
Figure 10. Temperature fields. HTZ: high temperature zone; LTZ: low temperature zone.
Energies 10 00684 g010
Figure 11. Equivalence ratio fields. HERZ: high equivalence ratio zone, LERZ: low equivalence ratio zones.
Energies 10 00684 g011
Figure 12. Velocity fields.
Energies 10 00684 g012aEnergies 10 00684 g012bEnergies 10 00684 g012c
Table 1. Opposed-piston, opposed-cylinder (OPOC) diesel engine specifications.
ItemSpecification
Number of cylinders2
Bore (mm)100 mm
Stroke (mm)160 mm
Compression ratio21
Rated engine speed (rpm)3600 rpm
Rated power (kW)160 kW
Rail pressure (MPa)140 Mpa
Nozzle diameter (mm)0.22 mm
Number of injectors4
Number of holes3
Table 2. Test Conditions.
Experimental Conditions for Validation
Engine Speed (rpm)2800 rpm
Engine Load80%
Injection Pressure (MPa)140 MPa
Single InjectionInjection Quantity(mg)84 mg
Injection TimingATDC −15 deg
Numerical Modeling Conditions
Engine Speed (rpm)2800 rpm
Injection Pressure (MPa)140 MPa
Split InjectionInjection Quantity (mg)4.2 mg + 79.8 mg
8.4 mg + 75.6 mg
12.6 mg + 71.4 mg
16.8 mg + 67.2 mg
Injection TimingATDC −65 deg + ATDC −15 deg
ATDC −55 deg + ATDC −15 deg
ATDC −45 deg + ATDC −15 deg
ATDC −35 deg + ATDC −15 deg
ATDC −25 deg + ATDC −15 deg

