
Modeling the Performance of a New Speed Adjustable Compound Supercharging Diesel Engine Working under Plateau Conditions

School of Mechanical Engineering, Beijing Institute of Technology, Beijing 100081, China
*
Author to whom correspondence should be addressed.
Energies 2017, 10(5), 689; https://doi.org/10.3390/en10050689
Submission received: 24 March 2017
/
Revised: 2 May 2017
/
Accepted: 8 May 2017
/
Published: 17 May 2017
(This article belongs to the Special Issue Internal Combustion Engines 2017)
Abstract
:In order to improve the diesel engine performance under plateau (high altitude) conditions, a new Speed Adjustable Compound (SAC) supercharging method is proposed. A simulation model based on a six-cylinder V-type turbocharged intercooler diesel engine is built on the GT-POWER platform, and then simulation-based research is carried out. A genetic algorithm (GA) is used to identify the best operation parameters, including the supercharger speed and fuel injection quantity under steady state conditions. Transient performance is obtained through starting process simulation of a vehicle with SAC engine on the MATLAB/Simulink GT-POWER co-simulation platform. Both the steady and transient performance of the SAC engine are compared with those of the original engine. Results show that the torque of the SAC engine at full load is significantly increased when the engine speed n < 1600 r/min. The increment of the maximum torque can reach up to 31% at 1000 r/min compared to that of the original engine, while the peak torque is increased by 9%. The fuel consumption deterioration is restricted within 5%. What’s more, the SAC engine can help reducing the acceleration time by 20% during tip-in pedal events during the vehicle starting process.
1. Introduction
The air pressure and air density experience sharp declines at high elevation, which causes a large drop in the air intake flow of diesel engines [1,2]. Many aspects of the performance of the traditional turbocharged diesel engine are deteriorated as a result, such as power, fuel consumption and emissions [3,4]. The compressor may experience surge or over-speed problems. Besides, the turbo lag problem can’t be ignored when engine exhaust energy is lacking [4].
In recent years, many supercharging technologies have been applied to improve the plateau performance of diesel engines. Li [5] applied a turbocharged system with waste gate in a CA6110/125Z1A2 diesel engine. The results showed this method could improve the torque performance during low engine speeds and avoid over-speed problems of the compressor at high engine speeds, but it had poor full load torque at high engine speeds and bad economic performance because part of the exhaust gas was released at high engine speeds. Zhang [6] did some simulation research on a M11-C300 turbocharged diesel engine with a Variable Geometry Turbocharger (VGT). According to the simulation results, the VGT had high efficiency and could effectively solve the problem of turbo lag, but the increase of engine power at high altitudes was insufficient due to the compression ratio limitations. Liu et al. [7] did some research on a 6 V diesel engine with two stage turbocharged systems and found that at 4500 m altitude, this charging system could improve the engine power to 85% of its level at sea level, but the problem of turbo lag still existed in the two stage turbocharged system.
Electric supercharging has the advantages of fast acceleration and can provide very high spontaneous boost pressure while the car is pulling away at low revolutions. This was demonstrated by Audi in the Audi RS 5 TDI concept [8].
Mechanical compound supercharging was previously explored by various groups [9,10,11] and firstly applied by Volkswagen to improve the torque performance of gasoline engines. A 1.4 L Twin-charger Stratified Injection (TSI) engine could have the same output power as a 2.31 L Natural Aspiration (NA) engine, but the fuel consumption was increased [12]. The system structure adopted a roots-type supercharger and a turbocharger in series. The transient characteristics of the engine were improved by the supercharger, and the pressure ratio was improved by the compound charging system.
Because the transmission ratio between the supercharger and engine are fixed, it is impossible to optimize the engine intake performance according to the working characteristics, which may lead to higher fuel consumption. In addition, the air flow rate and compression ratio of the roots-type supercharger are directly related to size and weight. The engine will demand high flow rates and compression ratios at high altitudes. This means much more size and weight increment for the roots-type supercharger [12]. Compared to the roots-type supercharger, the centrifugal supercharger is much smaller and more efficient. Related studies have shown that the intake pressure of a centrifugal supercharger driven by a motor can be optimized throughout the whole engine operation range [13,14]. In this study, the SAC system is introduced to solve the problems of turbo-lag and enhance the engine performance at plateau. The SAC system only needs to install a supercharger in front of the single stage turbocharged diesel engine.
In this paper, our research on modeling and simulation of the Speed Adjustable Compound supercharging diesel engine working at plateau is presented. The main features of the work are as follows: first, a simulation model of the SAC diesel engine is set up based on experimental data of an original turbocharged diesel engine. The influence of the supercharger speed is analyzed; Second, steady state operation parameters including supercharger speed and cycle fuel injection quantity of the SAC diesel engine are optimized to improve the engine performance at 4500 m. Third, transient performance of the SAC engine is tested by simulating the vehicle starting process. The main purpose of this paper is to illustrate the significant advantages of the SAC system in improving power and transient performance of diesel engine at 4500 m altitude.
2. System Modeling and Parametric Analysis
2.1. System Description
The SAC system consists of one turbocharger and one supercharger. The turbocharger is always in operation, and the supercharger operates in the low and middle speed region of the engine. A bypass valve is arranged next to the supercharger.
When the supercharger is stopped, the bypass valve will open to maintain a normal air flow. To reduce the complexity of the system, only one intercooler is arranged in the rear of the compressor of turbocharger. A system schematic is shown in Figure 1. The supercharger has lower inertia and is driven by a motor, so it can accelerate fast and provide a high intake pressure during any situation lacking engine exhaust energy. The driving motor is connected to supercharger using the driving belt. The rotation speed of the driving motor can be adjusted from 0 r/min to 90,000 r/min continuously. Table 1 shows the main parameters of the supercharger drive system.
The turbocharger operates throughout the complete operational range. The original turbocharger is retained in this paper. One thing to note is that a compressor driven by an electric motor, namely a relatively low supercharging pressure and high current consumption, that’s why influence of supercharger speed was analyzed below.
2.2. System Model
The analysis is based on a previously validated [15] GT-POWER engine model of a V-type six-cylinder turbocharged intercooled diesel engine, which employs a mechanical diesel pump and a turbocharger. The parameters of the engine are listed in Table 2.
The combustion process is described using a zero dimension (0-D) Predictive combustion model based on neural network (NN) and three Wiebe functions. This combustion model was proposed by Galindo et al. [16], and Serrano et al. [17,18]. Five operation factors—the outlet air temperature of the intercooler, the outlet air pressure of the intercooler, the fuel injection quantity, the injection timing and engine speed—which are related to the combustion process were chosen as the input parameters of the NN. The NN training data is obtained from experiments in a plateau environment simulation cabin covering the engine speed range from 1000 r/min to 2100 r/min, load range from 10% to 100%, 17.5° injection timing, 4500 m altitude, and intercooler temperature range from 40 °C to 90 °C. Nine parameters of the three Wiebe functions were chosen as the output parameters of the NN. The main procedures to establish the 0-D Predictable combustion model are explained in [19]: first, the rate of heat release was extracted through an analysis of the in-cylinder pressure experimental data. Second, the three Wiebe functions were used to describe the rate of heat release and the training data under different working conditions were obtained. Third, the RBF neural network was trained to build the relationship between the five operating parameters and nine three Wiebe function parameters.
The original engine model is built, and then the SAC engine is modeled by modifying the original model. One thing to note is that the engine power used in this paper is the net power (Pnet) which is obtained by deducting the power consumption of the supercharger from the engine power. The BSFC is calculated using this ‘net power’.
2.3. Influence of Supercharger Speed
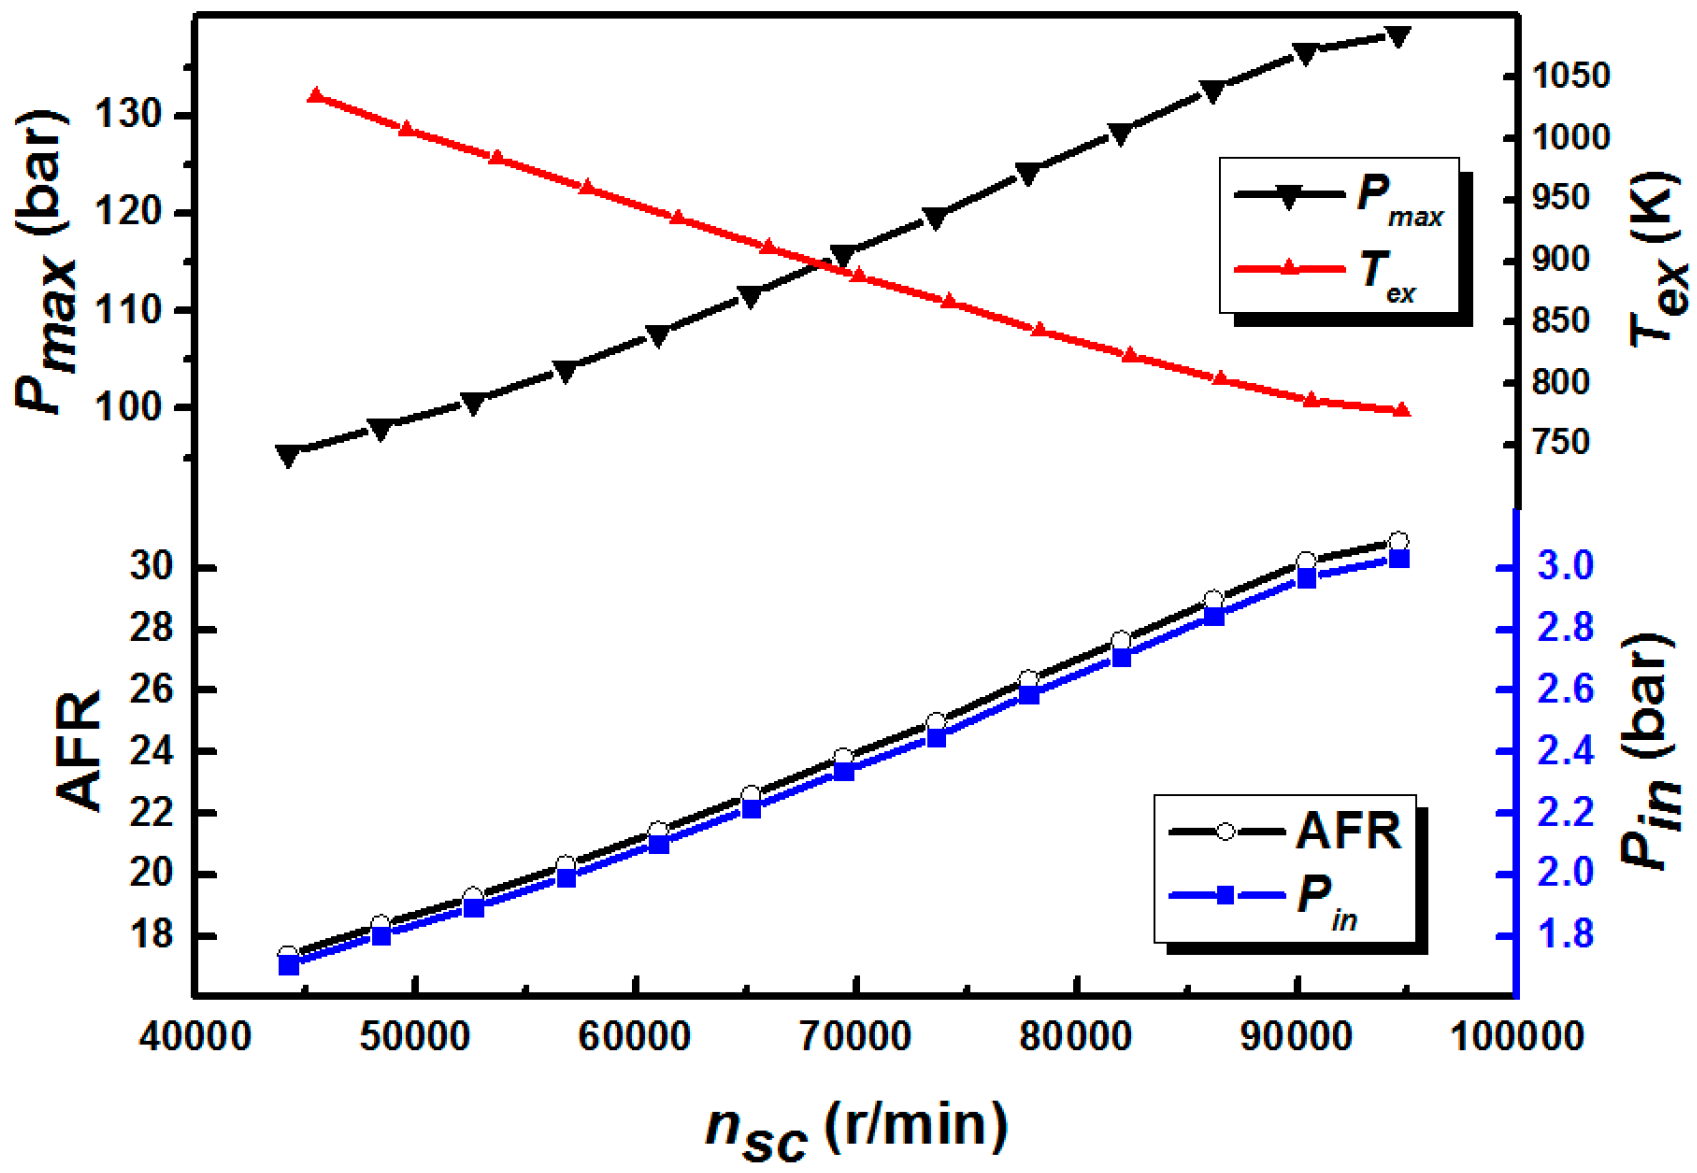
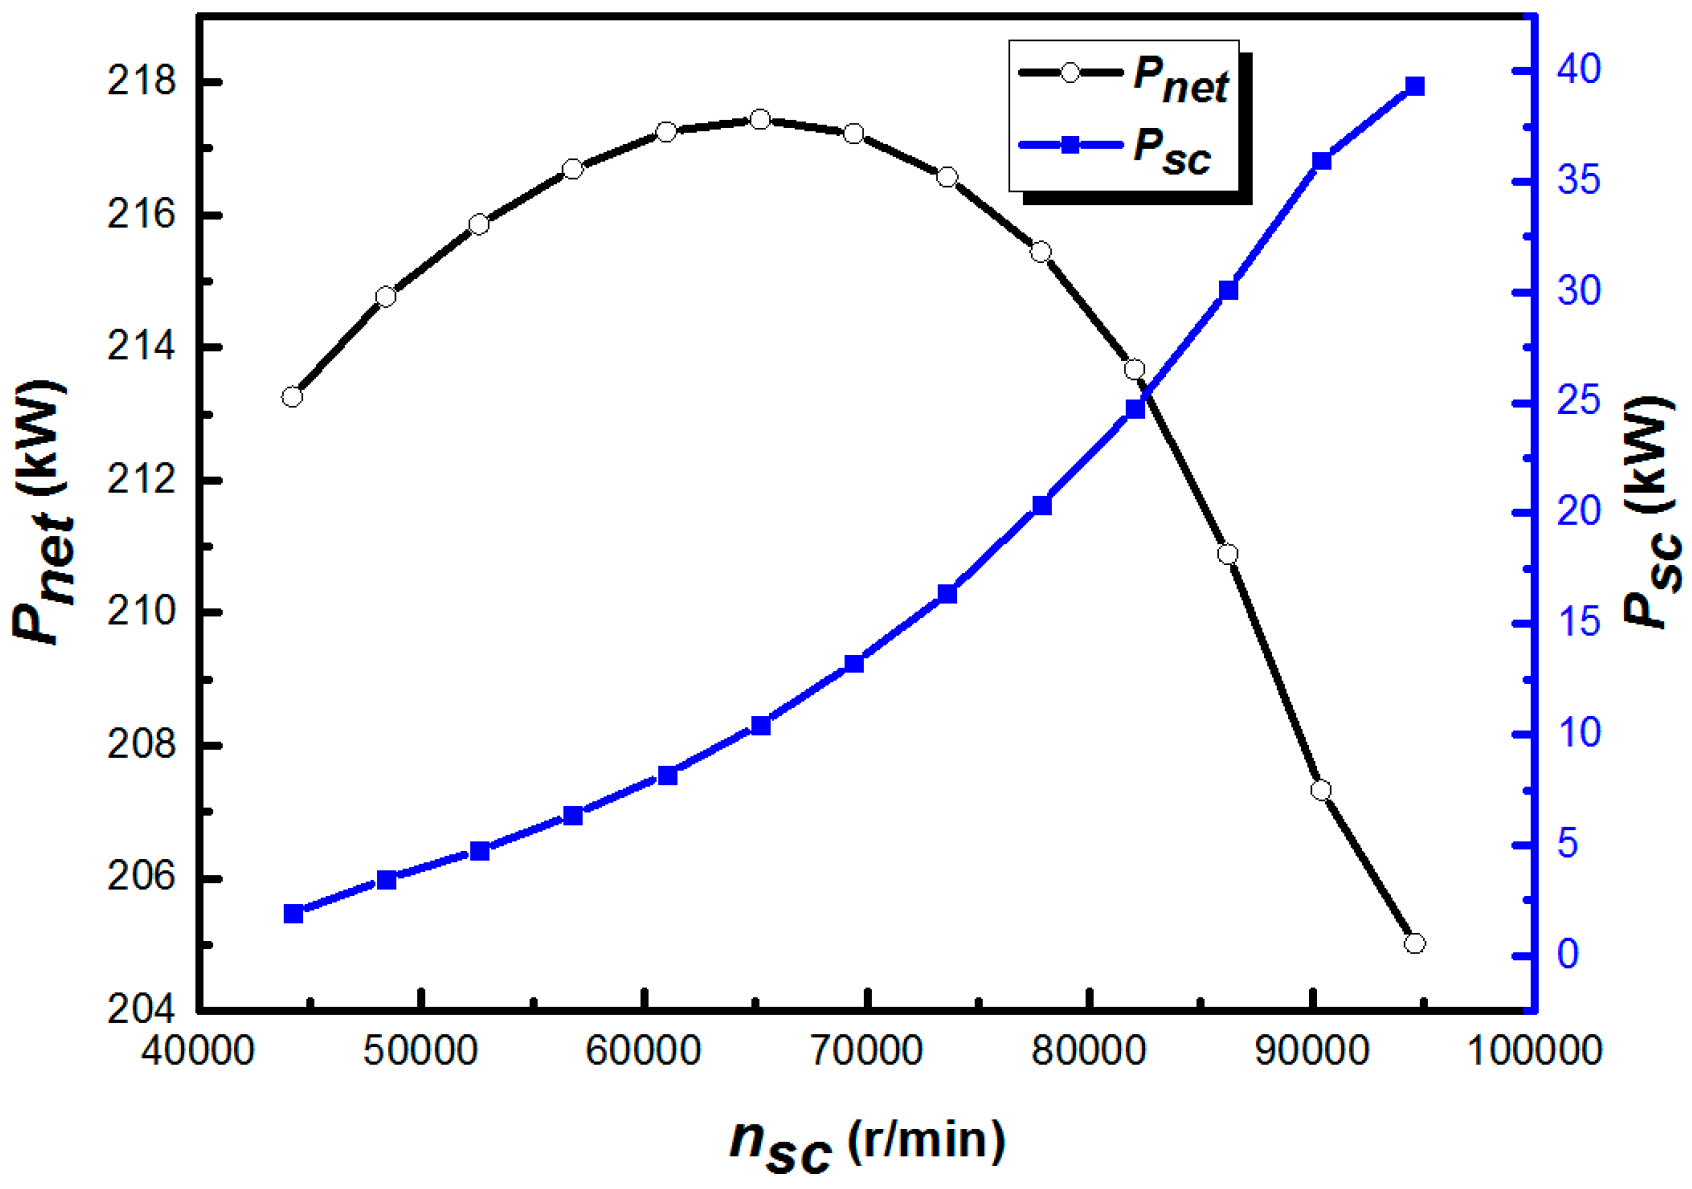
It is obvious that a higher supercharger speed nsc means a higher pressure ratio to the engine, thus Pnet, the turbine inlet temperature Tex, AFR and the peak pressure pmax of the engine will change accordingly. Results of numerical simulations at the operating point with 1500 r/min, 167 mg per cycle in one cylinder and 4500 m altitude of the engine, and with nsc ranging from 44,200 r/min to 94,600 r/min are shown in Figure 2 and Figure 3.
With the increase of nsc, pin and pmax and AFR increase monotonously at the rate of 4.0×10⁻⁵ bar/(r/min), 7.3×10⁻⁴ bar/(r/min) and 2.8×10⁻⁴ 1/(r/min), respectively. Meantime Tex decreases at the rate of 4.410−3 K/(r/min). In addition, the engine net power Pnet rises from 44,200 r/min to 67,000 r/min and then declines from 67,000 r/min to 94,600 r/min. As nsc increases, pin increases which can help to improve thermal efficiency; however, as can be seen from Figure 3, the power consumption of the supercharger will be high when nsc is too large, that’s why the power decreases then.
3. Steady Optimization and Simulation
3.1. Optimization Aim
Base on related reference and analysis in Section 2, the rotation speed of the supercharger and cycle fuel injection quantity are two main factors that affect the engine power and BSFC, so the next stage is to optimize these two factors, as well as to keep the engine at maximum effective output power and operating stably. The ranges for the two parameters are specified in Table 3.
3.2. Performance Boundaries
The following constraints should be considered and defined in advance in order to provide realistic and reasonable results:
- Supercharger speed constraint: less than 90,000 r/min.
- Turbocharger speed constraint: less than 130,000 r/min.
- Maximum cylinder pressure: less than 162 bar.
- Maximum turbine inlet temperature: less than 1023 K.
- Minimum AFR: more than 17.
3.3. Optimized Algorithm
The research problem in this section corresponds to a global non-linear optimization problem with multiple constraints. The genetic algorithm (GA) fulfills the role of global search particularly well, and is increasingly being applied. The design process of a GA mainly includes three aspects: selection, crossover and mutation. The selection process is regarded as the ‘‘natural selection law’’ in the genetic processes, expressing the optimization targets through the fitness function. A fitness function should be designed according to the feature of specific objects. An appropriate fitness function is critical to ensure the GA will run correctly and effectively [20].
3.3.1. Fitness Function
The static penalty functions are employed in this paper, and the magnitude of punishment depends on the violation degree. The violation degree h is defined as follow:
where h is the assessment of the violation degree, subscripts of h stand for violation object such as pmax, Tex and n(x). The vector stands for optimization parameters. stands for the supercharger speed. stands for fuel injection quantity. The fitness function is expressed in Equation (4).
where P stands for the engine net power. K represents the penalty parameters. If pmax or Tex or n(x) exceeds the constraint, the penalty term in Equation (4) will work. A bigger fitness function value means the individual adapts the survival rules better. The genes of this individual are more likely to be used.
3.3.2. Penalty Parameters K
Penalty parameters K described in Equation (4) have a great influence on the fitness function. The selection of K has great effect on convergence of the optimization result. Zhu [21] has promoted a useful way to select K which is called ‘Fitness Equal to Zero at the Worst Point’. The main view is to restrict the elements of x fairly and reduce the impact of x value ranges. The biggest penalty should be imposed on operating points violating constraints most severely. That is to make the fitness function equal to zero. This way has been proved and is used in this paper.
Under a certain operating condition, the ranges of are expressed as and . The peak pressure pmax appears at the point A , with the maximum supercharger speed and cycle fuel injection quantity. The maximum Tex and maximum ntc both appear at the point B , with minimum supercharger speed and fuel injection quantity. The fitness function is set to zero at the points A and B. This is shown in Equations (5) and (6):
3.3.3. Convergence Conditions
Once the value of the fitness function and x meet Equations (7) and (8) in 20 consecutive generations, the optimization results is considered convergent. The subscript i (i = 1, 2 in this paper) stands for the dimension of x, and subscript j stands for the generation of the GA. The err stands for the error limits of convergence:
3.4. Optimization Realization
To make it easier for optimization, the GT-POWER engine model is integrated into a co-simulation environment with MATLAB m-file, and the corresponding system block diagram can be seen in Figure 4. Simulation parameters are transmitted from MATLAB to GT-POWER, and then the engine numerical model is run. When the GT-POWER simulation is finished, GT-POWER will transmit the results such as Pnet, pmax, Tex and ntc back to MATLAB. Using these simulation results, Equations (1)–(8) are calculated to judge whether the optimization is converged, if not, the genetic processes will continue until it converged. GA input parameters are specified in Table 4.
3.5. Simulation Results
3.5.1. Torque
Figure 5a shows the torque output of the SAC engine at full load under various engine speeds. The torque has a certain improvement compared to the original engine when the engine speed n < 1600 r/min. when the engine speed n > 1600 r/min, the torque of the original engine is higher than that of SAC. That is why at the supercharger operation is stopped. The peak torque point is moved from 1400 r/min to 1300 r/min and has a significant increment of 9%. What’s more, the torque at 1000 r/min has increased by 31% compared to that of the original engine. However, the torque of SAC system is virtually identical with that of the original engine when n > 1600 r/min. The reason is that the same turbocharger is used in these two schemes. Figure 5a,b show that the torque and fuel injection quantity have the same varying tendency. The increment of air mass flow (Figure 5c) leads to much more fuel injection which helps to increase the torque and power. Figure 5d shows the variation of nsc.
3.5.2. Fuel Consumption
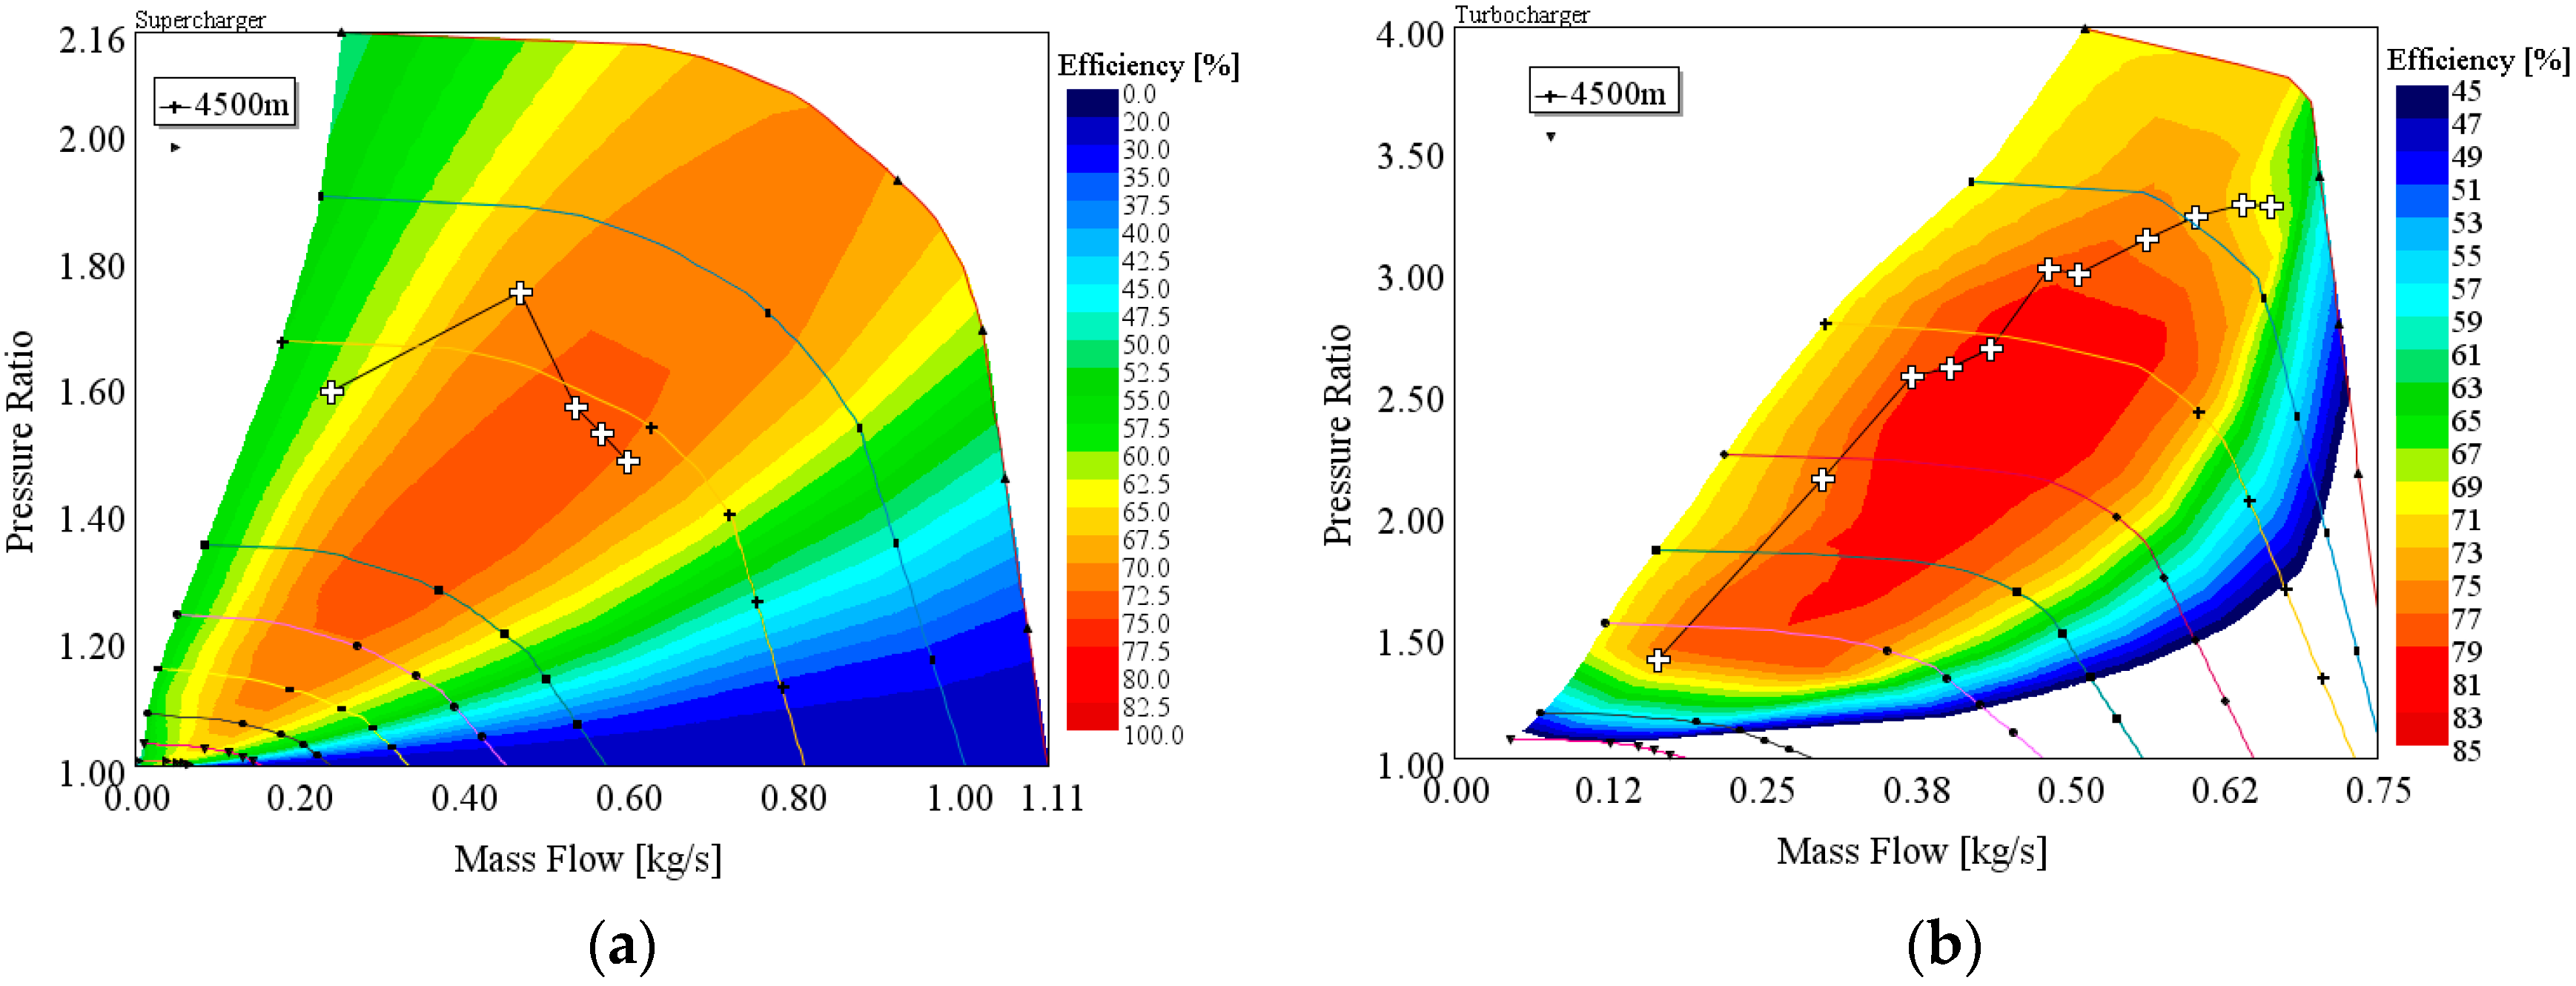
Figure 6 shows fuel consumption comparison between the SAC engine and original engine. The BSFC of the SAC engine is higher than that of the original engine when 1000 r/min < n < 1300 r/min (the maximum increment is restricted within 5%). This is because a significant amount of effective power is consumed by the supercharger. The phenomenon changes as the engine speeds up, due to the rise in efficiency both of the supercharger and turbocharger. This can be seen from Figure 7a,b, respectively.
3.5.3. Turbine Inlet Temperature
In the plateau environment, the air mass flow decreases leads to an increase of the turbine inlet temperature Tex. Tex is one of the important effects that limit the increasing of fuel injection at plateau [21]. Figure 8 shows that Tex rises with engine speeds up at full load conditions, except 1300 r/min.
This is mainly because that fuel injection quantity is increased as the engine speeds up and the engine has the maximum fuel injection quantity and smallest AFR (21 as can be seen from Figure 9) at 1300 r/min. The supercharger operation is stopped when the engine speed is larger than 1600 r/min and Tex falls with the decrease of fuel injection quantity.
3.5.4. Rotate Speed MAP of the Supercharger
The rotation speed MAP of the overall working conditions is shown in Figure 10. There is a very clear line which divides the overall area into ‘STC mode’ and ‘SC mode’. The nsc increases with the increasing load under STC mode.
4. Transient Simulation
In this section, a vehicle model is built with this SAC diesel engine, and then a ‘tip-in’ simulation during the vehicle starting process is run to test the transient performance of the SAC engine.
4.1. Simulation Setup
Vehicle model is built on the GT-Power platform. Figure 11 shows the model architecture including the engine, the SAC system, ECU and equivalent moment of inertia of the vehicle J’ and torque resistance from the wheel. Ignoring the elastic damping element of drive train, J’ can be calculated using Equations (9)–(11) and expressed by Equation (12):
where mG is entire vehicle mass, is driving speed, is angular velocity, is moment of inertia of converted by vehicle quality, is moment of inertia of input shaft, is moment of inertia of output shaft, is angular velocity of input shaft, is angular velocity of output shaft, is transmissionefficiency, is moment of inertia of engine crankshaft, is moment of inertia of gearbox, is moment of inertia of main reducing gear, is moment of inertia of the wheels, is radius of the tire, is transmission ratio of first gear, is transmission ratio of main reducing gear, is efficiency of gear box, and is efficiency of main reducing gear.
The relationship between resistance torque T’ on the crankshaft and running resistance F can be expressed using Equation (13) where is proportion of engine accessory energy consumption. The specifications of the car are shown in Table 5 and J’ is approximately 11 kg·m2.
4.2. Simulation During the Vehicle Starting Process
4.2.1. Vehicle Starting Process Analysis
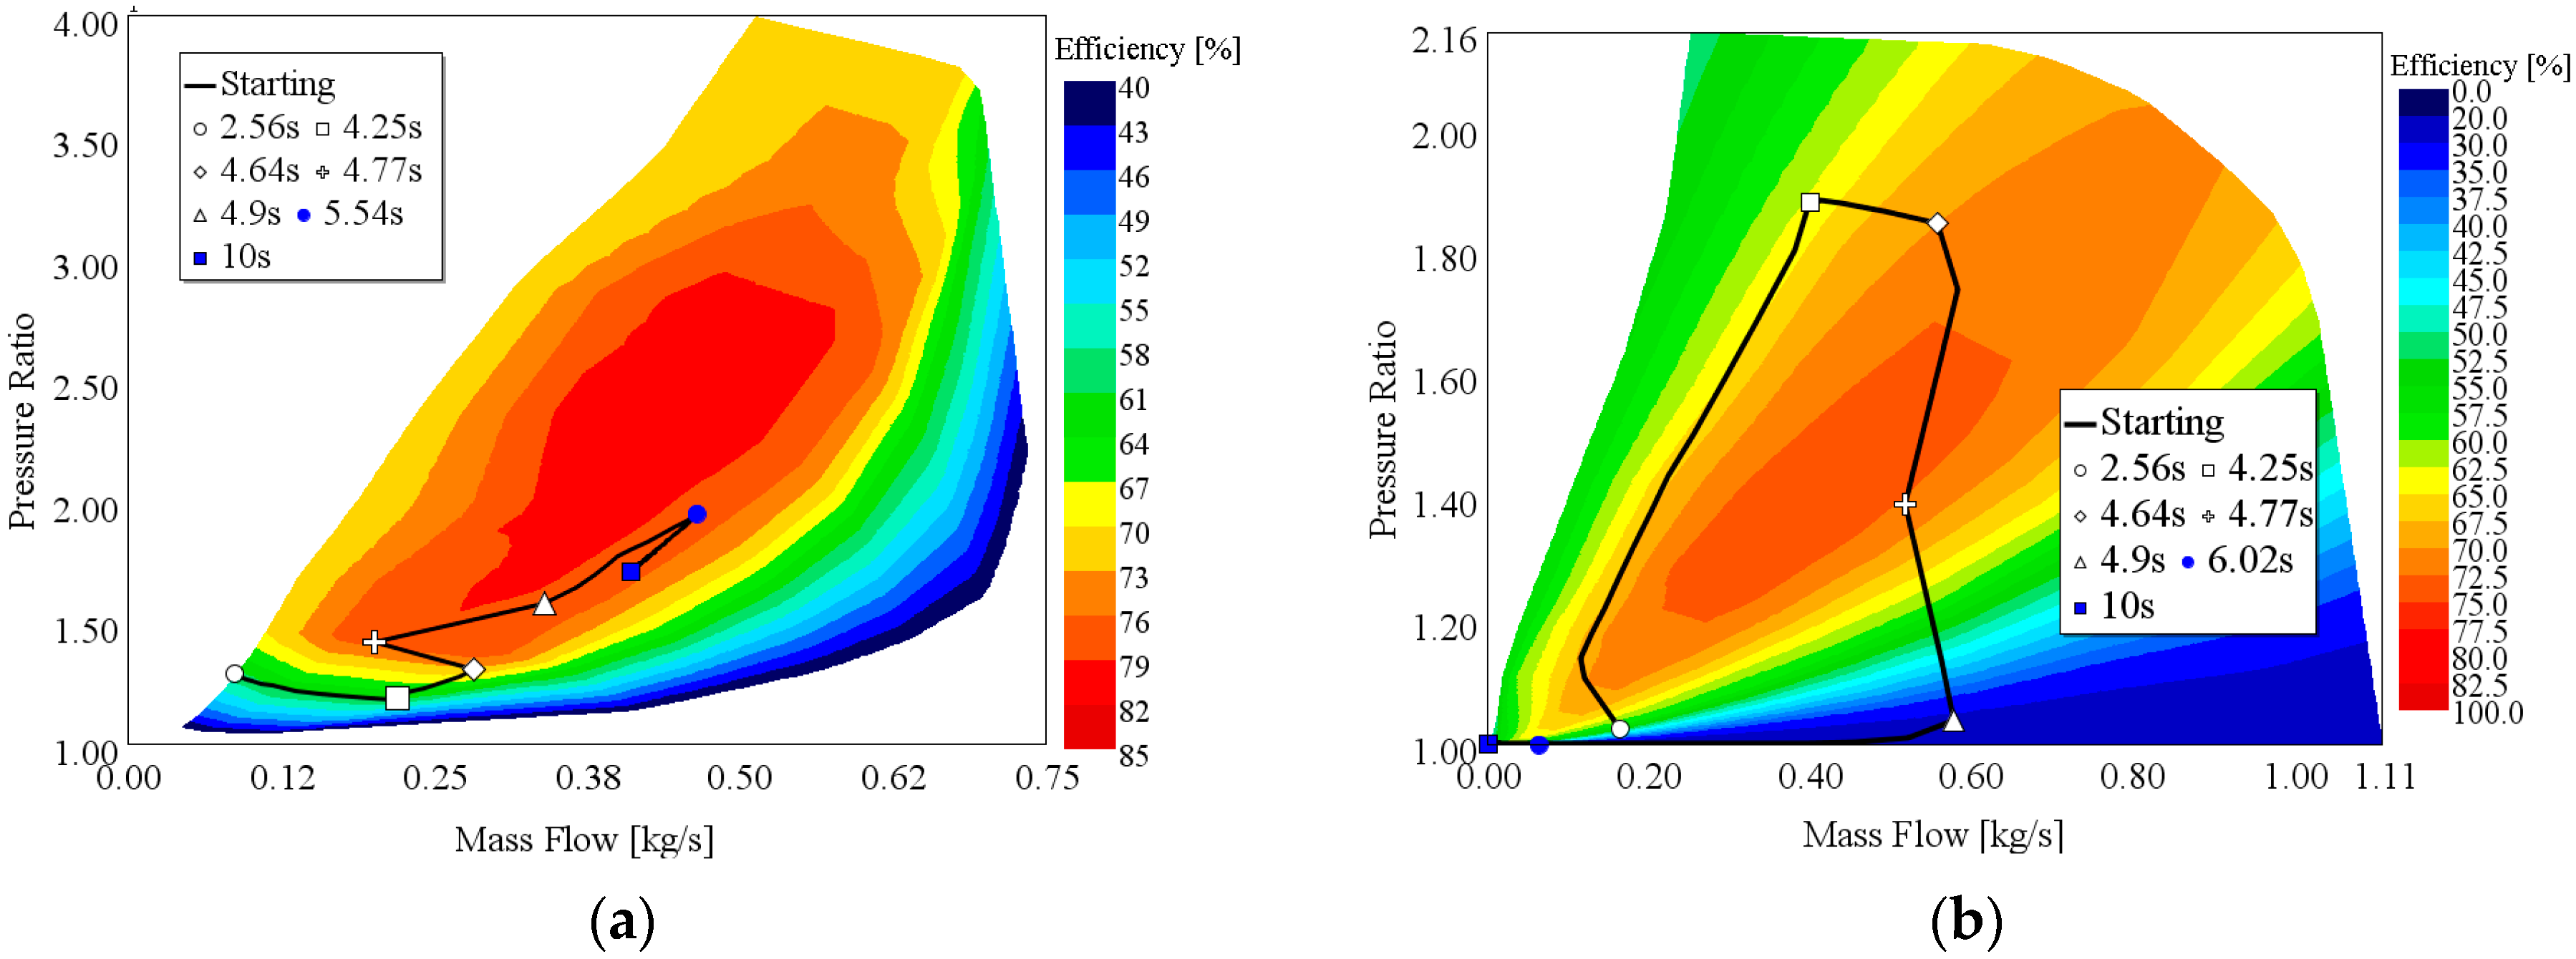
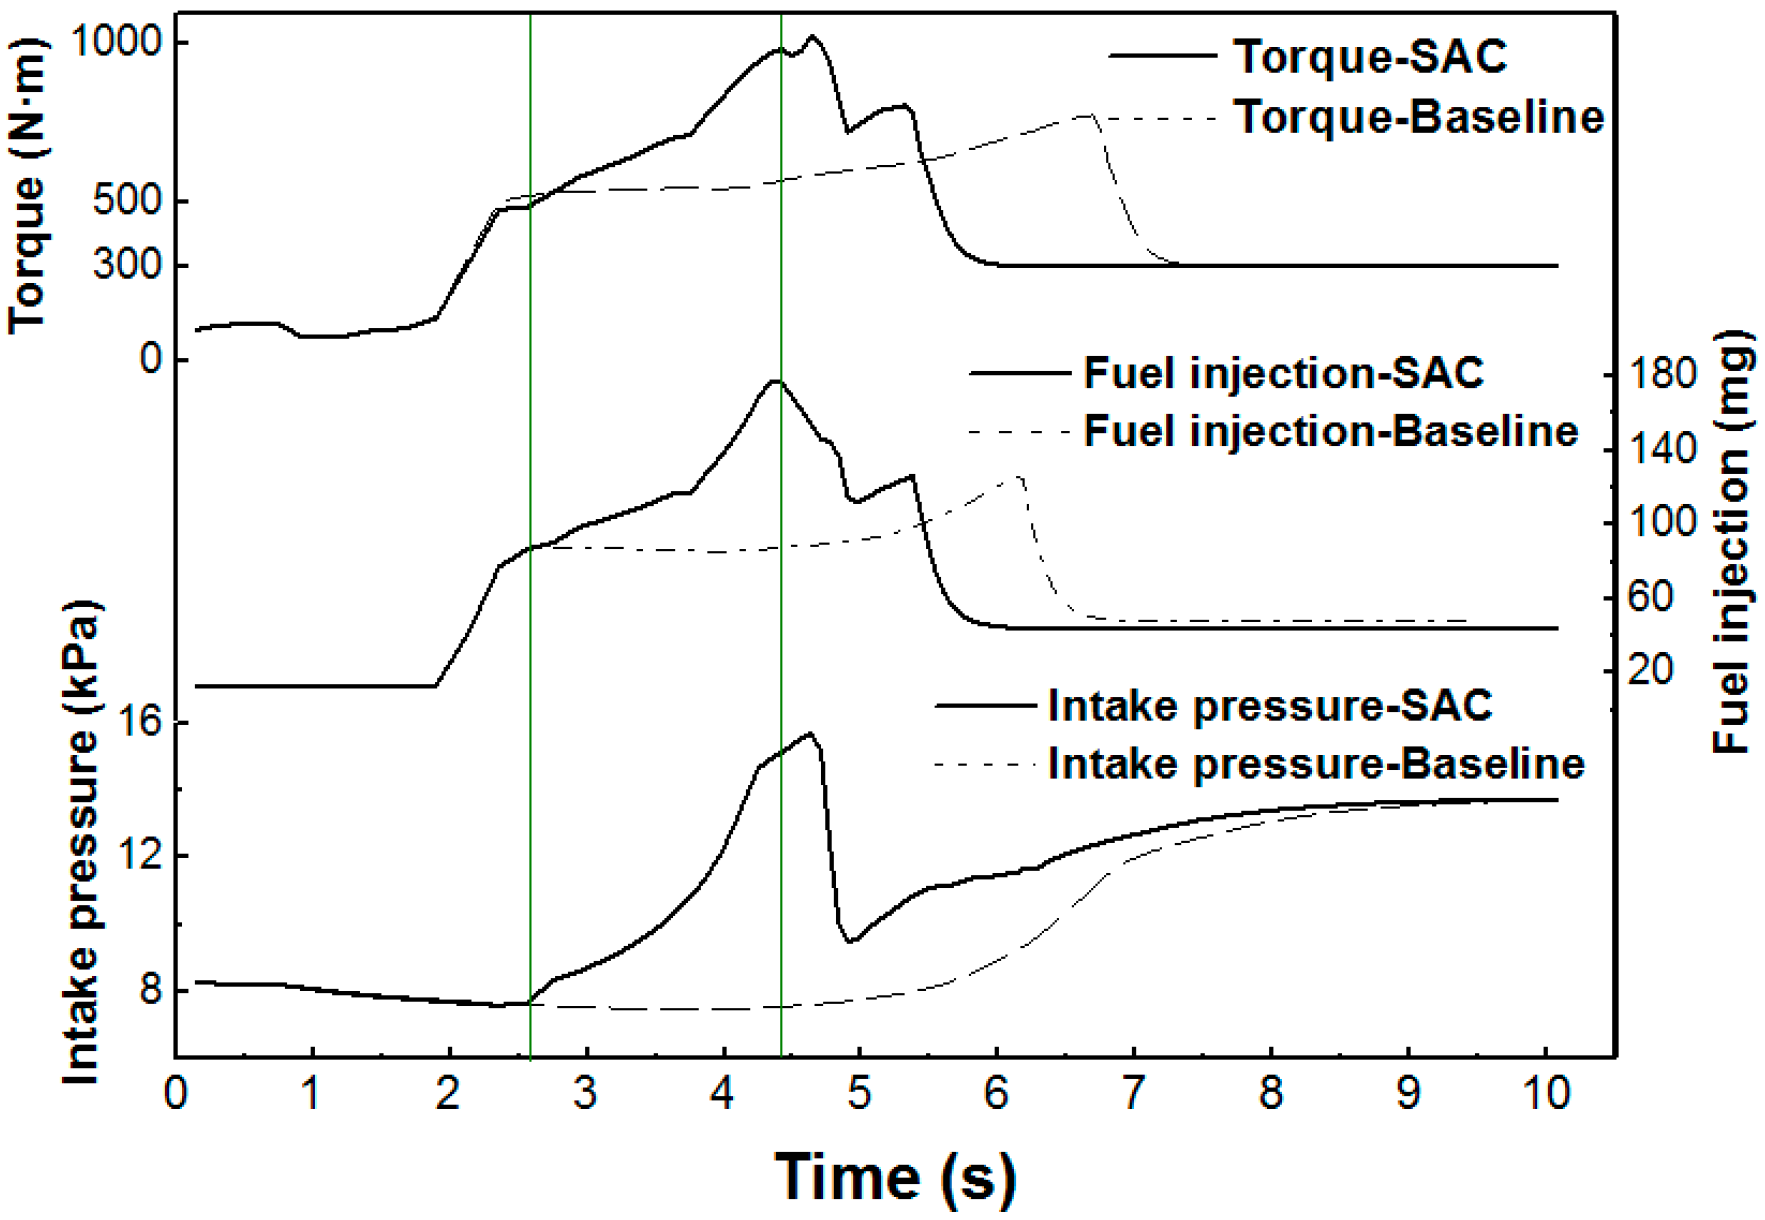
Simulation results during the vehicle starting process are shown in Figure 12, Figure 13, Figure 14 and Figure 15. The initial engine speed is 800 r/min. The clutch engagement process is finished at 1.7 s and then the accelerator pedal is pushed from 0% to 100% within 0.8 s. The engine speed decreases from 800 r/min to 500 r/min at 2.1 s, after that the vehicle starts to speed up until it reaches steady-state.
During the process, the SAC system enters STC mode at 2.7 s while the bypass valve is closed, and then the intake pressure starts to increase. The engine speed speeds up to 1600 r/min at 4.4 s. After that, the SAC system begins switching from STC mode to TC mode. The switching process is finished at 5.4 s. The mode-switch process is marked by an inlet reflux phenomenon which is caused by opening time of the bypass valve. This phenomenon will cause the decrease of intake air mass flow of the compressor which made it tend to surge, and this can be seen from Figure 15a.
4.2.2. Comparison with Original Engine
A similar vehicle model with an original engine is built and run to make a comparison. Comparison results are shown in Figure 13 and Figure 14. The SAC engine speeds up faster than the original one and can reduce the acceleration time by 20%. What’s more, the SAC engine has much higher intake pressure which allows much more fuel to be injected into the cylinder (Figure 14). That is why the torque of the SAC engine is higher than that of the original engine.
5. Conclusions
In this paper, a Speed Adjustable Compound (SAC) supercharging system is proposed to improve performance of the diesel engine working under plateau conditions. The engine simulation model is built based on a zero dimension (0-D) predictable combustion model. The main results of this paper are summarized as follows:
- (1)
- The SAC system is easy to implement and there is no need to change the original boosting system scheme. The speed of the supercharger can be adjusted according to the engine requirements, and high intake pressure is allowed in any situation lacking exhaust energy.
- (2)
- A genetic algorithm (GA) is used to optimize the supercharger speed and fuel injection quantity to improve steady state performance of the engine at 4500 m.
- (3)
- Steady state performance of the SAC engine working at 4500 m has a significantly improvement compared to that of the original engine when the engine speed n < 1600 r/min, whereby the peak torque is increased by 9%. The maximum increment of brake specific fuel consumption (BSFC) is no more than 5%.
- (4)
- Transient simulation shows that the SAC engine can help to reduce the acceleration time of the vehicle by 20% compared to that of the original engine. The SAC engine has better transient performance than a turbocharged diesel engine and has potential to improve the vehicle transient performance and drivability under plateau conditions.
Acknowledgments
The authors acknowledge the assistance of Xilong Zhang and Jie Yang for language. The research is supported by National Science Foundation of China (grant No. 51475043).
Author Contributions
M.X., F.Z. and C.Z. conceived and designed the experiments; M.X. performed the experiments; M.X. and F.Z. analyzed the data; C.Z. contributed reagents/materials/analysis tools; M.X. wrote the paper.” All authors read and approved the manuscript.
Conflicts of Interest
All authors declare no conflict of interest.
Nomenclature
| nsc | Rotate speed of supercharger [r/min] |
| pin | Intake pressure [bar] |
| Pnet | Engine net power [kW] |
| Psc | Power consumed by the supercharger [kW] |
| ntc | Rotate speed of turbocharger [r/min] |
| Tex | Turbine inlet temperature [K] |
| pmax | Peak pressure [bar] |
| 0-D | Zero Dimension |
| SC | Supercharging |
| GA | Genetic Algorithm |
| NN | Neutral Network |
| AFR | Air Fuel Ratio |
| SAC | Speed Adjustable Compound |
| BSFC | Brake Specific Fuel Consumption |
| n | Engine speed |
| TSI | Twin-charger Stratified Injection |
| VGT | Variable Geometry Turbocharger |
| NA | Natural Aspiration |
| STC | Supercharging and Turbocharging |
References
- Liang, L.G.; Jiang, D.M. Some predictions of turbocharged high speed diesel engine performance at high land. Trans. CSICE 1983, 2, 1–18. [Google Scholar]
- Liu, R.L.; Zhou, G.M.; Li, J.; Dong, S.R.; Ping, Z.; Fei, G.E. Calibration of common-rail diesel engine at high altitudes under full load operating conditions. J. Combust. Sci. Technol. 2012, 18, 199–205. [Google Scholar]
- Zhu, Z.X.; Zhang, F.J.; Han, K.; Liu, Y.Y.; Luo, G.L.; Yun-Long, L.I. Adaption of fuel injection parameters for turbocharged diesel engines working at high altitude. Acta Armamentarii 2014, 35, 583–589. [Google Scholar]
- Galindo, J.; Climent, H.; Guardiola, C.; Doménech, J. Strategies for improving the mode transition in a sequential parallel turbocharged automotive diesel engine. Int. J. Automot. Technol. 2009, 10, 141–149. [Google Scholar] [CrossRef]
- Li, W. Study on Adaptability of CA6110/125Z1A2 turbocharged diesel engine in Qing Zang Plateau. Automob. Technol. 2001, 7, 5–12. [Google Scholar]
- Zhang, H.; Zhuge, W.; Zhang, Y.; Hu, L. Study of the control strategy of the plateau self-adapted turbocharging system for diesel engine. Sae International Powertrains, Fuels and Lubricants Congress 2008. 2008-01-1636. [Google Scholar]
- Liu, X.H.; Wei, M.S.; Ma, C.C.; Shi, X. Simulation on one-stage and two-stage turbocharged diesel engines at different altitudes. Trans. CSICE 2010, 28, 447–452. [Google Scholar]
- Knirsch, D.I.S.; Weiss, D.I.U.; Zülch, D.I.S. Electric supercharging in the Audi RS 5 TDI concept. MTZ Worldw. 2015, 76, 14–19. [Google Scholar] [CrossRef]
- Matsura, Y.; Nakazawa, N.; Kobayashi, Y.; Ogita, H.; Kawatani, T. Effects of various methods for improving vehicle startability and transient response of turbocharged diesel trucks. Int. Congr. Expos. 1992, 920044. [Google Scholar]
- Schmitz, T.N.; Holloh, K.D.; Jurgens, R. Potential of additional mechanical supercharging for commercial vehicle engines. Ground Veh. Sect. 1994, 942268. [Google Scholar]
- Han, K.; Zhu, Z.X.; Zhang, F.J.; Yun-Long, L.I.; Geng, F.U.; Zhang, Z.Y. Research on composite adjustable supercharged program of diesel engine for power recovery at plateau. Acta Armamentarii 2013, 34, 129–136. [Google Scholar]
- Rose, A.; Akehurst, S.; Brace, C.J. Modelling the performance of a continuously variable supercharger drive system. Proc. Inst. Mech. Eng. Part D. J. Automob. Eng. 2011, 225, 1399–1414. [Google Scholar] [CrossRef]
- Bhinder, F.S. Supercharging compressors-problems and potential of the various alternatives. SAE Int. Congr. Expos. 1984, 840243. [Google Scholar]
- George, S.; Morris, G.; Dixon, J.; Pearce, D.; Heslop, G. Optimal boost control for an electrical supercharging application. SAE Tech. Pap. 2004. 2004-01-0523. [Google Scholar]
- Zhu, Z.X.; Zhang, F.J.; Li, C.J.; Han, K. Calibration for fuel injection parameters of the diesel engine working at plateau via simulating. Adv. Mech. Eng. 2014, 1, 1–8. [Google Scholar] [CrossRef]
- Galindo, J.; Luján, J.M.; Serrano, J.R.; Hernández, L. Combustion simulation of turbocharger HSDI diesel engines during transient operation using neural networks. Appl. Therm. Eng. 2005, 25, 877–898. [Google Scholar] [CrossRef]
- Serrano, J.R.; Arnau, F.J.; Dolz, V.; Piqueras, P. Methodology for characterization and simulation of turbocharged diesel engines combustion during transient operation, Part 1: Data acquisition and post-processing. Appl. Therm. Eng. 2009, 29, 142–149. [Google Scholar] [CrossRef]
- Serrano, J.R.; Climent, H.; Guardiola, C.; Piqueras, P. Methodology for characterisation and simulation of turbocharged diesel engines combustion during transient operation, Part 2: Phenomenological combustion simulation. Appl. Therm. Eng. 2009, 29, 150–158. [Google Scholar] [CrossRef]
- Zhu, Z.X.; Zhang, F.J.; Wu, T.T.; Han, K.; Liu, Y.Y.; Peng, Q. Zero-D predictable combustion model based on neural network and modeling. Trans. CSICE 2015, 33, 163–170. [Google Scholar]
- Kalogirou, S.A. Artificial intelligence for the modeling and control of combustion processes: A review. Prog. Energy Combust. Sci. 2003, 29, 515–566. [Google Scholar] [CrossRef]
- Zhu, Z.; Zhang, F.; Li, C.; Wu, T.; Han, K.; Lv, J. Genetic algorithm optimization applied to the fuel supply parameters of diesel engines working at plateau. Appl. Energy 2015, 157, 789–797. [Google Scholar] [CrossRef]
Figure 1.
System schematic of SAC system.

Figure 2.
The influence of nsc to pmax, Tex, AFR, and pin.

Figure 3.
The influence of nsc to Pnet and Psc.

Figure 4.
System block diagram.

Figure 5.
Full load optimization results: (a) Torque; (b) Fuel; (c) Air mass flow; (d) nsc.

Figure 6.
Full load optimization results: BSFC.

Figure 7.
Full load optimization results. (a) Supercharger; (b) Turbocharger.

Figure 8.
Full load optimization results. Turbine inlet temperature Tex.

Figure 9.
Full load optimization results. AFR.

Figure 10.
nsc of overall working conditions.

Figure 11.
Vehicle simulation model.

Figure 12.
Vehicle starting process simulation results. nsc, bypass valve, pedal, clutch.

Figure 13.
Vehicle starting process simulation results. Torque, Fuel injection and Intake pressure.

Figure 14.
Vehicle starting process simulation results. Engine speed and AFR.

Figure 15.
Vehicle starting process simulation results: (a) Compressor; (b) Supercharger.

Table 1.
Parameters of the SC driven system.
| Parameter | Value |
|---|---|
| Belt driven ratio | 1.4 |
| Belt type | V-type |
| Motor speed | 0~6000 rpm |
| Motor power | 20 Kw |
| Drive ratio of SC | 7.5 |
| Max drive efficiency of SC | 0.97 |
Table 2.
Engine parameters.
| Parameter | Value |
|---|---|
| Bore | 132 mm |
| Stroke | 145 mm |
| Compression ratio | 17:1 |
| Maximum torque | 1980 N.m@1300 r/min |
| pmax | 160 bar |
| Maximum of Tex | 1023 K |
Table 3.
Input parameters for optimization.
| Parameter | Minimum | Maximum |
|---|---|---|
| Fuel injection quantity (mg/cycle/cyl) | 20 | 220 |
| Supercharger speed (r/min) | 0 | 90,000 |
Table 4.
Parameters of GA.
| Parameter | Value |
|---|---|
| Population size | 20 |
| Crossover proportion | 0.98 |
| Mutation rate | 0.01 |
| Error limit (e) | 0.005 |
Table 5.
Vehicle Specifications.
| Parameter | Value |
|---|---|
| Car mass (kg) | 16,000 |
| Wheel radius (mm) | 300 |
| Rolling resistance coefficient | 0.05 |
| Power consumption ratio of accessory | 0.15 |
| First gear ratio | 2.68 |
| Main reducer’s gear radio | 4.74 |
| Gearbox transmission efficiency | 0.92 |
© 2017 by the authors. Licensee MDPI, Basel, Switzerland. This article is an open access article distributed under the terms and conditions of the Creative Commons Attribution (CC BY) license (http://creativecommons.org/licenses/by/4.0/).
Share and Cite
MDPI and ACS Style
Xia, M.; Zhao, C.; Zhang, F.; Huang, Y. Modeling the Performance of a New Speed Adjustable Compound Supercharging Diesel Engine Working under Plateau Conditions. Energies 2017, 10, 689. https://doi.org/10.3390/en10050689
AMA Style
Xia M, Zhao C, Zhang F, Huang Y. Modeling the Performance of a New Speed Adjustable Compound Supercharging Diesel Engine Working under Plateau Conditions. Energies. 2017; 10(5):689. https://doi.org/10.3390/en10050689
Chicago/Turabian StyleXia, Meng, Changlu Zhao, Fujun Zhang, and Ying Huang. 2017. "Modeling the Performance of a New Speed Adjustable Compound Supercharging Diesel Engine Working under Plateau Conditions" Energies 10, no. 5: 689. https://doi.org/10.3390/en10050689
Note that from the first issue of 2016, this journal uses article numbers instead of page numbers. See further details here.