
Gas Flow Behavior of Nanoscale Pores in Shale Gas Reservoirs

Abstract
:1. Introduction
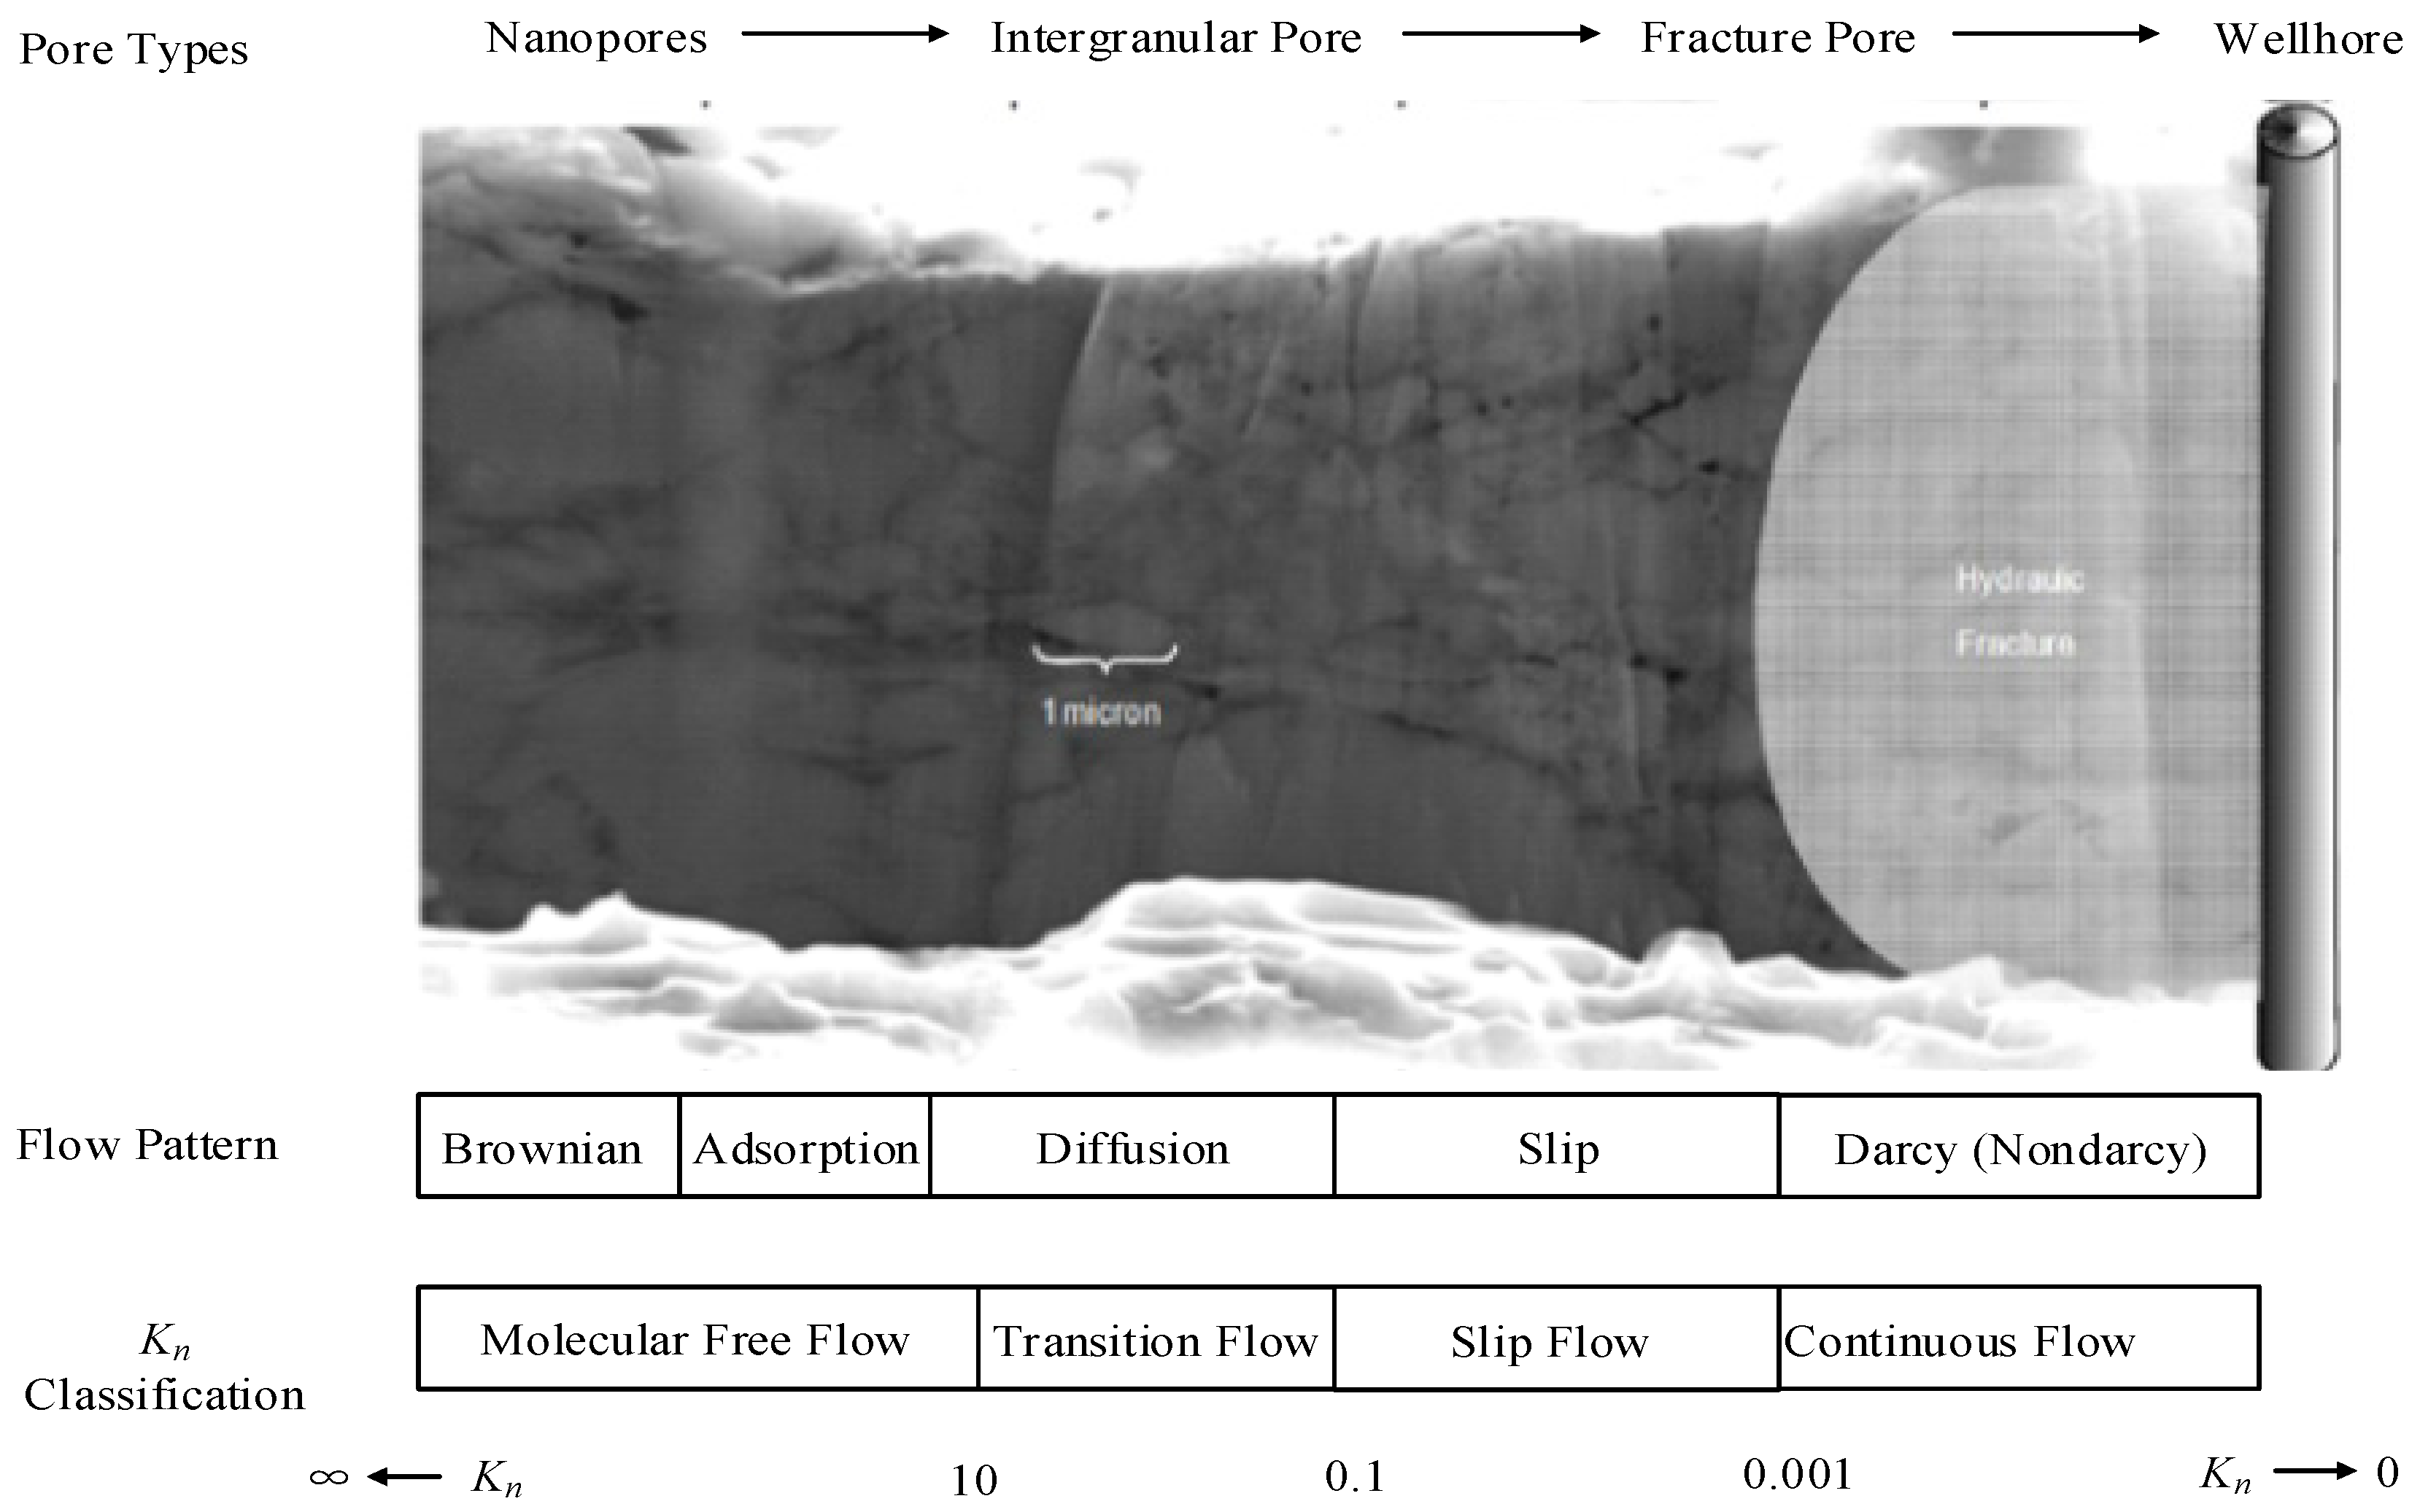
2. Gas Flow Regimes
2.1. Knudsen Number
2.2. Gas Flow Regimes
3. Gas Flow Mathematical Model
3.1. Darcy Flow
3.2. Slip Flow
3.3. Transition Flow
3.4. Molecular Free Flow
4. Mathematical Model with Multi-Flow Regimes
4.1. Gas Mathematical Model
4.2. Case Study
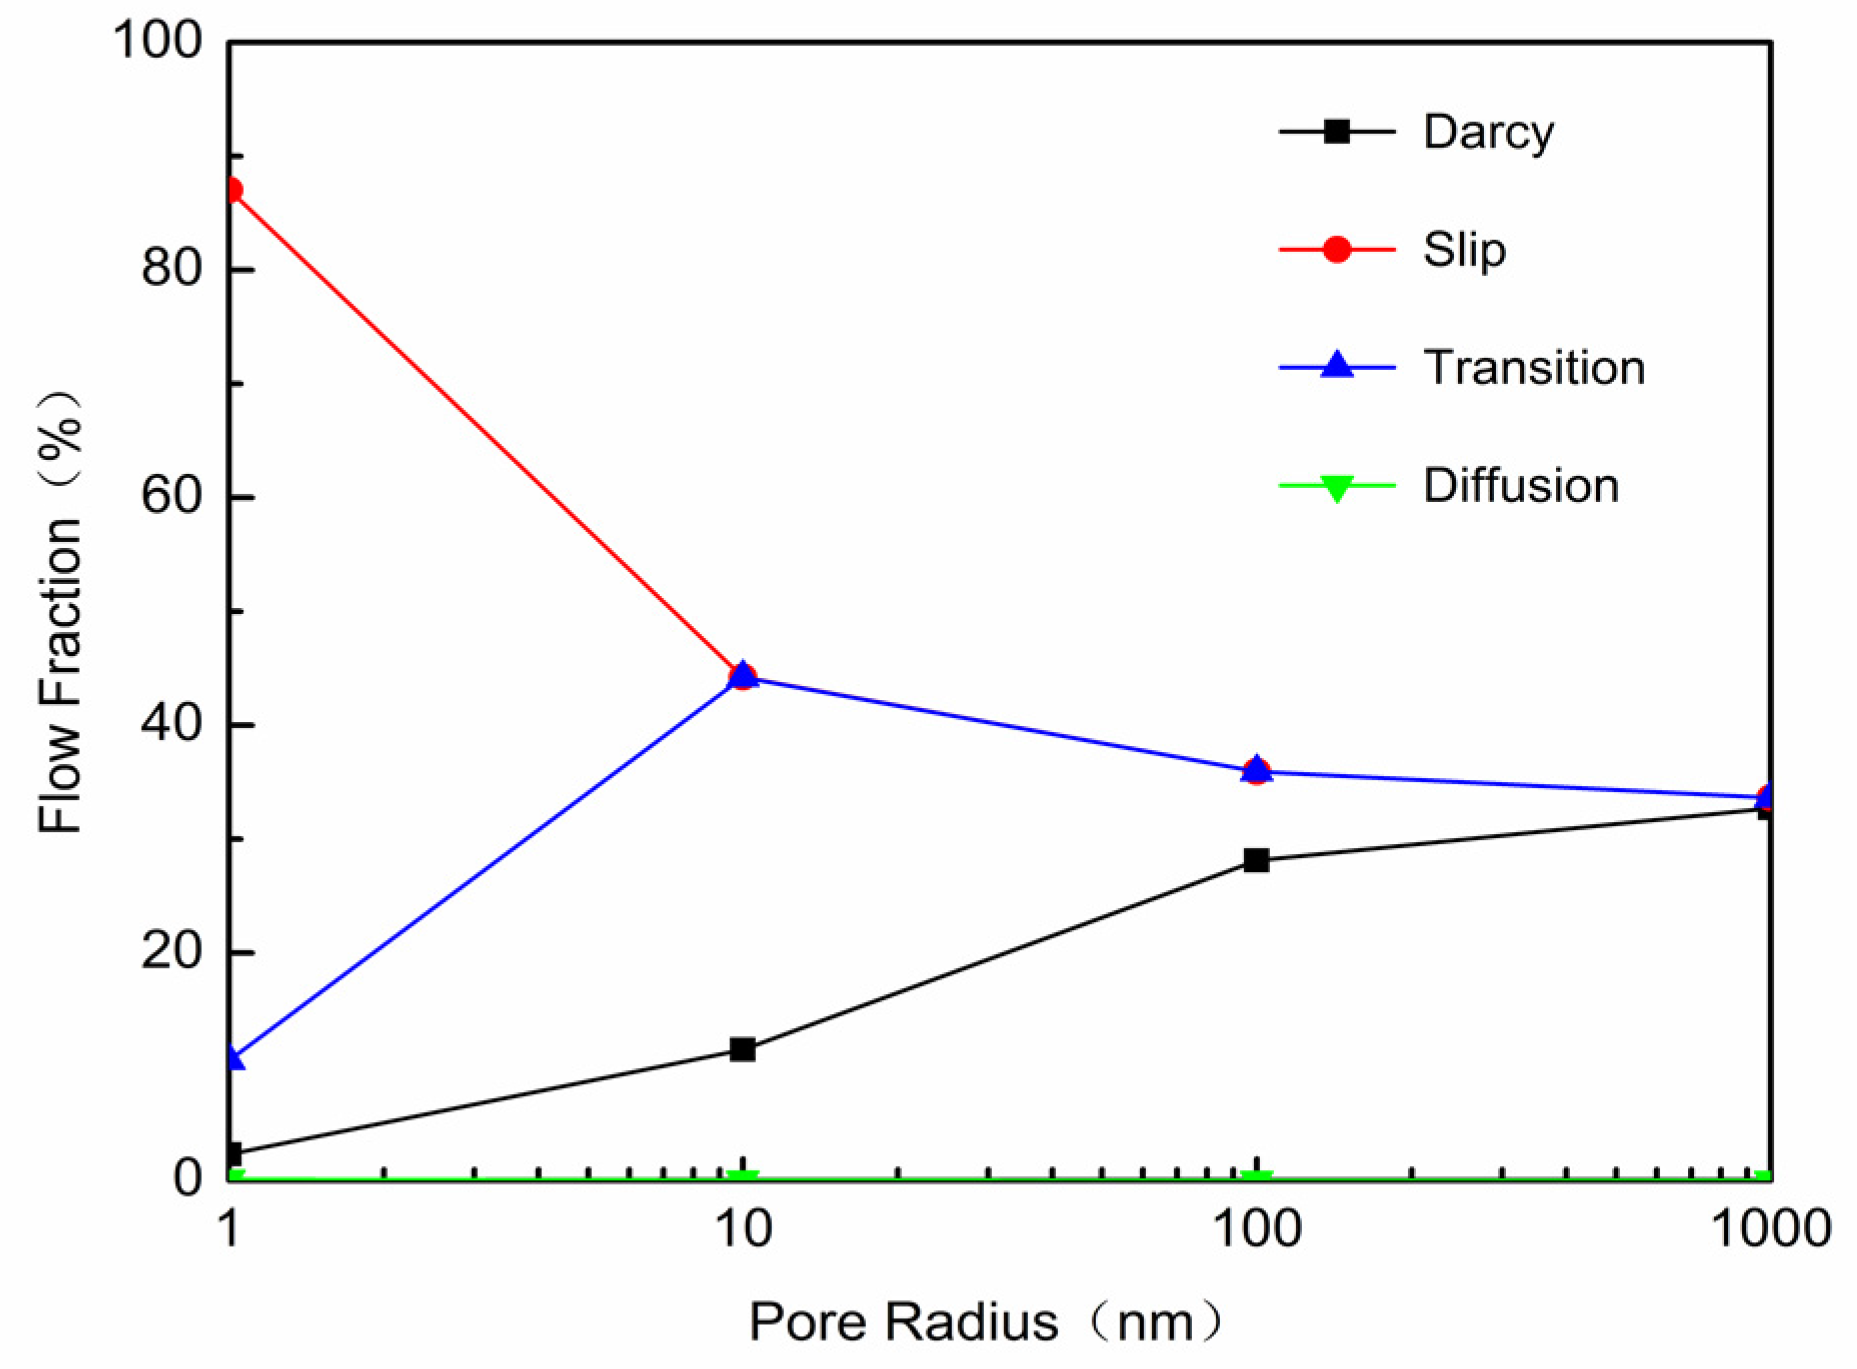
5. Sensitivity Analysis
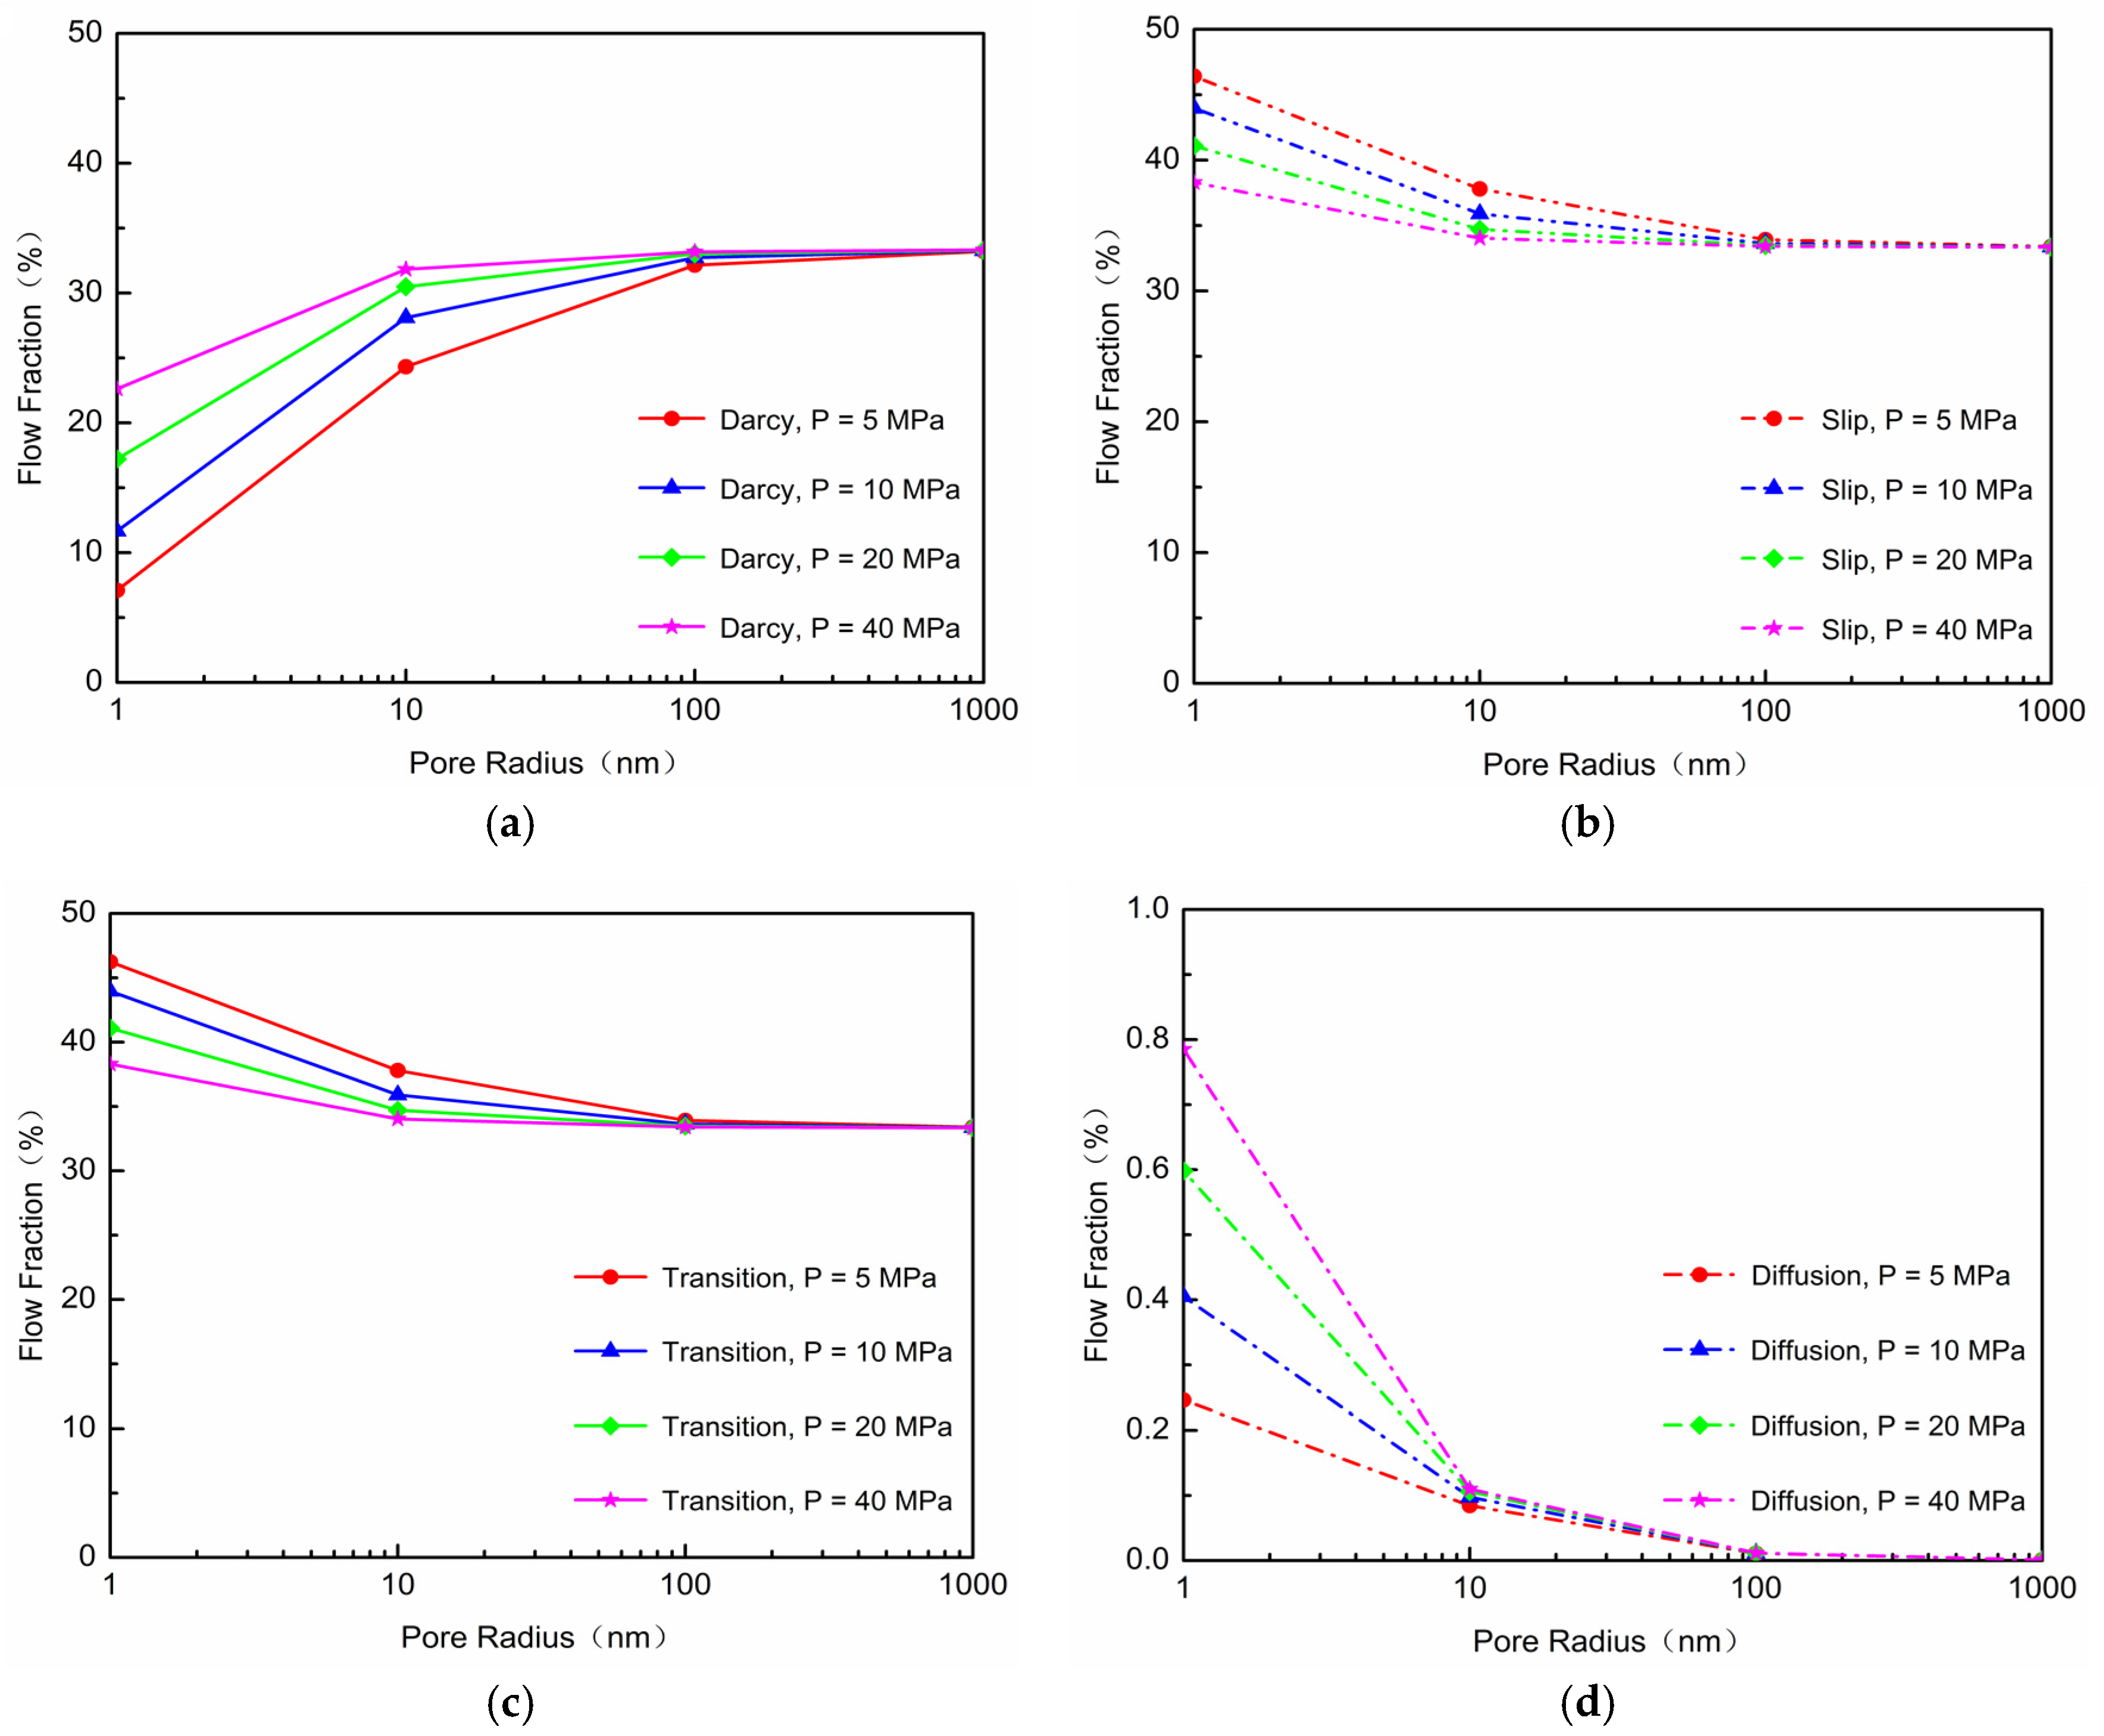
5.1. Effect of Pressure on Flow Regimes
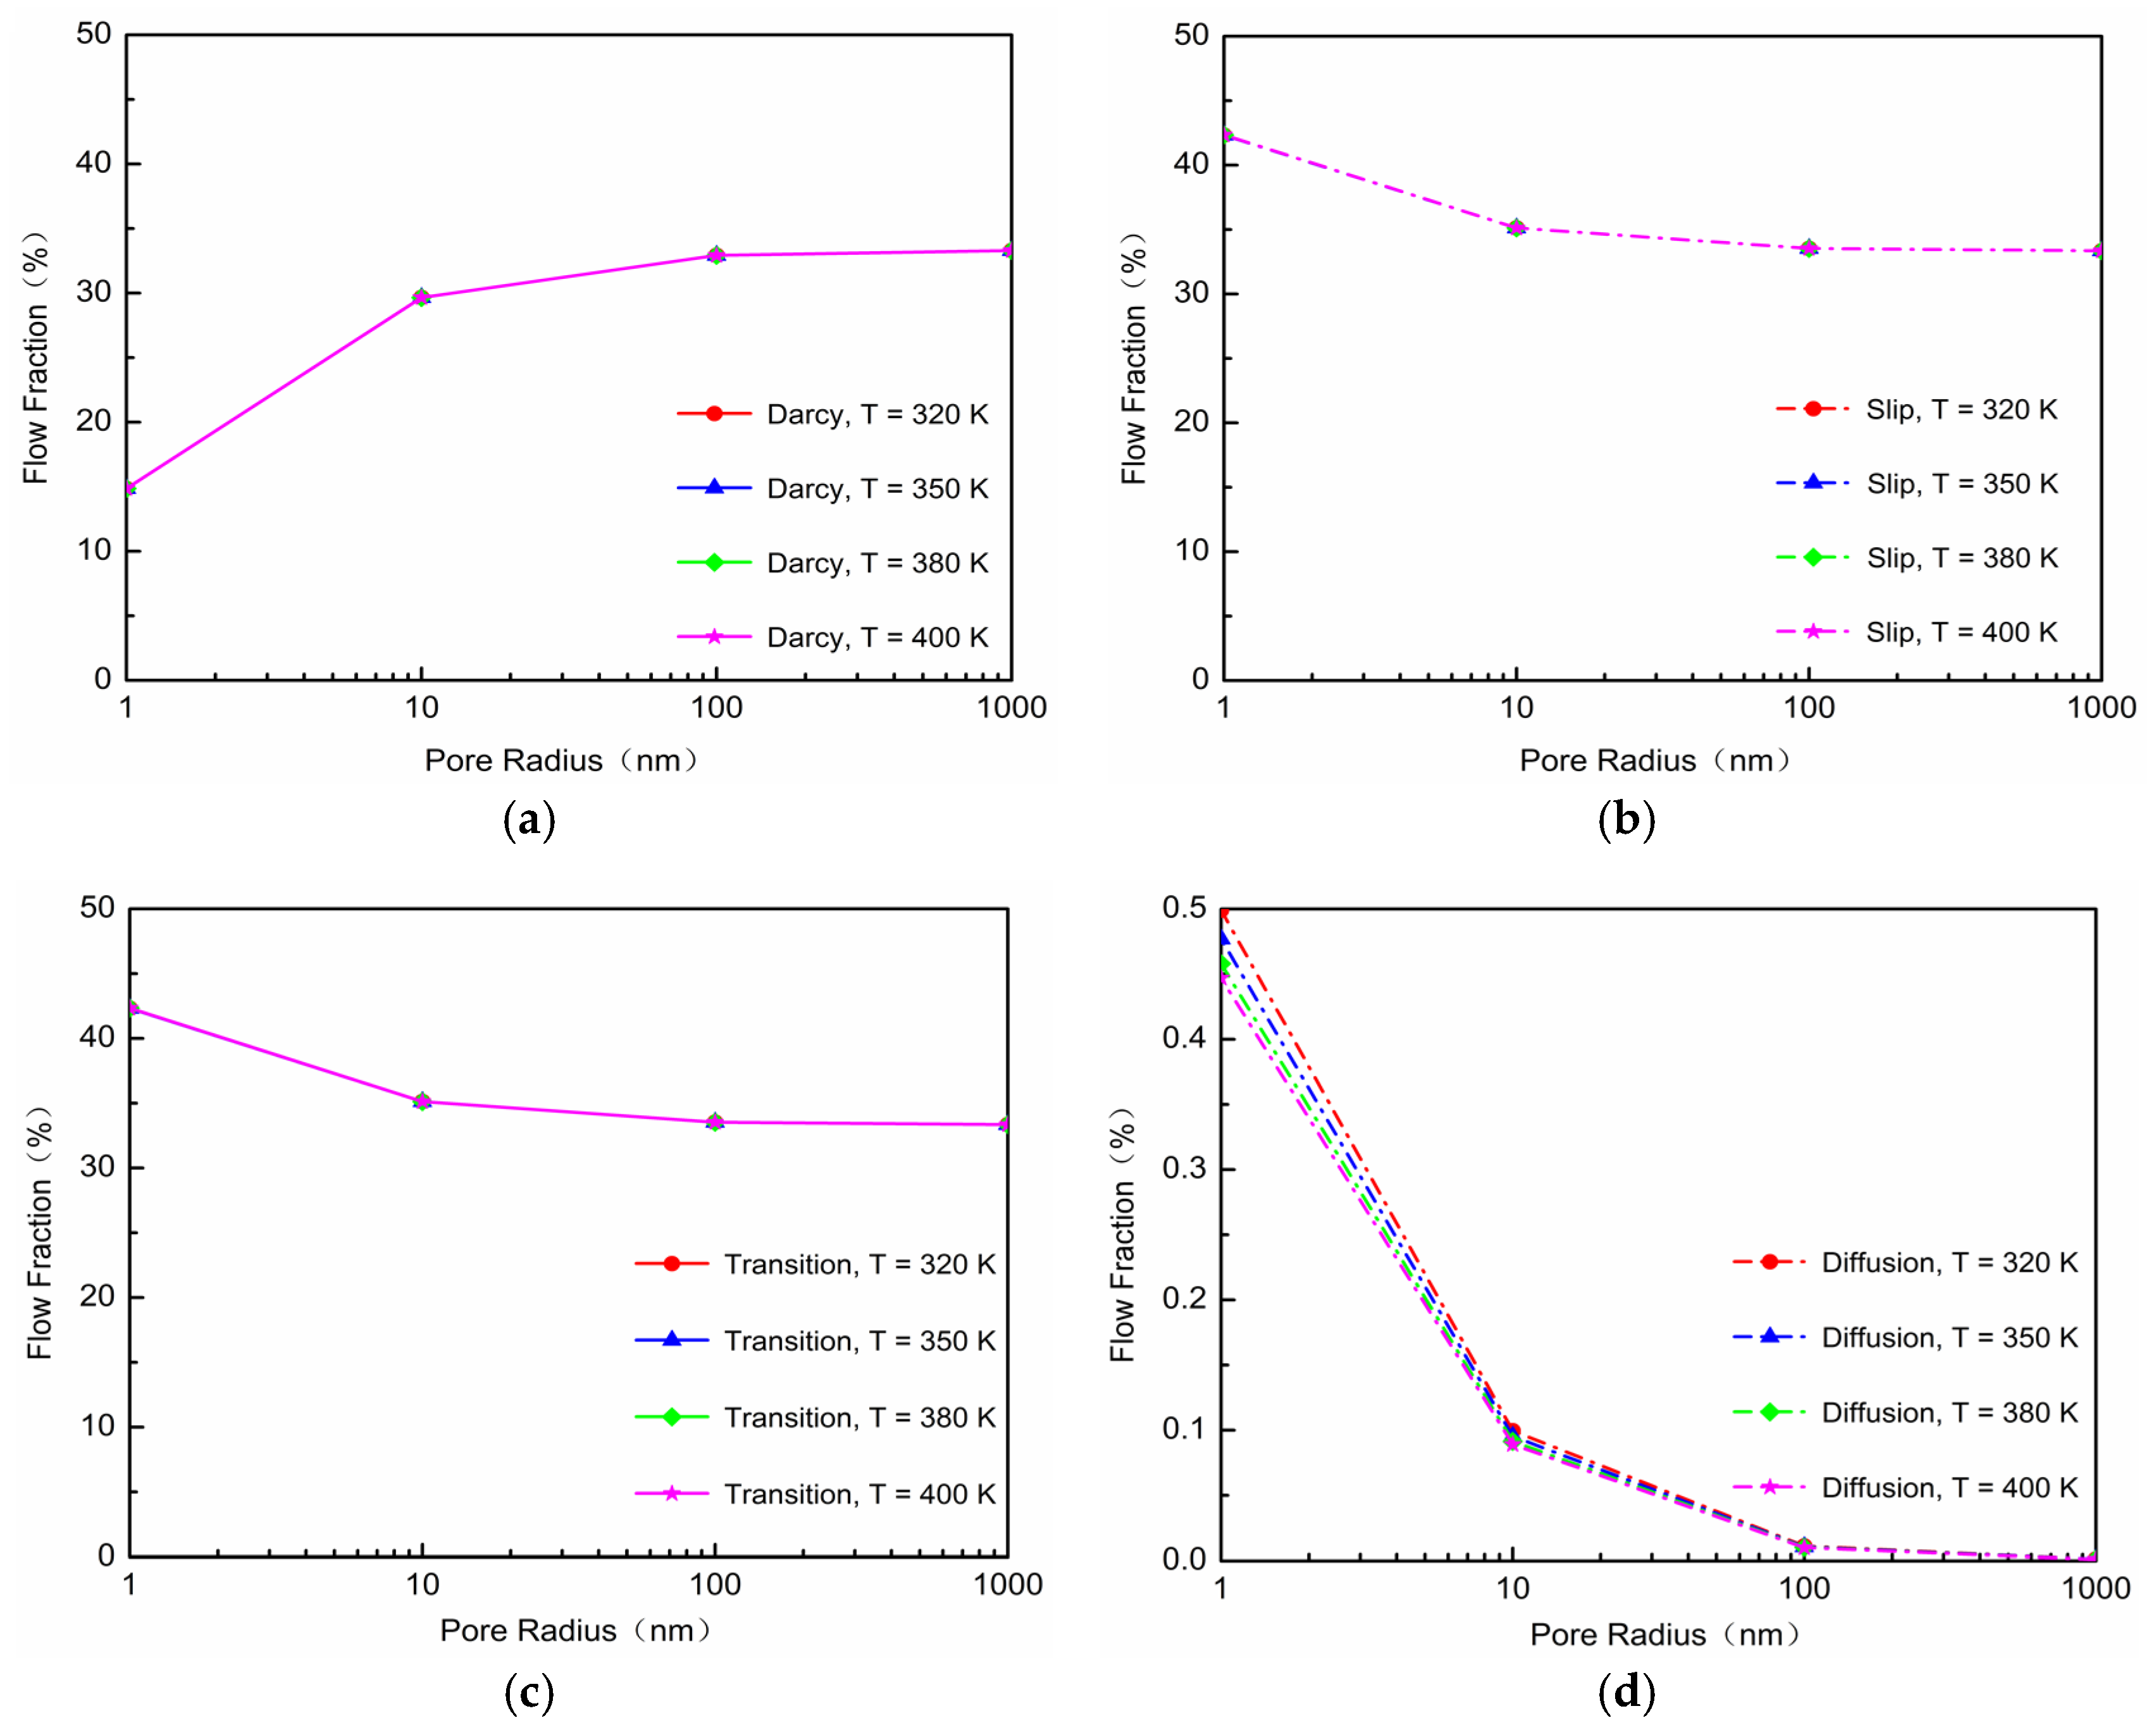
5.2. Effect of Temperature on Flow Regimes
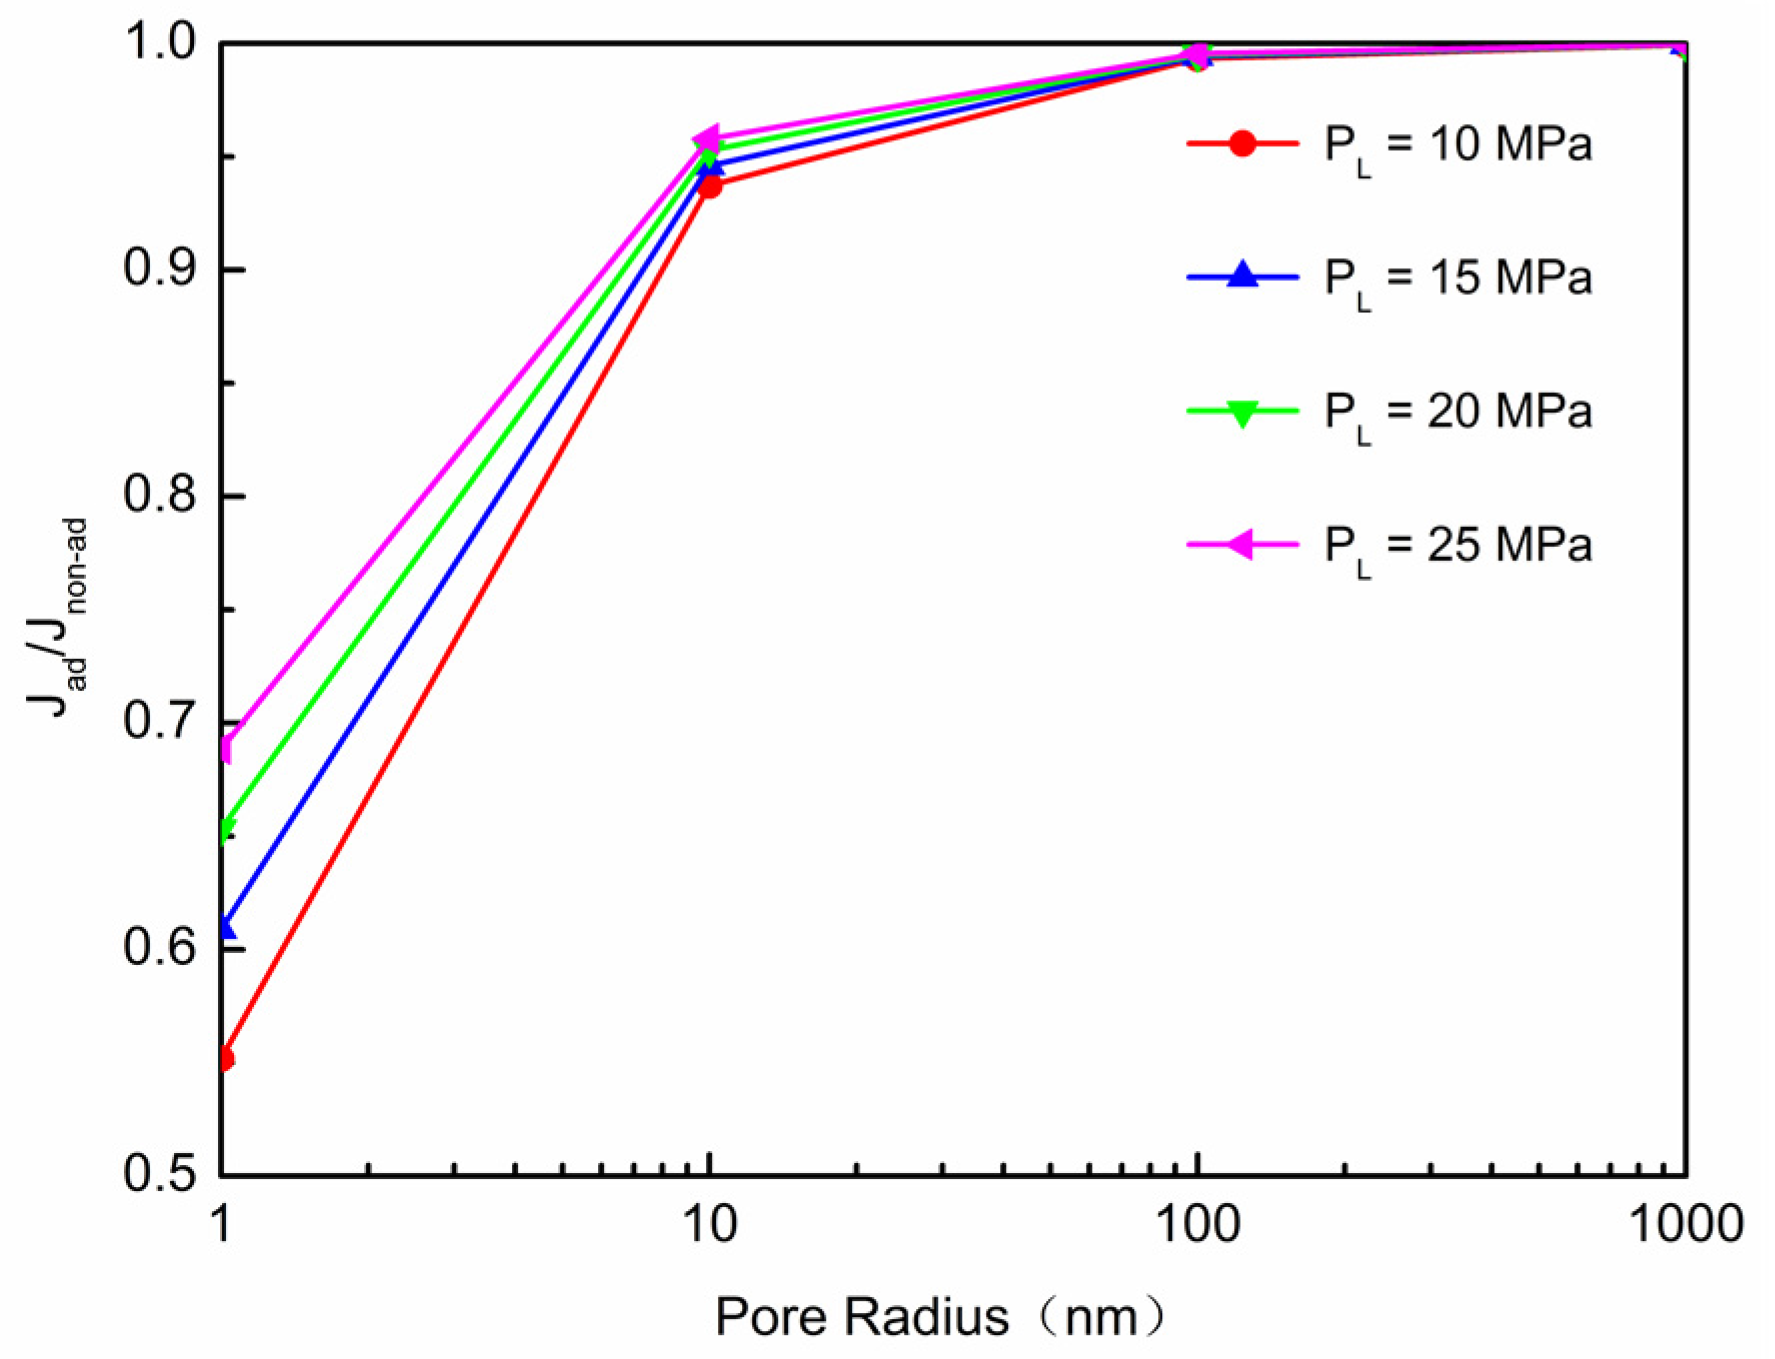
5.3. Effect of Langmuir Pressure
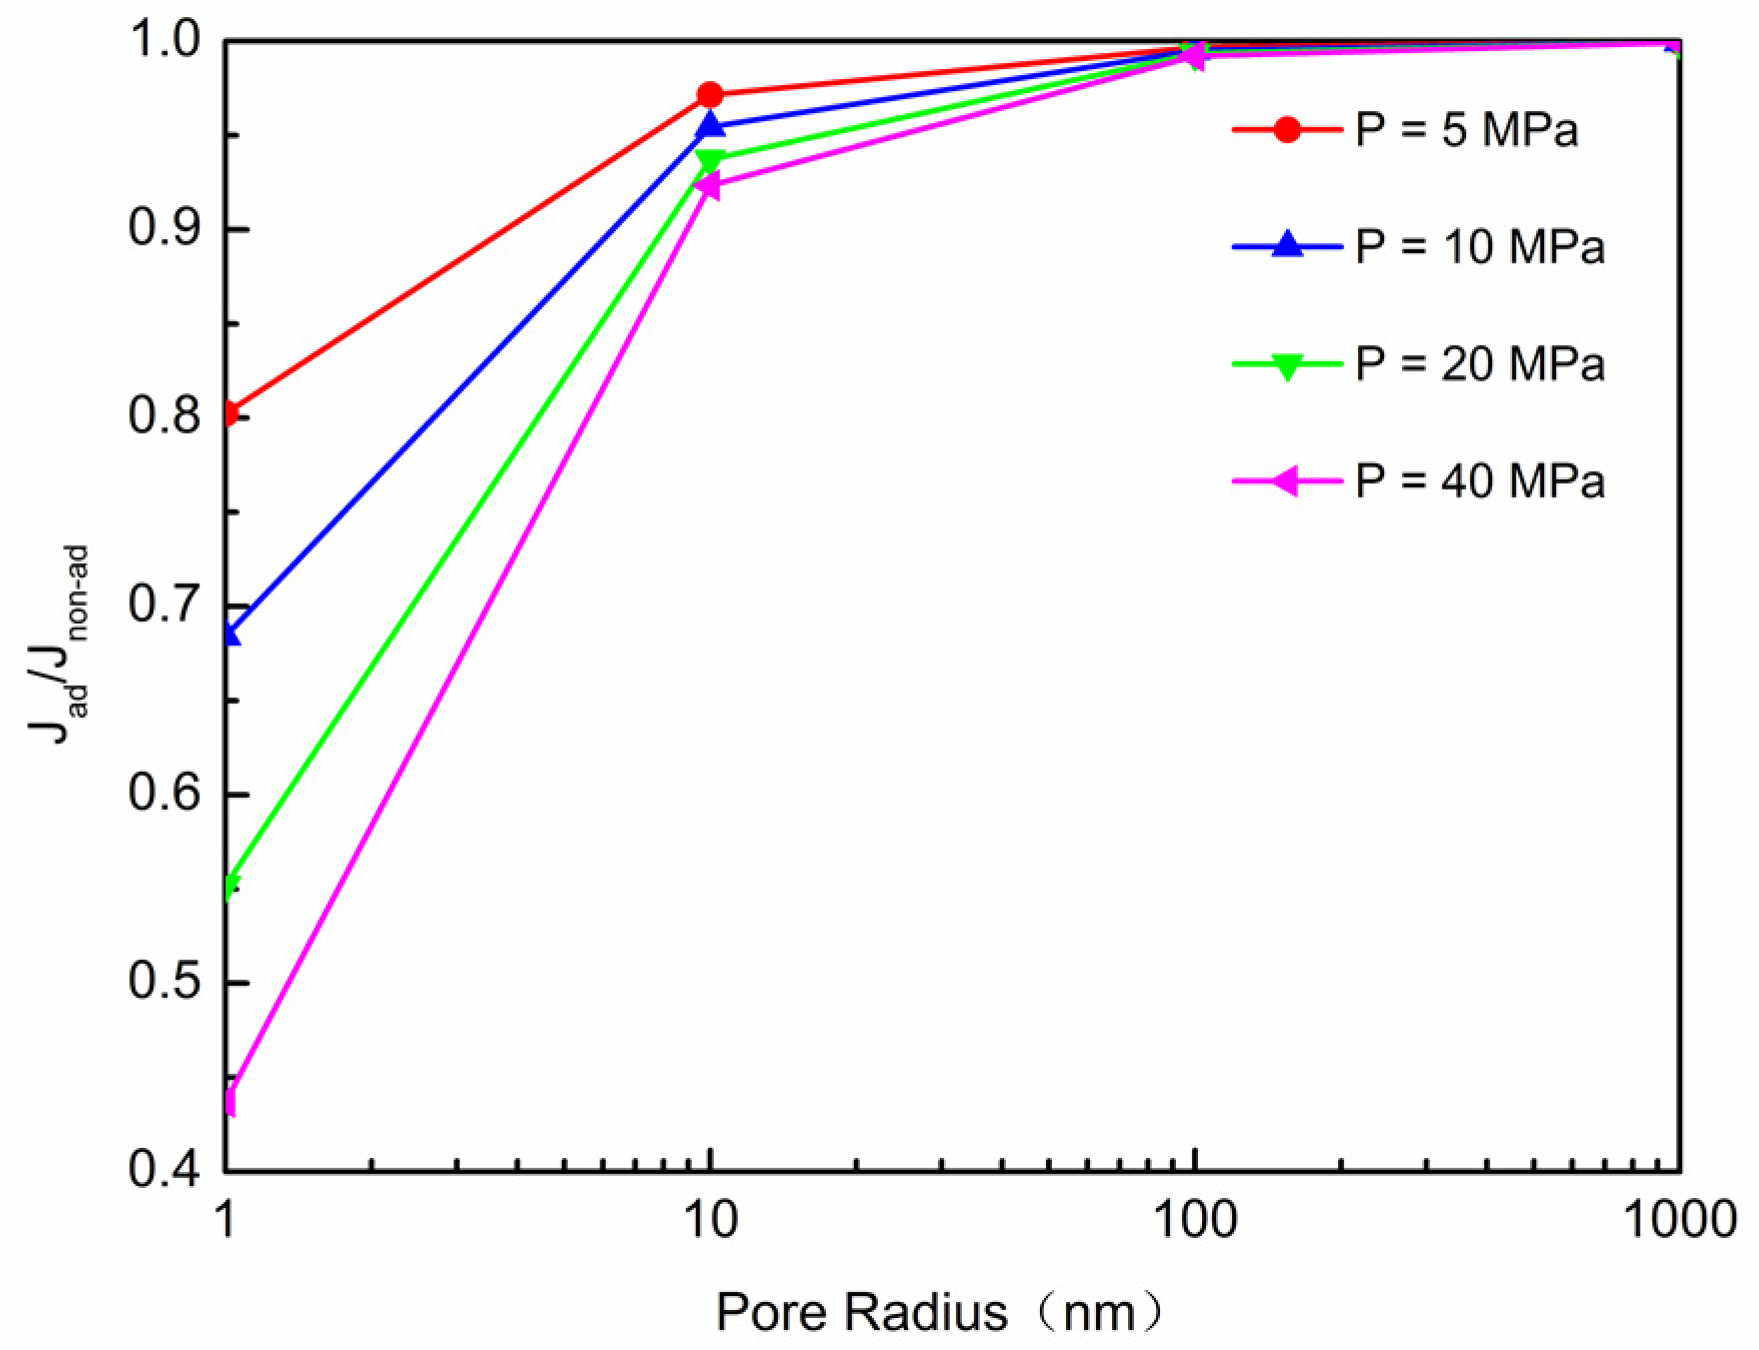
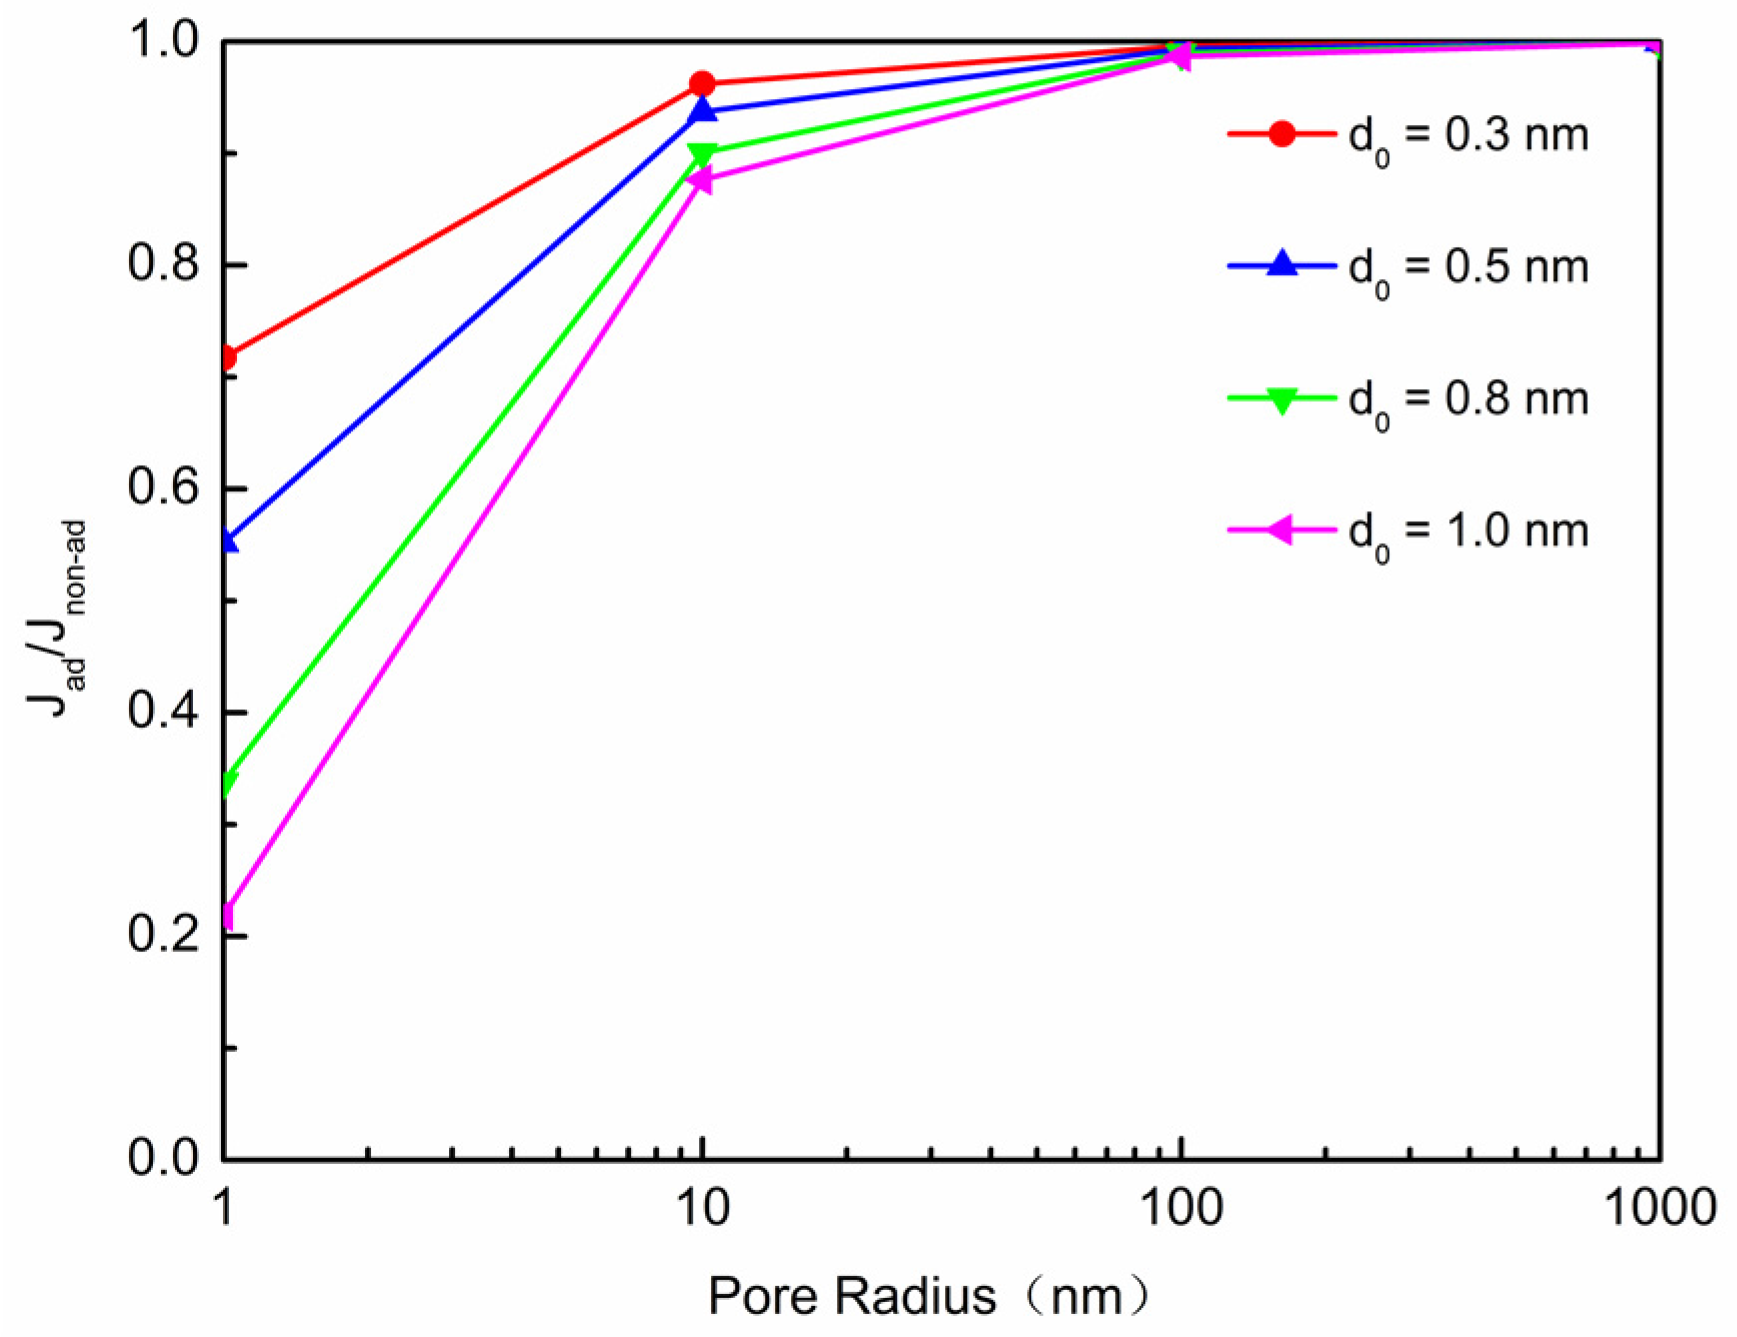
5.4. Effect of Adsorption Thickness
5.5. Effect of Pressure
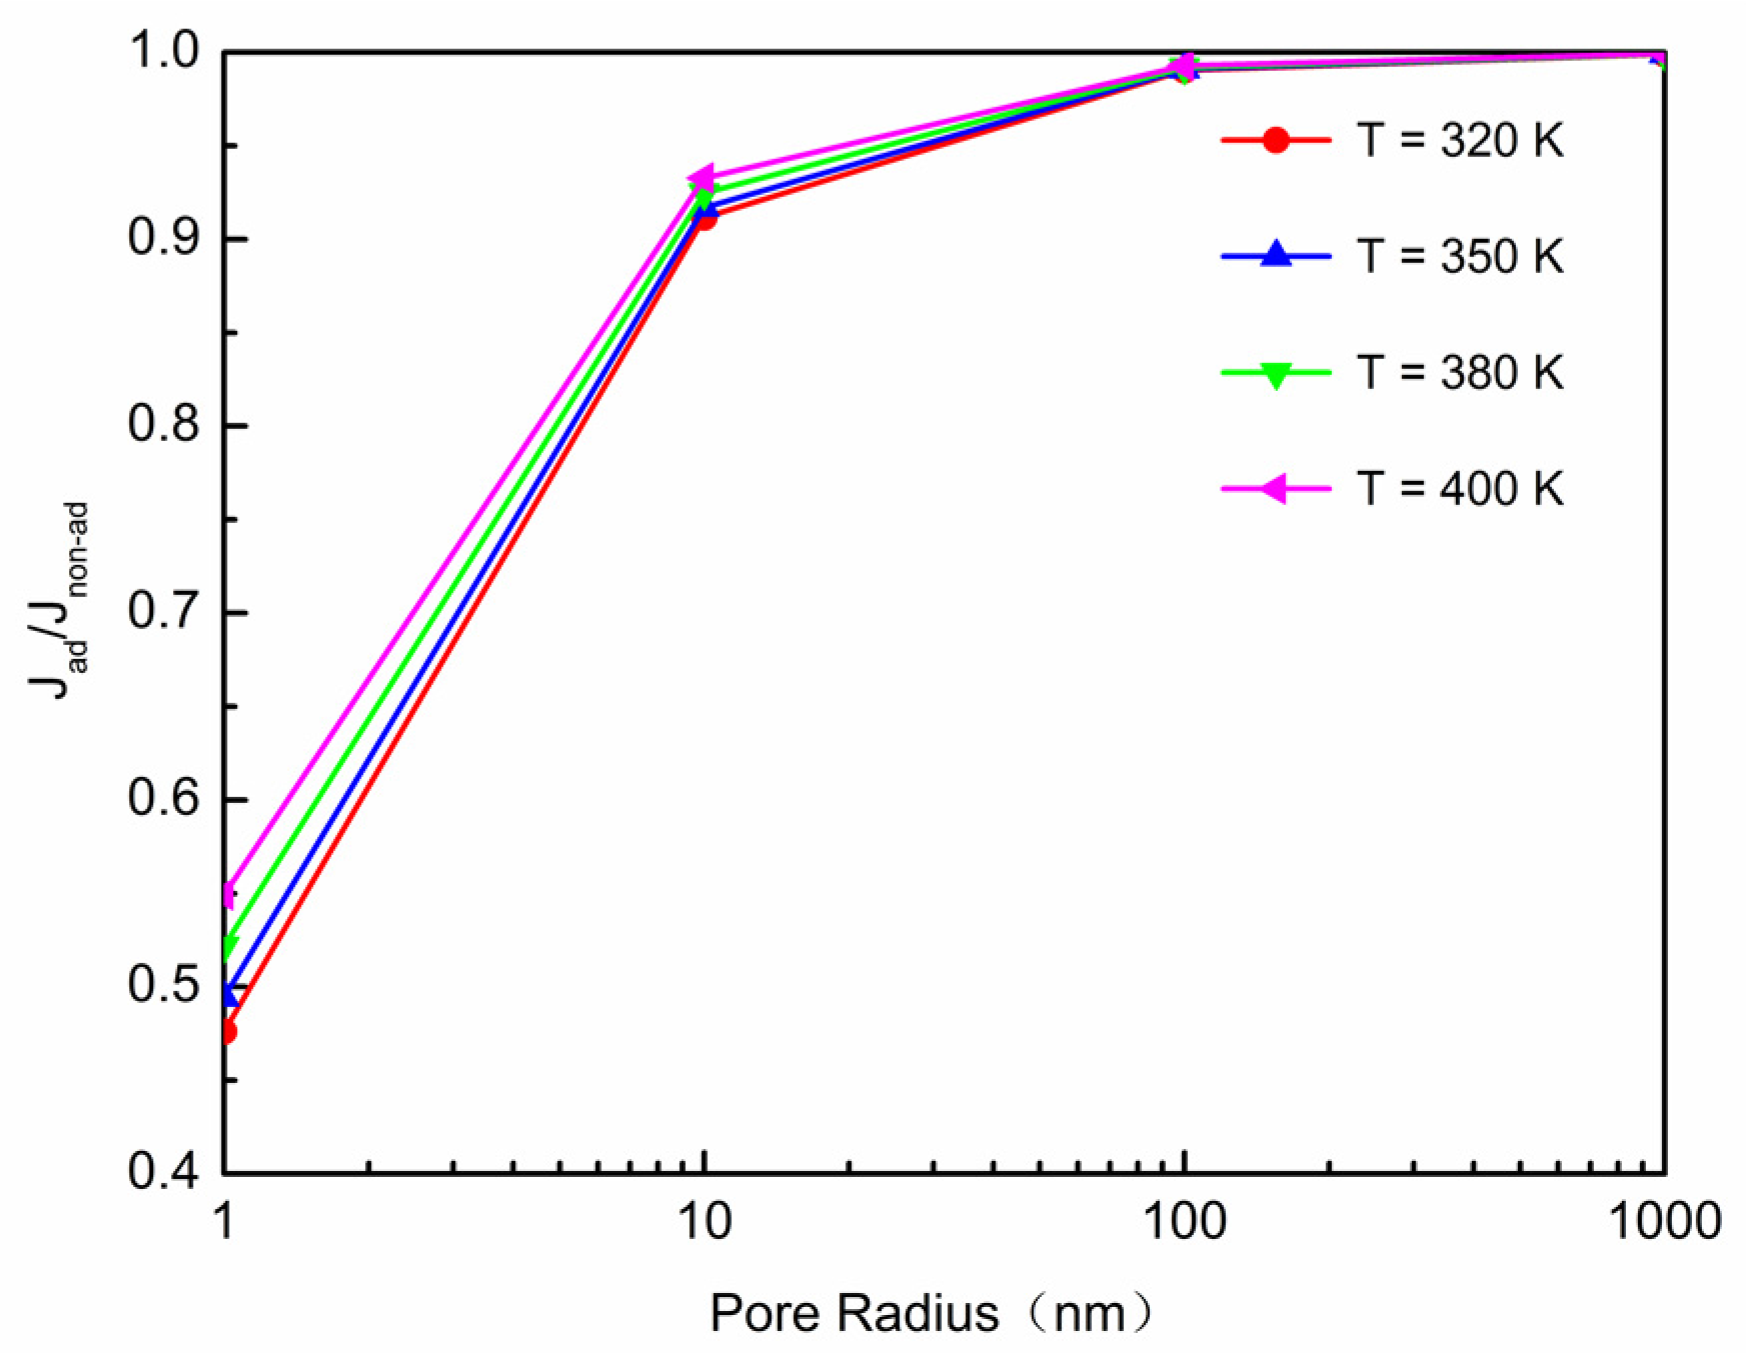
5.6. Effect of Temperature
6. Conclusions
Acknowledgments
Author Contributions
Conflicts of Interest
References
- Shen, W.J.; Zheng, L.G.; Oldenburg, C.M.; Cihan, A.; Wan, J.M.; Tokunaga, T.K. Methane diffusion and adsorption in shale rocks—A numerical study using the dusty gas model in Tough2/EOS7C-ECBM. In Proceedings of the TOUGH Symposium, Lawrence Berkeley National Laboratory, Berkeley, CA, USA, 28–30 September 2015. [Google Scholar]
- Sutton, R.P.; Cox, S.A.; Barree, R.D. Shale gas plays: A performance perspective. In Proceedings of the SPE Tight Gas Completions Conference, San Antonio, TX, USA, 2–3 November 2010. [Google Scholar]
- Shen, W.J.; Wan, J.M.; Kim, Y.; Li, X.Z. Porosity calculation, pore size distribution and mineral analysis within shale rocks: Application of scanning electron microscopy. Electron. J. Geotech. Eng. 2015, 20, 11477–11490. [Google Scholar]
- Shen, W.J.; Xu, Y.M.; Li, X.Z.; Huang, W.G.; Gu, J.R. Numerical simulation of gas and water flow mechanism in hydraulically fractured shale gas reservoirs. J. Nat. Gas Sci. Eng. 2016, 35, 726–735. [Google Scholar] [CrossRef]
- Davies, D.K.; Bryant, W.R.; Vessel, R.K.; Burkett, P.J. Porosity, Permeabilities and Microfabrics of Devonian Shales. In Microstructure of Fine-Grained Sediments; Bennett, R.H., Bryant, W.R., Hulbert, M.H., Eds.; Springer Verlag: New York, NY, USA, 1991; pp. 109–119. [Google Scholar]
- Bustin, R.M.; Bustin, A.M.; Cui, X.; Ross, D.; Pathi, V.M. Impact of Shale Properties on Pore Structure and Storage Characteristics. In Proceedings of the SPE Shale Gas Production Conference, Fort Worth, TX, USA, 16–18 November 2008. [Google Scholar]
- Reed, R.M.; Loucks, R.G.; Ruppel, S.C. Comment on “Formation of nanoporous pyrobitumen residues during maturation of the Barnett Shale (Fort Worth Basin)” by Bernard et al. (2012). Int. J. Coal Geol. 2014, 127, 111–131. [Google Scholar] [CrossRef]
- Hill, C.K.; Nelson, C.R. Gas Productive Fractured Shales: An Overview and Update; Gas Tips of Gas Research Institute: Des Plaines, IL, USA, 2010; Volume 6, pp. 4–13. [Google Scholar]
- Strapoc, D.; Mastalerz, M.; Schimmelmann, A.; Drobniak, A.; Hasenmueller, N.R. Geochemical constrains on the origin and volume of gas in the New Albany Shale (Devonian-Mississippian), eastern Illinois Basin. AAPG Bull. 2010, 94, 1713–1740. [Google Scholar] [CrossRef]
- Javadpour, F.; Fisher, D.; Unsworth, M. Nanoscale gas flow in shale gas sediments. J. Can. Pet. Technol. 2007, 46, 16–21. [Google Scholar] [CrossRef]
- Loucks, R.G.; Reed, R.M.; Ruppel, S.C.; Jarvie, D.M. Morphology, genesis and distribution of nano-scale pores in siliceous mudstones of the Mississippian Barnett Shale. J. Sed. Res. 2009, 79, 848–861. [Google Scholar] [CrossRef]
- Beskok, A.; Karniadakis, G.E. Simulation of heat and momentum transfer in complex micro geometries. J. Thermophys. Heat Transf. 1994, 8, 647–653. [Google Scholar] [CrossRef]
- Swami, V.; Clarkson, C.R.; Settari, A. Non-darcy flow in shale nanopores: Do we have a final answer. In Proceedings of the SPE Canadian Unconventional Resources Conference, Calgary, AB, Canada, 30 October–1 November 2012. [Google Scholar]
- Bird, R.B.; Stewart, W.E.; Lightfoot, E.N. Transport Phenomenon, 2nd ed.; John Wiley & Sons, Inc.: New York, NY, USA, 2012. [Google Scholar]
- Javadpour, F. Nanopores and apparent permeability of gas flow in mudrocks (shales and siltstone). J. Can. Pet. Technol. 2009, 48, 16–21. [Google Scholar] [CrossRef]
- Ozkan, E.; Brown, M.; Raghavan, R.; Kazemi, H. Comparison of fractured horizontal-well performance in conventional and unconventional reservoirs. SPE Reserv. Eval. Eng. 2009, 14, 248–259. [Google Scholar] [CrossRef]
- Moridis, G.J.; Blasingame, T.A.; Freeman, C.M. Analysis of mechanisms of flow in fractured tight gas and shale gas reservoirs. In Proceedings of the SPE Latin American and Caribbean Petroleum Engineering Conference, Lima, Peru, 1–3 December 2010. [Google Scholar]
- Freeman, C.M.; Moridis, G.J.; Blasingame, T.A. A Numerical study of microscale flow behavior in tight gas and shale gas reservoir systems. Transp. Porous Media 2011, 90, 253–268. [Google Scholar] [CrossRef]
- Clarkson, C.R.; Nobakht, M.; Kaviani, D.; Ertekin, T. Production analysis of tight gas and shale gas reservoirs using the dynamic-slippage concept. SPE J. 2012, 17, 230–242. [Google Scholar] [CrossRef]
- Clarkson, C.R.; Qanbari, F.; Nobakht, M.; Heffner, L.E. Incorporating geomechanical and dynamic hydraulic fracture property changes into rate-transient analysis: Example from the haynesville shale. SPE Reserv. Eval. Eng. 2013, 16, 303–316. [Google Scholar] [CrossRef]
- Civan, F.; Rai, C.S.; Sondergeld, C.H. Shale-gas permeability and diffusivity inferred by improved formulation of relevant retention and transport mechanisms. Transp. Porous Media 2011, 86, 925–944. [Google Scholar] [CrossRef]
- Sakhaee, P.A.; Bryant, S.L. Gas permeability of shale. SPE Reserv. Eval. Form. Eval. 2012, 8, 401–409. [Google Scholar] [CrossRef]
- Anderson, J.M.; Moorman, M.W.; Brown, J.R.; Hochrein, J.M.; Thornberg, S.M. Isothermal mass flow measurements in microfabricated rectangular channels over a very wide knudsen range. J. Micromech. Microeng. 2014, 24, 055013. [Google Scholar] [CrossRef]
- Hadjiconstantinou, N.G. The limits of navier-stokes theory and kinetic extensions for describing small-scale gaseous hydrodynamics. Phys. Fluids 2006, 18, 111301–111320. [Google Scholar] [CrossRef]
- Roy, S.; Raju, R.; Chuang, H.F.; Cruden, B.A.; Meyyappan, M. Modeling gas flow through microchannels and nanopores. J. Appl. Phys. 2003, 93, 4870–4879. [Google Scholar] [CrossRef]
- Klinkenberg, L.J. The Permeability of Porous Media to Liquids and Gases. Drilling and Production Practice; American Petroleum Institute: Washington, DC, USA, 1941; pp. 200–213. [Google Scholar]
- Ho, C.K.; Webb, S. Gas Transport in Porous Media; Springer Netherlands: Houten, The Netherlands, 2006. [Google Scholar]
- Beskok, A.; Karniadakis, G.E. A model for flows in channels, pipes, and ducts at micro and nano scales. Microscale Thermophys. Eng. 1999, 3, 43–77. [Google Scholar]
- Civan, F. Effective correlation of apparent gas permeability in tight porous media. Transp. Porous Media 2010, 82, 375–384. [Google Scholar] [CrossRef]
- Shi, J.T.; Zhang, L.; Li, Y.S.; Wang, T. Diffusion and flow mechanisms of shale gas through matrix pores and gas production forecasting. In Proceedings of the SPE Unconventional Resources Conference, Calgary, AB, Canada, 5–7 November 2013. [Google Scholar]


| Gas Components | Mole Fraction (%) | Mole Mass (kg/kmol) | Collision Diameter (δ, ×10−9 m) |
|---|---|---|---|
| CH4 | 87.4 | 16 | 0.40 |
| C2H6 | 0.12 | 30 | 0.52 |
| CO2 | 12.48 | 44 | 0.45 |
| Average | 19.50 | 0.41 | |
| Property | Value | Unit |
|---|---|---|
| Gas density (ρg) | 8.03 | kg/m3 |
| Gas viscosity (μg) | 0.12 | ×10−4 Pa·s |
| Average mean-free-path (λ) | 5.55 | nm |
| Maximum adsorption thickness (d0) | 0.50 | nm |
| Knudsen number (Kn) | 5.55 | 1 |
| Temperature (T) | 300 | K |
| Pressure (P) | 10 | MPa |
| Pressure gradient ( P) | 5 | MPa |
| Langmuir pressure (PL) | 10 | MPa |
| Universal gas constant (R) | 8.31 | Pa·m3/(mol·K) |
| Gas mole mass (M) | 19.50 | ×10−3 kg/kmol |
© 2017 by the authors. Licensee MDPI, Basel, Switzerland. This article is an open access article distributed under the terms and conditions of the Creative Commons Attribution (CC BY) license (http://creativecommons.org/licenses/by/4.0/).
Share and Cite
Shen, W.; Li, X.; Xu, Y.; Sun, Y.; Huang, W. Gas Flow Behavior of Nanoscale Pores in Shale Gas Reservoirs. Energies 2017, 10, 751. https://doi.org/10.3390/en10060751
Shen W, Li X, Xu Y, Sun Y, Huang W. Gas Flow Behavior of Nanoscale Pores in Shale Gas Reservoirs. Energies. 2017; 10(6):751. https://doi.org/10.3390/en10060751
Chicago/Turabian StyleShen, Weijun, Xizhe Li, Yanmei Xu, Yuping Sun, and Weigang Huang. 2017. "Gas Flow Behavior of Nanoscale Pores in Shale Gas Reservoirs" Energies 10, no. 6: 751. https://doi.org/10.3390/en10060751