Effect of Altitude on the Audible Noise Level of AC Power lines
by
Wangling He
1, 
Baoquan Wan
2,
Lei Lan
1,
Chunming Pei
3,
Jiangong Zhang
2,
Yuchao Chen
4,
Xiaoyue Chen
1,* and
Xishan Wen
1 1
School of Electrical Engineering, Wuhan University, Wuhan 430072, China
2
State Key Laboratory of Power Grid Environmental Protection (China Electric Power Research Institute), Wuhan 430072, China
3
Wuhan NARI Group Corporation, Wuhan 430074, China
4
State Grid Corporation of China, Beijing 100031, China
*
Author to whom correspondence should be addressed.
Energies 2017, 10(7), 1055; https://doi.org/10.3390/en10071055
Submission received: 15 June 2017
/
Revised: 3 July 2017
/
Accepted: 18 July 2017
/
Published: 21 July 2017
(This article belongs to the Section F: Electrical Engineering)
Abstract
:The audible noise (AN) induced by corona discharge of AC transmission lines is more severe at high altitudes than at low altitudes; this has become a crucial limiting factor for the structural design of power lines and their environmental impact assessment. To determine the altitude effect and correction of AN level for AC power lines, a corona cage test system was used to measure the acoustic power level of four bundled conductors at five elevations, namely Wuhan (23 m), Tianshui (1100 m), Xining (2261 m), Gonghe (2943 m), and Yangbajain (4300 m). We obtained the AN characteristics for different altitudes, bundle numbers, and subconductor diameters through a statistical analysis of measured data. The analysis and comparison results indicate that the actual AN correction values are slightly less than the Bonneville Power Administration term of 1 dB/300 m at altitudes below 3200 m. Above 3200 m, the difference increases gradually. A correction term 2.85 dB/1000 m is recommended for more accurate evaluation.
1. Introduction
With the imbalance in the distribution of energy resources and load centers in China, an increasing number of high-voltage transmission lines are being built to transport power from western regions to eastern regions. Because the region encompassing western and eastern China covers a vast area with a wide-ranging altitude, some high-voltage AC (HVAC) transmission lines are inevitably built in high-altitude areas such as the Qinghai-Tibet plateau, which covers approximately 200,000 km2 and has an average altitude exceeding 3200 m [1,2,3]. Air density decreases with altitude; moreover, the mean free path increases and the likelihood of corona discharge also increases [4,5]. Thus, the corona discharge phenomenon becomes more serious at high altitudes and can result in undesirable environmental effects such as audible noise (AN), corona loss (CL), and radio interference (RI). AN performance is a crucial factor for the design of overhead line conductors [6,7,8]. From [9], it can be observed that, in many cases, the selection of conductors for Bonneville Power Administration (BPA, USA) high-voltage lines is based on AN performance. Therefore, investigating the influence of altitude on AN levels is critical.
Several studies have investigated the influence of altitude or air density on HVAC corona noise. In 1987, Chartier et al. from BPA performed a long-term test and summarized the A-weighted L50 value (the value exceeding 50% of the all-time value in rainy weather) of AN test results from a test station located at an altitude of 1953 m near a double-circuit 500-kV line [9]. By comparing the results of this test with those from another station at an altitude of 277 m located near a 500-kV line with similar design, the AN correction factor under rainy conditions was found to be 1 dB/300 m. Between 1985 and 1986, the Ente Nazionale per L’Energia Elettrica (ENEL, Italy) and Eskom (South Africa) cooperated to study the influence of altitude on HVAC corona noise. Two corona cages were built in Johannesburg, South Africa, and Suvereto, Italy, at altitudes of 1584 m and 0 m, respectively. The results showed that the AN altitude correction was approximately 1 dB/300 m under artificial heavy-rain conditions [10]. From 2010 to 2014, Zhao et al. examined the altitude effect and AN correction for high-voltage DC (HVDC) transmission lines by using four downscaled test lines at four altitudes. They observed that the AN levels of HVDC transmission lines were nonlinearly dependent on altitude, and the AN correction value for HVDC lines was less than the predicted value by 1 dB/300 m [11].
The aforementioned studies on HVAC AN levels mainly focused on a single type of conductor bundle, and the valid data on AN levels measured above an altitude of 2000 m are limited. Moreover, with the advancement of materials and manufacturing, the characteristics of conductors may have a better performance in acoustic noise emission. Therefore, to investigate whether the 1 dB/300 m term can be applied to high altitudes and new conductors or not, we conducted experiments on AN levels with four types of conductor bundles at different altitudes by using a mobile corona cage; subsequently, the acoustic power levels of different bundled conductors at different altitudes were measured and analyzed.
2. Experimental Method
2.1. Facility and Experimental Setup
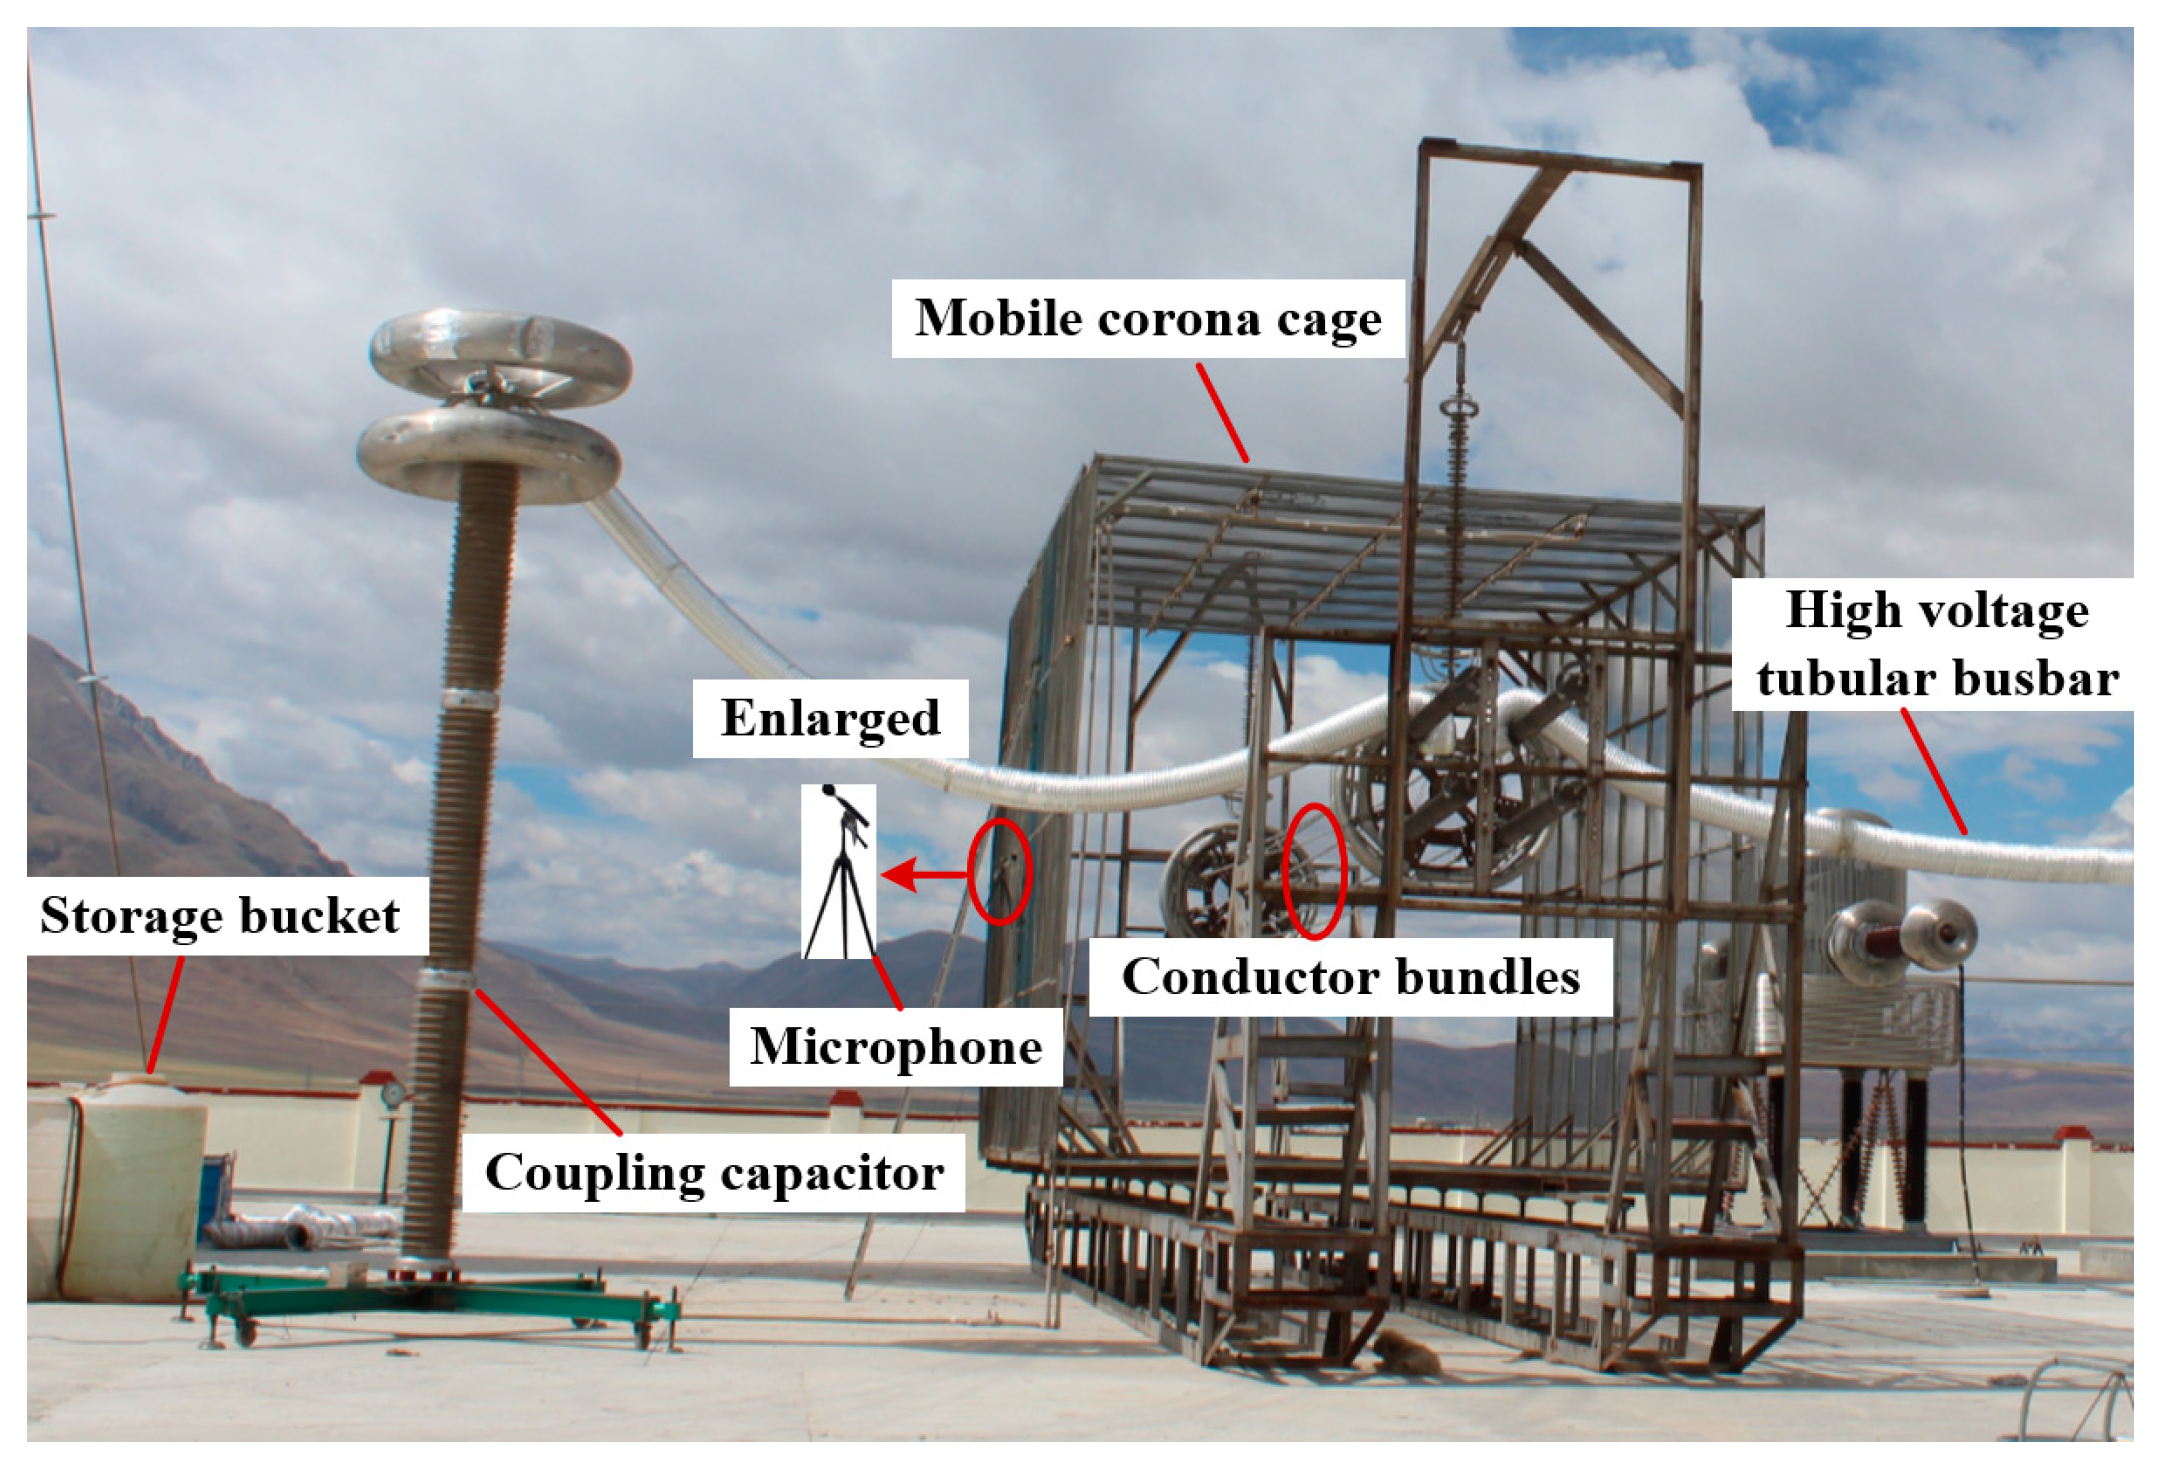
In this study, we constructed a mobile corona cage using wire-mesh enclosures, with a cross-section of 6 × 6 m and an effective length of 10 m, as shown in Figure 1. Four types of bundled conductors were used to measure the AN levels under heavy-rain conditions in the cage. The average rainfall during the test was no less than 18 mm/h to ensure that the measured values are only influenced by bundle geometry and the surface electric field. The types of bundled conductors used were as follows: 4 × LGJ400, 6 × LGJ400, 6 × LGJ500, and 8 × LGJ400. The subconductor diameter of LGJ400 and LGJ500 was 26.8 mm and 30.0 mm, respectively. The LGJ400 conductor is commonly used in the 750 kV power grids that operate in western China, and the LGJ500 conductor is widely used for ultra-high voltage (UHV) AC transmission projects in China, such as the 1000 kV Jindongnan-Nanyang-Jingmen UHV AC power lines. Furthermore, the conductor spacing was set to a constant of 400 mm.
The measurement system comprised a microphone, an amplifier, a data acquisition system, and a computer. The microphone was a 1/2-in free-field microphone of type 4189 (Brüel & Kjær, Nærum, Denmark) with a frequency range of 6.3 Hz to 20 kHz and a sensitivity of 50 mV/pa. The amplifier supplied polarized voltage to the microphone, providing 20 dB amplification to the microphone’s output signal. The data acquisition module was a Type 3050 (also by Brüel & Kjær), offering 4–6 high-precision input channels with an input noise frequency ranging from DC to 51.2 kHz [12]. The sound pressure level (SPL) signal was measured by the microphone and converted into an electrical signal, which was then transmitted to the data acquisition module and processed. Subsequently, the measurement results were displayed by the pulse measurement and analyzed on a personal computer (PC).
In the experimental setup (Figure 2), the microphone was placed close to the cage at the same height as the bundled conductors. The vertical location of the microphone was at the center of the entire corona cage. High AC voltage was supplied by a single-phase transformer to the bundled conductors.
2.2. Meteorological Conditions and Test locations
Atmospheric pressure at different altitudes can be approximated by the empirical Equation [13]:
where H is the altitude in kilometers, P0 is the standard atmospheric pressure of 101.325 kPa, and k is a constant of 10.7.
The relative air density is a function of the temperature t (°C) and pressure P (kPa) of the air surrounding the conductor surface [13].
The air pressures in Wuhan (23 m), Tianshui (1100 m), Xining (2261 m), Gonghe (2943 m), and Yangbajain (4300 m) were calculated to be 101.1 kPa, 90.9 kPa, 79.9 kPa, 73.4 kPa, and 60.6 kPa, respectively. The temperatures were approximately 10 °C and the variation range was less than ±6 °C. The relative air density of these five locations was 1.05, 0.93, 0.83, 0.76, and 0.63, respectively. The influence of humidity can be ignored, because the test was performed under heavy-rain conditions, and the influence of temperature was much lower than that of air pressure and altitude. Thus, altitude was the major factor influencing the AN level in these measurements.
The other four elevations are shown in Figure 3.
3. Measurement and Discussion
3.1. Method of Gaining Acoustic Power Density
Because of the complexity of the corona discharge process, determining the AN level entirely from theoretical considerations is difficult. Therefore, the A-weighted acoustic power density was used as the generation quantity of AN to describe the AN performance of transmission lines [14]. The A-weighted acoustic power density can be derived from the experimental data obtained in the corona cage according to the following procedure.
- The ambient noise interference should be eliminated in the process of AN measurement. Before the voltage was applied, the values of ambient noise and the noise of raindrops were measured. Abnormally large values appearing during the test were excluded. The actual AN level from the power lines corona was then calculated as:where LM is the measured value, LB is the background value, and LA is the corona noise.
- Assuming the corona is distributed uniformly along the test line, the AN source of the element length dx can be described as an independent point source and the acoustic propagation as a spherical sound wave. The acoustic power energy from a test line can be calculated as shown in Equation (4), which accounts for the reflection properties of the ground.where J is the acoustic power energy, A0 is the acoustic power density, L is the conductor length, D is the radial distance from the measuring point to the conductor, is the variable distance along the conductor, Di is the distance from the measuring point to the image of the line, and k is the reflection coefficient of the ground.
- The SPL measured from the corona cage experiment can be defined as follows:where P is the SPL, δ is the air density, and c is the velocity of the sound wave propagation in air.
- From Equations (4) and (5), the relationship between P and A0 can be defined as:where
- The acoustic power density level (PWL) of different bundled conductors can be obtained by combining the measured SPL from the cage test and Equation (6).
3.2. Measurement Results
All measurements were performed under heavy-rain conditions with different bundled conductors at different altitudes. The concept of average maximum surface gradient was examined first. As shown in Figure 4, the voltage applied to the conductors was 1 kV, and the electric-field strength at the surface of 4 × LGJ400 was non-uniform. Owing to the shielding effect, the electric-field strength of the inner parts of the bundled conductors was less than that of the outer parts.
Because of the non-uniformity of the surface electric-field strength of the bundled conductors, the maximum gradient of each subconductor was selected and the average of these gradients was calculated as a variable to derive the PWL from the corona cage [14].
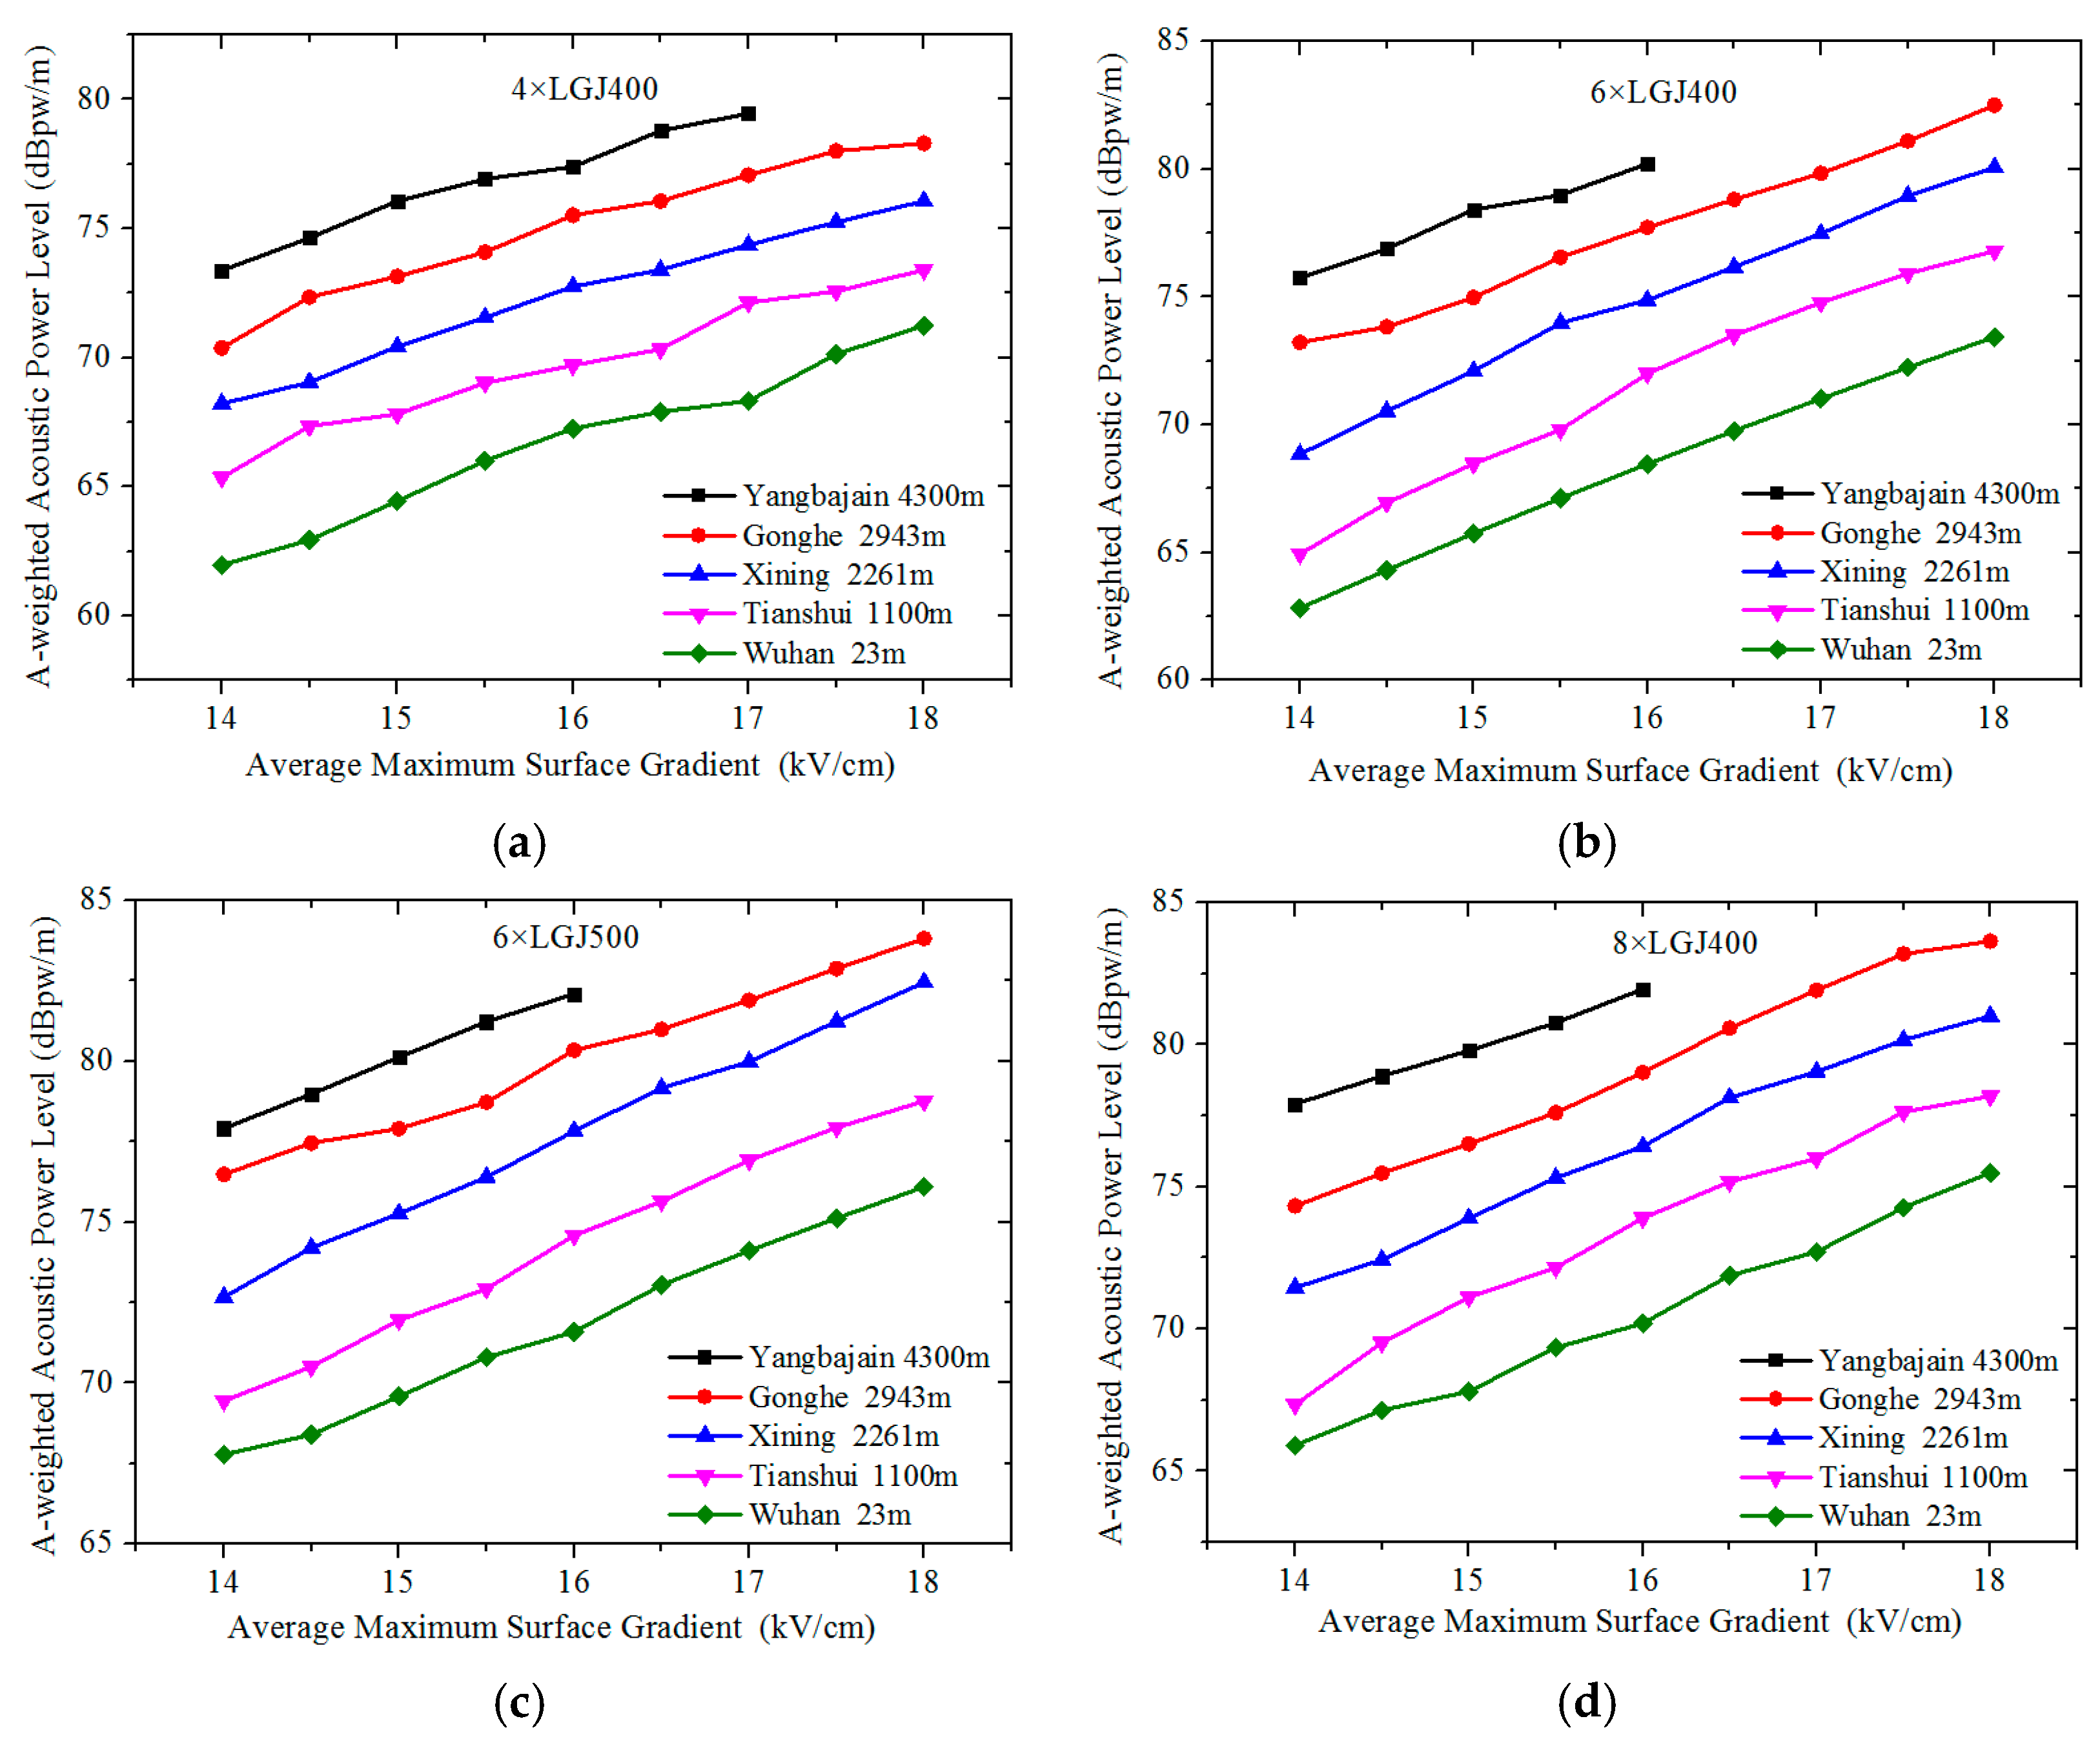
The results are shown in Figure 5, where the average maximum gradient is the root mean square (RMS) value. From Figure 5, it is suggested that: (1) altitude has a considerable influence on PWL performance. As the altitude increased, the PWL of all bundled conductors increased; (2) The PWL correction has different values when the surface voltage gradient is different. Considering the case of altitudes of 2943 m and 23 m, the differences between the correction values present a slightly downward trend between 16 kV/cm and 18 kV/cm. The differences were 1.20, 0.24, 1.04, and 0.67 dB for 4 × LGJ400, 6 × LGJ400, 6 × LGJ500, and 8 × LGJ400, respectively. However, this downward trend is not obvious compared with the radio interference altitude correction [15].
The average maximum gradients were selected in the range of 16–18 kV/cm to analyze the AN performance because the gradient of transmission lines is usually designed in this range [16]. Furthermore, the average PWL values of different bundled conductors in this range are discussed. Because the test data in Yangbajian is incomplete due to the lower breakdown voltage caused by heavy-rain conditions and low pressure, the discussions in this section involve the test data in the other four locations.
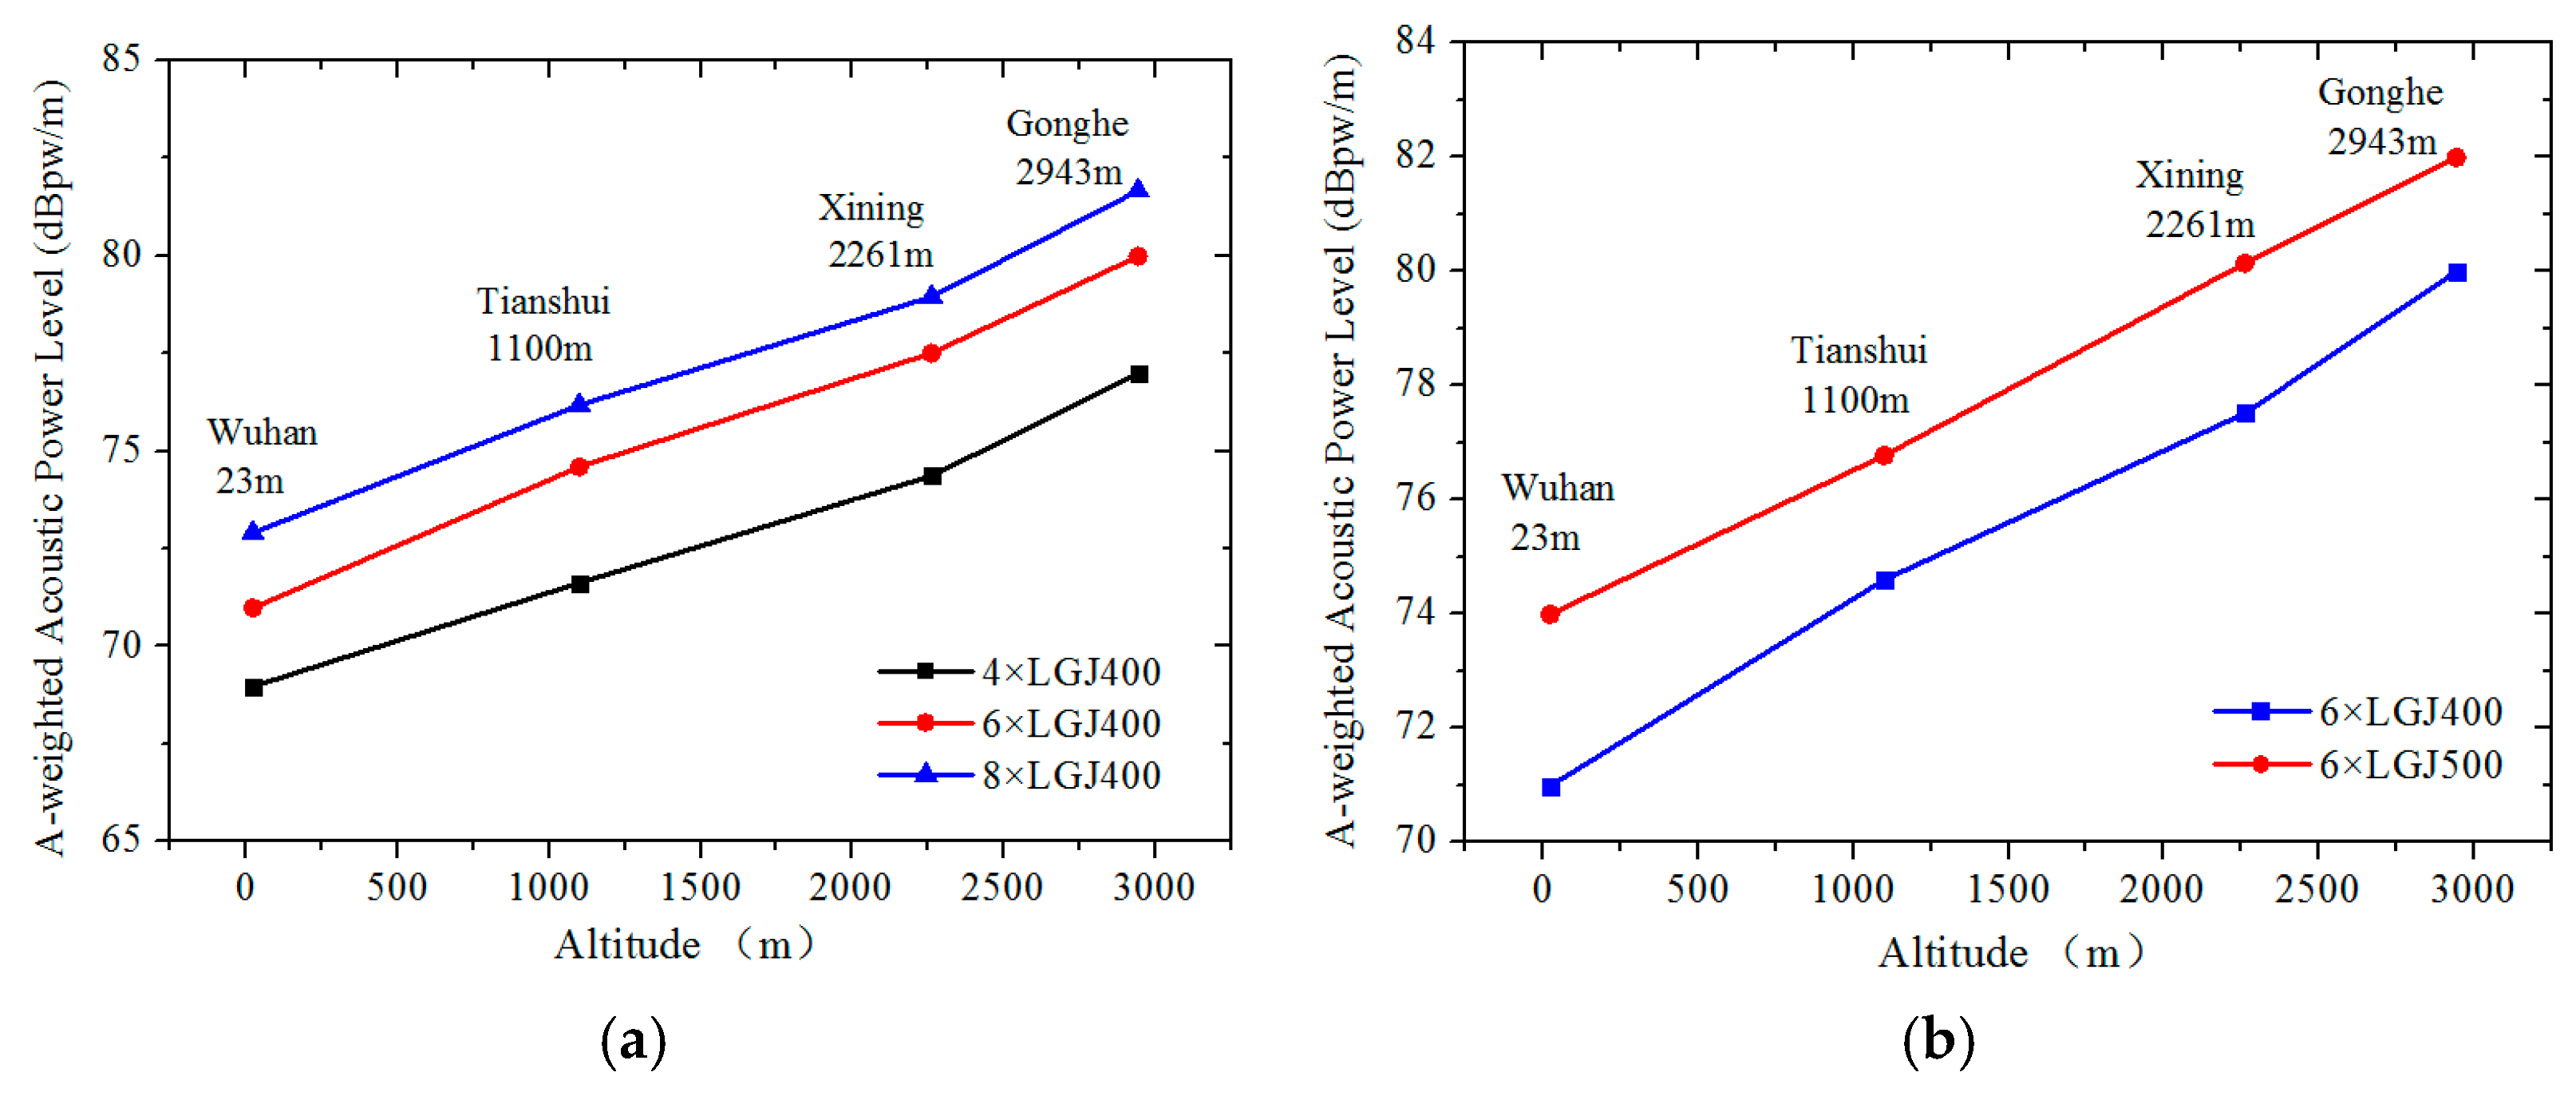
The PWL mean values of LGJ400 with different bundle numbers and six bundled conductors with different subconductor diameters are depicted in Figure 6.
As shown in Figure 6a, the influence of bundle number on the PWL value is very obvious. With an increase in the bundle number, the PWL value increases. Moreover, the difference reduced gradually when the bundle number increased. Considering the case of Xining, the difference is 1.44 dB between number 8 and number 6, and 3.15 dB between number 6 and number 4. This phenomenon is different from the radio interference where the bundle number has little influence on the radio interference excitation function [15]. From Figure 6b, it can be observed that the subconductor diameter changed from 26.8 to 30.0 mm, and the PWL value increases as the subconductor diameter increases.
The aforementioned results reveal that the PWL increased with the average maximum bundle gradient (gmax), and that it was positively correlated with the bundle size and subconductor diameter. This phenomenon can be explained by the corona discharge performance. When gmax is constant, the number of corona discharge points in the bundle conductor surface increases with the increase in bundle size or subconductor diameter. Therefore, the noise source and the PWL of the conductor increase. According to Peek’s formula [17], the corona onset electric field decreases with an increase in the subconductor diameter, and the corona discharge level of a larger-diameter conductor should therefore be intensified with the same gmax. However, in practical transmission projects, engineers usually reduce the AN level by increasing the bundle size. This is mainly because the surface gradient decreases with increased bundle size if the applied voltage is constant. For example, considering LGJ400, the gmax values of 4 × LGJ400 and 8 × LGJ400 were 0.075 and 0.055 kV/cm when the applied voltage was 1 kV in the mobile corona cage, signifying a reduction of approximately 27%. Therefore, the AN performance can be improved by increasing the bundle size in practical projects where the operating voltage is almost constant.
3.3. Measured AN Correction Factor
From [9], the AN altitude correction function recommended by BPA for HVAC transmission lines is given as follows:
where x is the altitude in m; and Δ is the AN correction value, dB (A).
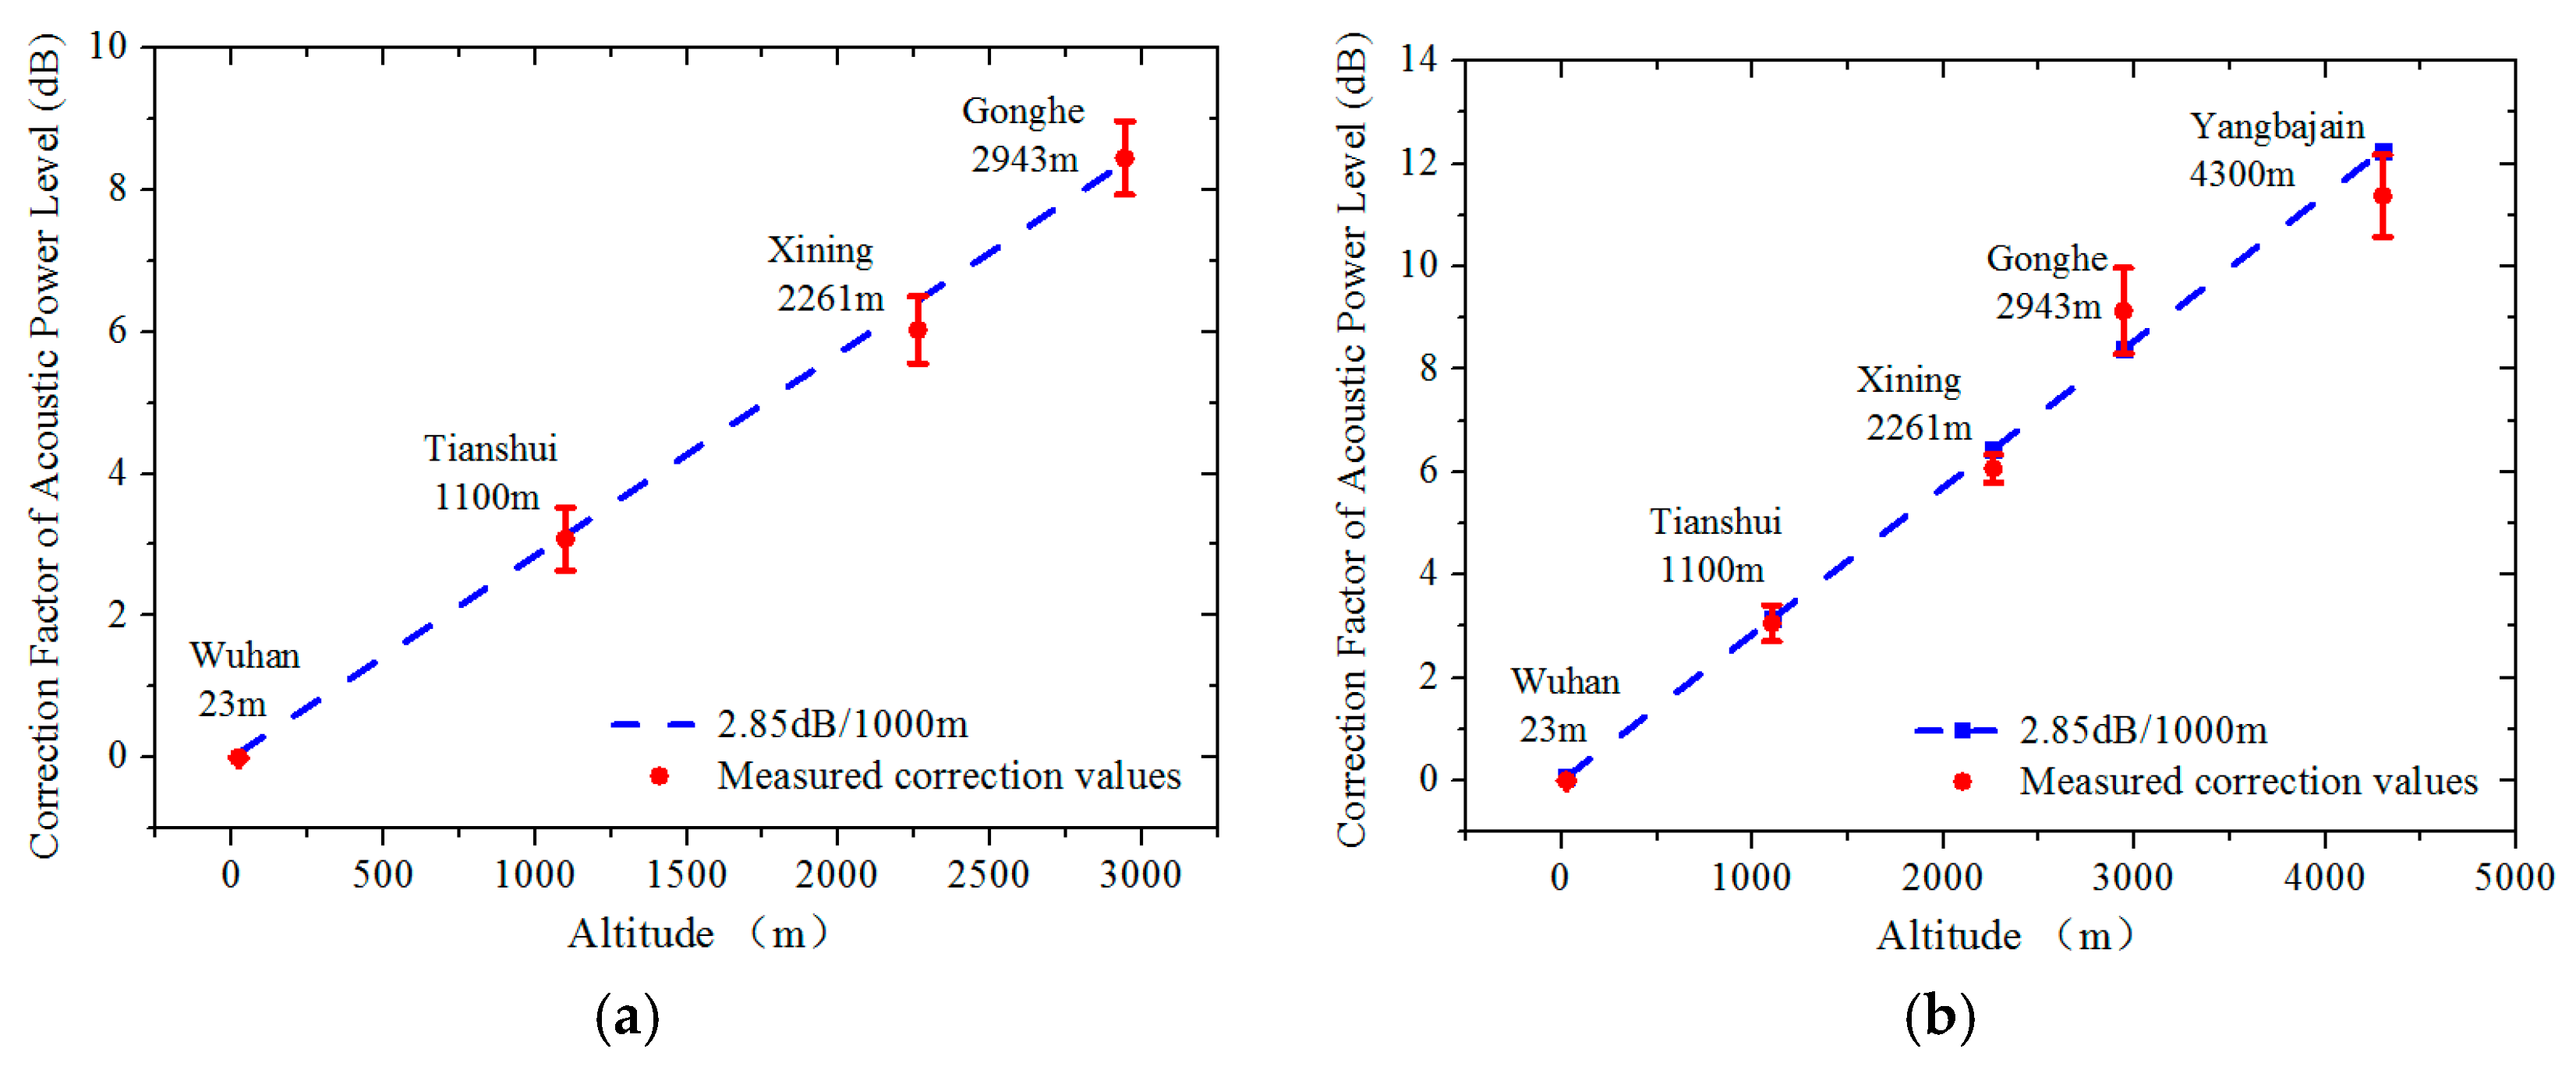
Because of the combined influence of heavy-rain conditions and low pressure, the breakdown voltage between the bundle conductor and corona cage reduced sharply. Therefore, the PWL values of bundled conductors reduced when the gradient exceeded 15 kV/cm in Yangbajain. The measured average PWL correction values of different bundled conductors between 16 and 18 kV/cm are shown in Figure 7a, and the average values between 15 and 16 kV/cm are shown in Figure 7b. Moreover, the correction factor of the BPA term is described in the figure to compare with the test results.
From Figure 7, it can be observed that the measured average correction values are generally lower than the values calculated using the BPA term. As shown in Figure 7b, the difference between BPA value and the measured average values are 2.9 dB, 0.6 dB, 1.2 dB and 0.5 dB, corresponding to the locations of Yangbajian, Gonghe, Xining and Tianshui, respectively. Then, the linear interpolation method was used between the measured data of Yangbajian point and Gonghe point. It was found that the difference between BPA value and calculated value began to exceed of 1.2 dB when the altitude was 3200 m. Therefore, a preliminary conclusion is that, when the altitude is below 3200 m, the BPA term can be used as an AN altitude correction function to provide a conservation reference value for rigorous evaluation. When the altitude exceeds 3200 m, the BPA term has a considerably higher deviation. If the BPA term is used to determine the AN level above 3200 m, the project investment increases significantly due to the high cost of standard solutions such as larger subconductors or higher numbers of bundles, and the associated costs of high-strength towers.
Therefore, on the basis of the measured AN correction results, a correction term using Equation (9) was fitted by applying the minimum mean square error method from the test results. The comparison of the calculated correction values and tests results is shown in Figure 8.
where x is the altitude, m; and Δ is the AN correction value, dB (A).
From Figure 8, it can be observed that Equation (9) is more accurate and in line with the practical situation. If this method is used to design the HVAC transmission lines, smaller bundled conductors such as those with bundle numbers and smaller subconductor diameters can be used in the transmission project to meet environmental protection requirements. This will considerably reduce the expenditure on conductors. Moreover, combining Figure 7 and Figure 8, the BPA term can be used to correct the AN level conservatively at high altitudes when the altitude is below 3200 m. Above this altitude, the difference becomes larger and Equation (9) is recommended.
4. Conclusions
In this study, the A-weighted PWL values of different bundled conductors were measured using a mobile corona cage at five different altitudes from 0 to 4300 m. The AN performances of different bundle numbers and different subconductors were discussed. Based on the experimental and theoretical analyses, it is concluded that: (a) the PWL values increase with the average maximum bundle gradient, and are positively correlated with bundle size and subconductor diameter; (b) The widely used BPA correction term is valid and can provide a rigorous evaluation below 3200 m; however, above this altitude, it is not applicable and results in an increased investment; (c) An AN correction term is proposed that can provide a more accurate evaluation for altitudes below 4300 m. (d) It is necessary to obtain more data for altitudes exceeding 3200 m in the future to prove the validity of the key altitude 3200 m and the recommended AN correction formula further.
Acknowledgments
This work was supported by State Key Laboratory of Power Grid Environmental Protection and the State Grid Corporation of China (SGCC) Science and Technology Project of China under Grant GY71-17-005, which supplied the costs of publishing in open access. The authors would also particularly like to thank Yulong Chen and Huagang Liu (China Electric Power Research Institute, China) for their consistent support throughout the experiment procedure.
Author Contributions
Wangling He, Baoquan Wan, Chunming Pei and Yuchao Chen conceived and designed the experiments; Wangling He, Yuchao Chen and Chunming Pei performed the experiments; Wangling He, Lei Lan and Xiaoyue Chen analyzed the data; Jiangong Zhang and Xishan Wen contributed reagents/materials/analysis tools; Wangling He, Lei Lan and Xiaoyue Chen wrote the paper.
Conflicts of Interest
The authors declare no conflict of interest.
References
- Liu, Z.Y. Ultra-High Voltage Grid; China Economy Press: Beijing, China, 2006. [Google Scholar]
- Liu, Z.Y. Electric Power and Energy in China; China Electric Power Press: Beijing, China, 2012. [Google Scholar]
- Wu, X.; Wan, B.Q. Electromagnetic Environment of Power Transmission Project; China Electric Power Press: Beijing, China, 2009. [Google Scholar]
- Bian, X.M.; Wang, L.M.; Liu, Y.P.; Yang, Y.J.; Guan, Z.C. High altitude effect on corona inception voltages of DC power transmission conductors based on the mobile corona cage. IEEE Trans. Power Del. 2013, 28, 1971–1973. [Google Scholar]
- Liu, Y.P.; You, S.H.; Lu, F.C.; Wan, Q.F.; Bian, X.M.; Wang, L.Y. 500-kV EHV bundle conductors’ corona onset voltage calculation and analysis in corona cage at different altitudes. IEEE Trans. Power Del. 2012, 27, 2090–2097. [Google Scholar] [CrossRef]
- Li, Q.; Rowland, S.M.; Dupere, I.; Shuttleworth, R. Acoustic noise evaluation for overhead line conductors using an anechoic chamber. IEEE Trans. Power Del. 2017, 32, 1835–1843. [Google Scholar] [CrossRef]
- Straumann, U. Mechanism of the tonal emission from ac high voltage overhead transmission lines. J. Phys. D Appl. Phys. 2011, 44, 1–8. [Google Scholar] [CrossRef]
- Li, X.B.; Cui, X.; Lu, T.B.; Zhang, D.; Liu, Y. Time-domain characteristics of the audible noise generated by single corona source under positive voltage. IEEE Trans. Dielectr. Electr. Insul. 2015, 22, 870–878. [Google Scholar] [CrossRef]
- Chartier, V.L.; Lee, L.Y.; Dickson, L.D.; Martin, K.E. Effect of high altitude on high AC transmission line corona phenomena. IEEE Trans. Power Del. 1987, 7, 225–237. [Google Scholar] [CrossRef]
- Britten, A.C.; Konkel, E.C.H. Radio interference, corona losses, audible noise and power frequency electric fields as factors in the design of Eskom’s 765 kV lines. In Proceedings of the CIGRE Open Conference on EHV Transmission Systems, Johannesburg, South Africa, 19 October 1987; pp. 5–13. [Google Scholar]
- Zhao, L.X.; Lu, J.Y.; Cui, X.; Xie, L.; Ju, Y.; He, K. The altitude effect and correction of audible noise for HVDC transmission lines. IEEE Trans. Power Del. 2016, 99, 1–9. [Google Scholar] [CrossRef]
- User Manual for Hand-Held Analyzer; Brüel & Kjær Vibration Measurement Inc.: Nærum, Denmark, 2016.
- Maruvada, P.S. Corona Performance of High-Voltage Transmission Lines; Research Studies Press: Baldock, UK, 2000. [Google Scholar]
- EPRI AC Transmission Line Reference Book-200 kV and Above, 3rd ed.; Electric Power Research Institute: Palo Alto, CA, USA, 2005.
- He, W.L.; He, J.J.; Wan, B.Q.; Chen, Y.C.; Pei, C.M.; Chen, Y.L. Influence of altitude on radio interference level of AC power lines based on corona cage. IET Sci. Meas. Technol. 2015, 9, 861–865. [Google Scholar] [CrossRef]
- Tang, J.; Liu, Y.P.; Wu, X. Effect of altitude on radio interference based on corona test cage. High Volt. Eng. 2009, 35, 601–606. [Google Scholar]
- Peek, F.W. Dielectric Phenomena in High Voltage Engineering; McGraw-Hill Book Company Inc.: New York, NY, USA, 1929. [Google Scholar]
Figure 1.
Mobile corona cage at Yangbajain (4300 m elevation).

Figure 2.
Diagram of AN measurement.

Figure 3.
AC corona cage tests at different altitudes.

Figure 4.
Electric-field distribution of conductor bundles in a corona cage. (a) Contour surface of electric field (kV/m); (b) enlarged contour surface of electric field (kV/m) (upper-left conductor).
Figure 4.
Electric-field distribution of conductor bundles in a corona cage. (a) Contour surface of electric field (kV/m); (b) enlarged contour surface of electric field (kV/m) (upper-left conductor).

Figure 5.
PWL values with different bundle numbers and different subconductor diameters at different altitude areas. (a) 4 × LGJ400, (b) 6 × LGJ400, (c) 6 × LGJ500 and (d) 8 × LGJ400.
Figure 5.
PWL values with different bundle numbers and different subconductor diameters at different altitude areas. (a) 4 × LGJ400, (b) 6 × LGJ400, (c) 6 × LGJ500 and (d) 8 × LGJ400.

Figure 6.
Comparison of PWL values between different bundled conductors: (a) same subconductor diameters with different bundle number; (b) same bundle number with different subconductor diameter.
Figure 6.
Comparison of PWL values between different bundled conductors: (a) same subconductor diameters with different bundle number; (b) same bundle number with different subconductor diameter.

Figure 7.
RI correction values of different altitudes. (a) Average values during 16–18 kV/cm; (b) average values during 15–16 kV/cm.
Figure 7.
RI correction values of different altitudes. (a) Average values during 16–18 kV/cm; (b) average values during 15–16 kV/cm.

Figure 8.
Comparison of test results and calculated results. (a) Average values during 16–18 kV/cm; (b) average values during 15–16 kV/cm.
Figure 8.
Comparison of test results and calculated results. (a) Average values during 16–18 kV/cm; (b) average values during 15–16 kV/cm.

© 2017 by the authors. Licensee MDPI, Basel, Switzerland. This article is an open access article distributed under the terms and conditions of the Creative Commons Attribution (CC BY) license (http://creativecommons.org/licenses/by/4.0/).
Share and Cite
MDPI and ACS Style
He, W.; Wan, B.; Lan, L.; Pei, C.; Zhang, J.; Chen, Y.; Chen, X.; Wen, X. Effect of Altitude on the Audible Noise Level of AC Power lines. Energies 2017, 10, 1055. https://doi.org/10.3390/en10071055
AMA Style
He W, Wan B, Lan L, Pei C, Zhang J, Chen Y, Chen X, Wen X. Effect of Altitude on the Audible Noise Level of AC Power lines. Energies. 2017; 10(7):1055. https://doi.org/10.3390/en10071055
Chicago/Turabian StyleHe, Wangling, Baoquan Wan, Lei Lan, Chunming Pei, Jiangong Zhang, Yuchao Chen, Xiaoyue Chen, and Xishan Wen. 2017. "Effect of Altitude on the Audible Noise Level of AC Power lines" Energies 10, no. 7: 1055. https://doi.org/10.3390/en10071055
Note that from the first issue of 2016, this journal uses article numbers instead of page numbers. See further details here.