Article

Break-Even Points of Battery Energy Storage Systems for Peak Shaving Applications

1
Department of Electrical Engineering, University of Chile, 8370451 Santiago, Chile
2
School of Electrical, Computer and Energy Engineering, Arizona State University, P.O. Box 875706, Tempe, AZ 85287, USA
*
Author to whom correspondence should be addressed.
Energies 2017, 10(7), 833; https://doi.org/10.3390/en10070833
Submission received: 24 April 2017 / Revised: 13 June 2017 / Accepted: 15 June 2017 / Published: 22 June 2017
(This article belongs to the Section D: Energy Storage and Application)

Abstract

:
In the last few years, several investigations have been carried out in the field of optimal sizing of energy storage systems (ESSs) at both the transmission and distribution levels. Nevertheless, most of these works make important assumptions about key factors affecting ESS profitability such as efficiency and life cycles and especially about the specific costs of the ESS, without considering the uncertainty involved. In this context, this work aims to answer the question: what should be the costs of different ESS technologies in order to make a profit when considering peak shaving applications? The paper presents a comprehensive sensitivity analysis of the interaction between the profitability of an ESS project and some key parameters influencing the project performance. The proposed approach determines the break-even points for different ESSs considering a wide range of life cycles, efficiencies, energy prices, and power prices. To do this, an optimization algorithm for the sizing of ESSs is proposed from a distribution company perspective. From the results, it is possible to conclude that, depending on the values of round trip efficiency, life cycles, and power price, there are four battery energy storage systems (BESS) technologies that are already profitable when only peak shaving applications are considered: lead acid, NaS, ZnBr, and vanadium redox.

1. Introduction

In power systems, the load profile during the day is characterized by short periods of time when significant amounts of power are required, the so called “peak load times” of the system. Depending on the load composition (industrial, residential, and/or commercial) and the season of the year, peak load time periods may occur at different hours during the day. Demand peaks significantly impact the economic performance of power systems. Generation units with low efficiencies have to be started to meet this peak demand. These peak demands also have a direct impact on network planning [1]. The electrical infrastructure in transmission and distribution networks must be sized to meet the maximal demand of the system [2]. Hence, system installations are fully utilized only at some hours of the year, while most of the time these facilities are actually underutilized. Consequently, distribution network (DN) customers are charged not only according to their total energy consumption but also according to their highest power demand. The exact pricing structure may vary slightly from country to country, but the basis is essentially the same everywhere [1]. These demand charges usually represent an important portion of the total electricity payments of DN customers. Therefore, DN customers are extremely interested in lowering these charges without lowering their energy consumption.
In this context, energy storage systems (ESSs) are fast response devices, which not only add more flexibility and controllability to the system but also provide a wide range of technical and economic benefits. The ESS can store energy at off-peak load periods and then use this energy during peak load periods. The economic benefits for the DN are achieved not only by the reduction of demand charges but also due to:
  • The reduction of network reinforcement needs: the electrical infrastructure in the DN does not has to be sized for the highest power demand anymore but for a more flattened generation profile [3].
  • The reduction of the electricity bill: depending on the market conditions, the DN customers can decrease their total energy costs by taking advantage of energy price differences between peak and off-peak load periods [4]. This way, if the energy price during the peak load periods of the day is more expensive than the price during the off-peak periods, a sound strategy for the ESS scheduling would lead to an electricity bill reduction.
In power systems, ESS technologies may include compressed air energy storage (CAES), superconducting magnetic energy storage systems (SMES), pumped hydro storage (PHS), super-capacitors, flywheels, and a variety of batteries. There are many ways to classify these ESSs: based on the application area [5], the form of energy conversion [6], or depending on the amount of MWh that the ESS can provide [7]. Considering this last point, ESSs are classified into two main categories:
  • Energy applications: the ESS must maintain a constant delivery of power, typically covering time frames between minutes to hours [8]. These ESS technologies are usually used for energy management, frequency regulation, and energy arbitrage, among other applications [7].
  • Power applications: this includes ESSs with high power density and the ability to respond in short time frames (few seconds to some minutes). These technologies are usually applied to improve power quality [7] and also for frequency regulation.
CAES, PHS, and batteries fall into the category of energy applications, whereas SMES, super-capacitors, and flywheels fall into the category of power applications. CAES and PHS have special siting needs, and therefore these plants cannot be built everywhere. On the other hand, SMES, super-capacitors, and flywheels are short-duration devices, and thus they are mostly used for power quality support (making them less suitable for e.g., peak shaving applications [6]). As a consequence, these technologies of ESSs are not further considered in this work.
In spite of the significant advances that have been made in battery energy storage systems (BESS) in terms of efficiency and life cycle over the past few years, their relatively high costs are still hard to justify in many applications in power systems [9,10]. As a consequence, a critical aspect in any BESS project is its size optimization, i.e., the determination of its optimal power and energy ratings. Not appropriately sizing a BESS may not only lead to its underutilization but also to negative results from an economic viewpoint [11,12].
In response to this need, several researches in the field of optimal sizing of ESSs have been conducted, focusing on either microgrids [11,12,13,14,15,16] or high voltage power systems [17,18,19,20,21,22,23]. The list of previous works on the optimal sizing of ESSs is quite extensive. However, most of them have drawbacks related to making important assumptions about key aspects affecting ESS profitability such as efficiency, life cycles, and specific costs. Unfortunately, most of the time, the exact values of these ESS characteristics are quite difficult to determine due to the high uncertainty involved and because of the continuous changes in ESS technology with research and development activities [24]. Furthermore, since the initial capital costs of many storage technologies are still high, acquiring an ESS for reducing the peak demand (peak shaving applications) can be justified in DNs if the daily load profile leads to an important price difference between peak and off-peak load periods [9], and the demand charges paid by the DN are high. This is confirmed by several BESSs that have been installed worldwide for load leveling and peak shaving applications during the past few years [25,26].
In the aforementioned context, this work aims to answer the question: what should be the costs of different BESS technologies in order to make the peak shaving applications financially viable? The paper presents a comprehensive sensitivity analysis of the interaction between the financial viability of a BESS project and some key parameters influencing the project performance. The idea is to find the break-even points for different BESS technologies considering a wide range of life cycles, efficiencies, energy prices, and power prices. To do this, an optimization methodology for the sizing of BESSs is used. The peak-shaving application in distribution networks is used as a test-bed for the proposed methodology considering that the Distribution Company (DisCo) has the ownership and operation of the BESSs.
The remainder of this paper is organized as follows. Section 2 presents the proposed methodology for the sizing and selection of BESS for peak-shaving applications; Section 3 describes the case study used to evaluate the proposed methodology; Section 4 analyses the results obtained in this work; finally, Section 5 presents the concluding remarks.

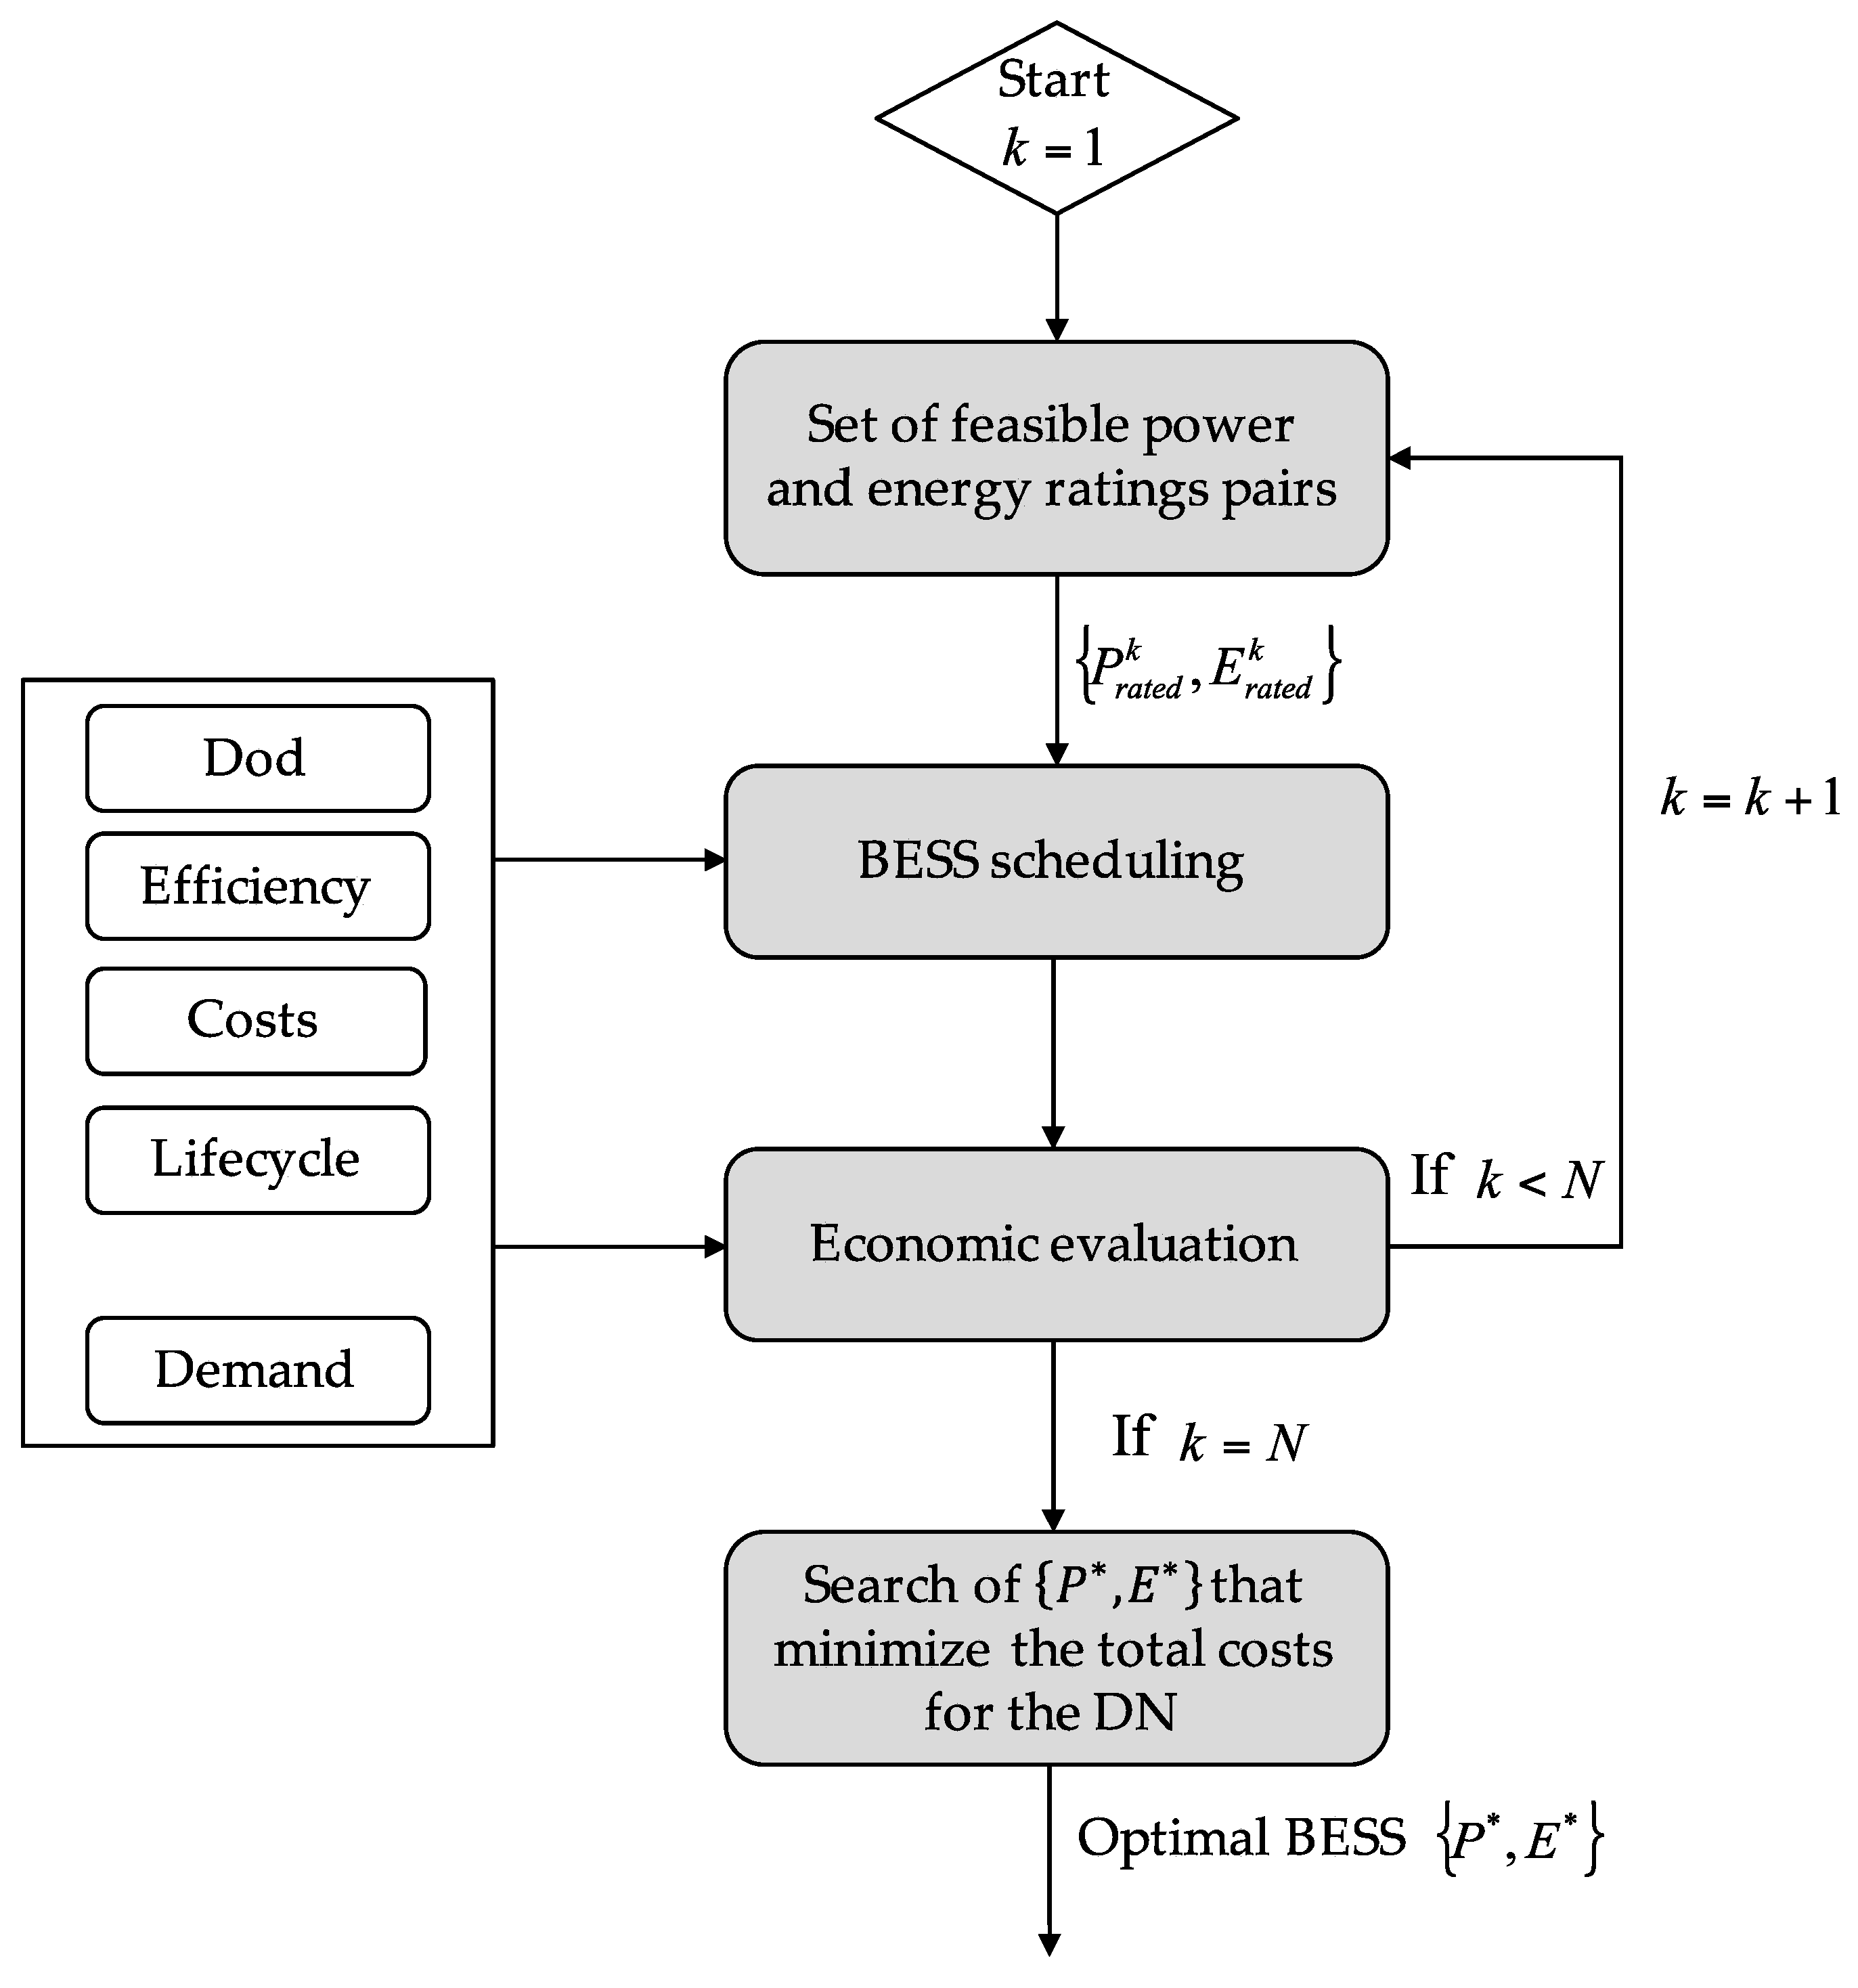
2. Proposed Methodology for BESS Selection for Peak-Shaving Applications

In order to formulate an approach to address the main objective of this paper described earlier in the introduction, an optimization methodology for sizing the BESS is proposed. The proposed methodology is based on an iterative process divided into three main phases; namely, (1) selection of a set of feasible power and energy pairs; (2) BESS scheduling; and (3) an economic evaluation based on a net present value (NPV) analysis. Figure 1 outlines the proposed methodology. The economic convenience of the BESS is determined based on the difference between its costs and its comparative benefits due to a reduction of the peak demand and thus in the cost of supplying the load. Note that other benefits such as the reduction of network reinforcements (deferral of equipment), ancillary services, or performance improvements could be also taken into account in the proposed methodology. However, they are beyond the scope of this paper.
As input data, the proposed methodology uses a database that contains the technical characteristics of commercially available BESS such as efficiency, depth of discharge (DoD), and lifecycle, as well as their related capital and operating and maintenance (O&M) costs.

2.1. Set of Feasible Power and Energy Ratings Pairs

The selection of the set of feasible power and energy pairs consists of determining a feasible set of power and energy ratings pairs (commercially available) for the BESS { P k , E k } k = 1 N , where P k and E k represent the rated power and energy capacity of pair k, respectively. The selection is performed considering that, for peak-shaving applications, the BESS must be able to supply energy during at least some hours of the day. Then, for each pair of power and energy { P k , E k } previously selected, the daily scheduling is determined.

2.2. BESS Scheduling

The BESS scheduling defines the optimal charging/discharging schedule of the BESS for each day during the control period. To minimize the costs of the DN, the charge/discharge operation must be scheduled so as to store energy during periods of low energy prices (light-load periods) and discharge during the hours of the day in which the peak demand of the DN occurs [24]. For this purpose, the BESS model used in this work considers the stored energy as a state variable [24,27]. The energy level in the BESS is calculated as the difference between the stored energy of two consecutive stages [27]:
S o C t = S o C t 1 + Δ t · P t / η d     P t < 0
S o C t = S o C t 1 + Δ t · P t · η c     P t 0
where S o C t is the state of charge of the BESS (stored energy) at time t , Δ t is the considered time period (one hour in this work), and P t is the power discharged from the storage unit or the power charged from the grid at time t . It is important to note that P t is assumed constant and equal to the average power during the time interval [ t ; t 1 ] . Then, the energy taken/injected by the BESS at time t is given by Δ t · P t . A positive value of P t indicates charging and a negative value indicates the discharging of the BESS. Finally η d and η c are the discharge and charge efficiency of the BESS, respectively. The stored energy within the BESS is limited by its minimum and maximum state of charge, S o C min and S o C max , respectively, as follows:
S o C min S o C t S o C max t
Additionally the BESS must satisfy the following constraint during its operation:
| P t | P B E S S max t
where P B E S S max is the maximum rate of charge/discharge of the battery. It is important to note that it is assumed that the BESS can change its power instantaneously, i.e., ramp rate constraints are negligible. Moreover, a constraint imposing that at the end of each day in the control period the storage level must be the same as at the beginning of each day is also considered [13]:
S o C T = S o C 0

2.3. Economic Evaluation

Given the scheduling of each BESS, the economic evaluation is performed. In this part, the total costs of the DN (including the BESS) are evaluated based on Equation (6) over the lifespan of the battery, where C c a p i t a l B E S S is the capital cost of the BESS, N P V ( O & M ) is the NPV of the O&M costs of the BESS, N P V ( E L C E S S ) is the NPV of the energy costs due to the BESS losses, and N P V ( P P C ) is the NPV of the peak power charges paid by the DN. For this purpose, only one cycle per day is considered.
O F = C c a p i t a l B E S S + N P V ( O & M ) + N P V ( E L C E S S ) + N P V ( P P C )
The present values are calculated over the BESS life span according to:
N P V ( O & M ) = O & M · F C
N P V ( E L C B E S S ) = E L C B E S S · F G 1
N P V ( P P C ) = P P C · F G 2
where F C , F G 1 , and   F G 2 are annuity factors to obtain the pertinent present values, which are calculated based on:
F C = 1 i r { 1 1 ( 1 + i r ) T }
F G 1 = 1 i r g 1 { 1 ( 1 + g 1 1 + i r ) T }
F G 2 = 1 i r g 2 { 1 ( 1 + g 2 1 + i r ) T }
In the equations above, i r is the interest rate, g 1 is the annual growth of the energy price, g 2 is the annual growth of the peak power price paid by the DN, and T is the BESS lifetime in years. In Equation (9), the yearly peak power charges paid by the DN are calculated according to:
P P C = P P P · P p e a k · 12 [ $ / year ]
where P P P is the peak power price in [ $ kW · month ] and P p e a k is the peak demand of the DN in [ kW ] measured during the control period. For further details in this regard, please see Section 3.1.
The operating and maintenance (O&M) costs of a BESS are considered to be a constant yearly rate during the lifetime of the project and are estimated as a fixed percentage of the capital cost [28,29]. The total costs of a BESS can be defined as a function of the capital costs, O&M costs, and other costs related to specific technologies [30]. The capital costs of an ESS can be broken down into an energy and a power component. The energy cost for storage is the cost of the devices that actually store the energy (storage medium) [10,31]. The power cost would include the synchronous machines in a PHS and the power electronics in a battery system [10]. The energy costs are expressed in cost per unit of stored energy ($/kWh), while the power costs in cost per unit of power ($/kW). Consequently the BESS capital costs can be expressed as [24,30]:
C c a p i t a l B E S S = C P P B E S S + C E E B E S S
where P B E S S and E B E S S are the rated power and energy of the BESS in kW and kWh, respectively, and C P and C E are their specific costs in $/kW and $/kWh.
Table 1 shows estimates for the cost of power and energy of several battery technologies combining the information contained in [6,10,14,32,33]. This separation in the capital costs of energy and power allows the power and energy ratings of the BESS to be dimensioned independently, thereby facilitating the optimization involved in the sizing process.
As shown in Table 1, there is a wide range of feasible costs for different BESS. They can vary dramatically depending on the technology employed and the configuration of the storage system in terms of discharge capacity (kW) and energy storage capacity (kWh). Site-specific conditions and some particular requirements depending on the application may also cause the BESS capital costs to vary significantly from the estimations given here [6]. The information summarized in Table 1 should only be regarded as an estimate.
The annual fixed O&M costs per year in $/year can be defined according to [10,34]:
O & M = U M C · P B E S S
where U M C are O&M costs in $/kW/year and P B E S S is the rated power of the BESS in kW. Table 2 summarizes the O&M costs for some BESS technologies according to [10,14,33].

2.4. Search of { P * , E * } That Minimize the Total Costs for the DN

The process described above runs iteratively until all the power and energy ratings pairs included in the feasible set have been considered. Once this iterative process is finished, the last step is to select the power and energy rating pair { P * , E * } that minimizes the total cost for the DN, i.e., the value of Equation (6).

3. Case Study: Chilectra Distribution Network

The case study for this work is the Chilean DN Chilectra. Chilectra is the DN that supplies Chile's capital, Santiago, serving around one third of the country´s population. This DN has a current electricity peak demand of around 2000 MW, with an annual energy demand of around 14,500 GWh. It is important to remark that the peak value of 2000 MW is achieved during the night hours and that in the remaining hours of the day the load is appreciably lower, thus justifying peak shaving services.

3.1. Demand Charges in Chile

Regulation concerning power demand payments in DNs varies from place to place. In the Chilean case, non-regulated consumers and DNs have to pay a power charge to their suppliers (electric generation companies). This charge equals the power price times of the contract peak power. Every month, within the control period, the peak power is measured every hour. The control period in Chile includes the months from April to September, from 18:00 to 23:00 h. The contract peak power corresponds to the average of the two highest peak powers within the control period.
Table 3 depicts the economic parameters considered in the optimization. The energy price and the peak power charge are defined according to the current values in the system. The growth rate of peak demand in the DN is established based on the trend observed in the last few years.

3.2. Feasible Pairs of Energy and Power

As shown in Figure 1, the first step of the methodology consists of determining a feasible set of power and energy ratings pairs (commercially available) for the BESS. Since the maximum power demand in Chilectra is around 2000 MW, the maximum BESS power rating is limited to 200 MW in order to restrict the maximum BESS penetration level to 10%. We select BESS with power ratings between 1 and 200 MW considering steps of 0.5 MW. Although the control period for the peak power determination in Chile includes 5 h per day (from 18:00 to 23:00 h), this time frame has only monitoring purposes. Within the control period, the peak load is only achieved during a maximum of a couple of hours. Thus, to reduce the BESS investment costs required for the peak shaving, the maximum BESS energy use considered in the optimization process is constrained to 4 h.

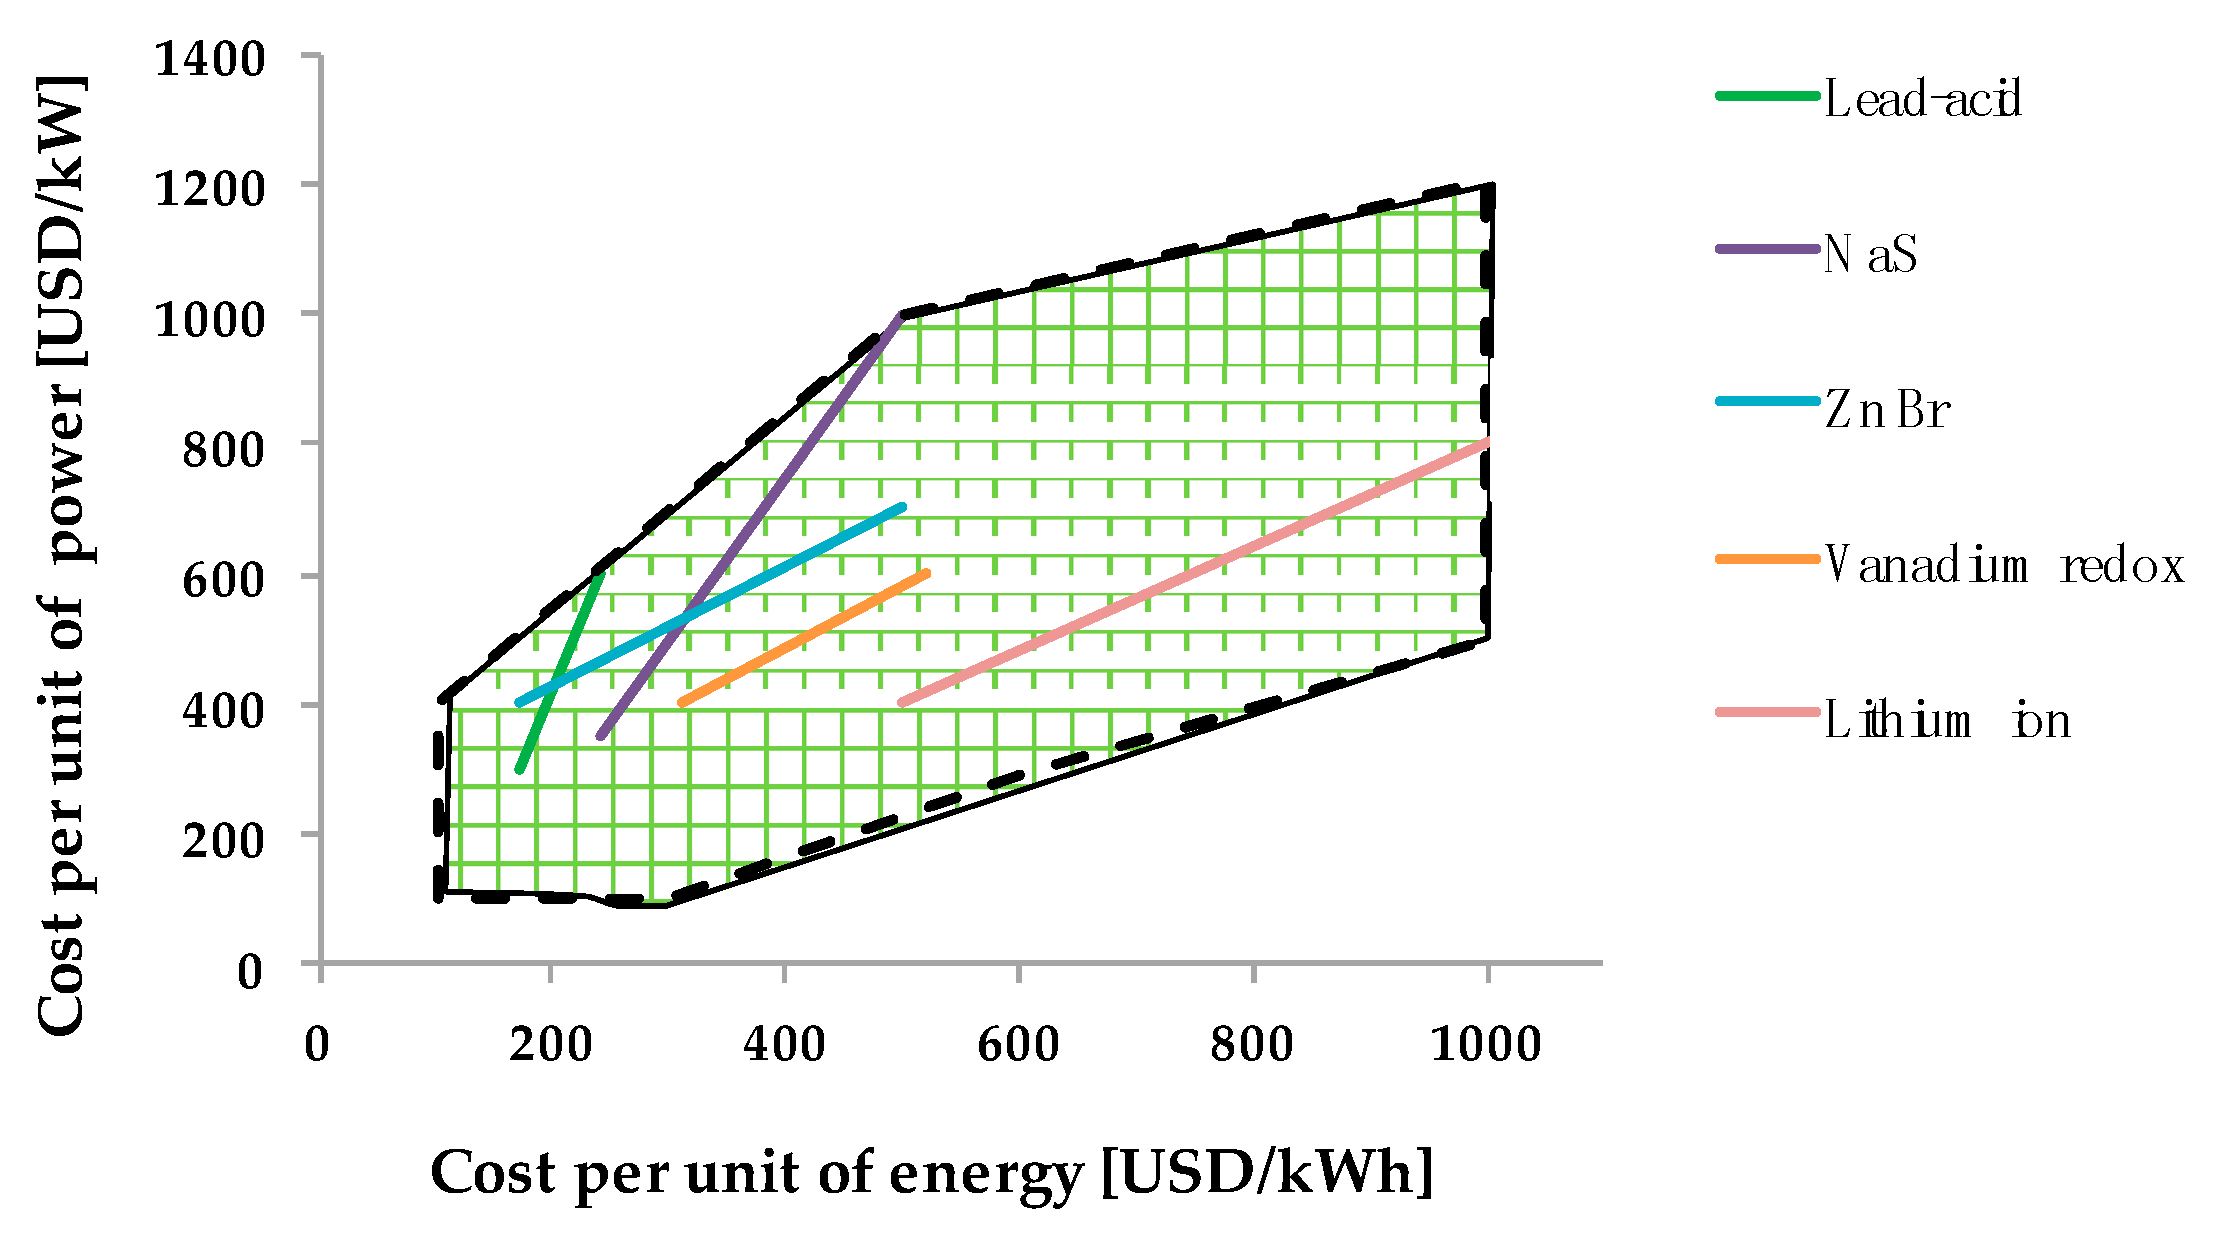
3.3. Considered Costs of Energy and Power

The set of feasible energy and power costs for the BESS to consider in the optimization has been defined based on Table 1. The set is shown in the green-hatched area of Figure 2. This area aims to represent several commercially available BESS today and in the near future. It is defined by closely enclosing the estimates of future cost curves for various BESS technologies. These estimates are generated based on linear extrapolations of the information contained in Table 1. A minimum of 100 USD/kWh and 100 USD/kW has been considered for the energy and power costs, respectively. This is a reasonable assumption since the costs can be expected to decrease as more production and operational experience is gained throughout the world. The maximum values in the figure are according to Table 1.

4. Results

This section presents the results obtained from the application of the proposed methodology for the sizing and selection of BESS for peak shaving in the DN (see Section 3). For a first round of simulations, a standard battery (SB) with the technical parameters shown in Table 4 is used as the base case. For simplification purposes, the O&M costs are assumed to be a constant yearly rate of 20 USD/kW · year.

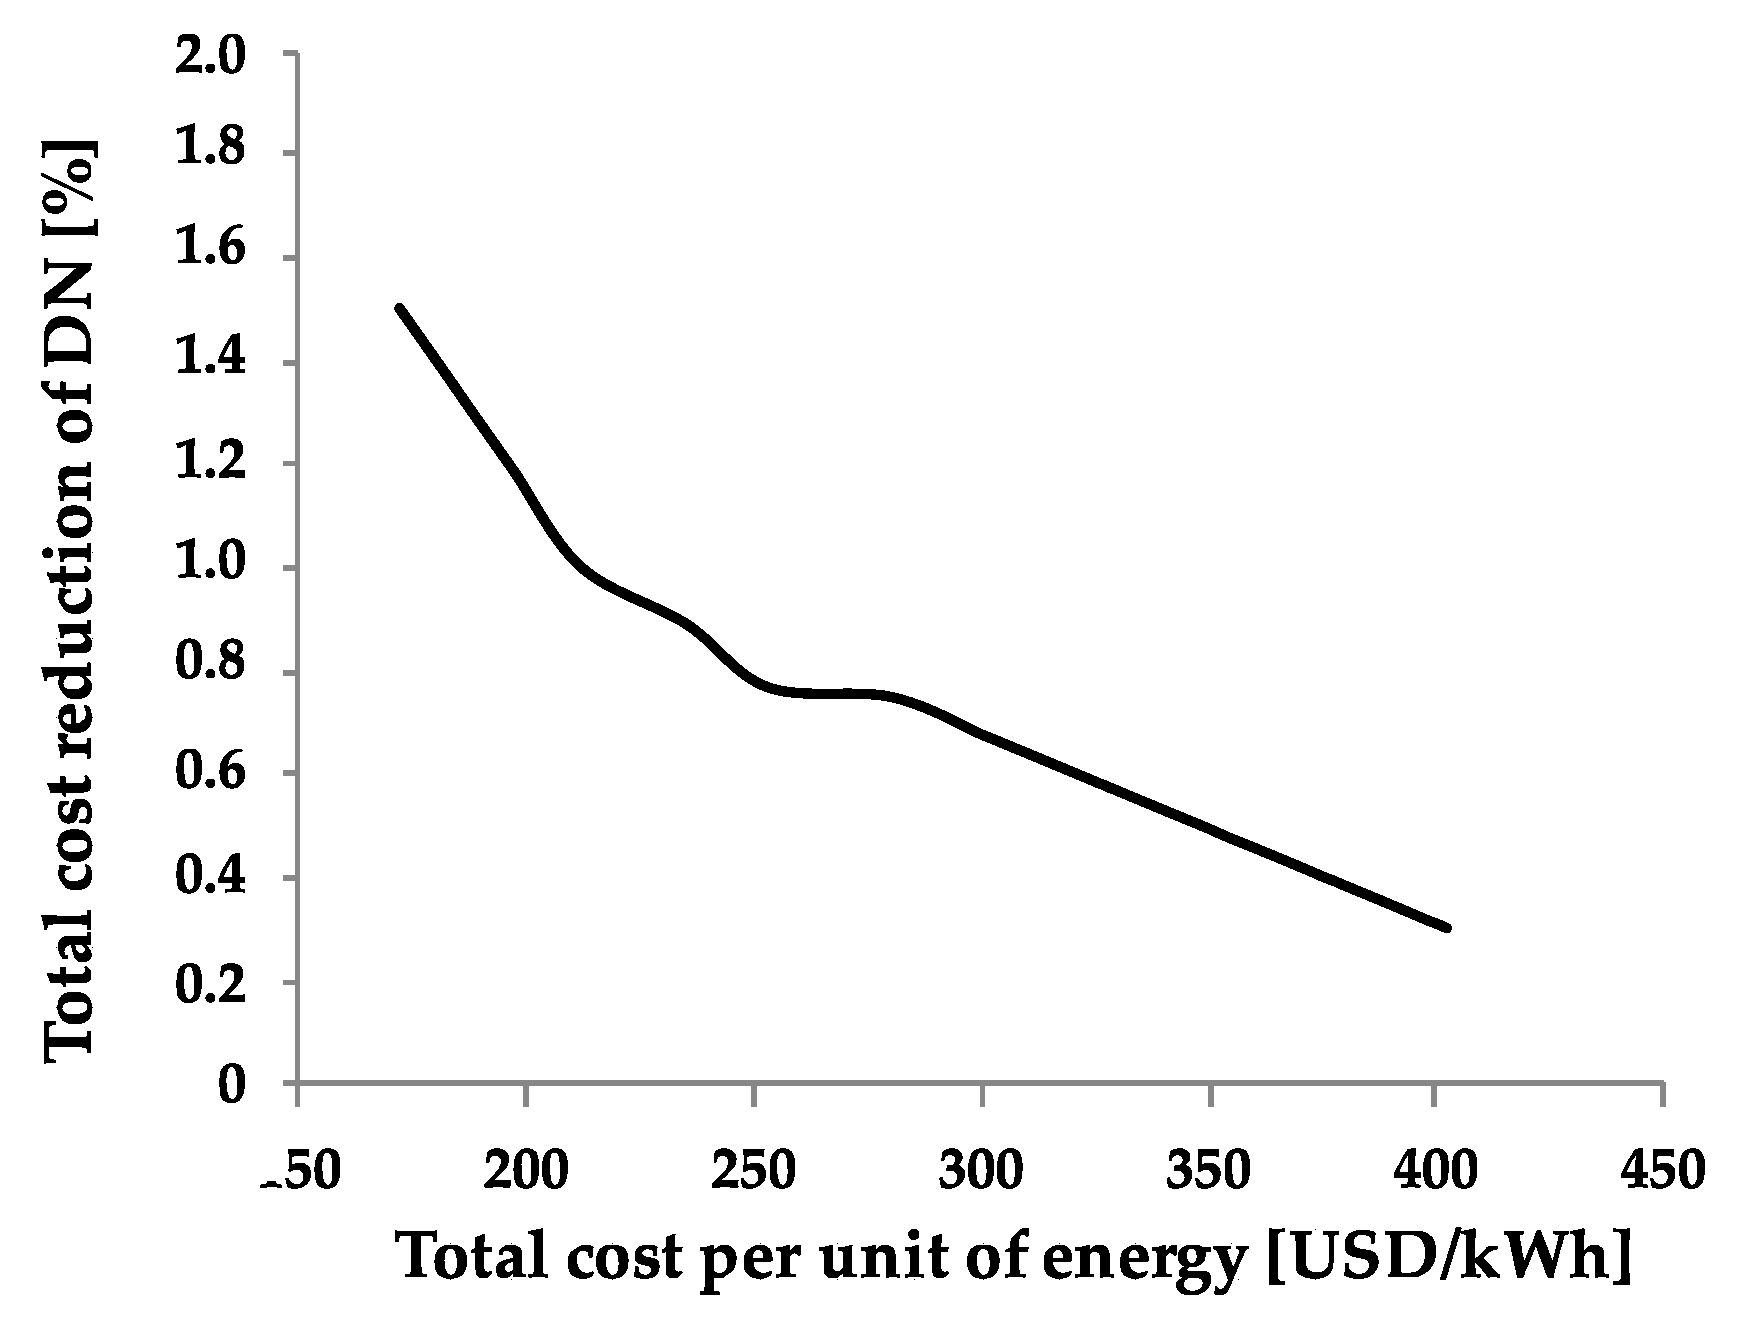
4.1. Break-Even Points for the SB

This section aims to determine a set of break-even points for the standard battery (see Table 4) when considering peak shaving applications. To facilitate this, the methodology presented in Figure 1 is applied, considering the set of energy and power costs shown in the green-hatched area of Figure 2.
The red-shaded area shown in Figure 3 represents the power and energy costs for which the optimization problem can be solved, i.e., for these set of capital costs, the DisCo can reduce its total costs through the incorporation of a BESS. For the rest of the costs enclosed by the black dotted line, it is not possible to find a BESS able to reduce the costs of the DN by only considering the benefits of peak shaving.
For the conditions assumed in this case, Figure 3 shows that lead-acid and zinc-bromine (ZnBr) batteries are able to reduce the total costs of the DN. Indeed, the efficiencies and life cycles considered in this case (see Table 4) are according to the real values of commercially available lead-acid and ZnBr batteries [33,35]. The break-even costs are around 400 USD/kW and 200 USD/kWh. Under these conditions of life cycles and efficiency, the other BESS technologies are still required to further reduce their capital costs in order to be economically competitive when only considering peak shaving applications. Nevertheless, considering more benefits from the BESS would probably change this situation.
Figure 4 shows the cost reductions for the DN when considering the pairs of power and energy costs at the red borderline shown in Figure 3. The total cost per unit of energy T C E is calculated according to:
T C E = C P P r a t e d + C E E r a t e d E r a t e d [ USD kWh ]
From Figure 4 it is observed that the maximum cost reduction in the DN (1.5%) occurs when the total cost per unit of energy of the BESS is around 180 USD/kWh. For BESS with capital costs greater than 400 USD/kWh, no available battery technology is able to reduce the costs of the DN.

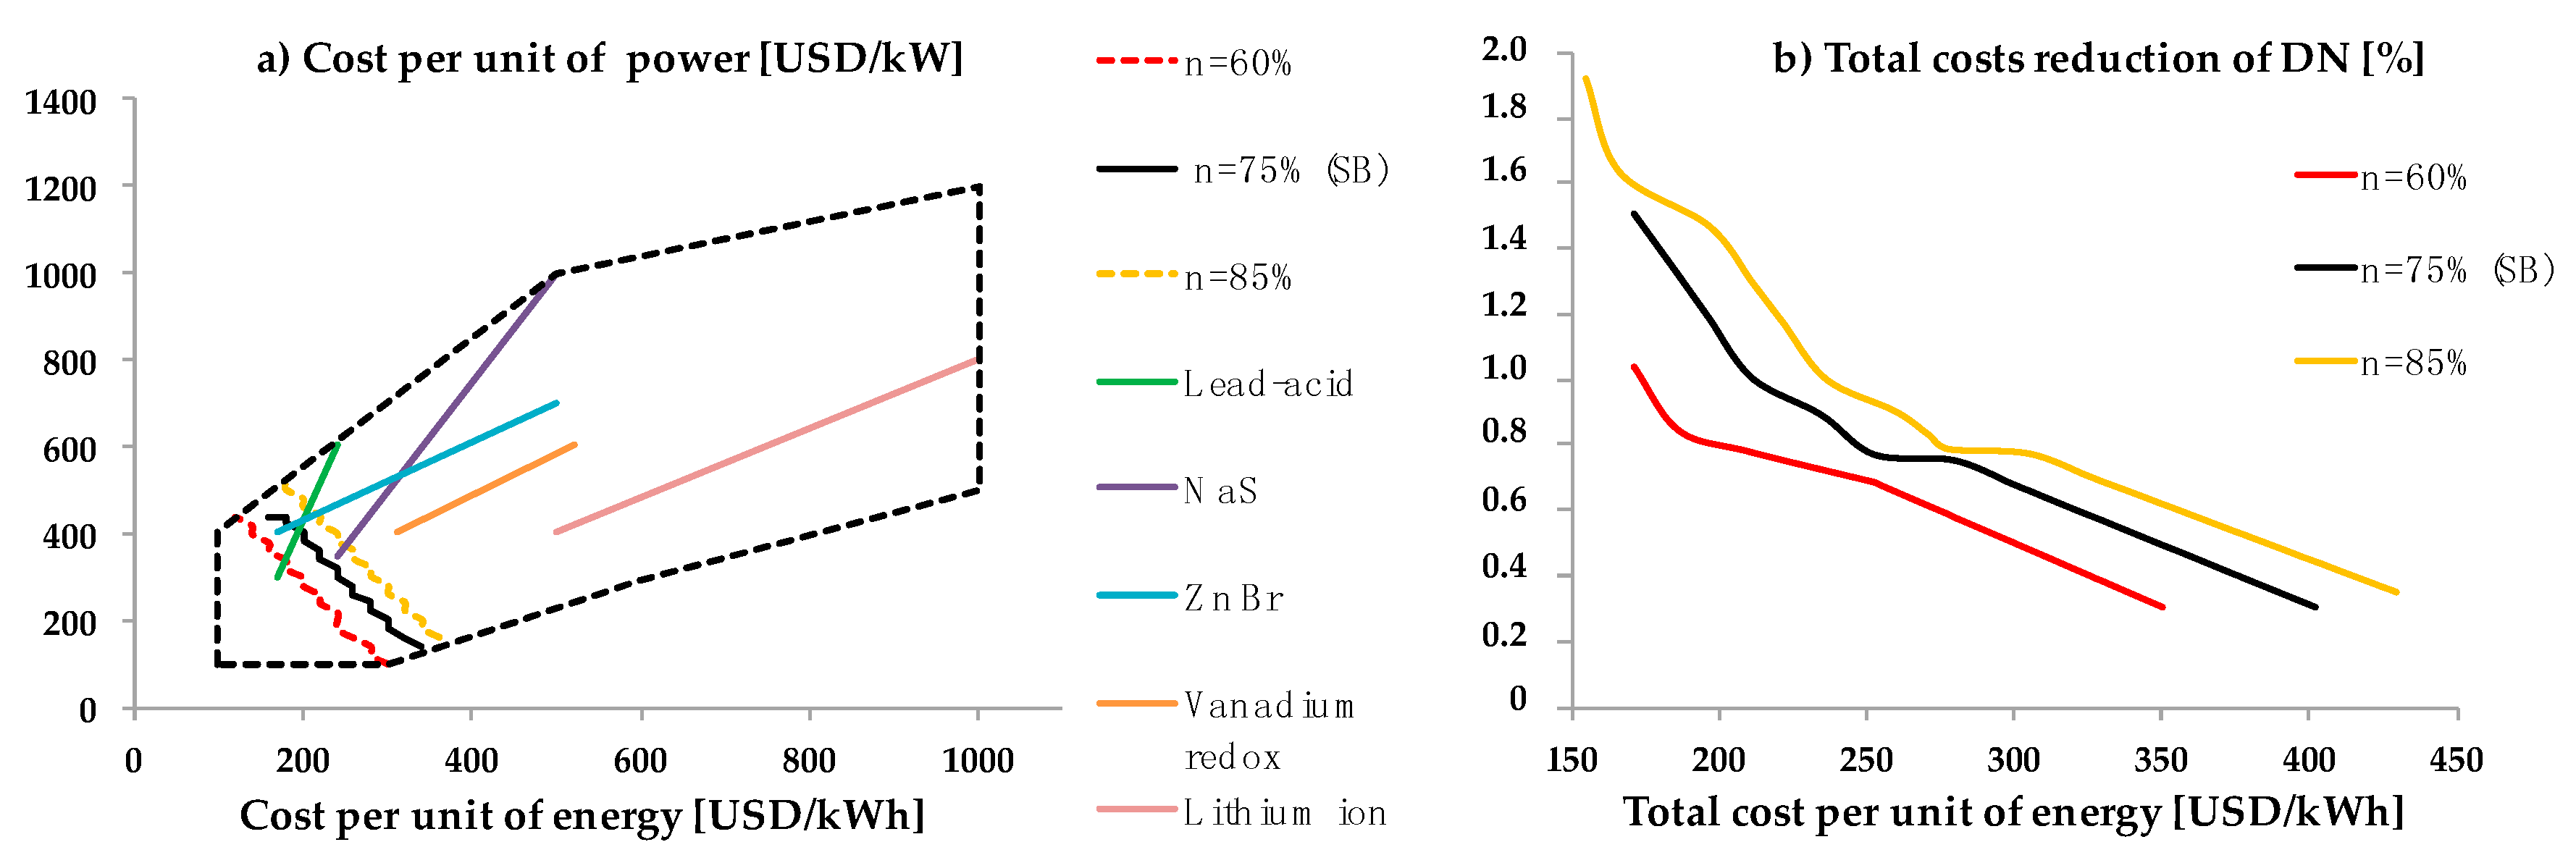
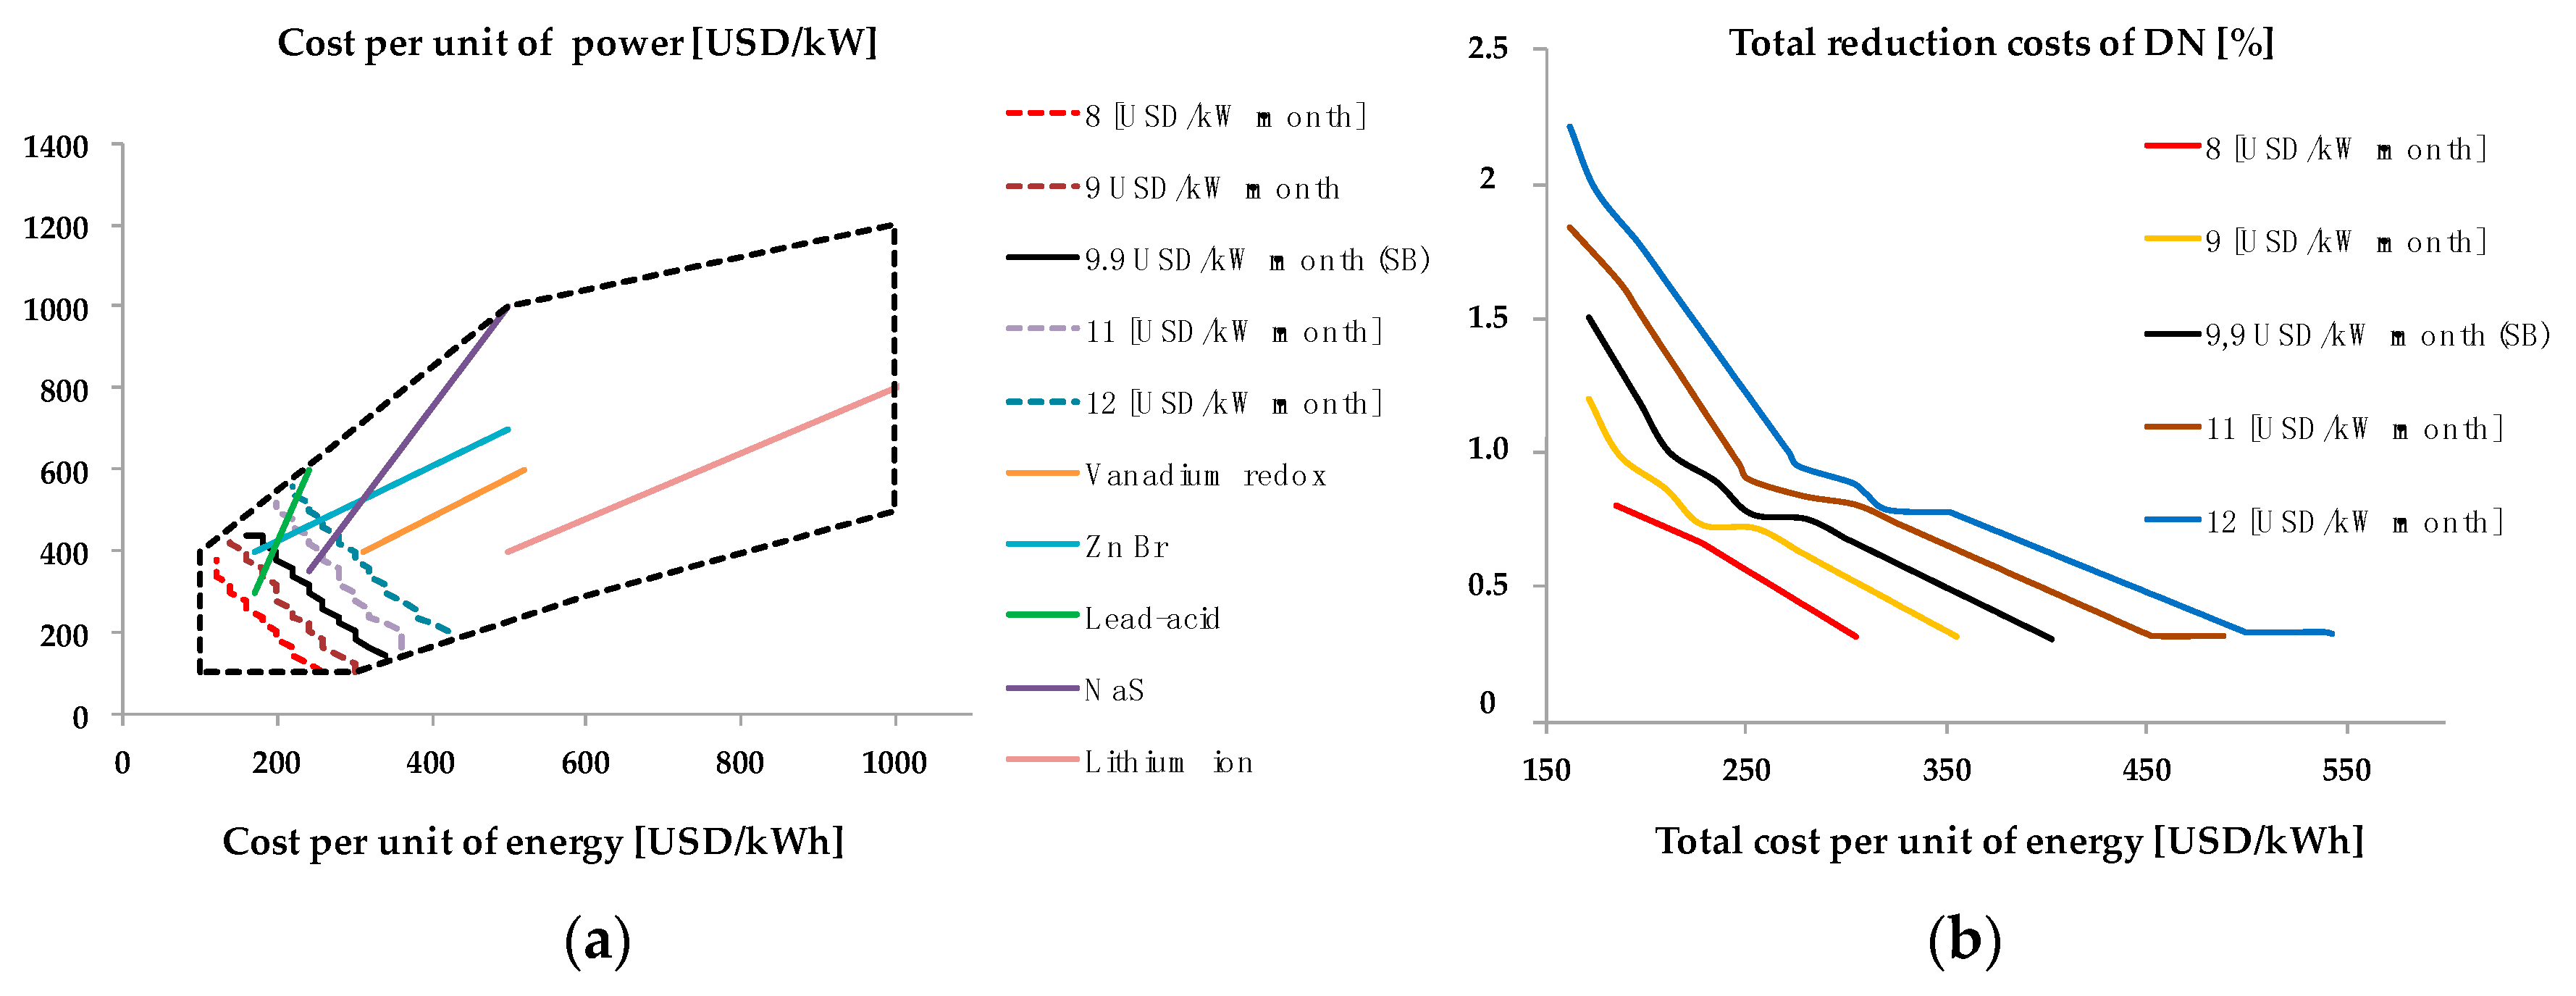
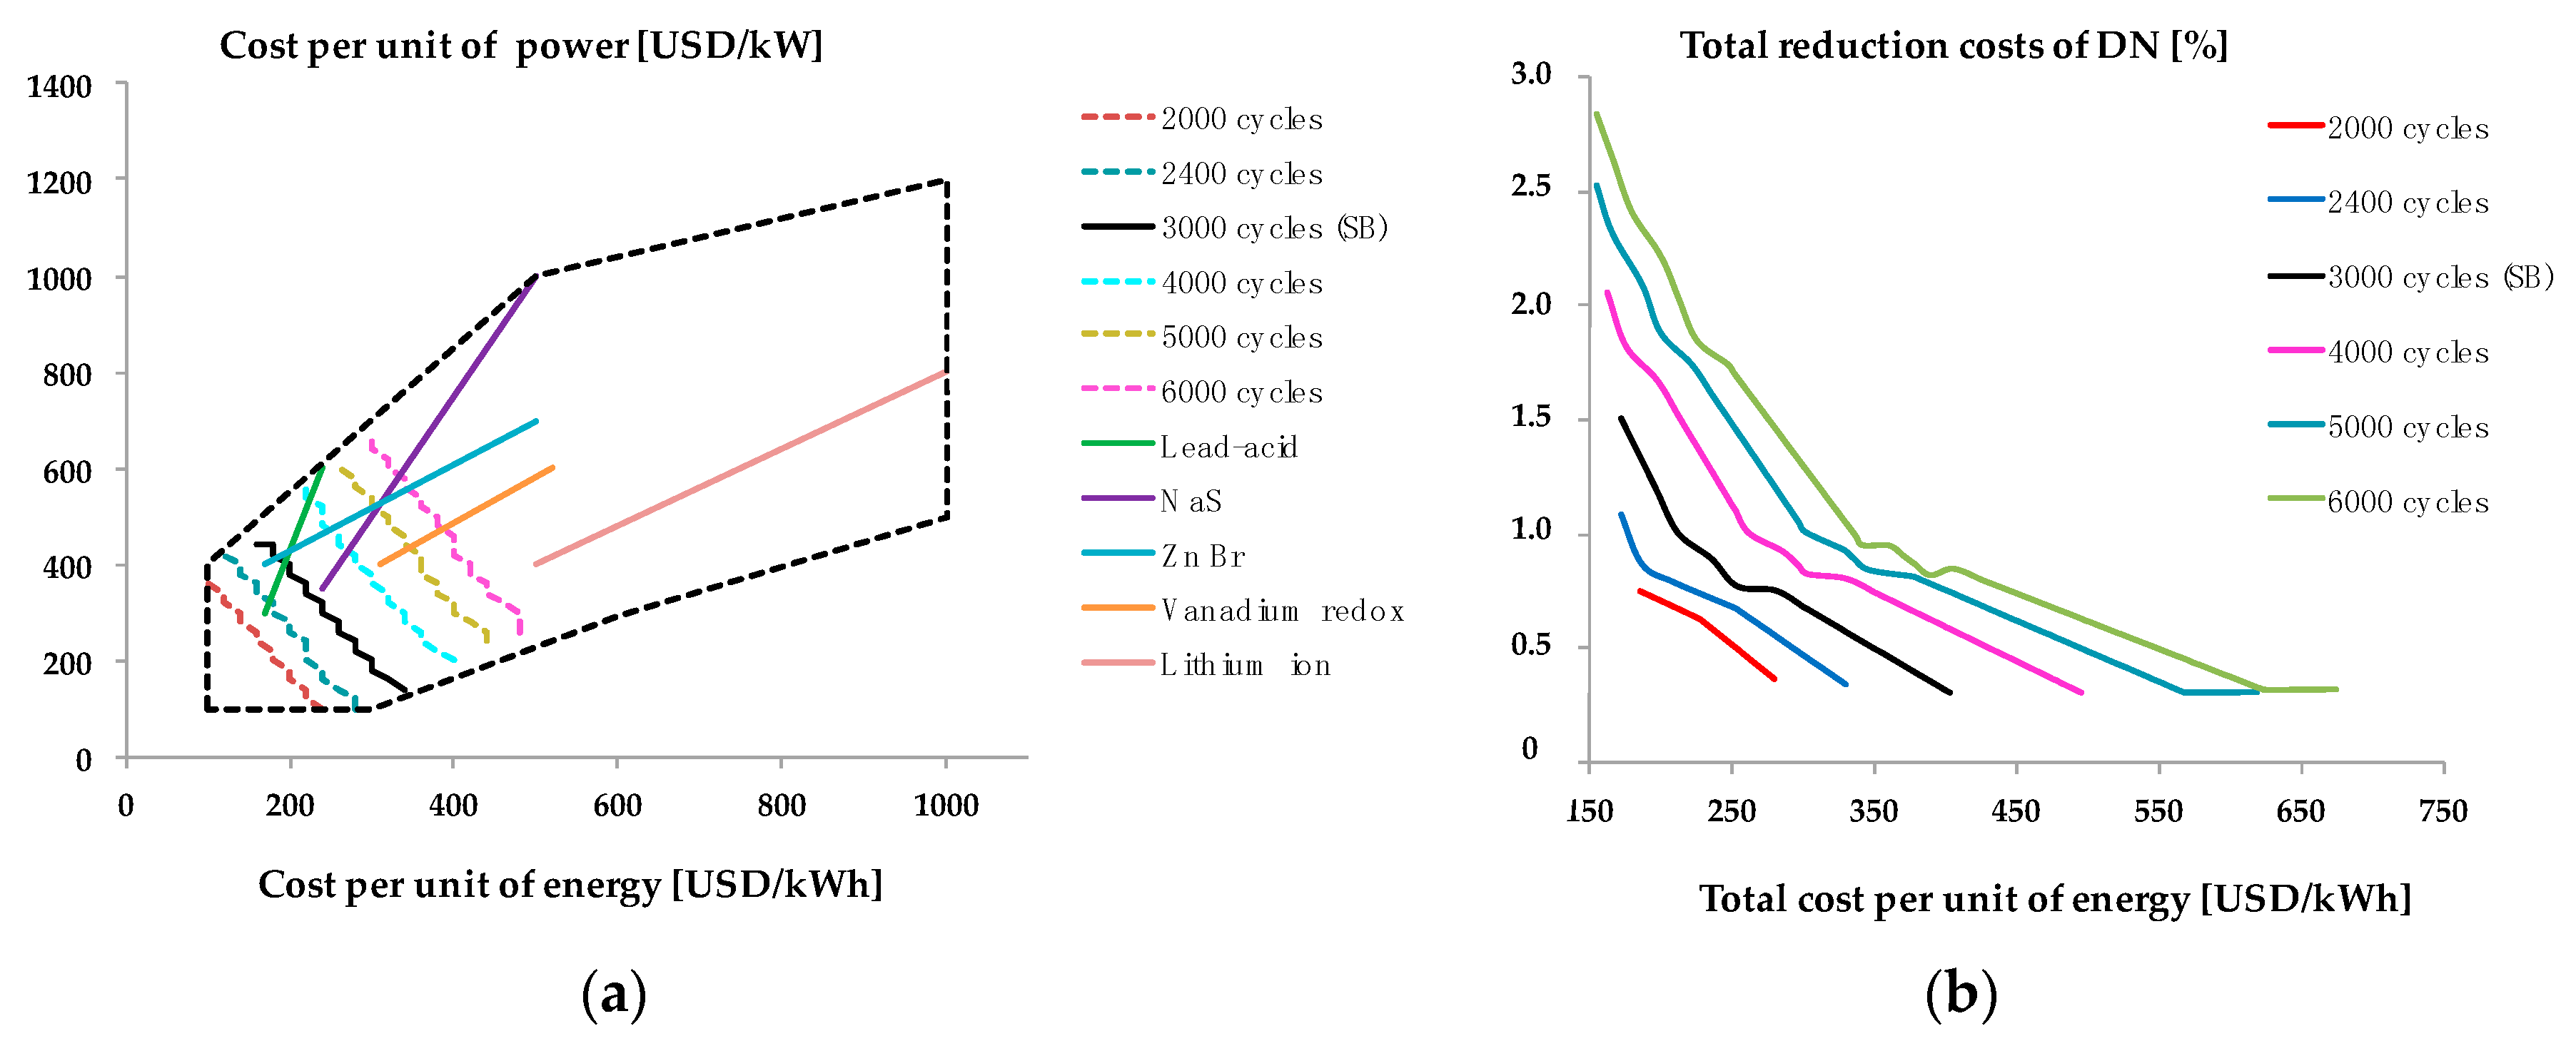
4.2. Sensitivity Analysis

Considering the high level of uncertainty present in the different parameters of the BESS, in this part a sensitivity analysis is performed according to Table 5.
In the previous section, the round trip efficiency of the SB was considered to be 75%. However, the efficiency of present commercially available BESS technologies can vary considerably, between 60% and 96% depending on the storage technology [4,6,7,8,14,22,25,32,33,34,35,36,37]. In this context, the following figure shows (a) how the cost boundary moves as the efficiency of the battery changes and (b) the cost reductions for the DN when considering the pairs of power and energy costs at the borderlines.
From Figure 5a it is observed that as the BESS efficiency decreases, the optimization requires lower BESS capital costs in order to reduce the costs of the DN when only considering peak shaving applications. Actually, increasing the BESS efficiency moves the cost boundary to the right, thus allowing more expensive BESS technologies to decrease the costs of the DN. Indeed, for an efficiency of 85%, not only Lead Acid and ZnBr batteries are economically viable but also NaS batteries as well. This is a realistic result since the current efficiencies of NaS batteries are actually between 75% and 85% [35]. In the case of NaS batteries, the break-even costs are 340 USD/kW and 260 USD/kWh. From Figure 5b it can be seen that the DN can reduce its costs until 2% when considering a BESS with an efficiency of 85%.
Figure 6 presents the same analysis as before but by changing the power price paid by the DisCo between 8 and 12 USD/kW · month.
Figure 6a shows that the power price is a relevant parameter to consider when sizing a BESS for peak shaving applications in a DN. An increase in the power price to 12 USD/kW · month, moves the cost boundary quite near to the costs levels upon which vanadium redox batteries start to be economically viable, i.e., able to reduce the costs of the DN. Indeed, the break-even costs in this case are around 400 USD/kW and 300 USD/kWh, values quite close to the costs presented in Table 1 for vanadium redox batteries. Considering a power price of 12 USD/kW · month, the maximum cost reduction for the DN is around 2.3%.
For the standard battery, we considered a life of 3000 cycles. However, the cycles of current commercially available batteries can vary considerably depending on the technology involved and the depth of discharge used in the operation. Figure 7 shows how the cost boundary moves as the cycles of the BESS change.
From Figure 7a, it can be concluded that the life span of the battery is a key parameter to consider when sizing a BESS for peak shaving applications. Indeed, to increase the life cycle to 5000 cycles allows vanadium redox batteries to reduce the costs of the DN when only considering peak shaving applications. According to [25,36,37], BESS based on vanadium redox can reach more than 10,000 life cycles [25,36,37]. Considering only 5000 life cycles, the break-even costs for vanadium redox batteries are 420 USD/kW and 360 USD/kWh, which is in line with the costs presented in Table 1. The maximum cost reduction for the DN in this case is around 2.5%.

5. Conclusions

This paper has investigated the interaction between the optimal sizing of BESSs and key factors affecting their profitability when considering peak shaving applications in DNs. An optimization methodology for the sizing of ESSs was formulated from a distribution company perspective to implement the proposed approach.
The results obtained have shown that all the parameters considered in the study, namely, round trip efficiency, life cycles, and power price paid by the DN due to peak demand, are important when sizing BESS for peak shaving applications. When considering a round trip efficiency of 75% and a life cycle of 3000, the break-even costs of the BESS are around 400 USD/kW and 200 USD/kWh, which corresponds to currently available lead-acid and zinc-bromine batteries. The BESS efficiency proved to be another important parameter. Indeed, when the BESS efficiency increases until 85%, lead-acid, ZnBr, and also NaS batteries are able to reduce the costs of the DN. In fact, the break-even costs for NaS batteries are around 340 USD/kW and 260 USD/kWh. Finally, by increasing their life cycle to 5000 cycles, it was found vanadium redox batteries are also able to reduce the costs of the DN when only considering peak shaving applications.
As a final conclusion, depending on the values of round trip efficiency, life cycles, and power price, there are four BESS technologies that are already profitable when only considering peak shaving applications: lead acid, NaS, ZnBr, and vanadium redox. It is important to remark that this result was obtained considering the parameters of commercially available BESS technologies. Nevertheless, further studies are required in order to include the effects of BESS aging since this is a key aspect of BESS that was not included in this study. Furthermore, a sensitivity analysis with respect to the maximum BESS energy use is also proposed for future studies.

Acknowledgments

The authors would like to acknowledge the support of the Chilean Council of Scientific and Technological Research, CONICYT (Fondap/15110019, FONDECYT/11160228, and CONICYT-PCHA/MAGISTER NACIONAL/2013-22130176), the Complex Engineering Systems Institute (ICM: P-05-004-F, CONICYT: FB0816), and the Fulbright NEXUS Regional Scholar Program in the realization of this work.

Author Contributions

Claudia Rahmann wrote the paper and conceived the proposed methodology to find the break-even points of different BESS technologies considering a wide range of life cycles, efficiencies, energy prices, and power prices. Benjamin Mac-Clure collected the required data and performed the calculations. Vijay Vittal and Felipe Valencia advised and helped frame the project and revised the manuscript.

Conflicts of Interest

The authors declare no conflict of interest.

References

  1. Even, A.; Neyens, J.; Demouselle, A. Peak shaving with batteries. In Proceedings of the 12th International Conference on Electricity Distribution, Birmingham, UK, 17–21 May 1993. [Google Scholar]
  2. Wang, Z.; Wang, S. Grid Power Peak Shaving and Valley Filling Using Vehicle-to-Grid Systems. IEEE Trans. Power Deliv. 2013, 28, 1822–1829. [Google Scholar] [CrossRef]
  3. Nykamp, S.; Molderink, A.; Hurink, J.L.; Smit, G.J.M. Storage operation for peak shaving of distributed PV and wind generation. In Proceedings of the IEEE PES Innovative Smart Grid Technologies Conference, Washington, DC, USA, 24–27 February 2013. [Google Scholar]
  4. Venu, C.; Riffonneau, Y.; Bacha, S.; Baghzouz, Y. Battery Storage System sizing in distribution feeders with distributed photovoltaic systems. In Proceedings of the IEEE PowerTech, Bucharest, Romania, 28 June–2 July 2009. [Google Scholar]
  5. Guerrero, M.A.; Romero, E.; Barrero, F.; Milanes, M.I.; González, E. Overview of Medium Scale Energy Storage Systems. In Proceedings of the Compatibility and Power Electronics, Badajoz, Spain, 20–22 May 2009. [Google Scholar]
  6. Chen, H.; Cong, T.N.; Yang, W.; Tan, C.; Li, Y.; Ding, Y. Progress in electrical energy storage system: A critical review. Prog. Nat. Sci. 2009, 19, 291–312. [Google Scholar] [CrossRef]
  7. Masaud, T.M.; Lee, K.; Sen, P.K. An overview of energy storage technologies in electric power systems: What is the future? In Proceedings of the North American Power Symposium, Arlington, TX, USA, 26–28 September 2010. [Google Scholar]
  8. Manz, D.; Keller, J.; Miller, N. Value Propositions for Utility-Scale Energy Storage. In Proceedings of the IEEE/PES Power Systems Conference and Exposition, Phoenix, AZ, USA, 20–23 March 2011. [Google Scholar]
  9. Geurin, S.O.; Barnes, A.K.; Balda, J.C. Smart Grid Applications of Selected Energy Storage Technologies. In Proceedings of the IEEE PES Innovative Smart Grid Technologies, Washington, DC, USA, 16–20 January 2012. [Google Scholar]
  10. Poonpun, P.; Jewell, W.T. Analysis of the Cost per Kilowatt Hour to Store Electricity. IEEE Trans. Energy Convers. 2008, 23, 529–534. [Google Scholar] [CrossRef]
  11. Bahramirad, S.; Reder, W.; Khodaei, A. Reliability-Constrained Optimal Sizing of Energy Storage System in a Microgrid. IEEE Trans. Smart Grid 2012, 3, 2056–2062. [Google Scholar] [CrossRef]
  12. Bahramirad, S.; Daneshi, H. Optimal Sizing of Smart Grid Storage Management System in a Microgrid. In Proceedings of the IEEE PES Innovative Smart Grid Technologies, Washington, DC, USA, 16–20 January 2012. [Google Scholar]
  13. Chen, S.X.; Gooi, H.B.; Wang, M.Q. Sizing of energy storage for microgrids. IEEE Trans. Smart Grid 2012, 3, 142–151. [Google Scholar] [CrossRef]
  14. Ross, M.; Hidalgo, R.; Abbey, C.; Joos, G. Analysis of Energy Storage Sizing and Technologies. In Proceedings of the IEEE Electric Power & Energy Conference, Halifax, NS, USA, 25–27 August 2010. [Google Scholar]
  15. Bahmani-Firouzi, B.; Azizipanah-Abarghooee, R. Optimal sizing of battery energy storage for micro-grid operation management using a new improved bat algorithm. Int. J. Electr. Power Energy Syst. 2014, 56, 42–54. [Google Scholar] [CrossRef]
  16. Aghamohammadi, M.R.; Abdolahinia, H. A new approach for optimal sizing of battery energy storage system for primary frequency control of islanded Microgrid. Int. J. Electr. Power Energy Syst. 2014, 54, 325–333. [Google Scholar] [CrossRef]
  17. Le, H.T.; Nguyen, T.Q. Sizing energy storage systems for wind power firming: An analytical approach and a cost-benefit analysis. In Proceedings of the IEEE Power and Energy Society General Meeting–Conversion and Delivery of Electrical Energy in the 21st Century, Pittsburgh, PA, USA, 20–24 July 2008. [Google Scholar]
  18. Brekken, T.K.A.; Yokochi, A.; von Jouanne, A.; Yen, Z.Z.; Hapke, H.M.; Halamay, D.A. Optimal Energy Storage Sizing and Control for Wind Power Applications. IEEE Trans. Sustain. Energy 2011, 2, 69–77. [Google Scholar] [CrossRef]
  19. Bludszuweit, H.; Dominguez-Navarro, J.A. A Probabilistic Method for Energy Storage Sizing Based on Wind Power Forecast Uncertainty. IEEE Trans. Power Syst. 2011, 26, 1651–1658. [Google Scholar] [CrossRef]
  20. Wang, X.Y.; Vilathgamuwa, D.M.; Choi, S.S. Determination of Battery Storage Capacity in Energy Buffer for Wind Farm. IEEE Trans. Energy Convers. 2008, 23, 868–878. [Google Scholar] [CrossRef]
  21. Ru, Y.; Kleissl, J.; Martinez, S. Storage Size Determination for Grid-Connected Photovoltaic Systems. IEEE Trans. Sustain. Energy 2013, 4, 68–81. [Google Scholar] [CrossRef]
  22. Kaldellis, J.K.; Zafirakis, D.; Kondili, E. Optimum sizing of photovoltaic-energy storage systems for autonomous small islands. Int. J. Electr. Power Energy Syst. 2010, 32, 24–36. [Google Scholar] [CrossRef]
  23. Akatsuka, M.; Hara, R.; Kita, H.; Ito, T.; Ueda, Y.; Saito, Y. Estimation of battery capacity for suppression of a PV power plant output fluctuation. In Proceedings of the 35th IEEE Photovoltaic Specialists Conference, Honolulu, HI, USA, 20–25 June 2010. [Google Scholar]
  24. Chacra, F.A.; Bastard, P.; Fleury, G.; Clavreul, R. Impact of Energy Storage Costs on Economical Performance in a Distribution Substation. IEEE Trans. Power Syst. 2005, 20, 684–691. [Google Scholar] [CrossRef]
  25. Dunn, B.; Kamath, H.; Tarascon, J.-M. Electrical Energy Storage for the grid: A battery of Choices. Sci. Mag. 2011, 334, 928–935. [Google Scholar] [CrossRef] [PubMed]
  26. Mercier, P.; Cherkaoui, R.; Oudalov, A. Optimizing a Battery Energy Storage System for Frequency Control Application in an Isolated Power System. IEEE Trans. Power Syst. 2009, 24, 684–691. [Google Scholar] [CrossRef]
  27. Chen, C.; Duan, S.; Cai, T.; Liu, B.; Hu, G. Optimal Allocation and Economic Analysis of Energy Storage System in Microgrids. IEEE Trans. Power Electron. 2011, 26, 2762–2773. [Google Scholar] [CrossRef]
  28. Miranda, I.; Silva, N.; Leite, H. Distribution Storage System Optimal Sizing and Techno-Economic Robustness. In Proceedings of the IEEE International Energy Conference and Exhibition, Florence, Italy, 9–12 September 2012. [Google Scholar]
  29. Miranda, I.; Silva, N.; Leite, H. Technical and Economic Assessment for Optimal Sizing of Distributed Storage. In Proceedings of the 3rd IEEE PES International Conference and Exhibition on Innovative Smart Grid Technologies, Berlin, Germany, 14–17 October 2012. [Google Scholar]
  30. Chakraborty, S.; Senjyu, T.; Toyama, H.; Saber, A.Y.; Funabashi, T. Determination methodology for optimising the energy storage size for power system. IET Gener. Transm. Distrib. 2009, 3, 987–999. [Google Scholar] [CrossRef]
  31. Makarov, Y.V.; Du, P.; Kintner-Meyer, M.C.W.; Jin, C.; Illian, H. Sizing Energy Storage to Accommodate High Penetration of Variable Energy Resources. IEEE Trans. Sustain. Energy 2012, 3, 34–40. [Google Scholar] [CrossRef]
  32. Schoenung, S. Energy Storage Systems Cost Update: A Study for the DOE Energy Storage Systems Program; Sandia National Laboratories: Albuquerque, NM, USA, 2011.
  33. Carnegie, R.; Gotham, D.; Nderitu, D.; Preckel, P.V. Utility Scale Energy Storage Systems. Internal Report of the State Utility Forecasting Group, 2013. Available online: https://www.purdue.edu/discoverypark/energy/assets/pdfs/SUFG/publications/SUFG%20Energy%20Storage%20Report.pdf (accessed on 16 June 2017).
  34. Atwa, Y.M.; El-Saadany, E.F. Optimal Allocation of ESS in Distribution Systems with a High Penetration of Wind Energy. IEEE Trans. Power Syst. 2010, 25, 1815–1822. [Google Scholar] [CrossRef]
  35. Díaz-Gonzalez, F.; Sumper, A.; Gomis-Bellmunt, O.; Villafáfila-Robles, R. A review of energy storage technologies for wind power applications. Renew. Sustain. Energy Rev. 2012, 16, 2154–2171. [Google Scholar] [CrossRef]
  36. Rastler, D. Electricity Energy Storage Technology Options: A White Paper Primer on Applications, Costs, and Benefits; Electric Power Research Institute: Palo Alto, CA, USA, December 2010. [Google Scholar]
  37. Divya, K.C.; Ostergaard, J. Battery energy storage technology for power systems—An overview. Electr. Power Syst. Res. 2009, 79, 511–520. [Google Scholar] [CrossRef]
Figure 1. Flowchart of the proposed methodology for sizing of BESS.
Energies 10 00833 g001
Figure 2. Energy and power costs for BESS considered in the optimization.
Energies 10 00833 g002
Figure 3. Break even costs for the SB.
Energies 10 00833 g003
Figure 4. Total cost reductions for the distribution network (DN) considering the SB.
Energies 10 00833 g004
Figure 5. (a) Effects of the battery efficiency on the break-even costs and (b) Total cost reductions for the DN for different BESS efficiencies.
Energies 10 00833 g005
Figure 6. (a) Effects of the power price on the break-even costs and (b) Total cost reductions for the DN for different power prices.
Energies 10 00833 g006
Figure 7. (a) Effects of the BESS life span on the break-even costs and (b) Total cost reductions for the DN for different life cycles of the BESS.
Energies 10 00833 g007
Table 1. Costs Estimation for Different BESS Technologies.
TechnologyCost Per Unit of Power [$/kW]Cost Per Unit of Energy [$/kWh]
Lead acid300–600170–240
NaS350–1000240–500
ZnBr400–700170–500
Vanadium Redox400–600310–520
Lithium ion400–1200500–1500
Table 2. Fixed operating and maintenance (O&M) Costs for Different BESS Technologies.
TechnologyO&M Costs [$/kW/Year]
Lead acid24.1–56.5
NaS25.7–46.7
ZnBr38.8–55.9
Vanadium Redox32.2–56.4
Lithium ion25
Table 3. Economical parameters.
ParameterValueUnite
Peak power price (PPP)9.9USD/kW · month
Energy price (EP)90.3USD /MWh
Interest rate ( i r ) 10%
Annual growth rate of the peak power price ( g 2 ) 5%
Table 4. Technical parameters of the standard battery (SB).
ParameterValue
Depth of discharge (DoD)80%
Round trip efficiency75%
Cycles3000
Table 5. Sensitivity analysis.
ParametersMinimumMaximum
Round trip efficiency [%]6085
Energy price [USD/MWh]50150
Power price [USD/kW · month]812
Cycles20006000

