Numerical and Experimental Studies on the Heat Transfer Performance of Copper Foam Filled with Paraffin


School of Materials and Energy, Guangdong University of Technology, Guangzhou 510006, China
*
Author to whom correspondence should be addressed.
Energies 2017, 10(7), 902; https://doi.org/10.3390/en10070902
Submission received: 21 March 2017
/
Revised: 12 June 2017
/
Accepted: 26 June 2017
/
Published: 2 July 2017
(This article belongs to the Section D: Energy Storage and Application)
Abstract
:The pore-scale numerical works on the effective thermal conductivity and melting process of copper foam filled with paraffin, and a phase-change material (PCM) with low thermal conductivity, were conducted by utilizing the two-dimensional (2D) hexahedron Calmidi-Mahajan (C-M) model and the three-dimensional (3D) dodecahedron Boomsma-Poulikakos (B-P) model. The unidirectional heat transfer experiment was established to investigate the effective thermal conductivity of the composite. The simulation results of the effective thermal conductivity of the composite in 2D C-M model were 6.93, 5.41, 4.22 and 2.75 W/(m·K), for porosity of 93%, 95%, 96% and 98% respectively, while the effective thermal conductivity of the composite in 3D B-P model were 7.07, 5.24, 3.07 and 1.22 W/(m·K). The simulated results were in agreement with the experimental data obtained for the composite. It was found that the copper foam can effectively enhance the thermal conductivity of the paraffin, i.e., the smaller the porosity of copper foam, the higher the effective thermal conductivity of the composite. In addition, the Fluent Solidification/Melting model was applied to numerically investigate the melting process of the paraffin in the pore. Lastly, the solid–liquid interface development, completely melted time and temperature field distribution of paraffin in the pore of copper foam were also discussed.
1. Introduction
Phase-change materials (PCMs) have been extensively utilized in thermal energy storage (TES) and electronic thermal management (TM) devices in recent years because of their good properties, such as a large amount of latent heat, suitable phase-change temperature and good chemical stabilities [1,2]. However, PCMs always suffered from an inherent disadvantage of low thermal conductivity, resulting in poor thermal performance and restricting their further utilization in the field of energy storage and thermal management [3]. For examples, the thermal conductivity of paraffin is less than 0.4 W/(m·K). Such low thermal conductivity of pure paraffin will lead to small heat transfer rate, resulting in slow heat charging and discharging in TES devices as well as inability to maintain constant temperature in TM systems [4]. Different methods have been put forward to enhance the thermal conductivity of PCMs, for example, inserting highly conductive materials including metal fins [5,6], expanded graphite [7,8], and nanoparticles [9].
Due to their high thermal conductivity and high ratios of heat transfer surface to volume, metal foams are excellent candidates for the enhancement of the thermal conductivity of PCM. Kopanidis et al. [10] analyzed the relationship between the surface thermal conductivity of copper foam and the fluid pressure drop using numerical methods; the results indicated that the copper foam could achieve good thermal conductivity with a small fluid pressure drop. Xiao et al. [11] made composite of copper foam/paraffin to improve the thermal conductivity, and found its equivalent thermal conductivity was nearly 15 times larger than that of pure paraffin. Li et al. [12] also investigated the effect of the foam morphology parameters such as porosity, pore size on the wall temperature of the phase-change energy storage system. The results showed that the influence of pore size was less obvious than that of porosity. Sundarram et al. [13] used numerical method to analyze metal foam/PCM composite thermal management system, and the results presented that at a fixed porosity, a smaller pore size of the metal foam led to a longer time period, that the temperature of the heat source remained nearly constant. Zhou et al. [14] compared composite of copper foam/paraffin and expanded graphite/paraffin through experimental method, and found that the former had better heat-transfer performance. Tian et al. [15] numerically investigated metal foam/paraffin composite based on the two-equation non-equilibrium heat-transfer model; the results showed that heat conduction rate was increased significantly using metal foam, and that natural convection was suppressed owing to the large flow resistance in metal foam. Furthermore, Qu et al. [16] experimentally investigated the melting processing of metal foam infiltrated with PCM; the results indicated that temperature increased more linearly for the metal foam/PCM composite than for the case of pure paraffin since the enhancement in thermal conduction caused by metal foam exceeded the level of its suppression to natural convection of melted paraffin.
Due to the non-uniformity and randomness of pores in the metal foams, many thermal conductivity models of metal foams had a large error compared with experimental results [17,18], but two-dimensional (2D) Calmidi-Mahajan (C-M) model [19] and three-dimensional (3D) Boomsma-Poulikakos (B-P) model [20] got high accuracy when used to deduce thermal conduction properties of porous media. However, few papers employed these models to simulate heat transfer performance of metal foam/PCM composite. In this paper, the pore-scale numerical works on the effective thermal conductivity and melting process of copper foam filled with paraffin were conducted by using the improved 2D C-M model and 3D B-P model. The unidirectional heat transfer experimental setup was also established to investigate the effective thermal conductivity of the composite. The relationship between porosity of copper foam and the effective thermal conductivity of the composite was discussed. Finally, the solid–liquid interface development, completely melted time and temperature field distribution of paraffin in the pore of copper foam were also discussed.
2. Simulation
2.1. Copper Foam Model
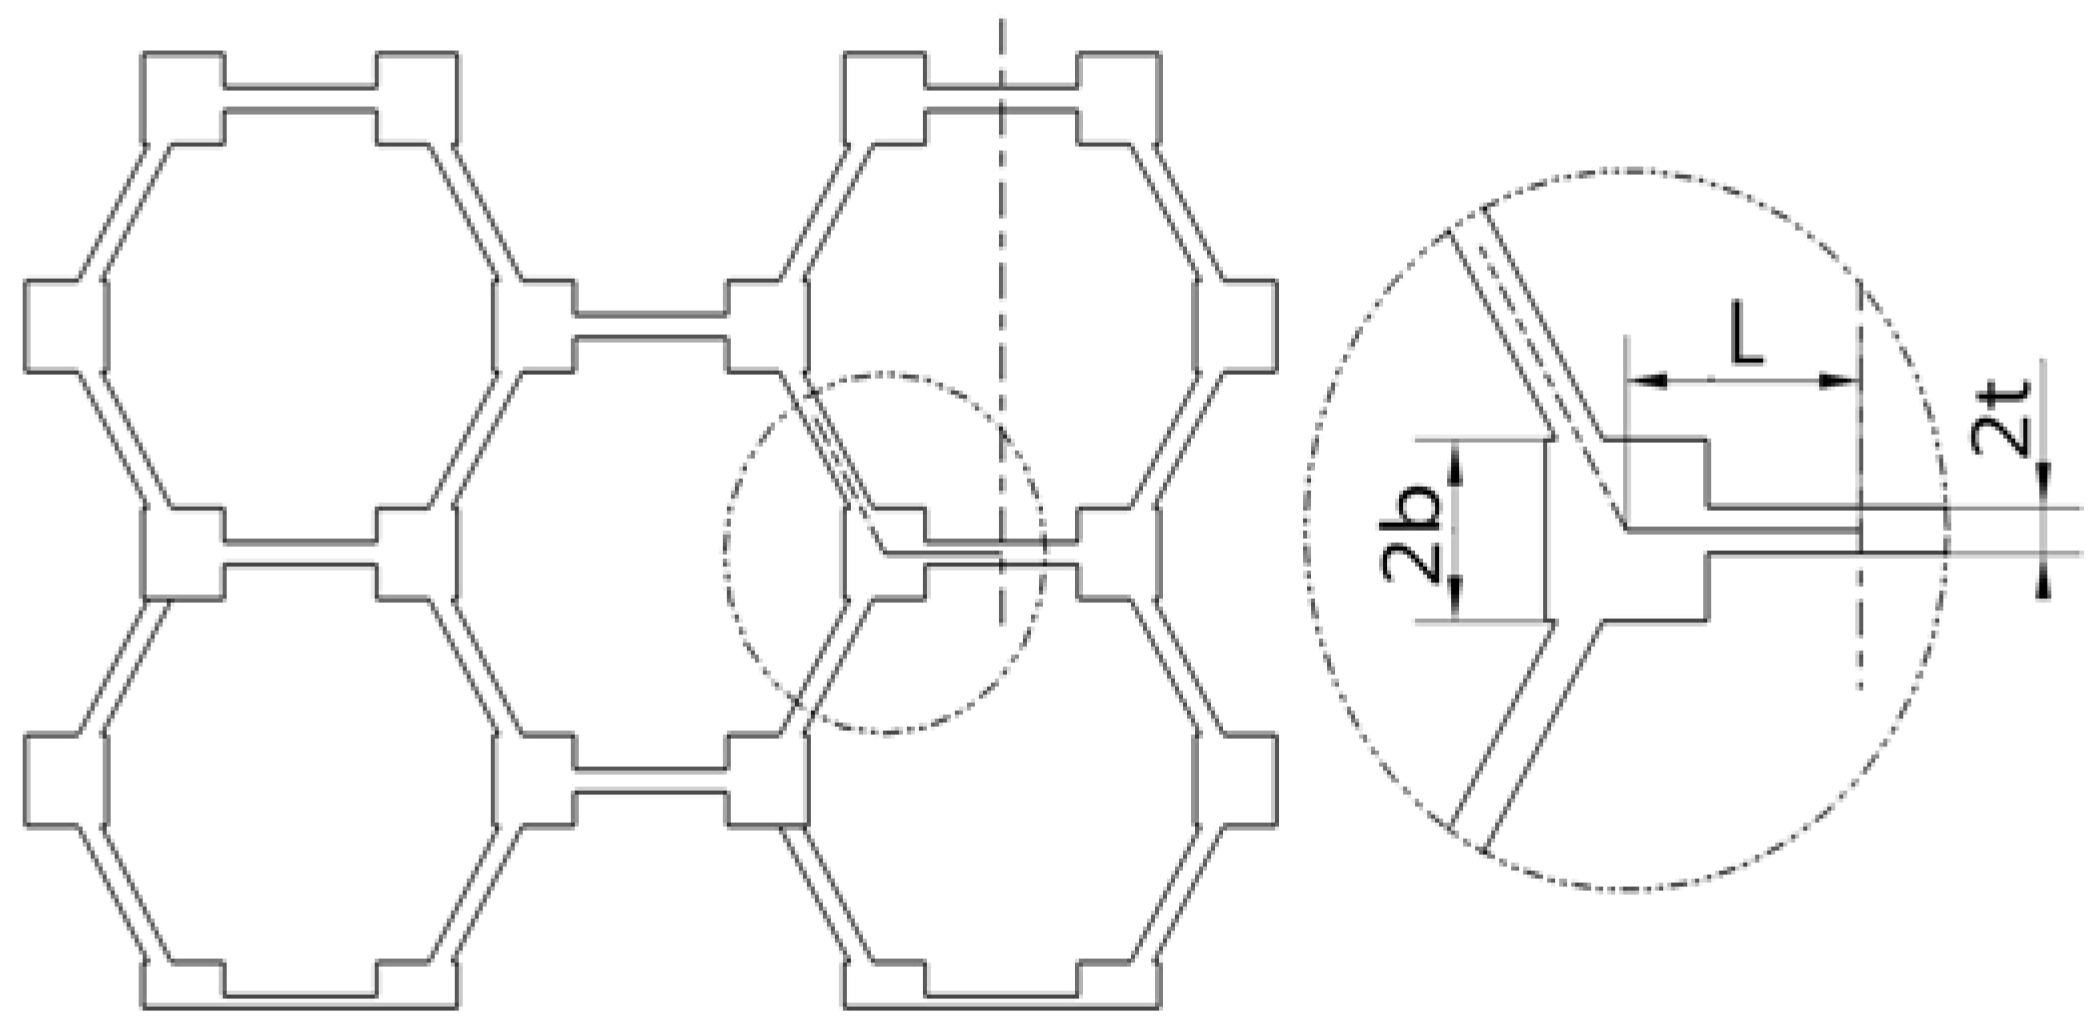
2D C-M model [19], shown in Figure 1, was a two-dimensional mathematical model for the effective heat transfer coefficient of the metal foam. In the model, the metal network was regarded as a hexahedral grid. The metal fiber was taken as a narrow rectangle, and the node as a cube. The thickness of metal fiber was 2t, length 2L, and the side length of the node cube was 2b. The height of 2D C-M model was 3.464 mm. The porosity was defined by Equation (1) which was also shown in Appendix A.
During calculation, the value of t/b was 0.19, details of these values can be found in literatures [21].
3D B-P model [20], shown in Figure 2, was a three-dimensional dodecahedron mathematical model for calculating the thermal conductivity of metal foam in terms of considering the porosity. The metal fiber was considered as a cylinder with a radius, the nodes as a side length of a cube. The height of 3D B-P model was 2.828 mm. The porosity can be obtained through Equation (2) which was also presented in Appendix A.
where d = a/L was the dimensionless radius of metal fiber; e = r/L was the dimensionless node length, in the paper e = 0.339, a was metal fiber radius, r was the node cube side length, and L was the metal fiber length.
2.2.Thermal Conductivity
Simulation study on the effective thermal conductivity of copper foam/PCM composite included numerical method, control equation and boundary conditions. Paraffin was filled in the pore of the 2D C-M and 3D B-P models to make the representative volume elements. The representative volume elements were meshed and imported in ANSYS Workbench Steady-State Thermal Module. ANSYS provided an automatic mesh generator that could generate surface and solid meshes. The mesh size utilized in this paper varied according to the porosity of the copper foam. The higher the porosity, the smaller the mesh size, since the copper fiber became smaller with increased porosity. The physical parameters of the materials were listed in Table 1. The porosities of copper foam were 93%, 95%, 96% and 98% respectively.
Given that the thermal conductivity of solid paraffin was very close to that of liquid paraffin, only the solid phase was considered. Thus, only the energy equation was solved in the effective thermal conductivity simulation. The energy equation applied to steady-state heat conduction simulation of the composite was given by Equation (3)
where , and were the thermal conductivity in three directions in coordinate.
After generating the meshes, the boundary conditions were adopted to the models. This involved applying the temperature boundary condition to the top surface and the heat flow boundary condition to other surfaces. The boundary conditions for the models were given as follows:
Furthermore, it should be mentioned that the pores were assumed to be saturated with the paraffin and the thermal conductivity of materials were independent of temperature. The temperature difference ΔT of the models was obtained via simulation. Through Fourier’s transformation of thermal conduction, the effective thermal conductivity can be calculated.
2.3. Melting Process Simulation
Instead of using one-temperature model which assumed paraffin and copper foam had the same temperature and employed a uniform energy equation for the two phases of the porous medium, the present study utilized 2D C-M and 3D B–P models to replace copper foam; therefore, the method applied to simulate the melting process was called direct numerical simulation, which was regarded as much closer to the actual process. The thermo-physical parameters of the materials were listed in Table 1, and the porosity of the copper foam was 95%.
The melting simulation was based on the following assumptions: (i) The copper foam and the paraffin were isotropic, and the thermal properties of materials did not change with temperature except density. (ii) The copper foam and the paraffin contacted closely, and the contact thermal barrier can be ignored. (iii) The composite met Boussinesq’s hypothesis that in low velocity flow, the density variation of materials with the pressure could be neglected and the density variation was mainly due to the temperature change.
It was proved that the convection of melted paraffin in different pores was negligible [22]. The reason was that the pore size of the metal foam was very small, and its existence might cause the flow resistance in the domain. Therefore, mathematical models in this paper were also based on the assumption that the copper foam/paraffin composite did not generate any convection in liquid phase. Thus, only the energy equations were solved in this simulation, and the convective term in the energy equations was ignored.
During the simulation, different energy equations were employed to paraffin and copper foam regions respectively. The energy equation in the (solid and liquid) paraffin regions was written as follows:
where , , t, , and h were density, specific heat, time, temperature, thermal conductivity and latent heat of the paraffin.
Liquid fraction in Equation (5) was changed according to the paraffin temperature, as follows:
where and were the initial melting temperature and the completely melted temperature.
Heat transfer in copper foam regions was described as follows:
where , , and were density, specific heat, temperature, and thermal conductivity of the copper foam.
Coupled heat transfer was considered at the copper foam/paraffin interface as in Equation (8).
The boundary conditions were set as follows:
The initial conditions were set as:
To simulate the melting process of copper foam/paraffin composite, the Solidification/Melting model in Fluent was used to analyze the paraffin in the pore of copper foam with double precision. Un-structured grids were generated in metal foam, and the pore filled with paraffin. The convergence criterion of absolute scaled residual for energy equations was 10−6, and the time-step was set as = 0.005 s.
3. Experiment
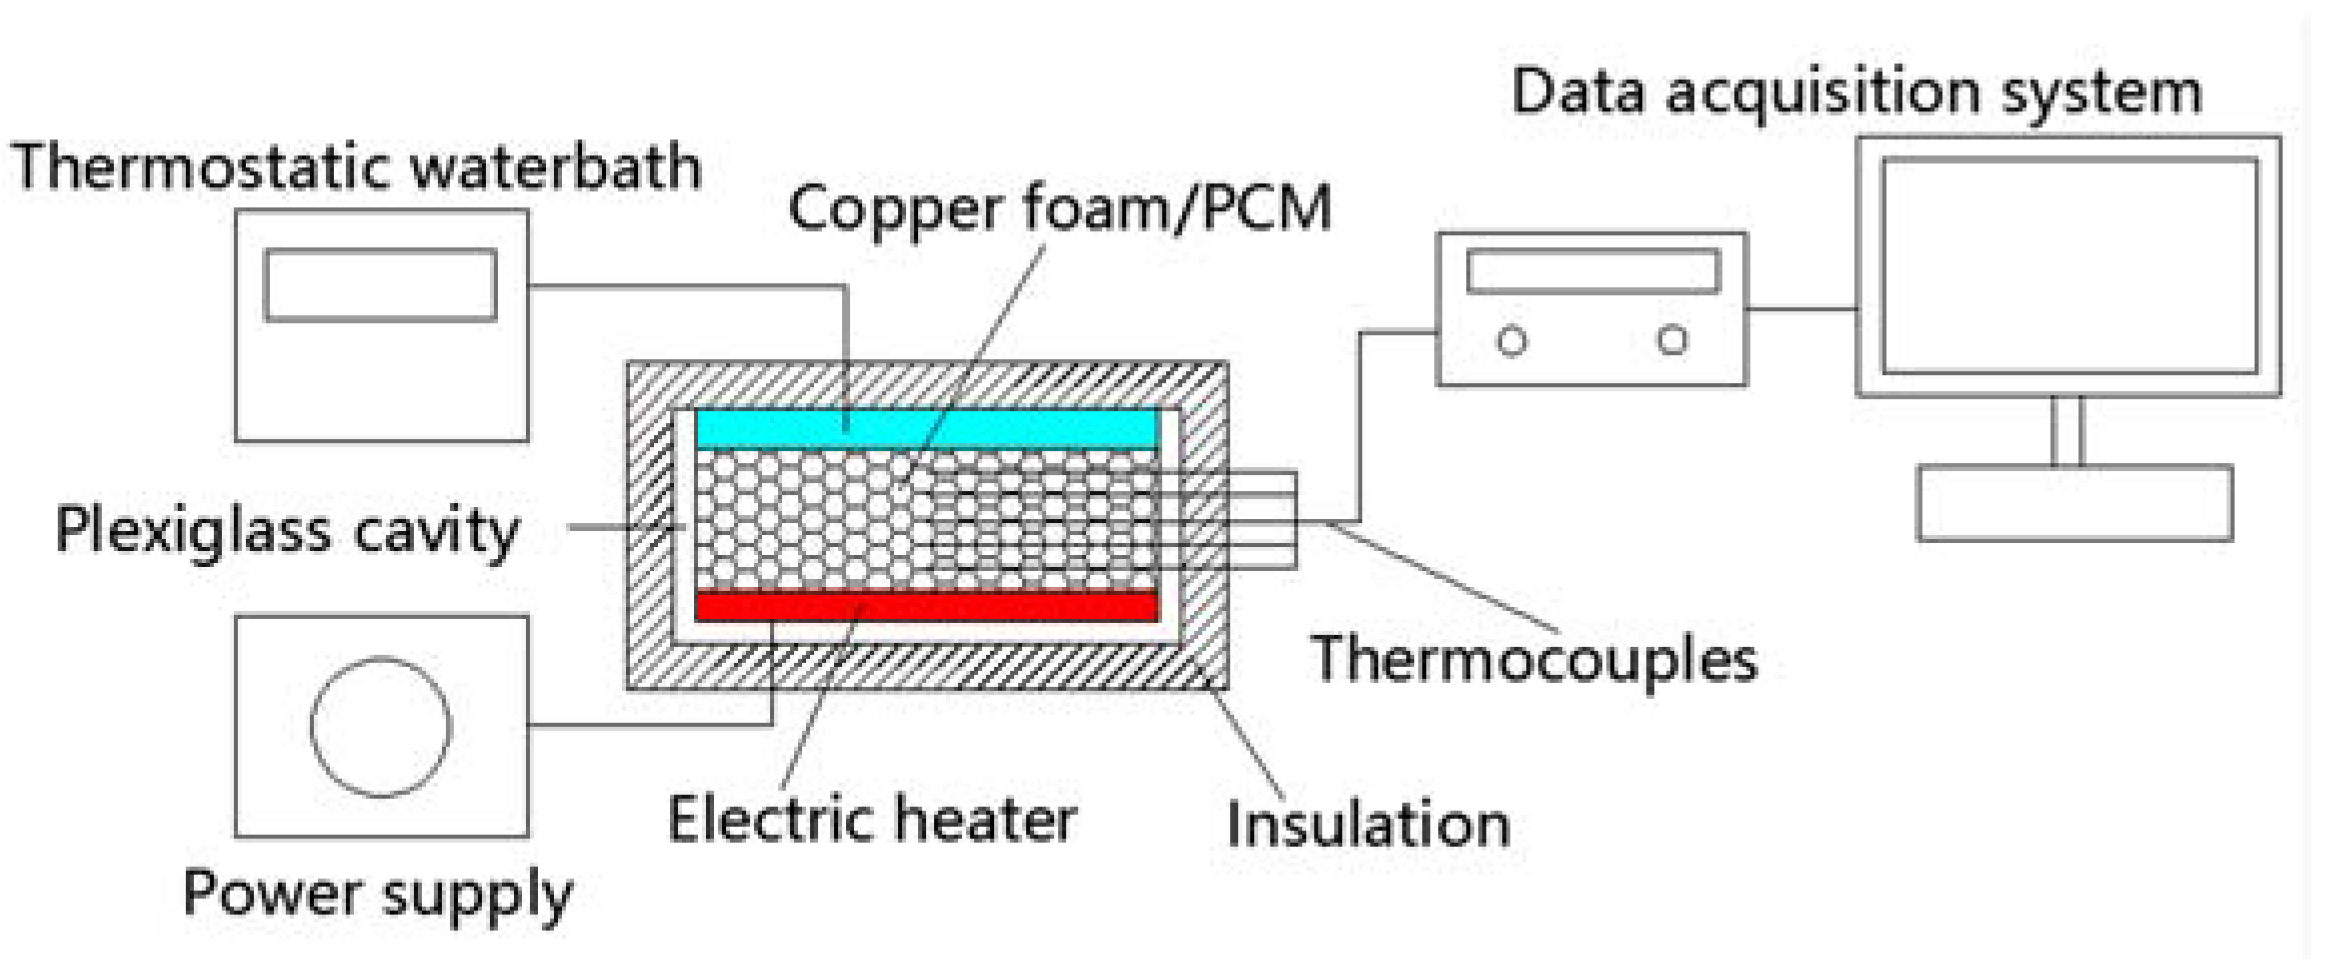
In order to measure the effective thermal conductivity of the composite, which consists of more than a single phase (such as the metal foam/PCM composite), the steady-state method was chosen because it is simpler and less sensitive than transient methods. As shown in Figure 3, the steady-state experimental setup was designed and established to investigate the relationship between the effective thermal conductivity of the composite and the porosity of copper foam. The experimental setup consisted of thermostatic water-bath, electric heater, plexiglass cavity, composite sample, data acquisition system and DC voltage power supply. A 2 mm thick copper plate was arranged at the bottom and top of the sample to minimize the contact thermal resistance with heat source and cold source. A constant heat flux of 560 W/m2 was supplied by the heater to the bottom of the sample, while the top of the sample was set as 22 °C through cooling block of the thermostatic water-bath. In order to realize that heat transferred only from bottom surface to top surface of the sample, insulation of the side walls was very important. Thus, a 1 cm thick thermal insulation material (polyurethane foam plate) was used to minimize heat loss from the sides. A total of 18 T-type thermocouples with the accuracy of ±0.1 °C were utilized in the experiment. Five thermocouples were arranged at different heights along the vertical axis of the sample to measure the temperature change. Other thermocouples were arranged on the inner and outer sides of the insulation materials to measure heat loss from side walls, as well as the ambient to observe ambient temperature.
In the present experiment, four composite samples having an approximate dimension of 100 × 100 × 30 mm were prepared through inserting paraffin into copper foam. Four different copper foams with the porosity of 93%, 95%, 96% and 98% respectively, were used in the experiment, and the pore size of the copper foams was 10PPI.
When all the thermocouples collected ambient temperature, the heat flux began to be applied to the composite. The temperature of the composite gradually increased until it reached the steady state and all the thermocouples in the composite recorded the temperature. The experiment was considered as completed after collecting an unchanged temperature distribution in the composite for at least 10 min. After obtaining the temperature distribution, the effective thermal conductivity of the composite can be evaluated by using Fourier’s law. To ensure repeatability and accuracy of the experimental data, the experiment was conducted three times for each composite sample. The experimental data was showed in the next section and compared to the numerical results.
The uncertainty of the experiment was also analyzed in the paper. The overall uncertainty was mainly due to the inaccuracies of measurement for power input, temperature, thickness, porosity and heat loss. The deviation of power input by DC voltage power supply was 0.42%. With δT being ±0.1 °C (±0.4%) for the thermocouples, δH being ±0.2 mm (±0.66%) for the thickness of the composite, δε being ±0.5%. qloss was estimated at 0.192 W according to the thermocouples arranged on the inner and outer sides of the insulation materials and the thermal conductivity of insulation materials, and q being 5.6 W (560 W/m2). The overall uncertainty of the experiment was calculated at 3.58% by the following equation:
where P, T, H, ε and qloss were the power input, temperature, thickness of the composite, porosity and heat loss, respectively.
4. Results and Discussion
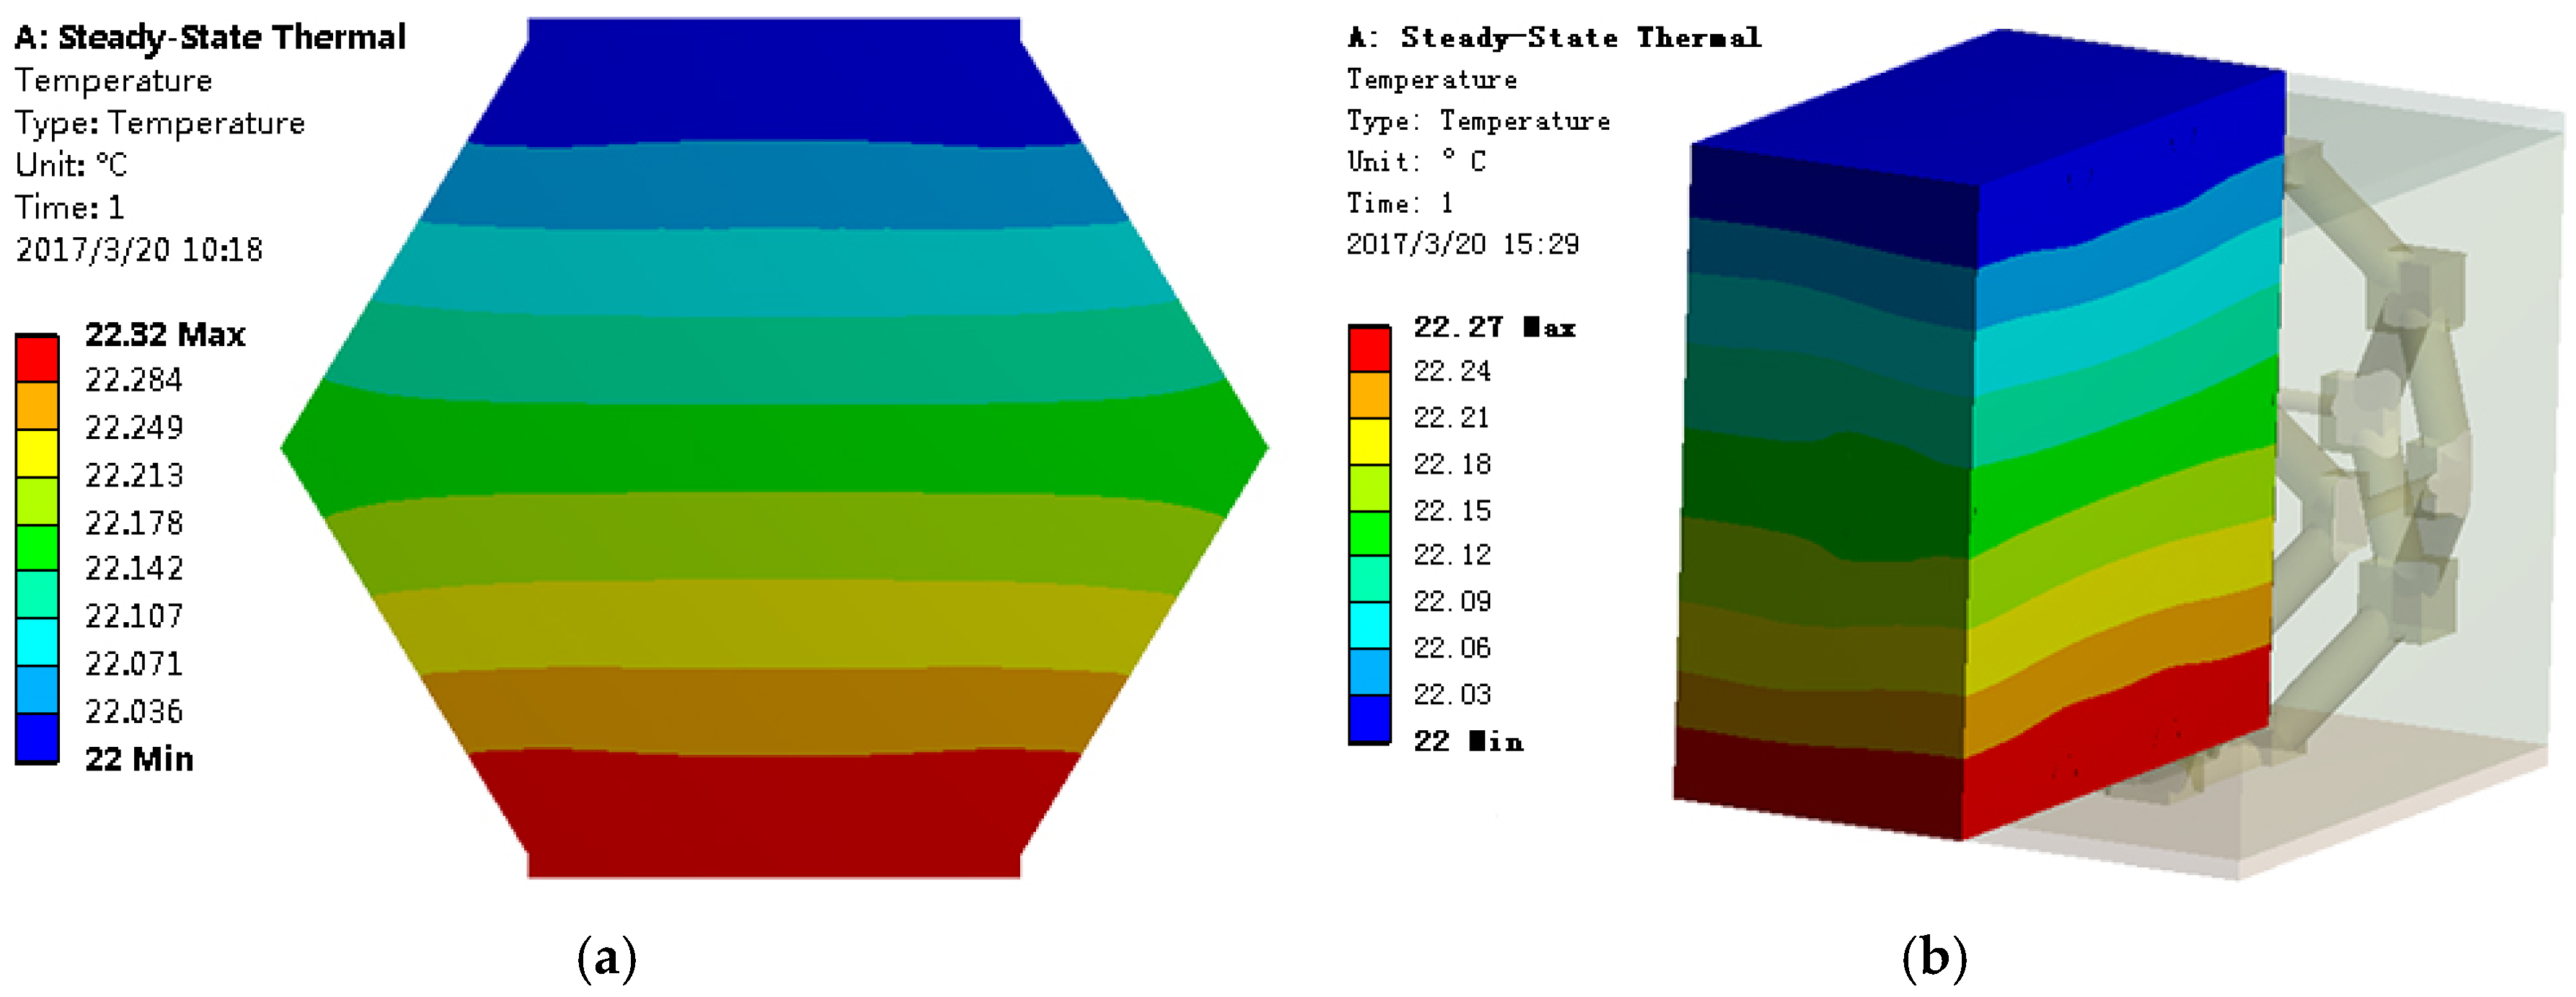
According to the simulation method explained in Section 2.2, several thermal conduction simulations were conducted for the composite at different porosity of copper foam. The temperature distribution in the composite was presented in Figure 4 for the porosity of 95%.
The temperature of hot side can be integrated based on the obtained temperature field. Knowing the heat flux through the composite and the temperature difference, the effective thermal conductivity of the composite can be calculated by utilizing Fourier’s law. The simulated results of the effective thermal conductivity of the composite were shown in Table 2 and Table 3 based on the 2D C-M and 3D B-P models, respectively.
In 2D C-M model, the effective thermal conductivities were 6.93, 5.41, 4.22 and 2.75 W/(m·K), for porosity of 93%, 95%, 96% and 98% respectively, which were 26.7, 20.8, 16.2 and 10.6 times larger than that of pure paraffin. In 3D B–P model, the effective thermal conductivities were 7.07, 5.24, 3.07 and 1.22 W/(m·K), for porosity of 93%, 95%, 96% and 98% respectively, which were 27.2, 20.2, 11.8 and 4.7 times larger than that of pure paraffin. Based on these results, it was obvious that the copper foam can enhance the thermal conductivity of paraffin, i.e., the smaller the porosity of copper foam, the higher the effective thermal conductivity of the composite. Although the addition of copper foam can improve the energy storage efficiency of PCM, utilizing copper foam reduces the capacity of the PCM in condition of the same container when compared to the case of pure PCM, i.e., the smaller the porosity of copper foam, the less the energy storage. Therefore, in order to establish a better energy storage system, both the porosity of the copper foam and the capacity of PCM need to be considered.
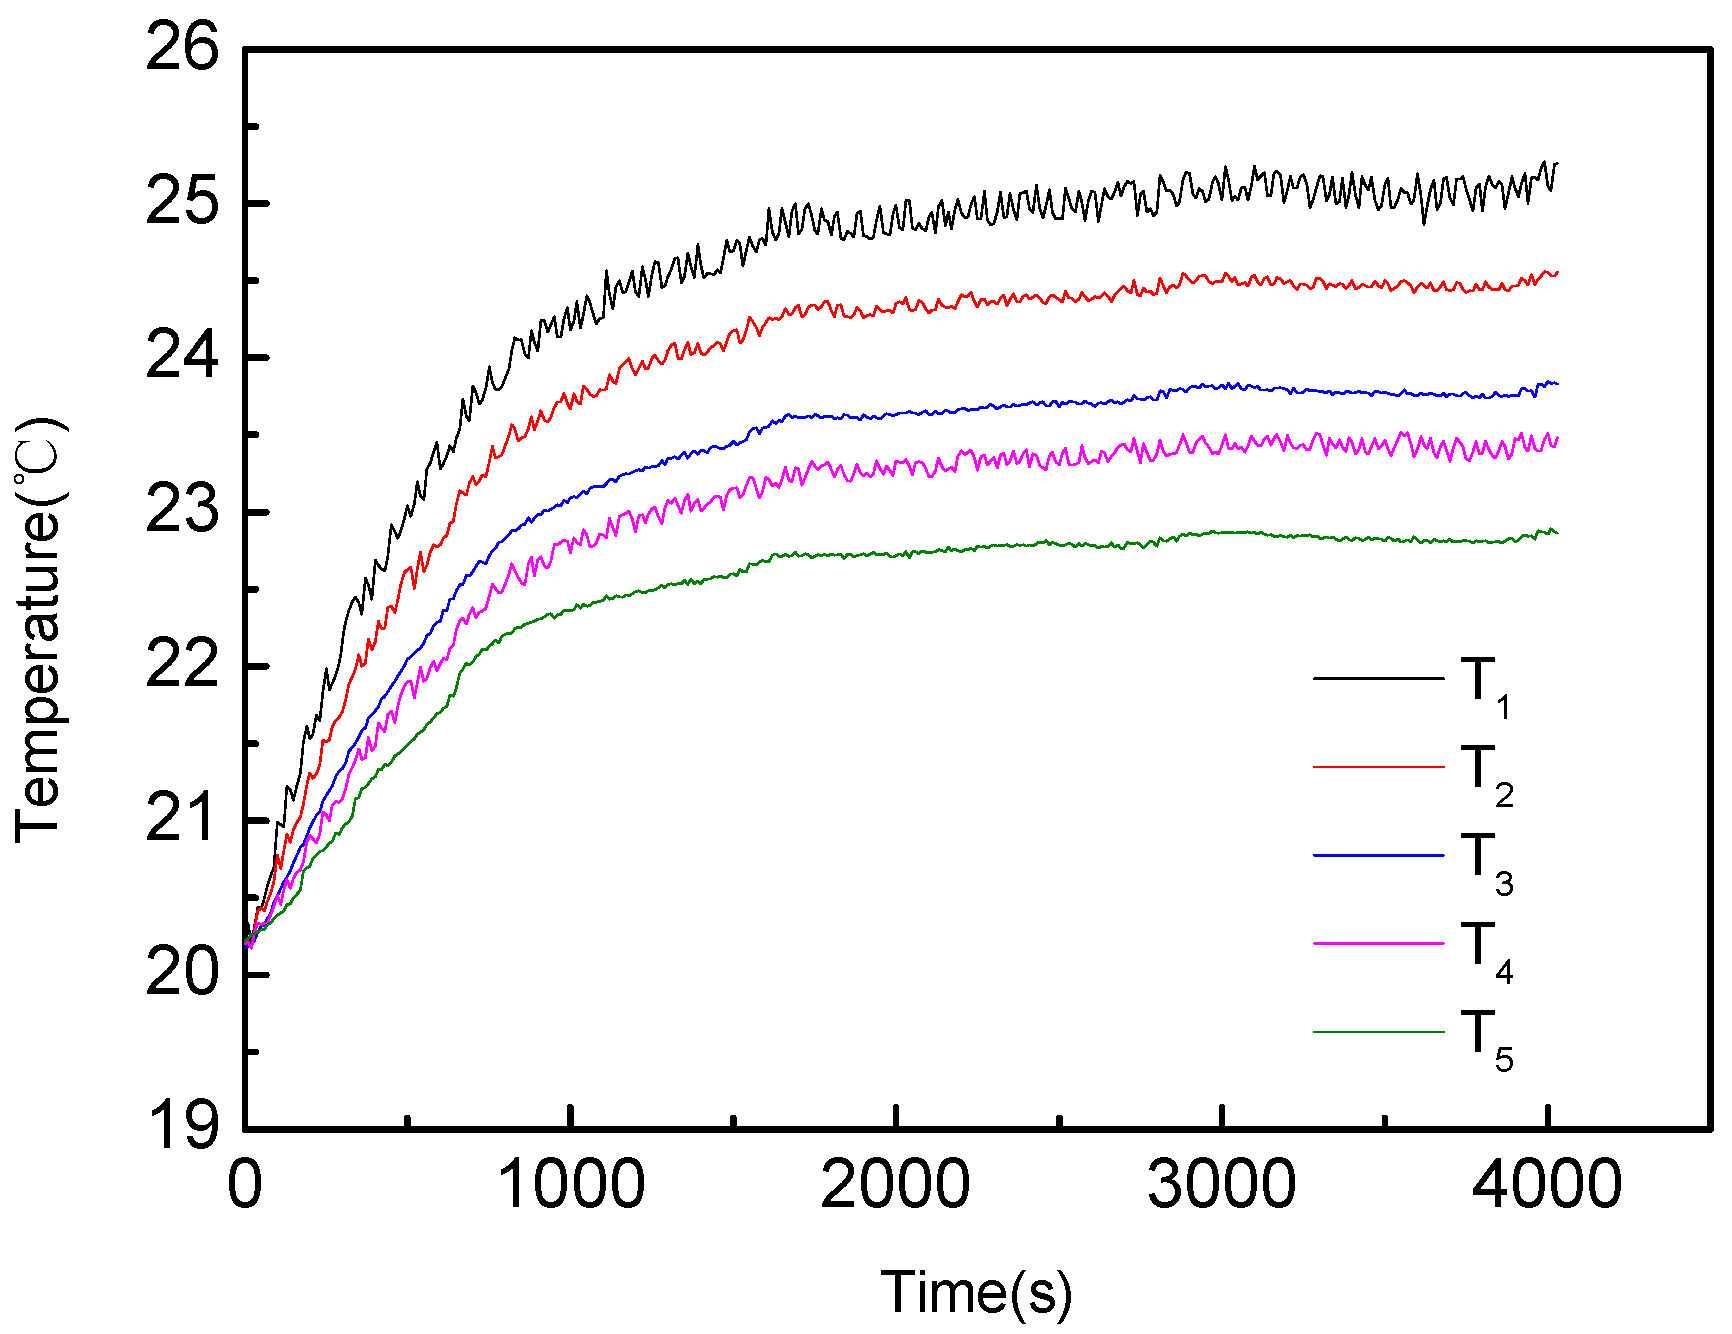
Based on the experimental method mentioned in Section 3, the temperature variation of the composite was measured. The temperature of the composite for the porosity of 95% during the experiment was presented in Figure 5. After applying the heat flux to the bottom side of the composite, the temperature of each point in the composite increased with time until thermocouple recordings did not change.
After obtaining the temperature distribution of the composite for different porosity via experimental method, the effective thermal conductivity of the composite can also be extracted by using Fourier’s law. The effective thermal conductivity of composite based on the simulation was validated against the experimental results (Figure 6). When the porosities of the copper foam were 93% and 95%, the simulation results were well consistent with the experimental results, which indicated that two models can be used to accurately simulate the effective thermal conductivity of the copper foam/paraffin composite in condition of low porosity copper foam. However, when the porosity was 96%, the error between numerical and experimental result was larger, especially in B-P model. When the porosity further increased to 98%, the relative error increased to 43%. It can also be seen from Figure 6 that when the porosity of copper foam was larger than 95%, the simulation result obtained through 2D C-M model was larger than the experimental results, while the results obtained through 3D B-P model was smaller than the experimental results. The deviation was reasonable because thermal conductivity of the composite mainly depended on the metal fiber conduction, and as the porosity of copper foam increased, the metal fiber became smaller, resulting in the decrease in the contact area between the metal fiber and paraffin. However, the contact area in 2D C-M model was reduced less than that in actual copper foam, while that in the 3D B-P model was decreased more than that in actual copper foam. So 2D C-M model overestimated, and 3D B-P model underestimated the experimental results when the porosity was larger than 95%.
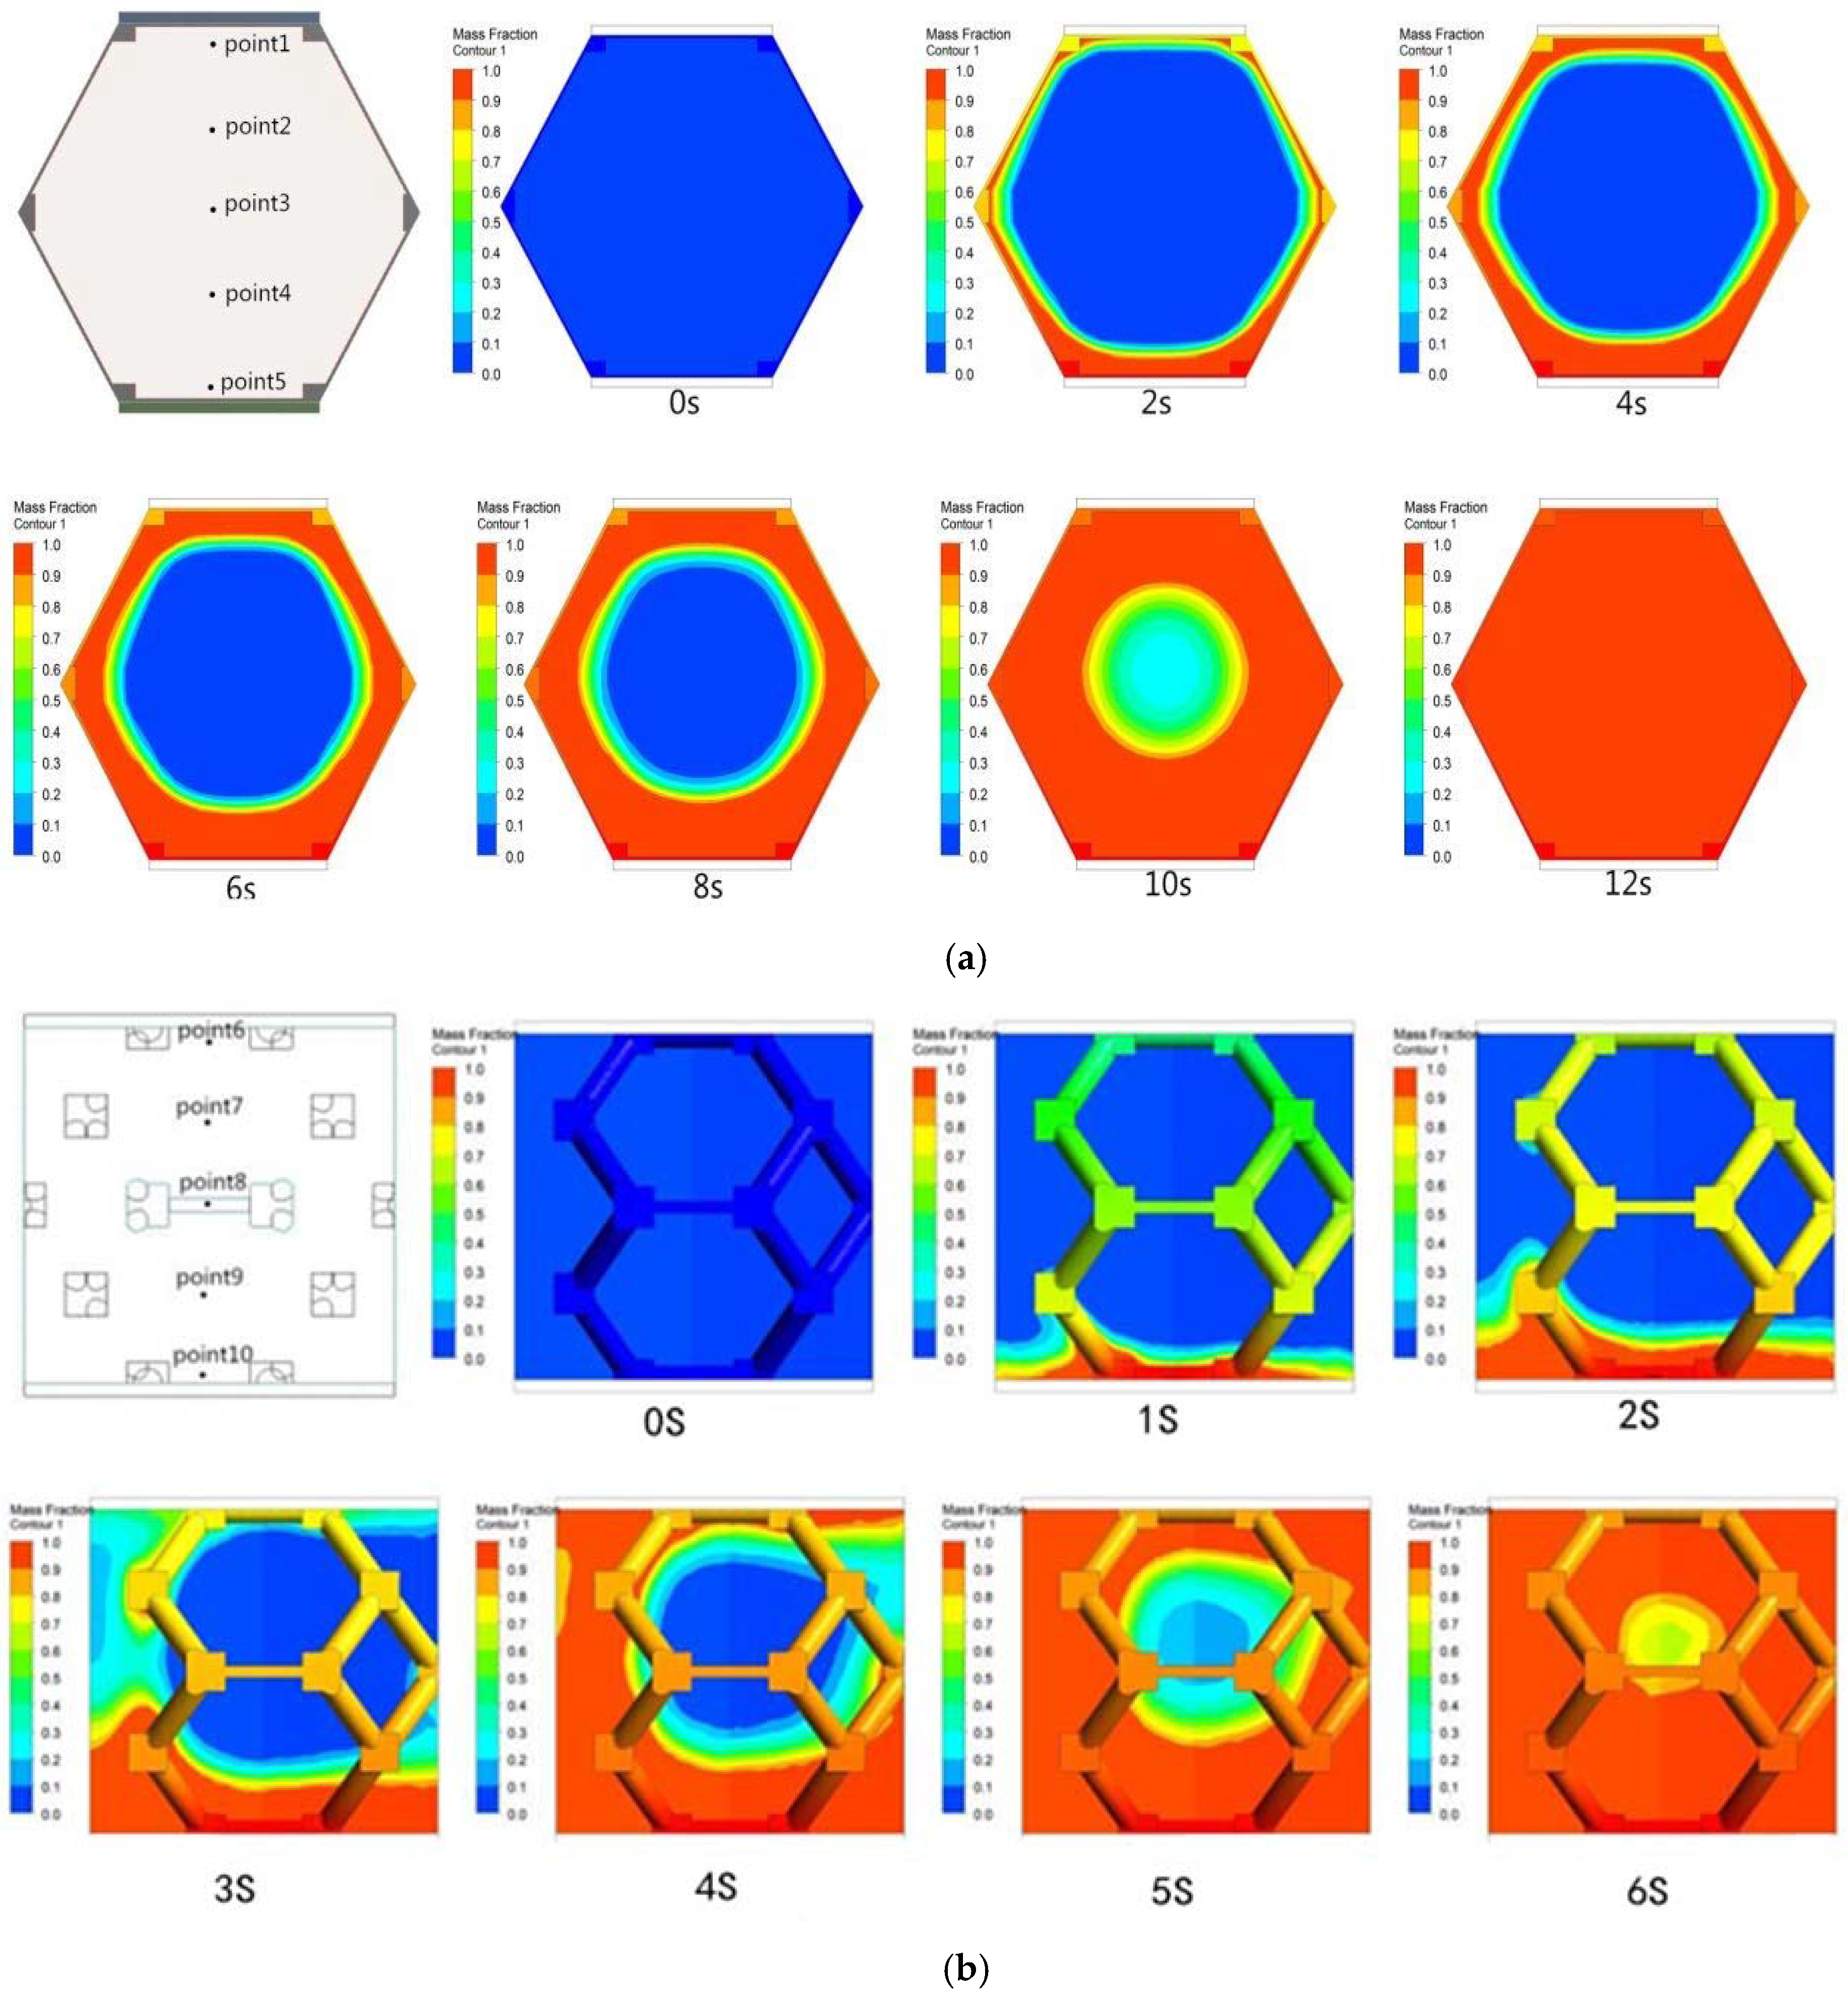
Based on the numerical method mentioned above, the melting processes of the composite by using 2D C-M and 3D B-P models were presented in Figure 7. The composite can be divided into three different regions in the melting process, namely solid-phase region, liquid-phase region and mushy region. The blue color represented solid-phase region, red color was liquid-phase region and other color indicated mushy region. During the melting process, solid-phase zone decreased, the mushy region thickened and liquid-phase region increased gradually. The melting processes of paraffin in the two models were similar. At the beginning of the melting process, the heat was transferred from the heat source to the bottom of the composite quickly, so the paraffin at the bottom melted first. Then the heat was spread to all the structure including the top part due to the high thermal conductivity of copper foam, leading to the melting of the paraffin contacting with the copper fiber. Then the inner part of the paraffin was also gradually heated and melted. The solid–liquid interface of paraffin developed from the boundary to the inner of the composite, resulting in that the solid paraffin was surrounded by the melted paraffin. The melting processes of the paraffin in the two models were well consistent with the obtained experimental phenomena, which presented that in pore scale, the paraffin near metal fiber melted first and the melting front was parallel to the structure of metal fiber, and with the increase of melting time, the melting front moved to the center of pore structure [22]. The completely melted time of the whole process took 12 s in 2D C-M model, and 7 s in 3D B-P model. This big difference between the two models was obviously not caused by the effective thermal conductivity difference (5.41 W/(m·K) and 5.24 W/(m·K), respectively), but by the distribution of copper fibers in the composite. Although the porosities for both models were 95%, the copper fiber in 2D C-M model distributed around the structure, the contact area was very small, while that in 3D B–P model was distributed in the inner part, thus the completely melted time was larger in 2D C-M model.
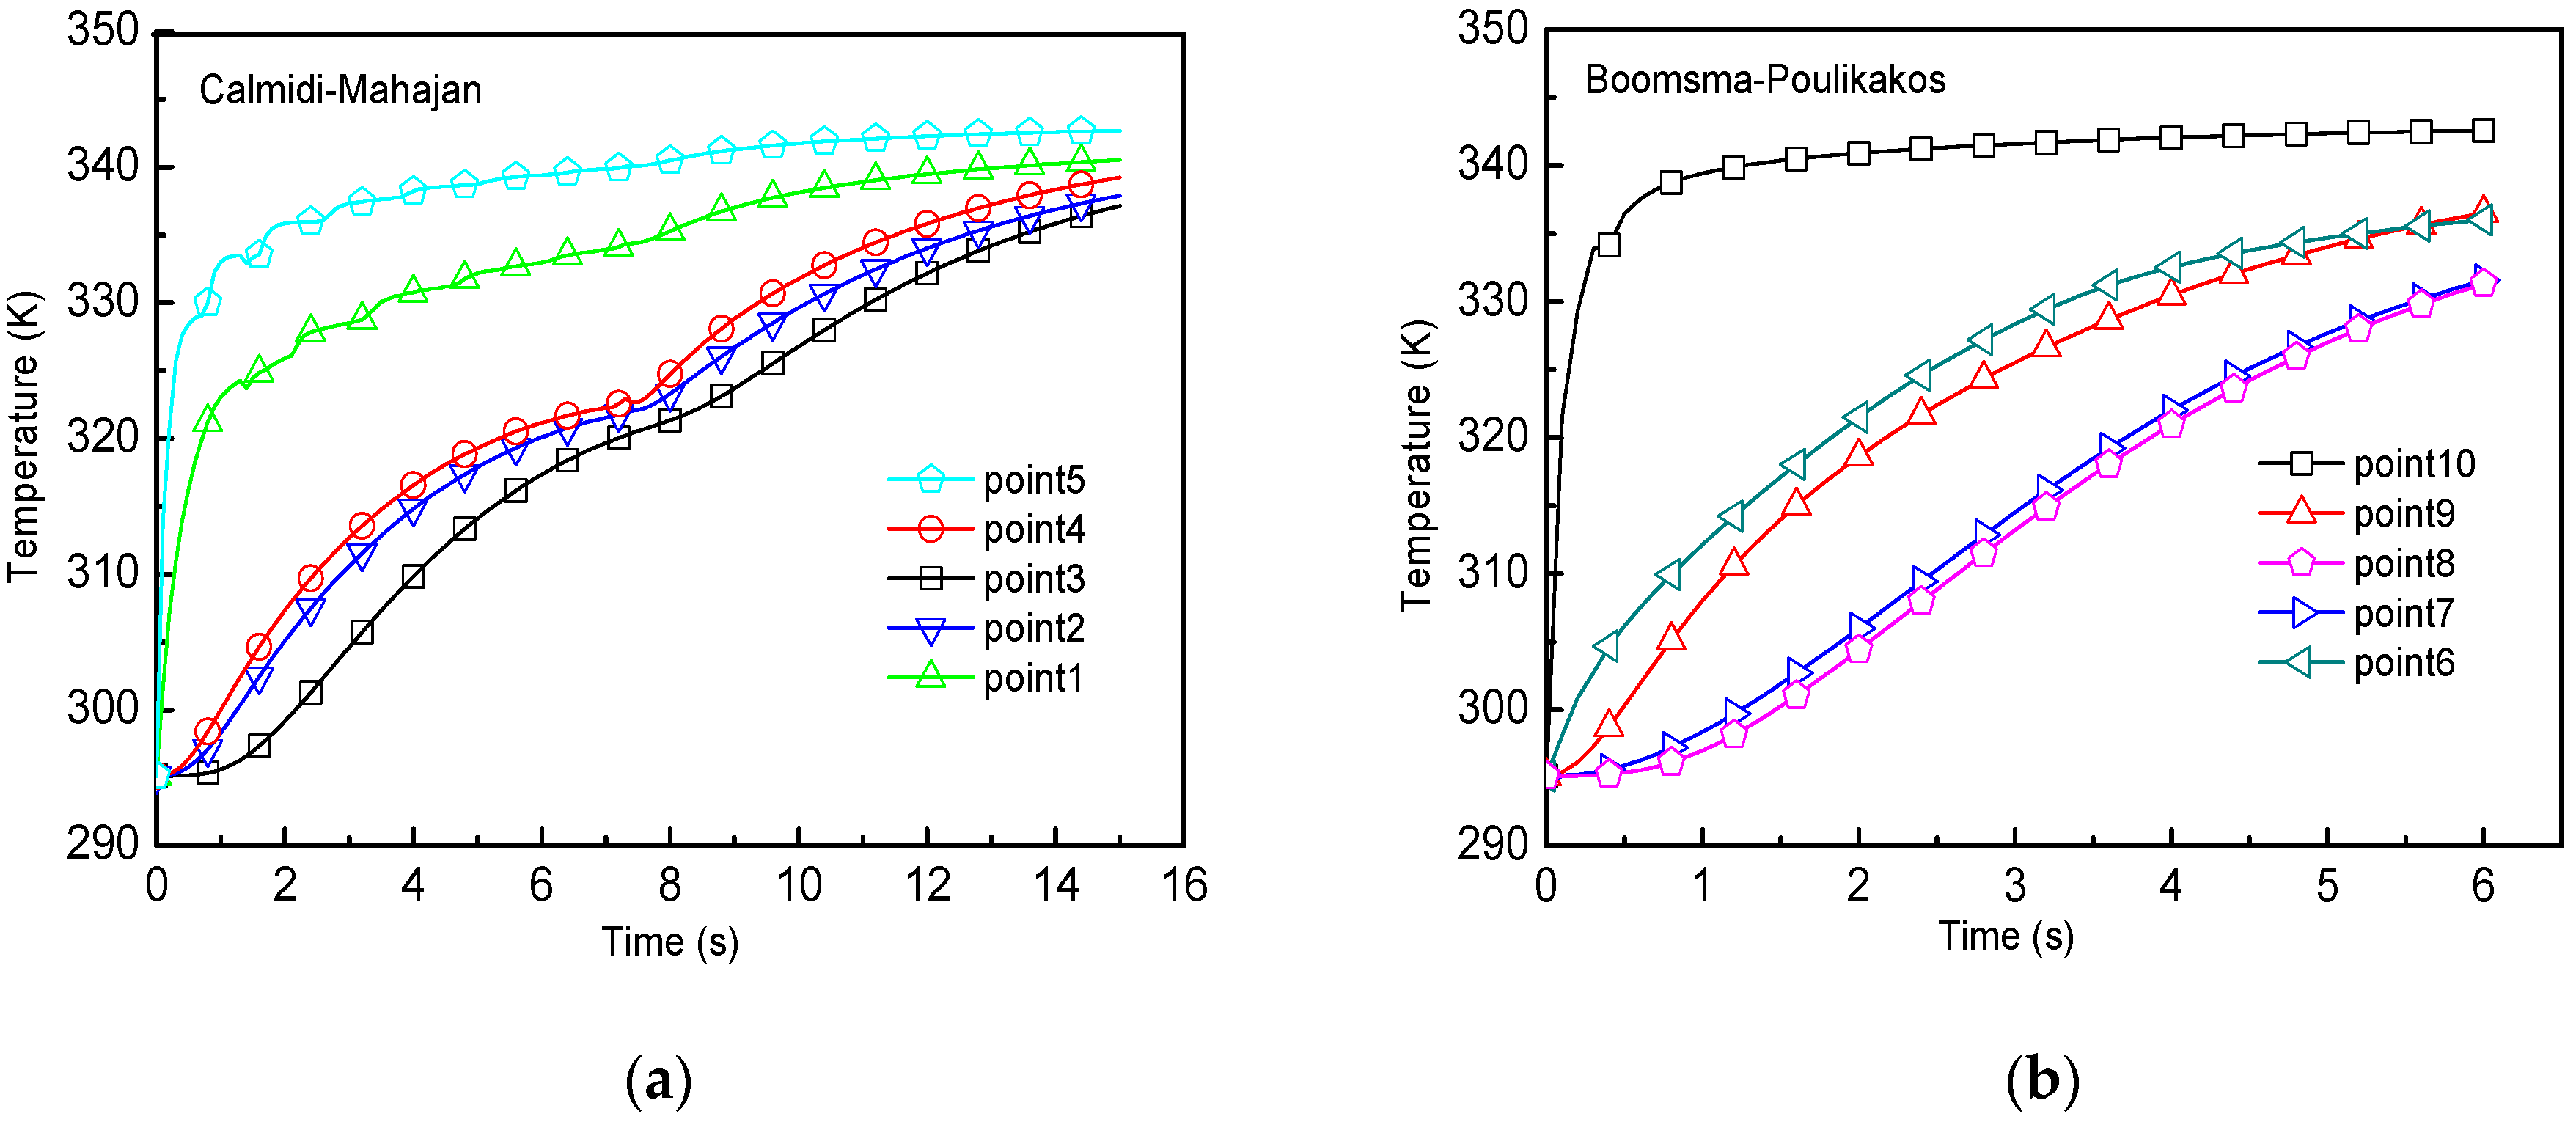
Temperature variation as a function of time during the melting process was presented in Figure 8. It was obvious that temperature growth rate in 2D C-M model was similar to that in 3D B-P model. It was found out that at the beginning of heating, the temperature of the composite increased rapidly because the paraffin absorbed little heat in solid-phase sensible heat storage stage and the heat transfer performance of paraffin was improved by copper foam. When the temperature rose to the phase transition temperature, the paraffin began to melt and absorbed a lot of heat, so the growth rate of the temperature was slowed down, and when the paraffin was completely melted, growth rate of the temperature was increased again. It can also be seen from Figure 8 that the bottom of both models almost reached the temperature of the heat source within 1 s, and the temperature of the paraffin near copper fiber also increased quickly because of the high thermal conductivity of copper fiber. The temperature growth speed in the centre of the composite was the slowest due to the low thermal conductivity of the paraffin, leading to the small heating speed. The increasing order of the temperature in the composite was in agreement with the melting process shown in Figure 7, which presented the paraffin at the bottom and near the metal fiber melted first and the paraffin in the centre of the pore finally melted. Additionally, the simulated results were also consistent well with our previous experimental data [23] in which the PCM was filled within the copper foam, thus it further verified the effectiveness of the two models utilized in simulating the melting process of metal foam/PCM composite.
5. Conclusions
In this paper, the pore-scale numerical work on the effective thermal conductivity and melting process of composite of copper foam filled with paraffin was conducted by utilizing 2D C-M model and 3D B-P models. The unidirectional heat transfer experimental device was established to investigate the effective thermal conductivity of the composite. The simulation results demonstrated the effectiveness of the two models in investigating the heat transfer of copper foam/PCM composite by comparing the experimental data. The results indicated that copper foam can enhance the thermal conductivity of paraffin, i.e., the smaller the porosity of copper foam, the higher the effective thermal conductivity of the composite. The simulated results of the effective thermal conductivity were consistent with the experimental data for the porosity less than 95%, and the error between experimental data and simulated results became larger with the increasing of porosity. The melting process simulation results showed that the melting speed of paraffin in 3D B-P model was faster than that in 2D C-M model in conditions of the same porosity because 3D B-P model had larger contact area with paraffin, and the solid–liquid interface of paraffin developed from the boundary to the inner of the composite, resulting in that the solid paraffin was surrounded by the melted paraffin. In addition, the temperature of the paraffin near the heat source and the copper fiber increased faster than that in the inner part of the composite.
Acknowledgments
This work was supported by the Fund of the National Natural Science Foundation of China (Grant No. 51676049), the Science and Technology Program of Guangzhou (Grant No. 2016201604030056).
Author Contributions
Changhong Wang and Huanpei Zheng conducted the numerical work and experiment together; Changhong Wang and Huanpei Zheng wrote this paper; Huanpei Zheng designed the experimental system. All the authors contributed equally to this work.
Conflicts of Interest
The authors declare no conflict of interest.
Nomenclature
| a | radius of cylinder (mm) |
| b | half of the length of node cube (mm) |
| cp | specific heat capacity (J/(kg·K)) |
| d | dimensionless radius of metal fiber |
| e | dimensionless length of node cube |
| H | thickness of the composite(mm) |
| h | latent heat (J/kg) |
| k | thermal conductivity (W/(m·K)) |
| L | half of the length of metal fiber (mm) |
| P | power input (W) |
| q | heat flux (W/m2) |
| T | temperature (K) |
| Tm1 | initial melting temperature(K) |
| Tm2 | completely melted temperature (K) |
| t | half of the thickness of metal fiber (mm) |
Greek Symbols
| β | liquid fraction |
| ε | porosity |
| ρ | density (kg/m3) |
Subscripts
| f | paraffin |
| s | copper foam |
Appendix A
The porosity of 2D C-M model was defined as:
The porosity of 3D B–P model can be obtained through the geometric relationships:
References
- Ibrahim, N.I.; Al-Sulaiman, F.A.; Rahman, S.; Yilbas, B.S.; Sahin, A.Z. Heat transfer enhancement of phase change materials for thermal energy storage applications: A critical review. Renew. Sustain. Energy Rev. 2017, 74, 26–50. [Google Scholar] [CrossRef]
- Huang, X.; Alva, G.; Jia, Y.; Fang, G. Morphological characterization and applications of phase change materials in thermal energy storage: A review. Renew. Sustain. Energy Rev. 2017, 72, 128–145. [Google Scholar] [CrossRef]
- Zhang, Z.; He, X. Three-dimensional numerical study on solid-liquid phase change within open-celled aluminum foam with porosity gradient. Appl. Therm. Eng. 2017, 113, 298–308. [Google Scholar] [CrossRef]
- Zhang, P.; Xiao, X.; Ma, Z.W. A review of the composite phase change materials: Fabrication, characterization, mathematical modeling and application to performance enhancement. Appl. Energy 2016, 165, 472–510. [Google Scholar] [CrossRef]
- Sheikholeslami, M.; Lohrasbi, S.; Ganji, D.D. Numerical analysis of discharging process acceleration in LHTESS by immersing innovative fin configuration using finite element method. Appl. Therm. Eng. 2016, 107, 154–166. [Google Scholar] [CrossRef]
- Kalbasi, R.; Salimpour, M.R. Constructal design of horizontal fins to improve the performance of phase change material rectangular enclosures. Appl. Therm. Eng. 2015, 91, 234–244. [Google Scholar] [CrossRef]
- Li, Z.; Sun, W.G.; Wang, G.; Wu, Z.G. Experimental and numerical study on the effective thermal conductivity of paraffin/expanded graphite composite. Sol. Energy Mater. Sol. Cell 2014, 128, 447–455. [Google Scholar] [CrossRef]
- Wang, T.; Wang, S.; Geng, L.; Fang, Y. Enhancement on thermal properties of paraffin/calcium carbonate phase change microcapsules with carbon network. Appl. Energy 2016, 179, 601–608. [Google Scholar] [CrossRef]
- Owolabi, A.L.; Al-Kayiem, H.H.; Baheta, A.T. Nanoadditives induced enhancement of the thermal properties of paraffin-based nanocomposites for thermal energy storage. Sol. Energy 2016, 135, 644–653. [Google Scholar] [CrossRef]
- Kopanidis, A.; Theodorakakos, A.; Gavaises, E.; Bouris, D. 3D numerical simulation of flow and conjugate heat transfer through a pore scale model of high porosity open cell metal foam. Int. J. Heat Mass Transf. 2010, 53, 2539–2550. [Google Scholar] [CrossRef]
- Xiao, X.; Zhang, P.; Li, M. Preparation and thermal characterization of paraffin/metal foam composite phase change material. Appl. Energy 2013, 112, 1357–1366. [Google Scholar] [CrossRef]
- Li, W.Q.; Qu, Z.G.; He, Y.L.; Tao, W.Q. Experimental and numerical studies on melting phase change heat transfer in open-cell metallic foams filled with paraffin. Appl. Therm. Eng. 2012, 37, 1–9. [Google Scholar] [CrossRef]
- Sundarram, S.S.; Li, W. The effect of pore size and porosity on thermal management performance of phase change material infiltrated microcellular metal foams. Appl. Therm. Eng. 2014, 64, 147–154. [Google Scholar] [CrossRef]
- Zhou, D.; Zhao, C.Y. Experimental investigations on heat transfer in phase change materials (PCMs) embedded in porous materials. Appl. Therm. Eng. 2011, 31, 970–977. [Google Scholar] [CrossRef]
- Tian, Y.; Zhao, C.Y. A numerical investigation of heat transfer in phase change materials (PCMs) embedded in porous metals. Energy 2011, 36, 5539–5546. [Google Scholar] [CrossRef]
- Qu, Z.G.; Li, W.Q.; Wang, J.L.; Tao, W.Q. Passive thermal management using metal foam saturated with phase change material in a heat sink. Int. Commun. Heat Mass Transf. 2012, 39, 1546–1549. [Google Scholar] [CrossRef]
- Mahjoob, S.; Vafai, K. A synthesis of fluid and thermal transport models for metal foam heat exchangers. Int. J. Heat Mass Transf. 2008, 51, 3701–3711. [Google Scholar] [CrossRef]
- Bhattacharya, A.; Calmidi, V.V.; Mahajan, R.L. Thermophysical properties of high porosity metal foams. Int. J. Heat Mass Transf. 2002, 45, 1017–1031. [Google Scholar] [CrossRef]
- Calmidi, V.V.; Mahajan, R.L. The effective thermal conductivity of high porosity fibrous metal foams. J. Heat Transf. 1999, 121, 466–471. [Google Scholar] [CrossRef]
- Boomsma, K.; Poulikakos, D. On the effective thermal conductivity of a three-dimensionally structured fluid-saturated metal foam. Int. J. Heat Mass Transf. 2001, 44, 827–836. [Google Scholar] [CrossRef]
- Bhattacharya, A. Thermophysical Properties and Convective Transport in Metal Foam and Finned Metal Foam Heat Sinks. Ph.D. Thesis, University of Colorado, Boulder, CO, USA, 2001. [Google Scholar]
- Yang, J.; Yang, L.; Xu, C.; Du, X. Experimental study on enhancement of thermal energy storage with phase-change material. Appl. Energy 2016, 169, 164–176. [Google Scholar] [CrossRef]
- Wang, C.; Lin, T.; Li, N.; Zheng, H. Heat transfer enhancement of phase change composite material: Copper foam/paraffin. Renew. Energy 2016, 96, 960–965. [Google Scholar] [CrossRef]
Figure 1.
Schematic drawing of the 2D Calmidi-Mahajan (C-M) model.

Figure 2.
Schematic drawing of the 3D Boomsma-Poulikakos (B-P) model.
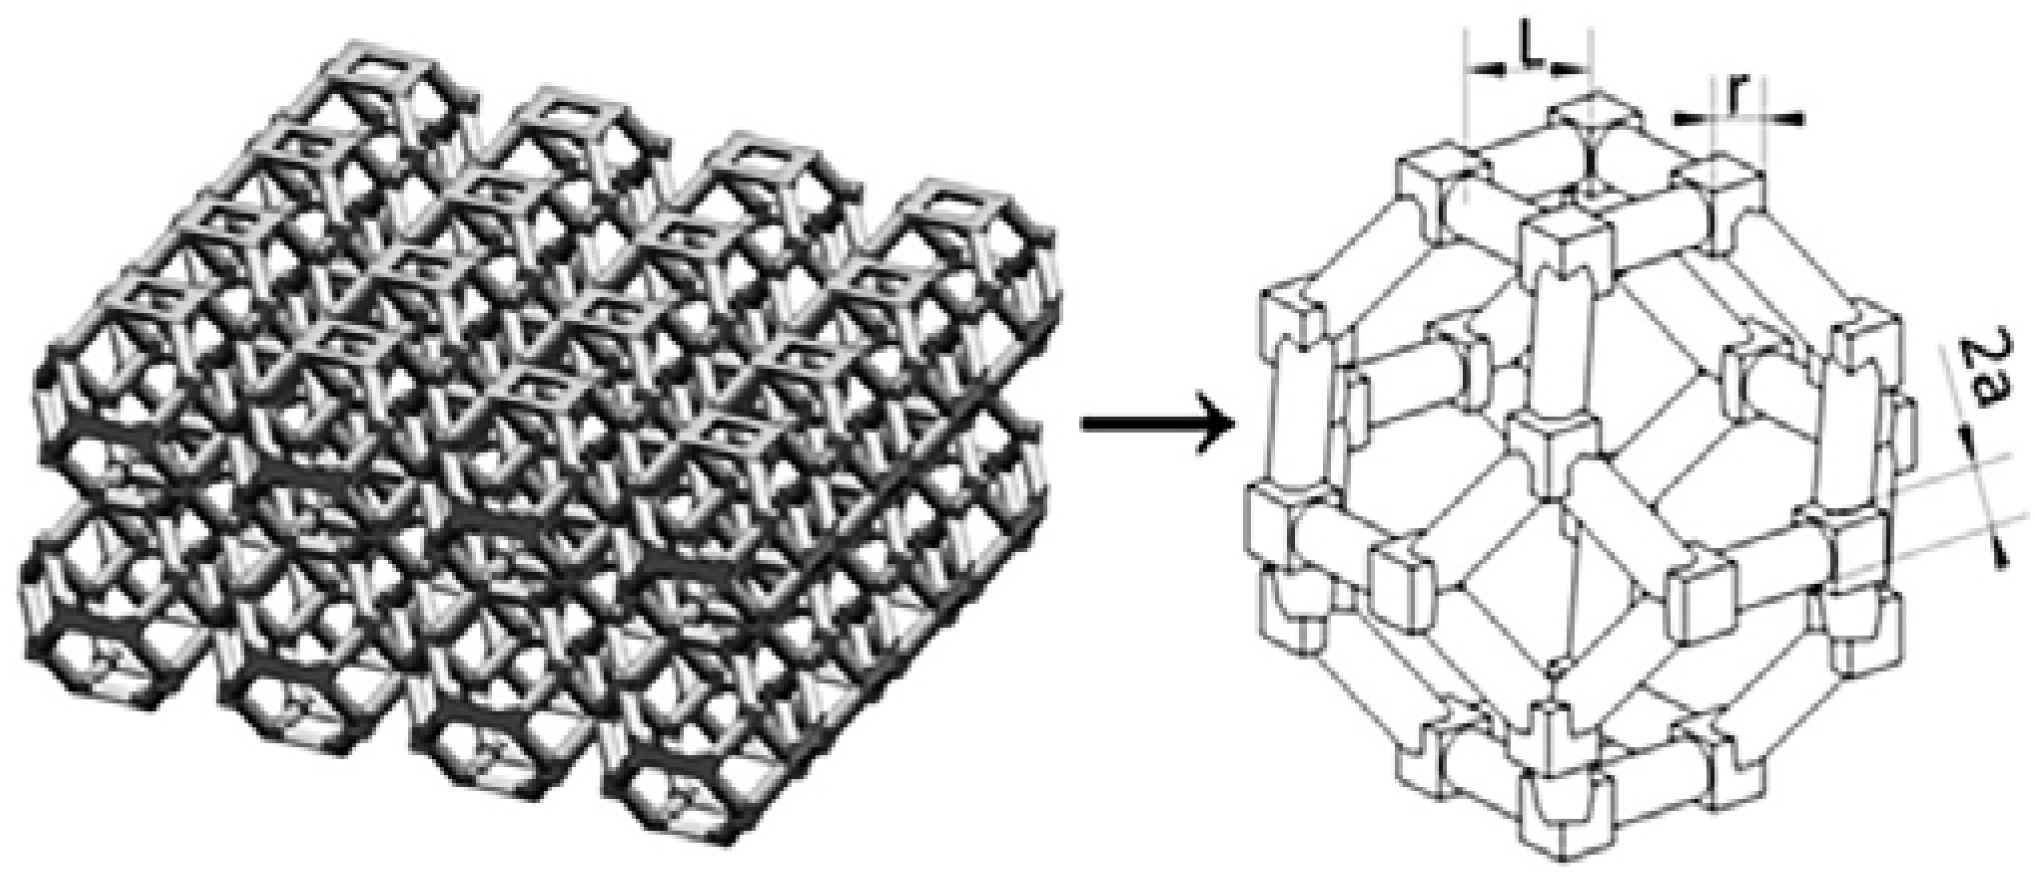
Figure 3.
Experimental apparatus for effective thermal conductivity measurement.

Figure 4.
The temperature distribution of the composite for porosity of 95%: (a) 2D C-M model; (b) 3D B-P model.
Figure 4.
The temperature distribution of the composite for porosity of 95%: (a) 2D C-M model; (b) 3D B-P model.

Figure 5.
The temperature variation of the composite for the porosity of 95%.

Figure 6.
The numerical and experimental results of the effective thermal conductivity.
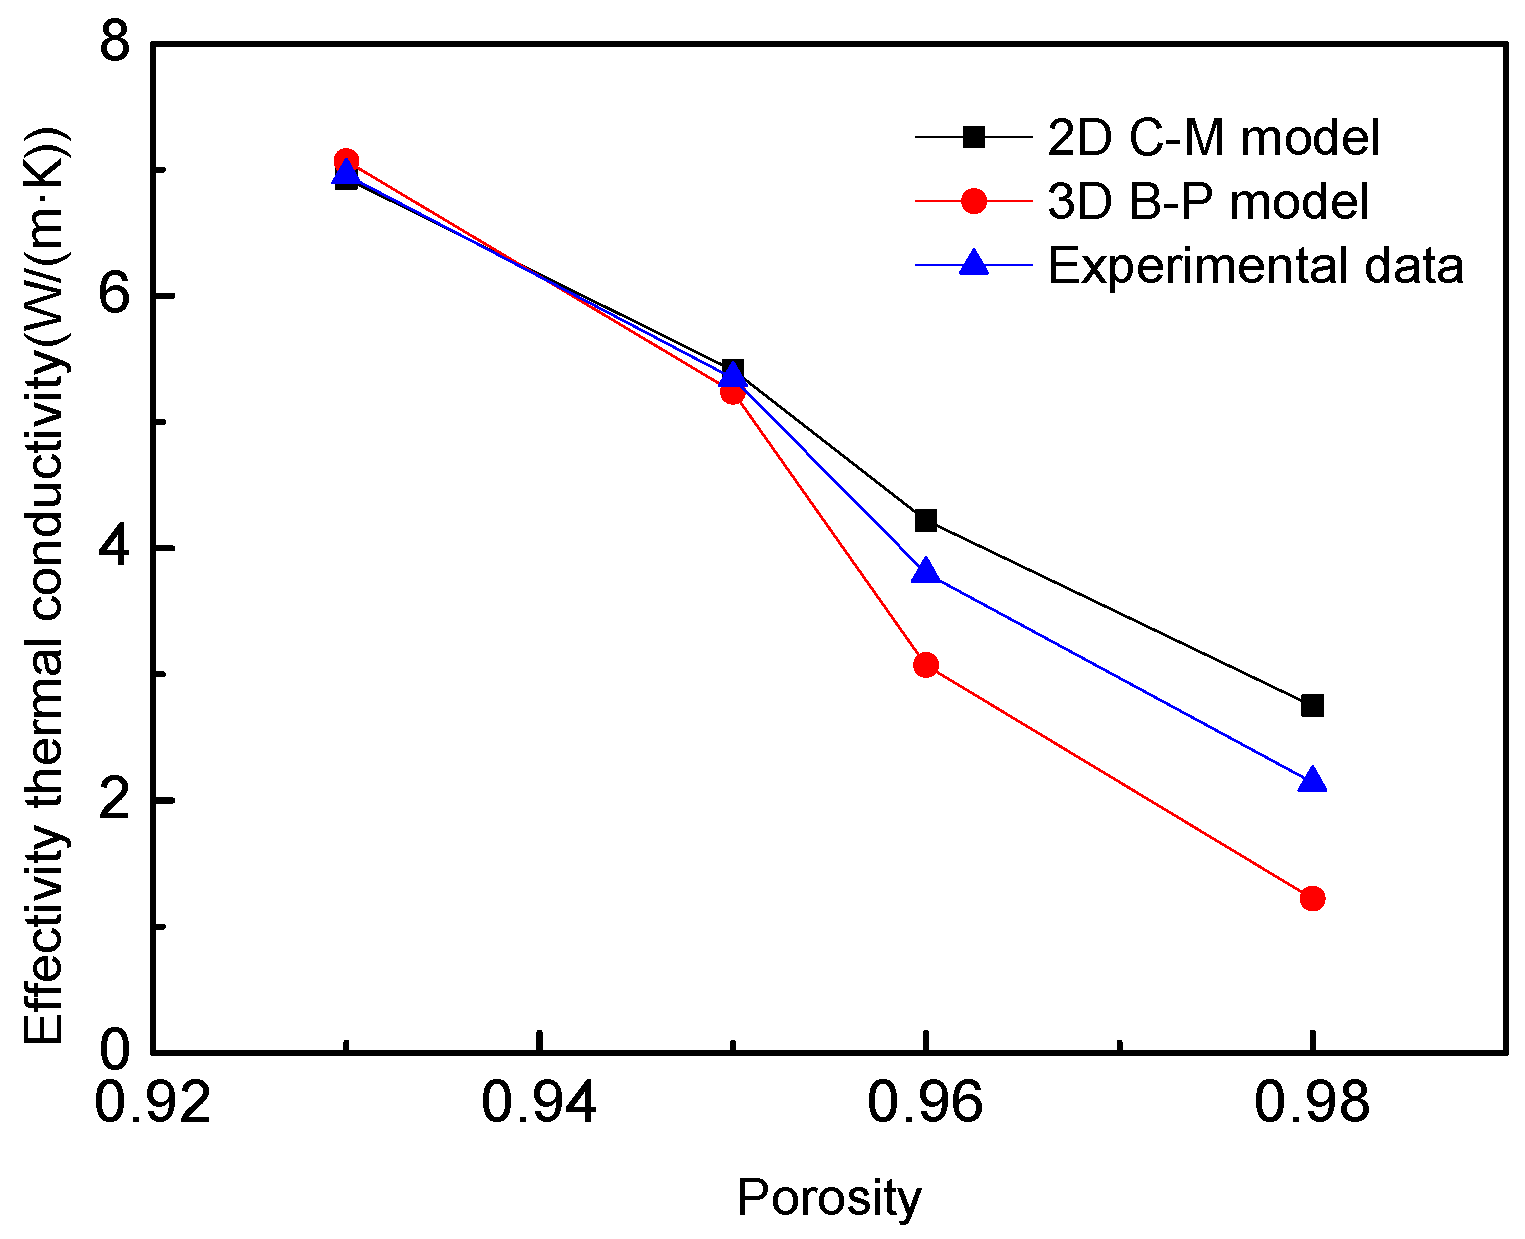
Figure 7.
The melting process of two models when the porosity was 95%: (a) 2D C-M model; (b) 3D B-P model.
Figure 7.
The melting process of two models when the porosity was 95%: (a) 2D C-M model; (b) 3D B-P model.

Figure 8.
Temperature as a function of time during the melting process: (a) 2D C-M model; (b) 3D B-P model.
Figure 8.
Temperature as a function of time during the melting process: (a) 2D C-M model; (b) 3D B-P model.


Table 1.
Physical parameter of materials.
| Material | Thermal Conductivity W/(m·K) | Specific Heat Capacity J/(kg·K) | Latent Heat of Phase Transition J/kg | Phase Transition Temperature °C |
|---|---|---|---|---|
| Paraffin | 0.26 | 2300 | 220,000 | 48~50 |
| Copper foam | 398 | 386 | -- | -- |
Table 2.
Effective thermal conductivity in 2D C-M model.
| Porosity | ΔT (°C) | Effective Thermal Conductivity (W/(m·K)) |
|---|---|---|
| 93% | 0.25 | 6.93 |
| 95% | 0.32 | 5.41 |
| 96% | 0.41 | 4.22 |
| 98% | 0.63 | 2.75 |
Table 3.
Effective thermal conductivity in 3D B-P model.
| Porosity | ΔT (°C) | Effective Thermal Conductivity (W/(m·K)) |
|---|---|---|
| 93% | 0.20 | 7.07 |
| 95% | 0.27 | 5.24 |
| 96% | 0.46 | 3.07 |
| 98% | 1.16 | 1.22 |
© 2017 by the authors. Licensee MDPI, Basel, Switzerland. This article is an open access article distributed under the terms and conditions of the Creative Commons Attribution (CC BY) license (http://creativecommons.org/licenses/by/4.0/).
Share and Cite
MDPI and ACS Style
Zheng, H.; Wang, C. Numerical and Experimental Studies on the Heat Transfer Performance of Copper Foam Filled with Paraffin. Energies 2017, 10, 902. https://doi.org/10.3390/en10070902
AMA Style
Zheng H, Wang C. Numerical and Experimental Studies on the Heat Transfer Performance of Copper Foam Filled with Paraffin. Energies. 2017; 10(7):902. https://doi.org/10.3390/en10070902
Chicago/Turabian StyleZheng, Huanpei, and Changhong Wang. 2017. "Numerical and Experimental Studies on the Heat Transfer Performance of Copper Foam Filled with Paraffin" Energies 10, no. 7: 902. https://doi.org/10.3390/en10070902
Note that from the first issue of 2016, this journal uses article numbers instead of page numbers. See further details here.