Explosion Behaviour of 30% Hydrogen/70% Methane-Blended Fuels in a Weak Turbulent Environment

School of Mechanical, Electronic and Control Engineering, Beijing Jiaotong University, Beijing 100044, China
*
Author to whom correspondence should be addressed.
Energies 2017, 10(7), 915; https://doi.org/10.3390/en10070915
Submission received: 6 June 2017
/
Revised: 28 June 2017
/
Accepted: 29 June 2017
/
Published: 3 July 2017
(This article belongs to the Section I: Energy Fundamentals and Conversion)
Abstract
:In the present investigation the explosion characteristics of 30% H2/70% CH4-blended fuels have been experimentally studied in different turbulent environments. Some important indicators about the explosion characteristics, including maximum explosion pressure (pmax), explosion duration (tc), maximum rate of pressure rise ((dp/dt)max), deflagration index (KG), and fast burn period (tb) have been studied. Furthermore, the influences of turbulent intensity associated with the equivalence ratio on explosion characteristics have been compressively analysed. The results indicated that, with the increase of turbulent intensity (u’rms), the value of pmax will be correspondingly raised while the equivalent ratio (φ) corresponding to the peak value of pmax gradually changes from stoichiometric to 1.2. Based upon the value of pmax in laminar condition, the growth extent of pmax monotonically rises to u’rms, but under a same u’rms the growth extent of pmax first declines and then rises with the increase of φ in the rage of 0.6 to 1.2. Under a laminar environment, the peak value of (dp/dt)max is attained at φ = 1.0; although such a conclusion is maintained in the studied range of turbulent intensity, the difference on the value of (dp/dt)max between φ = 1.0 and φ = 1.2 is obviously reduced with the increase of u’rms. Meanwhile, from the variation of KG, it could be found that turbulence can raise the hazardous potential of disaster. With the increase of u’rms, both the values of tc and tb reduce, the quota of tb in the explosion performs a similar regulation, but the detailed variation extent is also controlled by u’rms.
1. Introduction
Facing to the depletion of fossil fuels and the deterioration of the environment, clean alternative fuel(s) has become one hot topic in the scientific field of energies, among which the blended fuels of hydrogen and methane have been regarded as some popular options [1,2,3]. Owing to the component of hydrogen gas, hydrogen/methane-blended fuels could provide sufficient power during explosion while also easily inducing unexpected accidental explosion during the delivery and storage process; thus, studying the explosion characteristics of hydrogen/methane-blended fuels is very important to the field of applied energy.
In the past decade, some scholars contributed into the research about explosion characteristics of blended fuels, including blended fuels of pentane, hexane, and benzene [4], blended fuels of methane and carbon dioxide [5], blended fuels of liquefied petroleum gas [6], blended fuels of hydrogen and nitrogen oxides [7], the blended fuels of hydrogen and dust [8], the blended fuels of natural gas, argon, and nitrogen gas [9], blended fuels of n-alkane and nitrous oxide [10], blended fuels of butanol and octane [11], hydrogen/carbon monoxide blended fuels [12], blended fuels of hydrogen and methane [13]. As could be seen, the works on the explosion characteristics of hydrogen/methane-blended fuels are relative new and scarce in the current literature. Although Shen et al. reported some beneficial experimental data about the explosion of hydrogen/methane-blended fuels in 2017, their experiments were conducted under laminar conditions, just like most studies about explosion characteristics, without the effects of turbulence. However, as is well-known, the actual explosion in practical devices occurs within a turbulent environment; as an example, the explosion in a vehicle’s engine cylinder is always the premixed explosion within a weak turbulent environment, called the Wrinkled Premixed Explosion Mode [14]. Therefore, it is necessary and significant to study the explosion characteristics of hydrogen/methane-blended fuels within a turbulent environment.
In the research conducted by Shen et al., the experiments were conducted in a 20 L spherical explosion vessel, and the spherical space ensures the propagation of blast wave is even in each direction from the ignition location to the vessel’s inner wall. Learning from their experiences, we also conducted our research in a spherical explosion vessel with a similar size for a comparability on the obtained results. Owing to the necessity of a turbulence generation subsystem, the size of our rig is slightly larger than that of Shen et al. Since the effects of turbulence on explosion characteristics have been studied in the present article while the rig configuration is similar to that used for the same blended fuels under laminar conditions, the obtained results could fulfil the gap in the knowledge about explosion characteristics of hydrogen/methane-blended fuels to a certain extent.
Aiming at providing valuable information to acknowledge turbulent explosion characteristics and improve the current theory of premixed explosions, a series of experiments were performed on the explosion of blended fuels of hydrogen/methane with the volume fraction ratio of 30/70 within a weak turbulent environment in a spherical confined space. The combined influence of the fuel component (indicated here as the equivalence ratio, φ, from 0.6 to 1.2) and the initial turbulent intensity (indicated here by the root mean square turbulent fluctuation of the turbulent flow, u’rms, from 0 m/s to 1.309 m/s, which is in the same range of the turbulence in the cylinder of moderate spark-ignited internal combustion engines) on explosion characteristics have been studied. The five essential indicators reflecting explosion characteristics—maximal explosion pressure, the maximal rise rate of explosion pressure, explosion duration, fast explosion period, and deflagration index—have been taken as the objects to examine the detailed influences on a turbulent premixed explosion.
2. Experiment Setup and Procedures
All the experiments were conducted in a constant-volume combustion workbench (Beijing MacPower Co. Ltd., Beijing, China). The workbench is composed of four sub-systems: explosion vessel, turbulence generation system, ignition system, and data acquisition system.
The explosion vessel employed in the present article is designed in a spherical style (as those in the studies conducted by Razus et al. [4,6], Dupont [5], Denkevist [8], Zhang et al. [9], and Shen et al. [13]) rather than the cylinder style (used in the studies conducted by Tang et al. [7], Koshiba et al. [10], Xie et al. [11], and Hu et al. [12]). The major advantage of a spherical vessel is that it could ensure the even propagation of the blast wave, namely, the results are insensitive to the location of the pressure transducer. The employed explosion vessel has a net volume of 28.73 L with an inner diameter of 380 mm.
The turbulence generation system is composed of four axial-flow fans, four porous plates, four electric motors, and four magnetic couplings. Each fan is linked with one electric motor via one magnetic coupling and is located behind one porous plate to compose one fan-set, and four fan-sets are orthogonally mounted on the vessel in a pyramidal arrangement whose geometric centre is located at the vessel’s centre. The principle of turbulence generation is that four electric motors are synchronously triggered and rotate with the same speed, a swirl flow will be generated by the fan rotation forward porous plate, then the swirl would be transferred into flow jets after crossing the holes of the porous plate, and the jets from four directions would collide at the centre to form near isotropic turbulence. The turbulent intensity is determined by the fan shape, porous plate shape, and fan speed. More detailed information about the principal of turbulence generation could be found in our previous literature [14].
In the present investigation, the fan is a tetrahedron-type with five blades, the fan’s gross diameter is 90 mm while the blade width is 15 mm; the porous plate is a circular-type with 37 holes on it, the plate’s gross diameter is 110 mm, the holes’ diameters are 12 mm, and the distance between two neighbouring holes is 3 mm. The relationship between fan speed and turbulent intensity has been listed in Table 1. Actual images of the explosion vessel, axial-flow fan, and circular porous plate have been shown in Figure 1a–c, and the process of turbulence generation is demonstrated in Figure 1d.
The ignition system consists of two electrodes (diameter: 2.5 mm; gap: 2 mm) and one ignition coil, the electrodes are installed along a diameter of the circle to realize a centre-explosion. The data acquisition system employed on the explosion pressure is just the same as we employed in our previous studies on fundamental combustion characteristics of hydrogen flames within turbulent environment [14], which consists of one pressure transmitter DPA01M-P (Taida, Taiwan, China), one piezoelectric pressure transducer Kislter-6052C (Kistler Instrument AG, Winterhur, Switzerland), one charge amplifier Kislter-5018B (Kistler Instrument AG, Winterhur, Switzerland), one digital phosphor oscilloscope Tektronix DPO 3054 (Tektronix Inc., Beaverton, OR, USA), one synchronous trigger controller PMCCC Module (Beijing MacPower Co. Ltd., Beijing, China), and a data acquisition module NI PCI-6123 (National Instruments, Austin, TX, USA).
Procedurally, the explosion vessel is pumped to vacuum to provide an initial confined space, then hydrogen gas, methane gas, and air are, respectively, charged into the vessel upon Dalton’s Partial Pressure Law to configure the desired mixture with the specified equivalence ratio. Once the mixture has been prepared, the turbulence generation system is started to form the turbulent environment. After a period of one minute, the ignition system and data acquisition system is synchronously trigged to actualize the explosion and record the variation of the explosion pressure near the vessel’s inner wall. Once the explosion finishes, the vessel is again pumped to vacuum after flushing three times with air for the preparation of next set of experiments. For not inducing the effects of temperature on the explosion process, the initial temperature within the vessel in each explosion experiment should be maintained at the same level. During the actual procedure, after each explosion experiment, the vessel is flushed at least three times with cool nitrogen gas to cool the temperature of the vessel down to its normal temperature. Furthermore, after two or three sets of explosion experiments, the vessel will be dismantled to remove the accumulated water on the windows, and such operation also helps to cool the temperature of the vessel wall; therefore, in the present investigation, the temperature of the vessel walls indeed drops to sufficiently low levels before the onset of the measurements of the next explosion experiment.
In the present investigation, both the employed hydrogen and methane are pure gas with the purity of 99.99%, the employed air is synthesised by pure oxygen gas (with a purity of 99.99%) and pure nitrogen gas (with a purity of 99.99%) with the volume fraction ratio of 21/79, and all gases are supplied by Beijing Thermal-Spring Chemical Reagent and Gas Manufacturing Co. (Beijing, China). The detailed initial boundary of the present investigation is listed in Table 2.
3. Uncertainty Analysis
The uncertainty on the reported data mainly comes from two aspects: the first one is the uncertainty induced systematically, namely the uncertainty among each explosion experiment; and the other is the uncertainty induced by data processing, namely, the error induced by smoothing the raw data to statistical data as is done in all similar studies [4,5,6,7,8,9,10,11,12,13].
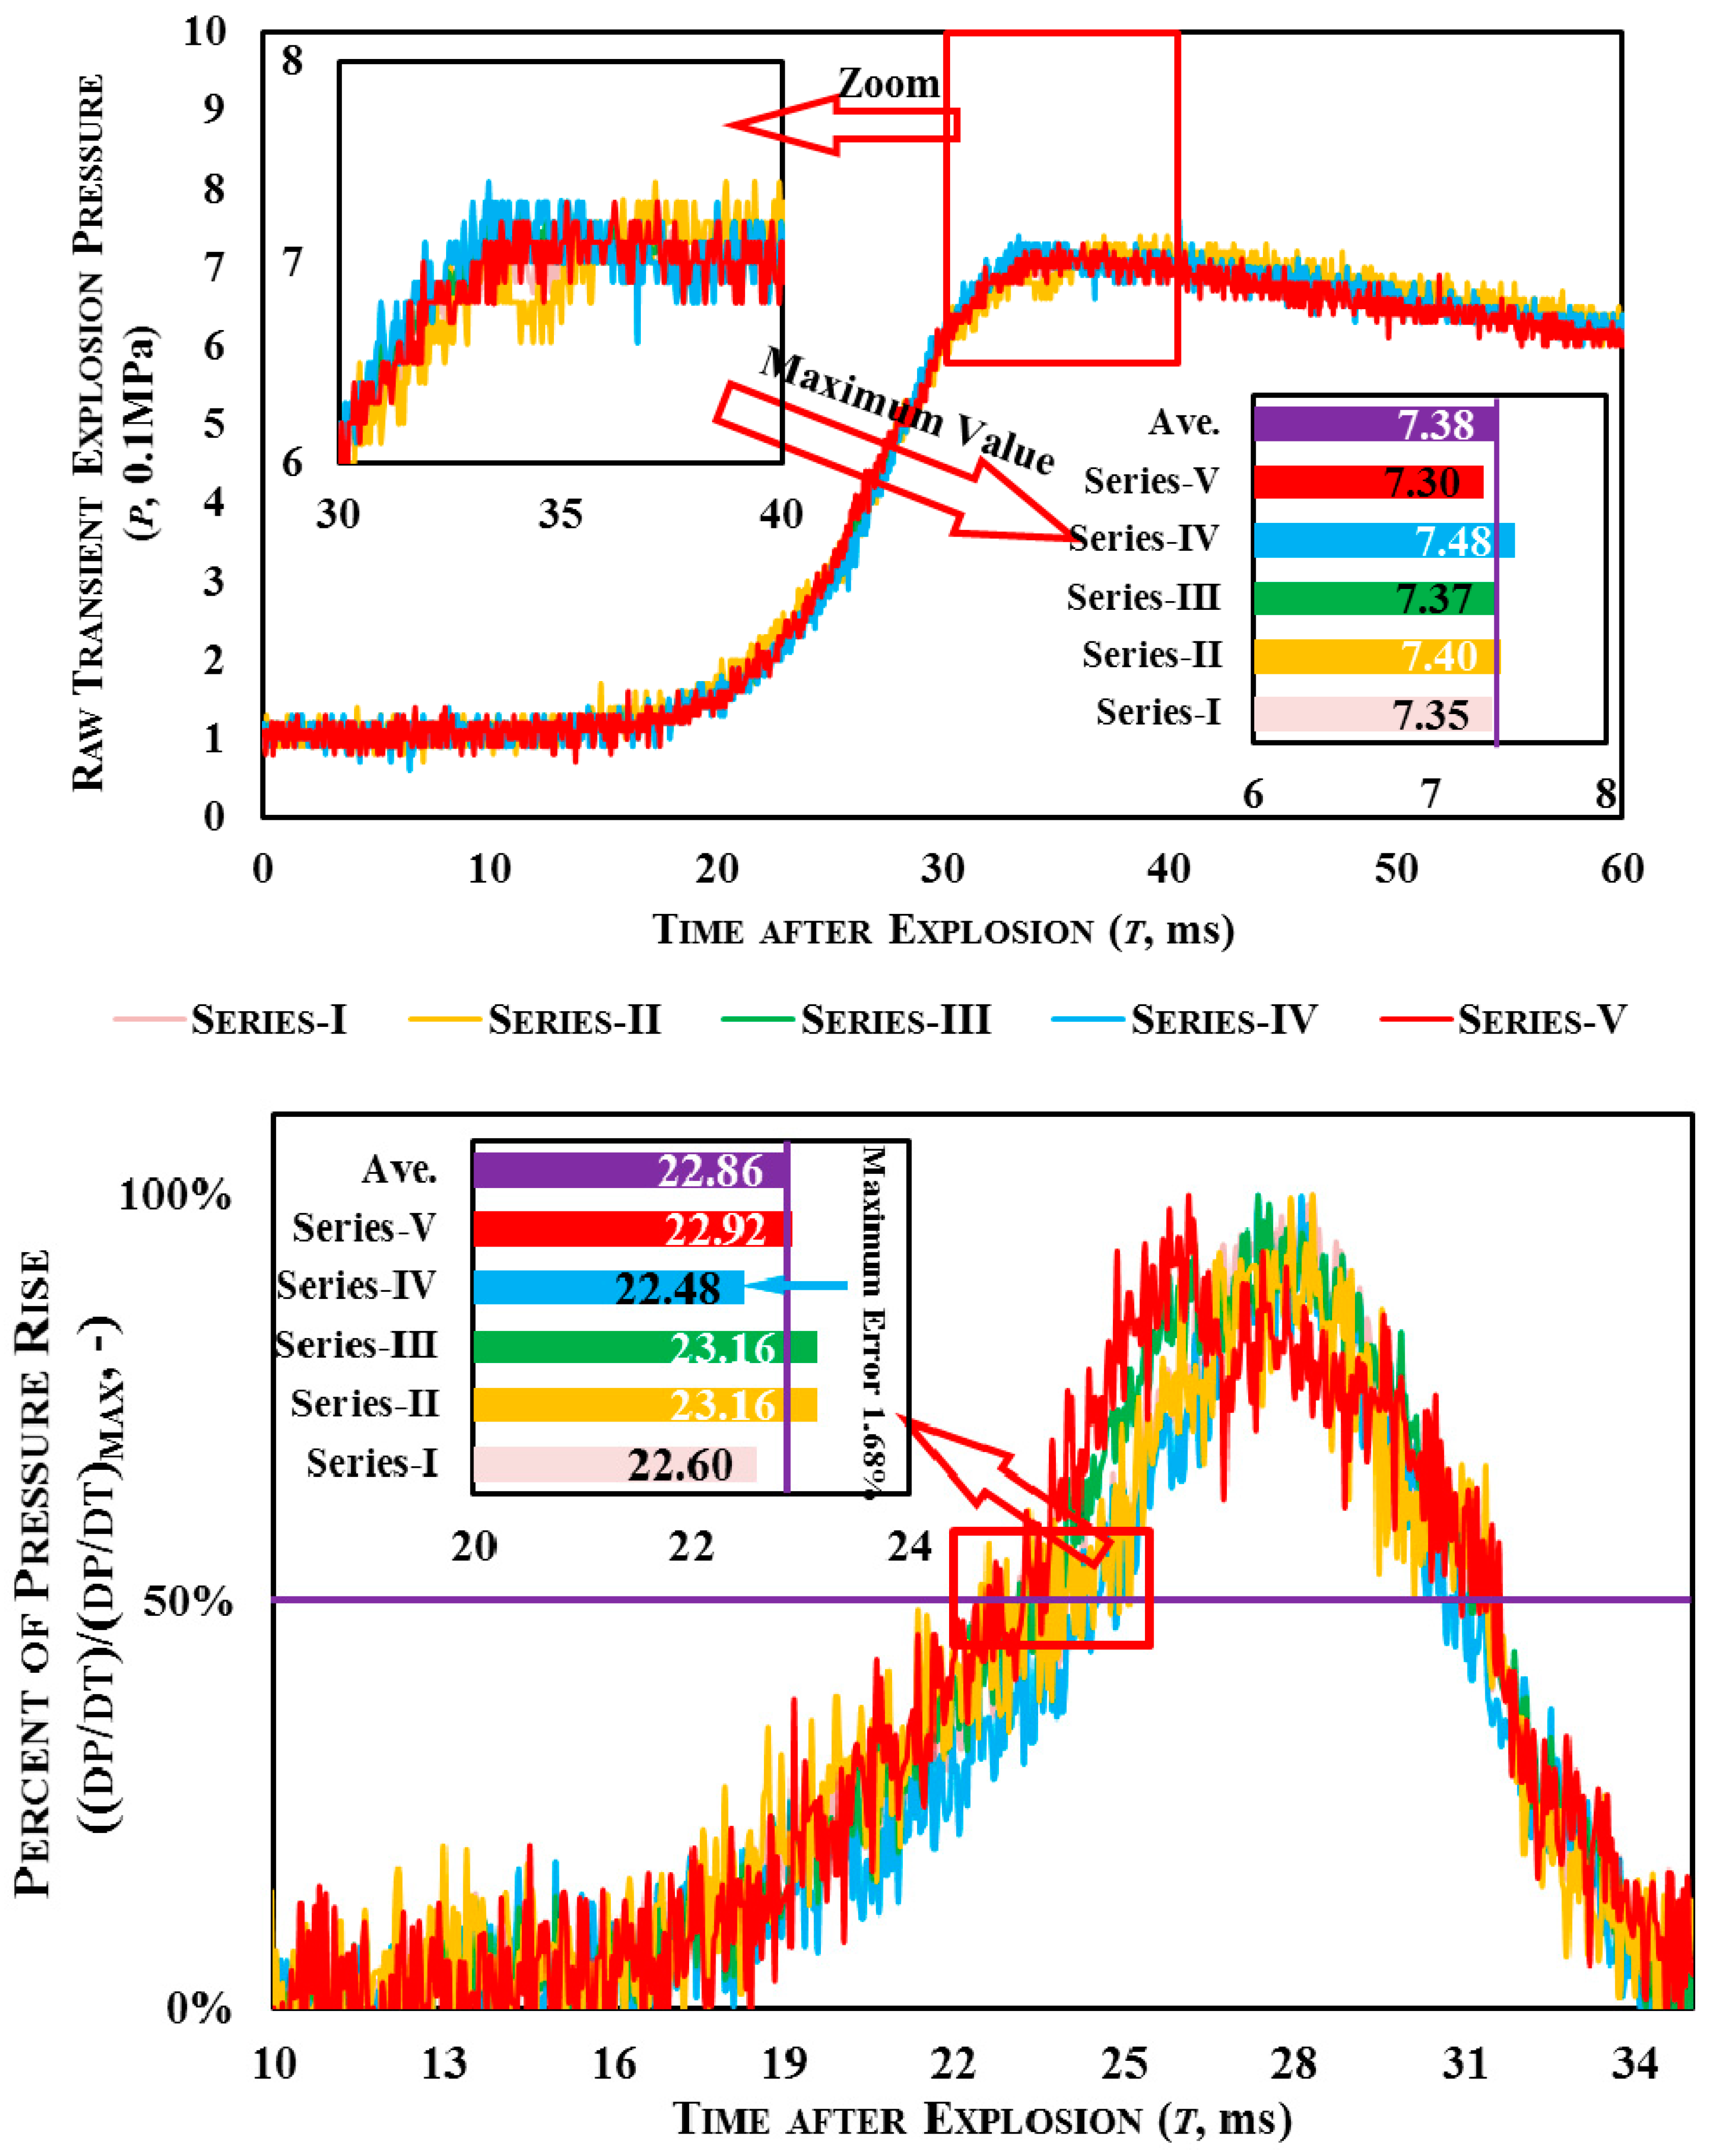
Firstly, making the analysis on systematic uncertainty. Figure 2 shows the comparison of the transient pressure historical traces and the pressure rise curves of five sets of explosion experiments with the same condition of φ = 1.0 and u’rms = 1.307 m/s. As can be seen, the explosion pressure trace within the five sets of ‘repeat’ experiments generally performs with a high similarity; the maximum pressure is around 7.38 bar with a maximum error of about 1.26% (exists at Series IV), namely, the uncertainty on pmax induced by the systematic factor is about ±1.26%. Meanwhile, the value of ta (defined as the time to reach a pressure rise of 50%) is around 22.480 ms with a maximum error of about −1.68% (which also exists at Series IV), namely, the uncertainty on ta induced by the systematic factor is about ±1.68. It should be emphasised that, learning from previous scholars [14,15], ta is one of the utmost important parameters to evaluate the repeatability of an explosion process, and the verification criterion on repeatability is commonly set at 5%. From the above statistic, it could be found that both the maximum errors of pmax and ta are far less than 5%, namely, the turbulent explosion progress reported by the present article could be believed repeatable with acceptable uncertainty levels.
Secondly, performing uncertainty analysis on the processing error. For a clear comparison of essential indicators relevant to the explosion characteristics, the raw trace is always smoothed by mathematical methods [4,5,6,7,8,9,10,11,12,13]. In the present investigation, the raw explosion pressure trace is smoothed by the moving window average method with a window width of 75 points, using the software package SciDAVis (for Mac, an open-source computer program, original authors are Tilman Benkert and Knut Franke, developers are Arun Narayanankutty, Dmitriy Pozitron, and Russell Standish, available from scidavis.sourceforge.net). Within the smoothing process, the time to reach a pressure rise of 50% ta has been taken as the criterion (of 5%) to ensure the general explosion process has not be changed. The comparison on the averaged pressure trace (upon the five repeatability experiments) and the pressure rise between the raw data and the smoothed data (in the case of φ = 1.0 and u’rms = 1.307 m/s) has been shown in Figure 3. As can be seen, the general explosion process could be maintained, the maximum value of the smoothed pressure trace is about 7.21 bar, the error bar of the averaged raw data of 7.38 bar is about 2.30%, and the value of ta in the smoothed pressure rise curve is about 22.37 ms, while the error bar of the averaged rate data of 22.86 ms is about 2.14%. Both error bars are still far less than 5%. Even with the total error is the product of systematic and processing errors, the error bar of pmax is about 3.59%, while the error bar of ta is about 3.86%, and they are still far less than 5%. While the pressure rise is the differential of the transient pressure to time, and the deflagration index is the multiple of (dp/dt)max, the error bar of these three parameter is the same. Meanwhile, the explosion duration and the fast burn period are characteristic parameters of time, just like ta and, thus, the error bar of these three time-related parameters are the same.
4. Results and Discussion
The explosion pressure curve is important to the knowledge about explosion characteristics since it is the raw source of all the data. Figure 4 illustrates the explosion pressure curves of the blended fuel of 30% H2/70% CH4 with different equivalence ratios within an environment of different turbulent intensity at the condition of standard temperature and pressure (STP). As can be seen, all the obtained curves have similar behaviours with three stages: (i) the initial ‘constant’ stage; (ii) the climb stage; and (iii) the decline stage. In detail, to 30% H2/70% CH4, under each specific equivalence ratio (φ), with the increase of the turbulent intensity (u’rms), the period of the initial ‘constant stage’ is obviously shortened, while the time at which the maximum value of the explosion pressure (pmax) attained is correspondingly advanced. Furthermore, the value of pmax is monotonically raised with the increase of u’rms.
For a more invisible and detailed comparison, the nexus among the maximum explosion pressure of 30% H2/70% CH4, equivalence ratio, and initial turbulent intensity is plotted in Figure 5, and the values of the maximum explosion pressure in a turbulent environment have been normalized by laminar conditions as shown in Figure 6. As can be seen from Figure 5, in a laminar environment, the peak value of pmax is attained at the stoichiometric level; however, for a turbulent environment, the maximum value of pmax is attained at φ = 1.2. According to the variation tendency of pmax to φ, the inclination degree of pmax in lean mixtures is much sheerer than that in rich mixtures. As could be seen from Figure 6, the value of pmax monotonically rises with the increase of u’rms. In the cases of φ = 0.8–1.2, the growth of pmax is nearly linear to u’rms while the growth rate is positively related to the absolute value of pmax in a laminar environment. In other words, the case of a certain φ in which the value of pmax is higher (within a laminar environment) has a weak sensitivity to the rise of pmax to u’rms. However, in leaner mixtures (such as φ = 0.6), the increase extent of pmax brought by strengthening the turbulence is more obvious, even in an accelerating trend, and even weaker turbulence (such as u’rms = 0.202 m/s) could make the value of pmax increase by nearly 20%.
The observed phenomenon is mainly attributed to two factors: the capacity of the explosion power and the actual level of heat loss. The first is dominated by the adiabatic explosion pressure, while the latter is related to the propagation speed of the blast wave during explosion. Different to other fuels, hydrogen gas has a stronger diffusion-thermal characteristic [16,17,18,19], which makes the values of adiabatic explosion pressure close for the case of the stoichiometric and φ = 1.2 levels, obviously higher than those in the cases whose equivalence ratio outside the range of 1.0–1.2 and, thus, it results in pmax being attained in the case of φ = 1.0–1.2. However, like most practical thermal or power devices, the explosion vessel is not an adiabatic system and certain amounts of released heat is lost during the explosion process for the temperature drop across the vessel’s wall and, resultantly, the actual value of pmax is less than the adiabatic explosion pressure. With respect to the similar values of adiabatic explosion pressure within the same space, less heat loss means a lower drop of pmax from the adiabatic explosion pressure, namely a relatively higher value of pmax; meanwhile, undergoing a similar temperature drop across the vessel’s wall, a faster propagation speed means a shorter time for the flame to reach the wall, and a lesser amount of heat conduction will occur across the wall for the sake of the integral. As reported in our previous literature [14,19,20], the premixed methane flame obtains its fastest propagation speed at the stoichiometric ratio while hydrogen obtains its fastest speed in rich mixtures (around φ = 1.6–1.8) and, hence, it is doubtless that the fastest propagation speed of the H2/CH4 premixed flame will be attained in rich mixtures whose equivalence ratio falls into the range of 1.0–1.6 [20,21,22]. However, the detailed variation of the propagation speed should be quantitatively compared for accurate explosions.
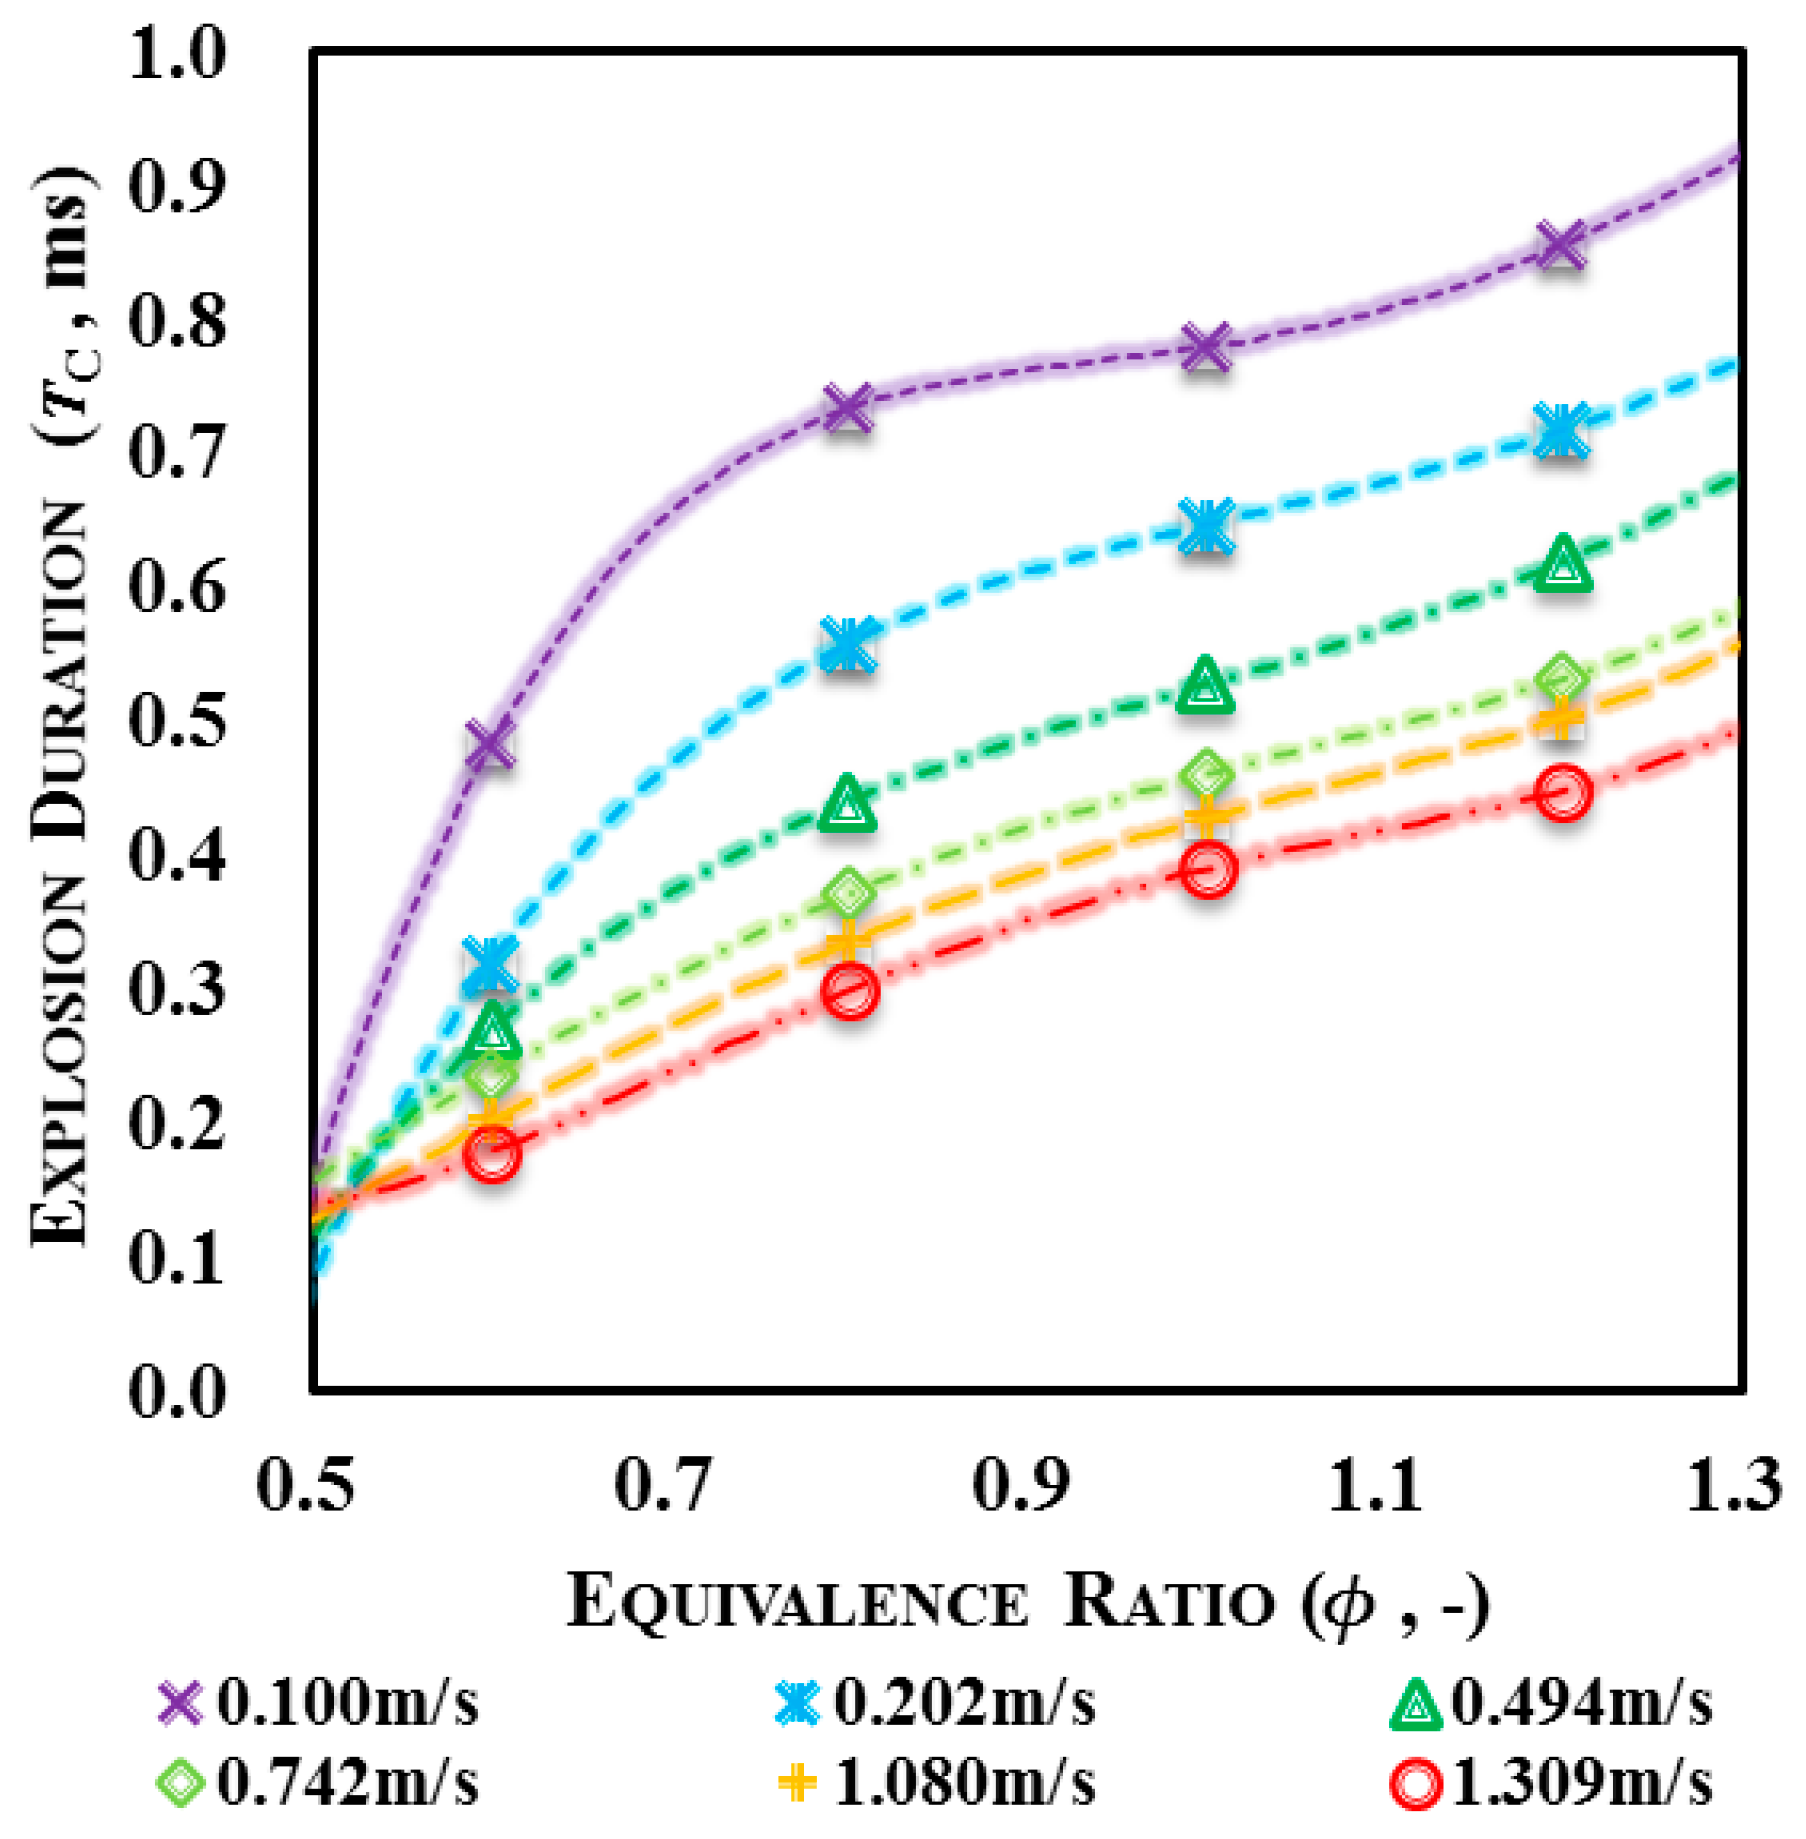
As is well-known, the peak value of the explosion pressure is attained when the flame reaches the vessel’s wall, namely, the explosion duration (the time at which pmax is attained, tc) is the time a flame needs to reach the boundary of a confined space and, thus, tc is one direct indictor reflecting the propagation speed. Figure 7 and Figure 8, respectively, show the absolute value and the normalized value (upon the laminar flow) of explosion duration under different conditions. As could be seen, in the laminar condition, the value of tc is smallest at φ = 1.0; however, in the turbulent condition, the value of tc is smallest at φ = 1.2. This means the integral amount of heat loss in the two cases under a similar adiabatic explosion pressure will obtain similar values of pmax during the explosion, as is presented in Figure 5 and Figure 6.
Backwards to other details about the variation of pmax as shown in Figure 5 and Figure 6, it could be found that, in lean explosions, the value of pmax monotonically declines with the decrease of φ, while it obviously rises with the increase of u’rms. The decline of pmax to φ could be easily explained by the decline of adiabatic explosion pressure (the maximum capability of the explosion pressure) for the reduced amount of chemical reactants. To a specific φ, the maximum capability of the explosion pressure is fixed, the increase of pmax brought by enhancing the turbulent intensity must be attributed to the reduction of the heat loss during the explosion; linked to what has been shown in Figure 7, it could be easily found that the time that flames with a same equivalence ratio need to reach the vessel’s wall is shortened with the increase of u’rms (for the reason that a stronger turbulence makes the flame front more wrinkled to enlarge the interface between unburnt mixtures to the hot flame-front, and then the process of the explosion is subsequently accelerated [14,23,24]) and, thus, the integral amount of heat loss is correspondingly reduced, and the value of pmax is resultantly raised more closely to the adiabatic explosion pressure. Regarding the richer explosions (such as φ = 1.2), the decline of pmax with the increase of φ occurs for the similar reason of a deficient chemical reaction, while the increase of pmax with the increase of u’rms occurs for the same reason of the reduction of heat loss.
Towards the detailed variation of tc brought by changing the turbulent intensity, it could be found that, from Figure 8, a weak turbulence would induce an obvious extent of decline on tc and the reduction extent is positive to the value of tc under laminar conditions, for example, to the cases of φ = 1.0 and 1.2 in which the values of tc under laminar conditions is the smallest, a weak turbulence with u’rms = 0.202 m/s could reduce tc by about 10–20%. The reduction extent will be enlarged to 40% for the case of φ = 0.8, and enlarged to about 50% for the case of φ = 0.6, in which the values of tc in the laminar environment is relatively higher. To each specific φ, the reduction extent of tc with the increase of u’rms performs a similar regulation in that it synchronized the declines with the increase of u’rms. Considering tc is one direct indictor reflecting the propagation speed, it could be concluded that the effects of turbulence on the enhancement of the propagation speed are related, limitable for the cases in which the propagation speed has been sufficiently rapid, while such enhancement is prominently related for those whose laminar propagation speed is lower.
In practical utilizations, whether an expected explosion in power devices or an unexpected explosion for safety issues, the rate of the pressure rise abstracts more attention than the absolute value of the instantaneous explosion pressure. Figure 9 shows the curves of the pressure rise rate (dp/dt) in the explosion of 30% H2/70% CH4/air mixtures under different initial conditions. As can be seen, dp/dt progressively rises until reaching the maximal value, then gradually declines. Taking the maximal rate of the pressure rise (dp/dt)max as the process of the pressure rise, the initial rate of dp/dt is relatively lower, and then suddenly rises at one certain point in time.
Compared with the explosion pressure curves, it could be determined that the critical time at which the rate of dp/dt suddenly increases is about the time at which the explosion pressure happens to rise from ta (the time at which 5% of the pressure rise is attained), and such behaviour is mainly attributed to the pressure wave being reflected from the vessel’s inner wall to the flame-front and the instantaneous thermal environment on the flame-front has been ceaselessly changed towards a higher pressure and temperature, which accelerates the chemical reaction of the mixture. As the flame-front further propagates, the distance between the flame-front and the vessel’s inner wall is shortened within an accelerating trend for the acceleration of the turbulent premixed flame’s propagation speed; once the distance between the flame-front and the vessel’s inner wall has become much closer, the growth rate of the flame’s surface area is decreased, and the pressure rise rate is correspondingly reduced.
Figure 10 shows the comparison on the maximum rate of pressure rise of 30% H2/70% CH4/air mixtures at different initial conditions. As can be seen, within the laminar environment, with the increase of φ from 0.6 to 1.2, the value of (dp/dt)max first rises to the maximal value, then declines, and the maximal value of (dp/dt)max is attained at the stoichiometric ratio. With the increase of u’rms from 0 to 1.307 m/s, the value of (dp/dt)max at each φ will correspondingly rise. Furthermore, one interesting phenomenon that occurs is that, with the increase of u’rms, the difference in the value of (dp/dt)max between φ = 1.0 and φ = 1.2 is obviously reduced.
As analysed above, the released heat is still lost through the vessel’s wall during the actual explosion, which plays an obvious role in the process of the pressure rise; therefore, the process of the pressure rise is also attributed to both maximum explosion pressure and propagation speed. In the stoichiometric case, albeit it has the highest adiabatic explosion pressure, the lower propagation speed (compared to the φ = 1.2) makes its (dp/dt)max have a weaker advantage; to the case of φ = 1.2, its lower adiabatic explosion pressure results in a lower (dp/dt)max, albeit it has the faster propagation speed. Therefore, the reduced difference on (dp/dt)max between the cases of φ = 1.0 and φ = 1.2 for a comprehensive competition results in the effects brought by the maximum explosion pressure and propagation speed. Under the influence of turbulence, the propagation speed of the blast wave significantly rises, but the adiabatic explosion pressure is maintained for the same equivalence (while the variation extent of the actual pmax is relatively weaker), the perfect competition results between pmax and propagation speed subsequently change, and the mentioned results are correspondingly obtained. Furthermore, at each specific φ, the value of (dp/dt)max is raised with the increase of u’rms for similar reasons.
Since the value of (dp/dt)max is relative to the size of the space, another parameter, the deflagration index (KG), is always taken to assess the robustness of an explosion by removing the effects of space volume:
where V is the vessel’s net volume. The corresponding values of KG for the explosion in 30% H2/70% CH4/air mixtures are also plotted in Figure 10.
KG = (dp/dt)max × V(1⁄3)
As can be seen, all the values of KG in the studied cases in the present investigation are still lower than 30 MPa·m/s (the criterion of Stand Level III is the most dangerous level of explosion), which means that the mixture of 30% H2/70% CH4 is one kind of explosive fuel with lower hazardous potential. However, it should be noted that, with the increase of u’rms, the value of KG is obviously raised; for example, the value of KG in 30% H2/70% CH4 with φ = 0.6 under laminar conditions is 1.770 MPa·m/s, just more than unity (the criterion of Stand Level 0, the safest level) but it will be raised by about 6.23 times to 11.029 MPa·m/s in the environment with u’rms = 1.307 m/s, namely, it has a hazardous potential. However, the growth extent of KG brought by turbulence will decline with the increase of φ, and the absolute growth amount of KG becomes more and more considerable, such as when the KG in 30% H2/70% CH4 with φ = 1.0 has been raised to about 18.800 MPa·m/s in the environment with u’rms = 1.307 m/s, which is sufficiently close to the criterion of Stand Level II. Upon such results, a significant suggestion could be given that, with respect to the expected utilization of explosion, generating turbulence could promote the explosion performance to obtain a higher explosion efficiency and/or better conversion efforts of thermal-to-power while, with respect to the unexpected disaster of explosion, the environment should be maintained as quiescent as possible to reduce the potential of reaching dangerous levels.
Figure 11 shows the fast explosion duration (tb, the time interval between ignition to the time (dp/dt)max is attained) of 30% H2/70% CH4/air mixtures at different initial conditions. As can be seen, under the laminar condition, with the increase of φ from 0.6 to 1.2, the value of tb first declines to the minimal value and then rises, and the minimal value of tb is attained at φ = 1.0. Under turbulent conditions, the minimal value of tb is also attained at φ = 1.0, but the difference on tb between φ = 1.0 and φ = 1.2 is obviously reduced, and such a reduction becomes more and more obvious with the further increase of u’rms. Looking backwards, the variation of explosion duration (tc), it can be found that the influence of turbulence and equivalence on both tb and tc are similar, and it is necessary to comprehensively explore the nexus between the variations of tb and tc brought by turbulence, therefore, the nexus between the normalized explosion duration and the normalized fast burn period have been plotted in Figure 12. As can be seen, under turbulent conditions, the value of the normalized fast burn period exponentially declines with the decrease of the normalized explosion duration, the decline extent is positive to u’rms, but the variation of such an extent becomes less noticeable with the increase of u’rms. The results also indicate that once u’rms has been raised to a certain value, the nexus between the normalized explosion duration and the normalized fast burn period will not be changed further.
5. Conclusions
In this study, the explosion characteristics of 30% H2/70% CH4/air have been experimentally studied under weakly turbulent conditions. The main conclusions are as follows, with respect to the investigated 30% H2/70% CH4/air:
- (1)
- The value of pmax is determined by two factors: the adiabatic explosion pressure and the heat loss during explosion. The adiabatic explosion pressure is irrelevant to turbulence, but the heat loss is closely related to turbulence since turbulence can influence the propagation speed and, thus, the raised pmax brought by enhancing the turbulent intensity is mainly attributed to the reduced heat loss brought by the accelerated propagation speed of the flame.
- (2)
- Since dp/dt is relevant to the propagation speed, the variation of (dp/dt)max under turbulent conditions can also be explained by the above conclusion. Meanwhile, from the variation of the deflagration index, it could be found that even relatively weaker turbulence can obviously raise the hazardous potential of disaster and, thus, maintaining the quiescence of the environment is one important method to reduce the hazardous level of accidental explosion.
- (3)
- The variations of tb and tc brought by turbulence are similar. The nexus between the normalized explosion duration and the normalized fast burn period indicates that once u’rms has been raised to a certain value, the nexus between the normalized explosion duration and the the normalized fast burn period will not be changed further.
Acknowledgments
The work was supported by National Natural Science Foundation of China under award 51606007, Beijing Natural Science Foundation under award 3174053, Fundamental Research Funds for the Central Universities under award 2016JBM050, and the Research Foundation for Talented Scholars under award 2016RC035.
Author Contributions
Study concepts were proposed by Zuo-Yu Sun. Literature research and study were designed by Guo-Xiu Li and Zuo-Yu Sun. Experimental studies and data acquisition were done by Fu-Sheng Li and Zuo-Yu Sun. Data analysis/interpretation and statistical analysis were done by all the authors (Fu-Sheng Li, Guo-Xiu Li, and Zuo-Yu Sun). Definition of the intellectual content of the manuscript, manuscript preparation, and editing was made by all the authors (Fu-Sheng Li, Guo-Xiu Li, and Zuo-Yu Sun).
Conflicts of Interest
The authors declare no conflict of interest.
References
- Sun, Z.Y.; Liu, F.S.; Liu, X.H.; Sun, B.G.; Sun, D.W. Research and development of hydrogen fuelled engines in China. Int. J. Hydrogen Energy 2012, 37, 664–681. [Google Scholar] [CrossRef]
- Tang, C.; Zhang, Y.; Huang, Z. Progress in combustion investigations of hydrogen enriched hydrocarbons. Renew. Sustain. Energy Rev. 2014, 30, 195–216. [Google Scholar] [CrossRef]
- Sun, Z.Y.; Li, G.X. On reliability and flexibility of sustainable energy application route for vehicles in China. Renew. Sustain. Energy Rev. 2015, 51, 830–846. [Google Scholar] [CrossRef]
- Razus, D.; Movileanu, C.; Brinzea, V.; Oancea, D. Explosion pressures of hydrocarbon-air mixtures in closed vessels. J. Hazard. Mater. 2006, 135, 58–65. [Google Scholar] [CrossRef] [PubMed]
- Dupont, L.; Accorsi, A. Explosion characteristics of synthesised biogas at various temperatures. J. Hazard. Mater. 2006, 136, 520–525. [Google Scholar] [CrossRef] [PubMed]
- Razus, D.; Brinzea, V.; Mitu, M.; Oancea, D. Explosions characteristics of LPG-air mixtures in closed vessels. J. Hazard. Mater. 2009, 165, 1248–1252. [Google Scholar] [CrossRef] [PubMed]
- Tang, C.; Huang, Z.; Jin, C.; He, J.; Wang, J.; Wang, X.; Miao, H. Explosion characteristics of hydrogen-nitrogen-air mixtures at elevated pressures and temperatures. Int. J. Hydrogen Energy 2009, 34, 554–561. [Google Scholar] [CrossRef]
- Denkevits, A. Hydrogen/dust explosion hazard in ITER: Effect of nitrogen dilution on explosion behaviour of hydrogen/tungsten dust/air mixtures. Fusion Eng. Des. 2010, 85, 1059–1063. [Google Scholar] [CrossRef]
- Zhang, B.; Xiu, G.; Bai, C. Explosion characteristics of argon/nitrogen diluted natural gas-air mixtures. Fuel 2014, 124, 125–132. [Google Scholar] [CrossRef]
- Koshiba, Y.; Nishida, T.; Morita, N.; Ohtani, H. Explosion behavior of n-alkane/nitrous oxide mixtures. Process Saf. Environ. 2015, 98, 11–15. [Google Scholar] [CrossRef]
- Xie, Y.; Wang, J.; Cai, X.; Huang, Z. Pressure history in the explosion of moist syngas/air mixtures. Fuel 2016, 40, 18250–18258. [Google Scholar] [CrossRef]
- Hu, E.; Tian, H.; Zhang, X.; Li, X.; Huang, Z. Explosion characteristics of n-butanol/iso-octane-air mixtures. Fuel 2017, 188, 90–97. [Google Scholar] [CrossRef]
- Shen, X.; Xiu, G.; Wu, S. Experimental study on the explosion characteristics of methane/air mixtures with hydrogen addition. Appl. Therm. Eng. 2017, 120, 741–747. [Google Scholar] [CrossRef]
- Sun, Z.Y.; Li, G.X. Propagation speed of wrinkled premixed flames within stoichiometric hydrogen-air mixtures under standard temperature and pressure. Korean J. Chem. Eng. 2017, 34, 1846–1857. [Google Scholar] [CrossRef]
- Vancoillie, J.; Sharpe, G.; Lawes, M.; Verhelst, S. The turbulent burning velocity of methanol-air mixtures. Fuel 2014, 130, 76–91. [Google Scholar] [CrossRef]
- Yanez, J.; Kuznetsov, M. An analysis of flame instabilities for hydrogen-air mixtures based on Sivashinsky equation. Phys. Lett. A 2016, 380, 2549–2560. [Google Scholar] [CrossRef]
- Liu, F.S.; Bao, X.C.; Gu, J.Y.; Chen, R. Onset of cellular instabilities in spherically propagating hydrogen-air premixed laminar flames. Int. J. Hydrogen Energy 2012, 37, 11458–11465. [Google Scholar] [CrossRef]
- Okafor, E.C.; Nagano, Y.; Kitagawa, T. Experimental and theoretical analysis of cellular instability in lean H2-CH4-air flames at elevated pressures. Int. J. Hydrogen Energy 2016, 41, 6581–6592. [Google Scholar] [CrossRef]
- Sun, Z.Y.; Liu, F.S.; Bao, X.C.; Liu, X.H. Research on cellular instabilities in outwardly propagating spherical hydrogen-air flames. Int. J. Hydrogen Energy 2012, 37, 7889–7899. [Google Scholar] [CrossRef]
- Sun, Z.Y.; Li, G.X. Propagation characteristics of laminar spherical flames within homogeneous hydrogen-air mixtures. Energy 2016, 116, 116–127. [Google Scholar] [CrossRef]
- Kumar, P.; Kishan, P.A.; Dhar, A. Numerical investigation of pressure and temperature influence on flame speed in CH4-H2 premixed combustion. Int. J. Hydrogen Energy 2016, 41, 9644–9652. [Google Scholar] [CrossRef]
- Nilsson, E.J.K.; van Sprang, A.; Larfeldt, J.; Konnov, A.A. The comparative and combined effects of hydrogen addition on the laminar burning velocities of methane and its blends with ethane and propane. Fuel 2017, 189, 369–376. [Google Scholar] [CrossRef]
- Matalon, M.; Creta, F. The turbulent flame speed of wrinkled premixed flames. Comptes Rendus Mécanique 2012, 340, 845–858. [Google Scholar] [CrossRef]
- Dasgupta, D.; Sun, W.; Day, M.; Lieuwen, T. Effect of turbulence-chemistry interactions on chemical pathways for turbulent hydrogen-air premixed flames. Combust. Flame 2017, 176, 191–201. [Google Scholar] [CrossRef]
Figure 1.
Schematic illustration of the explosion vessel: (a) vessel; (b) employed fan; (c) employed porous plate; and (d) principle of turbulence generation [14].
Figure 1.
Schematic illustration of the explosion vessel: (a) vessel; (b) employed fan; (c) employed porous plate; and (d) principle of turbulence generation [14].

Figure 2.
Uncertainty analysis on systematic uncertainty in the case of φ = 1.0 and u’rms = 1.307 m/s.
Figure 2.
Uncertainty analysis on systematic uncertainty in the case of φ = 1.0 and u’rms = 1.307 m/s.

Figure 3.
Comparisons between raw data and smoothed data φ = 1.0 and u’rms = 1.307 m/s.

Figure 4.
Explosion pressure curves of 30% H2/70% CH4/air under different conditions.

Figure 5.
Maximum explosion pressure of 30% H2/70% CH4/air mixtures under different conditions.

Figure 6.
Normalized maximum explosion pressure under laminar conditions.

Figure 7.
Explosion duration of 30% H2/70% CH4 mixtures under different conditions.

Figure 8.
Normalized explosion duration of 30% H2/70% CH4 under laminar conditions.

Figure 9.
Historic traces of explosion pressure rise of 30% H2/70% CH4/air under different conditions.
Figure 9.
Historic traces of explosion pressure rise of 30% H2/70% CH4/air under different conditions.

Figure 10.
Maximum rate of pressure rise and the deflagration index in a 30% H2/70% CH4/air explosion under different conditions.
Figure 10.
Maximum rate of pressure rise and the deflagration index in a 30% H2/70% CH4/air explosion under different conditions.

Figure 11.
Fast burn period of explosions in 30% H2/70% CH4/air.

Figure 12.
The nexus between the normalized explosion duration and the normalized fast burn period.


Table 1.
Corresponding turbulent intensity to driven speed in the present investigation.
| Parameter | Case 1 | Case 2 | Case 3 | Case 4 | Case 5 | Case 6 | Case 7 |
|---|---|---|---|---|---|---|---|
| Fan Speed (rpm) | 0 | 568 | 1136 | 1704 | 2272 | 2840 | 3408 |
| Turbulent Intensity (m/s) | 0.000 | 0.100 | 0.202 | 0.494 | 0.742 | 1.080 | 1.309 |
Table 2.
Corresponding turbulent intensity to driven speed in the present investigation.
| H2/CH4 | Equivalence Ratio (φ) | Partial Pressure of H2/CH4/Air | Turbulent Intensity (u’rms, m/s) |
|---|---|---|---|
| Series I | 0.6 | 0.023 bar/0.052 bar/0.925 bar | 0, 0.100, 0.202, 0.494, 0.742, 1.080, 1.309 |
| Series II | 0.8 | 0.029 bar/0.069 bar/0.902 bar | 0, 0.100, 0.202, 0.494, 0.742, 1.080, 1.309 |
| Series III | 1.0 | 0.036 bar/0.083 bar/0.881 bar | 0, 0.100, 0.202, 0.494, 0.742, 1.080, 1.309 |
| Series IV | 1.2 | 0.042 bar/0.098 bar/0.860 bar | 0, 0.100, 0.202, 0.494, 0.742, 1.080, 1.309 |
© 2017 by the authors. Licensee MDPI, Basel, Switzerland. This article is an open access article distributed under the terms and conditions of the Creative Commons Attribution (CC BY) license (http://creativecommons.org/licenses/by/4.0/).
Share and Cite
MDPI and ACS Style
Li, F.-S.; Li, G.-X.; Sun, Z.-Y. Explosion Behaviour of 30% Hydrogen/70% Methane-Blended Fuels in a Weak Turbulent Environment. Energies 2017, 10, 915. https://doi.org/10.3390/en10070915
AMA Style
Li F-S, Li G-X, Sun Z-Y. Explosion Behaviour of 30% Hydrogen/70% Methane-Blended Fuels in a Weak Turbulent Environment. Energies. 2017; 10(7):915. https://doi.org/10.3390/en10070915
Chicago/Turabian StyleLi, Fu-Sheng, Guo-Xiu Li, and Zuo-Yu Sun. 2017. "Explosion Behaviour of 30% Hydrogen/70% Methane-Blended Fuels in a Weak Turbulent Environment" Energies 10, no. 7: 915. https://doi.org/10.3390/en10070915
Note that from the first issue of 2016, this journal uses article numbers instead of page numbers. See further details here.