Advantages of Using Supercapacitors and Silicon Carbide on Hybrid Vehicle Series Architecture

1
Electrical, Electronic, and Telecommunications Engineering and Naval Architecture Department (DITEN), University of Genova, via all’Opera Pia 11a, 16145 Genova, Italy
2
Department of Mechanical, Energy, Management and Transportation Engineering (DIME), University of Genova, via all’Opera Pia 15, 16145 Genova, Italy
*
Author to whom correspondence should be addressed.
Energies 2017, 10(7), 920; https://doi.org/10.3390/en10070920
Submission received: 9 June 2017
/
Revised: 29 June 2017
/
Accepted: 30 June 2017
/
Published: 4 July 2017
Abstract
:In recent years enormous growth has taken place in the hybrid vehicle sector; parallel architecture is the most widespread configuration regarding medium size cars. At the same time, storage systems and power electronics have experienced some important innovations. The development of supercapacitors has permitted management of high power with elevated efficiency. Moreover, the availability on the market of silicon carbide components has allowed a significant reduction of power electronic losses. These improvements may challenge the hybrid architecture used in medium size cars nowadays. On one hand, series architecture would relevantly benefit from an electric powertrain efficiency increase, on the other hand, these innovations would generate low benefits in parallel architectures. The aim of this paper is to evaluate electric component average efficiency over different road missions, in order to estimate fuel economy over various working conditions and finally to establish which hybrid configuration is most efficient in vehicle applications.
1. Introduction
The spread on the market of medium size cars with hybrid parallel architecture has led to increased studies in the efficiency of the electric and electronic components necessary to realize this configuration. Often this architecture is realized with a planetary gearbox and two electric machines (power-split transmission). In [1] the component efficiency of a 2007 Toyota Camry is analyzed, whereas in [2,3] the same study is carried out, respectively, for a 2008 Toyota Lexus and a 2010 Toyota Prius. In [4,5] different studies are performed in order to synthesize optimal control logics for power split transmissions.
Whether the hybrid architecture is realized with a traditional transmission or a planetary gearbox, the term parallel is related to the possibility of providing power to the wheel shaft both with the combustion engine and the electric machine. Parallel architecture is sketched in Figure 1 with a motor generator unit (MGU); regenerative braking is allowed, whereas during combustion engine operation mode no electric losses are involved, the engine being directly connected to the transmission gearbox.
With regards to series architecture, there have been applications and studies on the use of such structures on urban buses. In [6] an analysis of potential fuel consumption reduction, using a series architecture on urban buses, is performed. The use of supercapacitors as the storage system in this architecture seems to offer potential benefits [7]. Supercapacitors seem to offer benefits on urban bus applications also using other hybrid architectures [8]. In [9] different storage systems (including supercapacitors) are evaluated, and the series architecture improvement on urban buses equipped with turbo-compound technology is shown; this technology consists of a combined cycle made of a combustion engine plus a gas turbine that allows exhaust gas enthalpy recovery.
In [10] different plug-in hybrid vehicle configurations are compared. The evaluation of fuel economy improvement with different hybrid powertrains is a current issue, in fact it is strictly related to component efficiency.
Electric and electronic components have greatly improved their performance in recent years. As far as supercapacitors are concerned, the nominal cell voltage has continuously increased up to an available 3.0 V (BCAP3000 P300 K04 [11]) on today’s market; this increase guarantees a great increase in energy density. Moreover, silicon carbide power electronics have permitted a great reduction in electric drive losses [12].
In this paper, the efficiency of the components necessary to realize a series powertrain will be analyzed in order to evaluate the performance achievable with the technologies available on the market. Both silicon and silicon carbide power electronic solutions are investigated, as well as battery and supercapacitor storage. Using an appropriate model created in MATLAB Simulink environment, the efficiency of such components is simulated on the Highway Fuel Economy Test (HWFET), the Urban Dynamometer Driving Schedule (UDDS), the US06 [13] and on some experimentally measured road missions.
Finally, combustion engine losses are introduced, in order to calculate the overall powertrain efficiency and fuel economy on the above-mentioned road missions.
2. Vehicle and Road Missions
2.1. Control Logic
The series architecture is sketched in Figure 2, where the generator (G) and the traction machine (M) are shown.
The advantage of this architecture is that the combustion engine can be controlled independently from the road mission profile. The totality of the energy supplied by the engine is subject to losses in the generator, in the traction electric machine and in the power converters. The storage balances the instantaneous difference between the power provided by the engine and that required by the road mission. Only the stored energy is subject to DC-DC converter and storage losses.
It is therefore clear that the higher the efficiency of the storage system (with its related converter), the higher the possibility to control the combustion engine. Indeed, if the storage losses are low, the engine can operate at maximum efficiency working conditions (approximately at 50% of the maximum power) and the exceeding energy can be stored; when the storage system reaches full charge, it is possible to shut down the engine until the stored energy is no longer sufficient to guarantee total electric traction.
The threshold to shut down the engine cannot be 100% of the storage state of charge (SOC); it is obviously necessary to guarantee an appropriate margin to recover backward energy caused by possible prolonged braking (long downhill roads).
In this study supercapacitors (SCs) were used as storage system, this choice was made for different reasons. A large quantity of power flows in the storage in the series architecture; therefore, long life in terms of number of cycles, is an important characteristic. Moreover, SOC measurement is precise and reliable. Finally, SCs can charge and discharge with high efficiency.
A heuristic management of power generation was developed. The internal combustion engine (ICE) charges the SCs until 75% of their maximum voltage (in such a way leaving a suitable margin for long braking); when the voltage goes below 55%, ICE turns on again. SCs can work until 50% of their maximum voltage; the lower limit margin (between 50% and 55%) is used to avoid frequent ICE ignitions when the speed is lower than 30 km/h (for comfort reasons).
2.2. Internal Combustion Engine
The spark-ignition engine presented in [14] was used as reference. In this study a 40 kW ICE was used (as reported in Section 2.3), therefore ICE [14] torque and speed were normalized in per units and the related efficiency (plotted in Figure 3) was considered in this study.
2.3. Vehicle Features
The vehicle features used for the simulations are shown in Table 1.
2.4. Road Missions
The reference cycles (US06, UDDS, and HWFET) allow a comparison between the results in literature and the results obtained in this study; the disadvantage of these road missions is that they are at constant slope. This is not usually relevant, but since long downhill missions are particularly critical in this study as SCs have lower specific energy compared to batteries, they may fully charge and dissipative braking might be necessary.
For this reason, in addition to the three standard cycles, two experimentally measured missions in Genoa city (urban and fast-urban) and another mission measured in Genoa’s hinterland (extra-urban), were simulated. The main features of the six road missions are presented in Table 2.
The extra-urban mission is particularly critical for the storage system due to a long downhill road. In particular, this mission is characterized by a significant difference in altitude, as shown in Figure 4.
3. Electric Components and Power Electronics Modelling
3.1. Electric Machines
In Table 3 the main features of the electric machines are shown.
The electric machine losses were modelled according to the results illustrated in [15]; these losses, together with the related efficiencies, are plotted in Figure 5.
In order to evaluate the losses of machines with different characteristics, torque, speed and losses were converted in per unit (p.u.) and identical losses were supposed to derive from identical machine typology according to what is proposed in [16].
An equivalent per unit table was obtained and used as a look-up table in the MATLAB Simulink model.
With the above-mentioned hypothesis, the look-up table can be used both for the traction machine and for the generator, despite the different values of nominal torque and speed.
3.2. Inverters
Inverter losses using traditional silicon (Si) components and innovative silicon carbide (SiC) components were both evaluated.
Starting from the data shown in [12], available for a 350 V and a 800 V DC-link and by interpolating these values, losses for a 650 V DC-link converter were calculated.
3.3. Supercapacitor Storage
The weight of supercapacitor storage was limited to 85 kg, according to the current applications [3] and the assumptive sizing available in literature [17,18].
Using the BCAP3000 P300 K04 [11] elementary cells, connected in series up to 85 kg in weight, a storage characterized by the parameters shown in Table 4 was obtained.
Supercapacitor storage was modelled in the MATLAB Simulink environment as an ideal capacitor with a series resistance (ESR). More complicated models, like the one presented in [19], simulate the supercapacitor behavior for high frequency; this behavior becomes significant above 0.2 Hz frequency; however, considering the road missions low frequency dynamic, those effects were neglected. The self-discharge phenomenon (modelled with the parallel resistance) was also neglected; although this effect is of primary importance for the storage management, these results are negligible from an energy point of view.
3.4. DC-DC Converter
The supercapacitor voltage changes significantly because it depends on the stored energy; therefore, a DC-DC converter, connecting the storage to the DC-link, is necessary. All the energy which flows in the storage is affected by the converter losses both in the charging and discharging phases; for this reason, the efficiency evaluation of this component is of primary importance.
The DC-link voltage was chosen equal to 650 V, according to the available applications [3], the storage maximum voltage is 495 V, hence a half-bridge converter is suitable for this application because the storage voltage is always lower than the DC-link voltage.
The losses in this component are the sum of switching losses and conduction losses.
The energy losses in each switching are given by Equation (5) [12]:
where Ic is the storage current and Vce is the DC-link voltage.
Generally the switching power loss is:
where LON is the switching on loss, LOFF the switching off loss, LR is the diode recovery loss, and fC is the switching frequency.
Replacing (5) in (6) one obtains:
The three-switching-loss contributions can be given by the constructors both separately or jointly.
From the IGBT F300R12KE3 [20] data-sheet one obtains:
For SiC technology, considering the MOSFET CAS300M12BM2 [21], for which the total switching losses are given, from its data-sheet one obtains:
Thus, the switching power loss is given by the Equation (10):
The conduction losses were simulated using an averaged switch model (ASM), which also evaluates the losses related to the current ripple; the model presented in [22] was used.
From the data-sheets of the above-mentioned components, one obtains the parameters shown in Table 5, which are necessary to calculate the conduction losses.
Concerning inductance, DC link capacitance and switching frequency, according to the values available in [22,23], the following values were used:
A model in the MATLAB Simulink Plecs environment was created to evaluate the converter losses, according to that explained above.
4. Simulation Results
4.1. Electric Powertrain Efficiency
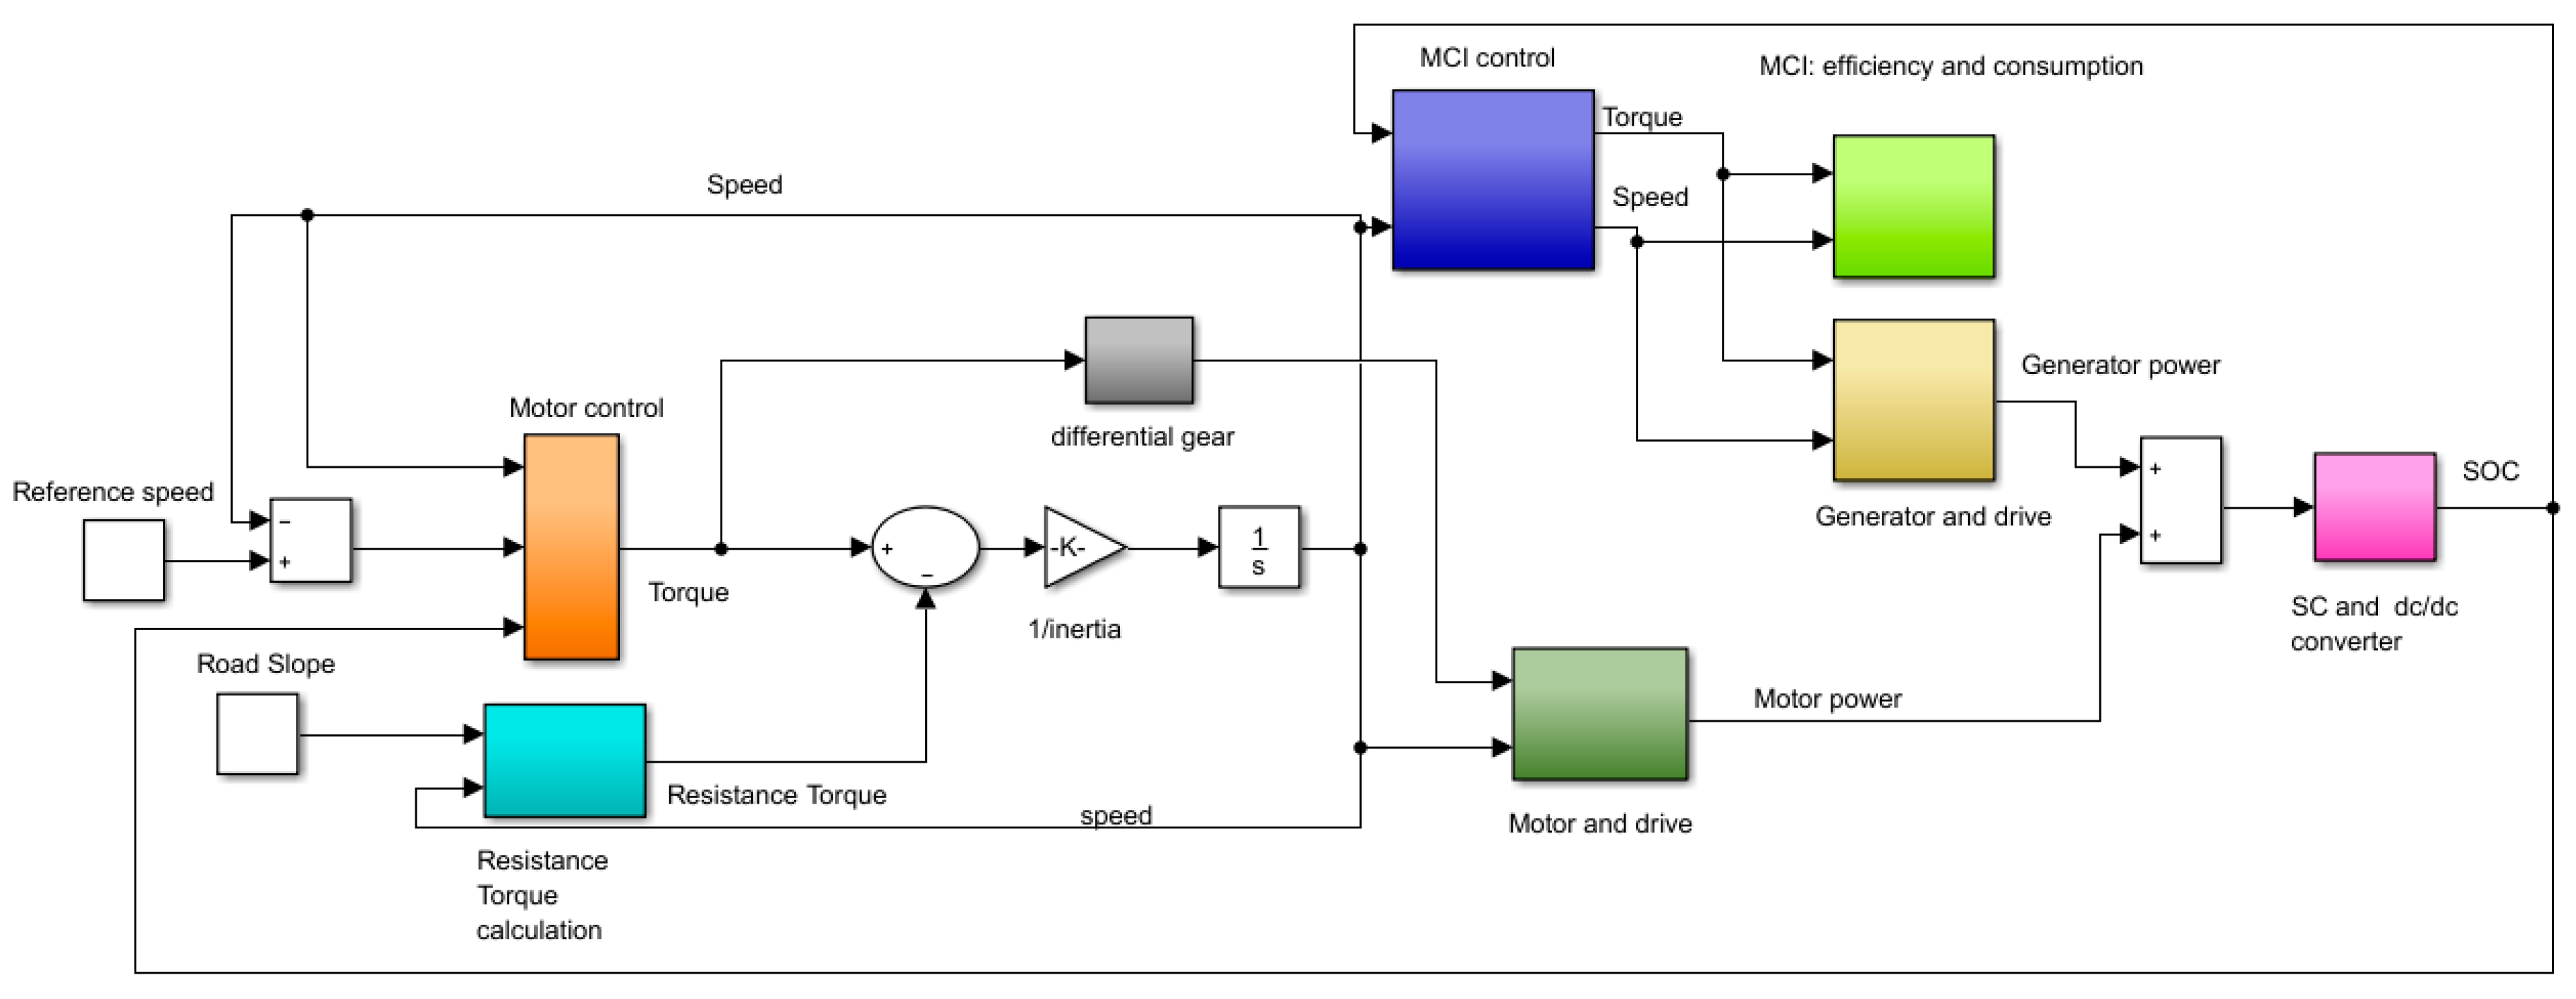
In order to evaluate component efficiency and overall powertrain efficiency in different working conditions, a MATLAB Simulink model was created (Figure 10).
The efficiency (η) of the electric components necessary to realize a series architecture, obtained by simulations with the model sketched in Figure 10, are presented in Table 6.
It is interesting to notice that the traction machine inverter efficiency is comparable to the one obtained in [12] over the three different road missions.
Regarding DC-DC converter and SC storage, with the above mentioned control logic, the major quantity of generated energy is affected by both charging and discharging losses; for this reason both efficiencies are evaluated.
The electric machine efficiency, as well as its inverter, instead, is evaluated only during motor working condition and the regenerative braking is not considered. The efficiency in regenerative deceleration, in fact, would be the same as a parallel architecture, so it is not useful to show this parameter here, where the aim is to evaluate the additional electric losses introduced by a series architecture.
An important result was for the storage system not to reach the full charge state (also in the extra-urban mission, despite the long downhill road). For this reason, the use of SCs is suitable for this application, as well as the sizing and the control logics.
In Table 7, the overall electric powertrain efficiency is shown (obtained as a product of Table 6 efficiencies).
Considering the very high electric powertrain efficiency, especially using SiC components, the series architecture could be a valid alternative to the parallel.
4.2. Powertrain Fuel Economy
To compare the two structures, series and parallel, simulations of the entire series powertrain efficiency were carried out: the ICE efficiency, the differential gear efficiency and the backward energy deriving from regenerative slowdowns were evaluated. In series architecture, the ICE can operate at a maximum efficiency condition, therefore its efficiency is about 34%.
To evaluate the energy virtuosity of series architecture, a comparison with the fuel economy of a parallel architecture is of primary importance.
In Table 8, different configurations of parallel and series architectures are compared. A parallel structure like the one sketched in Figure 1 was used; in fact, despite power-split architecture it is the most wide spread on the market, the first is more energy saving [24]. An 80% charge-discharge battery efficiency was considered for both architectures; this efficiency value can be considered both an optimistic evaluation for a NiMH battery and a real working condition efficiency for a Li-ion battery [25,26]; in any case battery efficiency has a low impact on the overall powertrain efficiency as far as parallel architecture is concerned [27]. As for series architecture, a simple rule-based energy management system was used in parallel architecture. Battery recharging is almost guaranteed only with regenerative braking and electric traction is preferred at low speed; the engine turn-on threshold depends on SOC measurement.
SCs and SiC component technology in parallel architecture would lead to low benefits. In fact, as shown in [27], parallel architecture is scarcely sensitive to battery efficiency variation. Moreover, in parallel architecture converters are used to interface the electric machine with the storage only during regenerative braking and electric traction. The only backward energy is affected by electric losses (storage and converter losses), whereas in series architecture all the generated energy is affected by these losses.
5. Conclusions
Simulations demonstrated that a SC storage is suitable for a medium size car hybrid series application.
Using a battery as storage system, parallel architecture is more efficient than series architecture (Table 8); this fact explains the actual spread of parallel architectures for medium size cars.
Nevertheless, this result is completely overturned if SCs are used as a storage system. The possibility of achieving the ICE maximum efficiency working condition, with low electric losses (Table 7), is successful.
The introduction of SiC components provides significant improvements, especially in low speed missions (UDDS and Urban); this technology, indeed, provides particular advantages in low-load conditions, as observed in [12]. For these road missions, the electric powertrain efficiency is increased by 5%. Using SiC components combined with SCs the overall electric powertrain efficiency is significantly high (between 85% and 89%).
This fact reevaluates the series architecture, which becomes more efficient than the parallel.
Moreover, series architecture would greatly benefit from a turbo-compound introduction, whereas these advantages would be negligible on parallel architecture due to the lower average ICE torque [9,24,27].
Definitively, with the introduction of turbo-compound technology, the gap between series and parallel architecture would be further increased.
For an industrial application, a cost and component sizing evaluation would be of great importance. Series architecture, on the one hand, would benefit from ICE downsizing and transmission gearbox removal, on the other hand, an additional generator with its related converter is necessary. If these two aspects compensate one another, SCs storage is the most expensive component. Approximately an 85 kg SCs has the same cost of an 85 kg Li-ion battery; however, a SCs life is significantly longer. SiC components are actually more expensive than traditional Si components, nevertheless the former represent an innovative solution from a technological standpoint and converters have a moderate impact on the overall powertrain cost.
For these reasons, parallel and series architecture costs can be more or less comparable.
Acknowledgments
The authors would like to wholeheartedly thank Alessandro Pini Prato for his suggestions, assistance, and encouragement throughout this work.
Author Contributions
Mario Marchesoni and Massimiliano Passalacqua handled the power electronics modeling. Damiano Lanzarotto coped with electric machine efficiency evaluation. Matteo Repetto provided useful data on internal combustion engines. Massimiliano Passalacqua performed simulations and wrote the article.
Conflicts of Interest
The authors declare no conflict of interest.
References
- Burress, T.A.; Coomer, C.L.; Campbell, S.L.; Seiber, L.E.; Marlino, L.D.; Staunton, R.H.; Cunningham, J.P. Evaluation of the 2007 Toyota Camry Hybrid Synergy Drive System. Available online: https://www.osti.gov/scitech/servlets/purl/928684 (accessed on 1 July 2017).
- Burress, T.A.; Coomer, C.L.; Campbell, S.L.; Wereszczak, A.A.; Cunningham, J.P.; Marlino, L.D. Evaluation of the 2008 Lexus Ls 600h Hybrid Synergy Drive System. Available online: https://www.osti.gov/scitech/servlets/purl/947393 (accessed on 1 July 2017).
- Burress, T.A.; Campbell, S.L.; Coomer, C.L.; Ayers, C.W.; Wereszczak, A.A.; Cunningham, J.P.; Marlino, L.D.; Seiber, L.E.; Lin, H.T. Evaluation of the 2010 Toyota Prius Hybrid Synergy Drive System. Available online: http://ecee.colorado.edu/~ecen5017/notes/OakRidge_2010Prius.pdf (accessed on 1 July 2017).
- Huang, K.; Xiang, C.; Ma, Y.; Wang, W.; Langari, R. Mode shift control for a hybrid heavy-duty vehicle with power-split transmission. Energies 2017, 10, 177. [Google Scholar] [CrossRef]
- Chen, Z.; Mi, C.C.; Xu, J.; Gong, X.; You, C. Energy management for a power-split plug-in hybrid electric vehicle based on dynamic programming and neural networks. IEEE Trans Veh. Technol. 2014, 63, 1567–1580. [Google Scholar] [CrossRef]
- Chen, J.; Du, J.; Wu, X. Fuel economy analysis of series hybrid electric bus with idling stop strategy. In Proceedings of the 2014 9th International Forum on Strategic Technology (IFOST), Cox’s Bazar, Bangladesh, 21–23 October 2014; pp. 359–362. [Google Scholar]
- Zhao, Y.; Yao, J.; Zhong, Z.m.; Sun, Z.c. The research of powertrain for supercapacitor-based series hybrid bus. In Proceedings of the 2008 IEEE Vehicle Power and Propulsion Conference, Harbin, China, 3–5 September 2008; pp. 1–4. [Google Scholar]
- Min, H.; Lai, C.; Yu, Y.; Zhu, T.; Zhang, C. Comparison study of two semi-active hybrid energy storage systems for hybrid electric vehicle applications and their experimental validation. Energies 2017, 10, 279. [Google Scholar] [CrossRef]
- Dellacha, J.; Repetto, M.; Passalacqua, M.; Lanzarotto, D.; Prato, A.P. Turbocompound technology on hybrid power trains: Urban buses take inspiration from F1 power units. Energy Product. Manag. 21st Century II Quest Sustain. Energy 2016, 205, 179–190. [Google Scholar]
- Son, H.; Park, K.; Hwang, S.; Kim, H. Design methodology of a power split type plug-in hybrid electric vehicle considering drivetrain losses. Energies 2017, 10, 437. [Google Scholar] [CrossRef]
- Maxwell Supercapacitor. Available online: www.maxwell.com (accessed on 1 July 2017).
- Kim, H.; Chen, H.; Zhu, J.; Maksimović, D.; Erickson, R. Impact of 1.2 kv sic-mosfet EV traction inverter on urban driving. In Proceedings of the 2016 IEEE 4th Workshop on Wide Bandgap Power Devices and Applications (WiPDA), Fayetteville, AR, USA, 7–9 November 2016; pp. 78–83. [Google Scholar]
- Vehicle and Fuel Emissions Testing. Available online: https://www.epa.gov/vehicle-and-fuel-emissions-testing/dynamometer-drive-schedules (accessed on 1 July 2017).
- Königstein, A.; Grebe, U.D.; Wu, K.-J.; Larsson, P.-I. Differentiated analysis of downsizing concepts. MTZ Worldw. 2008, 69, 4–11. [Google Scholar] [CrossRef]
- Pellegrino, G.; Vagati, A.; Guglielmi, P.; Boazzo, B. Performance comparison between surface-mounted and interior PM motor drives for electric vehicle application. IEEE Trans. Ind. Electron. 2012, 59, 803–811. [Google Scholar] [CrossRef]
- Mahmoudi, A.; Soong, W.L.; Pellegrino, G.; Armando, E. Efficiency maps of electrical machines. In Proceedings of the 2015 IEEE Energy Conversion Congress and Exposition (ECCE), Montreal, QC, Canada, 20–24 September 2015; pp. 2791–2799. [Google Scholar]
- Carpaneto, M.; Ferrando, G.; Marchesoni, M.; Savio, S. A new conversion system for the interface of generating and storage devices in hybrid fuel-cell vehicles. In Proceedings of the IEEE International Symposium on Industrial Electronics, Dubrovnik, Croatia, 20–23 June 2005; pp. 1477–1482. [Google Scholar]
- Leskovar, S.; Marchesoni, M.; Savio, S.; Vacca, C. Optimal sizing of storage systems in fuel cell vehicles for urban application. In Proceedings of the Symposium on Power Electronics and Electrical Drives and Advanced Electrical Motors (SPEEDAM), Capri, Italy, 16–18 June 2004. [Google Scholar]
- Musolino, V.; Piegari, L.; Tironi, E. New full-frequency-range supercapacitor model with easy identification procedure. IEEE Trans. Ind. Electron. 2013, 60, 112–120. [Google Scholar] [CrossRef]
- Infineon Semiconductor. Available online: www.infineon.com (accessed on 1 July 2017).
- Cree Semiconductor. Available online: www.wolfspeed.com (accessed on 1 July 2017).
- Marchesoni, M.; Vacca, C. A refined DC/DC two-quadrant converter model for conduction losses evaluation. In Proceedings of the International Power Electronics and Motion Control Conference 2004 (EPE/PEMC 2004), Riga, Latvia, 2–4 September 2004. [Google Scholar]
- Leskovar, S.; Marchesoni, M.; Mazzucchelli, M.; Vacca, C. Efficiency evaluation of fuel cell vehicle power conversion system based on average switching modeling. In Proceedings of the Symposium on Power Electronics and Electrical Drives and Advanced Electrical Motors (SPEEDAM), Capri, Italy, 16–18 June 2004. [Google Scholar]
- Lanzarotto, D.; Passalacqua, M.; Repetto, M. Energy comparison between different parallel hybrid architecture. In Proceedings of the WIT Energy and Sustainability 2017, Seville, Spain, 20–22 September 2017. [Google Scholar]
- Swal, N.; Shrivastava, V. An improve efficiency of li-ion batteries using optimization technique. In Proceedings of the 2016 3rd International Conference on Computing for Sustainable Global Development (INDIACom), New Delhi, India, 16–18 March 2016; pp. 2279–2284. [Google Scholar]
- Hu, X.; Murgovski, N.; Johannesson, L.M.; Egardt, B. Comparison of three electrochemical energy buffers applied to a hybrid bus powertrain with simultaneous optimal sizing and energy management. IEEE Trans. Intell. Transp. Syst. 2014, 15, 1193–1205. [Google Scholar] [CrossRef]
- Passalacqua, M.; Lanzarotto, D.; Repetto, M.; Marchesoni, M. Conceptual design upgrade on hybrid powertrains resulting from electrics improvements. WIT Int. J. Transp. Dev. Integr. 2017, in press. [Google Scholar]
Figure 1.
Hybrid parallel powertrain.

Figure 2.
Hybrid series powertrain.

Figure 3.
ICE efficiency contour map.

Figure 4.
Extra-urban mission elevation profile.

Figure 5.
(a) Interior-permanent-magnet motor losses [W] and (b) efficiency [%].

Figure 6.
(a) Si inverter losses [W] and (b) efficiency [%].

Figure 7.
(a) SiC inverter losses [W] and (b) efficiency [%].

Figure 8.
DC-DC Si converter efficiency [%].
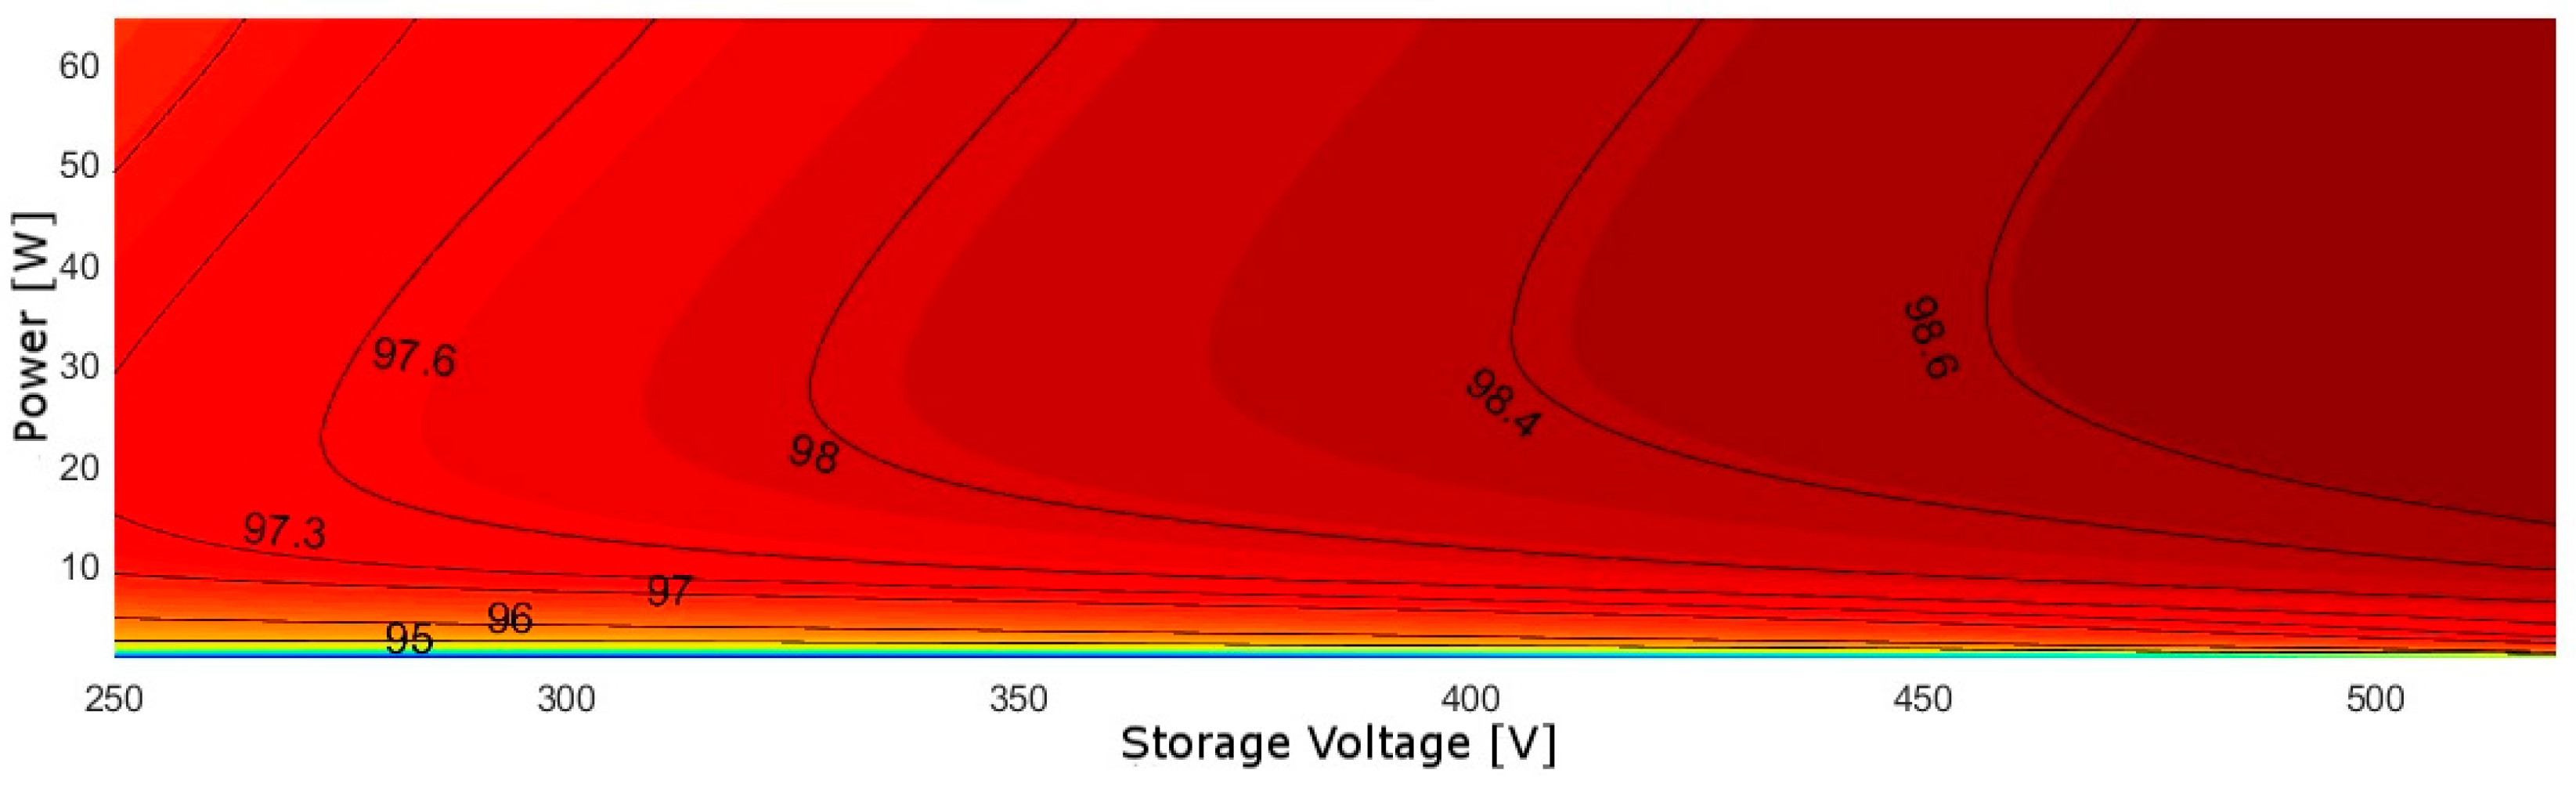
Figure 9.
DC-DC SiC converter efficiency [%].

Figure 10.
Hybrid powertrain MATLAB Simulink model.

Table 1.
Vehicle features.
| Vehicle Features | Values |
|---|---|
| Vehicle mass 1 [kg] | 1450 |
| Rolling coefficient | 0.01 |
| Aerodynamic drag coefficient | 0.25 |
| Vehicle front area [m2] | 2.3 |
| Wheel radius [m] | 0.3 |
| Final gear ratio | 8 |
| Differential gear efficiency | 0.97 |
| Air density [kg/m3] | 1.22 |
| ICE maximum power 2 [kW] | 40 |
| ICE rated power 3 [kW] | 20 |
| ICE rated speed 4 [rpm] | 2500 |
1 The vehicle mass includes the electric machines (about 80 kg), the storage system (85 kg) and the electric drives (about 15 kg). 2 The vehicle performance is related to the electric motor and it is independent of the ICE sizing; as a consequence, ICE downsizing about 50%. 3 Power in the maximum efficiency working condition. 4 Speed in the maximum efficiency working condition.
Table 2.
Simulated road mission features.
| Road Missions | Average Speed [km/h] | Maximum Speed [km/h] | Length [km] | Elevation [m] | Maximum Road Slope [%] |
|---|---|---|---|---|---|
| US06 | 78 | 130 | 13 | - | - |
| UDDS | 31 | 90 | 12 | - | - |
| HWFET | 78 | 97 | 16.5 | - | - |
| Urban | 24 | 57 | 11.4 | 20 | negligible |
| Fast-urban | 27 | 68 | 22 | 62 | 6 |
| Extra-urban | 45 | 80 | 36 | 300 | 9 |
Table 3.
Electric machine features.
| Electric Machine Features | Values |
|---|---|
| Traction Machine Maximum Torque [Nm] | 230 |
| Traction machine base speed [rpm] | 3500 |
| Traction machine maximum speed [rpm] | 12,000 |
| Traction machine estimated weight 1 [kg] | 40 |
| Generator maximum torque 2 [Nm] | 400 |
| Generator base speed 3 [rpm] | 1750 |
| Generator estimated weight [kg] | 40 |
| Electric converters estimated weight [kg] | 15 |
| DC link voltage [V] | 650 |
1 The traction machine weight, as well as the generator and the converters weight, were estimated according to the values shown in [3]. 2 The continuative-use torque is about 55% of the maximum torque (shown in the table), according to what is presented in [15]. 3 The generator is directly connected at the ICE shaft, so the torque-speed characteristic of the generator should respect the ICE speed; for that reason the maximum torque and the base speed of generator and traction machine are different.
Table 4.
Supercapacitor storage features.
| Storage Features | Values |
|---|---|
| Elementary Cell Used | BCAP3000 P300 K04 |
| Number of series cells | 165 |
| Total mass [kg] | 86 |
| Capacitance [F] | 18.2 |
| Nominal voltage [V] | 495 |
| ESR 1 [mΩ] | 44.6 |
| Nominal power 2 [kW] | 662 |
| Useful energy 3 [Wh] | 465 |
1 Equivalent series resistance; 2 The storage nominal power is one order of magnitude higher than the converter nominal power, therefore this is not a critical parameter for the storage. In fact, the sizing criterion for supercapacitors is the stored energy; 3 Usable energy, calculated considering a working condition between 50% and 100% of the nominal voltage. This energy is calculated as E = 0.5 × 0.75 × C × V2max.
Table 5.
Parameters to evaluate conduction losses.
| ASM Parameters | Si | SiC |
|---|---|---|
| VCE | 1 V | 0 |
| RT | 0.003 Ω | 4.2 mΩ |
| VAK | 1 V | 0.85 V |
| RD | 0.002 Ω | 2.4 mΩ |
Table 6.
Electric component average efficiencies on different road missions.
| Power Electronics | Road Missions | η SC (Charge) | η SC (Discharge) | η DC/DC (Charge) | η DC/DC (Discharge) | η Traction Machine | η Traction Machine Inverter | η Generator | η Generator Inverter |
|---|---|---|---|---|---|---|---|---|---|
| Si | US06 | 0.988 | 0.988 | 0.978 | 0.978 | 0.954 | 0.988 | 0.961 | 0.991 |
| UDDS | 0.992 | 0.995 | 0.975 | 0.967 | 0.941 | 0.979 | 0.961 | 0.991 | |
| HWFET | 0.991 | 0.995 | 0.979 | 0.975 | 0.958 | 0.992 | 0.961 | 0.991 | |
| Urban | 0.990 | 0.993 | 0.970 | 0.969 | 0.935 | 0.975 | 0.961 | 0.991 | |
| Fast urban | 0.990 | 0.993 | 0.974 | 0.965 | 0.935 | 0.977 | 0.961 | 0.991 | |
| Extra-urban | 0.991 | 0.992 | 0.977 | 0.975 | 0.953 | 0.986 | 0.961 | 0.991 | |
| SiC | US06 | 0.988 | 0.989 | 0.991 | 0.991 | 0.954 | 0.994 | 0.961 | 0.994 |
| UDDS | 0.991 | 0.995 | 0.991 | 0.986 | 0.941 | 0.992 | 0.961 | 0.994 | |
| HWFET | 0.991 | 0.995 | 0.993 | 0.991 | 0.958 | 0.997 | 0.961 | 0.994 | |
| Urban | 0.989 | 0.992 | 0.990 | 0.988 | 0.935 | 0.990 | 0.961 | 0.994 | |
| Fast urban | 0.993 | 0.991 | 0.989 | 0.984 | 0.935 | 0.991 | 0.961 | 0.994 | |
| Extra-urban | 0.991 | 0.993 | 0.992 | 0.990 | 0.953 | 0.994 | 0.961 | 0.994 |
Table 7.
Electric powertrain efficiency over different road missions.
| Power Electronics | Road Missions | η Electric Powertrain |
|---|---|---|
| Si | US06 | 84% |
| UDDS | 82% | |
| HWFET | 85% | |
| Urban | 80% | |
| Fast urban | 80% | |
| Extra-urban | 84% | |
| SiC | US06 | 87% |
| UDDS | 86% | |
| HWFET | 89% | |
| Urban | 85% | |
| Fast urban | 85% | |
| Extra-urban | 87% |
Table 8.
Fuel economy [km/l].
| Road Missions | Parallel | Series (Battery + Si) | Series (SC + Si) | Series (SC + SiC) |
|---|---|---|---|---|
| US06 | 17.6 | 16.8 | 19.8 | 20.7 |
| UDDS | 23.7 | 25.1 | 31.5 | 34.7 |
| HWFET | 23.8 | 23.1 | 26.6 | 27.6 |
| Urban | 26.9 | 23.2 | 31.4 | 35 |
| Fast-urban | 27.4 | 24.9 | 32.1 | 35.3 |
| Extra-urban | 29.9 | 25.7 | 33.6 | 36 |
© 2017 by the authors. Licensee MDPI, Basel, Switzerland. This article is an open access article distributed under the terms and conditions of the Creative Commons Attribution (CC BY) license (http://creativecommons.org/licenses/by/4.0/).
Share and Cite
MDPI and ACS Style
Passalacqua, M.; Lanzarotto, D.; Repetto, M.; Marchesoni, M. Advantages of Using Supercapacitors and Silicon Carbide on Hybrid Vehicle Series Architecture. Energies 2017, 10, 920. https://doi.org/10.3390/en10070920
AMA Style
Passalacqua M, Lanzarotto D, Repetto M, Marchesoni M. Advantages of Using Supercapacitors and Silicon Carbide on Hybrid Vehicle Series Architecture. Energies. 2017; 10(7):920. https://doi.org/10.3390/en10070920
Chicago/Turabian StylePassalacqua, Massimiliano, Damiano Lanzarotto, Matteo Repetto, and Mario Marchesoni. 2017. "Advantages of Using Supercapacitors and Silicon Carbide on Hybrid Vehicle Series Architecture" Energies 10, no. 7: 920. https://doi.org/10.3390/en10070920
Note that from the first issue of 2016, this journal uses article numbers instead of page numbers. See further details here.