Electric Power Grids Distribution Generation System for Optimal Location and Sizing—A Case Study Investigation by Various Optimization Algorithms


Abstract
:1. Introduction
2. Background Mathematical Formulation
3. Methodology on Hybrid Optimization Algorithm
3.1. Simulated Annealing
3.2. Variable Search Environment Descendin
- Initialization: Select the set of environments, structures to be used in the descent. Find an initial solution x;
- Iterations: Repeat until no improvement is obtained (until there is no more optimization that we can get).In the following sequence:
- (1)
- Make .
- (2)
- Repeat until the following:
- (a)
- Exploration of the environment: Find the best solution of the kth neighborhood of
- (b)
- Move or not: If the obtained solution is better than x, do ; otherwise do .
3.3. Genetic Algorithm
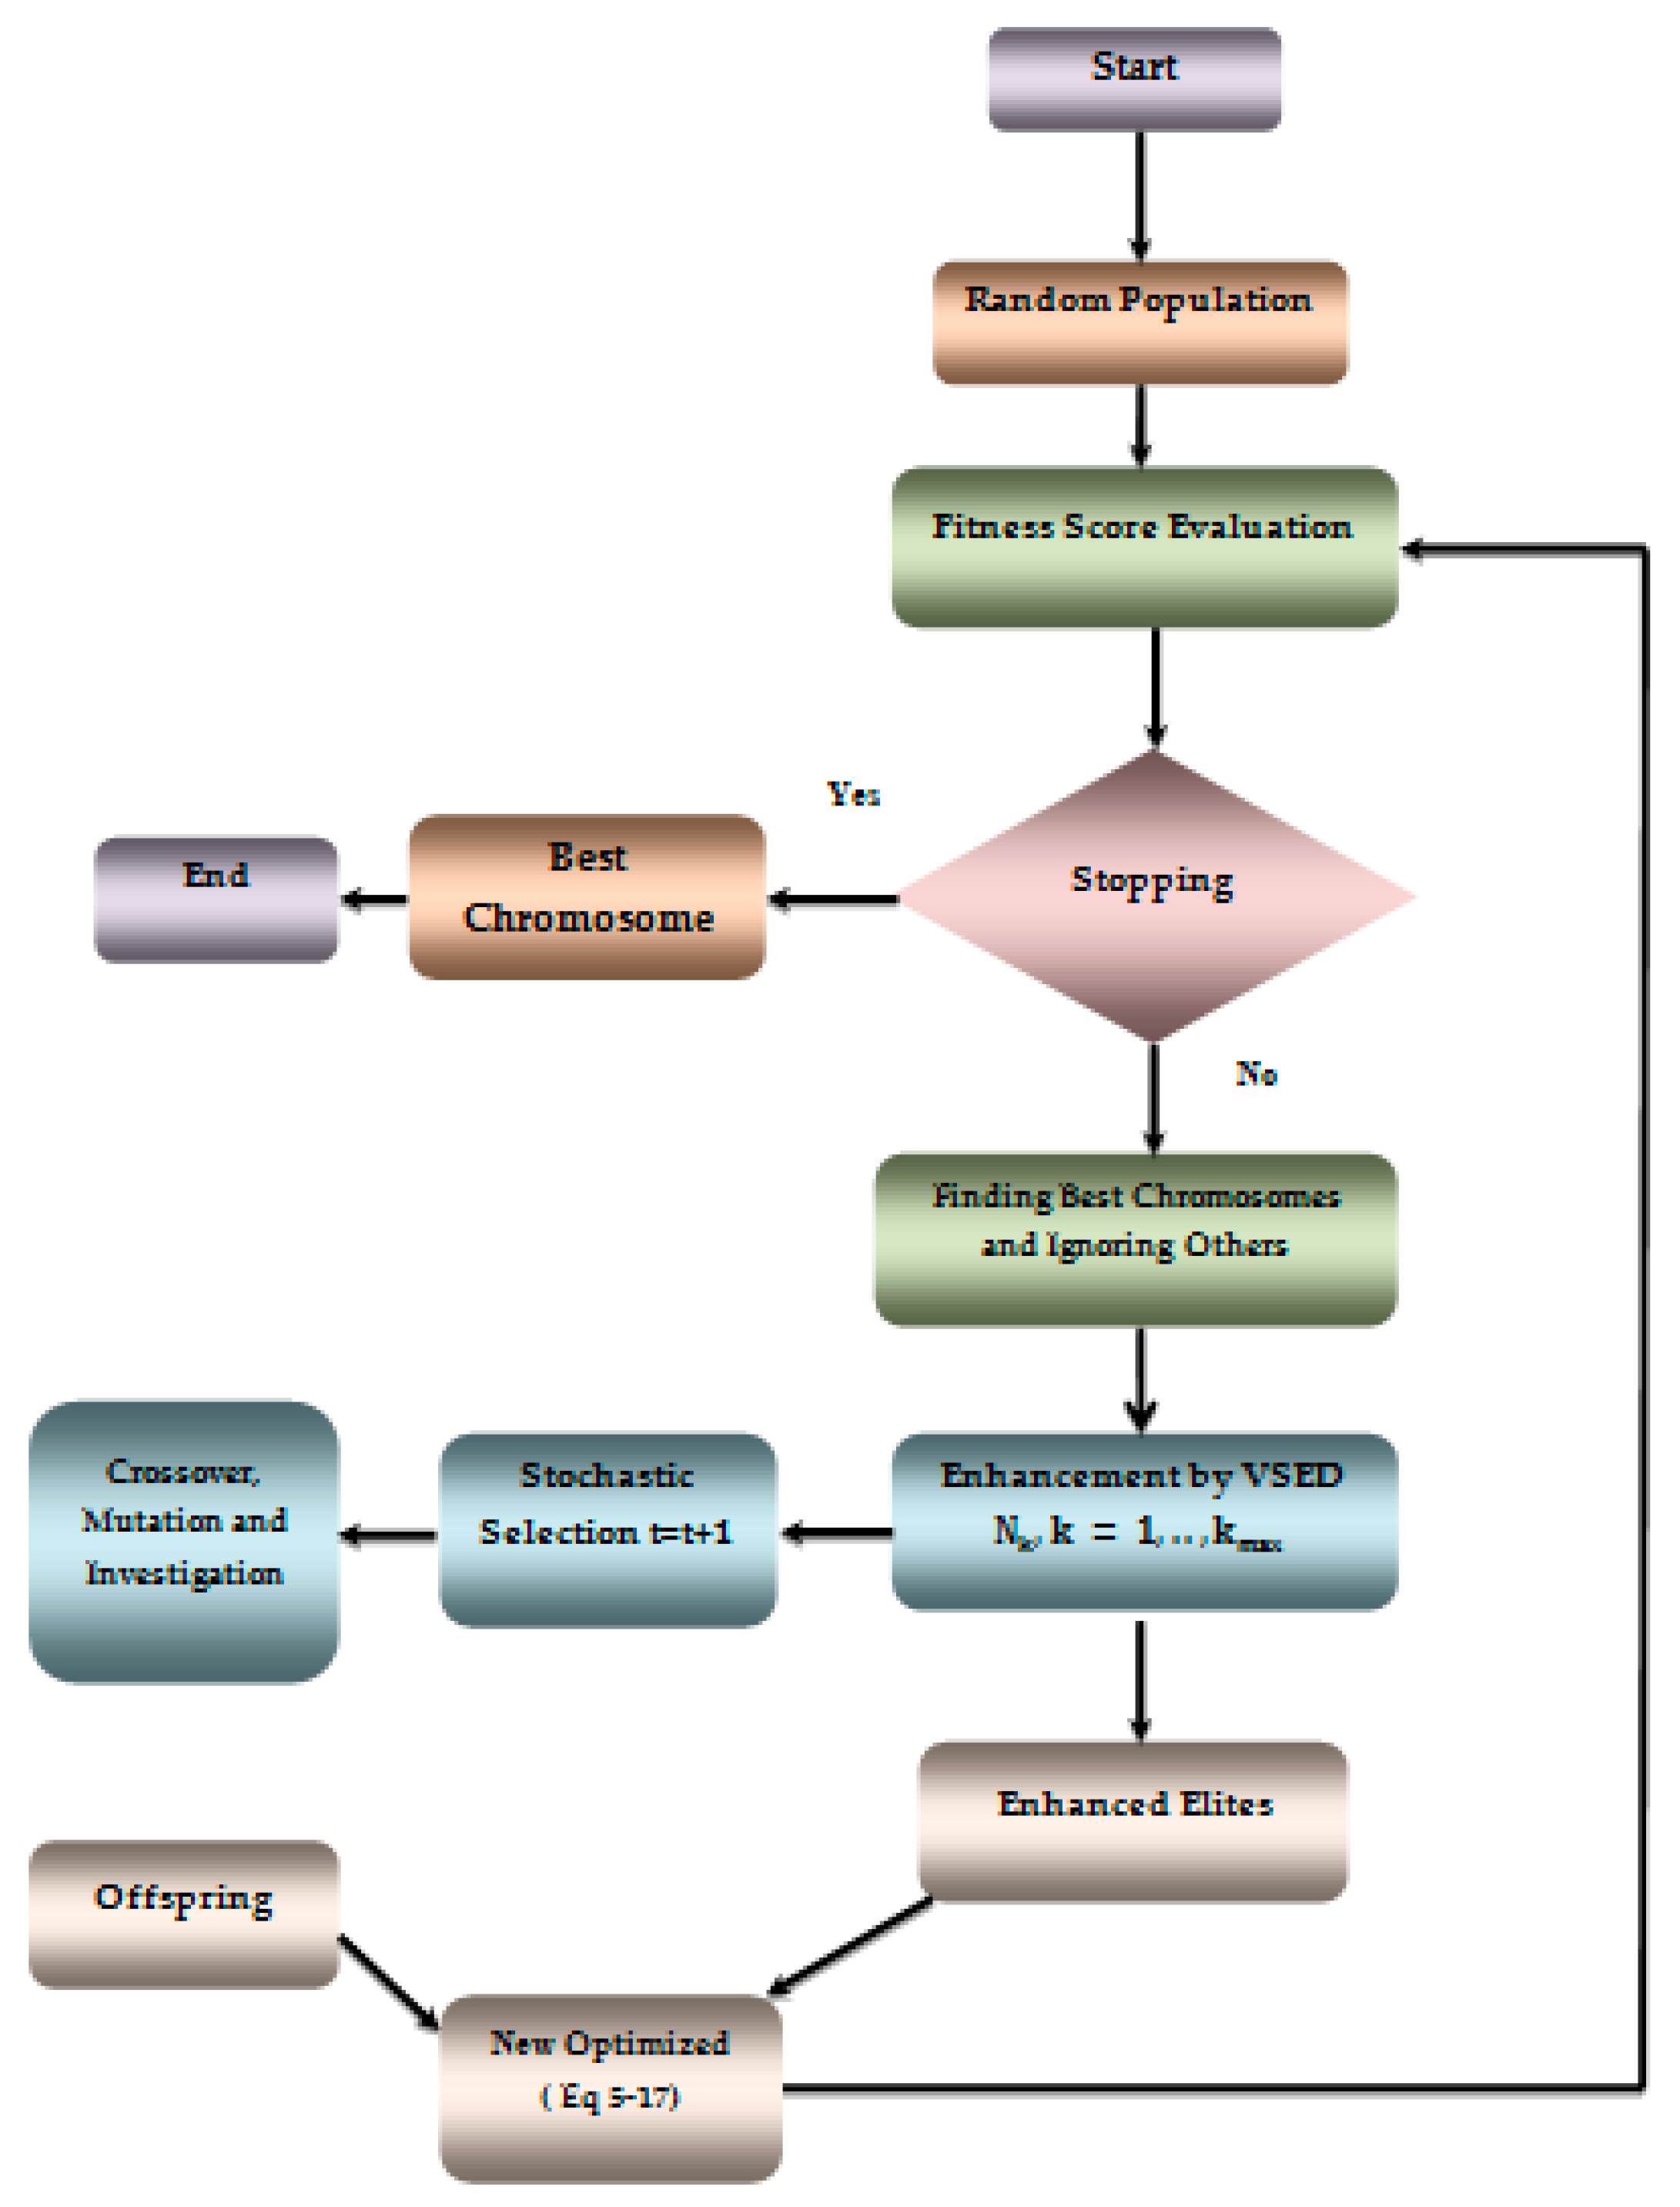
3.4. Hybrid Genetic Algorithm
4. Numerical Simulation Test and Investigation Results
4.1. Coding Solutions
4.2. Weighted Factors Calibration
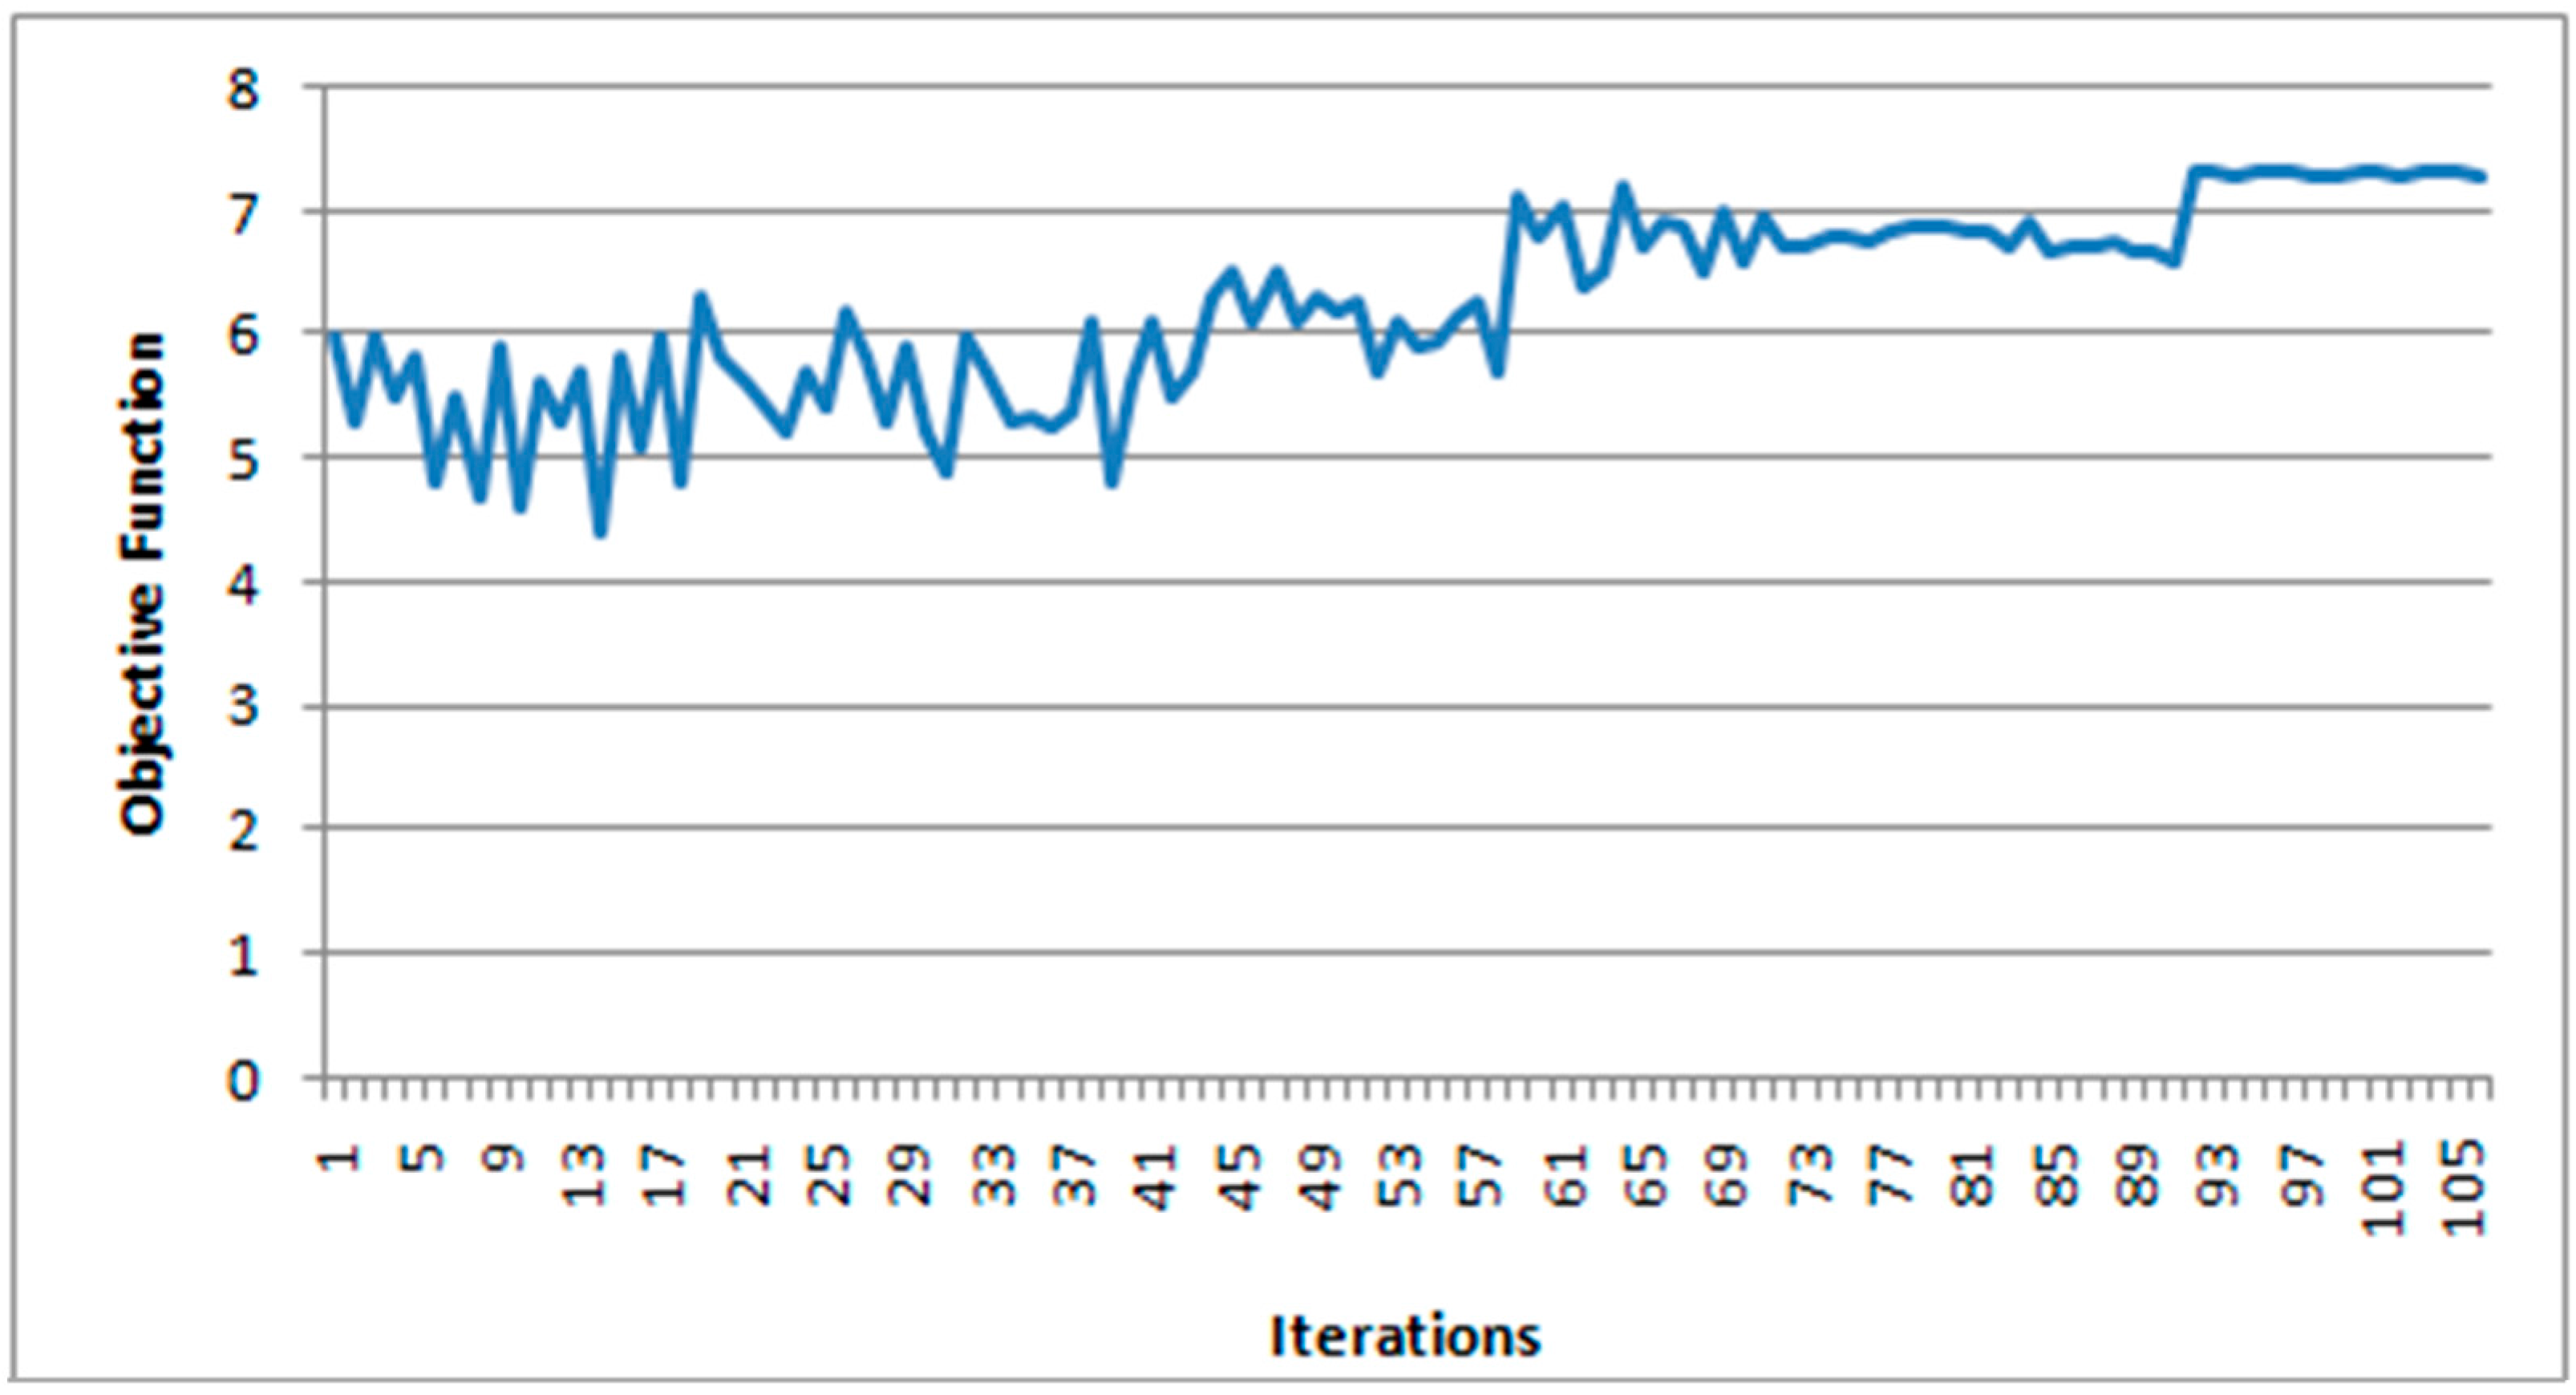
4.3. Results Using Simulated Annealing
4.4. Results Using Variable Search Environment Descending
4.5. Results Using the Genetic Algorithm
4.6. Results Using the Hybrid Genetic Algorithm
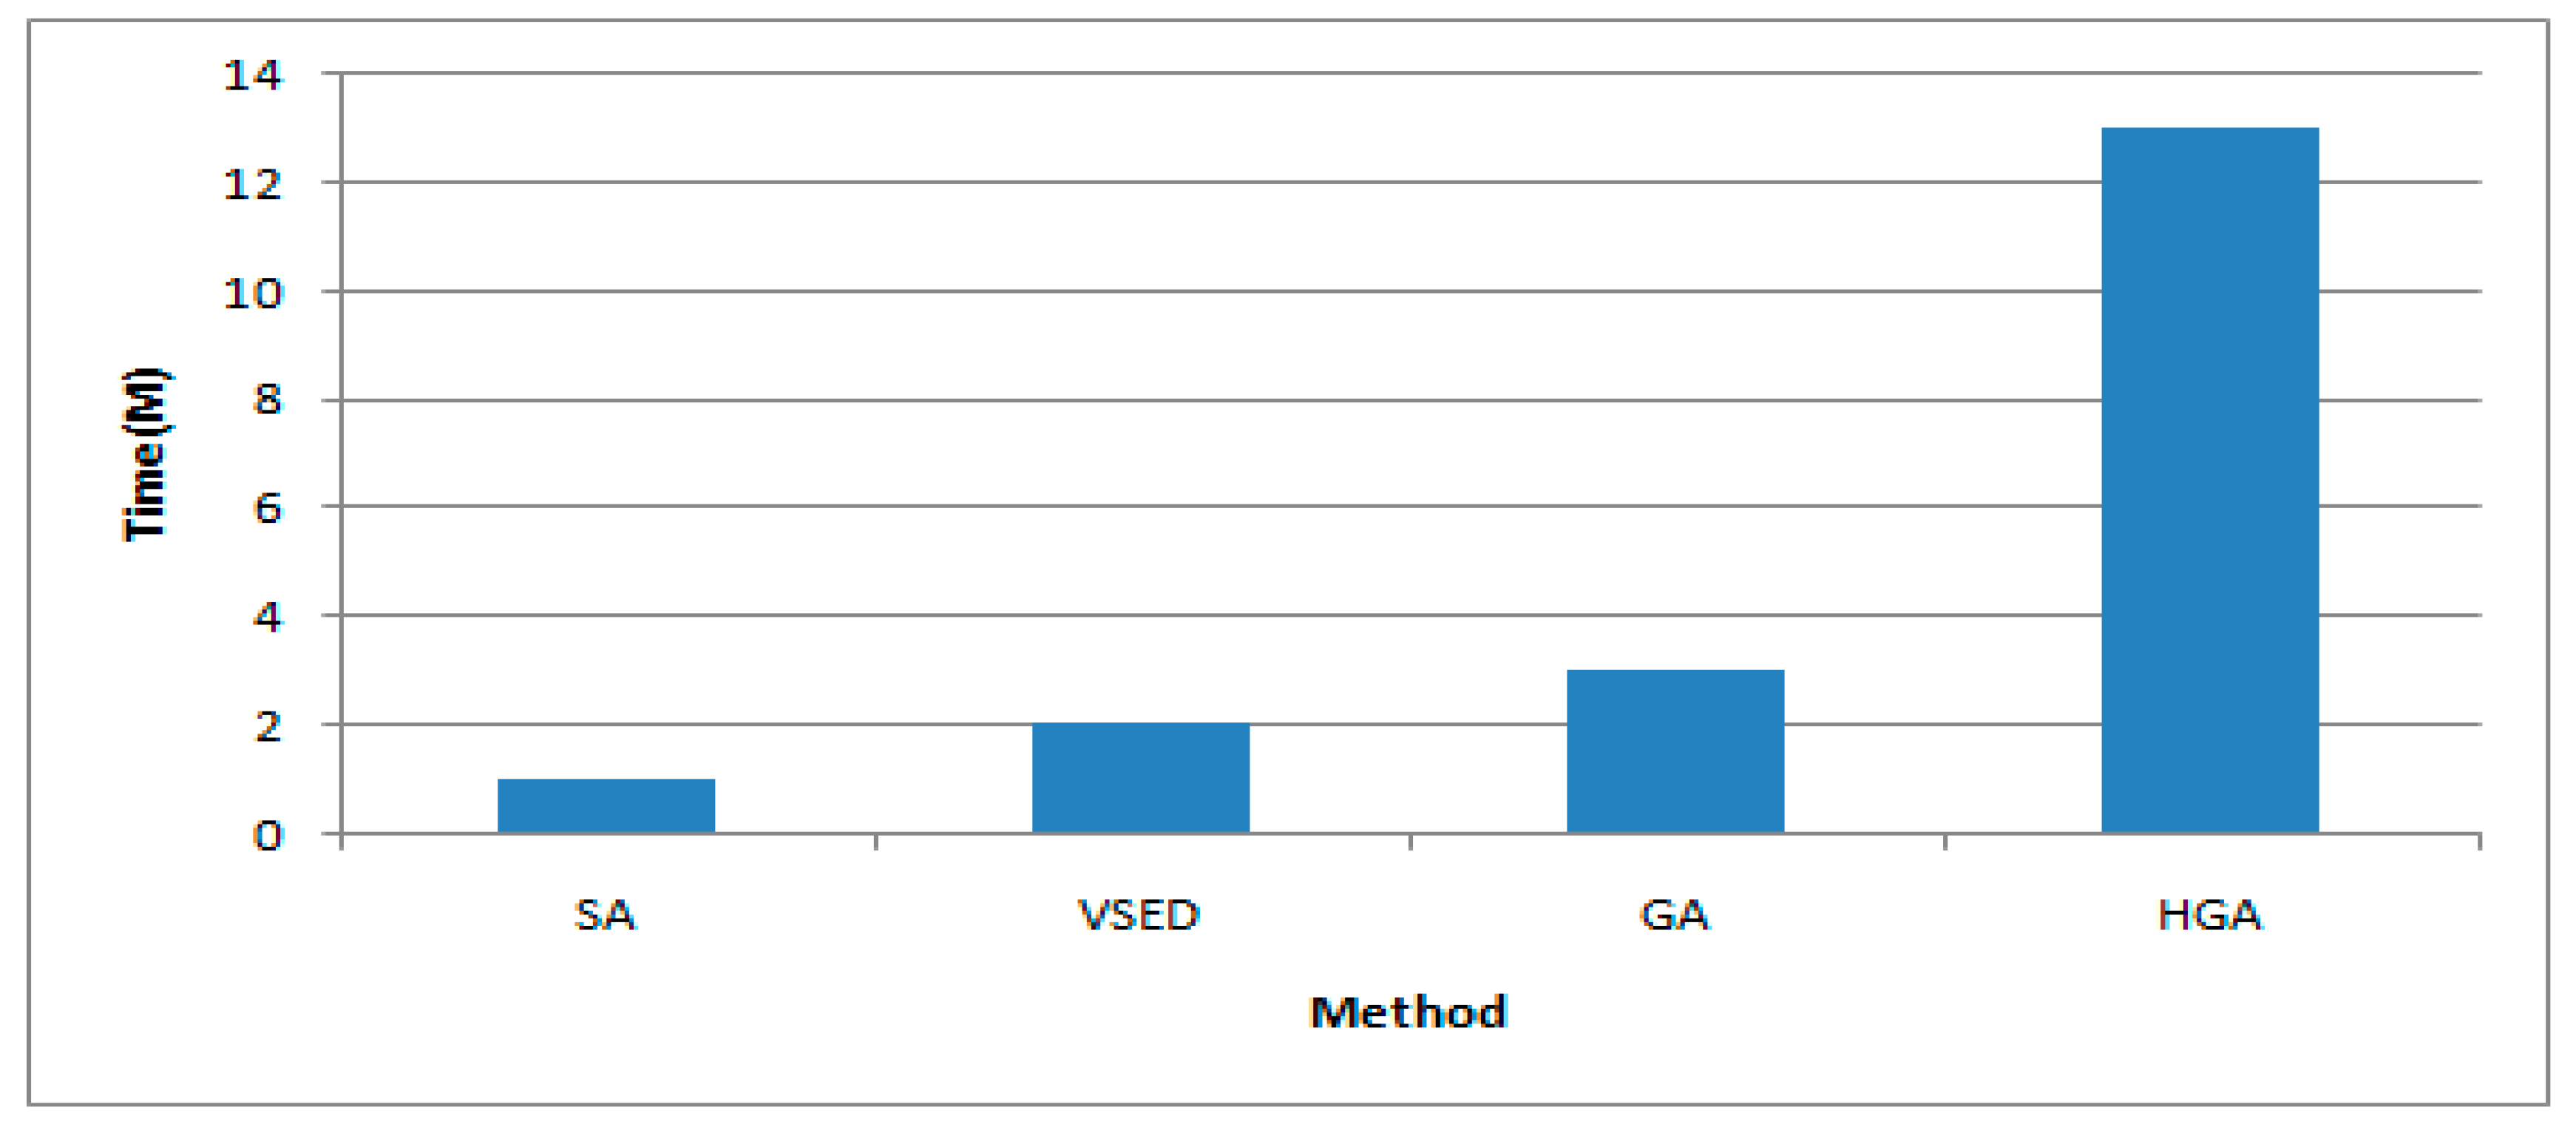
5. Comparative Performance Index of Algorithms
6. Conclusions
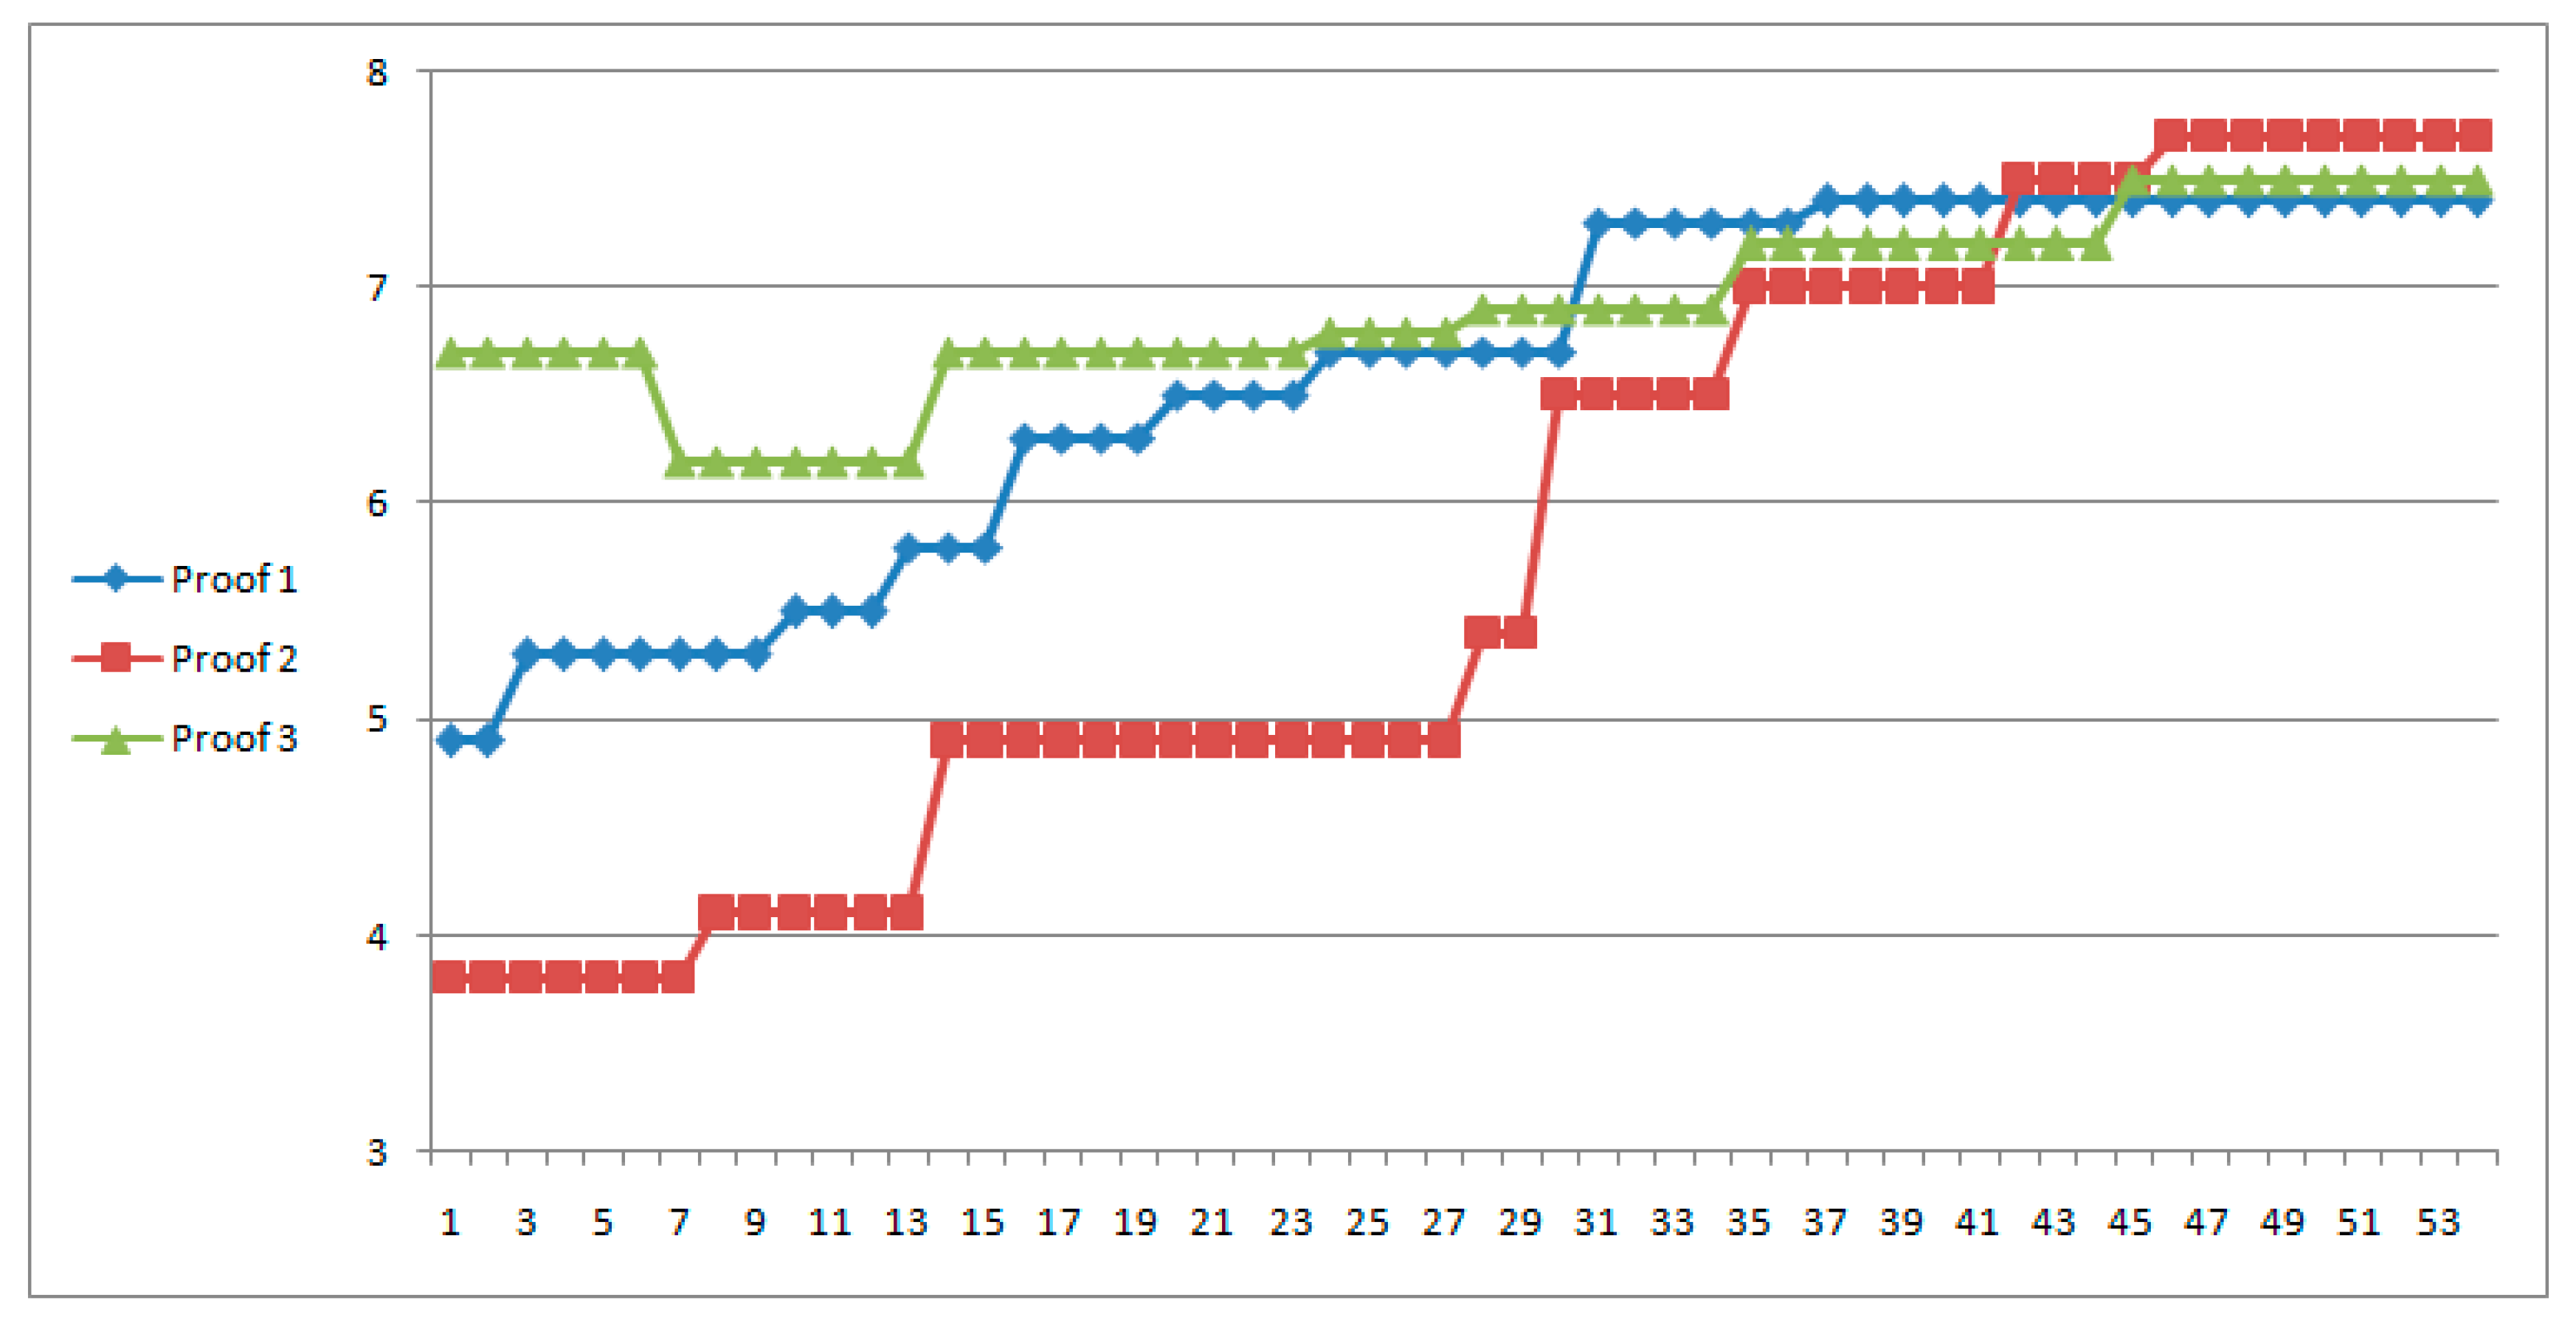
- (1)
- For the optimized solution 134.7321 kW is the power generated and target achieved by the proposed hybrid genetic algorithm.
- (2)
- Losses for setting opening closer to the optimal solution, which is 134.9930 kW on fluctuation.
- (3)
- The value of a configuration that is not near the optimum and possibly a local optimum, 137.5293 kW. The ordinate represents the number of times it is achieved that value losses in five runs and the abscissa represent the fraction of crossbreeding.
Acknowledgments
Author Contributions
Conflicts of Interest
References
- De Jonghe, C.; Hobbs, B.F.; Belmans, R. Optimal generation mix with short-term demand response and wind penetration. IEEE Trans. Power Syst. 2011, 27, 830–839. [Google Scholar] [CrossRef]
- Hung, D.Q.; Mithualananthan, N.; Bansal, R.C. Analytical expressions for DG allocation in primarydistribution networks. IEEE Trans. Power Syst. 2010, 25, 814–820. [Google Scholar]
- Hung, D.Q.; Mithualananthan, N. Multiple distributed generation placement in primary distribution networks for loss reduction. IEEE Trans. Power Syst. 2013, 60, 1700–1707. [Google Scholar]
- Shahbaz, H.; Rashid, A.; Jafarullah, M.; Atif, I.; Sanjeevikumar, P. Optimization of Hybrid Renewable Energy System Using Iterative Filter Selection Approach. IET Renew. Power Gener. 2017. [Google Scholar] [CrossRef]
- Georgilakis, P.S.; Hatziargyriou, N.D. Optimal distributed generation placement in power distribution networks: Models, methods and future research. IEEE Trans. Power Syst. 2014, 28, 3420–3428. [Google Scholar] [CrossRef]
- Abhishek, A.; Karthikeyan, V.; Sanjeevikumar, P.; Rajasekar, S.; Frede, B.; Asheesh, K.S. Optimal Planning of Electric Vehicle Charging Station at the Distribution System Using Hybrid Optimization Algorithm. Energy 2017, 133, 70–78. [Google Scholar]
- Ananthy, C.; Perianayagam, A.D.V.R.; Sanjeevikumar, P.; Rajasekar, S.; Ahmet, H.E. A Bio inspired Novel Optimization Technique For Reactive Power Flow. Eng. Sci. Technol. 2016, 19, 1682–1692. [Google Scholar]
- Aly, A.I.; Hegazy, Y.G.; Alsharkwy, M.A. A Simulated Annealing Algorithm for Multi-Objective Distribured Generation Planning. In Proceedings of the 2010 IEEE Power and Energy Society General Meeting, Detroit, MI, USA, 24–29 July 2010. [Google Scholar]
- Tan, W.S.; Hassan, M.Y.; Majid, M.S.; Rahman, H.A. Allocation and Sizing of DG Using Cuckoo Search Algorithm. In Proceedings of the IEEE International Conference on Power and Energy, Kota Kinabalu, Malaysia, 2–5 December 2012. [Google Scholar]
- Gandomkar, M.; Vakilian, M.; Ehsan, M. A Combination of Genetic Algorithm and Simulated Annealing for Optimal DG Allocation in Distribution Networks. In Proceedings of the Canadian Conference on Electrical and Computer Engineering, Saskatoon, SK, Canada, 1–4 May 2005; pp. 645–648. [Google Scholar]
- Jeon, Y.J.; Kim, J.C. Application of simulated annealing and tabu search for loss minimization in distribution systems. Electr. Power Energy Syst. 2004, 26, 9–18. [Google Scholar] [CrossRef]
- SMekhamer, F.; Abdelaziz, A.Y.; Mohammed, F.M.; Badr, M.A.L. A new intelligent optimization technique for distribution systems reconfiguration. In Proceedings of the 12th International Middle-East Power Systems Conference, Aswan, Egypt, 12–15 March 2008; pp. 397–401. [Google Scholar]
- Tan, W.S.; Hassan, M.Y.; Rahman, H.A.; Abdullah, M.P. Multi-distributed generation planning using hybrid particle swarm optimization-gravitational search algorithm. IET Gener. Transm. Distrib. 2014, 7, 929–942. [Google Scholar] [CrossRef]
- Chiradeja, P.; Ramakumar, R. An approach to quantify the technical benefits of distributed generation. IEEE Trans. Energy Convers. 2004, 19, 764–773. [Google Scholar] [CrossRef]
- Ahmed, A.; Ilyes, B.; Bhekisipho, T.; Tshilidzi, M. Hybrid Optimization Algorithm to the Problem of Distributed Generation Power Losses. In Proceedings of theIEEE International Conference on Systems, Man and Cybernetics, Budapest, Hungary, 9–12 October 2016. [Google Scholar]
- Kirkpatrick, S.; Gellat, C.D.; Vecci, M.P. Optimization by simulated annealing. J. Stat. Phys. 1983, 34, 975–986. [Google Scholar] [CrossRef]
- Abdelaziz, A.Y.; Mohamed, F.M.; Mekhamer, S.F.; Badr, M.A.L. Distribution system reconfiguration using a modified Tabu Search algorithm. Electr. Power Syst. Res. 2010, 80, 943–953. [Google Scholar] [CrossRef]
- Rashedi, R.; Hegazy, T. Capital renewal optimisation for large-scale infrastructure networks: Genetic algorithms versus advanced mathematical tools. Struct. Inf. Eng. 2015, 11, 253–262. [Google Scholar] [CrossRef]
- Ahmed Ali, A.; Hasan, A.N.; Marwala, T. Perturb and Observe based on Fuzzy Logic Controller Maximum Power Point tracking (MPPT). In Proceedings of the 2014 IEEE International Conference on Renewable Energy Research, Milwaukee, WI, USA, 19–22 October 2014. [Google Scholar]
- Soroudi, A.; Ehsan, M.; Caire, R.; Hadjsaid, N. Hybrid immune-genetic algorithm method for benefit maximization of distribution network operatros and distributed generation owners in a deregulated environment. IEEE Power Energy 2011, 5, 961–972. [Google Scholar]
- Cao, H.; Jia, L.; Si, G.; Zhang, Y. A Variable Selection Method for Pulverizing Capability Prediction of Tumbling Mill Based on Improved Hybrid Genetic Algorithm. Inf. Technol. Control 2011, 40, 3. [Google Scholar]
- Purushothama, G.K.; Jenkins, L. Simulated annealing with local search-a hybrid algorithm for unit commitment. IEEE Trans. Power Syst. 2003, 18, 273–278. [Google Scholar] [CrossRef]
- Lee, Y.C.; Lan, C.; Chu, C.Y.; Lai, C.M.; Chen, Y.J. A Pan-Tilt orienting mechanism with parallel axes of flexural actuation. Trans. Mechatron. 2013, 18, 1100–1112. [Google Scholar] [CrossRef]
- Nedić, N.; Vukmirović, S.; Imre, L.; Čapko, D. A Genetic Algorithm Approach for Utility management System Workflow Scheduling. Inf. Technol. Control 2010, 39, 4. [Google Scholar]
- Zimmerman, R.D.; Murillo-Sanchez, C.E.; Thomas, R.J. Matpower: A steady-state operations planning and analysis tools for power systems research and education. IEEE Trans. Power Syst. 2011, 26, 12–19. [Google Scholar] [CrossRef]


| Code | Size (MW) | Code | Size (MW) |
|---|---|---|---|
| 1000 | 0.25 | 1100 | 1.25 |
| 1001 | 0.50 | 1101 | 1.50 |
| 1010 | 0.75 | 1110 | 1.75 |
| 1011 | 1.00 | 1111 | 2.00 |
| Bus 1 | Bus 2 | Bus 3 | Bus 4 | … | Bus nb-1 | Bus nb |
|---|---|---|---|---|---|---|
| 0100 | 0011 | 1011 | 0111 | … | 0011 | 1111 |
| Simulation Trial | IRPL | IMPT | IRPL/IMPT |
|---|---|---|---|
| 1 | 41,884 | 1513 | 27,682 |
| 2 | 50,127 | 2806 | 17,864 |
| 3 | 43,297 | 2124 | 20,385 |
| 4 | 57,487 | 2478 | 23,199 |
| 5 | 34,329 | 1878 | 18,280 |
| 6 | 30,287 | 1079 | 26,070 |
| 7 | 44,238 | 2567 | 17,233 |
| 8 | 30,234 | 1969 | 15,355 |
| Bar | Size (MW) | W1 IRPL | W2 IMPL | FO |
|---|---|---|---|---|
| 8 | 1.5 | 29,578 | 43,747 | 73,325 |
| 17 | 1.75 | |||
| 22 | 2 | |||
| 29 | 1.5 |
| Bar | Size (MW) | W1 IRPL | W2 IMPL | FO |
|---|---|---|---|---|
| 5 | 2.0 | 39,274 | 38,313 | 77,857 |
| 10 | 2.0 | |||
| 21 | 1.5 | |||
| 31 | 1.5 |
| Bar | Size (MW) | W1 IRPL | W2 IMPL | FO |
|---|---|---|---|---|
| 10 | 2.5 | 38,887 | 37,836 | 76,723 |
| 15 | 1.5 | |||
| 26 | 1.5 | |||
| 29 | 1.25 |
| Bar | Size (MW) | W1 IRPL | W2 IMPL | FO |
|---|---|---|---|---|
| 12 | 1.7 | 40,573 | 39,201 | 79,774 |
| 13 | 2.0 | |||
| 22 | 1.0 | |||
| 30 | 1.25 |
| Optimization Algorithm Type | Iterations Unit | Time in Minutes |
|---|---|---|
| SA | 190 | 1.2 |
| VSED | 22 | 2.1 |
| GA | 90 | 2.9 |
| HGA | 6 | 12.6 |
© 2017 by the authors. Licensee MDPI, Basel, Switzerland. This article is an open access article distributed under the terms and conditions of the Creative Commons Attribution (CC BY) license (http://creativecommons.org/licenses/by/4.0/).
Share and Cite
Ali, A.; Padmanaban, S.; Twala, B.; Marwala, T. Electric Power Grids Distribution Generation System for Optimal Location and Sizing—A Case Study Investigation by Various Optimization Algorithms. Energies 2017, 10, 960. https://doi.org/10.3390/en10070960
Ali A, Padmanaban S, Twala B, Marwala T. Electric Power Grids Distribution Generation System for Optimal Location and Sizing—A Case Study Investigation by Various Optimization Algorithms. Energies. 2017; 10(7):960. https://doi.org/10.3390/en10070960
Chicago/Turabian StyleAli, Ahmed, Sanjeevikumar Padmanaban, Bhekisipho Twala, and Tshilidzi Marwala. 2017. "Electric Power Grids Distribution Generation System for Optimal Location and Sizing—A Case Study Investigation by Various Optimization Algorithms" Energies 10, no. 7: 960. https://doi.org/10.3390/en10070960
APA StyleAli, A., Padmanaban, S., Twala, B., & Marwala, T. (2017). Electric Power Grids Distribution Generation System for Optimal Location and Sizing—A Case Study Investigation by Various Optimization Algorithms. Energies, 10(7), 960. https://doi.org/10.3390/en10070960