Spatial Variation in Sediment Organic Carbon Distribution across the Alaskan Beaufort Sea Shelf
by
Richard B. Coffin
1,4,*, 
Joseph P. Smith
2,
Brandon Yoza
3,
Thomas J. Boyd
4 and
Michael T. Montgomery
4 1
Department of Physical and Environmental Sciences, Texas A&M University-Corpus Christi, Corpus Christi, TX 78412, USA
2
Department of Oceanography, US Naval Academy, Annapolis, MD 21402, USA
3
Hawaii Natural Energy Institute, University of Hawaii, Honolulu, HI 96822, USA
4
Marine Biogeochemistry, Naval Research Laboratory, Washington, DC 20375, USA
*
Author to whom correspondence should be addressed.
Energies 2017, 10(9), 1265; https://doi.org/10.3390/en10091265
Submission received: 17 June 2017
/
Revised: 22 August 2017
/
Accepted: 23 August 2017
/
Published: 25 August 2017
Abstract
:In September 2009, a series of sediment cores were collected across the Alaskan Beaufort Sea shelf-slope. Sediment and porewater organic carbon (OC) concentrations and stable carbon isotope ratios (δ13C) were measured to investigate spatial variations in sediment organic matter (OM) sources and distribution of these materials across the shelf. Cores were collected along three main nearshore (shelf) to offshore (slope) sampling lines (transects) from east-to-west along the North Slope of Alaska: Hammerhead (near Camden Bay), Thetis Island (near Prudhoe Bay), and Cape Halkett (towards Point Barrow). Measured sediment organic carbon (TOC) and porewater dissolved organic carbon (DOC) concentrations and their respective δ13C values were used to investigate the relative contribution of different OM sources to sediment OC pool cycled at each location. Sources of OM considered included: water column-sourced phytodetritus, deep sediment methane (CH4), and terrestrial, tundra/river-sourced OM. Results of these measurements, when coupled with results from previous research and additional analyses of sediment and porewater composition, show a pattern of spatial variation in sediment OC concentrations, OM source contributions, and OM cycled along the Alaskan Beaufort Sea shelf. In general, measured sediment total organic carbon (TOC) concentrations, δ13CTOC values, porewater DOC concentrations, and δ13CDOC values are consistent with an east-to-west transport of modern Holocene sediments with higher OC concentrations primarily sourced from relatively labile terrestrial, tundra OM sources and phytodetritus along the Alaskan Beaufort shelf. Sediment transport along the shelf results in the medium-to-long term accumulation and burial of sediment OM focused to the west which in turn results in higher biogenic CH4 production rates and higher upward CH4 diffusion through the sediments resulting in CH4−AMO-sourced contribution to sediment OC westward along the shelf. Understanding current OM sources and distributions along the Alaskan Beaufort shelf is important for enhancing models of carbon cycling in Arctic coastal shelf systems. This will help support the prediction of the climate response of the Arctic created in the face of future warming scenarios.
1. Introduction
Organic carbon (OC) in coastal shelf sediments is primarily derived from allochtonous and autochtonous organic matter (OM) from phytodetritus [1,2] and terrigenous sources transported primarily by rivers and surface runoff [3,4,5]. Organic matter deposition, accumulation, and burial in sediments is a significant portion of the carbon cycle in coastal shelf systems. The biogeochemical cycling of OM during early diagenesis drives benthic processes and ecology and can be a significant factor in determining the geotechnical and geophysical properties of coastal sediments. The subsequent burial of OM that accumulates in coastal sediments over longer time periods and its alteration during diagenesis and catagenesis forms the pre-cursors for hydrocarbon resources such as oil and natural gas. The accumulation and cycling of OM in coastal shelf environments is controlled by numerous factors such as OM supply, physical forcing and material transport, sediment reworking, microbial processes, and the local geological setting and physiochemical conditions. An important factor that determines the cycling and fate of sedimentary OC and its eventual fate is the relative lability of OM deposited that can be linked to the source from which OM was derived. Therefore, in order to better understand accumulation and cycling of OC in coastal shelf sediments, it is necessary to quantify the relative contribution of OM with different lability from multiple sources.
In the sediments of some coastal shelf systems, multiple sources of OM must be considered. Terrigenous inputs are often the dominant source for sedimentary OC in coastal systems. Terrestrial inputs of OM are primarily from rivers and surface runoff, but in some systems, inputs from groundwater can be significant [6,7]. There can also be additional inputs of OC to certain shelf environments from the upward migration of deep sediment petroleum and methane (CH4) to shallow, surface sediments [8,9,10,11,12,13]. There is a general assumption that phytodetritus is a strong OC contribution to coastal sediment [3]. The relative contributions of OC from phytodetritus, terrestrial sources, and deep sediment hydrocarbon sources to sediment total organic carbon (TOC) on the continental shelf varies significantly between different coastal systems around the world. However, more recent sediment studies do show a short sediment residence time for phytodetritus in the coastal sediment [14,15]. Climate change has a potential to alter the relative input of OM from different sources to these sediment carbon pools in coastal ecosystem in the future. A thorough understanding of the coastal sediment carbon budget today will aid in climate response predictions for the future.
Large deposits of gas hydrates exist around the world coastal regions, therefore CH4 contribution to the coastal sediment carbon budget is one key factor that could be sensitive to future changes in climate [16]. For example, in the Gulf of Mexico nearshore the Mississippi River outflow there is a strong terrestrial contribution to surface sediment carbon that shifts to a phytodetritus-dominated contribution over a short distance moving offshore [3,4]. Further offshore, however, on the Texas-Louisiana Shelf, there is significant contribution of CH4 and petroleum to shallow sediment carbon cycling [9,10,11,12,13,17]. A very different coastal system is the Nankai Trough, off the coast of Tokyo Japan, where deep sediment CH4 hydrate loading contributes significantly to the shallow sediment carbon cycling [18]. The degree to which climate change may affect the sediment carbon budgets in these different coastal systems is not wholly understood.
Since the peak of the Holocene, the relative contribution of different OM sources to the TOC pool in specific coastal systems has been largely in a (quasi-) steady-state balance. This is mostly because the physical processes that control river transport and bottom water temperatures in most coastal shelf regions have been relatively stable [19]. In some systems, however, there may be a departure from this balance due to natural and/or anthropogenic influences. For example, regional climate change in the Arctic has led to significant changes of OM cycling in shelf sediments and changes in the inputs of tundra-derived, permafrost-derived, and shallow hydrate-derived carbon [20,21,22].
Previous studies in the Arctic show a complicated coastal sediment carbon cycle resulting from spatial variation in OM sources [23]. Stable carbon isotope analysis (the ratio of 13/12C) of TOC (δ13CTOC) can be used to help trace carbon cycling and quantify carbon contributions from different sources. Organic carbon derived from marine phytodetritus typically has a range of δ13CTOC values from –30 to −17‰ [24]. Terrestrial (tundra-) derived OC typically overlaps that range with δ13CTOC values from −29 to −26‰ [25]. There have been observations of a 7% increase in OM discharge from Eurasian rivers to the Arctic shelf over recent decades [26]. Assuming sediment OC on Arctic shelf systems is a mix of OC from multiple sources, such an increase in terrestrial OM supply should result in a shift in the total amount of OC and likely the δ13CTOC values where this additional material is deposited.
Data from δ13CTOC and stable nitrogen isotope analysis (δ15N) of total sediment nitrogen (TSN) suggest that the OM pool in Beaufort Sea coastal sediment is primarily a mix of three end-members; labile water column plankton (photodetritus), refractory marine OM, and refractory terrigenous material [27]. However, globally measured remineralization rates of phytoplankton-derived OM are as high as 95% in shallow coastal sediments. This suggests that phytodetritus is a relatively minor contribution to medium-to-long term OM accumulation in these same environments [15,28]. Organic matter from terrestrial sources (rivers, surface run-off, groundwater) often dominates the TOC pool in shallow coastal systems such as those along the Arctic shelf. Many studies in the Arctic, however, do not account for a CH4 contribution to shallow sediment carbon cycling. A significant contribution of upward CH4 flux to the sediment OC pool has been observed in this region and other sites around the world [17,22,29,30,31]. One example is at Atwater Valley in the Gulf of Mexico, where the contribution to TOC pool from CH4 cycling was estimated at 85%, and δ13CTOC and Δ14CTOC were substantially depleted at −28.2‰ and −951‰, respectively [17]; i.e., compared to other locations where sediment dominated by phytodetritus was observed to be enriched, up to −19.7‰ [3]. Understanding the relative contribution of potential OM sources (primarily terrestrial, tundra-sourced OC and OC derived from upward CH4 flux) to Arctic shelf sediments will assist in developing interpretive and predictive Arctic coastal ocean carbon cycle models.
In this study, a series of sediment cores were collected in September 2009 across the Beaufort Sea shelf-slope along the North Slope of Alaska, USA. Sediment TOC concentrations and δ13CTOC values were measured to investigate spatial variations in OM cycling and sources assuming between different OM end-members [32,33]. Porewater dissolved organic carbon (DOC) concentrations and stable carbon isotope ratios (δ13CDOC), porewater Cl− concentrations, total sediment nitrogen (TSN) and stable nitrogen isotope ratios (δ15NTSN), sediment porosity (φ), and sediment inorganic carbon (TIC) and stable carbon isotope ratios (δ13CTIC) values were also measured to provide additional evidence to determine the spatial variability in the accumulation of OC from different sources in Alaskan Beaufort Sea shelf-slope sediments. Previous studies in this region [22] and research by others [34] suggest significant sediment gas hydrate loading and some upward migration of CH4 to the shallow surface sediments. This study therefore focuses primarily on comparing the relative contribution of phytodetritus, terrestrial, tundra-sourced OC (as a combination of river flow, surface runoff, and groundwater discharge) and OC linked to CH4 cycling to the medium-to-long term sediment TOC and porewater DOC pools. For this Arctic coastal shelf system it is expected that terrestrial, tundra-sourced OC will be 13C-enriched relative to 13C-depleted CH4–sourced OC [1,35]. Results of this study will be used to better constrain and explain the current spatial variability in the relative contribution of different OC sources across the Alaskan Beaufort Sea shelf-slope.
2. Methods
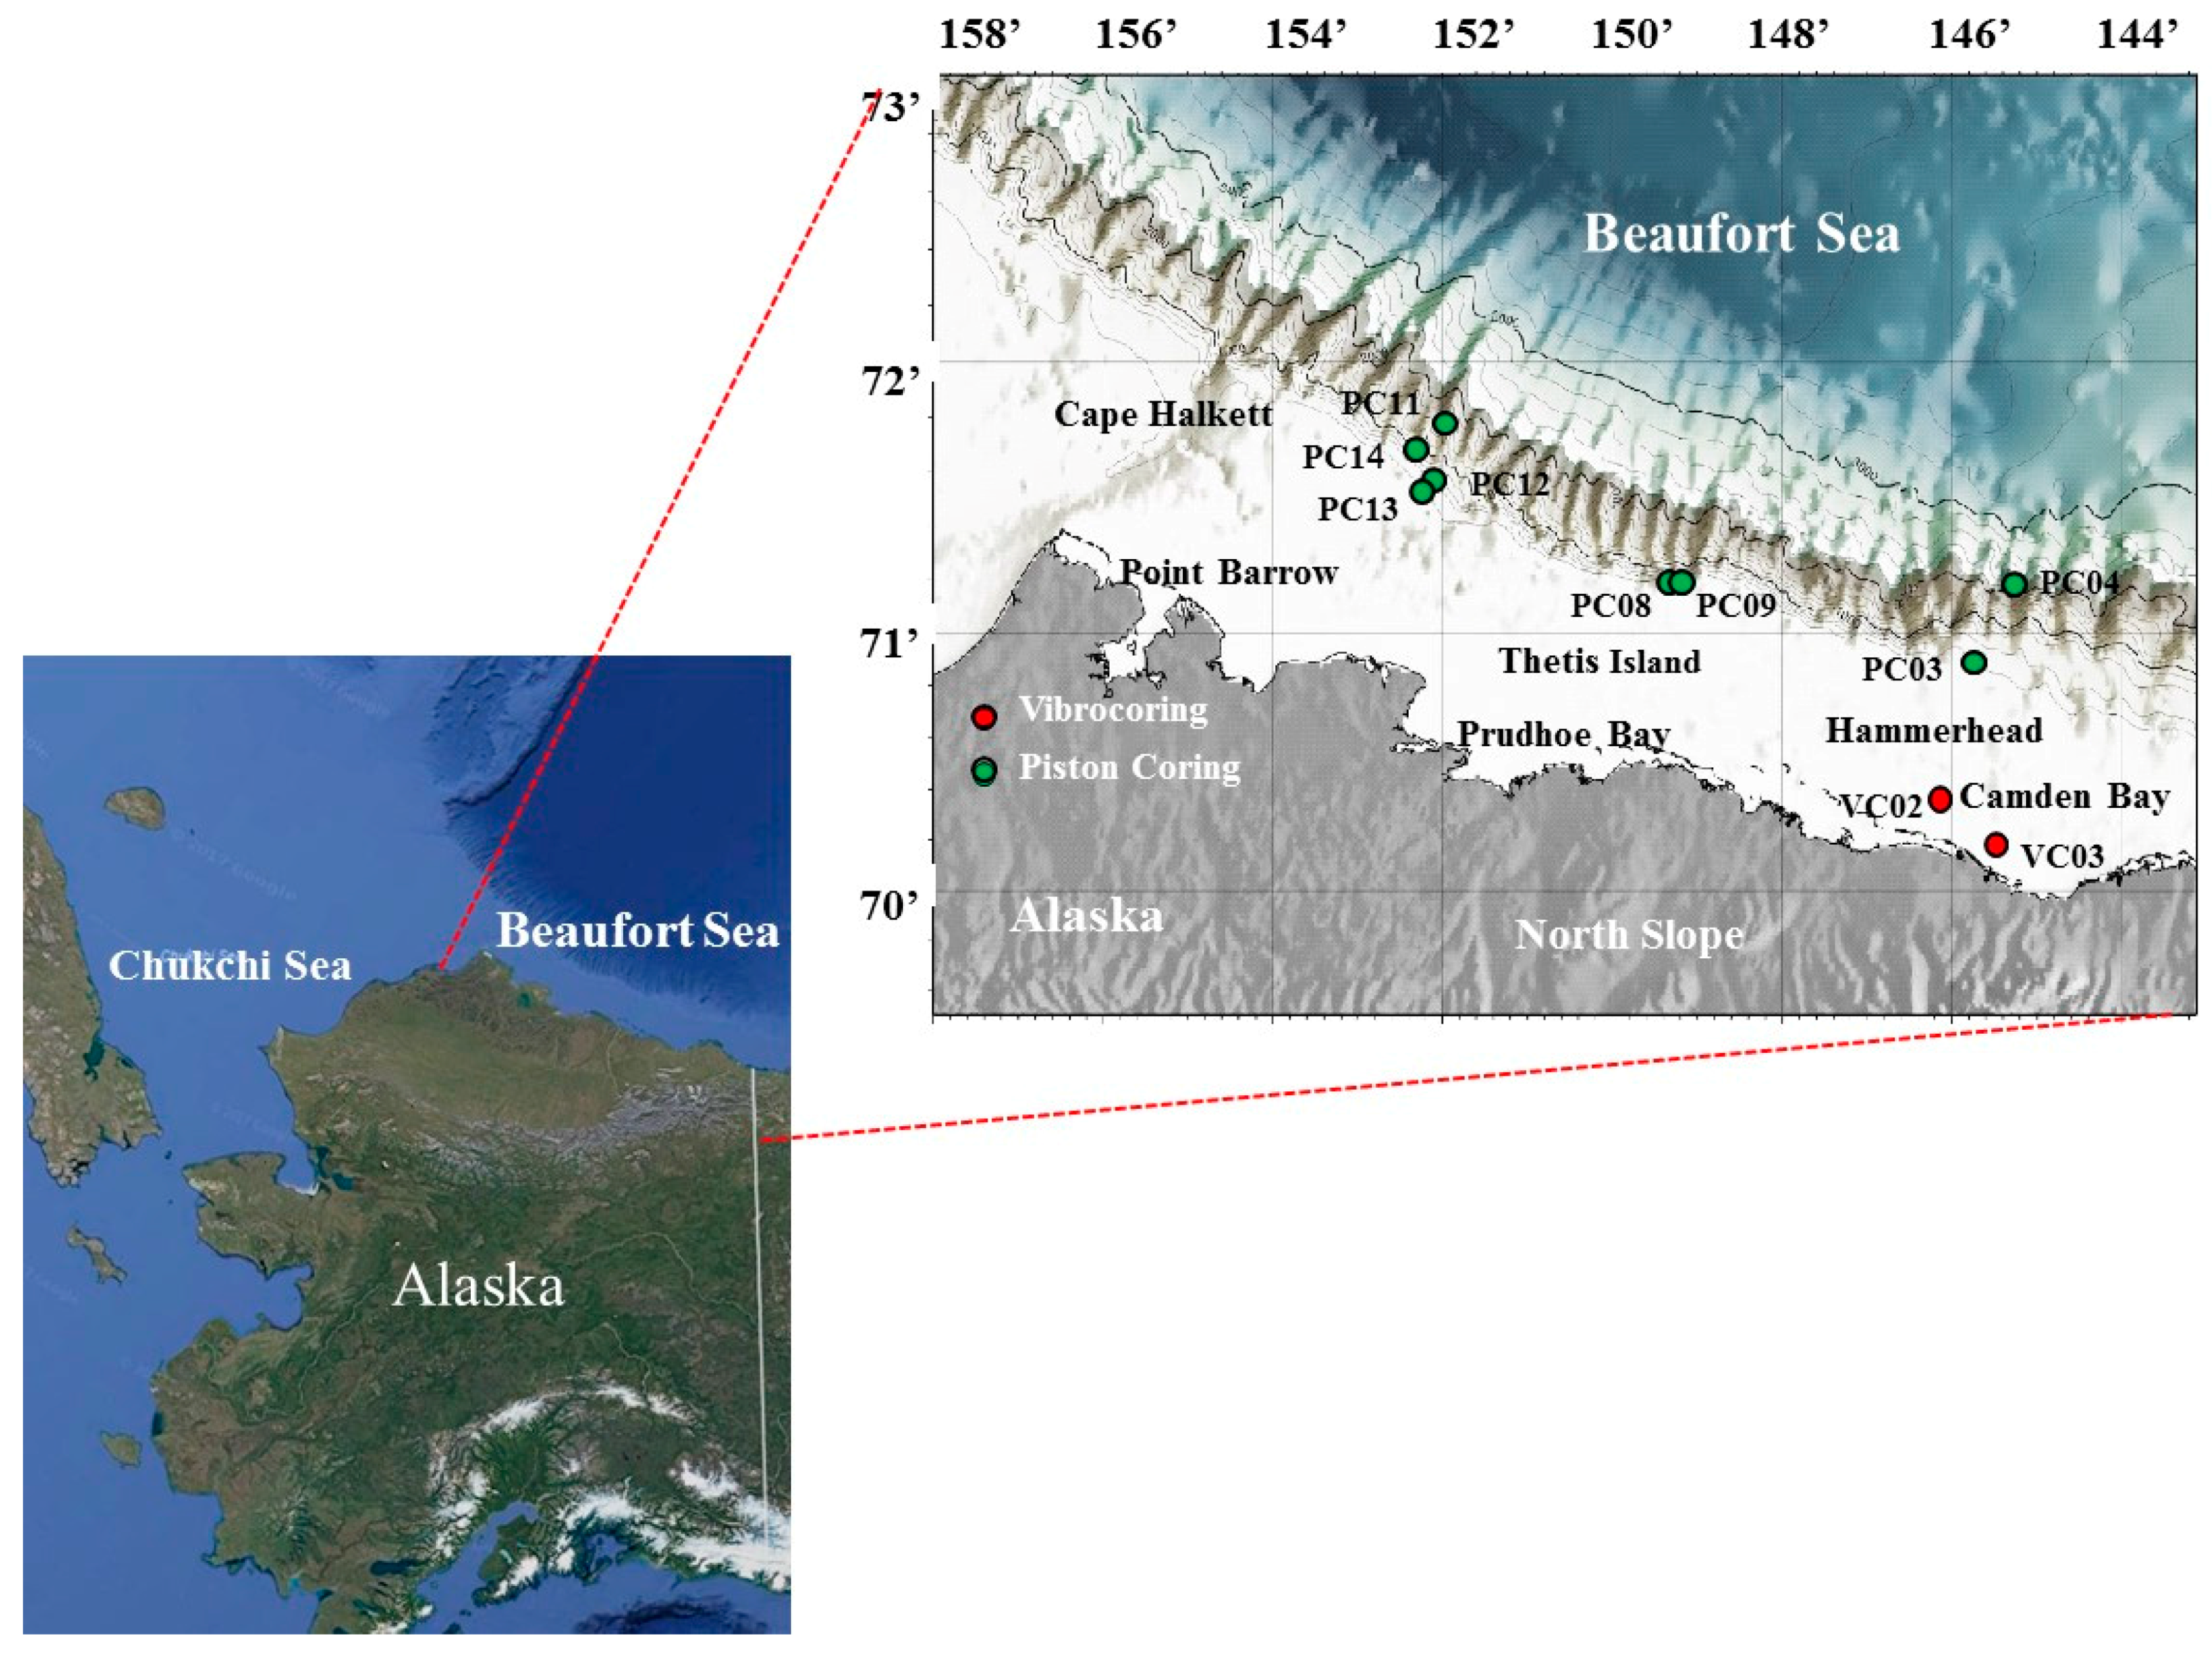
Site Overview—The study region on the Beaufort Sea shelf along the North Slope of Alaska covers an area of ~40,000 km2 extending from just to the east of Point Barrow, Alaska to Camden Bay near the Canadian border west of the mouth of the Mackenzie River (Figure 1). Water depths along this narrow shelf system range from very shallow <30 m near the coast to deeper than 200 m approaching a steep shelf-break where depths increase to over 1000 m over a short distance [22]. The seafloor along the Alaskan Beaufort shelf is characterized by a thin layer of Holocene sediments draped over consolidated Pleistocene sediments. A large fraction of Holocene sediments are tundra or river-sourced (dominated by the MacKenzie River plus minor contributions from smaller Alaskan rivers and streams) or materials eroded from the coast which are reworked by ice scouring along the shelf. This results in a sediment column comprised of a predominant clay/silt with a mix of sand and gravel deposited by ice rafting [36]. Along the ~640 km reach of the Alaskan Beaufort shelf there are repetitive ice-scoured galciogenic bedforms comprised with erosional bathymetric features and adjacent gullies filled with turbidites [37]. A key location where there is potentially a significant additional source of riverine sediment to the coastal region is the Coleville River, near the Thetis Island core sites selected for this study [38].
The Methane In The Arctic Shelf/Slope (MITAS) expedition in September 2009 aboard the USCGC Polar Sea [22,39] focused on sediment core collection from three main nearshore (shelf) to offshore (slope) sampling lines (transects) from east-to-west in along the North Slope of Alaska: Hammerhead (near Camden Bay), Thetis Island (near Prudhoe Bay), and Cape Halkett (towards Point Barrow) (Figure 1). Coring locations were selected based on review of previous Minerals Management Survey and United States Geologic Survey lithostratigraphy and sub-seafloor geologic structures and seismic data [22,39] (Figure 1).
A previous study focused on methane hydrates using the same MITAS-2009 coring locations and sediment and porewater samples used in this study showed considerable spatial variability in vertical CH4 flux between the three different regions along the Alaskan Beaufort shelf (Table 1) [22]. Flux estimates were based on assuming a 1:1 stoichiometric relationship between CH4 oxidation and simultaneous SO42− reduction during the anaerobic methane oxidation (AMO) by a specialized consortium of bacteria. In a diffusive porewater profile where AMO dominates there is microbial driven depletion of SO42− and CH4 concentrations. Through this sulfate methane transition (SMT) zone, the linear fit to a seawater sourced porewater SO42− concentration profile can be used to estimate the upward flux of CH4 from deeper sources. Under this assumption of a 1:1 stoichiometric ratio between CH4 oxidation and SO42− reduction, the diffusive flux of SO42− downward into the sediments is equivalent to the relative magnitude of CH4 flux upward through the sediments [40]. Regional variation in SO42− flux estimates ranged from −15.4 to −154.8 mmol m−2 a−1 (Table 1). Results suggest measureable upward CH4 fluxes across the study area with the lowest values observed on the Hammerhead line in nearshore permafrost-impacted sites as well as offshore sites. Moving east-to-west along the shelf, flux estimates generally increase with the maximum flux values offshore at Cape Halkett indicating significant microbial cycling of CH4 diffusing upwards to the shallow sediment. Estimated flux values suggest potentially-substantial contributions of CH4 to the sediment carbon cycle in this region but with significant spatial variation [22].
Measured headspace CH4 stable carbon isotope ratios (δ13CCH4), ranged from −138 to −48‰ through this region, likewise indicating spatial variation in CH4 oxidation and production [22]. While there were clear locations with active CH4 cycling, porewater δ13CDIC across the study region suggest diverse carbon sources contributed to shallow sediment carbon pools with a range from −36.3 to +5.1‰ [22]. All shallow sediment values ranged from −10 to 0‰ indicating some contribution from overlying water column detritus and seawater. Where high headspace CH4 concentrations were observed in deeper sediment, depleted δ13CDIC (down to −36.3‰) was observed indicating active AMO. The Cape Halkett cores, PC12 and PC13, showed the most enriched δ 13CDIC, up to 5.1‰ that was interpreted to be shallow sediment CH4 production where CO2 is the terminal electron acceptor during organoclastic degradation [17,29]. In contrast, δ13CDIC profiles observed at nearshore and offshore Hammerhead core locations were conservative, depleting with depth as a result of moderate organoclastic carbon degradation. In addition, a comparison of dissolved inorganic carbon (DIC) concentration and δ13CDIC data set across this study region shows a complicated spatial variation in the carbon sources and cycling [22], and provides support for further interpretation of carbon cycling addressed in this study. Understanding OM contributions of phytodetritus-settling, gas and petroleum seeps, and terrestrial, tundra-sourced carbon are necessary to source-apportion sediment OC.
Sediment Coring—Piston cores (PC) were used for sediment sampling at all locations (Figure 1; Table 1) except the two Hammerhead nearshore sites where vibracoring (VC) was required [22]. Piston coring was conducted using a 10 m long commercial piston coring system fitted with 2.75″ internal diameter (I.D.) clear acetate butyrate core liners. Vibracoring was conducted using a submersible electrical vibracore system fitted with 3.65″ I.D. core liners. Recovered core lengths ranged from 105 to 675 cm, with an average length of ~400 cm. After collection and recovery on deck, core liners were removed and cores were sectioned to 1 m lengths and split on a horizontal core splitter. Sampling intervals were decided based on observation of free gas pockets, sediment color, and hydrogen sulfide odor—indicating higher microbial cycling of OM and CH4. Sampling through the core was more frequent down core toward the predicted SMT. For each core, 15–20 sub-samples were taken at sampling intervals ranging from 5 to 60 cm.
Sample Analyses—Porewater samples were collected from core segments using Rhizon syringes with an effective filter pore size of 0.1 µm [41]. After extraction, porewater was dispensed into 1–10 mL vials and stored sealed and refrigerated for subsequent analysis. Sub-samples of wet sediment from core sections were collected and stored frozen in pre-weighed snap-tight Petri dishes for subsequent laboratory preparation and laboratory analysis.
Sediment porosity (φ) was measured gravimetrically as described by Hoehler et al. [42] (2000). Frozen sub-samples were thawed, equilibrated to room temperature, weighed, and dried at 60 °C, then re-weighed to determine sediment water content. Sediment water content was determined assuming constant pore water and bottom water density (1.035) and then relative φ was calculated assuming a constant solid matter density (2.500).
Sediment TOC, total carbon (TC), total sediment nitrogen (TSN) concentrations and δ13C or δ15N were determined with a Thermo Delta Plus XP Isotopic Ratio Mass Spectrometer (IRMS) (Thermo Scientific, Waltham, MA, USA) in-line with a Costech ECS 4010 CHNSO Elemental Analyzer (Costech Analytical Technologies, Inc., Valencia, CA, USA) using a Conflo III interface and helium carrier gas. For this analysis, 15–20 mg of dry, homogenized sediment was analyzed in triplicate. For TOC analysis, dry sub-samples were weighed into silver capsules and wetted with 10% hydrochloric acid then re-dried for 24–48 h at 60 °C to remove inorganic carbon. Subsamples for TC and TSN were weighed into tin capsules and analyzed directly with no additional treatment. Percent sediment inorganic carbon (TIC) was calculated by subtracting measured %TOC from the %TC and correcting values to calcium carbonate (%CaCO3) by weight. The δ13CTIC values were calculated using the sample mass and the measured δ13C ratio [29]. For DOC and δ13CDOC analysis, 1 mL of pore water was sealed in a 2 mL serum vial, then acidified with 20 µL of 85% phosphoric acid to remove the DIC. Porewater DOC samples and δ13CDOC sub-samples were analyzed using an OI Analytical 1010 wet chemical oxidation (WCO) system in line with a Thermo Delta Plus IRMS [43].
Porewater chloride (Cl−) concentrations were measured with a Dionex DX-120 ion chromatograph equipped with an AS-9HC column, an Anion Self-Regenerating Suppressor (ASRS Ultra II), and an AS-40 autosampler based on methods modified from [10]. Samples were diluted 1:50 (vol/vol) prior to analysis and measured using standard solutions referenced against 1:50 diluted International Association for the Physical Sciences of the Oceans (APSO) standard seawater (559 mM Cl−). Analytical precision was ±5% of the reference standard. Chloride concentrations were used to assess any potential upward advection of porewaters or freshening of porewaters due to tundra groundwater inputs to the coastal region. High porewater Cl− concentrations could be indicative of the upward advection of more saline porewaters whereas low porewater Cl− concentrations could be indicative of a freshwater contribution. Low Cl− concentrations could also be indicative of freshening due to methane hydrate destabilization.
Data Evaluation—Sources and cycling of sediment DOC and TOC through core profiles were calculated using the equations from Aller and Blair [32] and Blair et al. [44]. For this evaluation, we assume two prominent end-members; (1) A combination of allochthonous terrestrial, tundra-sourced OM mixed with autochthonous and allochthonous primary production (photodetritus), and (2) OC production driven through AMO. This evaluation studies TOC and DOC sources with depth below the seafloor and between different sites and accounts for fractionation during diagenesis and selective decay through aging, upward vertical gas flux and water column sedimentation. With sedimentation rates in the region of 60 cm 1000 a−1 [45] and active shallow sediment phytoplankton-OM remineralization, it is assumed that phytodetritus contributes only to the modern surface sediment and declines rapidly with depth in the sediments [15,28,35,46,47,48,49]. This approach therefore investigates the medium-to-long term accumulation of OC in the sediment over approximately the last 10,000 years. For this assessment, spatial variation in the water column-sourced OC vs. vertical CH4 flux contribution to the sediment carbon pool through the study region was calculated using mass and isotopic balances summarized by Equations (1) and (2):
where Cx = concentration of the carbon (TOC or DOC) pool and δ13Cx = the stable isotope composition of the respective component. CTM represents material transported to the core site (phytodetritus and terrestrial, tundra-sourced OC) and CAM represents carbon production through AMO. During diagenesis of OM (TOC or DOC) with the initial components CTM and CAM, mass and isotopic changes of carbon pools are represented by Equation (3):
where ΔC = net change in carbon pool concentration and δ13CΔ = net change in isotopic composition during diagenesis. When δ13CTMCTM (or δ13CAMCAM) = constant or zero and ΔCx ≠ zero, Equation (4) becomes:
where linear slopes of δ13CxCx versus Cx estimate the net isotopic signal of carbon lost or gained through vertical sediment profiles during diagenesis [32,33]. In this study, the linear slopes of δ13CxCx versus Cx are also used to investigate the net isotopic signal of carbon cycled between locations.
3. Results
General Sediment Characteristics—Sediment porosity (φ), porewater Cl−, and the sediment TOC/TSN ratios plotted down-core, vs. depth in the sediments provide general information as to the sedimentological conditions at each coring site (Figure 2). Porosity serves as a proxy for sediment density and water content. Porewater Cl− provides evidence of any freshening of porewaters and/or fluid advection within the sediment column. Lastly, the sediment TOC/TSN ratio provides information on OM burial and remineralization rates. The sediment TOC/TSN ratio will be a function of the nature of OM present, its age, and lability. Generally, sediment TOC/TSN values should decrease during OM remineralization.
Sediment porosity values measured varied from 0.35 to 0.79 φ. In most sites, porosity decreased gradually with depth in the sediments due to compaction. A notable exception was the PC04 site along the Hammerhead line offshore of the shelf break where porosity showed a pattern in decreasing and increasing values with depth, possibly indicative of differential sediment layering. The lowest porosity was observed at the Hammerhead nearshore sites (VC02 and VC03) with values averaging 0.45 ± 0.5 φ (n = 17). Low values (<0.50) were also observed at the nearshore site near Thetis Island (PC08). The highest observed sediment porosity values were at Cape Halkett with an average of 0.68 ± 0.04 φ (n = 88). In general, sediment porosity values increased nearshore-to-offshore and east-west. This would be consistent with prevailing current driven particle trajectories and the high degree of scouring due to the wind-driven movement of grounded sea-ice that would result in the net transport of sediment materials from east-to-west along the shallow Alaskan Beaufort shelf leaving behind more compact Pleistocene-aged sediments [50].
Measured sediment TOC/TSN ratios ranged from 8.0 to 17.2 with some differences between locations. At most sites, sediment TOC/TSN ratios stayed relatively constant with depth. The offshore Hammerhead site (PC04) had variable sediment TOC/TSN values with depth, consistent with the variable porosity values indicative of sediment layering. The highest sediment TOC/TSN values (17.2) were measure at the nearshore Thetis Island site (PC08) in the vicinity of the mouth of the Colville River, a potential source of terrestrial OM. Measured values nearshore (VC02, VC03) and Hammerhead offshore (PC03, PC04) were similar with TOC/TSN at 9.71 ± 0.30 (n = 17) and 9.83 ± 1.62 (n = 36), respectively. Values were moderately high throughout the entire Thetis Island line (PC08, PC09) at 10.68 ± 2.70 (n = 25) and lower at Cape Halkett (PC11, PC12, PC13, PC14); 9.12 ± 0.44 (n = 88).
In the absence of fluid advection through the sediment, the porewater Cl− values at each coring site should be a function of the average salinity of the bottom waters of the overlying water column. Bottom water salinity values from conductivity-temperature-depth (CTD) casts during MITAS-2009 were between 26.0 to 34.5‰, increasing nearshore-to-offshore. These CTD measurements represent a one-time snap-shot of water column salinity during the time of core collection but, if these values are assumed to represent average bottom water values, then expected porewater Cl− concentrations should be in the range of ~415 to 550 mM. Significant deviations outside the range of these values could be indicative of fluid advection through the sediments. There were observed differences in porewater Cl− concentrations across core locations ranging from about 460 to 560 mM. As might be expected, nearshore sites where bottom water salinities were lower generally had lower porewater Cl− concentrations. There was no clear indication of significant freshening or salinization of porewaters at any sites but the offshore Hammerhead site PC08 showed surprisingly low porewater Cl− concentrations in the shallow sediments. The cause for this is unclear but could be due to the relative proximity of the coring site to the Mackenzie River mouth.
Sediment Carbon—measured sediment total organic and inorganic carbon (%TOC and %TIC) concentrations and the δ13C values of these fractions vs. depth in the sediment (cmbsf) are shown in Figure 3. The %TIC contribution to the sediments over all sites ranged from 0.21 to 3.67% dry weight while %TOC ranged from 0.44 to 2.34% dry weight. Strong regional differences can be noted. Sediment %TIC was highest at Hammerhead nearshore (VC02, VC03) and Thetis Island (VC08, VC09) with averages of 1.20 ± 0.12% (n = 16) and 1.17 ± 0.61% (n = 22), respectively. Slightly lower %TIC values were observed at Hammerhead offshore; 0.93 ± 0.65% (n = 33). Sediment %TIC values were significantly lower at all sites along the Cape Halkett line (PC11, PC12, PC13, PC14) with an average of 0.43 ± 0.1% (n = 88). Spatial variations in measured sediment %TOC values mirrored the %TIC values. The highest sediment %TOC values observed, with an average of 1.59 ± 0.08% (n = 88), were along the Cape Halkett line where sediment %TIC was lowest. Likewise, the lowest sediment %TOC values were observed at Hammerhead nearshore sites with an average of 0.79 ± 0.06% (n = 16). Hammerhead offshore and Thetis Island sites had %TOC values averaging 1.07 ± 0.20% (n = 33) and 1.34 ± 0.29% (n = 22), respectively. The trends observed in sediment carbon values are consistent with observed sediment porosity values which suggest a scouring of recent, relatively OC-rich Holocene sediments and subsequent net transport from east-to-west along the shelf.
The δ13CTIC values in all cores at all sites ranged from −8.24 to 3.87‰ with some variation with depth in select cores and between cores from different sites (Figure 3). The largest down-core variations were observed along the Cape Halkett line and at the offshore Hammerhead site (PC-04). These sites also had both the most depleted and most enriched values observed in this study. The δ13CTOC values measured ranged from −27.50 to −23.50‰ with little down core variability but some differences between sites. In general, δ13CTOC values were slightly enriched east-to-west and nearshore-to-offshore. The OC in sediments along the Cape Halkett line were consistently δ13C-enriched relative to the other locations with average values of −24.55 ± 0.36‰ (n = 88). Sediment OC was the most 13C-depleted at the Hammerhead nearshore site with average values of −25.81 ± 0.18‰ (n = 16).
Sediment Nitrogen—measured %TSN values in all cores ranged from 0.073 to 0.211% (Figure 4). The highest %TSN values were measured along the Cape Halkett line with an average for all core samples of 0.17 ± 0.01% (n = 88). The lowest values measured were at the Hammerhead nearshore sites (VC02 and VC03) which had an average %TSN value of 0.08 ± 0.01% (n = 16). Values along the Hammerhead line increased in the offshore sites (PC03 and PC04) to an average of 0.11 ± .03% (n = 33). Values in the two cores collected near Thetis Island likewise showed an increase from lower values nearshore increasing offshore. The average value for %TSN on the Thetis Island line was 0.13 ± 0.02% (n = 22). Like measured %TOC values, sediment %TSN values showed a general pattern of increasing nearshore-to-offshore and east-to-west along the shelf.
Measured δ15NTSN values along the shelf ranged from 1.98 to 7.91‰ (Figure 4). The western-most locations at Cape Halkett were observed to have the most enriched δ15NTSN values averaging 6.60 ± 0.65‰ (n = 88). Values for δ15NTSN measured at Thetis Island were on average 4.86 ± 1.61‰ (n = 22) but were significantly more enriched at the offshore site (PC09) as compared to the nearshore site (PC08). Along the Hammerhead line, the measured δ15NTSN values in the nearshore sites (VC02 and VC03) averaged 3.14 ± 0.31‰ (n = 16) and the offshore sites (PC03 and PC04) averaged 3.55 ± 1.10‰ (n = 33). This difference does not appear to be significant but if one looks at just the surface sediments, a trend in enrichment of δ15NTSN values nearshore-to-offshore is evident. Interpretation of δ15NTSN values can be highly problematic due to the potential mixing of OM from different sources (marine vs. terrestrial) with a similar, overlapping range of δ15N values and fractionation during biogeochemical cycling, but the trend in enrichment from nearshore-to-offshore and east-to-west along the shelf is again clear, potentially suggesting variability in OM sources, transport, and accumulation.
Porewater DOC—measured porewater DOC concentrations ranged from 0.44 to 6.95 mM, with an increase with depth in the sediments observed at all sites (Figure 5). The highest porewater DOC concentrations were found at the Thetis Island nearshore site (PC08) and along the Cape Halkett line; 4.23 ± 2.01 mM (n = 12) and 3.17 ± 1.29 mM (n = 88), respectively. Porewater DOC concentrations were generally lower at the nearshore and offshore Hammerhead core locations; 1.82 ± 0.49 mM (n = 11) and 1.71 ± 0.44 mM (n = 19), respectively.
Measured porewater δ13CDOC values ranged from −35.1 to −24.0‰ (Figure 5). Hammerhead nearshore, Hammerhead offshore and Thetis Island δ13CDOC values were similar with values at −32.3 ± 1.6‰ (n = 19), −32.3 ± 1.8‰ (n = 11), and =30.4 ± 2.6‰ (n = 12), respectively. The DOC was more 13C-enriched at Cape Halkett with an average for all cores at −26.6 ± 1.56‰ (n = 88). Vertical δ13CDOC profiles at Cape Halkett and Thetis Island were 13C-depleted at the surface and increasingly enriched down core, while the samples at both Hammerhead sites were relatively uniform to moderately depleted down core. Interpretation of these differences is explored further in the Discussion section that follows.
TOC and DOC Data Interpretation—the mixing of sediment OC from different sources and transformation during diagenesis or transport and focusing can be investigated with Equations (1)–(4) using δ13C values and OC concentrations measured through core profiles and between coring locations (Equation (4)) [32,33]. A comparison of δ13CTOC-weighted %TOC concentrations to %TOC concentrations provides the TOC δ13C source value through the profile and shows strong regional variations in the TOC pool being cycled along the Alaskan Beaufort Slope (Figure 6). There was no SMT observed at any of the Hammerhead nearshore or offshore sites so these data were combined. The slope of the linear fit to the plot of δ13CTOC-weighted %TOC concentrations to %TOC concentrations at the Hammerhead Offshore and Nearshore sites was −26.4‰ (r2 = 0.998). In comparison, there was a strong difference in the slope of the linear fit to the plot of δ13CTOC-weighted %TOC concentrations to %TOC concentrations at the Thetis Island site at −31.1‰ (r2 = 0.998). Likewise, the slope of the linear fits to the plots of δ13CTOC-weighted %TOC concentrations to %TOC concentrations at Cape Halkett were significantly different with a value of −19.9‰ (r2 = 0.974) above the SMT and depleted below the SMT at −22.9‰ (r2 = 0.990), respectively. Results show strong spatial variations; the net isotopic signal of OC cycled between locations, indicative of variable contributions of OM with different liability from different sources to the sediment OC pool along the Alaskan Beaufort Sea shelf.
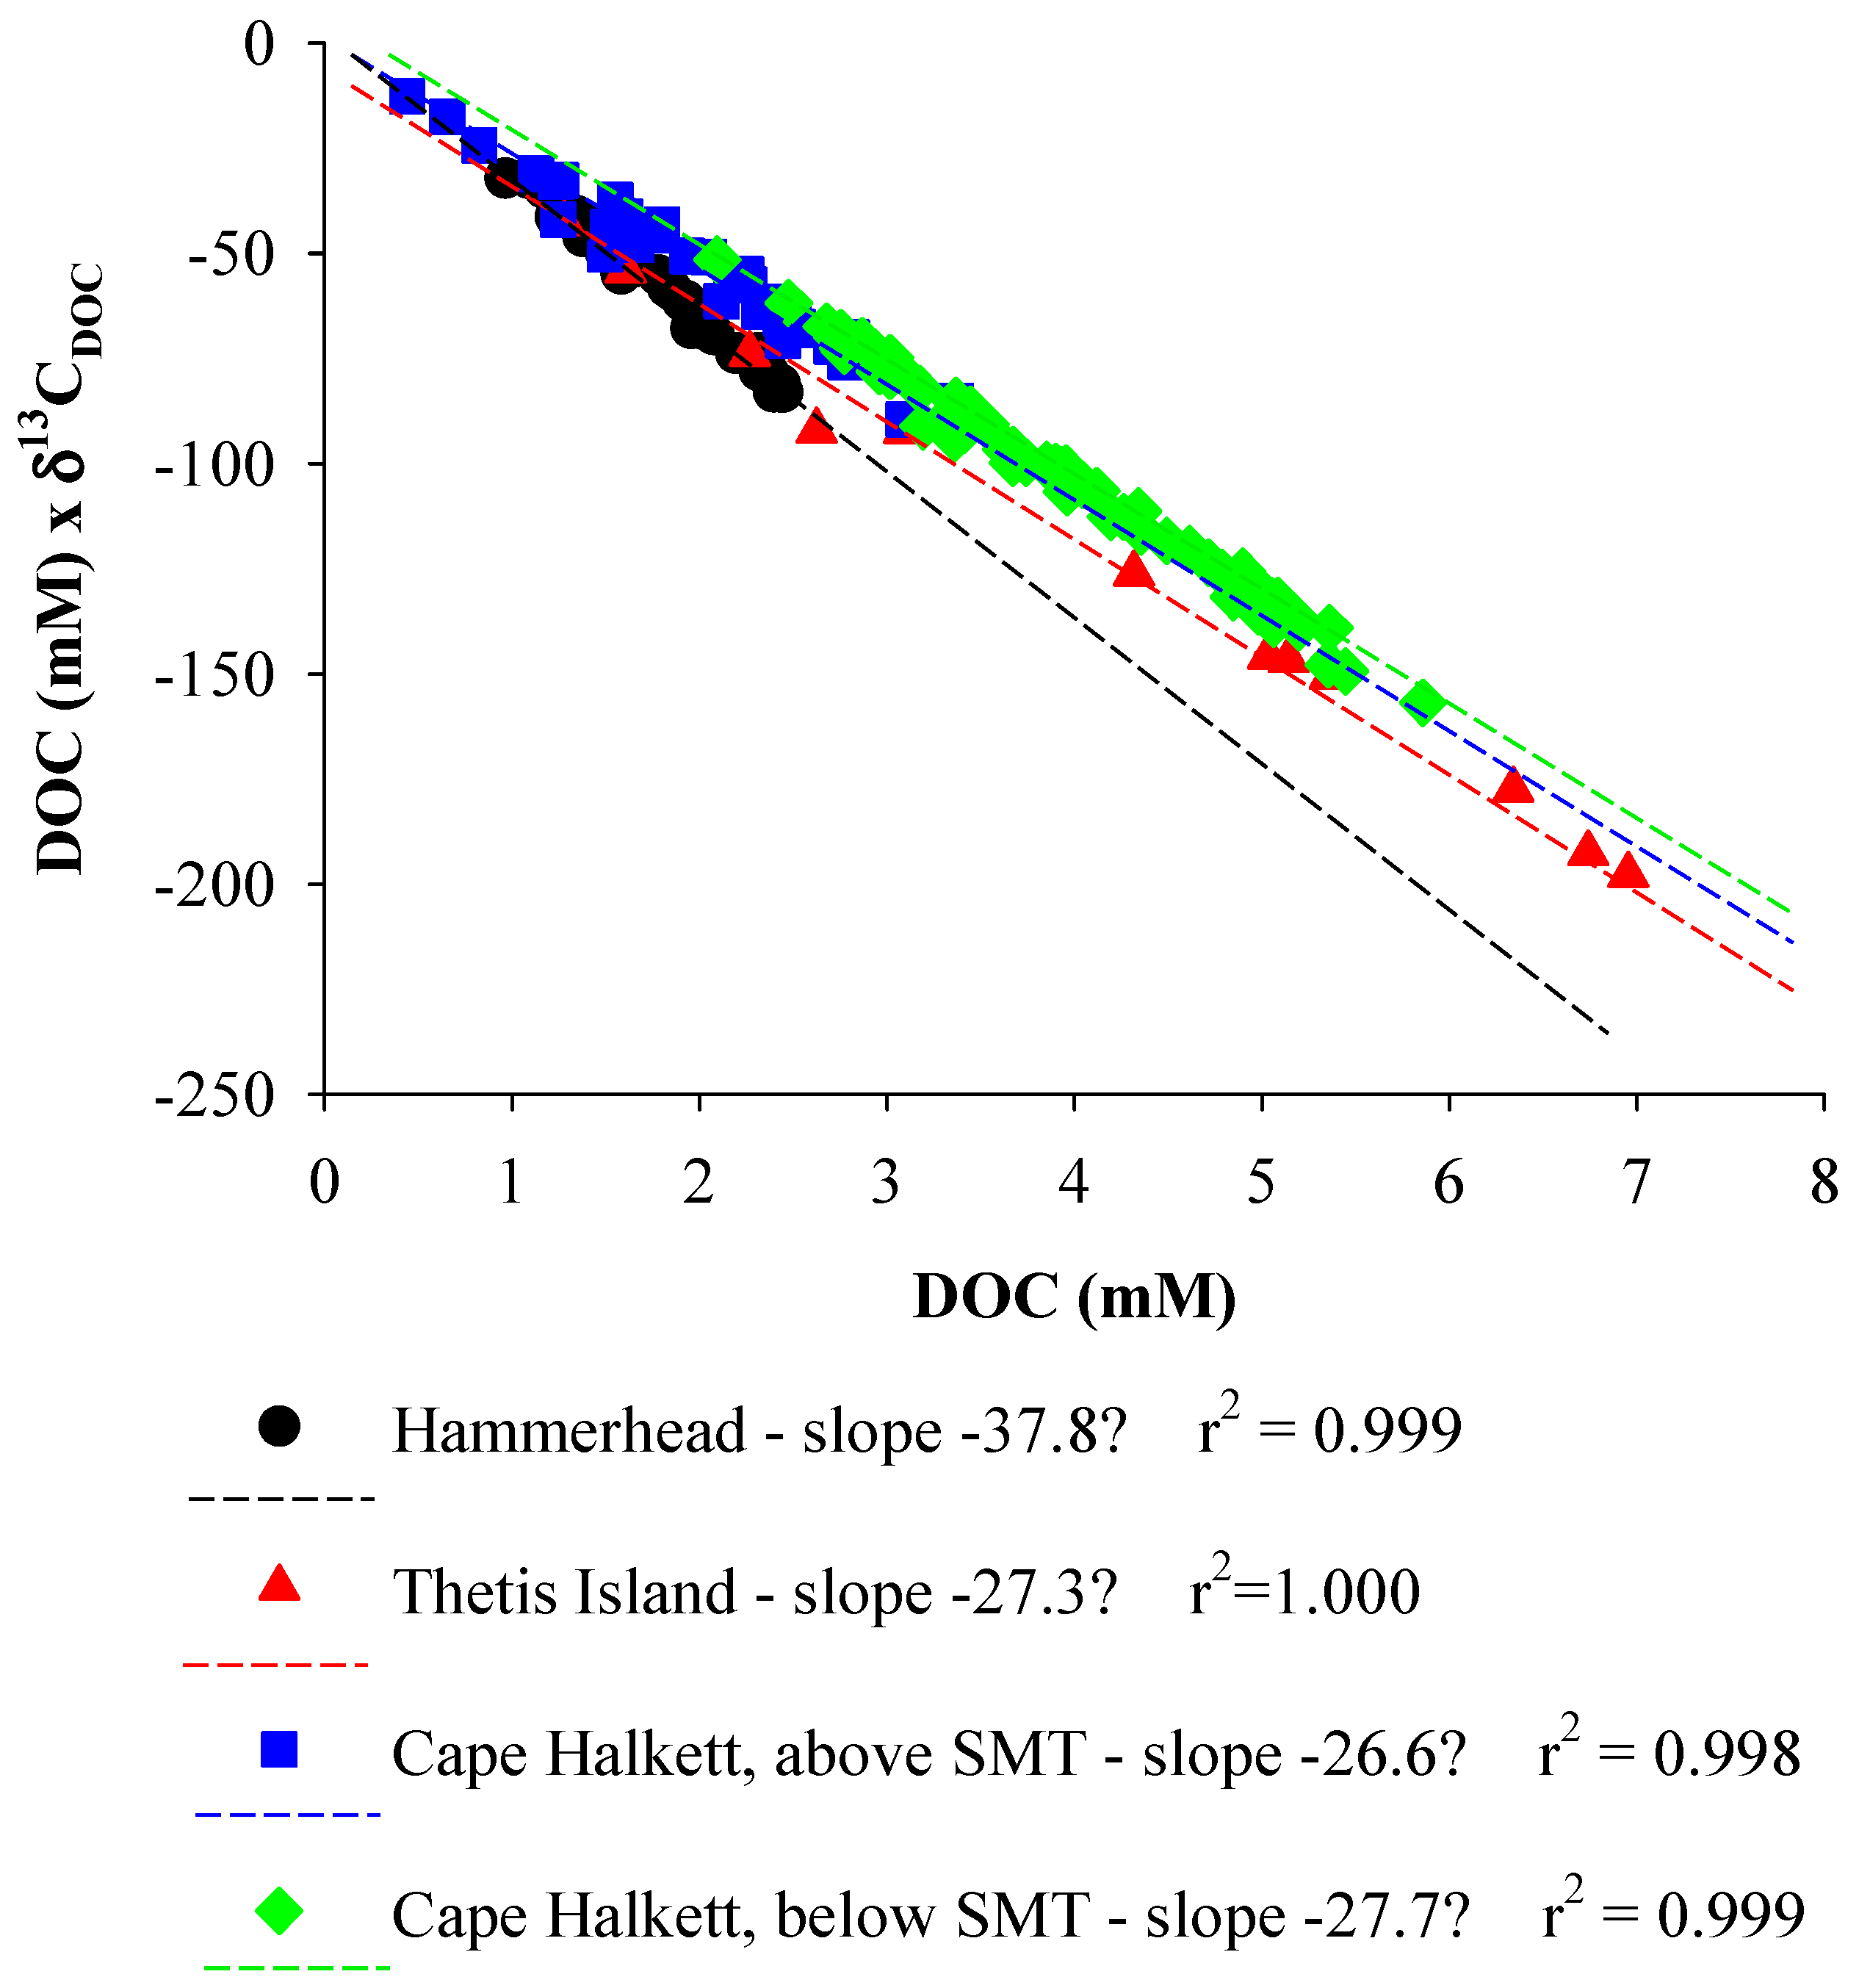
The sediment OC pool can be assessed in-depth by comparing δ13CDOC-weighted porewater DOC concentrations to DOC concentrations (Figure 7; Equation (4)). The slope of the linear fit to the plot of δ13CDOC-weighted DOC concentrations to DOC concentrations at the Hammerhead Offshore and Nearshore revealed a surprisingly depleted value of −37.8‰ (r2 = 0.999). In general, the slopes of the linear fits to the plots of δ13CDOC-weighted DOC concentrations to DOC concentrations were similar for Thetis Island, −27.3‰ (r2 = 1.000), and Cape Halkett, both above and below the SMT, −26.6‰ (r2 = 0.998) and −27.7‰ (r2 = 0.999), respectively. The slope of the linear fit to the plot of δ13CDOC-weighted DOC concentrations to DOC concentrations at Cape Halkett was moderately depleted below the SMT as compared to above the SMT, suggesting a possible AMO contribution to porewater DOC. This interpretation is supported with high AMO rates observed at Cape Halkett [22].
4. Discussion
This study investigates variability in sources of sediment TOC and porewater DOC across the Alaskan Beaufort Sea shelf (Figure 1). The spatial assessment in variation of OC sources addressed in this study utilizes inorganic and organic sediment carbon concentrations and δ13C, total nitrogen concentration and δ15N, general sediment chemistry properties, and a previous study that focused on spatial variation in vertical CH4 fluxes across the same study region [22]. Results suggest a dominant east-to-west transport of modern Holocene sediments with higher OC concentrations primarily sourced from relatively labile terrestrial, tundra OM sources and phytodetritus. Sediment transport pattern along the shelf results in the medium-to-long term accumulation and burial of sediment OM focused to the west which in turn results in higher biogenic CH4 production rates, higher upward CH4 diffusion through the sediments and an increase in CH4−AMO-sourced contribution to the sediment OC pool.
Inorganic and organic carbon measured in sediment across the Alaskan Beaufort Shelf ranged from 0.21 to 3.67% and 0.44 to 2.34%, respectively (Figure 3). The highest %TIC concentration was in Hammerhead offshore site, PC04, at up to 3.4% down core. It is interesting that %TIC concentrations measured in the Cape Halkett study region were not elevated relative to other locations since this region had relatively high AMO rates at all core sites [22]. Previous research in the Gulf of Mexico has shown that a significant fraction of the CH4 flux through sediments where AMO dominates can end up precipitating as authigenic carbonate [51]. The low %TIC concentrations measured could be a result of relatively modern elevated AMO rates occurring after the last glaciation, a result of westward sediment transport. The δ13CTIC values measured in this study ranged from −7.4 to 5.6‰ with little variation through most individual cores or amongst different core locations. Exceptions were at the Hammerhead Offshore site, PC04, and the Thetis Island site, PC08, where there were variations in δ13CTIC through the cores associated with changes in %TIC (Figure 3).
Measured sediment %TOC concentrations increased nearshore-to-offshore and east-to-west along the Alaskan Beaufort Sea shelf consistent with an east-west transport of sediment. Sediment porosity values coincide with this observation, with highest porosity values observed at the western-most Cape Halkett sites (Figure 2). This likely indicates an accumulation of newer, more mobile, less consolidated sediments focused to the west along the shelf. This would be consistent with the high coastal erosion rates observed along the Alaskan Beaufort Sea shelf which can be up to 1.8 × 10⁵ mg year−1 [52] and a net westward transport of sediment due to ice scouring [37,53]. Trends in sediment %TOC concentration measured along the shelf in this study are also consistent with those measured by of [47,48] on the Beaufort shelf, east of this study area towards the Mackenzie River delta where sediment %TOC values ranged from 0.73 to 1.7% [47].
Measured %TSN concentration ranged from 0.05 to 0.2% amongst all core locations (Figure 4). General patterns showed low %TSN concentration at Hammerhead nearshore and offshore sites while higher %TSN concentrations were observed westward at Cape Halkett. Sediment δ15NTSN ranged from 1.9 to 7.9‰ (Figure 4) with substantially depleted 15N eastward at the Hammerhead nearshore and offshore core sites. Westward, at Cape Halkett, δ15NTSN was consistently enriched in 15N with a minimum values of 5.8‰ in PC13. The δ15NTSN range for the Alaskan Beaufort Shelf was remarkably depleted relative to eastern values in the Beaufort Sea off the Mackenzie River delta that ranged from 5.8 to 15.8‰ [27]. This difference could be due to a higher contribution of phytodetritus to the sediment carbon and nitrogen pool near the Mackenzie River. The phytodetritus contribution to sediment OC along the entire Alaskan Beaufort Sea Slope has been reported to be low [15,28,49] and trends were not observed in downcore δ15NTSN profiles in this study that suggest a significant presence of phytodetritus deeper in the sediments (Figure 4).
The sediment TOC/TSN profiles in this study indicate a significant terrestrial, tundra-sourced contribution to sediment OC (Figure 2). Measured TOC/TSN values ranged from 7.6 to 17.2 for all core profiles. Higher values were observed in PC08 near Thetis Island, which, given the location to the Colville River mouth, may have a significant but possibly ephemeral input of more recent tundra-sourced OM. Further westward from the study area at the Beaufort-Chukchi Sea boundary, TOC/TSN ratios ranged from 9.0 to 14.0 [47]. Further eastward in the Beaufort Sea off the Mackenzie River mouth, TOC/TSN values ranged from 6.4 to 10.1 [27] in shallow sediments 30–40 cmbsf. Higher values of TOC/TSN ranging from 10 to 16 have been measured near the Siberia Arctic river systems due to the significant export of tundra-sourced carbon to the shelf by these large river systems [54].
The δ13CTOC values measured at all core sites along the coast of the Alaskan Beaufort Sea shelf ranged from −27.5 to −23.7‰ (Figure 3). These values are similar to those published for other regions in the Arctic Ocean; −27.4 to −25.0‰ for the Siberia coastal-river interface [54] and −26.8 to −24.5‰ for the Beaufort Sea off the Mackenzie River [27]. As stated in the Results section, the slopes of the linear fits to δ13CTOC-weighted %TOC concentrations and %TOC concentrations at Hammerhead, Thetis Island, and Cape Halkett show strong regional variations in the TOC pool being cycled along the Alaskan Beaufort shelf-slope (Figure 6). The net isotopic signal of OC cycled at the easternmost Hammerhead line was −26.4‰, likely indicative of a terrestrial, tundra-sourced OM accumulation. This δ13C value is not interpreted as a CH4-AMO contribution to sediment organic carbon because δ13CDIC in this region does not indicate active AMO [22]. In comparison, the net isotopic signal of OC cycled along the Western Cape Halkett line was significantly more 13C-enriched with values at −19.9‰ above the SMT and −22.9‰ below the SMT.
Previous research conducted in this area showed significant upward CH4 flux through the sediments of these same Cape Halkett sampling sites [22]. Estimated sediment anaerobic CH4 oxidation (AMO) rates along the study area were high (−100.1 to −154.8 mmol SO42− m−2 a−1, Table 1) measured westward around Thetis Island and Cape Halkett [22]. Recent studies have shown AMO to be a significant driver of shallow sediment and porewater carbon cycling processes [17,29]. Other research conducted at sites with similar vertical CH4 diffusion rates have shown CH4 contributions to shallow sediment OC are not significant in shallow sediments and were only observed deeper in the sediment through and below the SMT [29]. Enriched sediment δ13CTOC values with a range of −24.6 to −18.6‰ indicating significant contributions from phytodetritus to surface sediments were observed in nearshore-to-offshore sediment core samples collected during studies conducted by others westward at the boundary of the Beaufort-Chukchi Seas [47,48]. The more depleted net isotopic signal of TOC cycled below the SMT as compared to above the SMT at Cape Halkett, likely a combination of a significant phytodetritus to the surface sediments above the SMT and a CH4 AMO-derived OC contribution to sediments below the SMT. With consideration of substantial AMO observed at Cape Halkett [22], it is interesting that the observed shift in the net isotopic signal δ13CTOC from above and below the SMT only suggests a moderate contribution of CH4 AMO-derived OC to the sediments TOC pool. This observation is different from studies in other coastal areas [17,29]. In the Gulf of Mexico, on Atwater Valley, AMO was observed to contribute up to 85% of the TOC at sites with active advective vertical migration of porewaters and approximately 50% at sites with strong upward CH4 diffusion [17].
Based on several recent studies, it has been assumed that the phytodetritus contribution to sediment OC loading is low because this OM is highly labile and is rapidly remineralized in surface sediments [15,28,35,46,47,49]. Yet, eastward of the region in this study, at the Mackenzie River mouth, the top 20–50 cm of sediment appears to be 20–95% phytodetritus-sourced [35,47]. While this is a potentially high contribution to total sediment OC, this material is likely to be rapidly degraded during the shallow sediment early diagenesis. Supporting this statement, a study of deeper sediments at this same eastward location shows that the remineralization of phytoplankton-derived OC in surface sediments resulted in a maximum contribution to the OC pool in deeper sediments of only 3% [49]. This observation is supported by a study of several continental shelf areas around the world where predictions for phytoplankton remineralization in the water column and phytodetritus-OM remineralization in shallow sediment was estimated to be 95% [15]. Additionally, radiocarbon analyses indicate that the phytodetritus contribution to deeper sediment OC below the surface layer was generally low. Instead, sediment OC concentrations appeared to be dominated by terrestrial, tundra-sourced OC [28]. The observed contribution of phytodetritus in this study coupled with high AMO at the same location may be a result of relatively recent westward sediment transport. The core profiles presented in this study represent a net accumulation of sediments over approximately 5000–10,000 years. Sediment accumulation along the Alaskan Beaufort shelf is influenced by a strong westward transport of sediments by ice scouring and currents. Any contribution of phytodetritus to the sediments OC pool would be limited to relatively recent surface sediments that would likely move with the prevailing pattern for sediment transport from east-to-west along the shelf. A notable exception to east-to-west trends in sediment OC sources and distribution from Hammerhead to Cape Halkett was the Thetis Island nearshore site, PC08, near the mouth of the Collville River. At this location, the highest %TOC concentration was observed (Figure 2). The net isotopic signal of OC cycled derived from the linear fit to δ13CTOC-weighted %TOC concentrations and %TOC concentrations was −31.1‰. This suggests the possible accumulation of recently deposited terrestrial tundra-sourced OM, possibly from the Colville River (Figure 6).
Sediment porewater DOC concentrations and δ13CDOC values also varied spatially, indicating different OC source contributions across the Alaskan Beaufort shelf. Porewater DOC ranged from 0.7 to 6.9 mM and consistently increased with depth in the sediment (Figure 5). The highest porewater DOC concentrations through the entire profiles were at Cape Halkett and in the one core (PC08) at Thetis Island. The δ13CDOC values measured ranged from −35.1 to −24.0‰ with the lightest, more depleted, values in shallow sediment and regions with the lowest DOC concentrations. As DOC concentrations increased down core, there was a consistent increase in δ13CDOC values (becoming less negative, or more enriched). At offshore Hammerhead, DIC concentrations through core profiles were low with little variation in δ13CDIC while there were strong patterns in vertical profiles for these parameters at Thetis Island and Cape Halkett [22]. The most depleted δ13CDOC values were measured at the Hammerhead offshore site, PC03, in which DOC concentration was minimal. The low DIC with a uniform δ13C profile [22] suggests low carbon cycling in this region. At Cape Halkett and Thetis Island, variations in δ13CDOC above and below the SMT suggested a mixture of CH4, AMO-derived DOC and DOC derived from the remineralization of OM from terrestrial tundra-sources with a possible contribution of phytodetritus to the surface sediments [22]. DOC derived from thermogenic CH4, transported from shallow sediment to deep water column off the Cascadia Margin, was depleted down to −30.1‰ [55]. More depleted δ13CDOC values ranged from −42.8 to −20.1‰ in regions with strong biogenic CH4 diffusion to shallow sediments in the Gulf of Mexico Atwater Valley and off the Coast of New Zealand, Hikurangi Margin [17,29].
The slopes of the linear fits to δ13CDOC-weighted DOC concentrations and DOC concentrations in sediment porewaters also showed interesting spatial variations in the net isotopic signal of DOC cycled along the Alaskan Beaufort shelf (Figure 7). The net isotopic signals of DOC cycled at Thetis Island and Cape Halkett were −27.3‰ and −26.6‰ (above the SMT) and −27.7‰ (below the SMT), respectively, suggesting similar long term DOC production at these sites. The slight depletion in porewater δ13CDOC values below the SMT at Cape Halkett are consistent with CH4 AMO and subsequent production of DOC for contribution to the porewater DOC pool. Overall, the range of δ13CDOC values measured suggests contributions from CH4 AMO and/or the remineralization of terrestrial tundra-sourced OM dominating the sediment porewater DOC pool, although some contribution from phytodetritus in the surface sediments cannot be ruled out. It is important to note that the relative contribution of these different sources cannot be determined quantitatively with any degree of certainty with the results of this study but the evidence of high AMO rates observed at these same sites in previous research supports the conclusion of a significant CH4−AMO-sourced contribution to porewater DOC and sediment TOC pools [22].
The slope of linear fits to δ13CDOC-weighted DOC concentrations and DOC concentrations at the Hammerhead sites are very interesting. The net isotopic signal of OC cycled in porewater DOC pool, −37.8‰, was clearly depleted as compared to the Thetis Island and Cape Halkett values (Figure 7). Note that measured porewater DOC concentrations were lowest in this region and increased moving westward. With increases in porewater DOC concentrations, there was a shift to more enriched δ13CDOC values. Previous values for water column δ13CDOC measured by others in the Beaufort Sea, were −23‰ and ascribed to phytoplankton production [28]. The net isotopic signal of OC cycled in the porewater DOC pool at Hammerhead argues against the remineralization of phytodetritius as the dominant OC source. Compound-specific δ13C analysis of leaf lipids has demonstrated alkane values to be down to −38.6‰ [56]. The Hammerhead sites are located west of the Mackenzie River delta. A previous study by others on Mackenzie River delta sediments showed short-chain fatty acid δ13C values ranging from −25 to −29‰ (marine sourced) while longer chain fatty acids greater than C20 were δ13C depleted, ranging from −29 to −33‰ (terrestrial-sourced [57]). Radiocarbon analyses showed longer chain fatty acids to be 7000 to 12,000 years BP relative to short chain fatty acids having modern signatures [57]. Drenzek et al. [57] concluded that 40–50% of OC was petrogenic and remaining material was OC from land-based plant materials. The depleted net isotopic signal of OC cycled in the porewater DOC pool at Hammerhead from our study suggests that older (Pleistocence-aged), more refractory, terrestrial OM, potentially from the Mackenzie River, may be the dominant source of OM cycled in the porewaters at Hammerhead. This would be consistent with the general findings of this study.
In conclusion, results suggest an east-to-west transport along the Alaskan Beaufort shelf of modern Holocene sediments with higher OC concentrations primarily sourced from relatively labile terrestrial, tundra OM sources and phytodetritus. Sediment transport patterns along the shelf result in medium-to-long term accumulation and burial of sediment OM focused to the west which in turn results in higher biogenic CH4 production rates, higher upward CH4 diffusion through the sediments, and a higher CH4−AMO-sourced contribution to the sediment OC pool below the SMT to the west along the shelf. Regional climate change has the potential to impact, among other things, water column productivity as well as the timing, duration, and intensity of the normal freeze-thaw cycle of the tundra, therefore altering the flux of terrestrial, tundra-sourced OM to the coastal shelf. Likewise, warming of intermediate and bottom waters along the shelf and in sediments with shallow gas hydrate loadings could enhance CH4 diffusion rates to shallow sediments and elevated carbon cycling through AOM. Lastly, changes in regional sea ice extent and concentration as well as changes in the spatial and temporal distribution of the same, has the potential to alter coastal physics and sediment transport, affecting the re-distribution of OM to the sediments of the Alaskan Beaufort shelf. Understanding present contributions and distribution of OM to the sediments of coastal regions like the Alaskan Beaufort shelf will help enhance understanding of the regional carbon cycle that will be a key factor in model development for the prediction of Arctic response to future changes in climate.
Acknowledgments
Office of Naval Research Code 32 and Department of Energy, National Energy Technology Laboratory provided funding to support this research.
Author Contributions
This article is a result of the following contributions. Richard B. Coffin and Joseph P. Smith performed the experiments; Richard B. Coffin, Joseph P. Smith, Brandon Yoza, Thomas J. Boyd and Michael T. Montgomery analyzed the data; Richard B. Coffin, Joseph P. Smith, Brandon Yoza, Thomas J. Boyd and Michael T. Montgomery contributed reagents/materials/analysis tools; Richard B. Coffin wrote the paper. All authors contributed to revisions and editing of this manuscript.
Conflicts of Interest
The authors declare no conflict of interest.
References
- Ruttenberg, K.C.; Goñi, M.A. Phosphorous distribution, C:N:P ratios, and delta C-13(oc) in arctic, temperate, and tropical coastal sediments: Tools for characterizing bulk sedimentary organic matter. Mar. Geol. 1997, 139, 1–4. [Google Scholar] [CrossRef]
- Mayer, L.M.; Schick, L.L.; Allison, M.A.; Rutthenberg, K.C.; Bentley, S.J. Marine vs. terrigenous organic matter in Louisiana coastal sediments: The uses of bromine:organic carbon ratios. Mar. Chem. 2007, 107, 244–254. [Google Scholar] [CrossRef]
- Goñi, M.A.; Ruttenberg, K.C.; Eglinton, T.I. A re-assessment of the sources and importance of land-derived organic matter in surface sediment from the Gulf of Mexico. Geochem. Cosmochim. Acta 1998, 62, 3055–3075. [Google Scholar] [CrossRef]
- Bianchi, T.S.; Mitra, S.; McKee, B.A. Sources of terrestrially-derived organic carbon in lower Mississippi River and Louisiana shelf sediments: Implications for differential sedimentation and transport at the coastal margin. Mar. Chem. 2002, 77, 211–223. [Google Scholar] [CrossRef]
- Gordon, E.S.; Goñi, M.A. Controls on the distribution and accumulation of terrigenous organic matter in sediments from the Mississippi and Atchafalaya river margin. Mar. Chem. 2004, 92, 331–352. [Google Scholar] [CrossRef]
- Szymczycha, B.; Maciejewska, A.; Winogradow, A.; Pempkowiak, J. Could submarine groundwater discharge be a significant carbon source to the southern Baltic Sea? Oceanologia 2014, 56, 327–347. [Google Scholar] [CrossRef]
- Smith, A.M.; Cave, R.R. Influence of fresh water, nutruents and DOC in two submarine-groundwaer-fed estuaries on the west of Ireland. Sci. Total Environ. 2012, 438, 260–270. [Google Scholar] [CrossRef] [PubMed]
- Wang, X.-C.; Chen, R.F.; Whelan, J.; Eglinton, T. Contribution of “Old” Carbon from Natural Marine Hydrocarbon Seeps to Sedimentary and Dissolved Organic Carbon Pools in the Gulf of Mexico. Geophys. Res. Lett. 2001, 28, 3313–3316. [Google Scholar] [CrossRef]
- Joye, S.B.; Boetius, A.; Orcutt, B.N.; Montoya, J.P.; Schulz, H.N.; Erickson, M.J.; Lugo, S.K. The anaerobic oxidation of methane and sulfate reduction in sediments from Gulf of Mexico Cold seeps. Chem. Geol. 2004, 205, 219–238. [Google Scholar] [CrossRef]
- Paull, C.K.; Ussler III, W.; Lorenson, T.; Winters, W.; Dougherty, J. Geochemical constraints on the distribution of gas hydrates in the Gulf of Mexico. Geo Mar. Lett. 2005, 25, 273–280. [Google Scholar] [CrossRef]
- Ruppel, C.; Dickens, G.R.; Castellini, D.G.; Gilhooly, W.; Lisarralde, D. Heat and salt inhibition of gas hydrae formation in the northern Gulf of Mexico. Geophys. Res. Lett. 2005, 3, L04605. [Google Scholar] [CrossRef]
- Coffin, R.; Hamdan, L.; Plummer, R.; Smith, J.; Gardner, J.; Hagen, R.; Wood, W. Analysis of methane and sulfate flux in methane charged sediments from the Mississippi Canyon, Gulf of Mexico. Mar. Pet. Geol. 2008, 25, 977–987. [Google Scholar] [CrossRef]
- Lapham, L.L.; Chanton, J.P.; Martens, C.S.; Sleeper, K.; Woolsey, J.R. Microbial activity in surficial sediments overlying acoustic wipeout zones at a Gulf of Mexico cold seep. Geochem. Geophys. Geosyst. 2008, 9, Q06001. [Google Scholar] [CrossRef]
- Watanabe, K.; Kuwae, T. How organic carbon derived from multiple sources contributes to carbon sequestration processes in a shallow coastal system? Glob. Chang. Biol. 2015, 21, 2612–2623. [Google Scholar] [CrossRef] [PubMed]
- De Haas, H.; van Weering, T.C.E.; de Stigter, H. Organic carbon in shelf seas: Sinks or sources, processes and products. Cont. Shelf. Res. 2002, 22, 691–717. [Google Scholar] [CrossRef]
- Milkov, A.V. Molecular and stable isotope compositions of natural gas hydrates: A revised global data set and basic interpretatons in the context of geological settings. Organ Geochem. 2005, 36, 681–702. [Google Scholar] [CrossRef]
- Coffin, R.B.; Osburn, C.L.; Plummer, R.E.; Rose, P.S.; Grabowski, K.S. Deep sediment methane incorporation into shallow sediment carbon pools in Atwater Valley, Texas-Louisiana Shelf, Gulf of Mexico. Energies 2015, 8, 1561–1583. [Google Scholar] [CrossRef]
- Ashi, J.; Tokuyama, H.; Taira, A. Distribution of methane hydrate BSRs and its implication for the prism growth in the Nankai Trough. Mar. Geol. 2002, 187, 177–191. [Google Scholar] [CrossRef]
- Faux, J.F.; Belicka, L.L.; Harvey, H.R. Organic sources and carbon sequestration in Holecene shelf sediments from the western Arctic Ocean. Cont. Shelf Res. 2011, 31, 1169–1179. [Google Scholar] [CrossRef]
- Amiel, D.; Cochran, J.K. Terrestrial and marine POC fluxes derived from 234th distributions and d13C measurements on the Mackenzie Shelf. J. Geophys. Res. 2008, 113, C03S06. [Google Scholar] [CrossRef]
- Belicka, L.L.; Harvey, H.R. The sequestration of terrestrial organic carbon in Arctic Ocean sediments: A comparison of methods and implications for regional carbon budgets. Geochim. Cosmochim. Acta 2009, 73, 6231–6248. [Google Scholar] [CrossRef]
- Coffin, R.B.; Hamdan, L.; Smith, J.P.; Plummer, R.; Millholland, L.; Larson, R. Spatial variation in shallow sediment methane source and cycling on the Alaskan Beaufort Sea. Mar. Pet. Geol. 2013, 45. [Google Scholar] [CrossRef]
- Raymond, P.A.; McClelland, J.W.; Holmes, R.M.; Zhulidov, A.V.; Mull, K.; Peterson, B.J.; Striegl, R.G.; Aiken, G.R.; Gurtovaya, T.Y. Flux and age of dissolved organic carbon exported to the Arctic Ocean: A carbon isotopic study of the five largest arctic rivers. Glob. Biogeochem. Cycles 2007, 21. [Google Scholar] [CrossRef]
- Stein, R.; Macdonald, R.W. Organic Carbon Budget: Arctic Ocean vs. Global Ocean. In The Organic Carbon Cycle in the Arctic Ocean; Springer: Berlin, Germany, 2004; pp. 315–322. [Google Scholar]
- Naidu, A.S.; Cooper, L.W.; Finney, B.P.; Macdonald, R.W.; Alexander, C.; Semiletov, I.P. Organic carbon isotope ratios (d13C) of Arctic Ameraisan Continental shelf sediments. Int. J. Earth Sci. 2000, 89, 522–532. [Google Scholar] [CrossRef]
- Peterson, B.J.; Holmens, R.M.; McClelland, J.W.; Vörösmarty, C.J.; Lammers, R.B.; Shiklomanov, A.I.; Shklomanov, I.A.; Rahmstorf, S. Increasing River Discharde to the Arctic Ocean. Science 2002, 298, 2171–2173. [Google Scholar] [CrossRef] [PubMed]
- Magen, C.; Chaillou, G.; Crowe, S.A.; Mucci, A.; Sunby, B.; Gao, A.; Makabe, R.; Sasaki, H. Origin and fate of particulate organic matter in the sourthern Beaufort Sea—Amundsen Gulf region, Canadian Arctic. Estuar. Coast Shelf Sci. 2010, 86, 31–41. [Google Scholar] [CrossRef]
- Griffith, D.R.; McNichol, A.P.; Xu, L.; McLaughlin, R.A.; Macdonald, R.W.; Brown, K.A.; Eglinton, T.I. Carbon dynamics in the western Arctic Ocean: Insights from full-depth carbon isotope profiles of DIC, DIC and POC. Biogeosciences 2012, 9, 1217–1224. [Google Scholar] [CrossRef]
- Coffin, R.B.; Hamdan, L.J.; Smith, J.P.; Rose, P.S.; Plummer, R.E.; Yoza, B.; Pecher, I.; Montgomery, M.T. Contribution of Vertical Methane Flux to Shallow Sediment Carbon Pools across Porangahau Ridge, New Zealand. Energies 2014, 7, 5332–5356. [Google Scholar] [CrossRef]
- Treude, T.; Krause, S.; Schweers, J.; Dale, A.W.; Coffin, R.B.; Hamdan, L.J. Sulfate reduction and methane oxidation activity below the sulphate-methane transition zone in Alaska Beaufort continental margin sediments: Implications on deep sulphur cycling. Geochimica et Cosmochimica Acta 2014, 144, 217–237. [Google Scholar] [CrossRef]
- Lorenson, T.; Greinert, J.; Coffin, R. Dissolved methane in the Beaufort Sea and the Arctic Ocean, 1992–2009; Sources and atmospheric flux. Limnol. Oceannogr. 2016, 61, S300–S323. [Google Scholar] [CrossRef]
- Aller, R.C.; Blair, N.E. Carbon remineralization in the Amazon-Guianas tropical mobile mudbelt: A sedimentary incinerator. Cont. Shelf Res. 2006, 26, 2241–2259. [Google Scholar] [CrossRef]
- Aller, R.C.; Blair, N.E.; Brunskill, G.J. Early diagenetic cycling, incineration, and burial of sedimentary organic carbon in the central Gulf of Papus (Papua New Guinea). J. Geophys. Res. 2008, 113. [Google Scholar] [CrossRef]
- Andreassen, K.; Hart, P.E.; Grantz, A. Seismic studies of a bottom simulating reflection related to gas hydrate beneath the continental margin of the Beaufort Sea. J. Geophys. Res. 1995, 100, 12659–12673. [Google Scholar] [CrossRef]
- Goñi, M.A.; Yunker, M.B.; Macdonald, R.W.; Eglington, T.I. Distribution and sources of organic biomarkers in arctic sediments from the Mackenzie River and Beaufort Shelf. Mar. Chem. 2000, 71, 23–51. [Google Scholar] [CrossRef]
- Carmack, E.C.; MacDonald, R.W. Oceanography of the Canadian shelf of the Beaufort Sea: A setting for marine life. Arctic 2002, 56, 29–45. [Google Scholar] [CrossRef]
- Engles, J.L.; Edwards, M.H.; Polyak, L.; Johnson, P.D. Seafloor evidence for ice shelf flow across the Alaska-Beaufort margin of the Arctic Ocean. Earth Surf. Process. Landf. 2008, 33, 1047–1063. [Google Scholar] [CrossRef]
- Dunton, K.H.; Weingartner, T.; Carmack, E.C. The near shore western Beaufort Sea ecosystem: Circulation and importance of terrestrial carbon in arctic coastal food webs. Prog. Oceanogr. 2006, 71, 362–378. [Google Scholar] [CrossRef]
- Coffin, R.B.; Hamdan, L.J.; Smith, J.P.; Plummer, R.E.; Millholland, C.; Larson, R.; Wood, W. Beaufort Sea Methane Hydrate Exploration: Energy and Climate Change; Technical Memorandum, NRL/MR/6110-10-9330; US Naval Research Laboratory: Washington, DC, USA, 2010. [Google Scholar]
- Borowski, W.S.; Paull, C.K.; Ussler, W., III. Global and local variations of interstitial sulfate gradients in deep-water, continental margin sediments: Sensitivity to underlying methane and gas hydrates. Mar. Geol. 1999, 159, 131–154. [Google Scholar] [CrossRef]
- Dickens, G.R.; Koelling, M.; Smith, D.C.; Schnieders, L.; the IODP Expedition 302 Scientists. Rhizon Sampling of Pore Waters on Scientific Drilling Expeditions: An Example from the IODP Expeditionn 302, Arctic Coring Expedition (ACEX). Scientific Drill. 2007, 4, 22–25. [Google Scholar] [CrossRef]
- Hoehler, T.M.; Borowski, W.S.; Alperin, M.J.; Rodriguez, N.M.; Paull, C.K. 8. Model, Stable Isotope, and Radiotracer Characterization of Anaerobic Methane Oxidation in Gas Hydrate-Bearing Sediment of the Blake Ridge. Proc. Ocean Drill. Progr. Sci. Results 2000, 164, 79–85. [Google Scholar]
- Osburn, C.L.; St-Jean, G. The use of wet chemical oxidation with high-amplification isotope ratio mass spectrometry (WCO-IRMS) to measure stable isotope values of dissolved organic carbon in seawater. Limnol. Oceanogr. Methods 2007, 5, 296–308. [Google Scholar] [CrossRef]
- Blair, N.E.; Leithold, E.L.; Ford, S.T.; Peeler, K.A.; Holmes, J.C.; Perkey, W.W. The persistence of memory: The fate of ancient sedimentatry organic carbon in a modern sedimentary system. Geochim. Cosmochim. Acta 2003, 67, 63–73. [Google Scholar] [CrossRef]
- Reimnitz, E.; Barnes, P.W.; Toimil, L.J.; Melchior, J. Ice gouge recurrence and rates of sediment reworking, Beaufort Sea, Alaska. Geology 1997, 5, 405–408. [Google Scholar] [CrossRef]
- Sallon, A.; Michel, C.; Gosselin, M. Summertime primary production and carbon export in the southeastern Beaufort Sea during the low ice year of 2008. Polar Biol. 2011, 34, 1989–2005. [Google Scholar] [CrossRef]
- Belicka, L.L.; Macdonald, R.W.; Yunker, M.B.; Harvey, H.R. The role of depositional regime on carbon transport and preservation in Arctic Ocean sediments. Mar. Chem. 2004, 86, 65–68. [Google Scholar] [CrossRef]
- Belicka, L.L.; Macdonald, R.W.; Harvey, H.R. Trace element and molecular markers of organic carbon dynamics along a shelf-basin continuum in sediment of the western Arctic Ocean. Mar. Chem. 2009, 115, 72–85. [Google Scholar] [CrossRef]
- Macdonald, R.W.; Solomon, S.M.; Cranston, R.E.; Welch, H.E.; Yunker, M.B.; Gobeil, C. A sediment and organic carbon budget for the Canadian Beaufort Shelf. Mar. Geol. 1998, 144, 255–273. [Google Scholar] [CrossRef]
- Naidu, A.S.; Mowatt, T.C. Sources and dispersal patterns of clay minerals in surface sediments from the continental-shelf areas off Alaska. GSA Bull. 1983, 94, 841–854. [Google Scholar] [CrossRef]
- Smith, J.P.; Coffin, R.B. Methane flux and authigenic carbonate in shallow sediments overlying methane hydrate bearing strata in Alaminos Canyon, Gulf of Mexico. Energies 2014, 7, 6118–6141. [Google Scholar] [CrossRef]
- Jorgenson, M.T.; Brown, J. Classification of the Alaskan Beaufort Sea Coast and estimation of carbon and sediment inputs from coastal erosion. Geo Mar. Lett. 2005, 25, 69–80. [Google Scholar] [CrossRef] [Green Version]
- Darby, D.A. Sources of sediment found in sea ice from the western Arcitc Ocean, new insights into processes of entrainment and drift patterns. J. Geophys. Res. 2003, 108, 3257. [Google Scholar] [CrossRef]
- Van Dongen, B.E.; Semiletov, I.; Weijers, J.W.H.; Gustafsson, Ö. Contrasting lipid biomarker compositin of terrestrial organic matter exported from across the Eurasian Arctic by the five great Russian Arcctic rivers. Glob. Biogeochem. Cycles 2008, 22, GB1011. [Google Scholar] [CrossRef]
- Pohlman, J.W.; Bauer, J.E.; Waite, W.F.; Osburn, C.L.; Chapman, N.R. Methane hydrate-bearing seeps as a source of aged dissolved organic carbon to the oceans. Nat. Geosci. 2010. [Google Scholar] [CrossRef]
- Collister, J.W.; Rieley, G.; Stern, B.; Eglington, G.; Fry, B. Compound-specific δ13C analyses of leaf lipids from plants with differing carbon dioxide metabolisms. Org. Geochem. 1994, 21, 619–627. [Google Scholar] [CrossRef]
- Drenzek, N.J.; Montluçon, D.B.; Yunker, M.B.; Macdonald, R.W.; Eglinton, T.I. Constraints on the origin of sedimentatry organic carbon in the Beaufort Sea from coupled molecular 13C and 14C measurements. Mar. Chem. 2007, 103, 146–162. [Google Scholar] [CrossRef]
Figure 1.
Map showing study area and piston core (PC) and vibrocore (VC) locations along three nearshore-to-offshore transects (from east-to-west: Hammerhead, Thetis Island, Cape Halkett) across the Alaskan Beaufort Sea shelf during the 2009 Methane in the Arctic Shelf/Slope (MITAS) expedition.
Figure 1.
Map showing study area and piston core (PC) and vibrocore (VC) locations along three nearshore-to-offshore transects (from east-to-west: Hammerhead, Thetis Island, Cape Halkett) across the Alaskan Beaufort Sea shelf during the 2009 Methane in the Arctic Shelf/Slope (MITAS) expedition.

Figure 2.
Measured sediment organic carbon to total nitrogen ratios (TOC:TSN); porewater chloride (mM), and sediment porosity (φ) plotted vs. depth (cm) in the sediment below seafloor (cmbsf) for sediment cores collected along the North Slope of Alaska on the Beaufort Sea. Sediment core profiles are separated into three distinct sampling transects (Cape Halkett, Thetis Island and Hammerhead) and displayed by relative location west-to-east (left-to-right) and offshore-to-nearshore (top-to-bottom) on the North Slope. The blue dashed line presented in plots with a measured SMT represents the depth reported in Table 1. The red line in each transect indicates the relative location of the shelf-break for each coring transect (Figure 1).
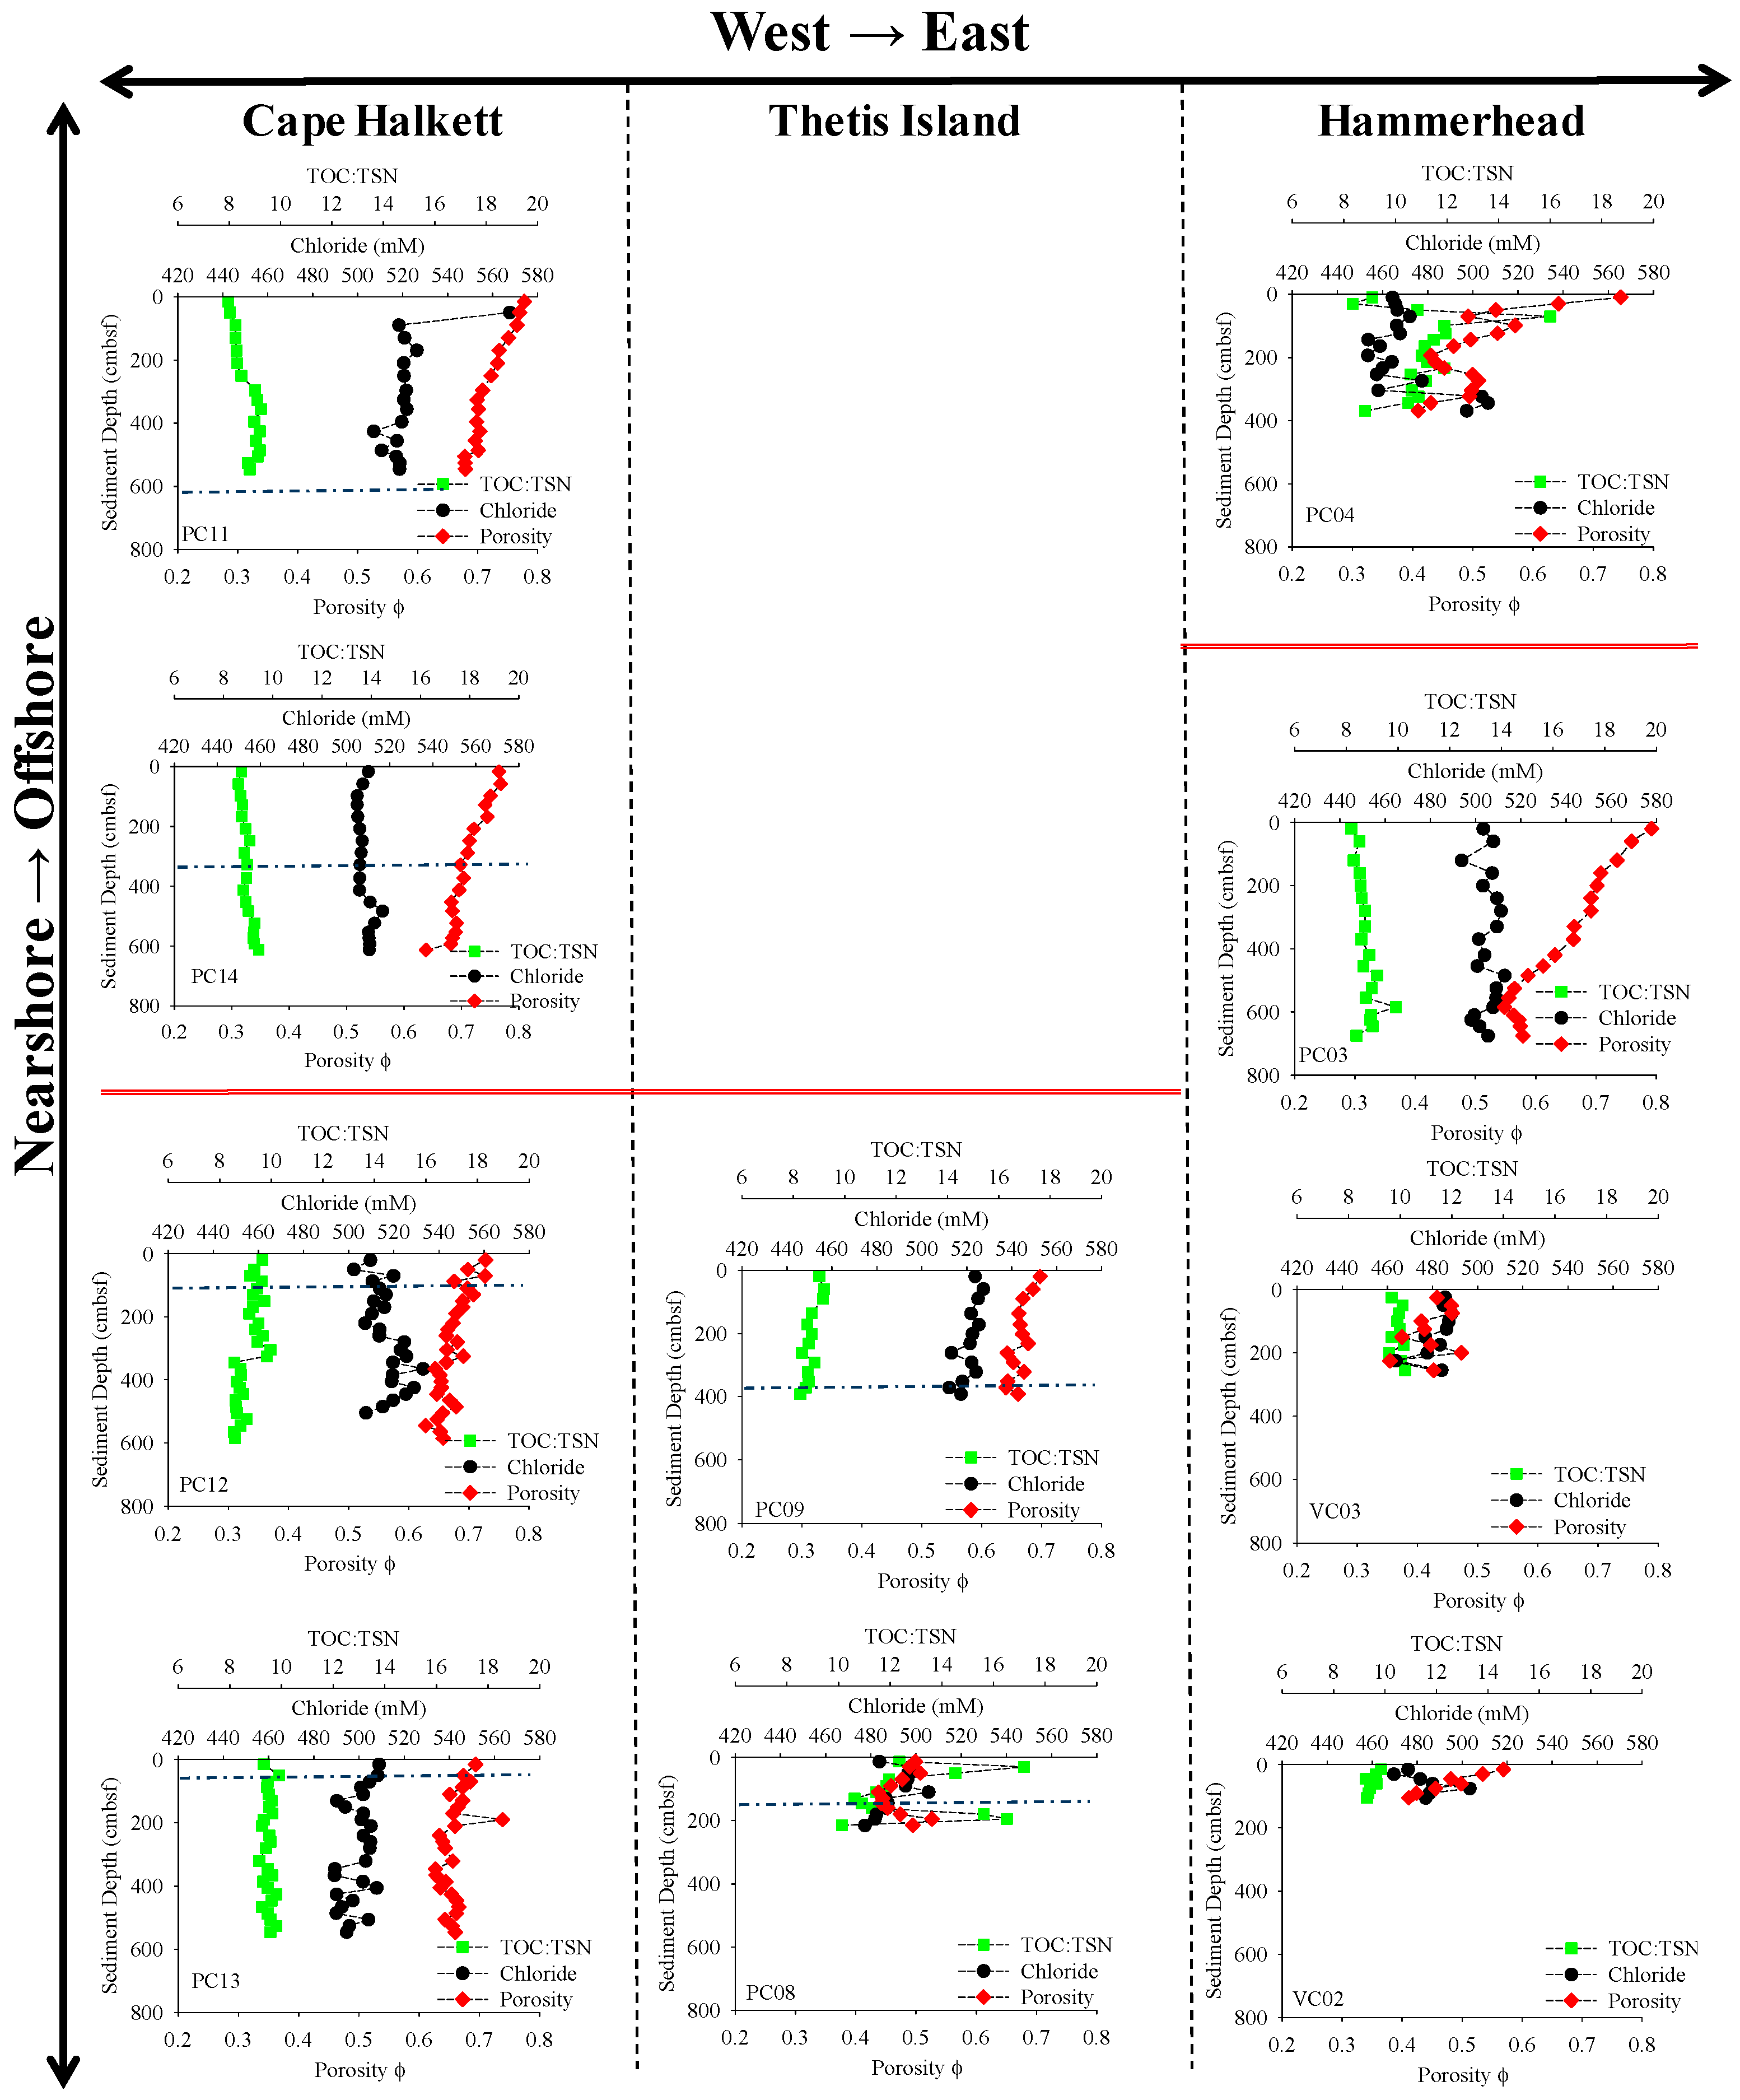
Figure 3.
Sediment organic carbon (%TOC) and inorganic carbon (%TIC), expressed as % dry weight, and the δ13C ratio of each fraction, δ13CTOC and δ13CTIC, respectively, plotted vs. depth (cm) in the sediment below seafloor (cmbsf) for cores collected along the North Slope of Alaska on the Beaufort Sea. Core profiles are separated into three distinct sampling transects (Cape Halkett, Thetis Island and Hammerhead) and displayed by relative location west-to-east (left-to-right) and offshore-to-nearshore (top-to-bottom) on the North Slope. The blue dashed line presented in plots with a measured SMT represents the depth reported in Table 1. The red line in each transect indicates the relative location of the shelf-break for each coring transect (Figure 1).
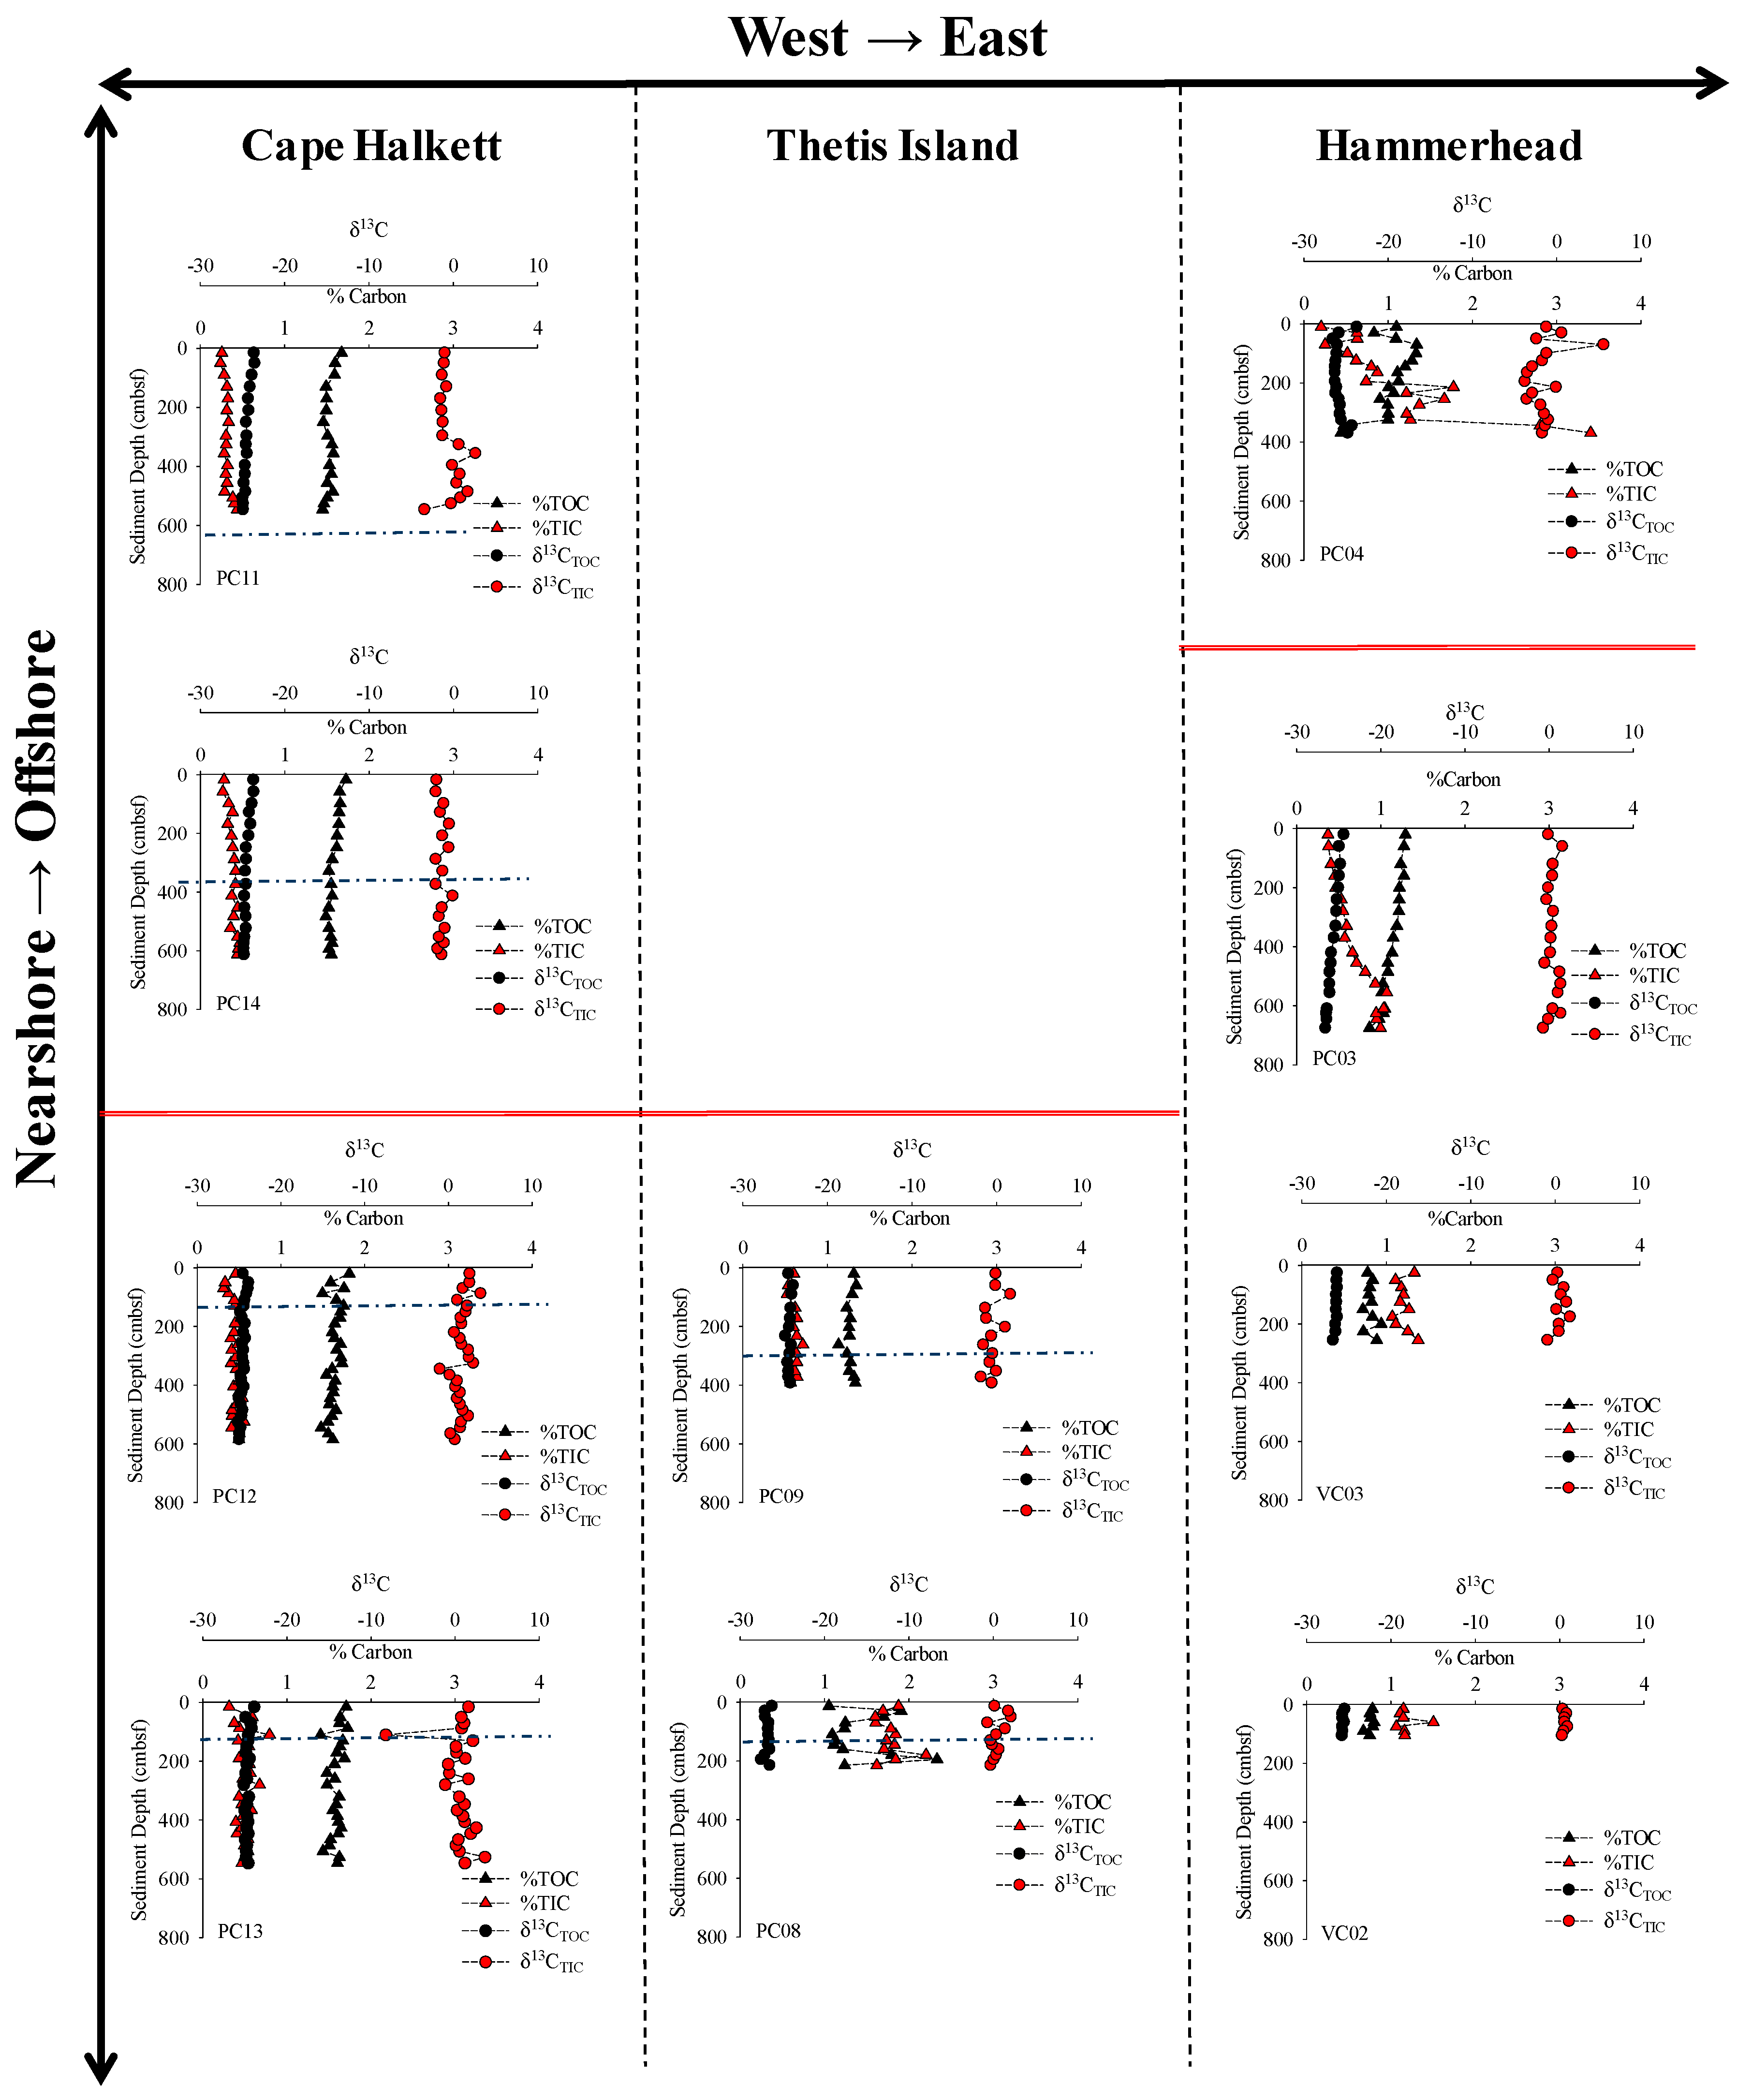
Figure 4.
Sediment % total sediment nitrogen (TSN) and δ15N plotted vs. depth (cm) in the sediment below seafloor (cmbsf) for cores collected along the North Slope of Alaska on the Beaufort Sea. Core profiles are separated into three distinct sampling transects (Cape Halkett, Thetis Island and Hammerhead) and displayed by relative location west-to-east (left-to-right) and offshore-to-nearshore (top-to-bottom) on the North Slope. The blue dashed line presented in plots with a measured SMT represents the depth reported in Table 1. The red line in each transect indicates the relative location of the shelf-break for each coring transect (Figure 1).
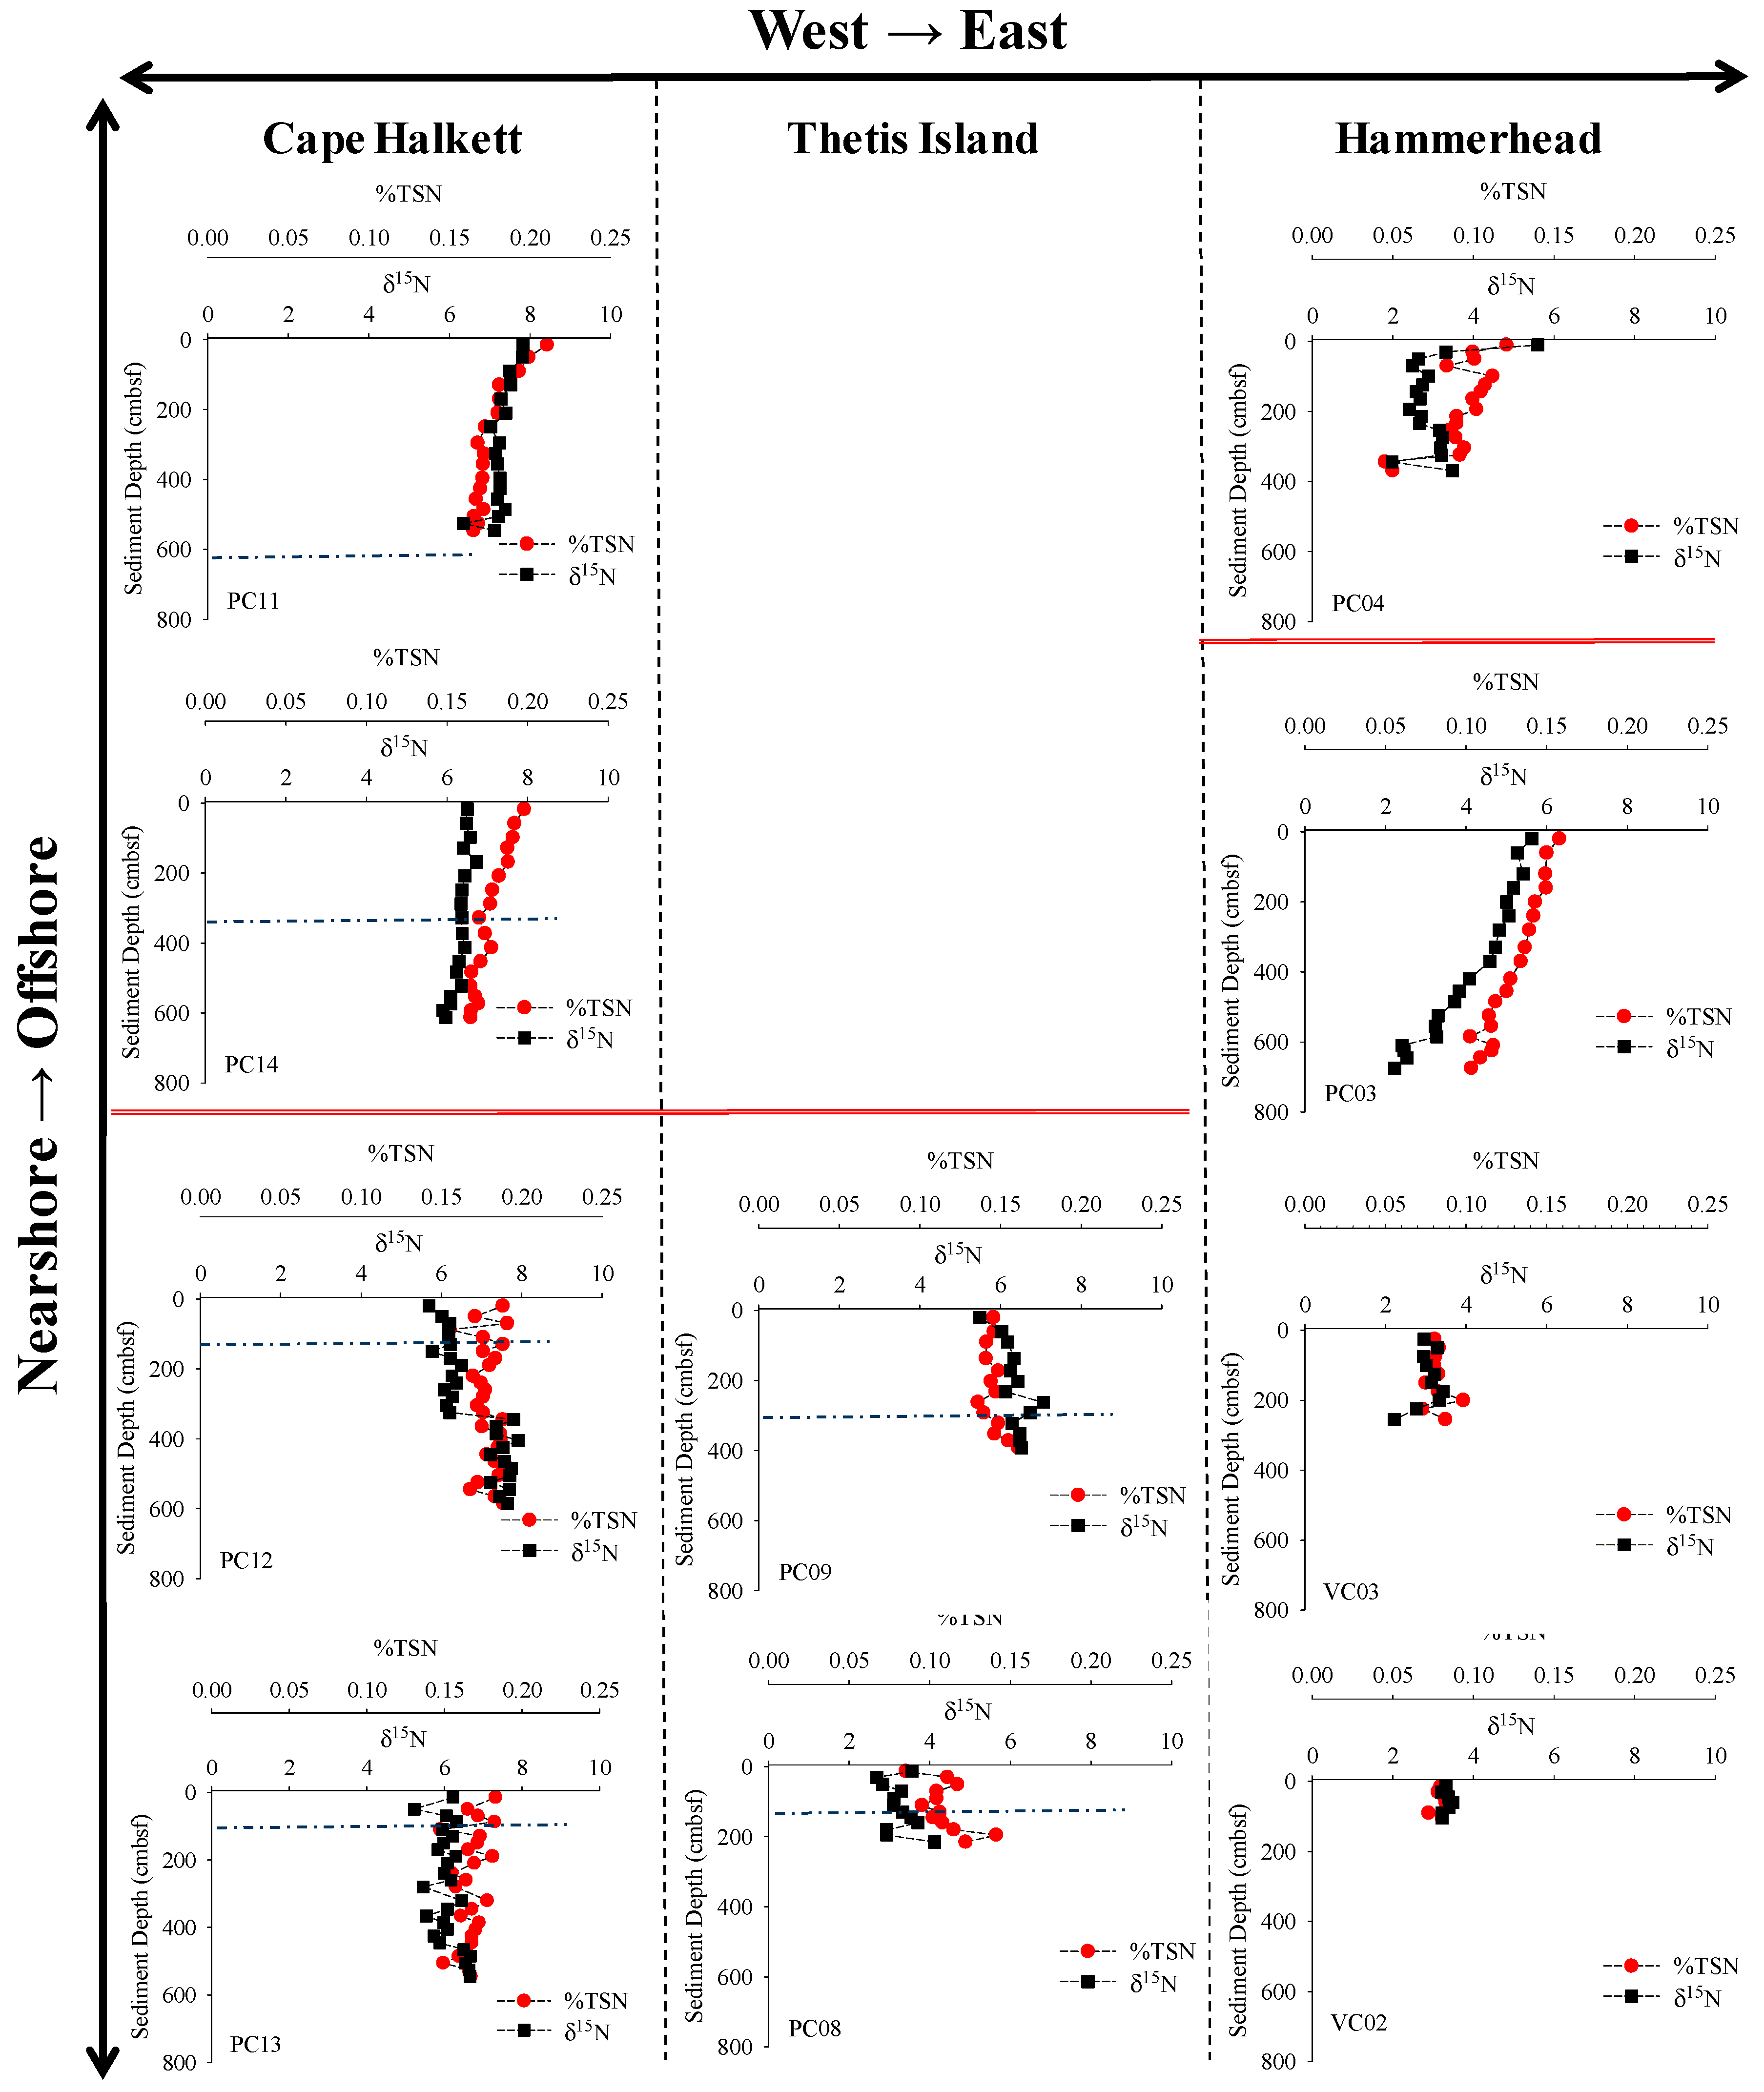
Figure 5.
Porewater profiles for dissolved organic carbon (DOC) concentration (mM C) and δ13CDOC plotted vs. depth (cm) in the sediment below seafloor (cmbsf) for cores collected along the North Slope of Alaska on the Beaufort Sea. Core profiles are separated into three distinct sampling transects (Cape Halkett, Thetis Island and Hammerhead) and displayed by relative location west-to-east (left-to-right) and offshore-to-nearshore (top-to-bottom) on the North Slope. The blue dashed line presented in plots with a measured SMT represents the depth reported in Table 1. The red line in each transect indicates the relative location of the shelf-break for each coring transect (Figure 1). Data on DOC concentration and δ13CDOC values are not presented for stations Hammerhead offshore station PC09 and Thetis offshore station PC04 because sufficient porewater volumes could not be obtained during sampling.
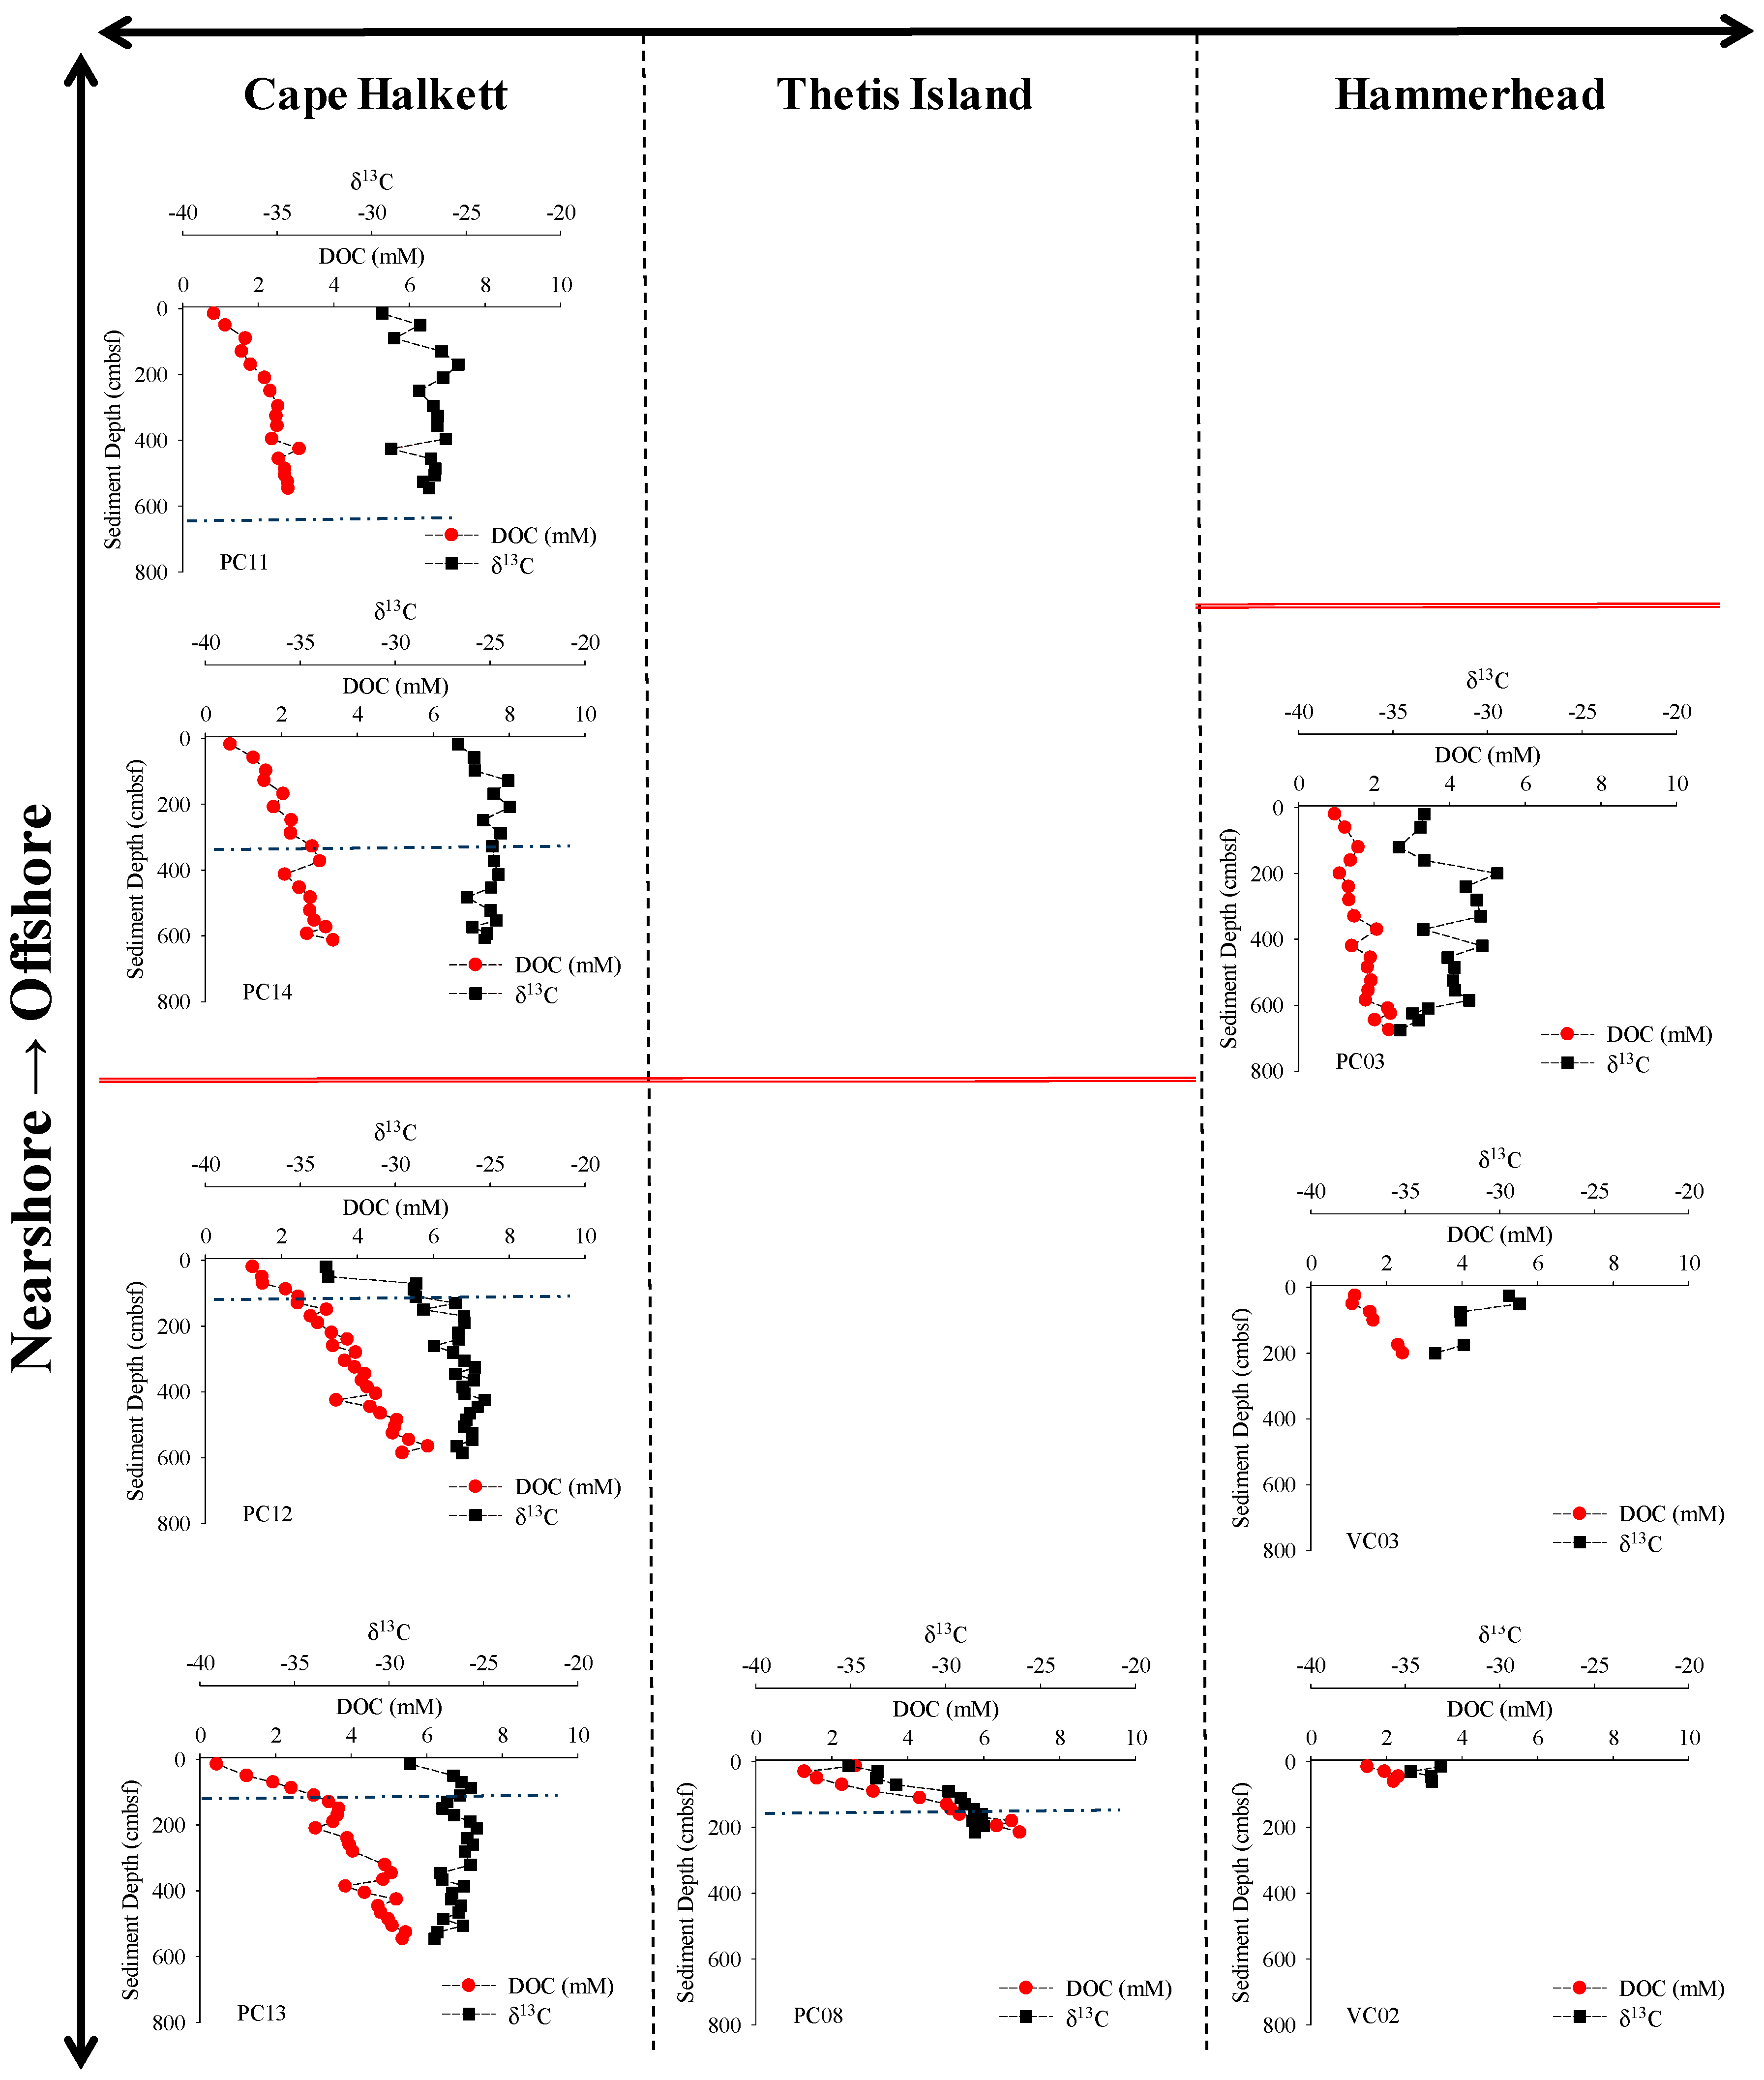
Figure 6.
Plot of measured δ13CTOC × %TOC concentrations vs. %TOC concentrations in sediment cores collected along the North Slope of Alaska on the Beaufort Sea. Data are grouped into four data sets: Hammerhead Nearshore and Offshore; Thetis Island; Cape Halkett above and below the SMT (Figure 1). The slope of the linear fit to each data set is presented below the plot (Equation (4)).
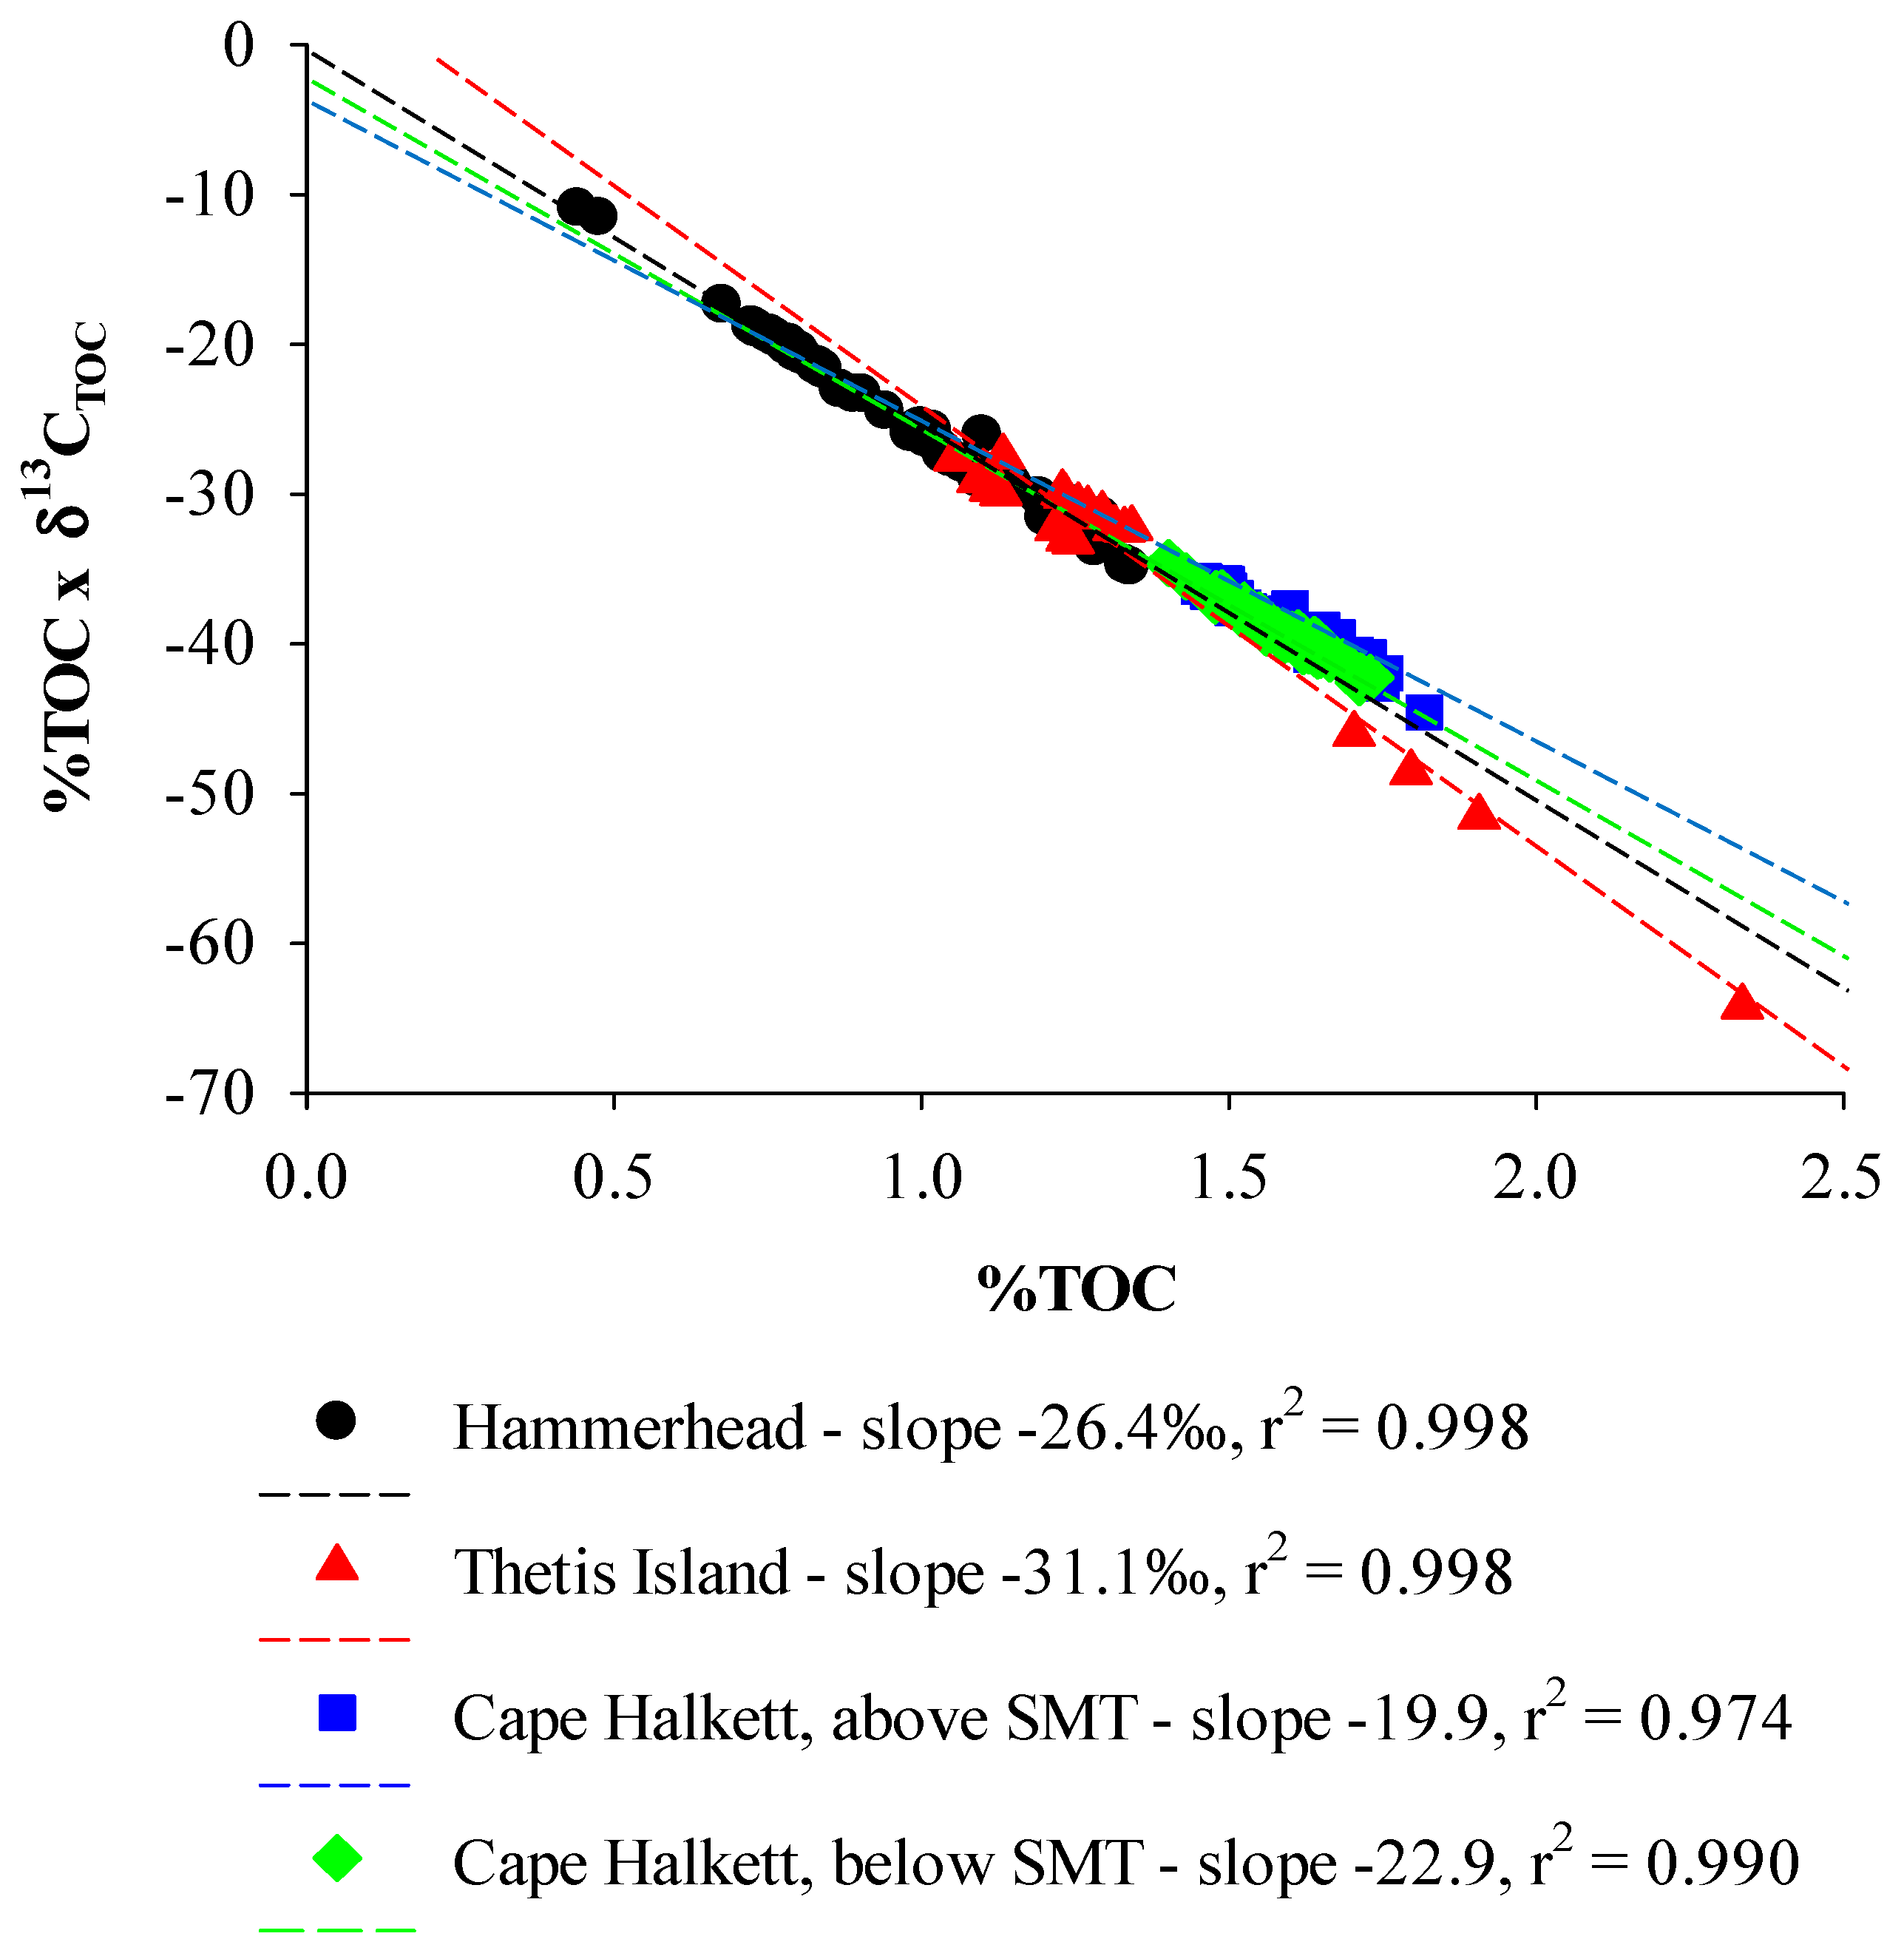
Figure 7.
Plot of measured δ13CDOC × DOC concentrations vs. DOC concentrations in sediment cores collected along the North Slope of Alaska on the Beaufort Sea. Data are grouped into four data sets: Hammerhead Nearshore and Offshore; Thetis Island; Cape Halkett above and below the SMT (Figure 1). The slope of the linear fit to each data set is presented below the plot (Equation (4)).


Table 1.
A review of sediment coring locations, water column depth (m), estimated sulfate methane transition (SMT) depth in centimeters below sea floor (cmbsf), and calculated downward SO42− flux the vertical CH4 flux estimate from sulfate (SO42−) profiles. CH4 and SO42− data are published in Coffin et al. [22].
| CORE ID | Latitude | Longitude | Water Depth (m) | SMT (cmbsf) | SO42− Flux (mmol m−2 a−1) |
|---|---|---|---|---|---|
| VC02 | 70°21.6448′ N | 146°00.4635′ W | 20 | nd | −15.4 |
| VC03 | 70°15.34210′ N | 146°04.69180′ W | 22 | nd | −15.2 |
| PC03 | 70°58.47840′ N | 145°29.21420′ W | 490 | nd | −6.1 |
| PC04 | 71°11.98460′ N | 145°14.95110′ W | 2077 | nd | −2.1 |
| PC08 | 71°12.44330′ N | 149°13.46600′ W | 144.5 | 179 | −100.1 |
| PC09 | 71°13.14430′ N | 149°13.23340′ W | 306 | 351 | −37.7 |
| PC11 | 71°46.68280′ N | 151°52.70670′ W | 1458 | 629 | −27.4 |
| PC12 | 71°32.97120′ N | 152°03.68110′ W | 342 | 147 | −124.7 |
| PC13 | 71°31.86300′ N | 152°04.75420′ W | 280 | 106 | −154.8 |
| PC14 | 71°37.64200′ N | 151°59.29430′ W | 1005 | 373 | −44.2 |
© 2017 by the authors. Licensee MDPI, Basel, Switzerland. This article is an open access article distributed under the terms and conditions of the Creative Commons Attribution (CC BY) license (http://creativecommons.org/licenses/by/4.0/).
Share and Cite
MDPI and ACS Style
Coffin, R.B.; Smith, J.P.; Yoza, B.; Boyd, T.J.; Montgomery, M.T. Spatial Variation in Sediment Organic Carbon Distribution across the Alaskan Beaufort Sea Shelf. Energies 2017, 10, 1265. https://doi.org/10.3390/en10091265
AMA Style
Coffin RB, Smith JP, Yoza B, Boyd TJ, Montgomery MT. Spatial Variation in Sediment Organic Carbon Distribution across the Alaskan Beaufort Sea Shelf. Energies. 2017; 10(9):1265. https://doi.org/10.3390/en10091265
Chicago/Turabian StyleCoffin, Richard B., Joseph P. Smith, Brandon Yoza, Thomas J. Boyd, and Michael T. Montgomery. 2017. "Spatial Variation in Sediment Organic Carbon Distribution across the Alaskan Beaufort Sea Shelf" Energies 10, no. 9: 1265. https://doi.org/10.3390/en10091265
Note that from the first issue of 2016, this journal uses article numbers instead of page numbers. See further details here.