Experimental Investigation of the Condensation Heat Transfer Coefficient of R134a inside Horizontal Smooth and Micro-Fin Tubes

Institute of Refrigeration and Cryogenics, University of Shanghai for Science and Technology, Shanghai 200093, China
*
Author to whom correspondence should be addressed.
Energies 2017, 10(9), 1280; https://doi.org/10.3390/en10091280
Submission received: 3 August 2017
/
Revised: 22 August 2017
/
Accepted: 23 August 2017
/
Published: 28 August 2017
Abstract
:The condensation heat transfer coefficient of R134a was experimentally studied inside two smooth and four micro-fin tubes. The working conditions and structural parameters of the test tubes were selected as the influencing factors, and the experiment was conducted under mass velocities of 400–1100 kg·m−2·s−1, condensation temperatures of 35–45 °C and water-testing Reynolds numbers of 8000–22,000, with an inlet superheat of 1–2 °C and outlet subcooling of 1–2 °C at the test section for the refrigerant. Experimental results indicate that the heat transfer coefficient increases with increasing mass velocity and decreasing condensation temperature and water-testing Reynolds number. The heat transfer coefficient of the micro-fin tube with a helix angle of 28° is the highest and that of smooth tube is the lowest for test tubes with the same inner diameter. Tube diameter has a small influence on the heat transfer coefficient for the smooth tubes while the heat transfer coefficient increases with decreasing tube diameter for the micro-fin tubes. The heat transfer coefficient inside the test tube was compared with some well-known existing correlations, and results show that correlations by Cavallini et al., Thome et al., Shah and Akers et al. can estimate the experimental data with mean absolute deviation of less than 30%, and correlations of Dobson and Chato et al. and Jung et al. cannot be used to capture the heat transfer coefficient with mean absolute deviations of 140.18% and 146.23%, respectively. While the Miyara et al. correlation overestimates the heat transfer coefficient, correlations of Cavallini et al., Koyama et al. and Oliver et al. all underestimate the experimental data for the micro-fin tube. Their deviations are from 25 to 55% for micro-fin tubes 3 and 4, while their deviations keep to within 30% for micro-fin tubes 5 and 6. Finally, to improve the correlation prediction accuracy, a dimensionless parameter was introduced to the correlations of Dobson and Chato et al. and Jung et al., and correlations of Cavallini et al., Koyama et al. and Oliver et al. were modified by enhancing the turbulence effect. The prediction accuracy of all modified correlations can be controlled to within 30%.
1. Introduction
In the literature it is agreed that condensation heat transfer is closely associated with the refrigerant flow pattern inside the tube. In condensation heat transfer, the refrigerant flow pattern is mainly controlled by the vapor shear force and gravity force: a high shear force leads to the annular flow, and wavy and slug flows appear when gravity force becomes the controlling force. Several flow regime studies with various temperatures, tube diameters, mass fluxes and so on have been conducted by many scholars [1,2,3,4,5].
According to the studies on the flow pattern, many correlations [6,7,8,9,10,11,12] for predicting the heat transfer coefficient and pressure drop were proposed. They took surface tension, shear force, gravity, viscosity et al. into consideration and were certified with the experiment. For example, the Shan [6], Akers et al. [7], Thome [8], Dobson and Chato [9] and Cavallini et al. [10] correlations were presented based on the experimental data from tubes with inner diameter larger than 3 mm, and the Wang et al. [11] and Yan and Lin [12] correlations were proposed based on the heat transfer characteristics for the mini-tube.
Various enhanced tubes have been extensively used in the air-conditioning and refrigeration industries due to their outstanding results for enhancing heat transfer. Enhanced tubes, including micro-fin tubes, mini-tubes, rectangular tubes, EHT tubes (that is produced using mini/micro-scale geometric patterns on the tube surfaces, for example dimples, roughness elements) etc. improve the heat transfer efficiency primarily by adjusting the structural parameters. There are a lot of mathematical models [13,14,15,16,17,18,19,20] for predicting the heat transfer coefficient inside the enhanced tube. For example, Cavallini et al. [13] presented a computational procedure for the heat transfer coefficient inside the enhanced tube based on the Cavallini and Zecchin equation. Miyara et al. [14] concluded a preliminary correlation for the heat transfer coefficient in a herringbone-type micro-fin tube based on a condensation experiment of R410A and R22. Goto et al. [15] proposed an empirical correlation to predict the heat transfer coefficient inside various kinds of micro-fin tubes based on Koyama and Yu’s correlation. Chamra et al. [16] presented a semi-empirical condensation model for the heat transfer coefficient inside the micro-fin tubes. Kedzierski et al. [17] concluded correlations of both heat transfer and pressure drop measurements in the micro-fin tube. Olivier et al. [18] modified a correlation for predicting the heat transfer coefficient inside a helical micro-fin tube for use inside a herringbone tube. However, the increase of heat transfer coefficient is always accompanied by an increasing pressure drop. Many authors associated the two-phase frictional pressure drop with the single-phase frictional pressure drop through a two-phase multiplier that is affected by refrigerants, working conditions, surface tension, and so on. Lazarek et al. [21] and Mishima et al. [22] studied the influence of diameter on the two-phase multiplier based on the Chisholm [23] multiplier. Zhang et al. [24] performed an experiment to study two-phase pressure drop under adiabatic conditions and proposed an expression for the liquid two-phase multiplier, in which the effect of the reduced pressure was taken into account. Koyama et al. [25] added new experimental data to the database and proposed a pressure drop correlation based on the estimation of the vapor two-phase multiplier. Sun et al. [26] collected 2092 items of experimental data inside the tubes with hydraulic diameters from 0.506 mm to 12 mm and reported a new correlation for the Chisholm parameter based on the Lockhart and Martinelli method. Revellin et al. [27] also studied the two-phase flow pressure drop of R134a and R245fa inside tubes with a 0.509 mm or 0.790 mm diameter under adiabatic conditions.
Actually, although there are many available prediction correlations for predicting the heat transfer coefficient and pressure drop, many heat transfer conditions and newly developed enhanced tubes have not been yet completely characterized due to the expansion of working conditions and the emergence of various new enhanced tubes, and the most practical way is to constantly modify the existing correlations to accurately predict the heat transfer coefficient and pressure drop for all kinds of working conditions and enhanced tubes.
In the present work, the condensation heat transfer coefficient of R134a (Shanghai Baida Refrigeration Equipment Co., Ltd., Shanghai, China) was investigated inside two smooth and four micro-fin tubes. The experiment was conducted under mass velocities of 400–1100 kg·m−2·s−1, condensation temperatures of 35–45 °C and water-testing Reynolds numbers of 8000–22,000, with an inlet superheat of 1–2 °C and an outlet subcooling of 1–2 °C at the test section for refrigerant. The influences of working conditions (mass velocity, condensation temperature and water-testing Reynolds number) and structural parameters of micro-fin tube (diameter, fin height and helix angle) were analyzed, then the experimental data of the heat transfer coefficient for the test tube was compared with some well-known correlations. Finally, given that working conditions of a large mass velocity, some correlations were further modified to improve their prediction accuracy for the corresponding experimental conditions and test tubes.
2. Experimental Apparatus and Procedure
2.1. Experimental Setup
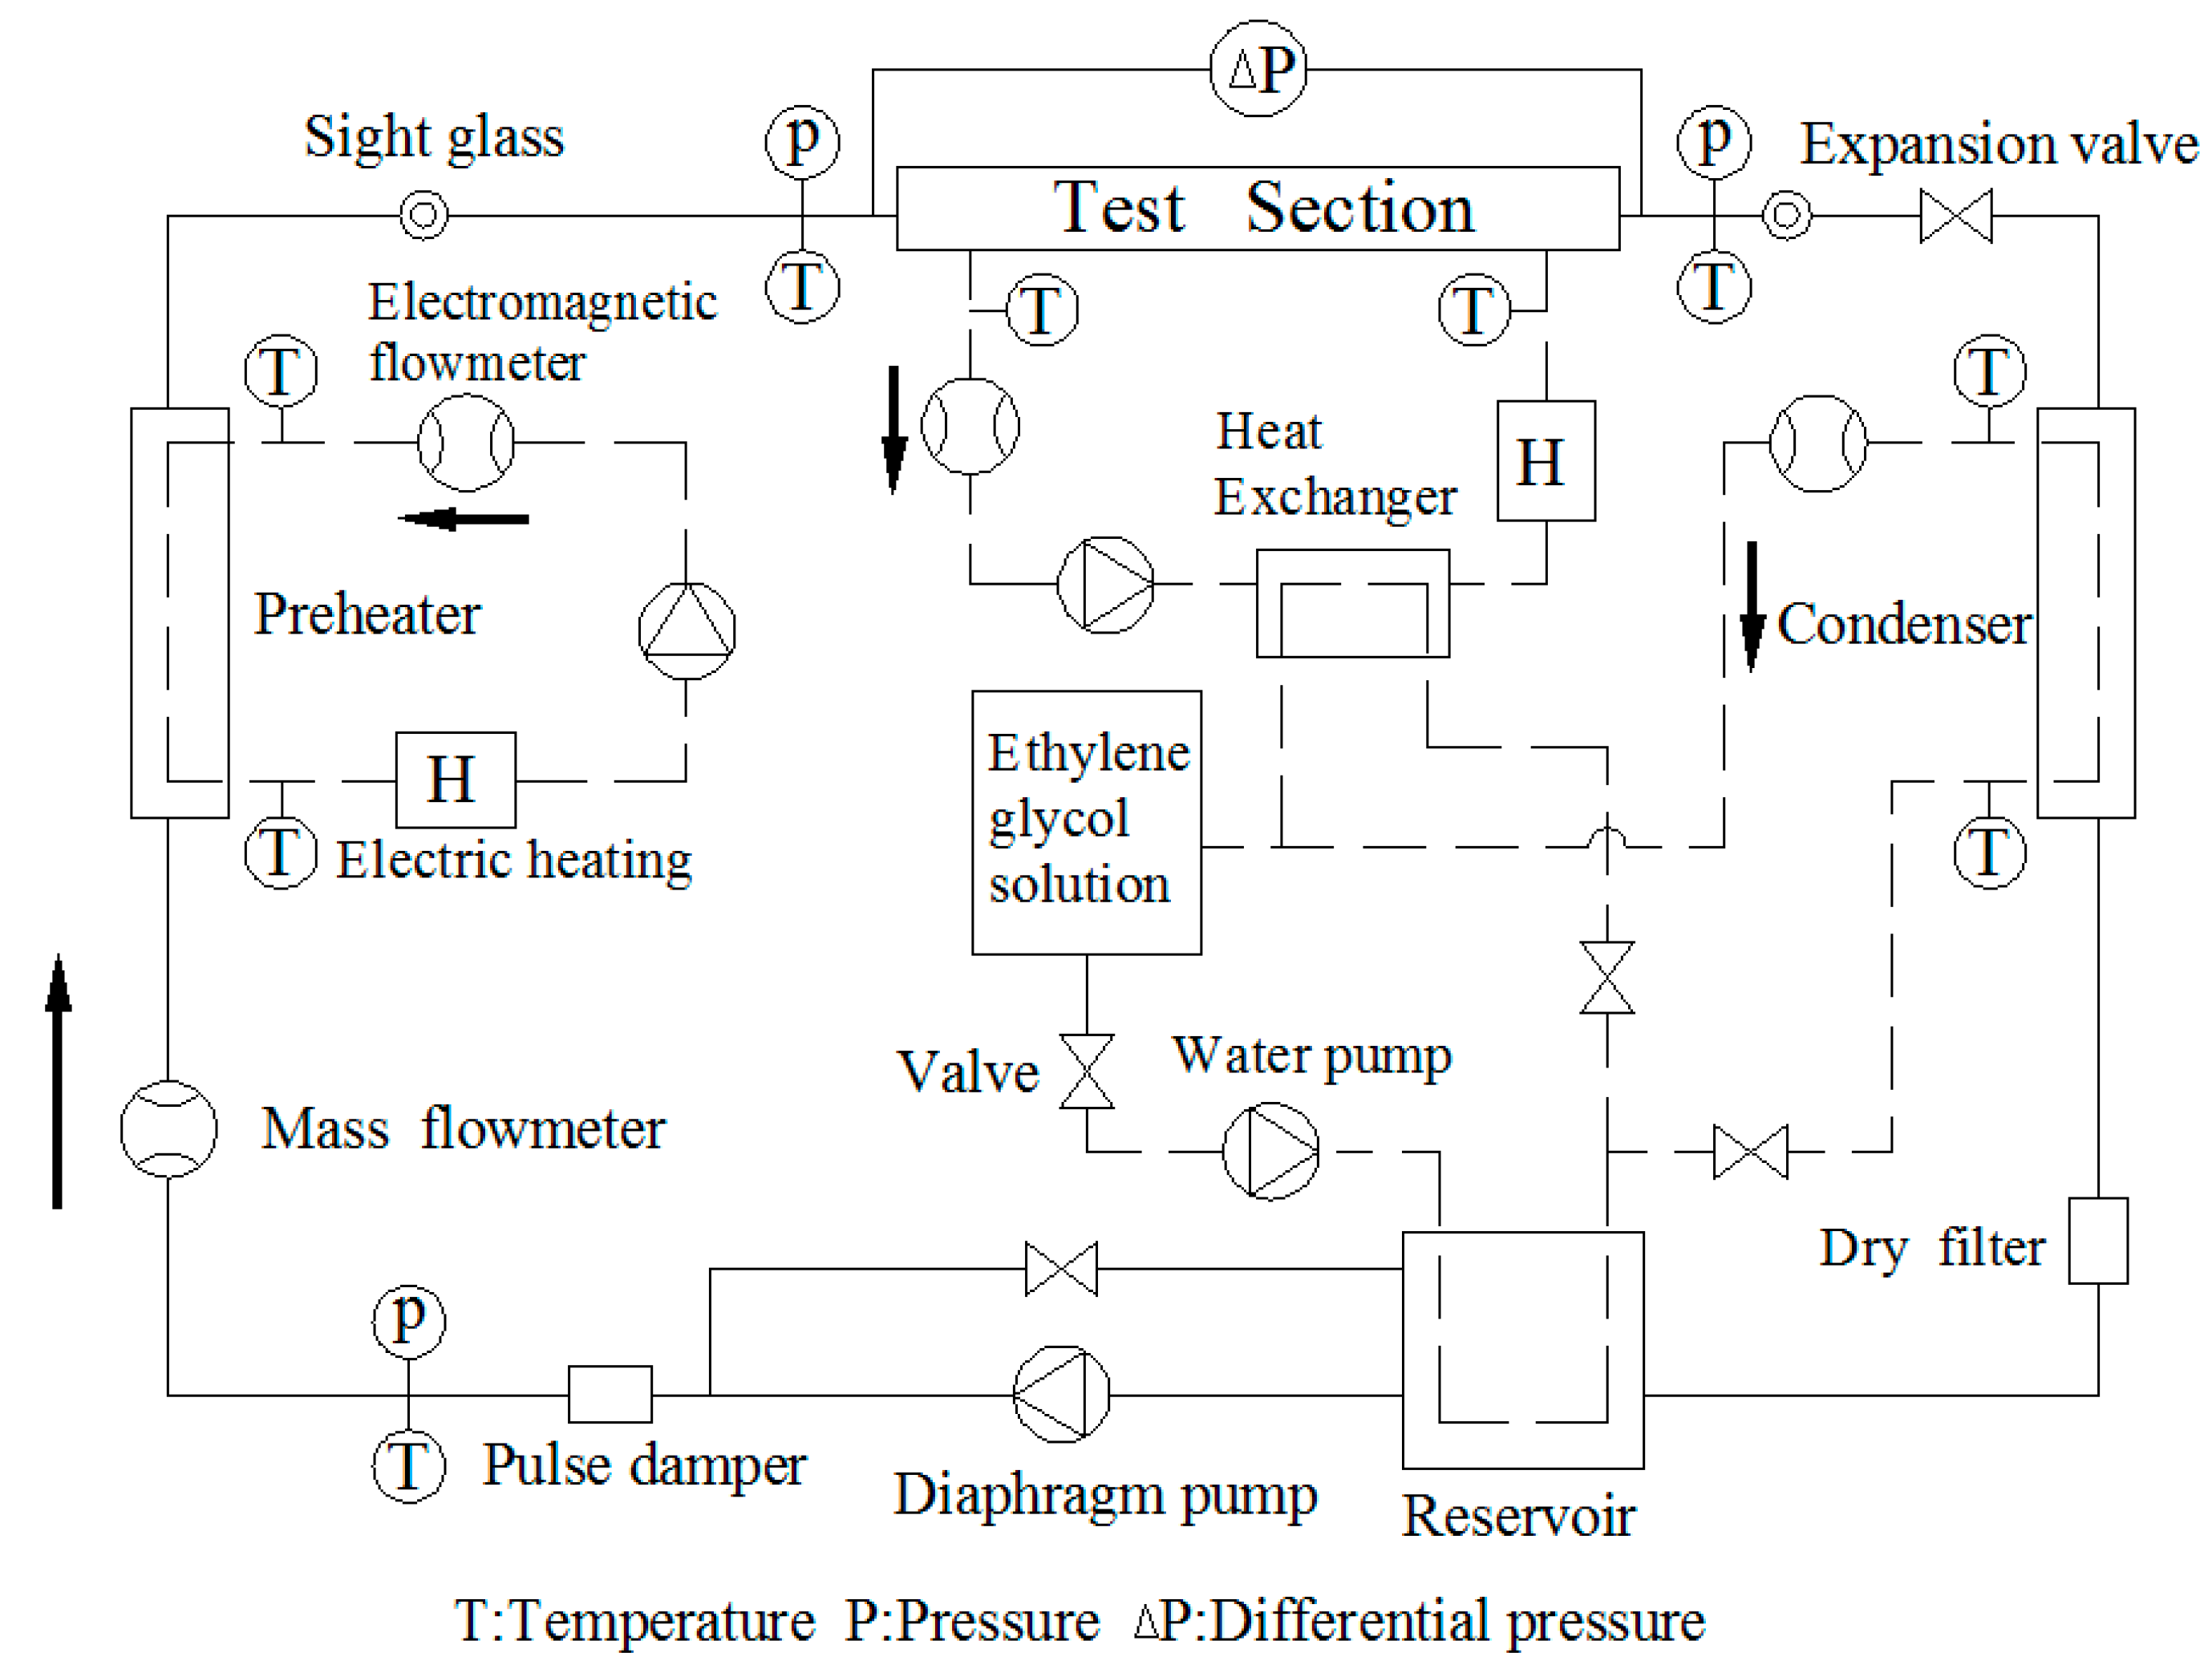
A schematic of the experimental setup designed for in-tube condensation heat transfer is shown in Figure 1. The experimental setup consists of a refrigerant loop, a water-testing loop and a water–glycol loop. The sub-cooled refrigerant in the reservoir is pumped to the mass flow meter by the diaphragm pump, and the refrigerant mass flow rate is controlled by adjusting the operating frequency and changing the piston stroke of the diaphragm pump. In the preheater, the refrigerant is heated to a desired superheat of 1–2 °C by adjusting the flow rate and inlet temperature of the water–glycol mixture. The superheated refrigerant enters the test section and is fully condensed by the water-testing loop outside. The condensation pressure is controlled by an electronic expansion valve located at the outlet of the test section. The refrigerant states can be observed through the sight glasses at the inlet and outlet of the test section. Then, the refrigerant flows to the condenser, where it is supercooled. The subcooled refrigerant eventually enters the reservoir, and the same cycle is repeated.
The water-testing loop is composed of a flow meter, pump, plate heat exchanger and electric heater, and it is used to simulate the external environment represented by water-testing Reynolds number, which is changed by adjusting the flow rate and inlet temperature of the water tests. There are three main functions of the water–glycol loop: firstly, it can provide the experimental environment of −25 °C in the preheater and condenser; secondly, it is used to transfer heat with the water-testing loop in the plate heat exchanger; and finally, it controls the two-phase refrigerant pressure in the reservoir, which is the reference pressure of the overall system.
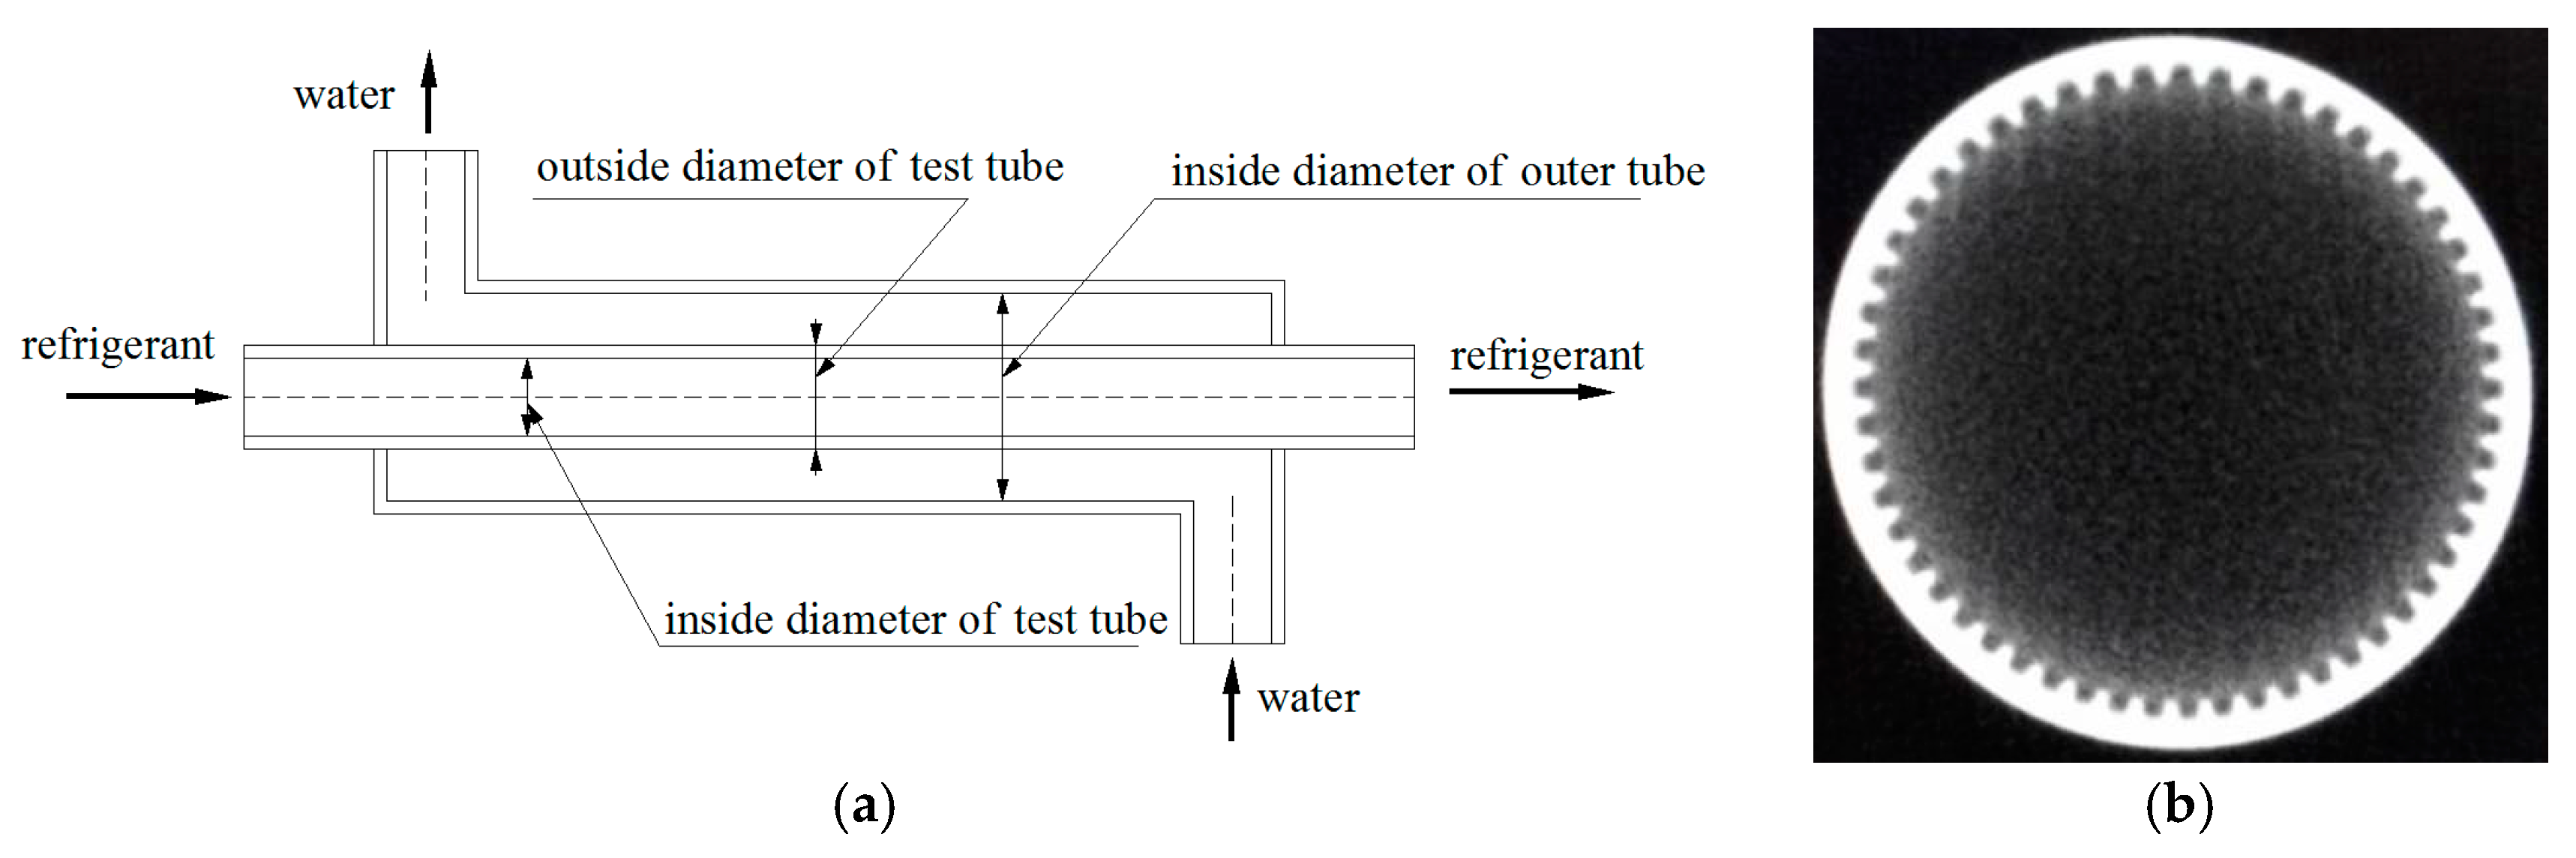
The test section is a reverse flow tube-in-tube condenser, the refrigerant flows inside the test tube while the water-testing flows in the annulus, as shown in Figure 2a. The test tube is composed of copper, and contains six types of tube: two smooth tubes with an inner diameter of 5.89 mm or 7.56 mm, two 5.89-mm fin root diameter micro-fin tubes with a helix angle of 18° or 28° and two 7.56-mm fin root diameter micro-fin tubes with an 18° or 28° helix angle. The cross-sectional dimensions of test tubes were measured using a KYKY2800 series scanning electron microscope (Tiance Optical Equipment Co., Ltd., Dongguan, China) with an accuracy of 5.5 nm, and are shown in Figure 2b. The detailed structural parameters of the test tubes are listed in Table 1.
The temperature-measuring module and the pressure-measuring module were designed to ensure the accuracy of the temperature and pressure transducers, as shown in Figure 3. The refrigerant flows against the platinum resistance in the temperature-measuring module and the thread connection are used to link the measuring module and the test tube. The refrigerant and water-testing temperatures were measured using a Pt100 temperature transducer (Shenzhen RBD Sensor Technology Co., Ltd., Shenzhen, China) with an accuracy of ±0.1 °C at the inlet and outlet of the test section. The condensation pressure was measured by an MC20A pressure transducer (Shanghai China Nuclear Auto-instrument & System Co., Ltd., Shanghai, China) located at the outlet of the test section with an accuracy of ±0.1%, and the measurement range was fixed at 0–4.2 MPa. The pressure drop across the test section was measured by an EJA110A differential pressure transducer (Shanghai China Nuclear Auto-instrument & System Co., Ltd., Shanghai, China) that was configured in the range of 0–150 kPa with an accuracy of ±0.1%. The two-phase refrigerant pressure in the reservoir was measured using an MC20A pressure transducer with the same specifications as previously mentioned. A Coriolis force mass flow meter (Beijing Sincerity Automatic Equipment Co., Ltd., Beijing, China) located between the diaphragm pump and the preheater was used to measure the refrigerant flow rates, with an accuracy of 0.1% and a measuring range of 0–6 kg·min−1. The water–glycol and water-testing flow rates were measured by an XY-LD magnetic flow meter (Jiangsu XiYuan Instrument Technology Co., Ltd., Huai’an, China) with an accuracy of 0.5%.
2.2. Data Reduction
To determine the refrigerant enthalpies, the refrigerant maintains the superheat of 1–2 °C and the subcooling of 1–2 °C at the inlet and outlet of the test section when the equilibrium state was obtained.
The refrigerant released heat rate was expressed as follows:
The water-testing absorbed heat rate was obtained by:
The heat transfer rate that is the basis of calculation of the heat transfer rate in the test section was expressed as:
where and are the refrigerant and water-testing mass fluxes, respectively, in kg·m−2·s−1; and are the refrigerant enthalpies that were calculated based on the measured temperature and pressure at the inlet and outlet of the test section, respectively, in kJ·kg−1; is the heat capacity of water-testing at constant pressure, in kJ·kg−1·°C−1; and and are the water-testing temperatures at the inlet and outlet of the test section, in °C.
To evaluate the effect of insulation of the test section, the heat leakage rate was proposed. The test section reaches the equilibrium state and the measured parameters are effective only when is less than 5% for the working conditions, which was calculated by:
The water-testing heat transfer coefficient was calculated using the Gnielinski equation [28] as follows:
where is the water-testing thermal conductivity based on the average of and , in W·m−1·°C−1; is the annulus hydraulic diameter, in m; is a correction factor; and is the fanning friction factor that is determined from the Petukhov equation [29]:
The fouling film can be ignored due to the test tube has not been used, therefore, the overall thermal resistance of the test tube can be divided into three parts: external water-testing convection, tube wall and internal refrigerant convection [30], and then the refrigerant heat transfer coefficient was determined by:
where is the thermal conductivity of the test tube, in W·m−1·°C−1, and is the log-mean temperature difference, which is calculated by:
where is the condensation temperature that is calculated based on the pressure drop and the refrigerant pressure at the outlet of the test section.
According to the Wilson plot method, the total thermal resistance is calculated by an equation of the total heat transfer coefficient referred to the outer surface and the outer surface area, therefore, the total heat transfer coefficient can be calculated by:
In the study, the uncertainty of the experimental parameter could be obtained by the following equation [31]:
where is the total uncertainty of the dependent variable , and is the uncertainty of the independent variable x that affects the dependent variable .
For example, the uncertainty of the total heat transfer coefficient can be calculated using the following equation:
The uncertainties of , and can be calculated in the same manner according to Equation (10). Since the pressure drop was measured directly using the differential pressure transducer, the uncertainty of pressure drop was mainly determined by the precision of apparatus. Table 2 shows the uncertainties of the measurement devices and experimental parameters in the experiment.
3. Results and Analysis
3.1. Single-Phase Heat Transfer Experiment
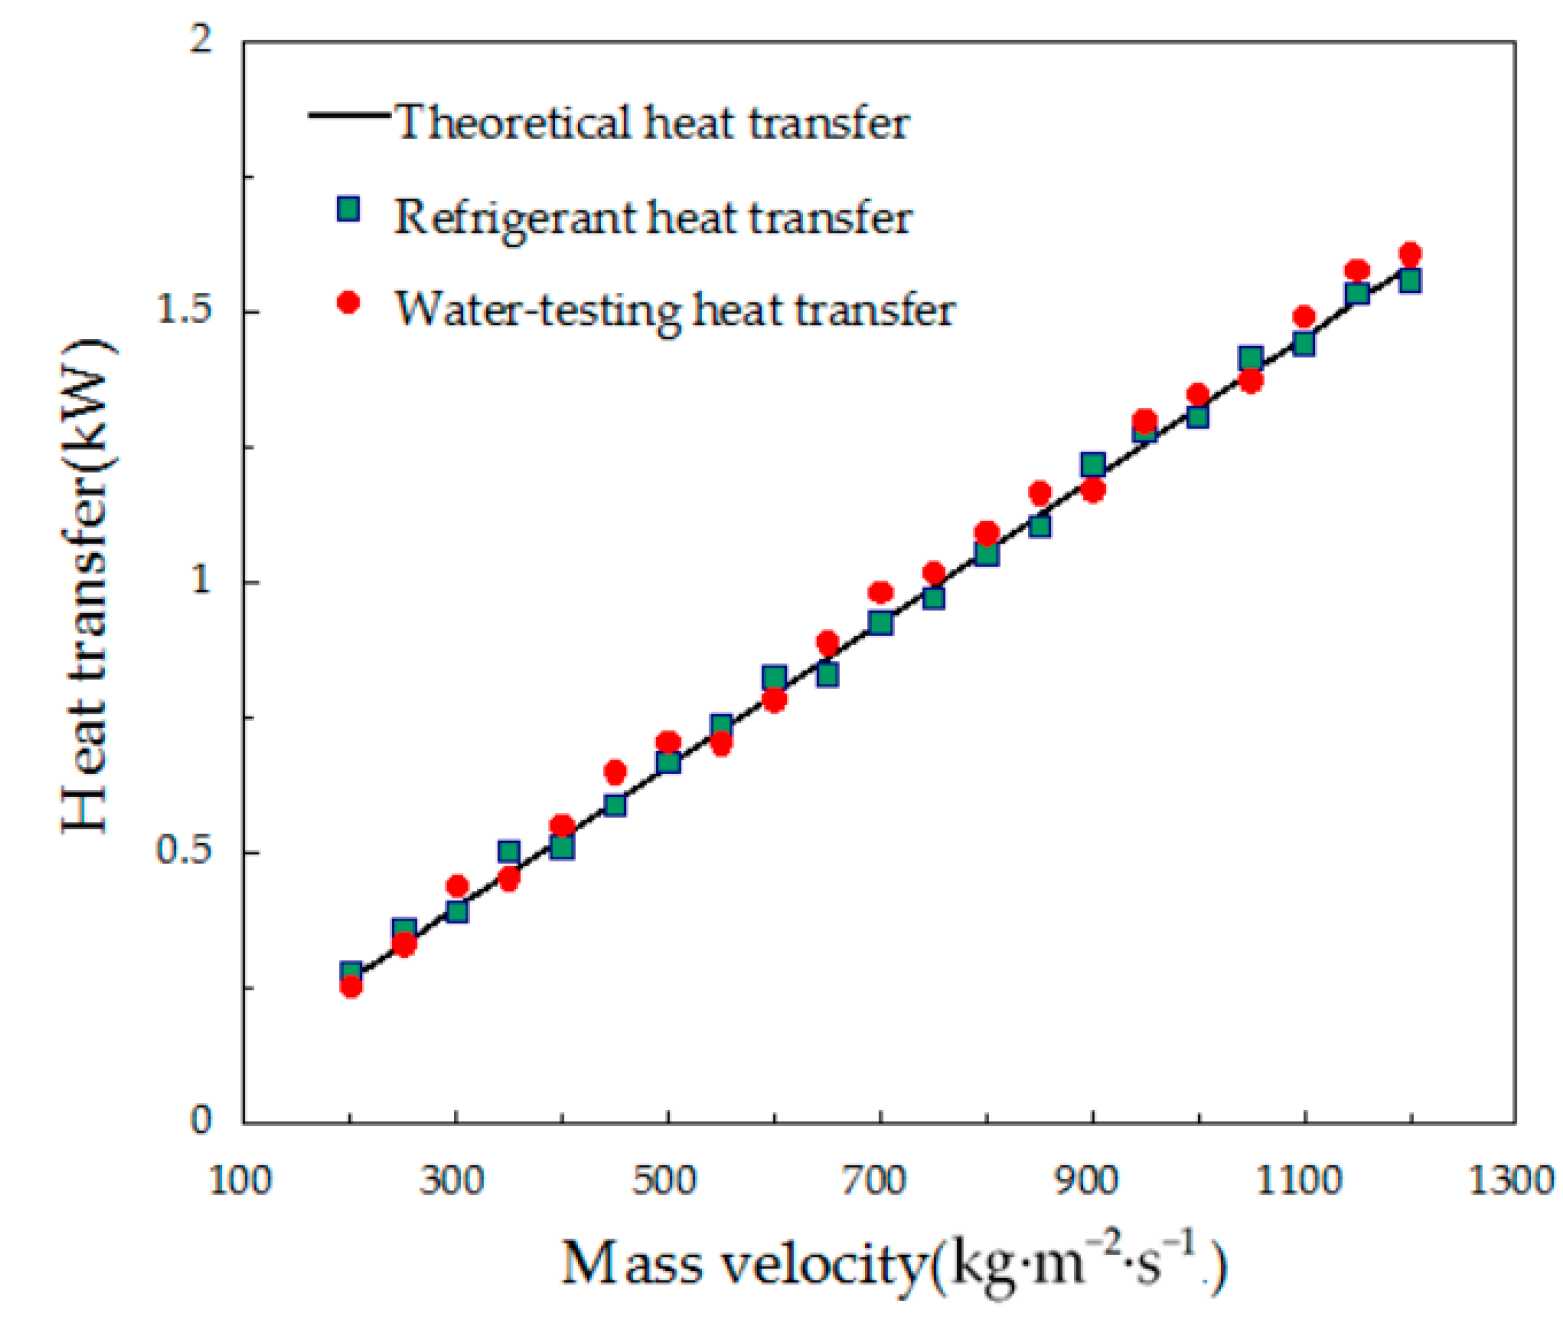
To ensure the accuracy of measuring parameters, the single-phase condensation heat transfer and pressure drop experiments of liquid R134a in the smooth tube with an inner diameter of 12.7 mm were carried out before any two-phase experiments, with the mass velocity ranging from 200 to 1200 kg·m−2·s−1 (corresponding to Reynolds number ranging from 12,500 to 74,500) and the condensation temperature of 30–40 °C.
Figure 4 shows the comparison of the heat transfer rate between refrigerant/water-testing and theoretical value. The refrigerant/water-testing experimental values agree well with the theoretical values, and deviations of the heat transfer rate between refrigerant and water testing are within 5%, showing that the heat leakage is small enough to meet the condensation experiment requirements.
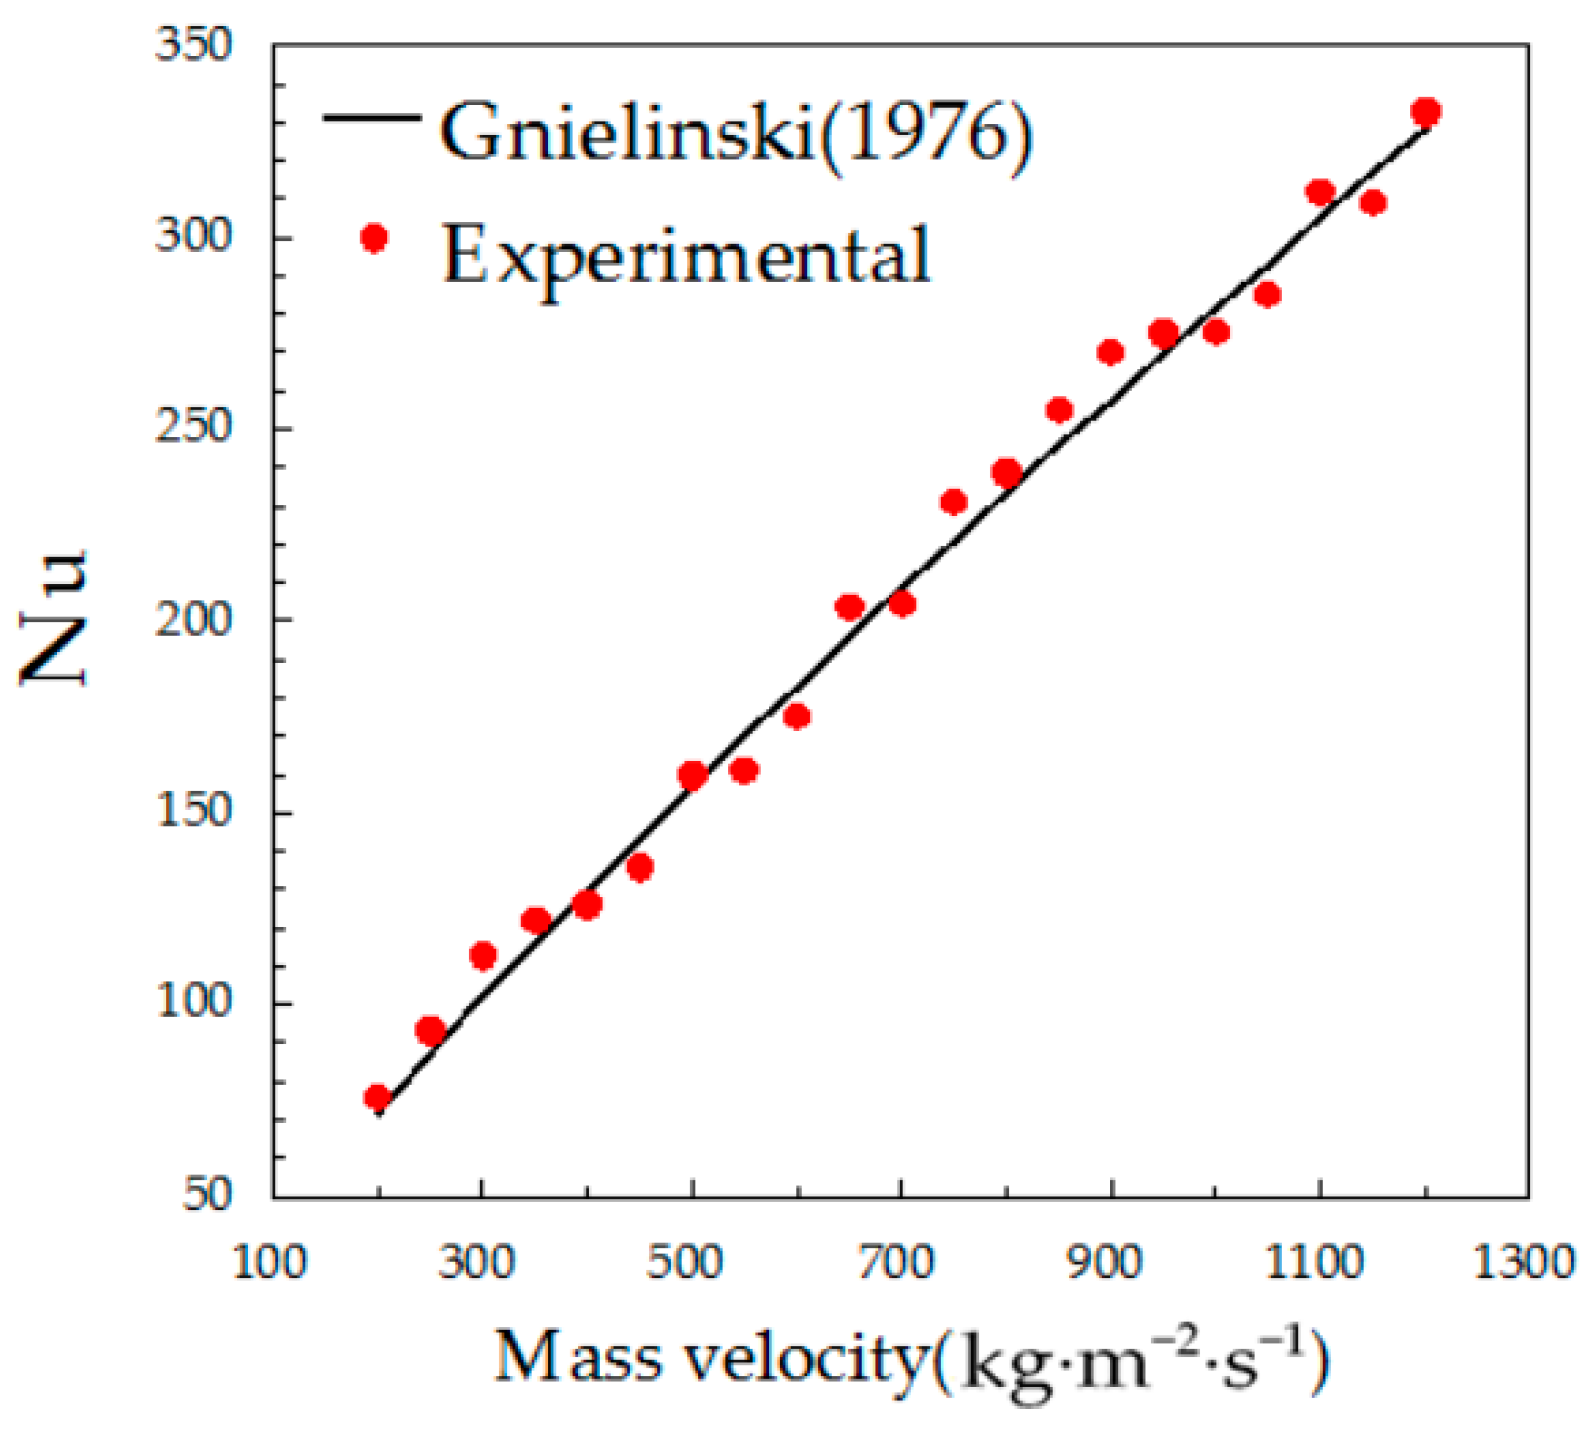
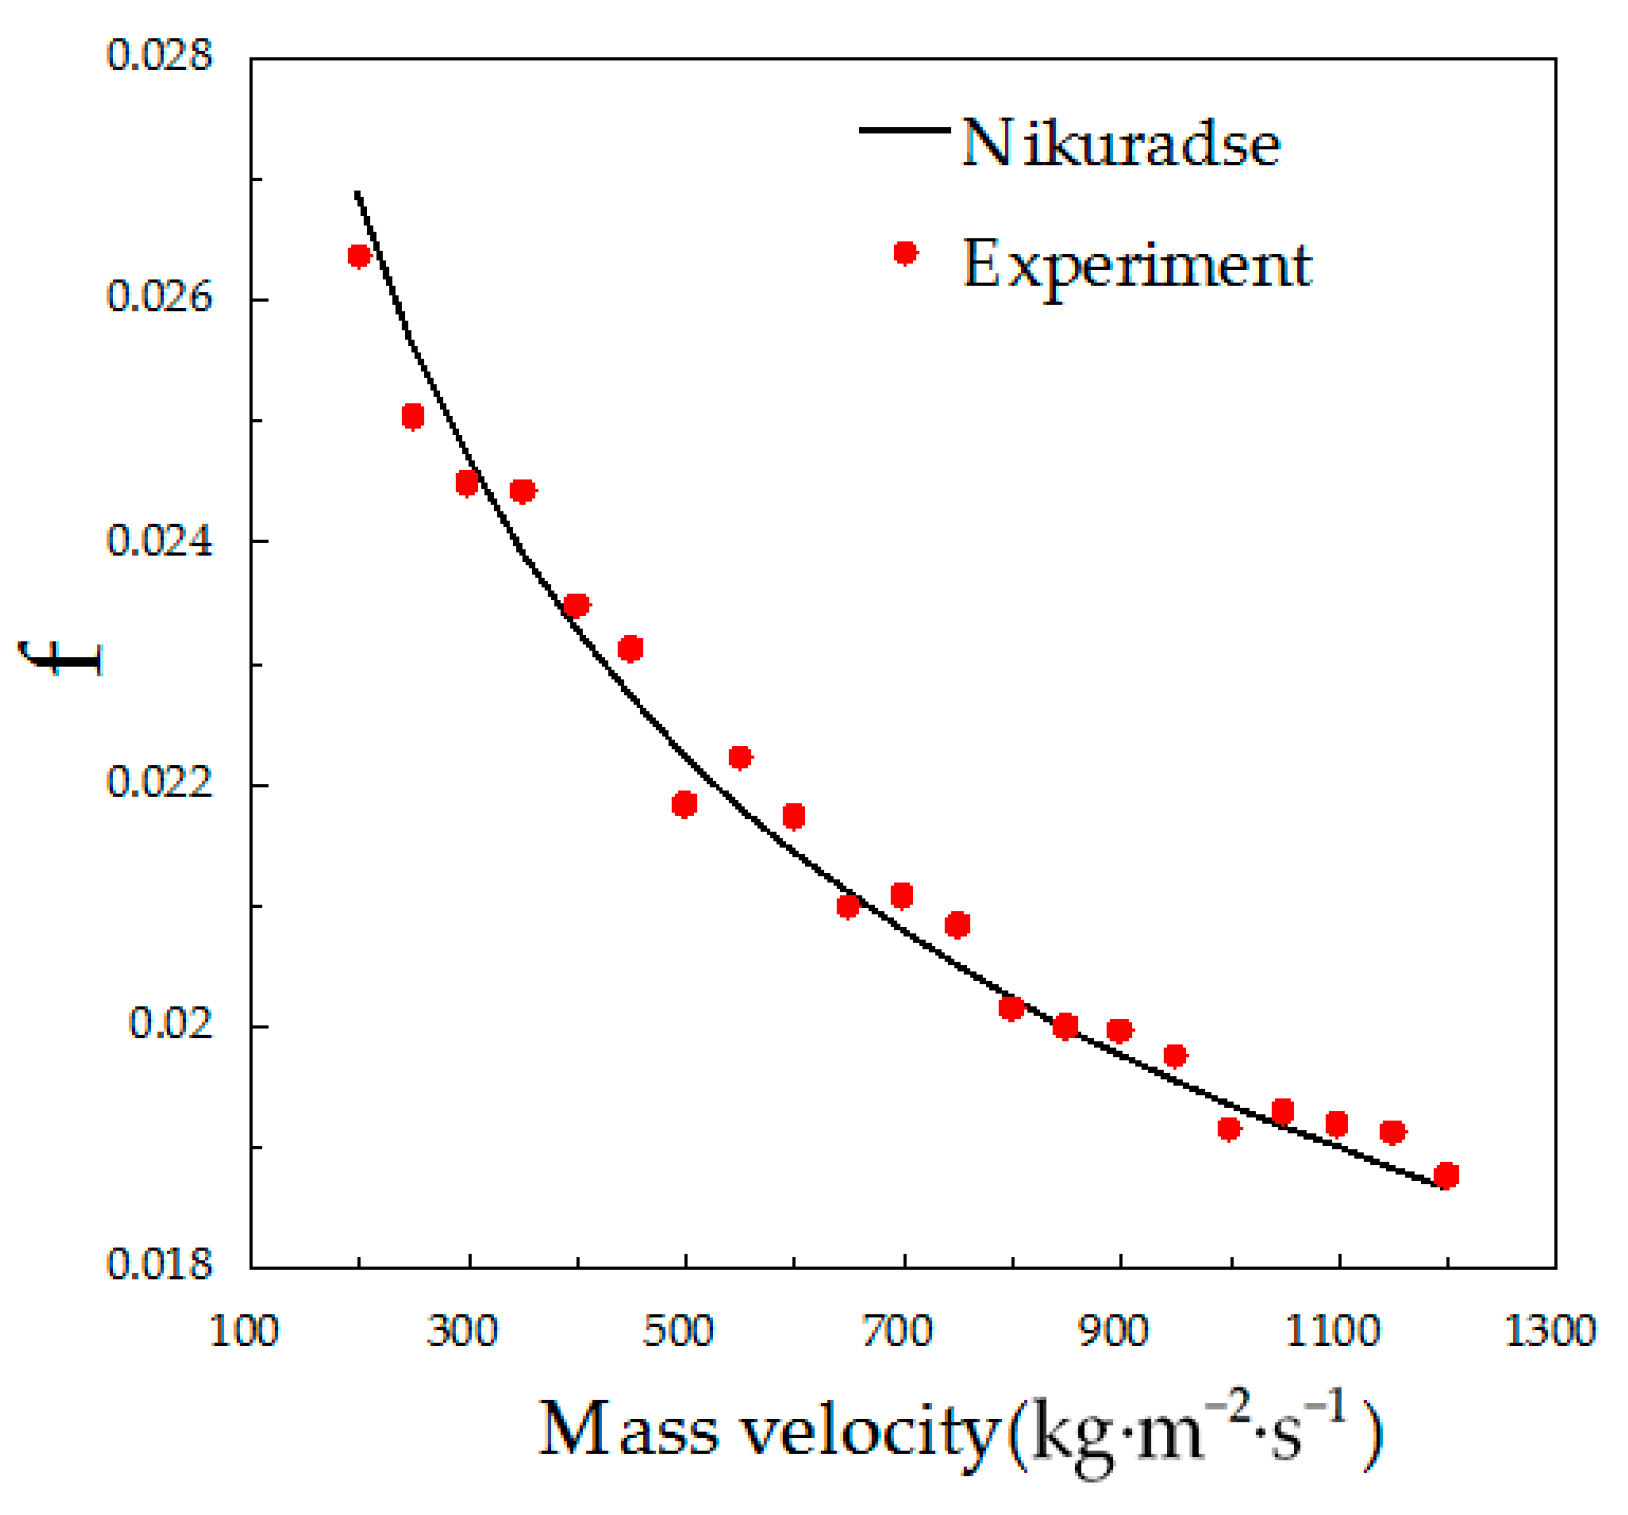
The comparison between experimental and theoretical Nusselt-based on the Gnielinski correlation is shown in Figure 5, experimental results are similar to the research results of Oh et al. [32]: the experimental value agrees well with the theoretical value with the average and root-mean-square deviations of 3.4% and 12.8%, respectively, which is enough to prove the reliability of experiment. Since the mean value of refrigerant temperatures at the inlet and outlet of the test section was regarded as a reference temperature, the fact that the non-linear refrigerant thermophysical properties vary with increasing temperature results in a difference between experimental and theoretical values, although there are measurement errors of the temperature and pressure transducers. The comparison between experimental and theoretical friction factor based on the Nikuradse correlation is also shown in Figure 6, and results show that the experimental value agrees well with the theoretical value, with the average and root-mean-square deviations of 1.2% and 4.4%, respectively.
R134a was used as the refrigerant in the two-phase condensation experiment, and Table 3 lists the properties of R134a under the working conditions. The experiment was performed under the following conditions: mass velocities of 400–1100 kg·m−2·s−1, water-testing Reynolds numbers of 8000–22,000 and condensation temperatures of 35–45 °C, as listed in Table 4.
3.2. Two-Phase Heat Transfer Experiment
The condensation heat transfer experiments of R134a inside two smooth and four micro-fin tubes were operated for mass velocities of 400–1100 kg·m−2·s−1, condensation temperatures of 35 °C, 40 °C, and 45 °C, and water-testing Reynolds numbers of 8000–22,000. The heat transfer coefficient was chosen as the evaluation index and the working conditions and structural parameters of the test tube were selected as influencing factors in the experiment. The refrigerant two-phase flow pattern inside the test tube was identified as the annular flow based on the Hajal et al. [33] flow pattern map under all working conditions.
To study the influences of mass velocity and condensation temperature, comparisons of the heat transfer coefficient of R134a at various mass velocities were made with condensation temperatures of 35 °C, 40 °C and 45 °C inside tubes 2, 5, and 6, as shown in Figure 7. Results show although the value added of unit mass velocity becomes bigger at a larger mass velocity, especially for the smooth tube, the heat transfer coefficient linearly increases with increasing mass velocity. This is because the vapor velocity and the liquid velocity all increase with increasing mass velocity for constant vapor quality, and the vapor velocity increases faster than that of liquid, causing the heat transfer boundary layer to be thinner and the turbulence intensity to increase. The increase of condensation temperature results in the increase of condensation pressure and vapor density, resulting in the velocity contrast of refrigerant vapor and liquid being decreased and a decrease of shear force at the interface of the vapor–liquid phase. In addition, the liquid thermal conductivity and surface tension decrease with the increase of temperature; all of these can result the heat transfer coefficient increasing with decreasing condensation temperature. In addition, with every 5 °C reduction in condensation temperature, the added value of the heat transfer coefficient is similar, due to the fact that the refrigerant thermo-physical properties are linear with condensation temperature.
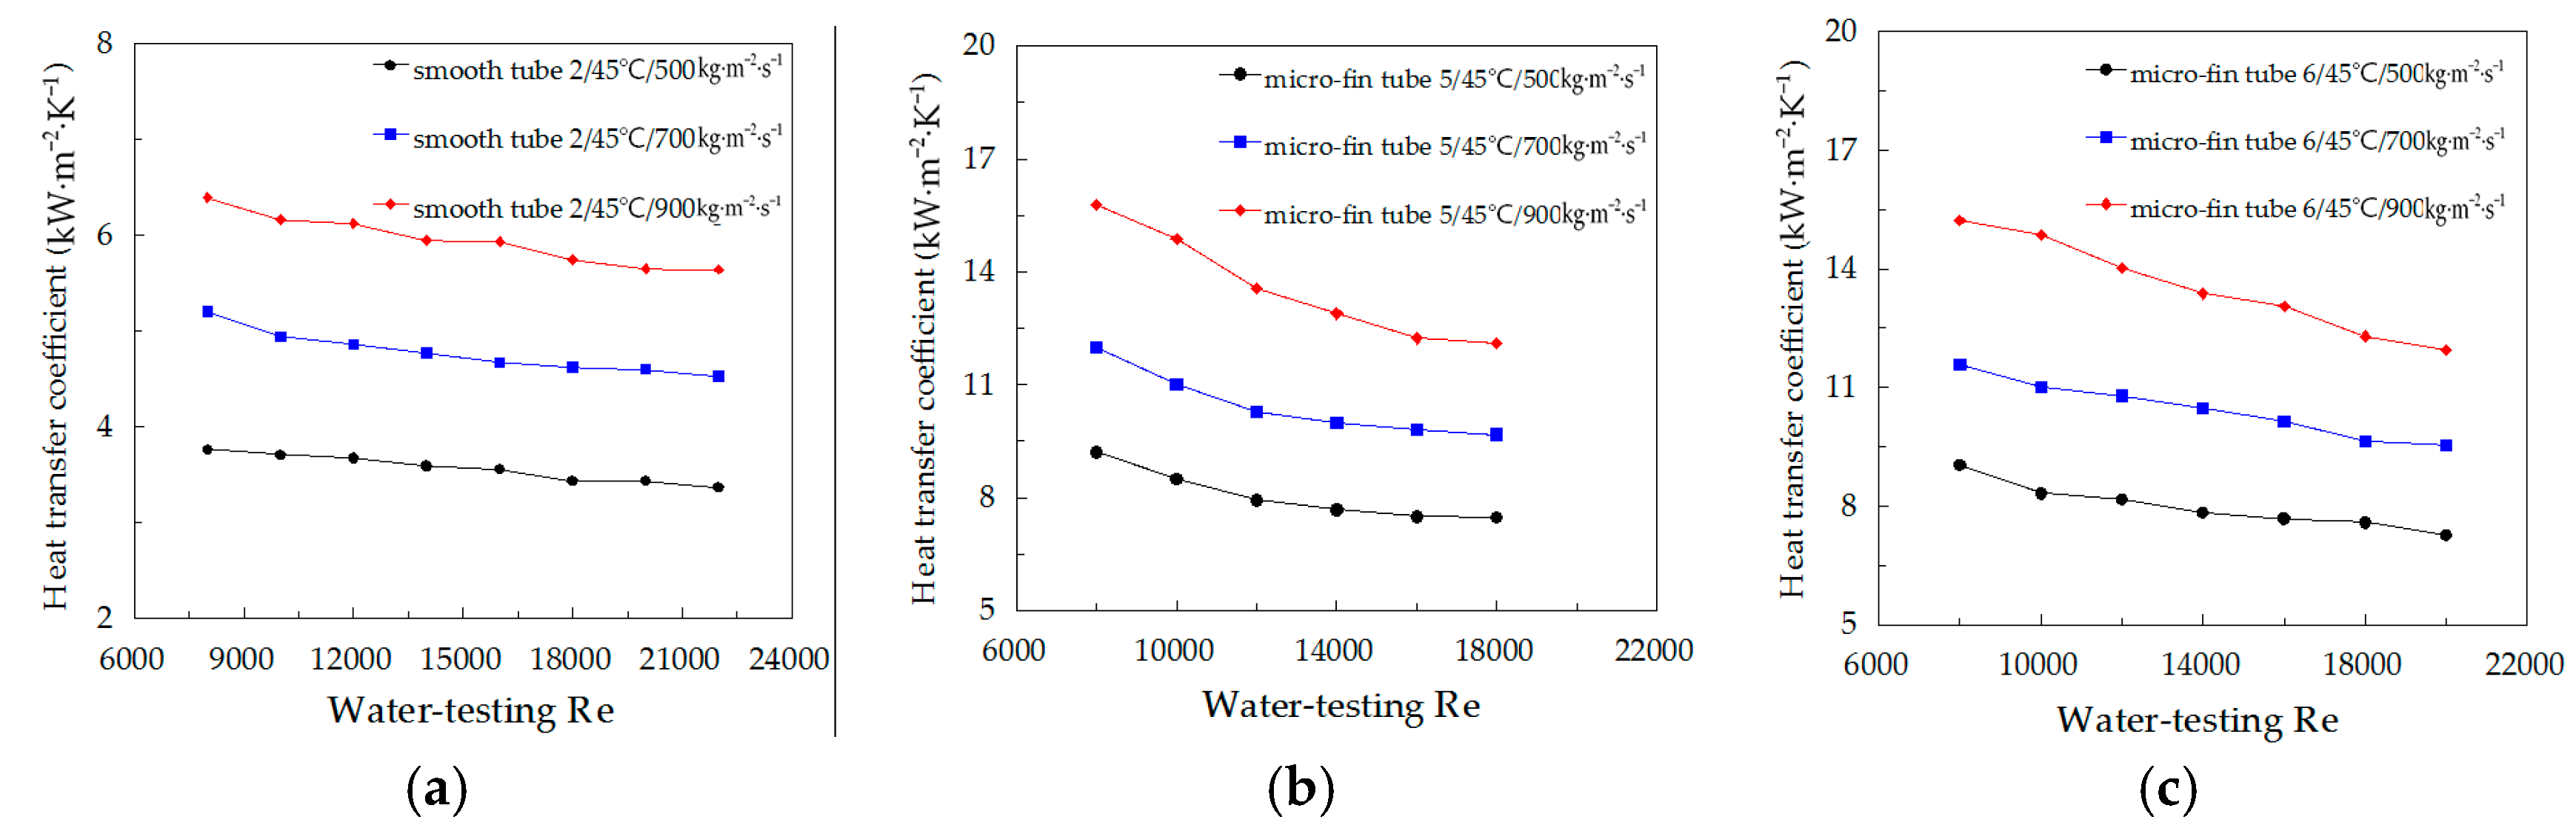
Figure 8 compares the heat transfer coefficients of R134a at various water-testing Reynolds number, with mass velocities of 500 kg·m−2·s−1, 700 kg·m−2·s−1 and 900 kg·m−2·s−1 and condensation temperature of 45 °C. The heat transfer coefficient decreases with increasing water-testing Reynolds number, and the influence of water-testing Reynolds number on the heat transfer coefficient is not significant for smooth tube while it becomes significant for micro-fin tube. To meet the heat transfer requests in the test section, the log-mean temperature difference increases with decreasing water-testing Reynolds number, which can cause the temperature gradient of boundary layer to become larger; hence the influence of water-testing Reynolds number can be extended to the influence of the boundary layer temperature gradient on the heat transfer coefficient. As mentioned above, the refrigerant thermo-physical properties for heat transfer improve with the decrease of temperature.
Research on the influence of tube diameter on the heat transfer coefficient has been performed by many scholars [34,35,36], but there is no a uniform result. Figure 9 shows the influence of tube diameter on the heat transfer coefficient for a condensation temperature of 35 °C and water-testing Reynolds number of 12,000 inside two smooth tubes and two micro-fin tubes with different inner diameters. Tube diameter has a small influence on the heat transfer for smooth tubes, as seen in the study from Baird et al. [34], while the heat transfer coefficient increases with decreasing tube diameter for micro-fin tubes. This can be explained by the interference of the micro-fin; apart from the different inner diameter, the micro-fin tubes 3 and 5 have micro-fins with the same height. A large ratio of fin height to inner diameter contributes to increasing the refrigerant turbulence, and then enhances heat transfer effect.
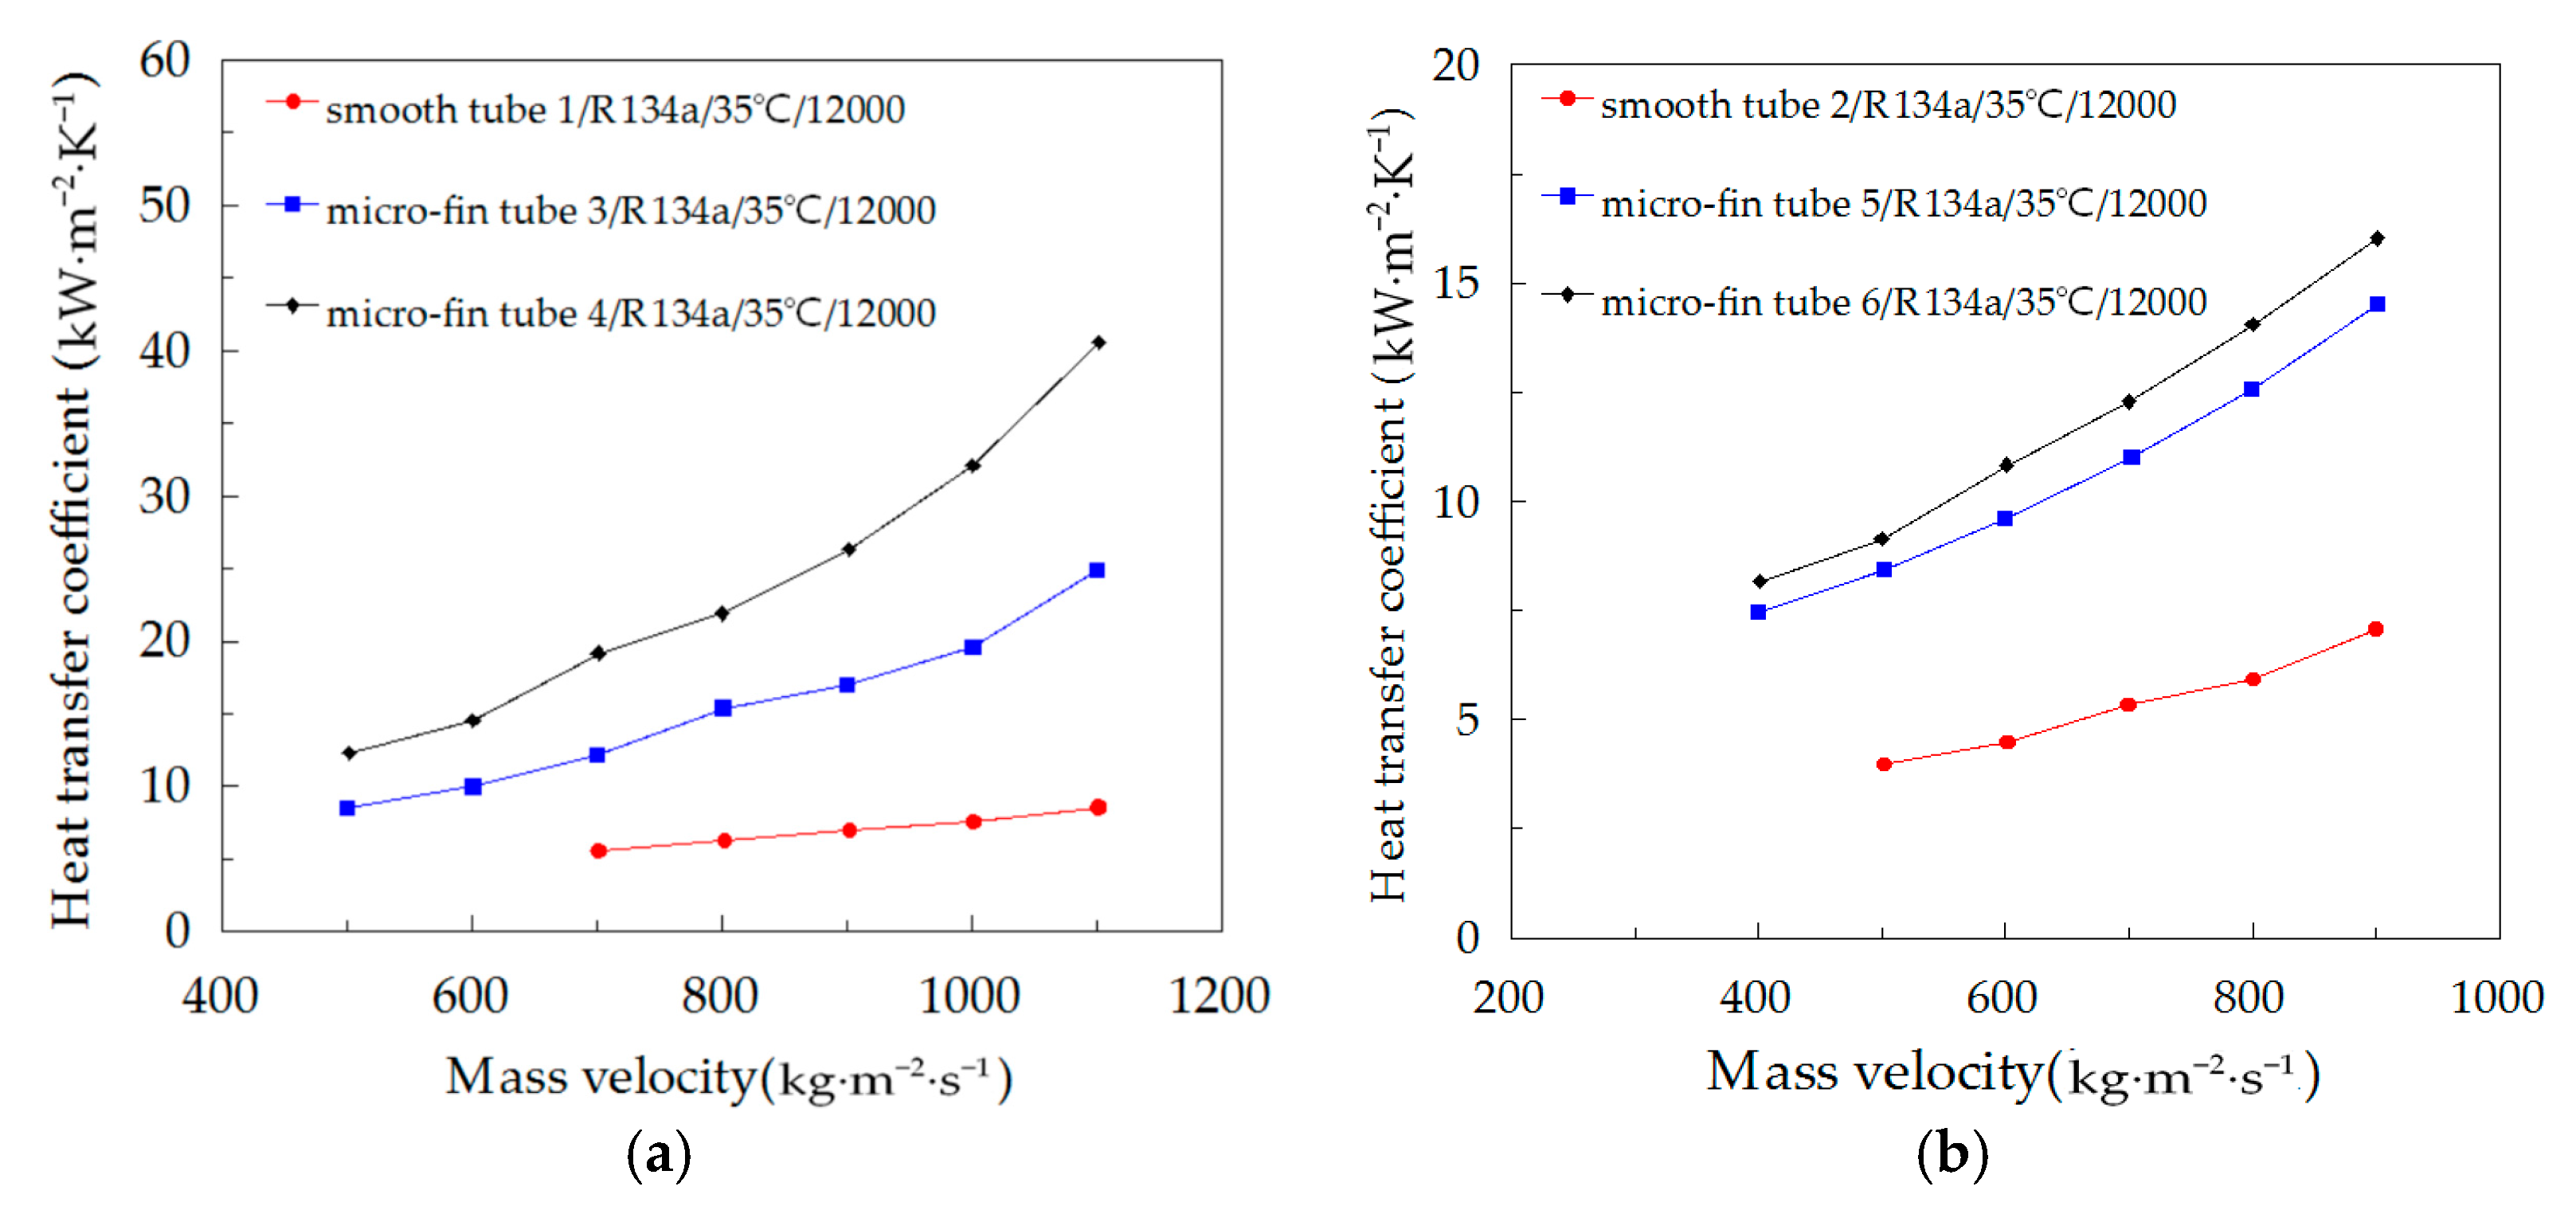
The relationship between the heat transfer coefficient and mass velocity with water-testing Reynolds number of 12,000 and condensation temperature of 35 °C inside two smooth and four micro-fin tubes is represented in Figure 10. The heat transfer coefficient of micro-fin tubes with a helix angle of 28° is the highest and the heat transfer capacity of smooth tubes is the poorest among test tubes with the same diameter. The heat transfer enhancement ratio is 3.23–5.37, 2.21–2.54 for micro-fin tubes 4 and 6, respectively. The heat transfer enhancement ratio is 2.19–2.87, 2.12–2.21 for micro-fin tubes 3 and 5, respectively. The complex interactions between the structural parameters of micro-fin tube and refrigerant thermo-physical properties cause an enhancement effect of micro-fin tube. The surface area remains constant for all working conditions. The enhancement by liquid drainage decreases with increasing mass velocity, which has been confirmed by experiment [37], hence interfacial turbulence is a major factor of the heat transfer enhancement. Apart from the interfacial turbulence increases with the increase of liquid and vapor velocities, a larger helix angle can also cause stronger turbulence. This is why the heat transfer coefficients micro-fin tubes 3 and 5 are in the middle.
3.3. Comparison with Existing Correlations
There exist some deviations between the experimental data and the correlation theoretical value due to the fact that the two experiments could not be exactly the same, especially for the following elements: working conditions, structural parameters of the test tube, algorithm, measurement accuracy of apparatus and so on. According to the previous studies, a prediction accuracy of less than 30% was defined as an acceptable deviation in the experiment.
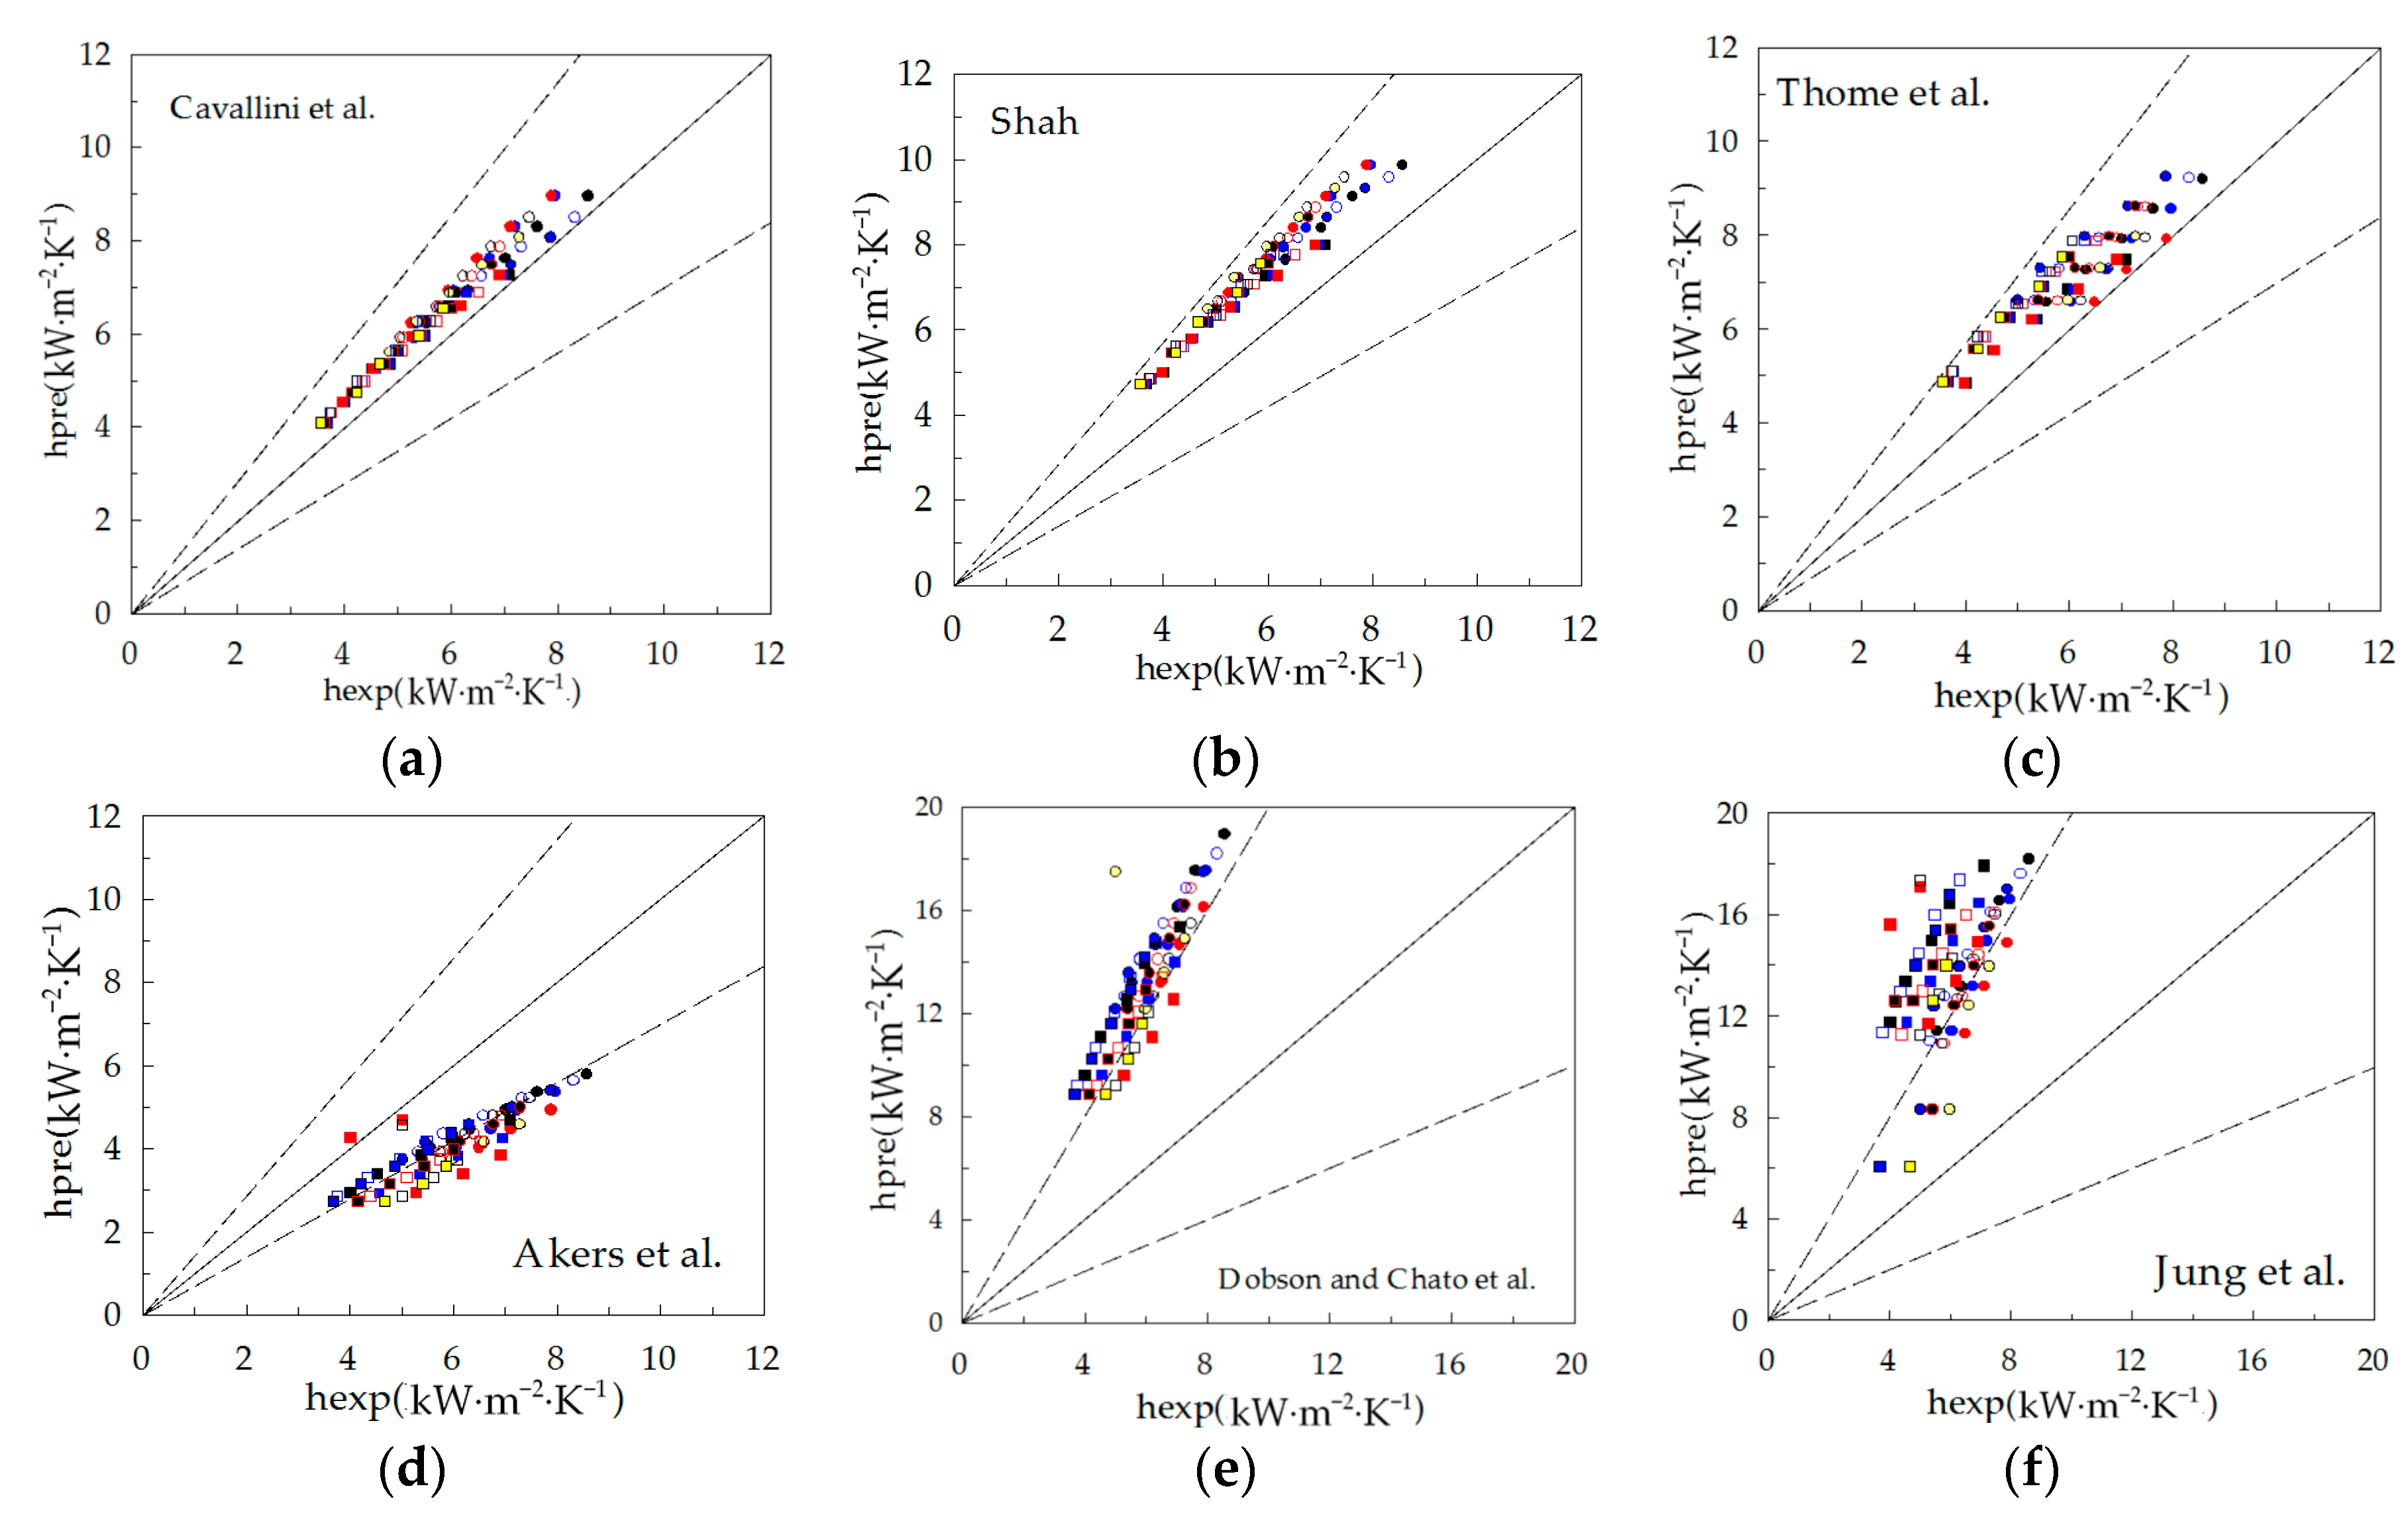
Condensation heat transfer characteristics of all types refrigerant inside the horizontal smooth tube have been studied for years and many correlations have been developed, meanwhile, continuous improvement of correlations has also been made for various alternative refrigerants and new type heat exchangers. In this experimental analysis, six well-known correlations by Cavallini et al. [38], Shah [6], Thome et al. [39], Akers et al. [7], Dobson and Chato et al. [9] and Jung et al. [40] were applied to compare the heat transfer coefficient of smooth tubes. Comparisons of the heat transfer coefficient between the predictive values and experimental values varying with mass velocity are shown in Figure 11, and Table 5 lists the deviation of various correlations against experimental heat transfer coefficient.
Since the actual working conditions gradually approach the assumed conditions of the Cavallini et al. correlation with increasing mass velocity for a constant vapor quality, the Cavallini et al. correlation predicts the experimental data very well for two smooth tubes with mean absolute deviation of 13.05%. Although the Shah and Thome et al. correlations overestimate the experimental data, they still can capture the heat transfer coefficient with a mean absolute deviation of 26.07% and 23.82%, respectively. This is because the increase of vapor and liquid velocities with increasing mass velocity results in the increase of shear stress, eventually causing liquid film to be evenly distributed. The effect of gravity can be ignored, in other words, heat transfer mechanism of forced-convection takes an increasingly dominant role with the increase of mass velocity. The Akers et al. correlation underestimates the heat transfer coefficient and has deviations from 20 to 40%, therefore, there exists a certain defect of the experimental data prediction. It is obvious that the predictive abilities of correlations of Dobson and Chato et al. and Jung et al. are poor, with mean absolute deviation of 140.18% and 146.23%, respectively, though they have higher prediction accuracy in a small mass flux based on the previous experimental investigations.
Meanwhile, the experimental data for the micro-fin tube was also compared with widely used correlations: the Cavallini et al. correlation [13], the Miyara et al. correlation [14], the Koyama et al. correlation [41], and the Oliver et al. correlation [18]. Detailed comparison results are shown in Figure 12, and deviations of various correlations against the experimental data are also listed in Table 5.
For micro-fin tubes 3 and 4, while the Miyara et al. correlation overestimates the heat transfer coefficient, correlations of Cavallini et al., Koyama et al. and Oliver et al. underestimate the experimental data and their predictive errors increase with the increase of mass velocity. The Miyara et al. correlation was proposed based on the experiment data in a herringbone-type micro-fin tube. Although condensate film inside the tube is invisible, one thing is for sure: the enhancement mechanism in detail is different for the enhanced tubes with different structure, and the heat transfer coefficient of the herringbone-type micro-fin tube is higher than that of the helical micro-fin tube based on previous research. For the correlations of Cavallini et al. and Koyama et al., since the experimental data was obtained under working condition of a small mass velocity, and the heat transfer mechanism did not take into account for large mass velocity, a very large error between the predictive value and experimental value exists at large mass velocity. The Oliver et al. correlation underestimates the experimental data with mean absolute deviation of 54.48%, hence it does not apply to predict the heat transfer coefficient in this study. However, all correlations have high prediction accuracy for micro-fin tubes 5 and 6; the correlations of Cavallini et al. and Miyara et al. present the best predicting results with mean absolute deviation of 6.62% and 4.73%, respectively. Although the correlations of Koyama et al. and Oliver et al. underestimate the experimental data, their prediction errors keep to within 30%. Except increasing the heat transfer area, the mixing of condensate film is a dominant factor of enhancement of condensation heat transfer for the micro-fin tube, which may cause the different predictive effects of correlations for micro-fin tubes with different inner diameters.
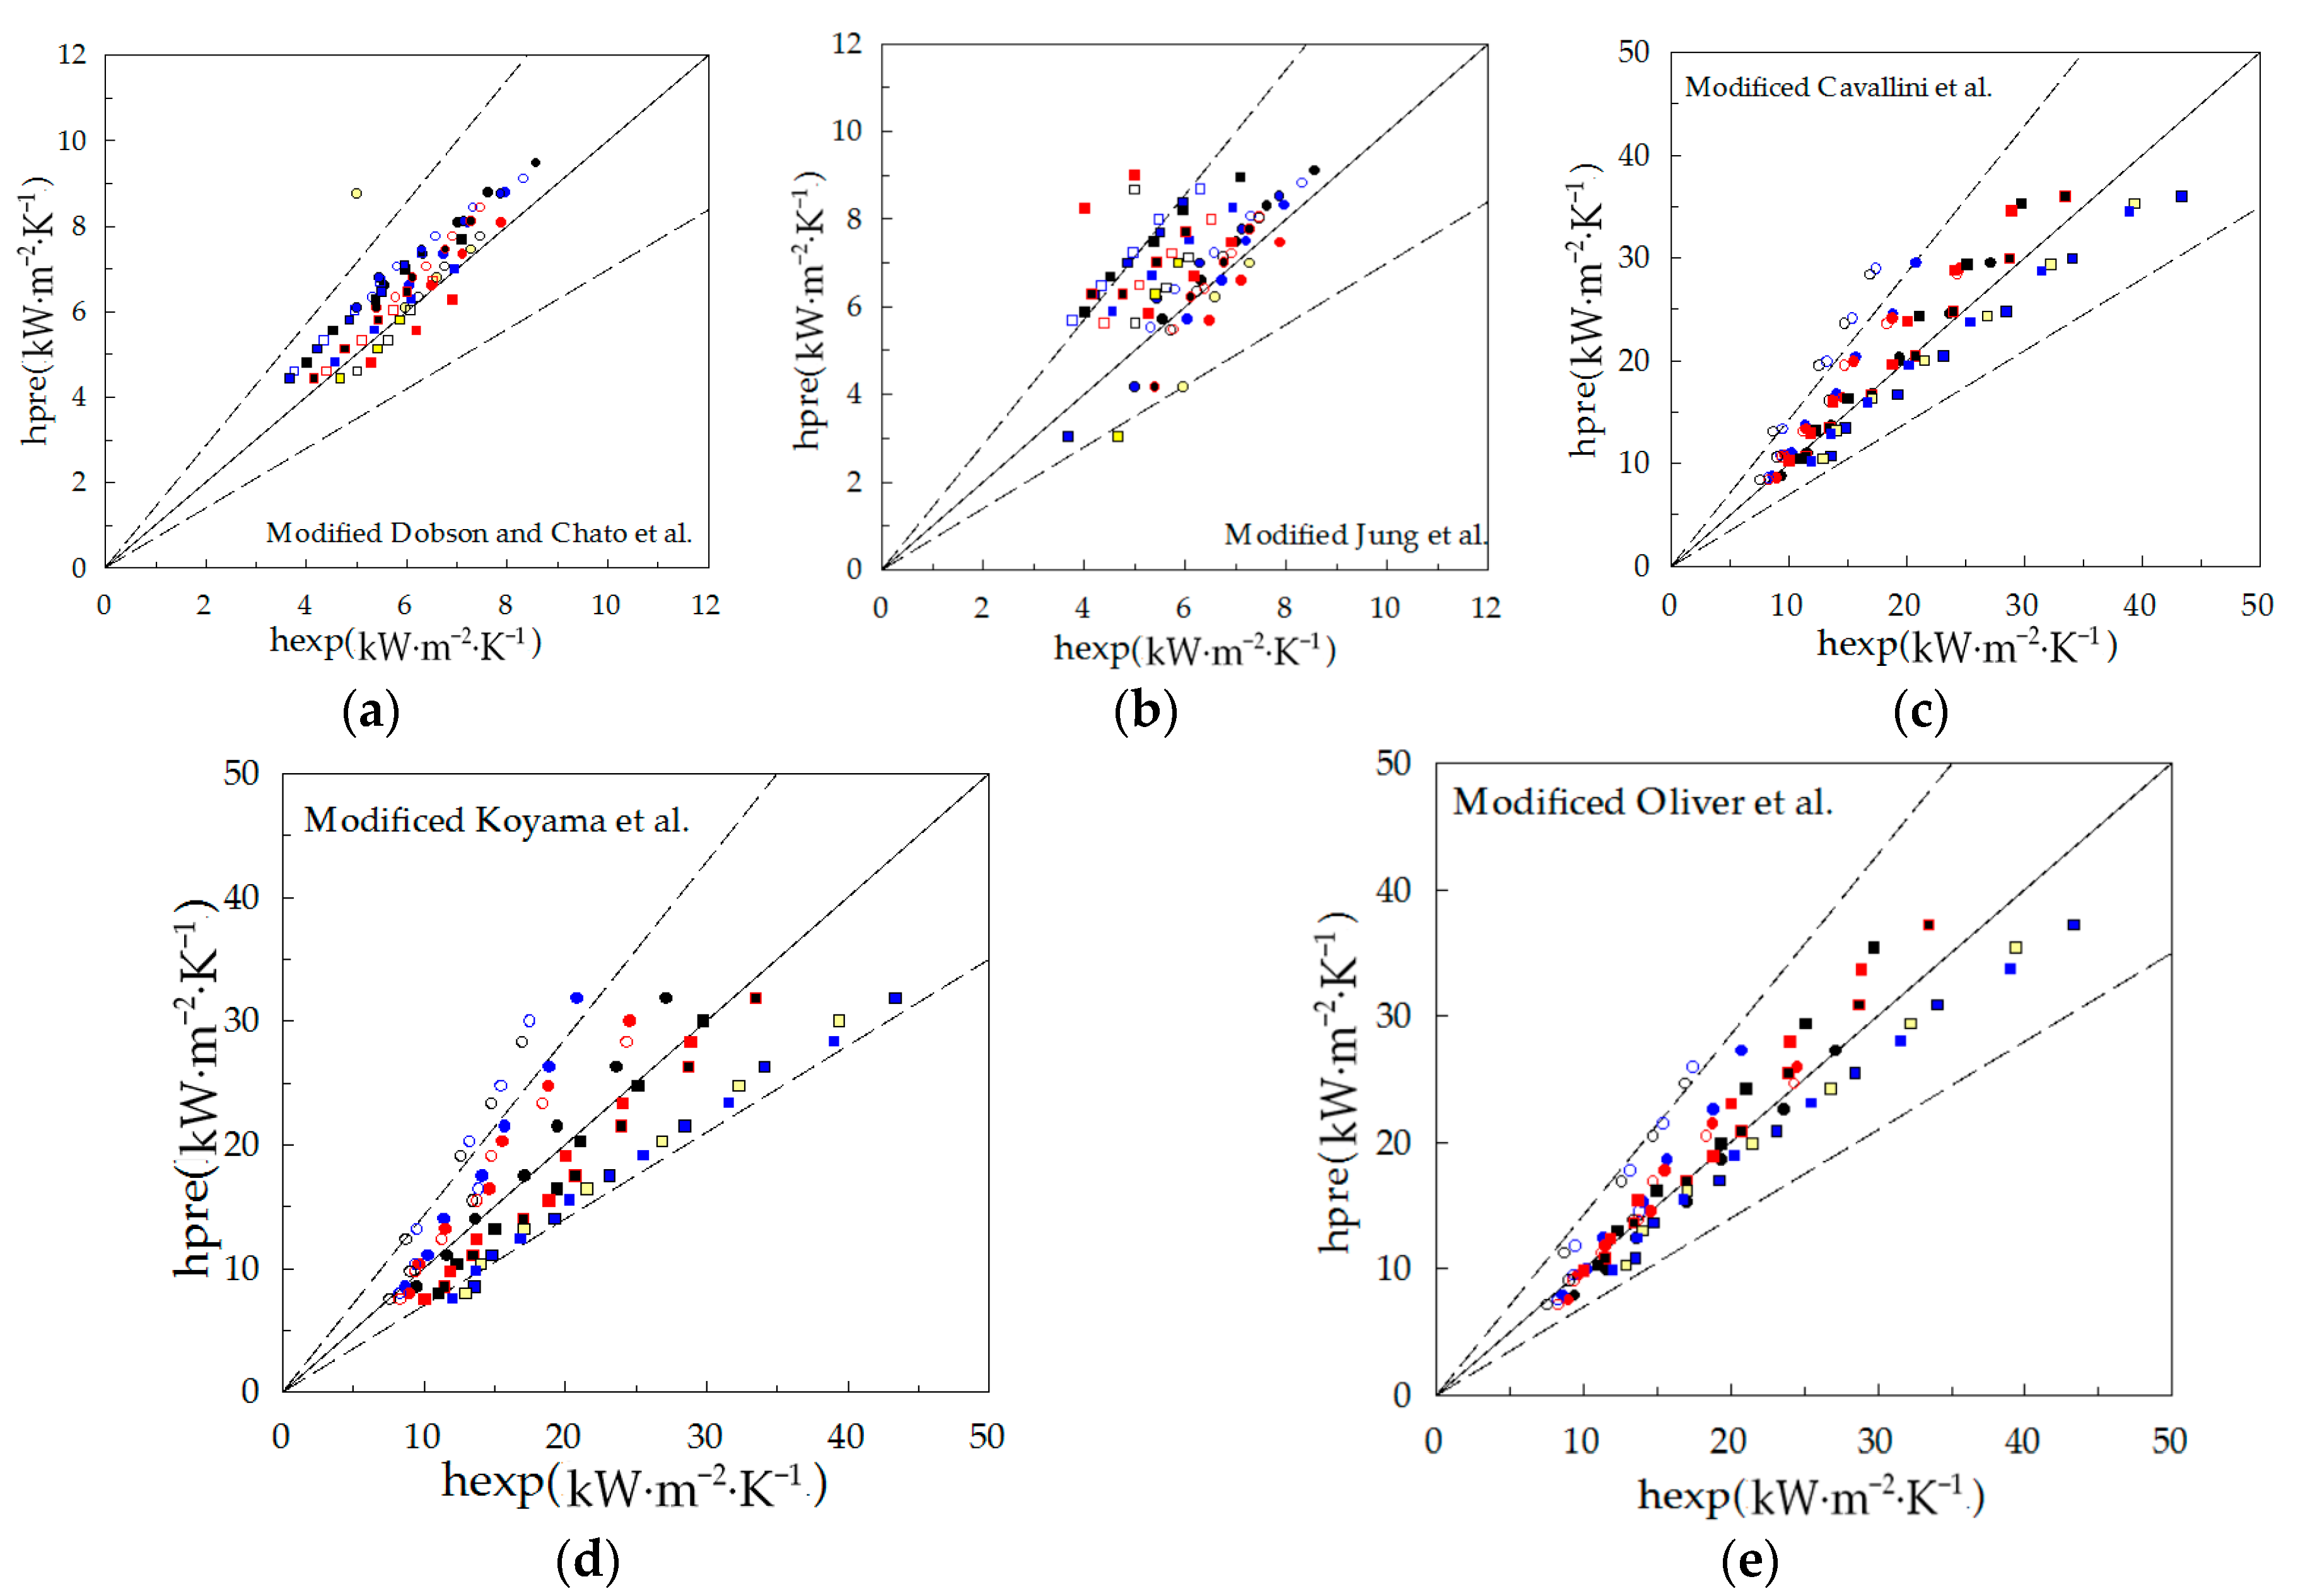
Given that distribution of condensate film becomes more uniform, that thickness decreases with increasing mass velocity for a constant vapor quality, and that the Reynolds number is used to characterize the refrigerant flow regime, dimensionless parameters that characterize fluid turbulence in the correlation (including not only Reynolds number) were modified to improve their prediction accuracy. For smooth tubs, a dimensionless parameter that characterizes the two-phase flow dynamic viscosity was introduced to the correlations of Dobson and Chato et al. and Jung et al., and the modified Dobson and Chato et al. correlation and modified Jung et al. correlation can predict the experimental data very well with mean absolute deviations of 20.31% and 23.24%, respectively. That is to say, their errors can be limited to the level of 30%, as shown in Figure 13a,b.
In the study of Guo et al. [42], the Oliver et al. correlation underestimates the heat transfer coefficient when the original value of the variable “s” is set to 0.715, while the predictive ability is improved and most predicted data can be controlled within a 30% error range when this value is set to 0.745, which provides a reference for the correlation modification. Reeq is the equivalent Reynolds number in the correlations of Cavallini et al. and Oliver et al., and ReL is the two-phase Reynolds number in the Koyama et al. correlation. They are applied to characterize the influence of turbulence effect on the heat transfer coefficient. The exponent to the equivalent Reynolds number is defined as 0.7 for helical micro-fin tubes in the Oliver et al. correlation and 0.8 in the Cavallini et al. correlation, and the exponent to the two-phase Reynolds number is set as 0.4 in the Koyama et al. correlation. That the correlation underestimates the experimental data shows that the forced-convection heat transfer effect has not obtained enough attention for a large mass velocity in the correlation, hence, the modified correlation is intended to enhance the turbulence effect. The influence of turbulence effect on heat transfer coefficient was modified by changing the exponent to the Reynolds number in the calculation. That the exponent and refrigerant mass velocity have a small linear relationship was discovered through the experimental data and theoretical value iterative calculation; the specific calculation procedure is:
Cavallini et al.:
Koyama et al.:
Oliver et al.:
Experimental results show that the modified correlations of Cavallini et al., Koyama et al. and Oliver et al. can predict the heat transfer coefficient with mean absolute deviation of 13.06%, 5.37% and 16.13% for micro-fin tubes 3 and 4, respectively. The specific modification of all modified correlations is shown in Table 6.
Since the herringbone-type micro-fin tub and helical micro-fin tub have different structural parameters of the micro-fin, and the ratio of the fin height to inner diameter that has a significant influence on the mixing of the condensate film is different for test micro-fin tubes with different inner diameters, the correlation was not modified through the enhancement of turbulence effect only. There exist many works obtaining a general correlation with a high prediction accuracy for all test tubes and with a wide working condition region.
4. Conclusions
The condensation heat transfer coefficient of R134a was experimentally studied inside two smooth and four micro-fin tubes. The influences of working conditions (mass velocity, condensation temperature and water-testing Reynolds number) and structural parameters of the micro-fin tube (diameter, fin height and helix angle) on the heat transfer coefficient were analyzed, and finally, the experimental data of heat transfer coefficient for all test tubes was compared with some well-known correlations.
The main conclusions are summarized as follows:
- (1)
- The heat transfer coefficient of R134a increases with increasing mass velocity, and decreasing condensation temperature and water-testing Reynolds number. The heat transfer coefficient of micro-fin tubes is higher than that of smooth tubes with the same inner diameter, the heat transfer enhancement ratio is 2.19–2.87, 3.23–5.37, 2.12–2.21 and 2.21–2.54 for micro-fin tubes 3, 4, 5 and 6, respectively. The tube diameter has a small influence on the heat transfer for smooth tubes, while the heat transfer coefficient increases with decreasing tube diameter for micro-fin tubes.
- (2)
- For the smooth tube, correlations of Cavallini et al., Shah, Thome et al. and Akers et al. can estimate the experimental data with mean absolute deviation of 13.05%, 26.07%, 23.82% and 26.11%, respectively, but Dobson and Chato et al. and Jung et al. fail to capture the heat transfer coefficient, with a poorer prediction accuracy. For the micro-fin tube, although the Miyara et al. correlation overestimates the heat transfer coefficient, correlations of Cavallini et al., Koyama et al. and Oliver et al. all underestimate the experimental data, and their deviation is from 25% to 55% for micro-fin tubes 3 and 4, while their deviations keep to within 30% for micro-fin tubes 5 and 6.
- (3)
- To improve the correlation prediction accuracy, a dimensionless parameter was introduced into the correlations by Dobson and Chato et al. and Jung et al., and designed to enhance the turbulence effect for the micro-fin tube. The correlations of Cavallini et al., Koyama et al., and Oliver et al. were modified, and the prediction accuracy of all modified correlations kept to within 25%. However, the modified correlations do not apply to the micro-fin tube with a larger inner diameter. There exist many works that obtain a general correlation for all test tubes and with a wide working condition region.
Acknowledgments
This project was supported by the Opening Project of the Shanghai Key Laboratory of Multiphase Flow and Heat Transfer in Power Engineering (13DZ2260900).
Author Contributions
Qingpu Li and Leren Tao carried out the concepts, study design, literature search, data acquistion, data analysis, graphics production and manuscript preparation. Lei Li and Yongpan Hu provided great assistance for data acquisition, data analysis and graphics production. Shengli Wu also carried out study design, graphics production and manuscript editing. All authors have read and approved the content of the manuscript.
Conflicts of Interest
The authors have no conflicts of interest to declare.
Abbreviations
| Q | heat exchange amount, W | mass flux, kg·m−2·s−1 | |
| G | mass flux, kg·m−2·s−1 | equivalent Reynolds number | |
| T | temperature, °C | liquid Prandtl number | |
| A | area, m2 | bond number | |
| ∆Tm | log-mean temperature difference, °C | Froude number | |
| Reynolds number | Nusselt number for forced convection condensation | ||
| total heat transfer coefficient, W·m−2·°C−1 | frictional two-phase multiplier | ||
| heat-transfer coefficient, W·m−2·°C−1 | trend factor | ||
| pressure drop, kPa | Subscripts | - | |
| Cp | specific heat at constant pressure, J·kg−1·°C−1 | refrigerant | |
| η | heat leakage rate | w | water-testing |
| L | effective length of the heat transfer, m | a | average value |
| D | diameter, m | ah | hydraulic value |
| x | vapor quality | in | inlet |
| density, kg·m−3 | out | outlet | |
| H | fin height, mm | i | inside tube |
| N | number of fins | o | outside tube |
| β | helical angle, ° | con | condensation condition |
| μ | dynamic viscosity, Pa·s | test tube | |
| thermal conductivity, W·m−1·°C−1 | liquid | ||
| a dimensionless parameter | ν | vapor | |
| Martinelli parameter | exp | experimental value | |
| exponent | pre | predicted value | |
| exponent |
References
- Breber, G.; Palen, J.W.; Taborek, J. Prediction of horizontal tubeside condensation of pure components using flow regime criteria. J. Heat Transf. 1980, 102, 471–476. [Google Scholar] [CrossRef]
- Soliman, H. On the annular-to-wavy flow pattern transition during condensation inside horizontal tubes. Can. J. Chem. Eng. 2010, 60, 475–481. [Google Scholar] [CrossRef]
- Coleman, J.W.; Garimella, S. Two-phase flow regimes in round, square and rectangular tubes during condensation of refrigerant R134a. Int. J. Refrig. 2003, 26, 117–128. [Google Scholar] [CrossRef]
- Cavallini, A.; Del, C.D.; Mancin, S.; Rossetto, L. An updated model for condensation of halogenated refrigerants inside enhanced tubes. In Proceedings of the 22nd International Congress of Refrigeration, Beijing, China, 21–26 August 2007. [Google Scholar]
- Chen, Q.; Amano, R.S.; Xin, M. Experimental study of flow patterns and regimes of condensation in horizontal three-dimensional micro-fin tubes. Heat Mass Transfer 2006, 43, 201–206. [Google Scholar] [CrossRef]
- Shah, M.M. A general correlation for heat transfer during film condensation inside pipes. Int. J. Heat Mass Transfer 1979, 22, 547–556. [Google Scholar] [CrossRef]
- Akers, W.W.; Deans, H.A.; Crosser, O.K. Condensation heat transfer within horizontal tubes. Chem. Eng. Prog. Symp. Ser. 1959, 55, 171–176. [Google Scholar]
- Thome, J.R.; El Hajal, J. Two-Phase Flow Pattern Map for Evaporation in Horizontal Tubes: Latest Version. Heat Transfer Eng. 2003, 24, 3–10. [Google Scholar] [CrossRef]
- Dobson, M.K.; Chato, J.C. Condensation in Smooth Horizontal Tubes. J. Heat Transfer 1998, 120, 193–213. [Google Scholar] [CrossRef]
- Cavallini, A.; Col, D.D.; Doretti, L.; Matkovic, M.; Rossetto, L. Condensation in Horizontal Smooth Tubes: A New Heat Transfer Model for Heat Exchanger Design. Heat Transfer Eng. 2006, 27, 31–38. [Google Scholar] [CrossRef]
- Wang, W.W.; Radcliff, T.D.; Christensen, R.N. A condensation heat transfer correlation for millimeter-scale tubing with flow regime transition. Exp. Therm. Fluid Sci. 2002, 26, 473–485. [Google Scholar] [CrossRef]
- Yan, Y.Y.; Lin, T.F. Condensation heat transfer and pressure drop of refrigerant R-134a in flat aluminum multi-channel tubes with and without micro-fins. Int. J. Heat Mass Transfer 1999, 42, 697–708. [Google Scholar] [CrossRef]
- Cavallini, A.; Col, D.D.; Doretti, L.; Longo, G.A.; Rossetto, L. A new computational procedure for heat transfer and pressure drop during refrigerant condensation inside enhanced tubes. J. Enhanc. Heat Transfer 1999, 6, 441–456. [Google Scholar]
- Miyara, A.; Nonaka, K.; Taniguchi, M. Condensation heat transfer and flow pattern inside a herringbone-type micro-fin tube. Int. J. Refrig. 2000, 23, 141–152. [Google Scholar] [CrossRef]
- Goto, M.; Inoue, N.; Yonemoto, R. Condensation heat transfer of R410A inside internally grooved horizontal tubes. Int. J. Refrig. 2003, 26, 410–416. [Google Scholar] [CrossRef]
- Chamra, L.M.; Mago, P.J.; Tan, M.; Kung, C. Modeling of condensation heat transfer of pure refrigerants in micro-fin tubes. Int. J. Heat Mass Transfer 2005, 48, 1293–1302. [Google Scholar] [CrossRef]
- Kedzierski, M.A.; Goncalves, J.M. Horizontal convective condensation of alternative refrigerants within a micro-fin tube. J. Enhanc. Heat Transfer 1999, 6, 161–178. [Google Scholar] [CrossRef]
- Olivier, J.A.; Liebenberg, L.; Thome, J.R.; Meyer, J.P. Heat transfer, pressure drop, and flow pattern recognition during condensation inside smooth, helical micro-fin, and herringbone tubes. Int. J. Refrig. 2007, 30, 609–623. [Google Scholar] [CrossRef]
- Islam, M.A.; Miyara, A. Liquid film and droplet flow behaviour and heat transfer characteristics of herringbone microfin tubes. Int. J. Refrig. 2007, 30, 1408–1416. [Google Scholar] [CrossRef]
- Tang, L.; Ohadi, M.M.; Johnson, A.T. Flow condensation in smooth and micro-fin tubes with HCFC-22, HFC-134a and HFC-410A refrigerants. Part I: Experimental results. J. Enhanc. Heat Transf. 2000, 7, 289–310. [Google Scholar] [CrossRef]
- Lazarek, G.M.; Black, S.H. Evaporative heat transfer, pressure drop and critical heat flux in a small vertical tube with R-113. Int. J. Heat Mass Transfer 1982, 25, 945–960. [Google Scholar] [CrossRef]
- Mishima, K.; Hibiki, T. Some characteristics of air-water two-phase flow in small diameter vertical tubes. Int. J. Multiph. Flow 1996, 22, 703–712. [Google Scholar] [CrossRef]
- Chisholm, D. A theoretical basis for the Lockhart-Martinelli correlation for two-phase flow. Int. J. Heat Mass Transfer 1967, 10, 1767–1778. [Google Scholar] [CrossRef]
- Zhang, M.; Webb, R.L. Correlation of two-phase friction for refrigerants in small-diameter tubes. Exp. Therm. Fluid Sci. 2001, 25, 131–139. [Google Scholar] [CrossRef]
- Koyama, S.; Kuwahara, K.; Nakashita, K.; Yamamoto, K. An experimental study on condensation of refrigerant R134a in a multi-port extruded tube. Int. J. Refrig. 2003, 26, 425–432. [Google Scholar] [CrossRef]
- Sun, L.; Mishima, K. Evaluation analysis of prediction methods for two-phase flow pressure drop in mini-channels. Int. J. Multiph. Flow 2009, 35, 47–54. [Google Scholar] [CrossRef]
- Revellin, R.; Thome, J.R. Adiabatic two-phase frictional pressure drops in microchannels. Exp. Therm. Fluid Sci. 2007, 31, 673–685. [Google Scholar] [CrossRef]
- Gnielinski, V. New equations for heat and mass transfer in turbulent pipe and channel flows. NASA STI/Recon Tech. Rep. A 1976, 75, 8–16. [Google Scholar]
- Petukhov, B.S. Heat transfer and friction in turbulent pipe flow with variable physical properties. Adv. Heat Transfer 1970, 6, 503–564. [Google Scholar]
- Koo, K.; Hwang, J.; Hur, H.; Lee, J.; Na, B.; Hwang, Y.; Kim, B.; Ahn, Y. An experimental study on the thermal and fouling characteristics in a washable shell and helically coiled heat exchanger by the Wilson plot method. J. Mech. Sci. Technol. 2016, 30, 2805–2812. [Google Scholar] [CrossRef]
- Li, M.; Chaobin, D. Flow boiling heat transfer of HFO1234yf and R32 refrigerant mixtures in a smooth horizontal tube: Part 1. Experimental investigation. Int. J. Heat Mass Transfer 2012, 55, 3437–3446. [Google Scholar] [CrossRef]
- Oh, H.K.; Son, C.H. Condensation heat transfer characteristics of R-22, R-134a and R-410A in a single circular micro-tube. Exp. Therm. Fluid Sci. 2011, 35, 706–716. [Google Scholar] [CrossRef]
- El Hajal, J.; Thome, J.R.; Cavallini, A. Condensation in horizontal tubes, part 1: Two-phase flow pattern map. Int. J. Heat Mass Transfer 2003, 46, 3349–3363. [Google Scholar] [CrossRef]
- Baird, J.R.; Fletcher, D.F.; Haynes, B.S. Local condensation heat transfer rates in fine passages. Int. J. Heat Mass Transfer 2003, 46, 4453–4466. [Google Scholar] [CrossRef]
- Shin, J.S.; Kim, M.H. An experimental study of flow condensation heat transfer inside circular and rectangular mini-channels. Heat Transfer Eng. 2005, 26, 36–44. [Google Scholar] [CrossRef]
- Liu, N.; Li, J.M. Experimental study on condensation heat transfer of R32, R152a and R22 in horizontal minichannels. Appl. Therm. Eng. 2015, 90, 763–773. [Google Scholar] [CrossRef]
- Yang, C.Y.; Webb, R.L. A predictive model for condensation in small hydraulic diameter tubes having axial micro-fins. ASME J. Heat Transfer 1997, 119, 776–782. [Google Scholar] [CrossRef]
- Cavallini, A.; Censi, G.; del Col, D.; Doretti, L.; Longo, G.A.; Rossetto, L.; Zilio, C. Condensation inside and outside smooth and enhanced tubes—A review of recent research. Int. J. Refrig. 2003, 26, 373–392. [Google Scholar] [CrossRef]
- Thome, J.R.; El Hajal, J.; Cavallini, A. Condensation in horizontal tubes, part 2: New heat transfer model based on flow regimes. Int. J. Heat Mass Transfer 2003, 46, 3365–3387. [Google Scholar] [CrossRef]
- Jung, D.; Song, K.; Cho, Y.; Kim, S. Flow condensation heat transfer coefficients of pure refrigerants. Int. J. Refrig. 2003, 26, 4–11. [Google Scholar] [CrossRef]
- Koyama, S.; Yu, J. Condensation heat transfer of pure refrigerant inside an internally grooved horizontal tube. In Proceedings of the JAR Annual Conference; 1996; pp. 173–186. [Google Scholar]
- Guo, S.P.; Wu, Z.; Li, W.; Kukulka, D.; Sunden, B.; Zhou, X.P.; Wei, J.J.; Simon, T. Condensation and evaporation heat transfer characteristics in horizontal smooth, herringbone and enhanced surface EHT tubes. Int. J. Heat Mass Transfer 2015, 85, 281–291. [Google Scholar] [CrossRef]
Figure 1.
Schematic of the experimental setup.

Figure 2.
(a) The test section and (b) cross-sectional view of the micro-fin tube.

Figure 3.
(a) Temperature-measuring module and (b) pressure-measuring module.
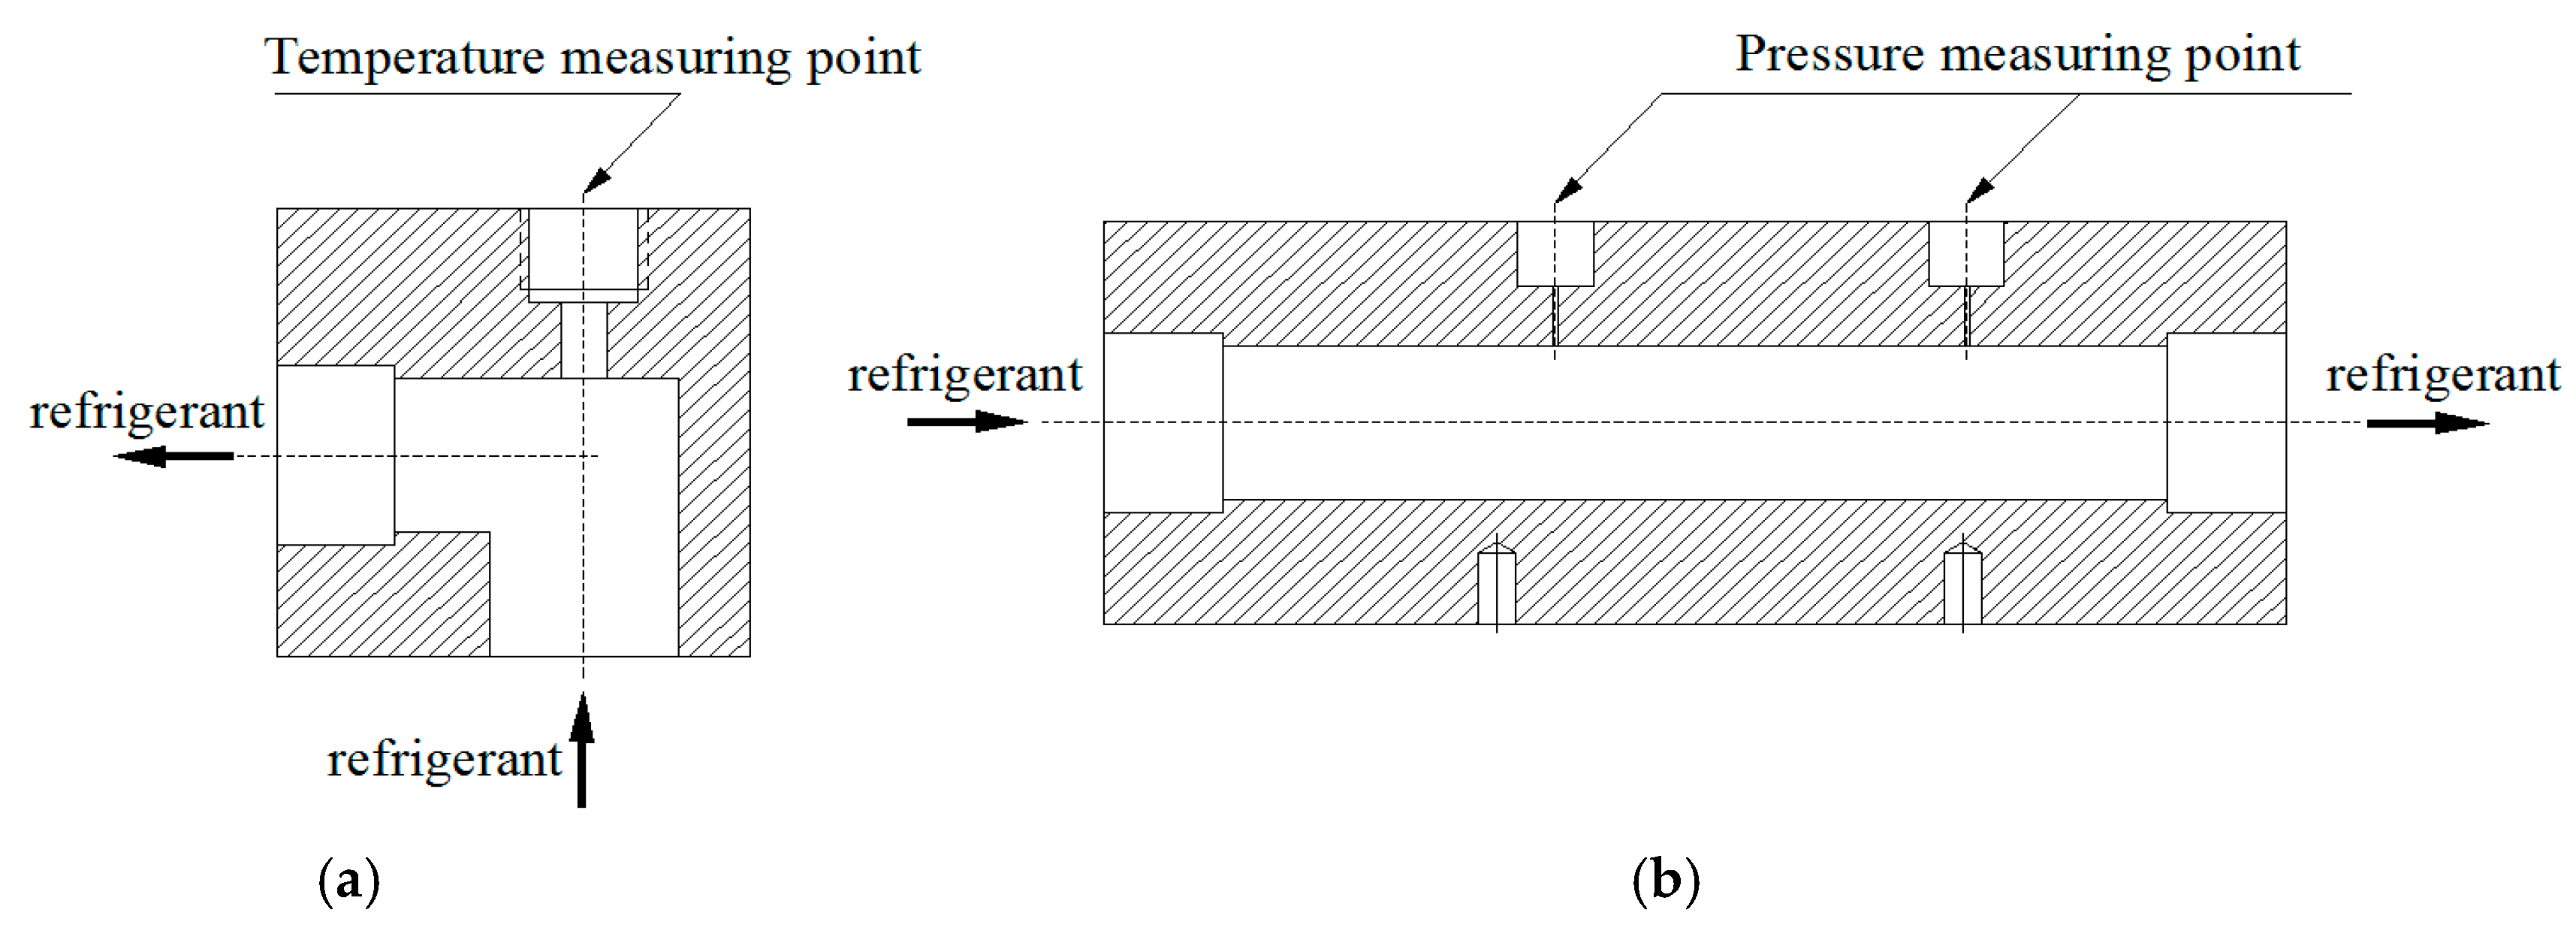
Figure 4.
Comparisons of heat transfer rate between refrigerant/water-testing experimental value and theoretical value for a single-phase flow.
Figure 4.
Comparisons of heat transfer rate between refrigerant/water-testing experimental value and theoretical value for a single-phase flow.

Figure 5.
Comparisons of Nusselt (Nu) between experimental value and theoretical value for a single-phase flow.
Figure 5.
Comparisons of Nusselt (Nu) between experimental value and theoretical value for a single-phase flow.

Figure 6.
Comparisons of friction factor between experimental value and theoretical value for a single-phase flow.
Figure 6.
Comparisons of friction factor between experimental value and theoretical value for a single-phase flow.

Figure 7.
Influence of mass velocity and condensation temperature on the heat transfer coefficient inside (a) tubes 2; (b) 5; and (c) 6 for R134a.
Figure 7.
Influence of mass velocity and condensation temperature on the heat transfer coefficient inside (a) tubes 2; (b) 5; and (c) 6 for R134a.
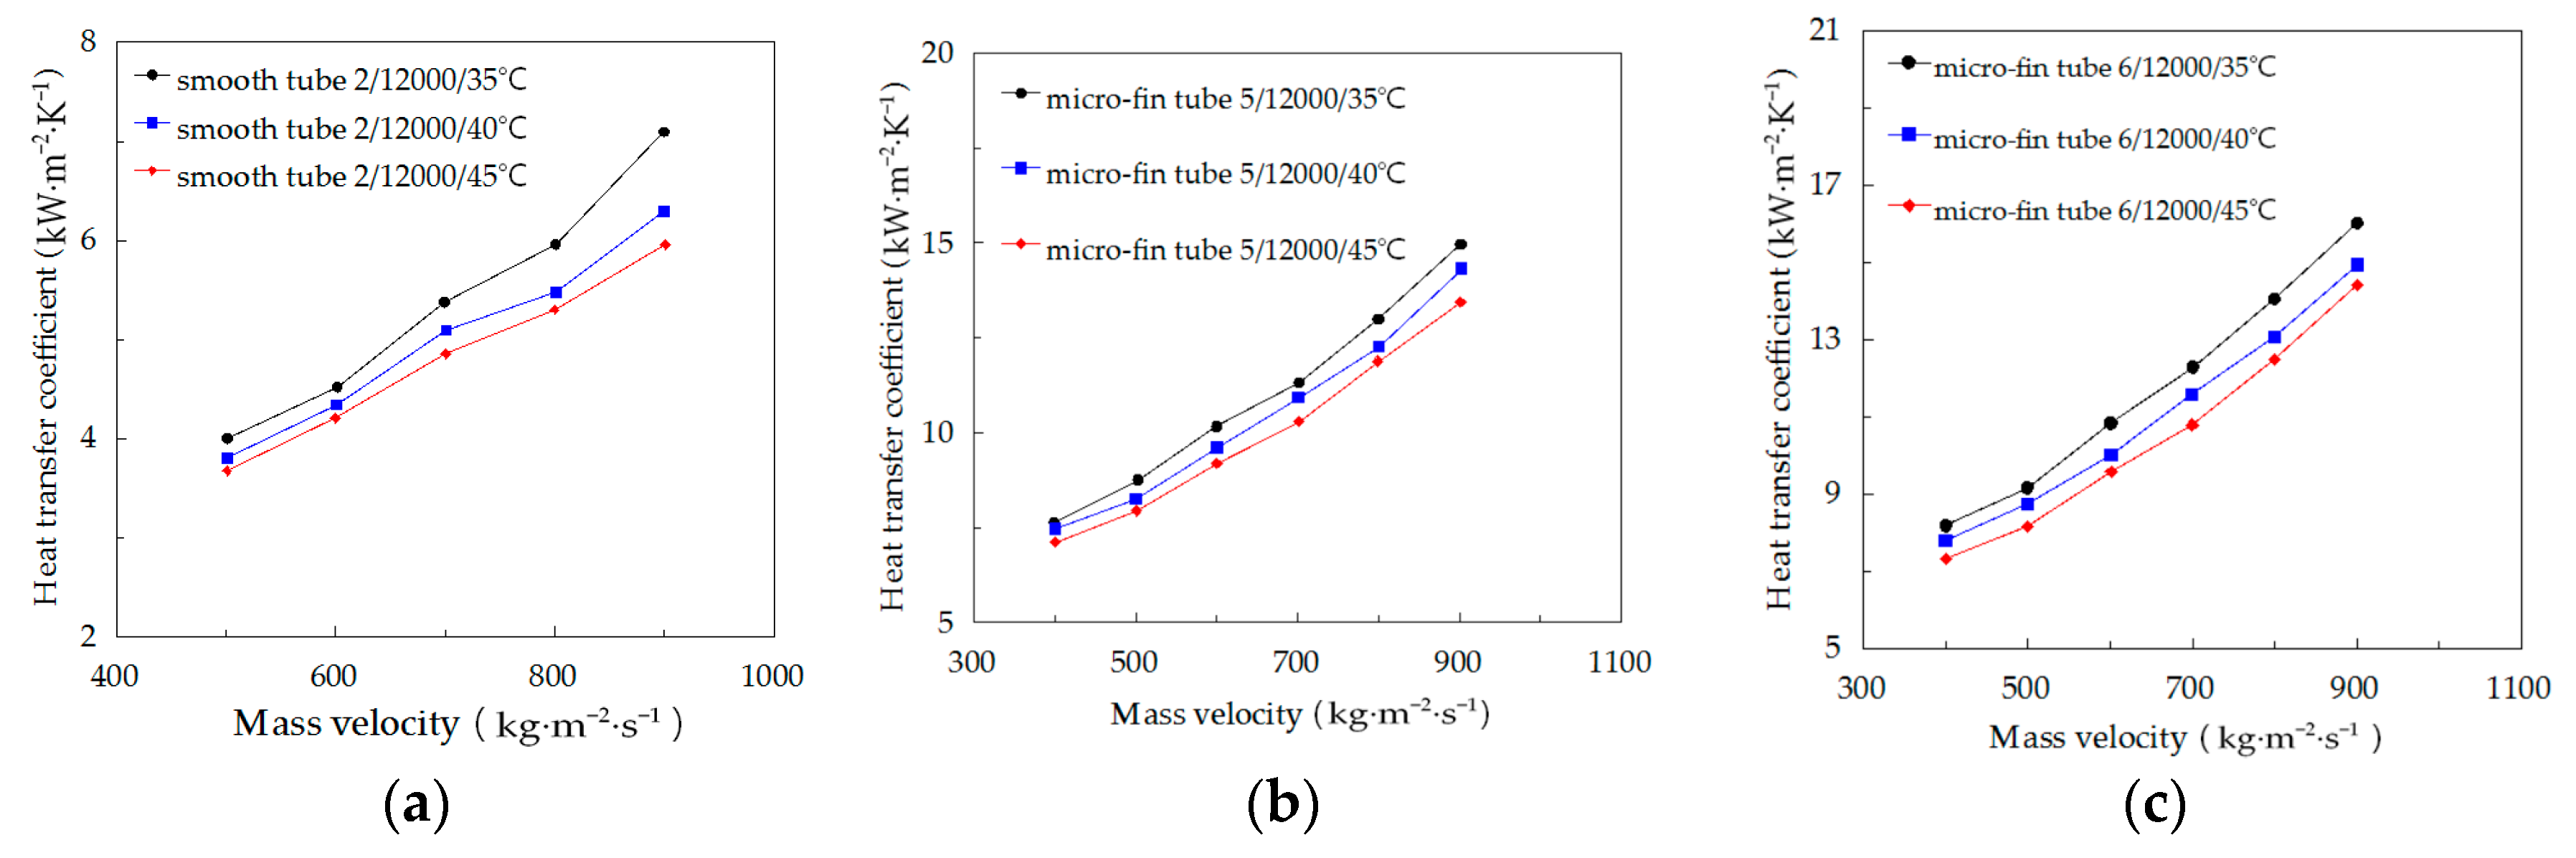
Figure 8.
Influence of water-testing Reynolds number on the heat transfer coefficient inside (a) tubes 2; (b) 5 and (c) 6 for R134a.
Figure 8.
Influence of water-testing Reynolds number on the heat transfer coefficient inside (a) tubes 2; (b) 5 and (c) 6 for R134a.

Figure 9.
Influence of tube diameter on the heat transfer coefficient inside (a) tubes 1, 2 and (b) 3, 5, for R134a.
Figure 9.
Influence of tube diameter on the heat transfer coefficient inside (a) tubes 1, 2 and (b) 3, 5, for R134a.
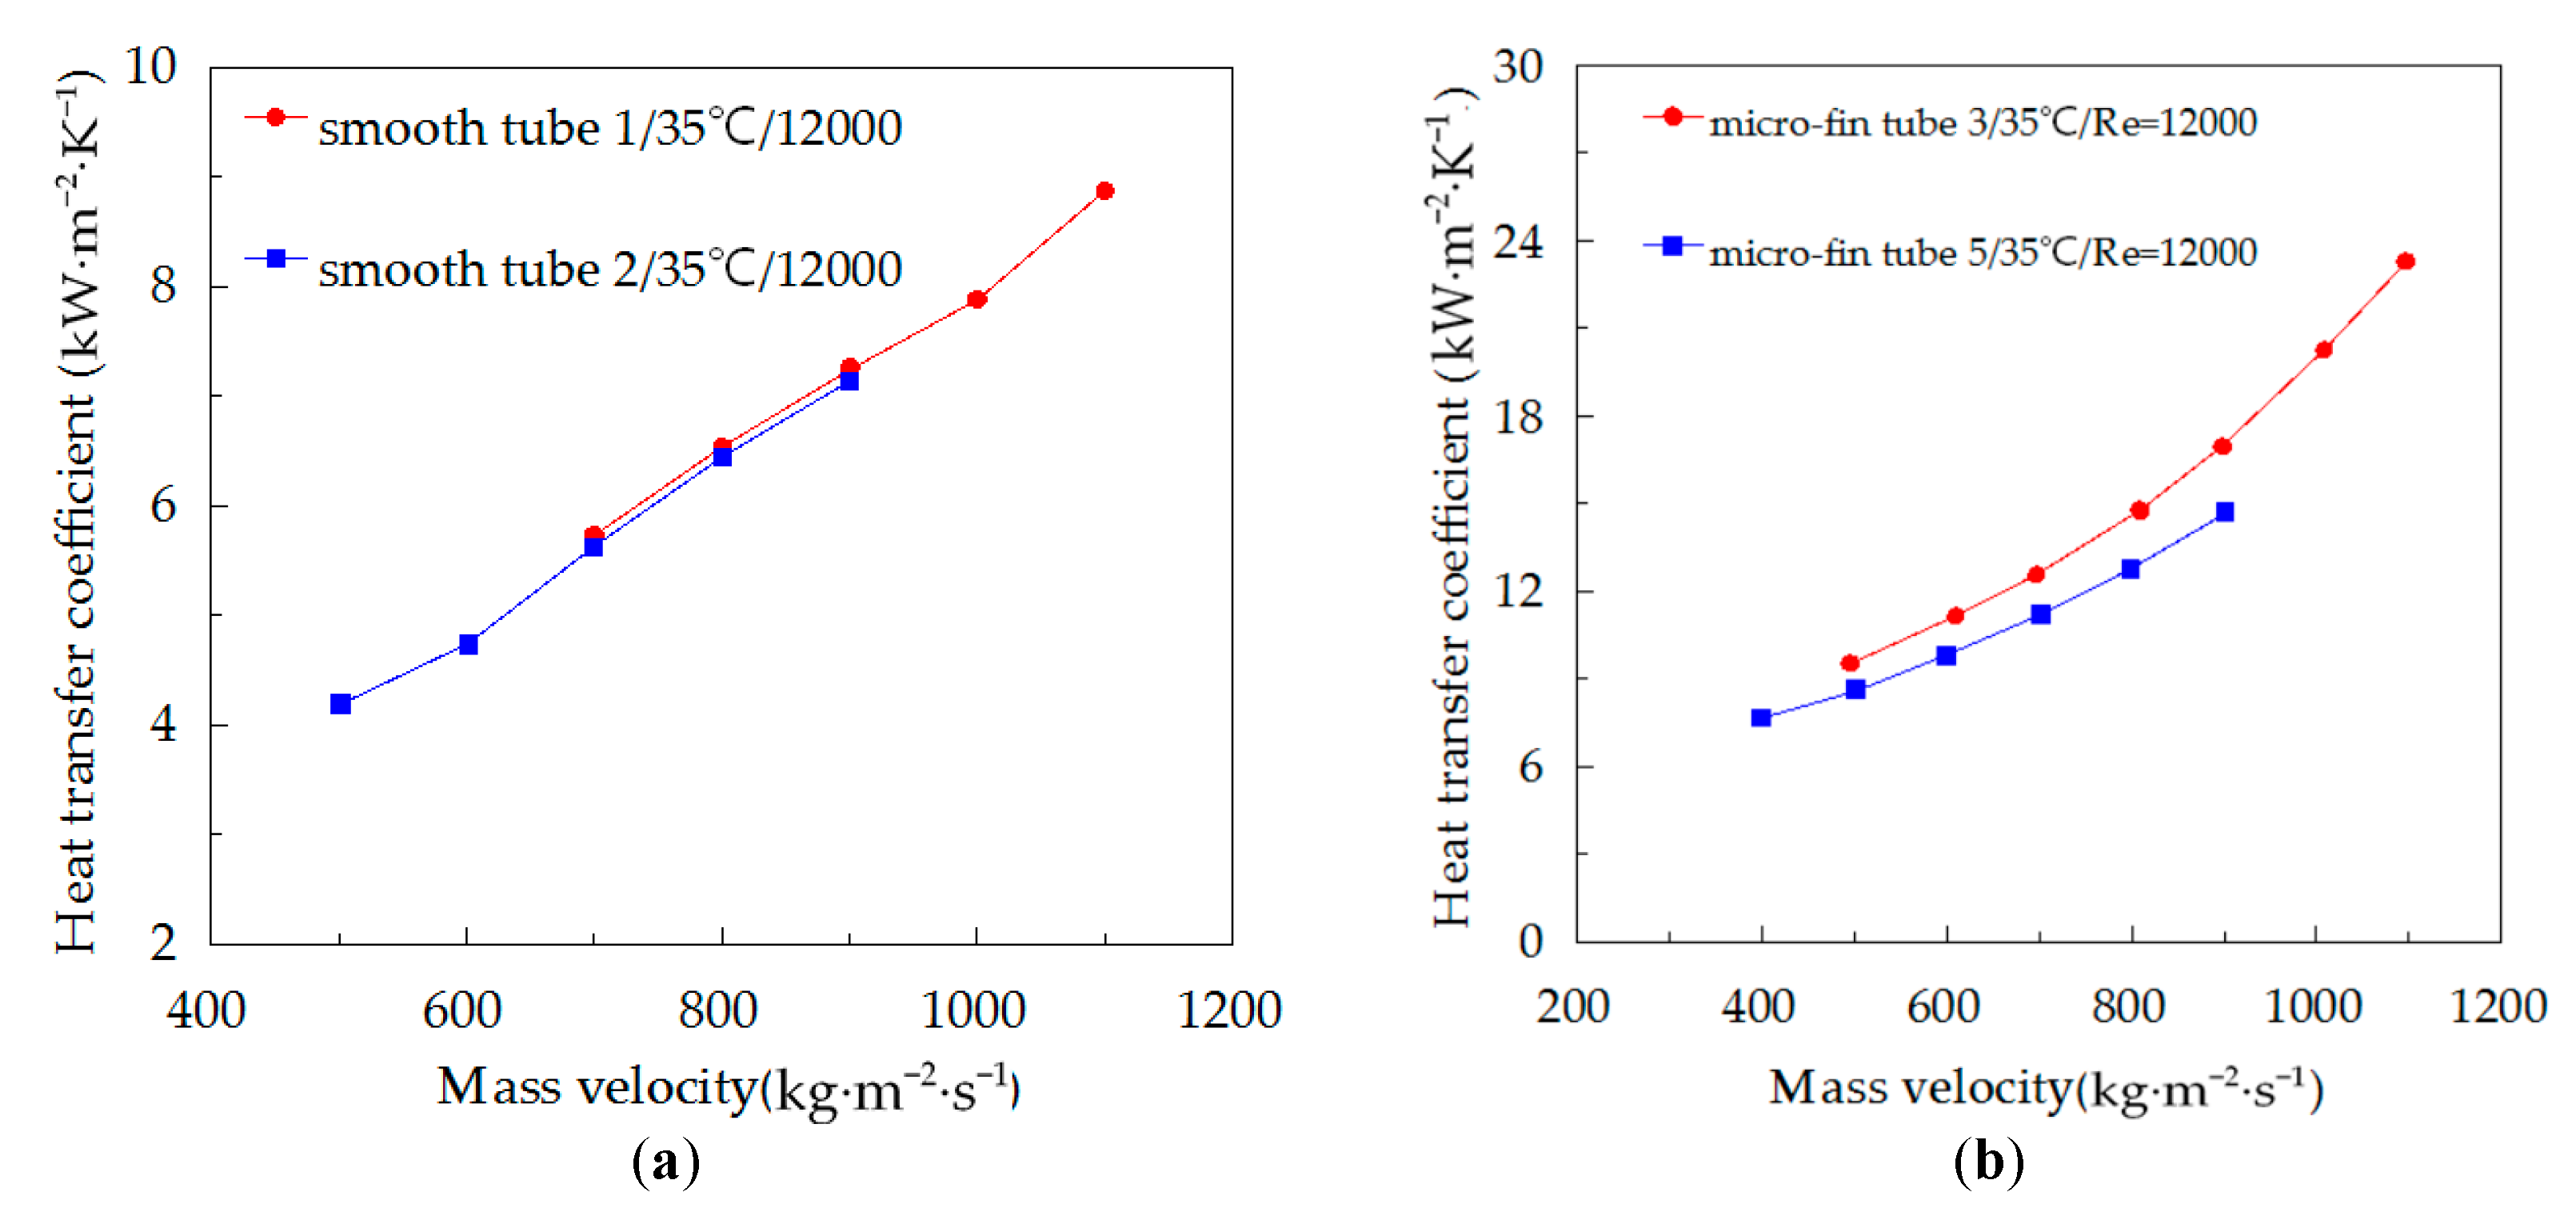
Figure 10.
Influences of structural parameters of the test tube on the heat transfer coefficient inside (a) tubes 1, 3 and 4 and (b) 2, 5 and 6 for R134a.
Figure 10.
Influences of structural parameters of the test tube on the heat transfer coefficient inside (a) tubes 1, 3 and 4 and (b) 2, 5 and 6 for R134a.

Figure 11.
Comparison of prediction methods with experimental data for smooth tubes (a) Cavallini et al.; (b) Shah; (c) Thome et al.; (d) Akers et al.; (e) Dobson and Chato et al.; (f) Jung et al.; (g) instructions of point.
Figure 11.
Comparison of prediction methods with experimental data for smooth tubes (a) Cavallini et al.; (b) Shah; (c) Thome et al.; (d) Akers et al.; (e) Dobson and Chato et al.; (f) Jung et al.; (g) instructions of point.


Figure 12.
Comparison of prediction methods with experimental data for micro-fin tubes: Cavallini et al. for micro-fin tubes (a) 3 and 4; and (b) 5 and 6; Miyara et al. for micro-fin tubes (c) 3 and 4; and (d) 5 and 6; Koyama et al. for micro-fin tubes (e) 3 and 4; and (f) 5 and 6; Oliver et al. for micro-fin tubes (g) 3 and 4; and (h) 5 and 6; (i) instructions of point.
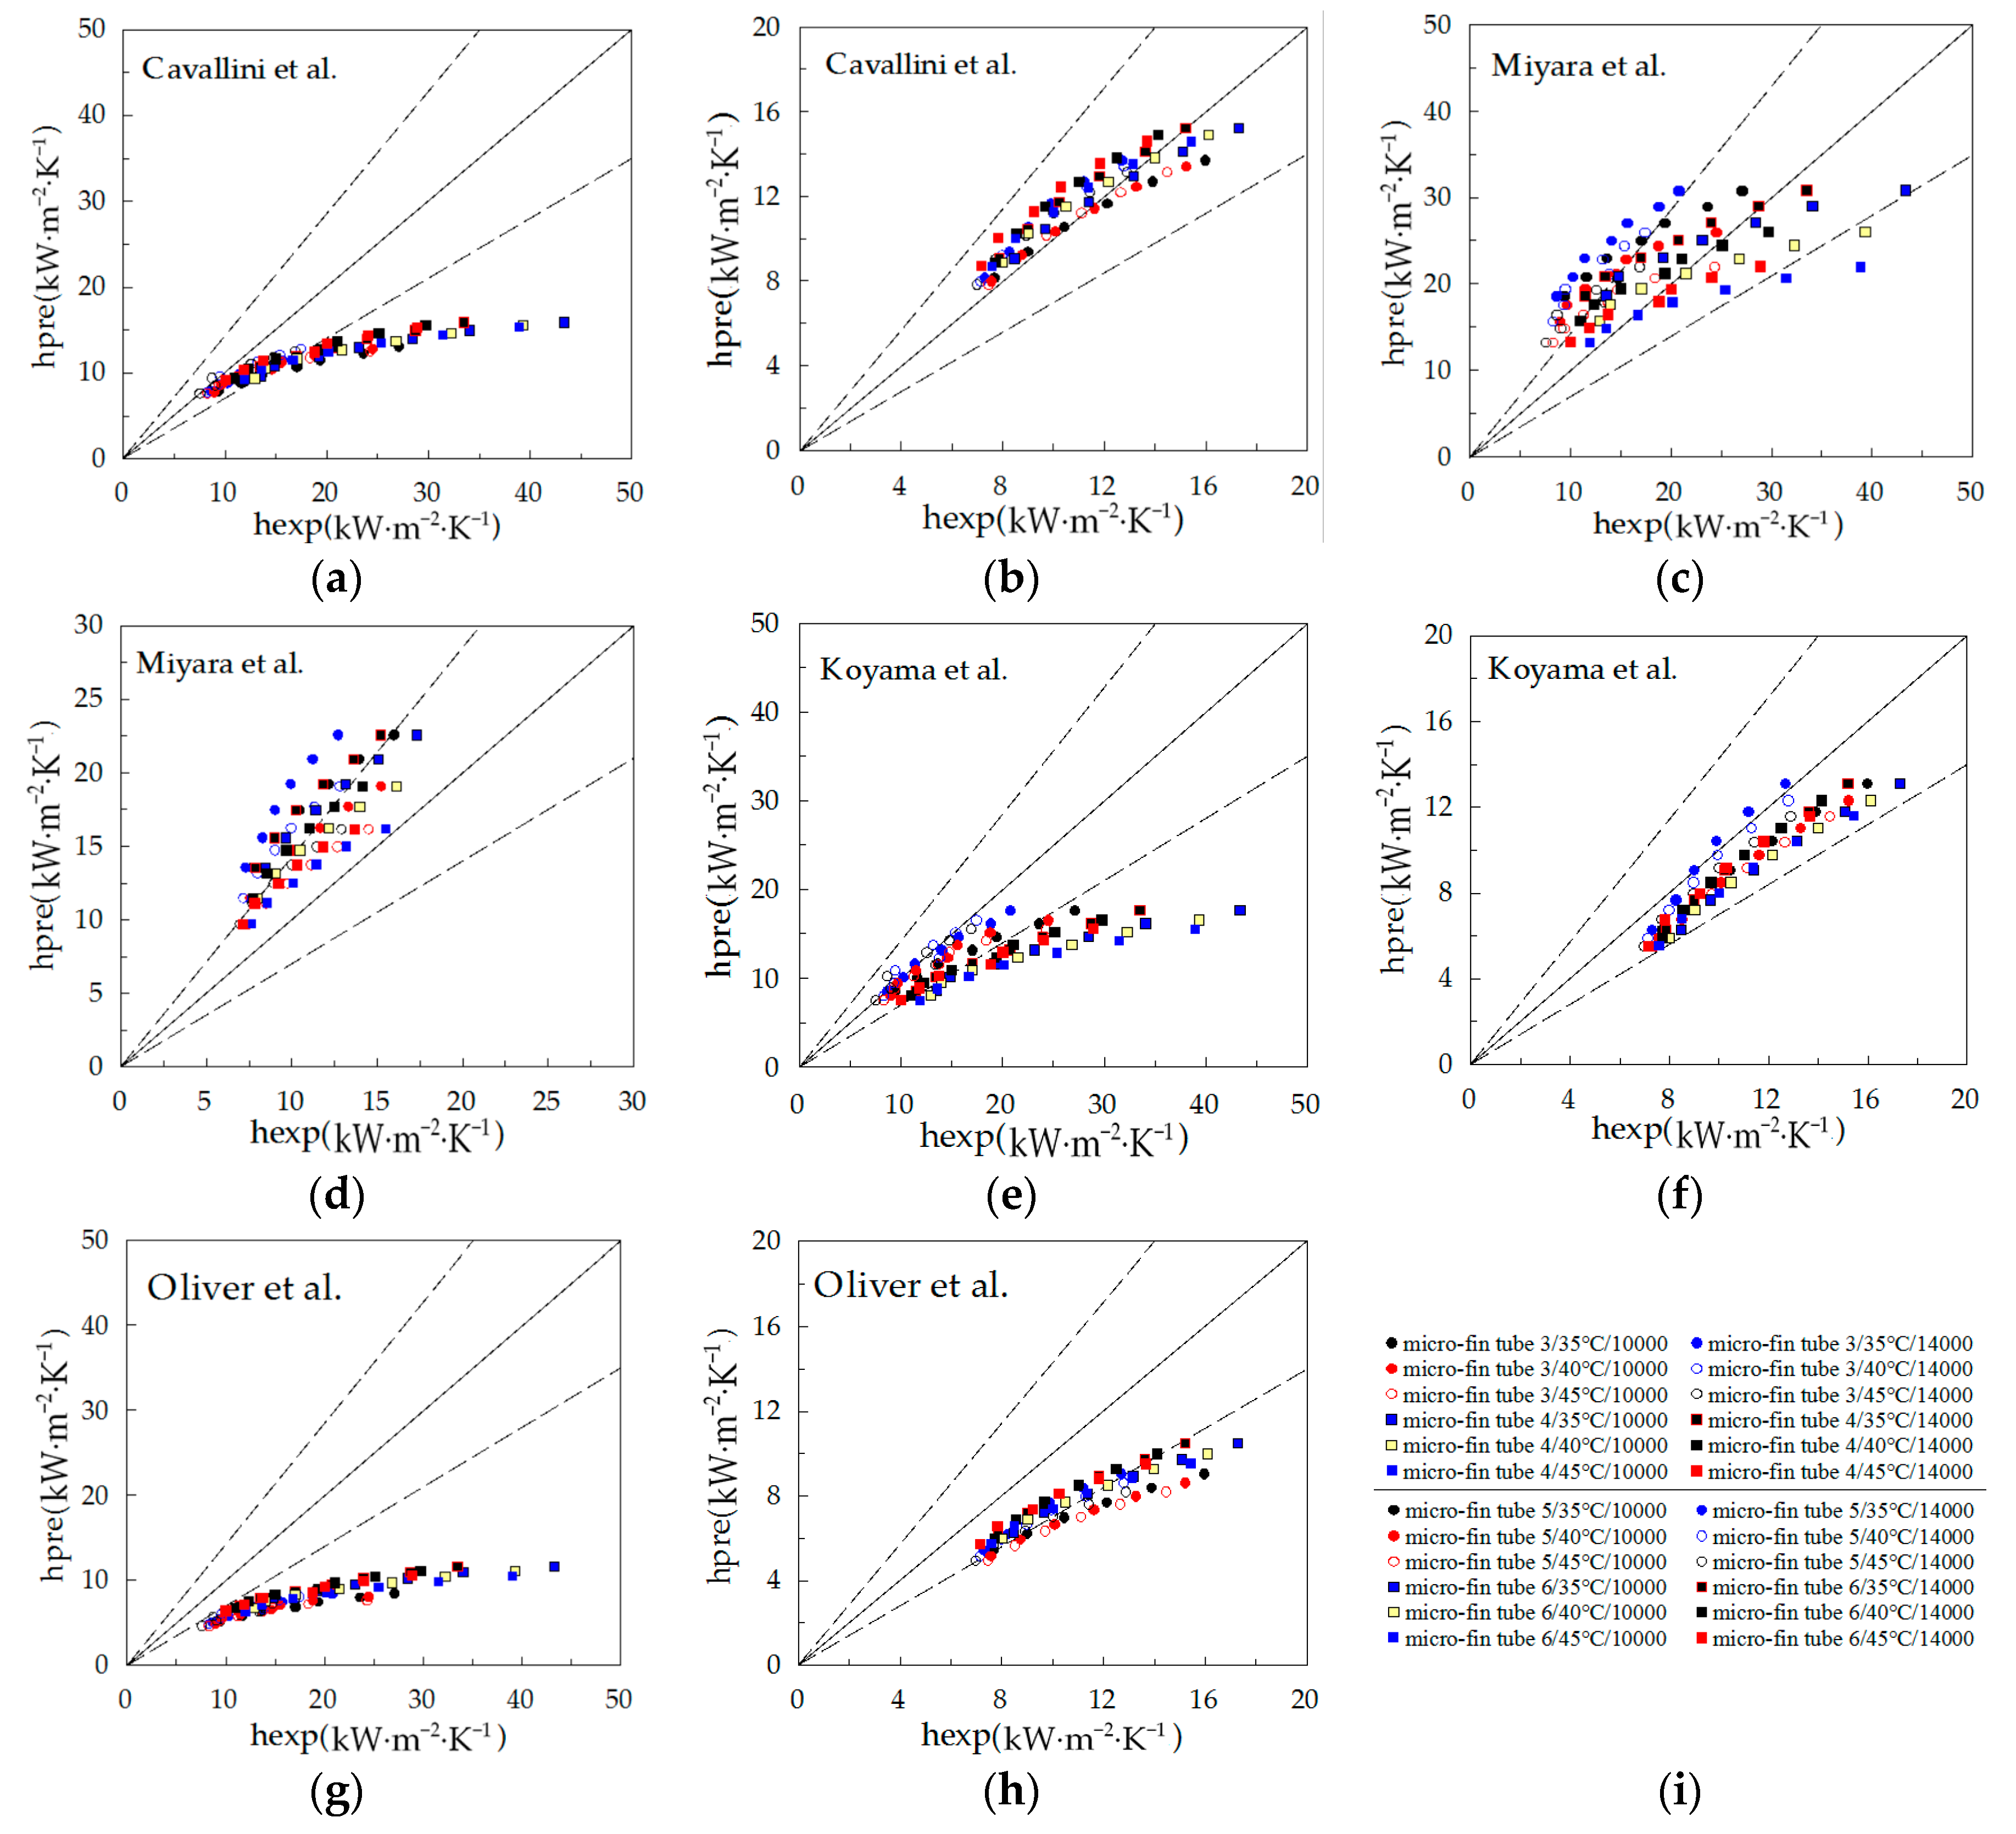
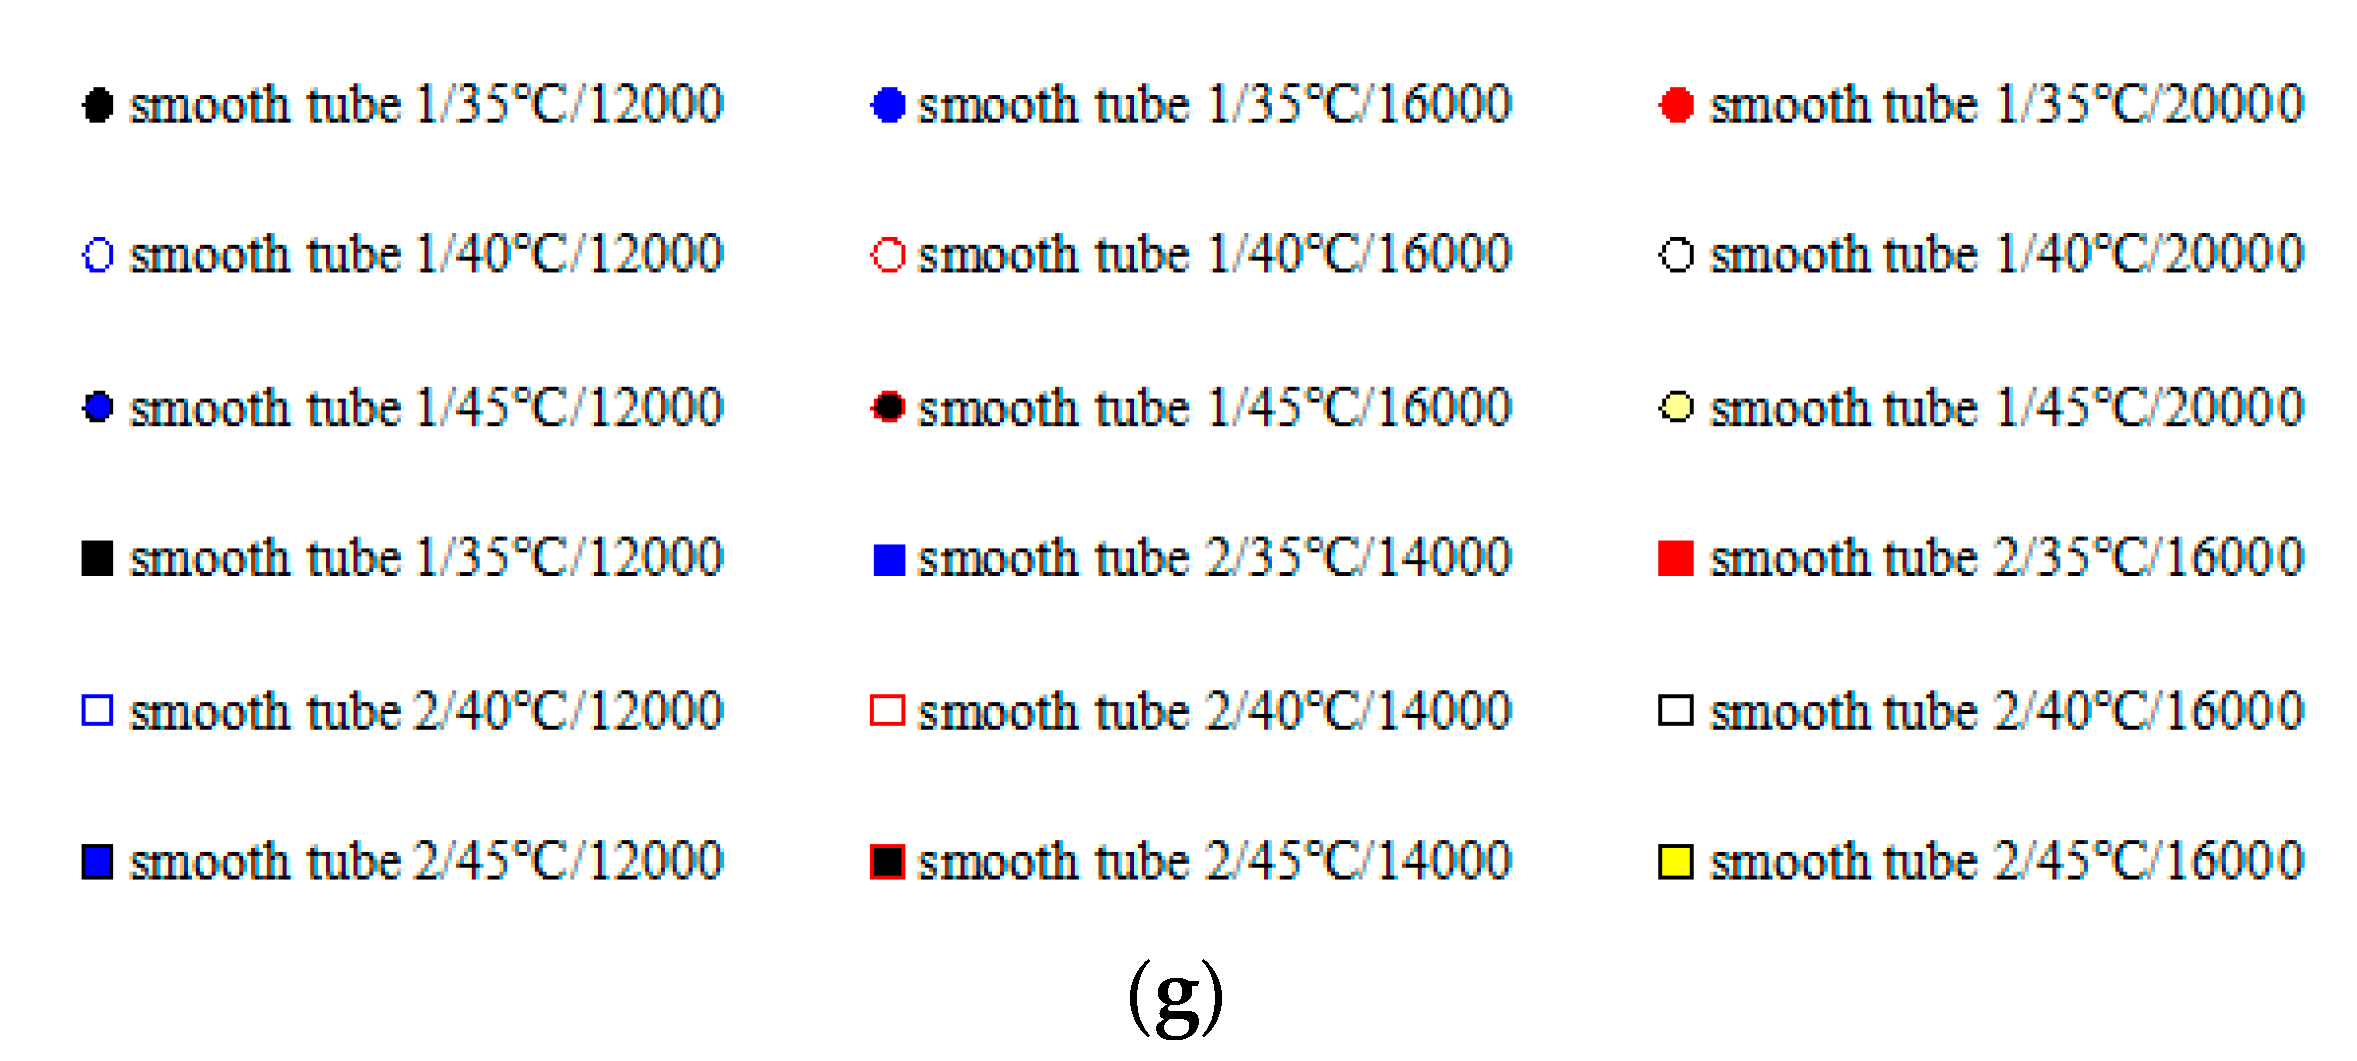
Figure 13.
Comparison of modified correlations with experimental data for test tubes: (a) Modified Dobson and Chato et al.; (b) Modified Jung et al.; (c) Modified Cavallini et al.; (d) Modified Koyama et al.; (e) Modified Oliver et al.
Figure 13.
Comparison of modified correlations with experimental data for test tubes: (a) Modified Dobson and Chato et al.; (b) Modified Jung et al.; (c) Modified Cavallini et al.; (d) Modified Koyama et al.; (e) Modified Oliver et al.


Table 1.
The structural parameters of test tubes.
| Number | Type Tube | Outer Diameter Do (mm) | Inner Diameter Di (mm) | Helical Angle β (°) | Fin Height H (mm) | Addendum Angle γ (°) | Number of Fins N | Teeth Space dt (mm) | Groove Width dg (mm) | Effective Length of Heat Transfer L (m) |
|---|---|---|---|---|---|---|---|---|---|---|
| 1 | smooth tube | 6.35 | 5.89 | - | - | - | - | - | - | 2 |
| 2 | smooth tube | 8.00 | 7.56 | - | - | - | - | - | - | 2 |
| 3 | micro-fin tube | 6.35 | 5.89 | 18 | 0.17 | 25 | 44 | 0.4 | 0.25 | 2 |
| 4 | micro-fin tube | 6.35 | 5.89 | 28 | 0.17 | 33 | 54 | 0.35 | 0.15 | 2 |
| 5 | micro-fin tube | 8.00 | 7.56 | 18 | 0.23 | 24.5 | 60 | 0.4 | 0.20 | 2 |
| 6 | micro-fin tube | 8.00 | 7.56 | 28 | 0.23 | 24.5 | 60 | 0.4 | 0.20 | 2 |
Table 2.
The uncertainty of experimental parameters.
| Nomenclature | Uncertainty | Nomenclature | Uncertainty |
|---|---|---|---|
| Temperature | ±0.1 °C | Water-testing Reynolds number | ±0.53% |
| Pressure, range: 0–4.2 MPa | ±0.1% of full scale | Heat transfer rate | ±3.4% |
| Differential pressure, rang: 0–150 kPa | ±0.065% of reading | Heat leakage rate | ±4.1% |
| Water-testing flow rate | 0.5% of reading | Log-mean temperature difference | ±0.31 °C |
| Water–glycol flow rate | 0.5% of reading | Total heat transfer coefficient | ±5.2% |
| Refrigerant mass flux, range: 0–6 kg/min | 0.1% of reading | Water-testing heat transfer coefficient | ±0.55% |
| Refrigerant mass velocity | ±0.1% | Refrigerant heat transfer coefficient | ±13.5% |
Table 3.
Thermal-physical properties of R134a.
| Refrig-erant | Tempe-rature (°C) | Pressure (MPa) | Liquid Density (kg·m−3) | Vapor Density (kg·m−3) | Liquid Thermal Conductivity (W·m−1·°C−1) | Vapor Thermal Conductivity (W·m−1·°C−1) | Liquid Viscosity (Pa·s) | Vapor Viscosity (Pa·s) | Surface Tension (N·m−1) |
|---|---|---|---|---|---|---|---|---|---|
| R134a | 35 | 0.88698 | 1167.5 | 43.416 | 0.076853 | 14.874 | 0.00017200 | 0.000012132 | 0.0067656 |
| 40 | 1.0166 | 1146.7 | 50.085 | 0.075446 | 15.446 | 0.00016145 | 0.000012373 | 0.0061268 | |
| 45 | 1.1599 | 1125.1 | 57.657 | 0.072575 | 16.062 | 0.00015139 | 0.000012633 | 0.0055016 |
Table 4.
Working conditions of the experiment.
| Refrigerant | R134a |
|---|---|
| Condensation temperature | 35 °C, 40 °C, 45 °C |
| Mass velocity, kg·m−2·s−1 | 400, 500, 600, 700, 800, 900, 1000, 1100 |
| Water-testing Reynolds number | 8000, 10,000, 12,000, 14,000, 16,000, 18,000, 20,000, 22,000 |
Table 5.
Deviation of various correlations against the experimental heat transfer coefficient.
| Correlation | Cavallini et al. | Shah | Thome et al. | Akers et al. | Dobson and Chato et al. | Jung et al. | ||||
| Deviation | MD b | MD b | MD b | MD b | MD b | MD b | ||||
| Smooth tubes 1 and 2 | 13.05 | 26.07 | 23.82 | 26.11 | 140.18 | 146.23 | ||||
| Correlation | Cavallini et al. | Miyara et al. | Koyama et al. | Oliver et al. | ||||||
| Deviation | AD a | MD b | AD a | MD b | AD a | MD b | AD a | MD b | ||
| Micro-fin tubes 3 and 4 | −30.51 | 31.50 | 37.25 | 55.95 | −26.34 | 27.46 | −52.41 | 54.48 | ||
| Micro-fin tubes 5 and 6 | 6.52 | 6.62 | 4.68 | 4.73 | −16.35 | 16.75 | −28.79 | 29.97 | ||
| Modified Correlation | Modified Dobson and Chato et al. | Modified Jung et al. | Modified Cavallini et al. | Modified Koyama et al. | Modified Oliver et al. | |||||
| Deviation | AD a | MD b | AD a | MD b | AD a | MD b | AD a | MD b | AD a | MD b |
| Smooth tubes 1 and 2 | - | 20.31 | - | 23.24 | - | - | - | - | - | - |
| Micro-fin tubes 3 and 4 | - | - | - | - | 6.75 | 13.06 | −5.57 | 5.37 | 0.62 | 16.13 |
a: Average deviation ; b: Mean deviation .
© 2017 by the authors. Licensee MDPI, Basel, Switzerland. This article is an open access article distributed under the terms and conditions of the Creative Commons Attribution (CC BY) license (http://creativecommons.org/licenses/by/4.0/).
Share and Cite
MDPI and ACS Style
Li, Q.; Tao, L.; Li, L.; Hu, Y.; Wu, S. Experimental Investigation of the Condensation Heat Transfer Coefficient of R134a inside Horizontal Smooth and Micro-Fin Tubes. Energies 2017, 10, 1280. https://doi.org/10.3390/en10091280
AMA Style
Li Q, Tao L, Li L, Hu Y, Wu S. Experimental Investigation of the Condensation Heat Transfer Coefficient of R134a inside Horizontal Smooth and Micro-Fin Tubes. Energies. 2017; 10(9):1280. https://doi.org/10.3390/en10091280
Chicago/Turabian StyleLi, Qingpu, Leren Tao, Lei Li, Yongpan Hu, and Shengli Wu. 2017. "Experimental Investigation of the Condensation Heat Transfer Coefficient of R134a inside Horizontal Smooth and Micro-Fin Tubes" Energies 10, no. 9: 1280. https://doi.org/10.3390/en10091280
Note that from the first issue of 2016, this journal uses article numbers instead of page numbers. See further details here.