Energy Flexibility from Large Prosumers to Support Distribution System Operation—A Technical and Legal Case Study on the Amsterdam ArenA Stadium

 ,
,
Abstract
:1. Introduction
- -
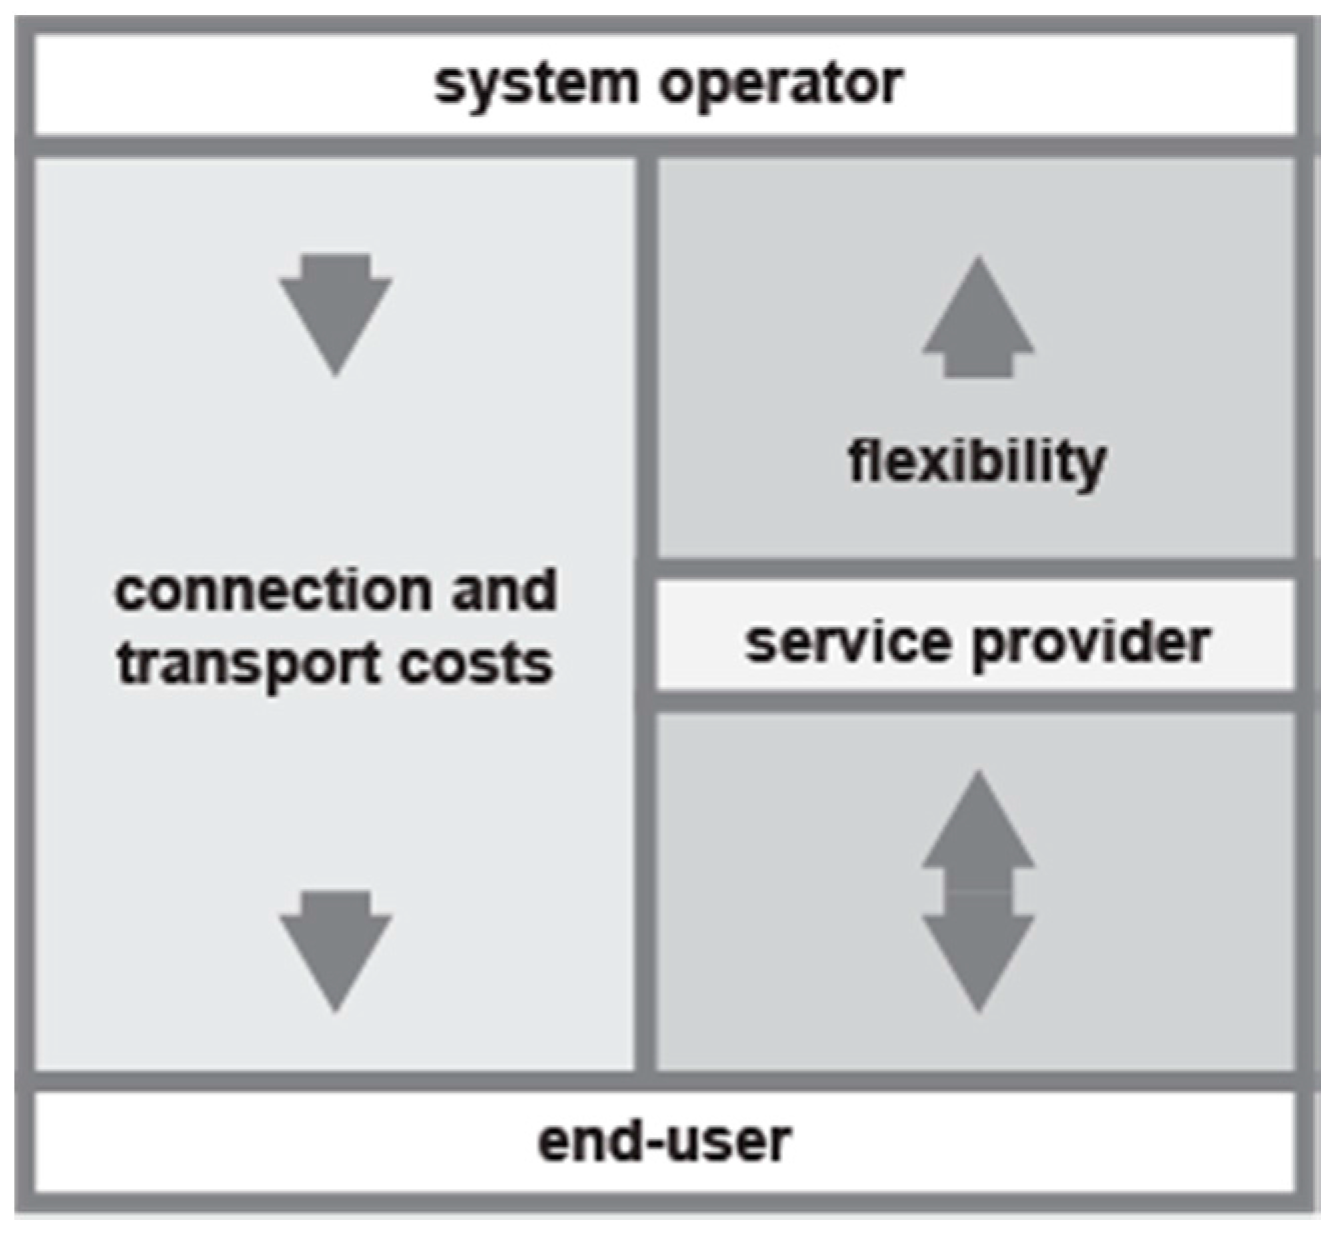
- An integrated discussion on the use of flexibility from large customers from both a technical and a legal perspective;
- -
- Identification of potential use cases of flexibility to exploit flexibility values for both system users and distribution grid operators; and,
- -
- Identification of potential legal barriers for the use of flexibility by DSOs.
2. Method: DISPATCH Framework and Central Research Questions
2.1. Abstract Interaction Layer: The Electricity System
2.2. Concrete Interaction Layer: DISPATCH2 Case Study
- (1)
- a base-case where no flexibility is available;
- (2)
- the ArenA using the flexibility provided by the planned storage system for peak-shaving its own load;
- (3)
- the ArenA coordinating with the DSO to use the flexibility provided by the planned storage system to reduce peak loads in the grid;
- (4)
- the DSO coordinating the flexibility provided by the planned storage system in the ArenA and flexibility provided by smart charging of the EVs to minimise peak use in the grid.
2.3. Discipline Specific Research Layer
2.3.1. Technical Aspects
- -
- to determine how flexibility provided by the ArenA’s planned storage system and the smart charging of EVs can increase the hosting capacity of the network surrounding the Arena, and;
- -
- to determine how different use of the flexibility in the system aligns with the objectives of the various stakeholders.
2.3.2. Legal Aspects
3. Technical Aspects
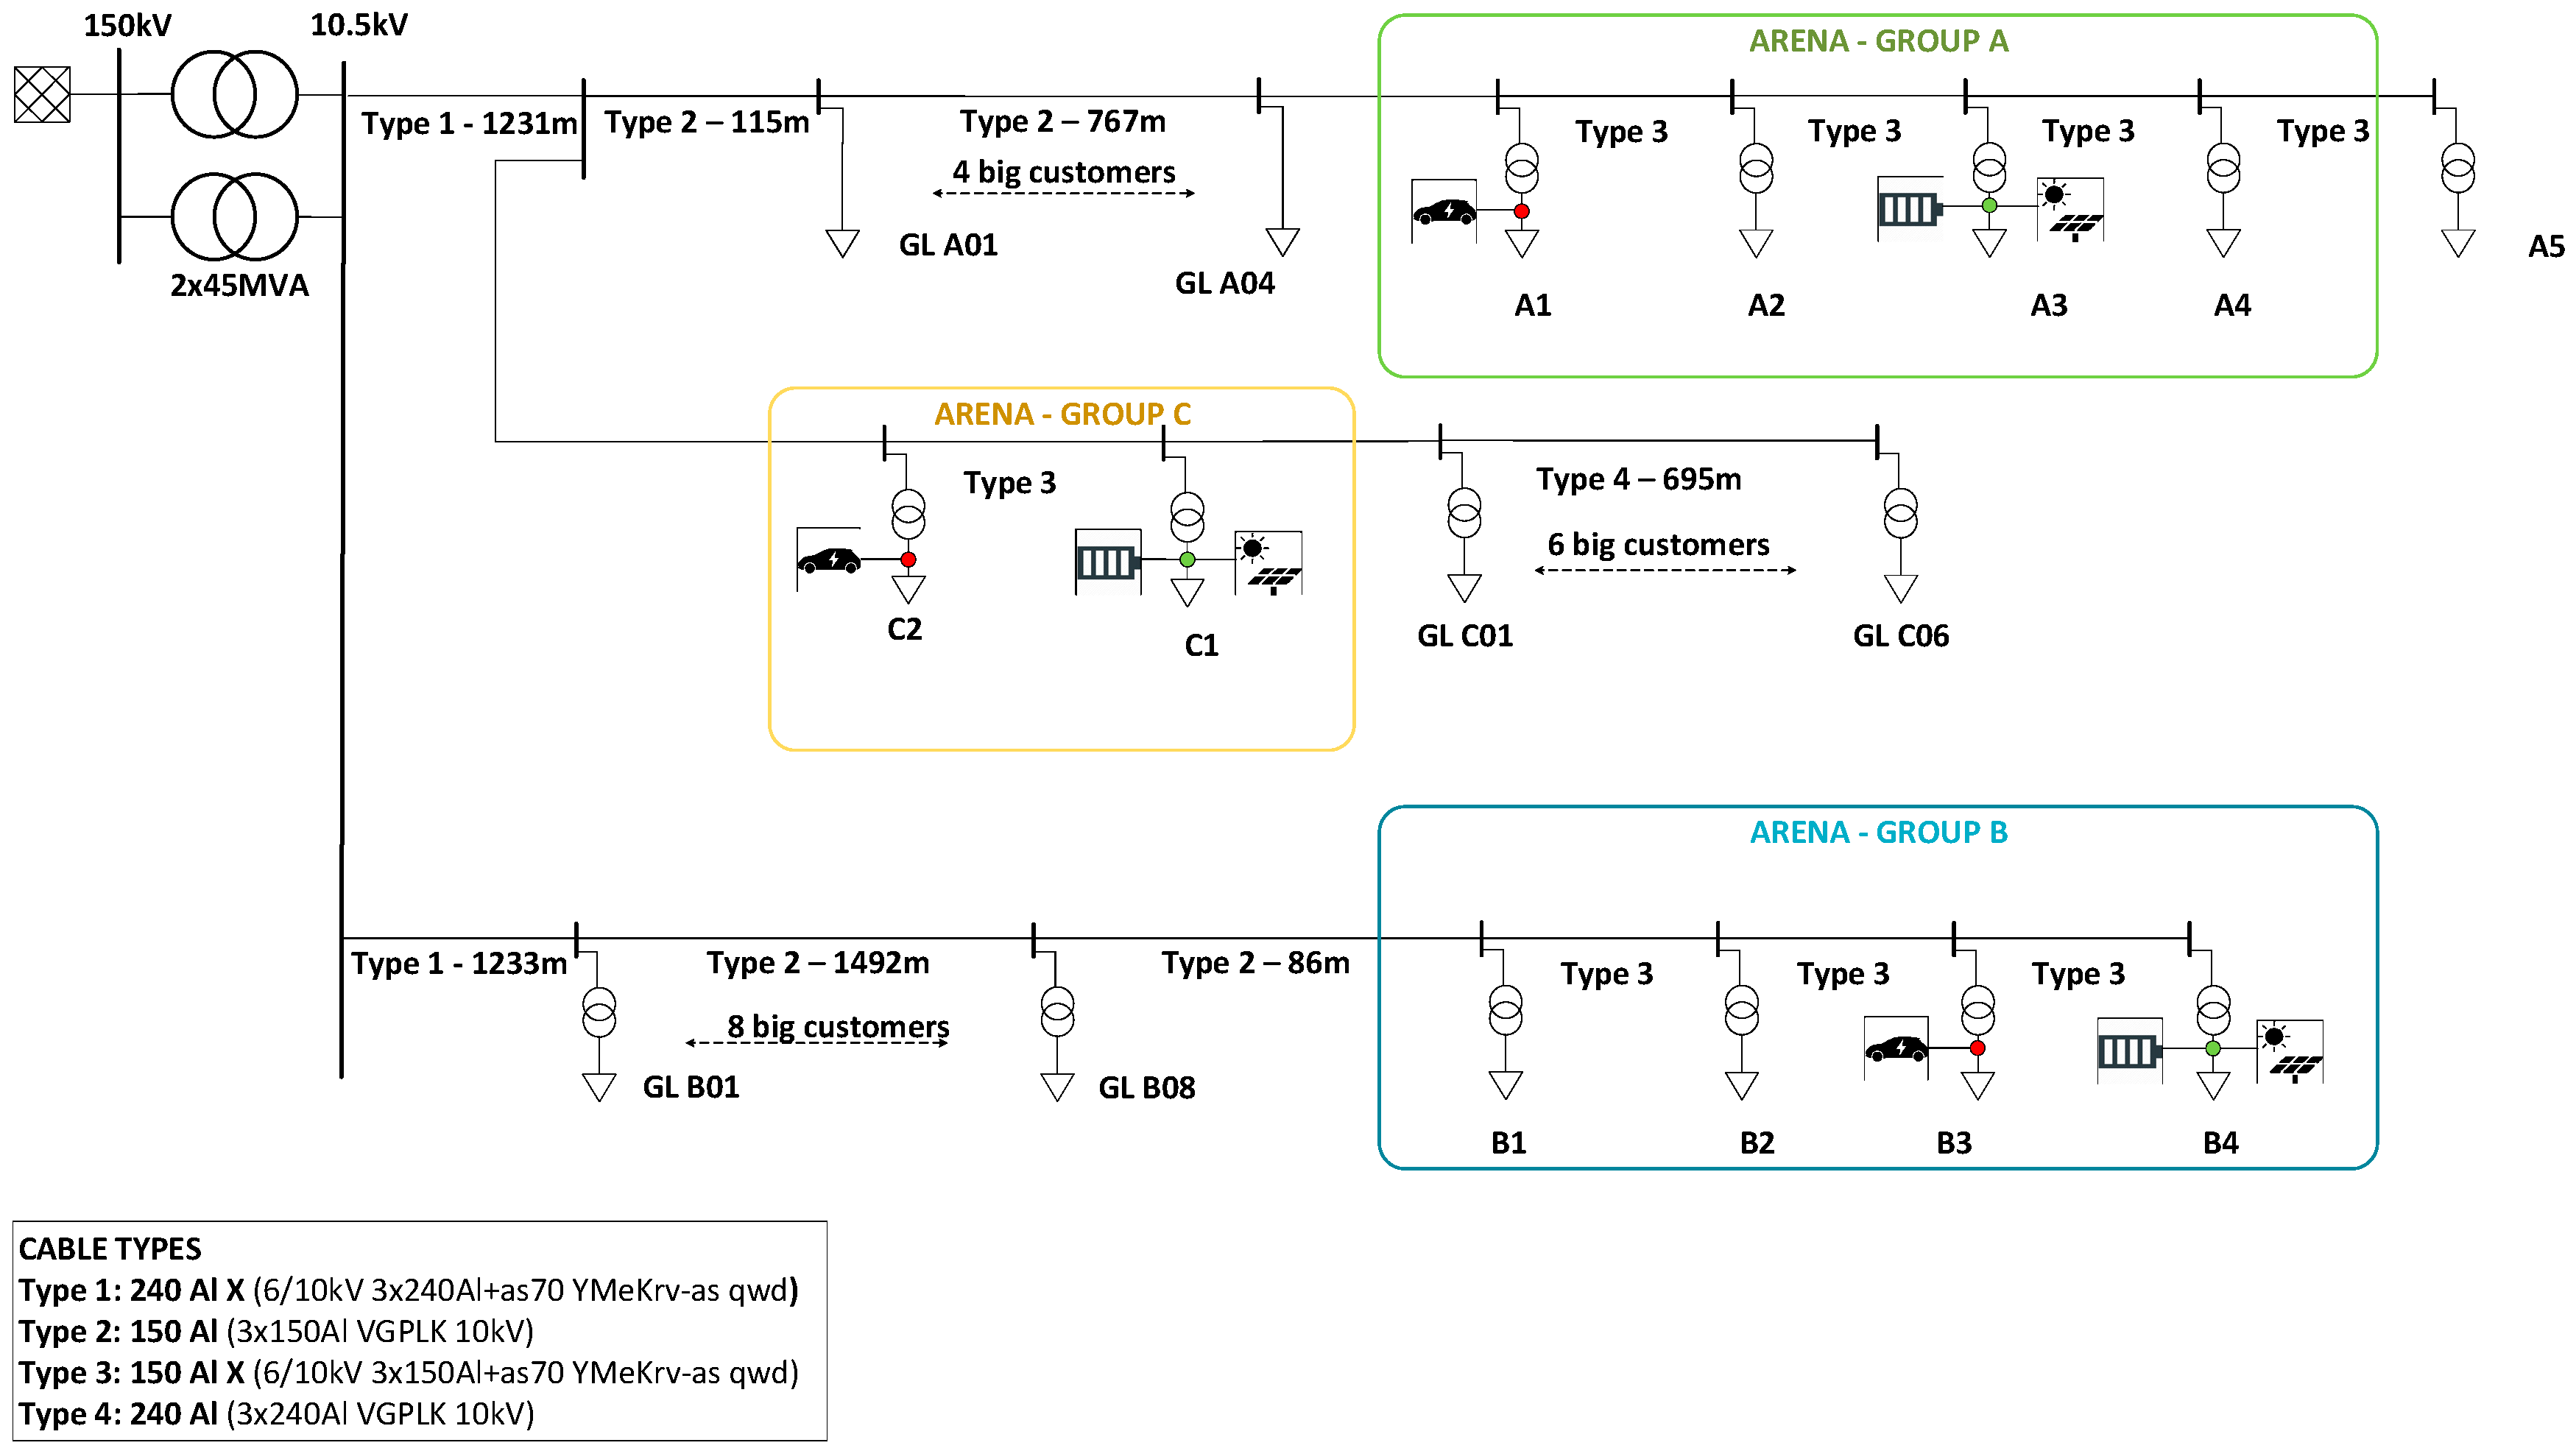
3.1. The ArenA Network
3.1.1. Network Topology
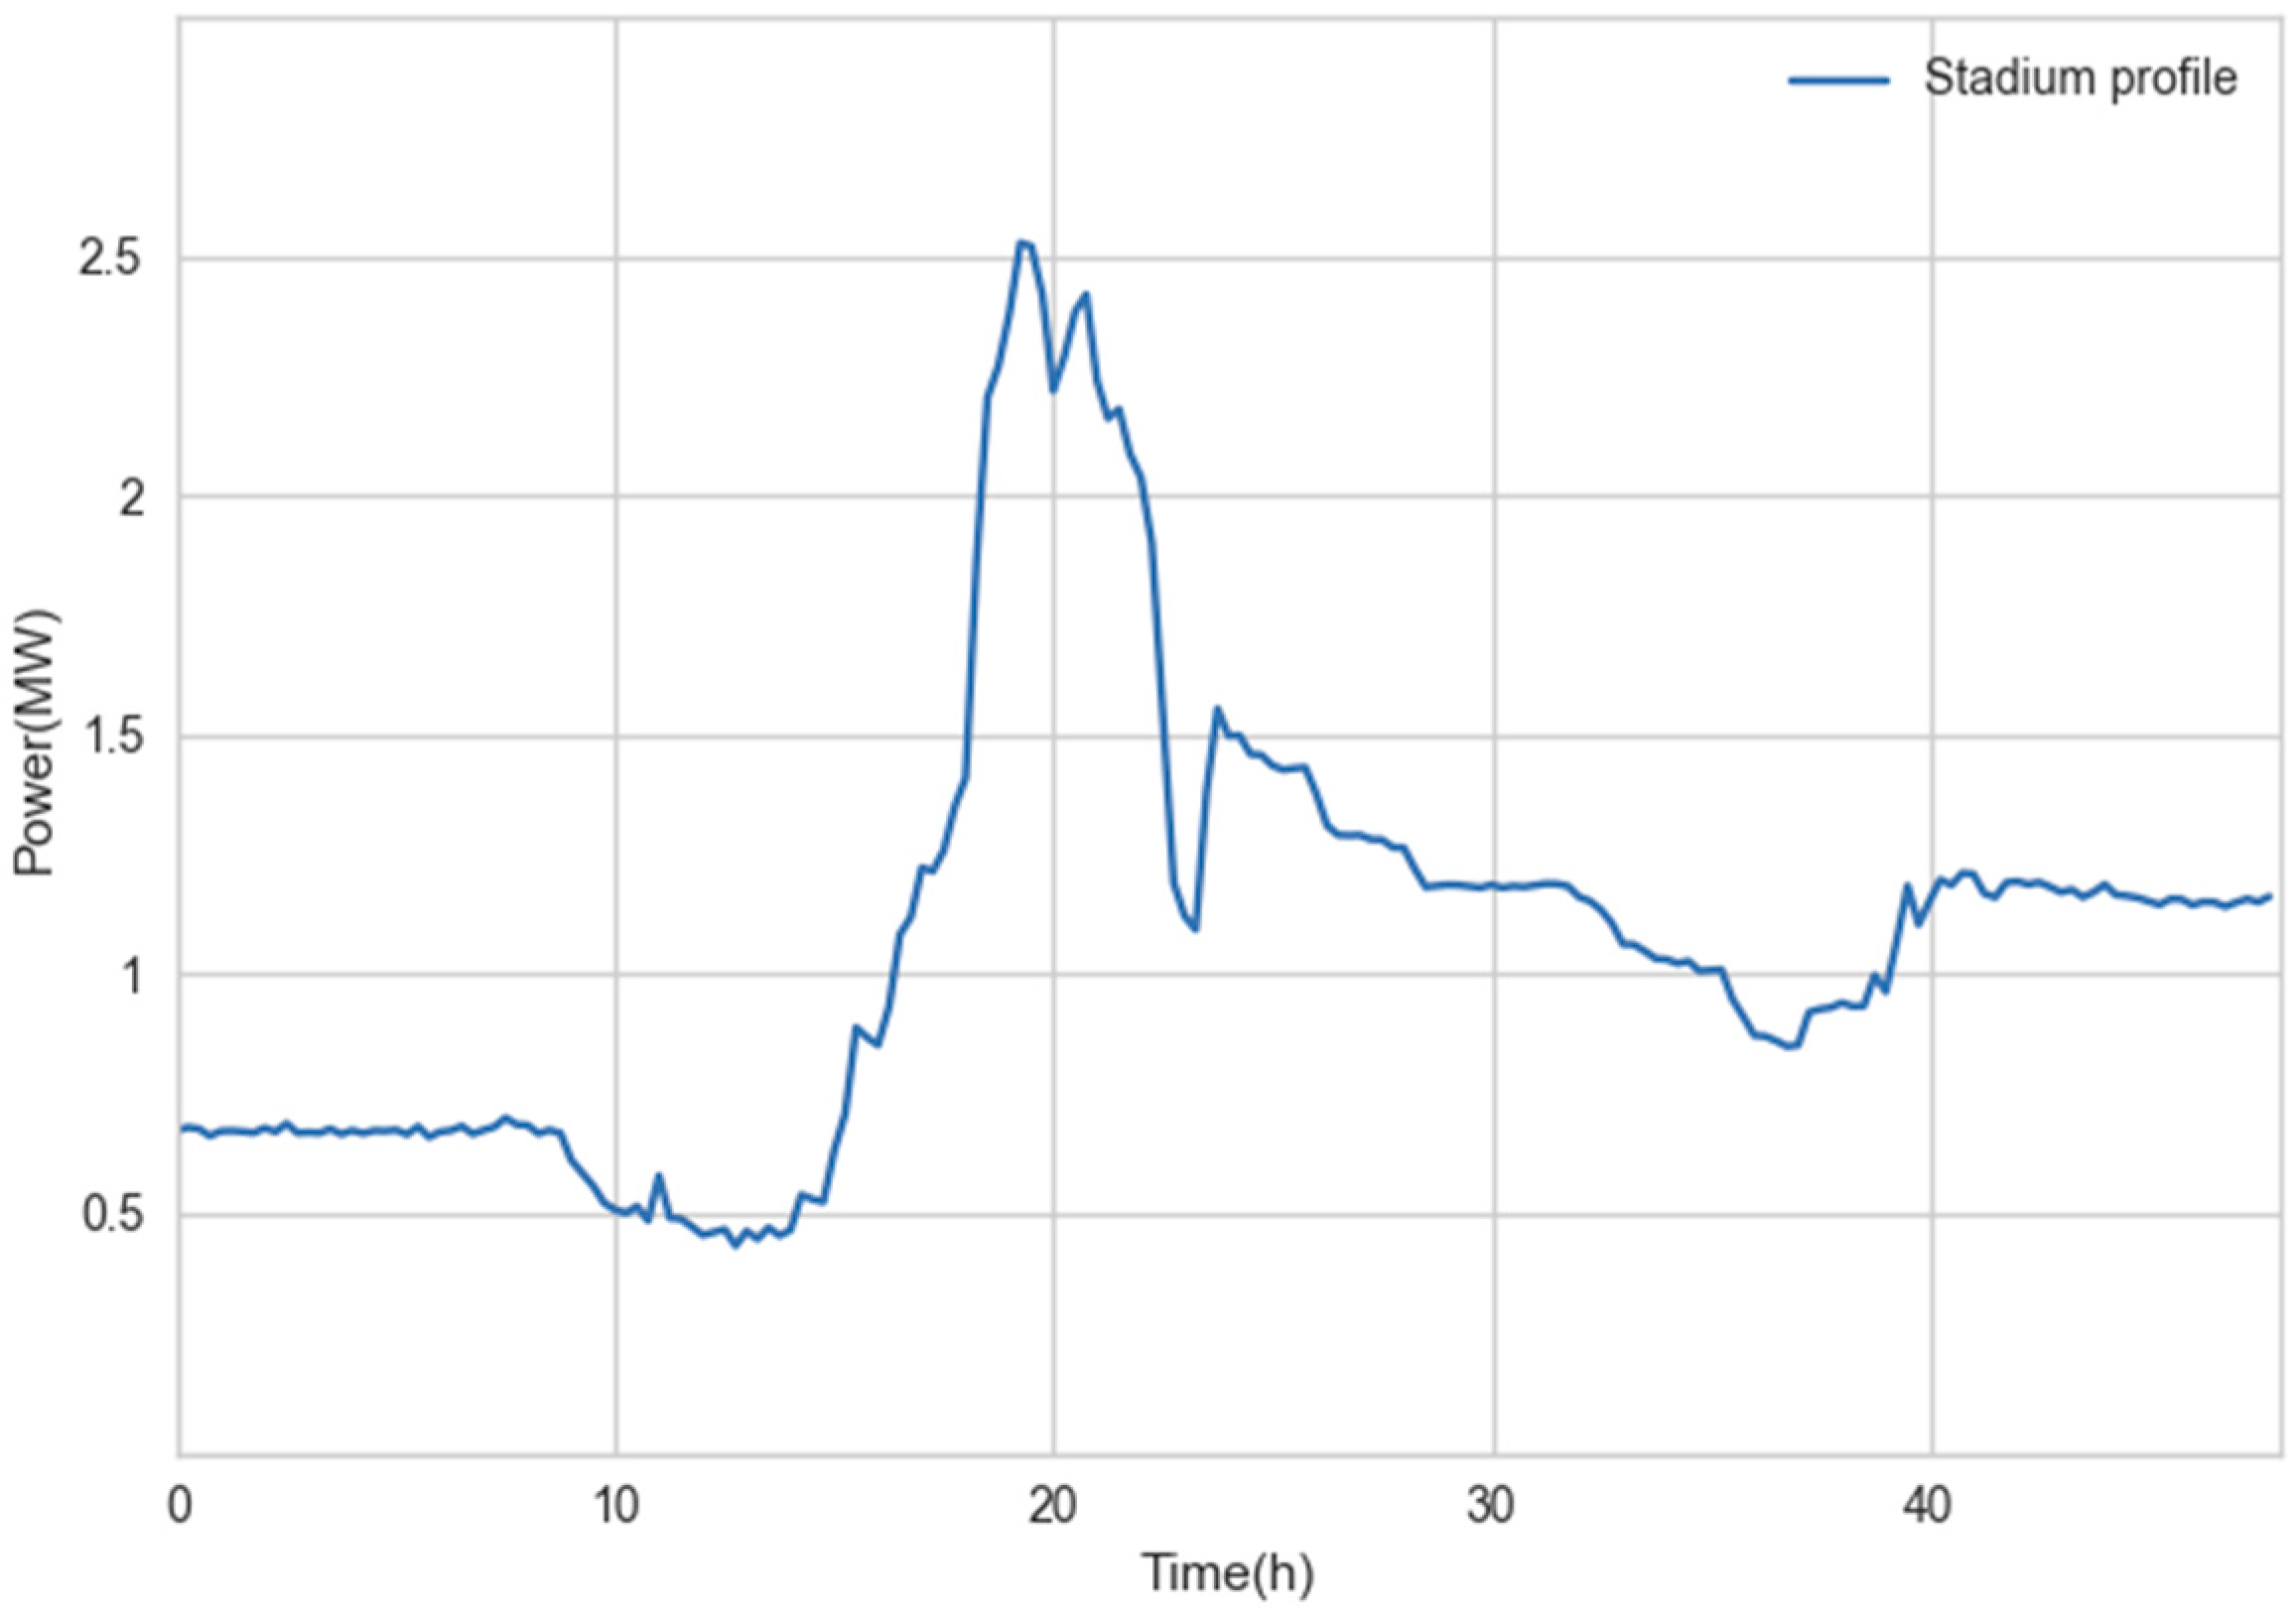
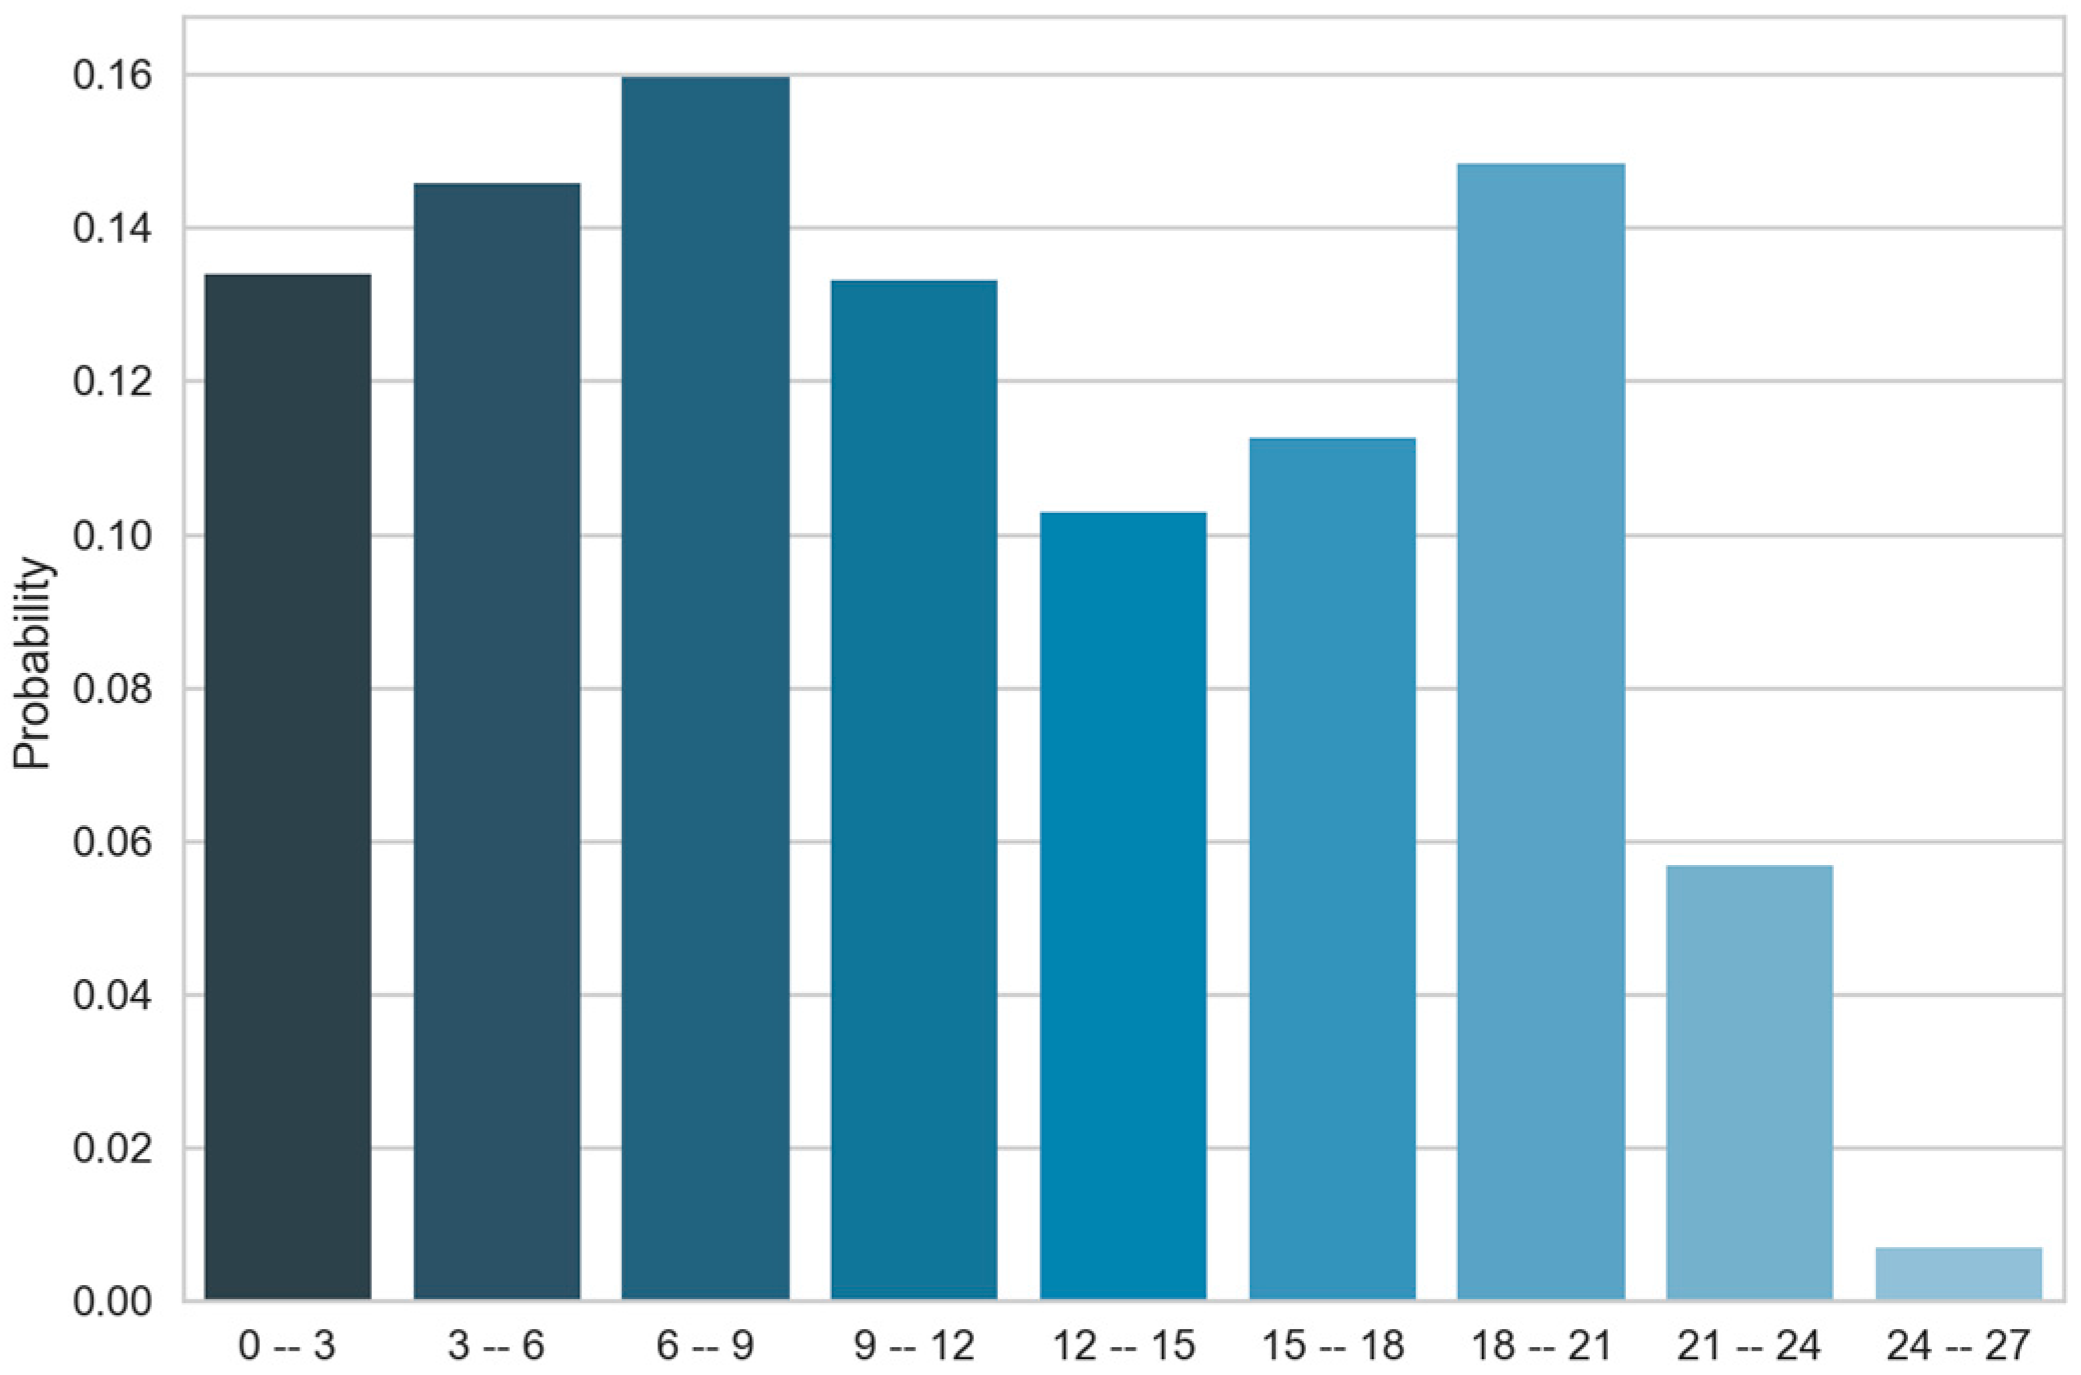
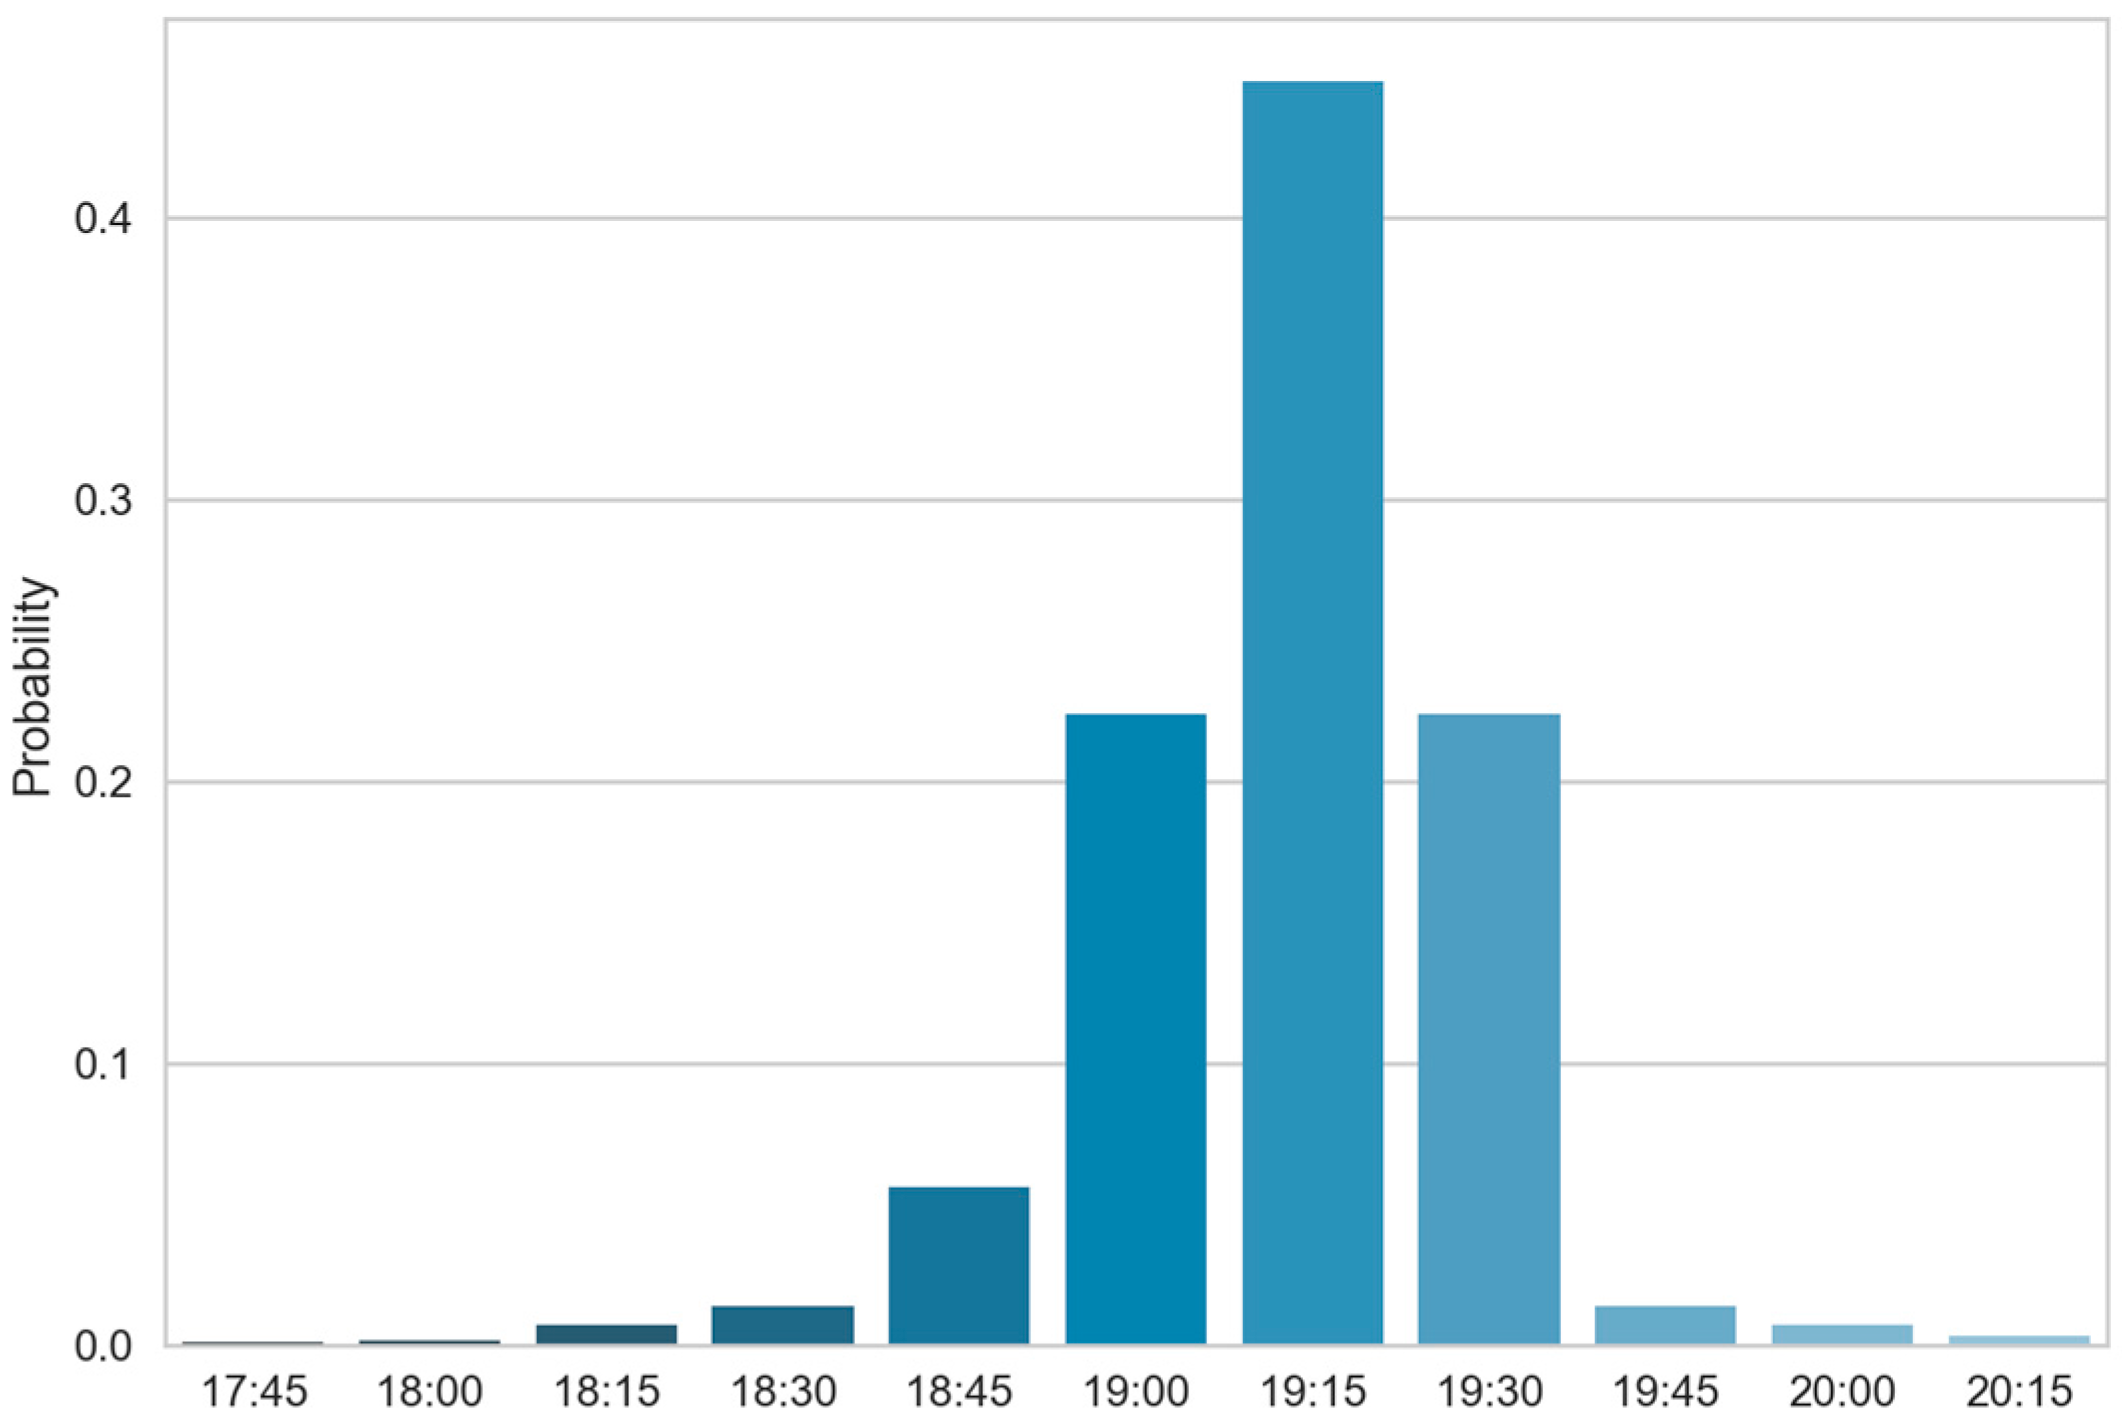
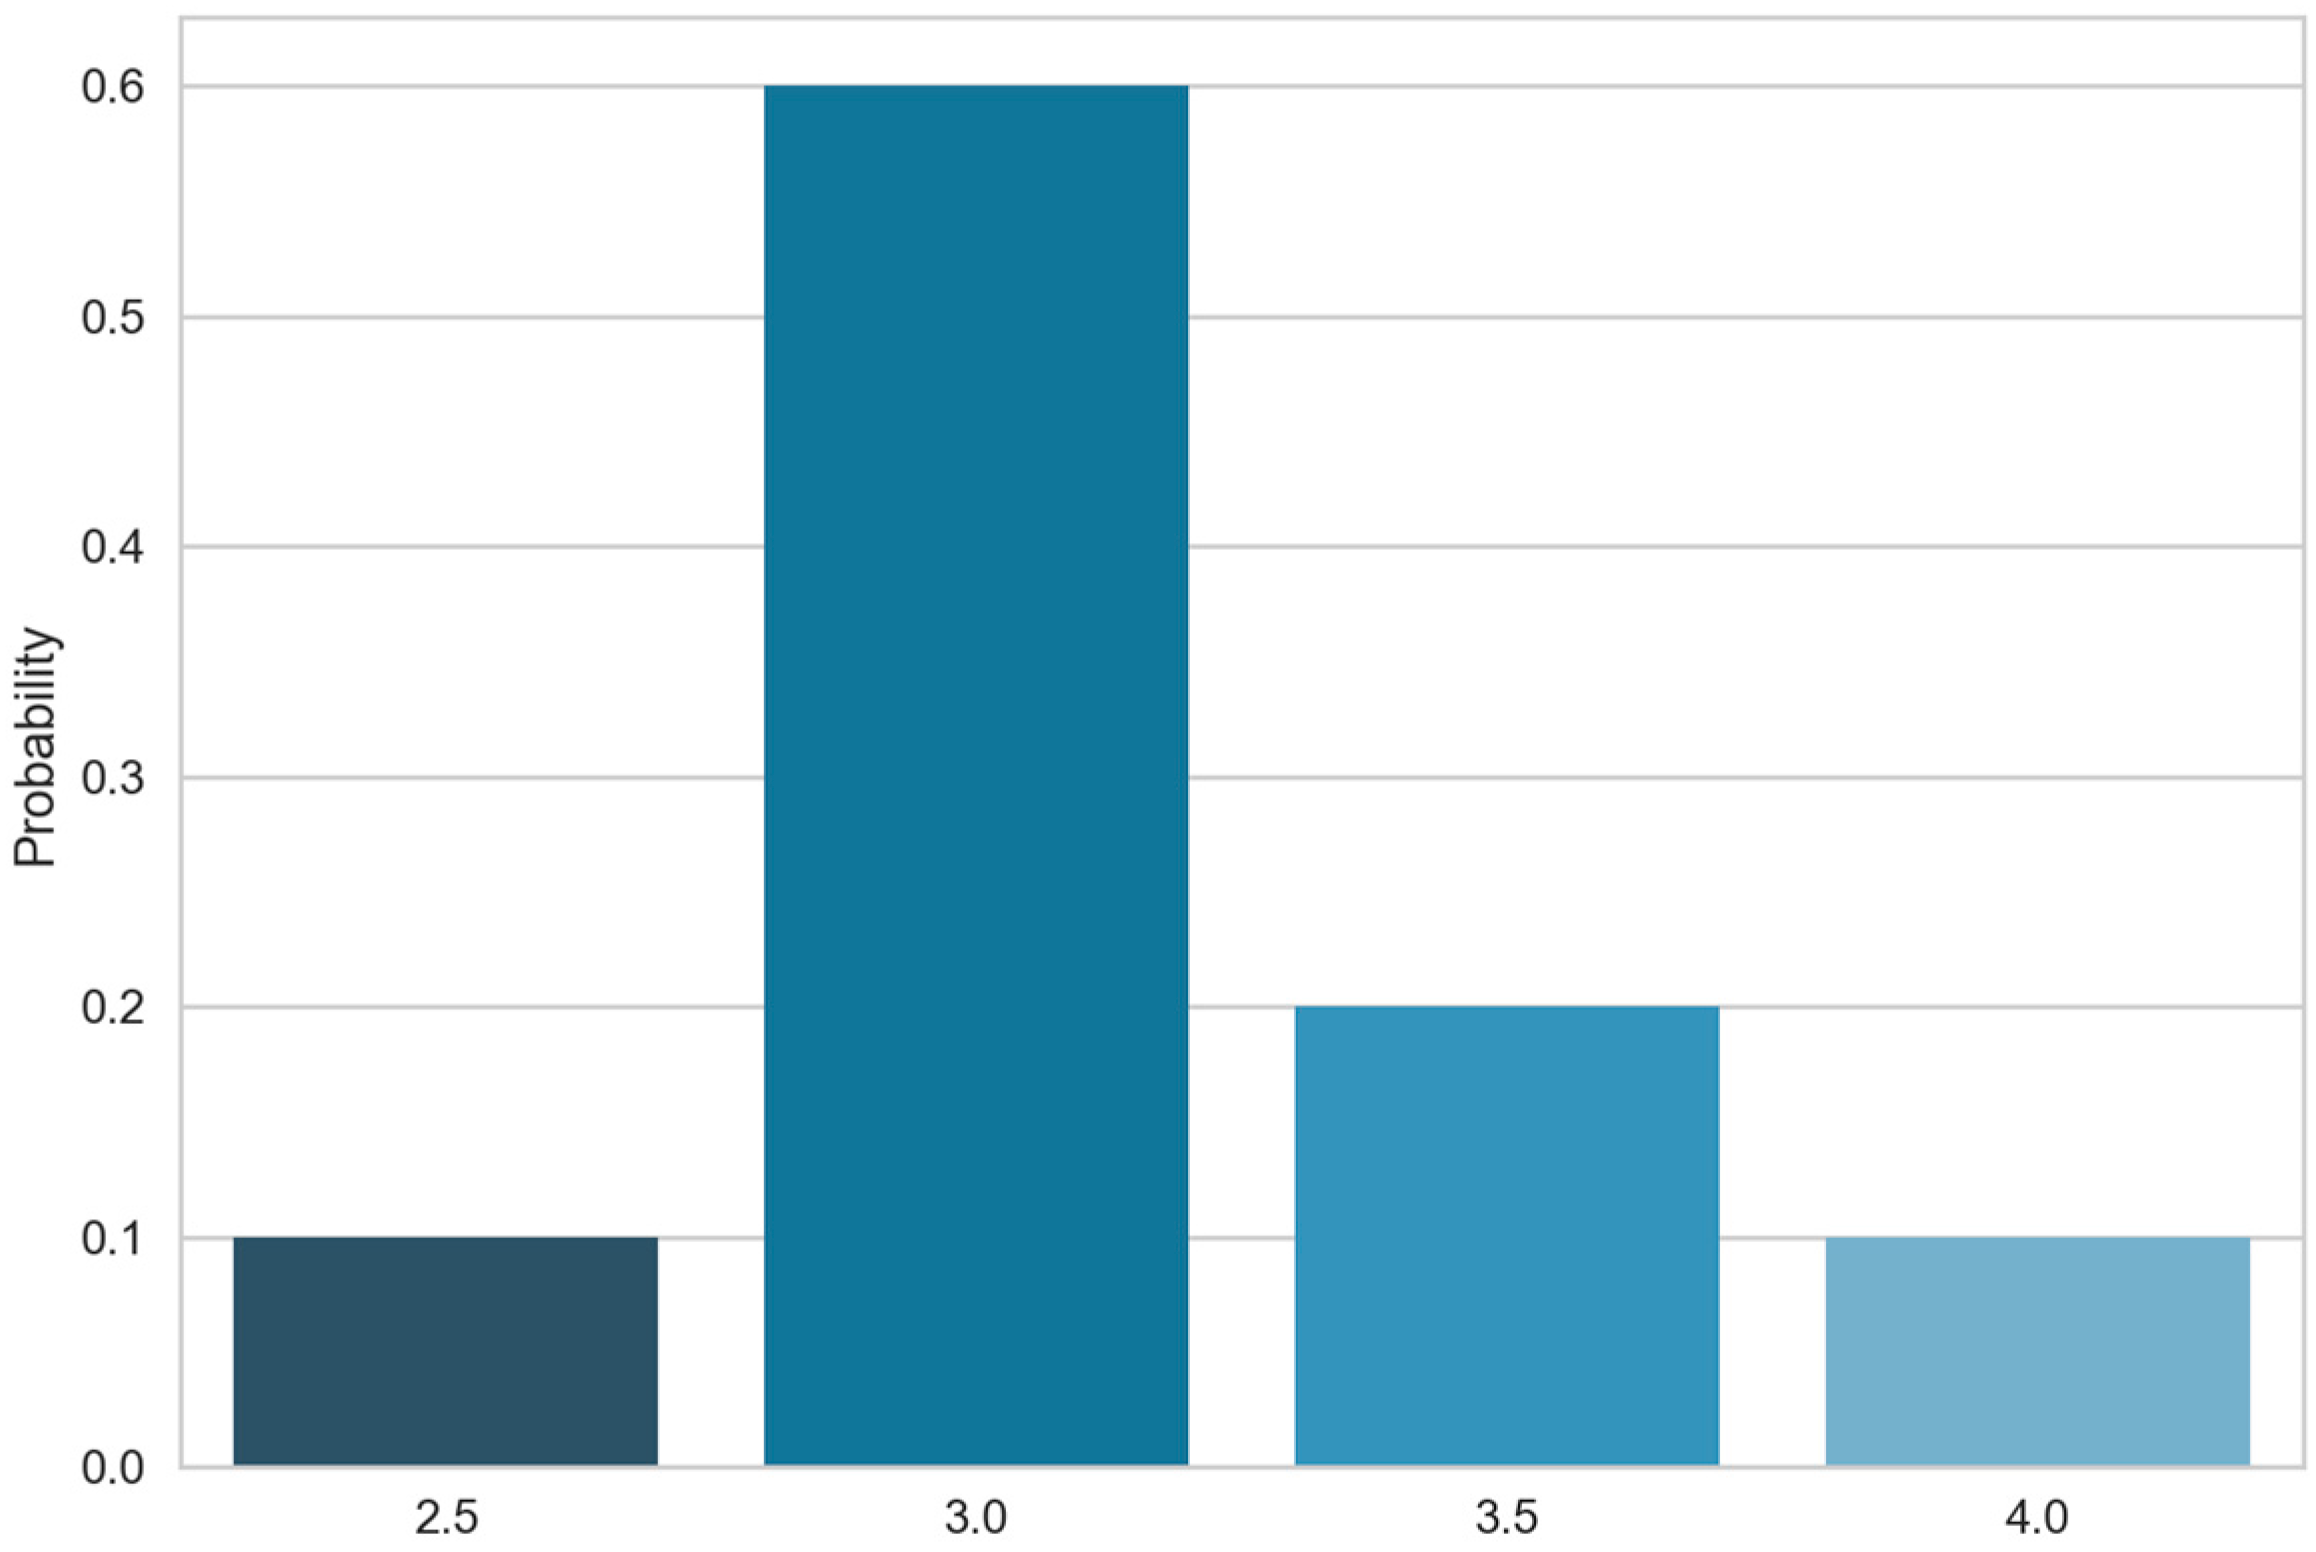
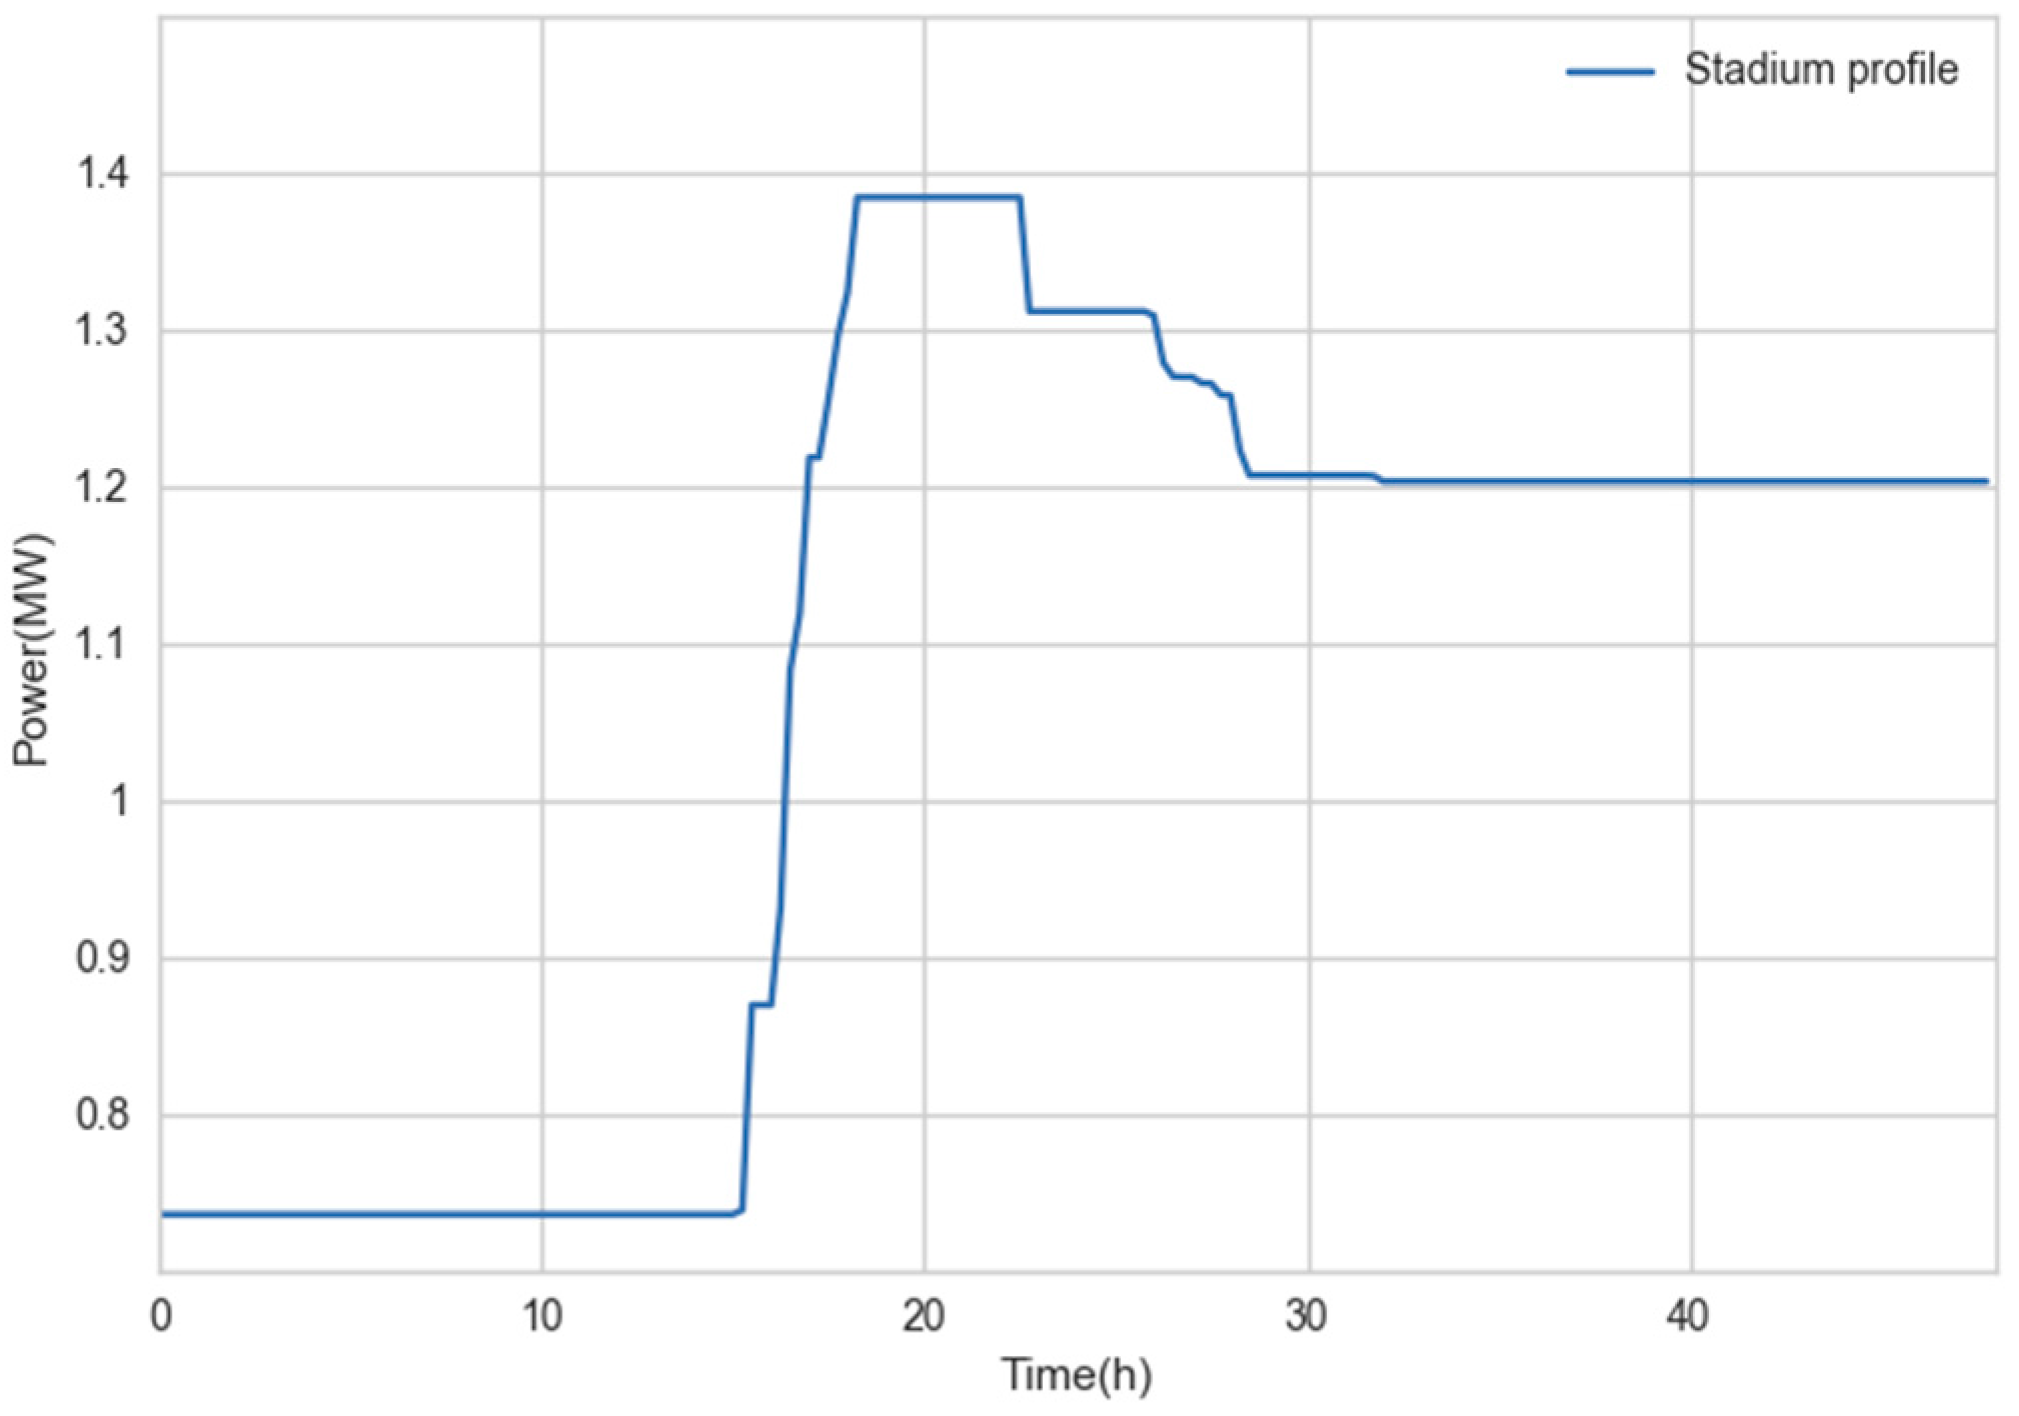
3.1.2. Load Profiles of Other Loads in the Network
3.1.3. Power Flow Simulation Platform
3.2. Flexibility Models and Profile Steering
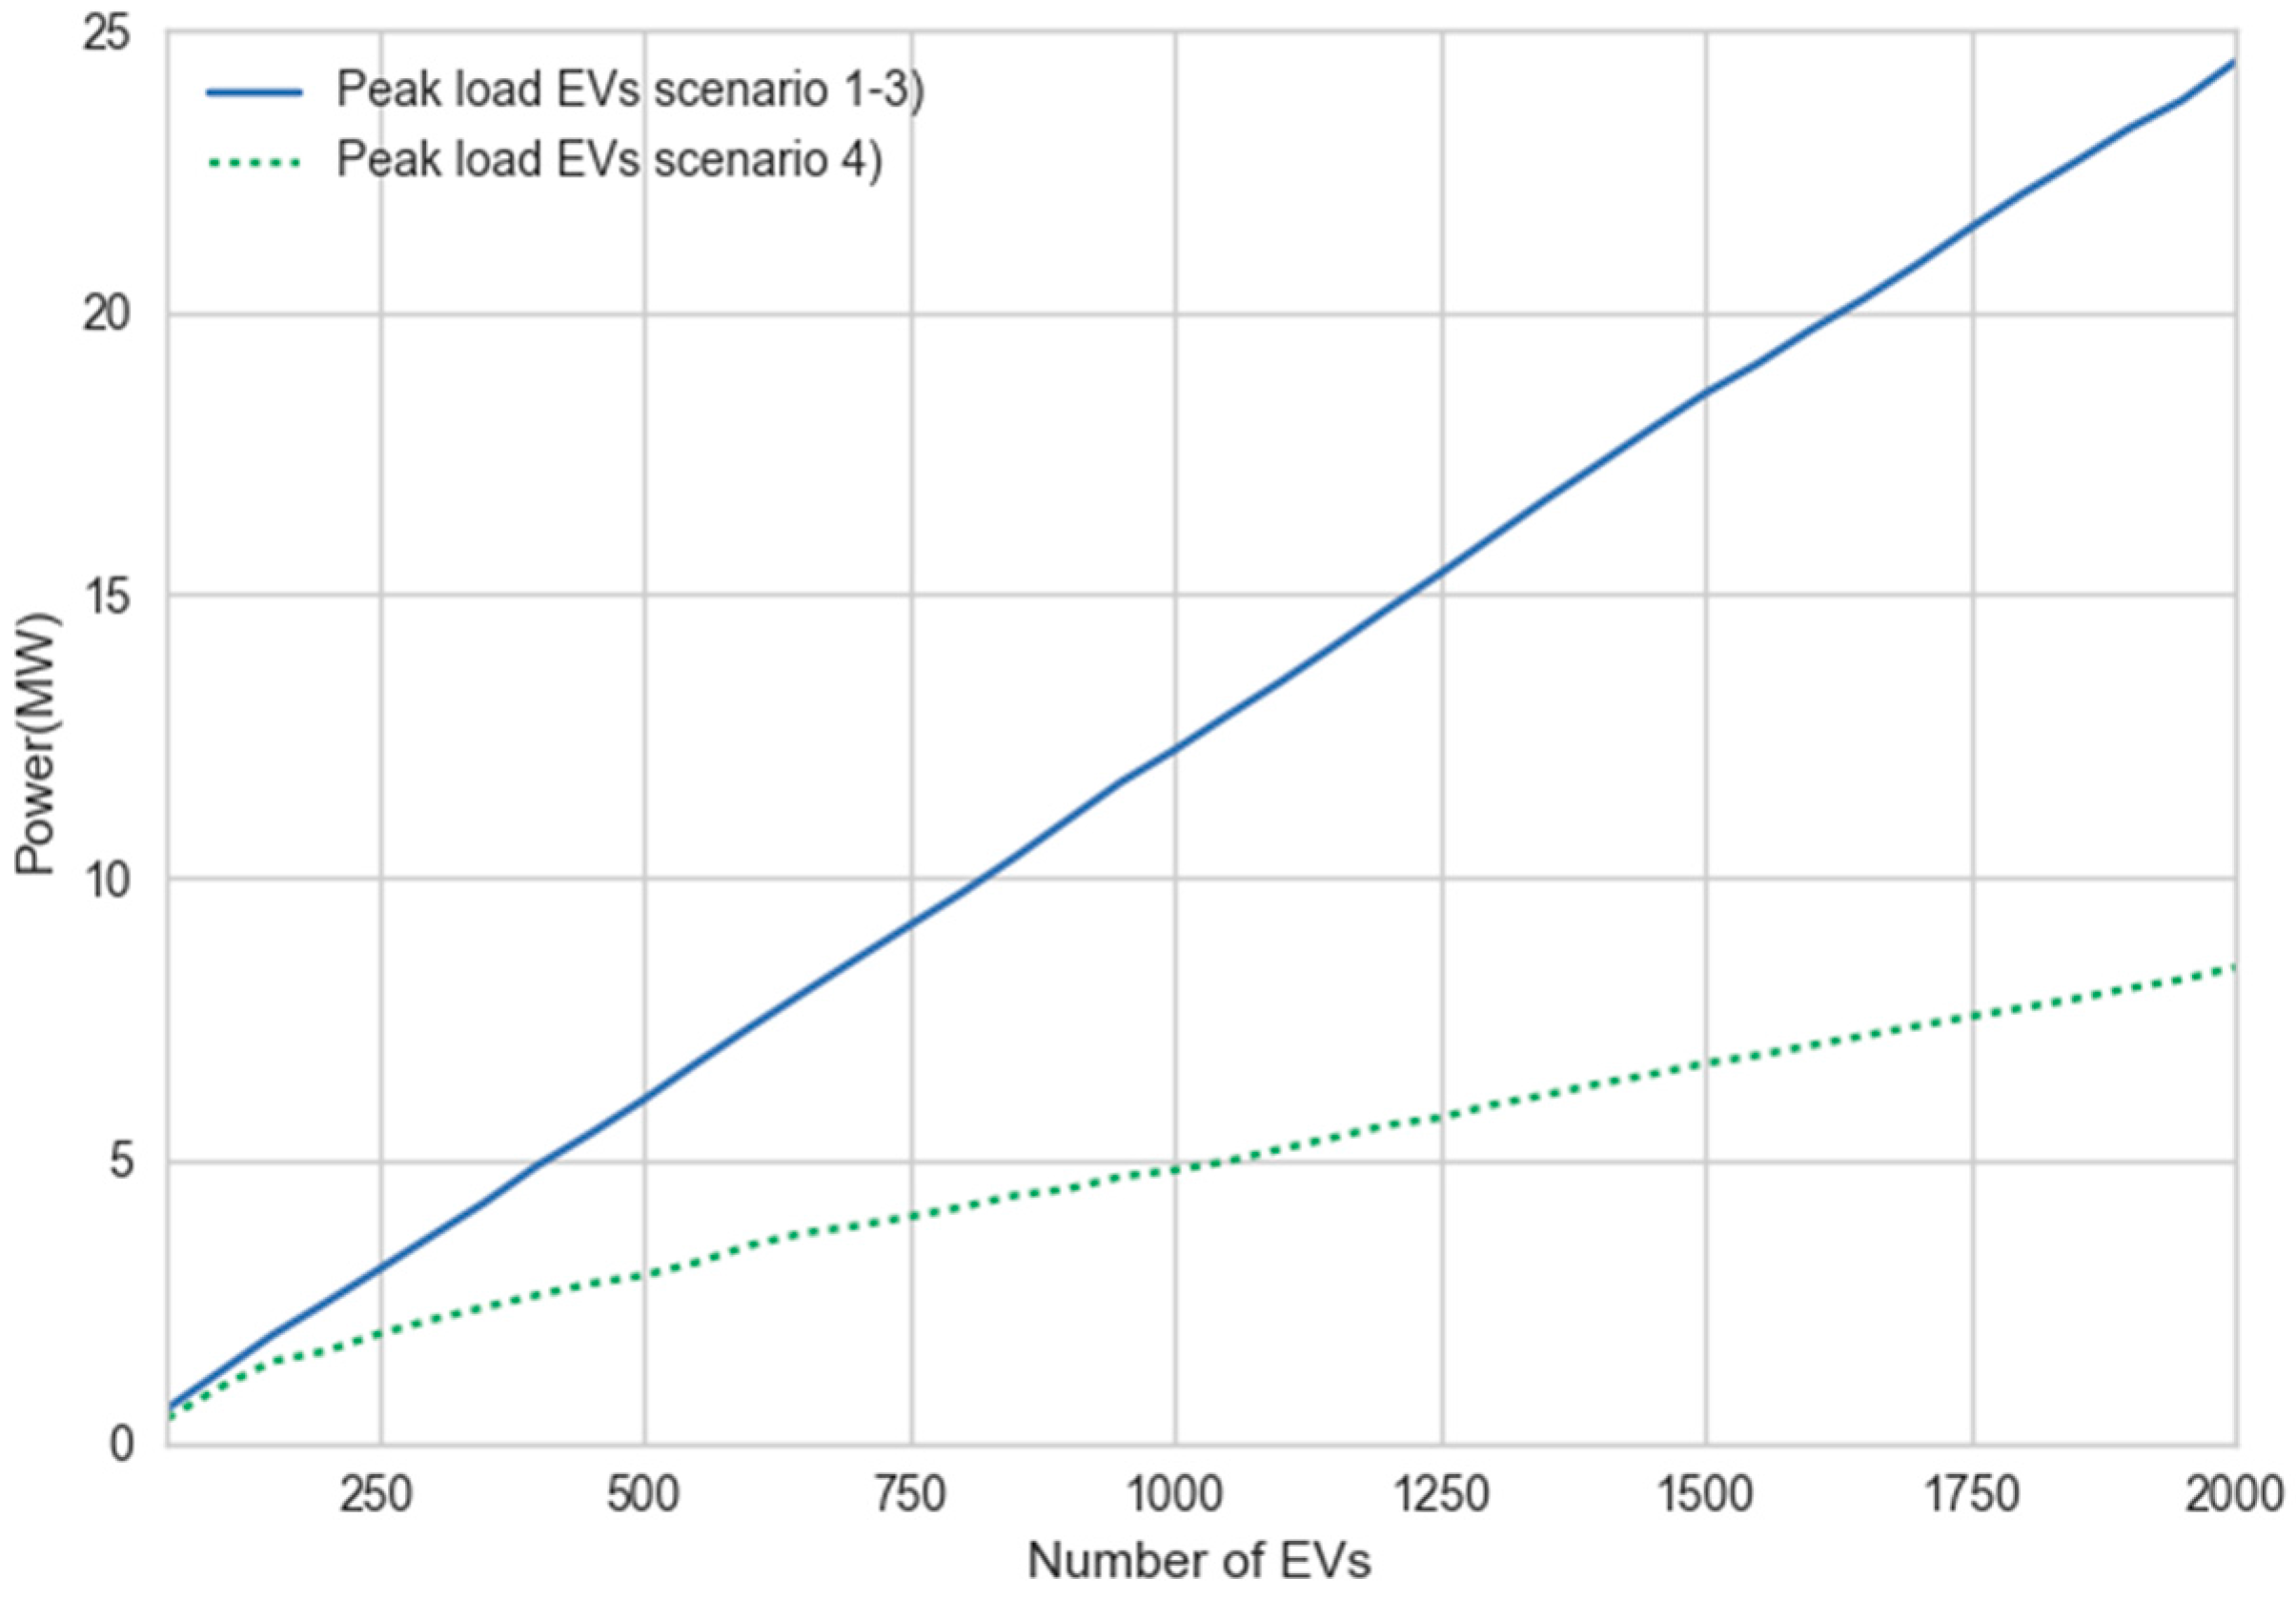
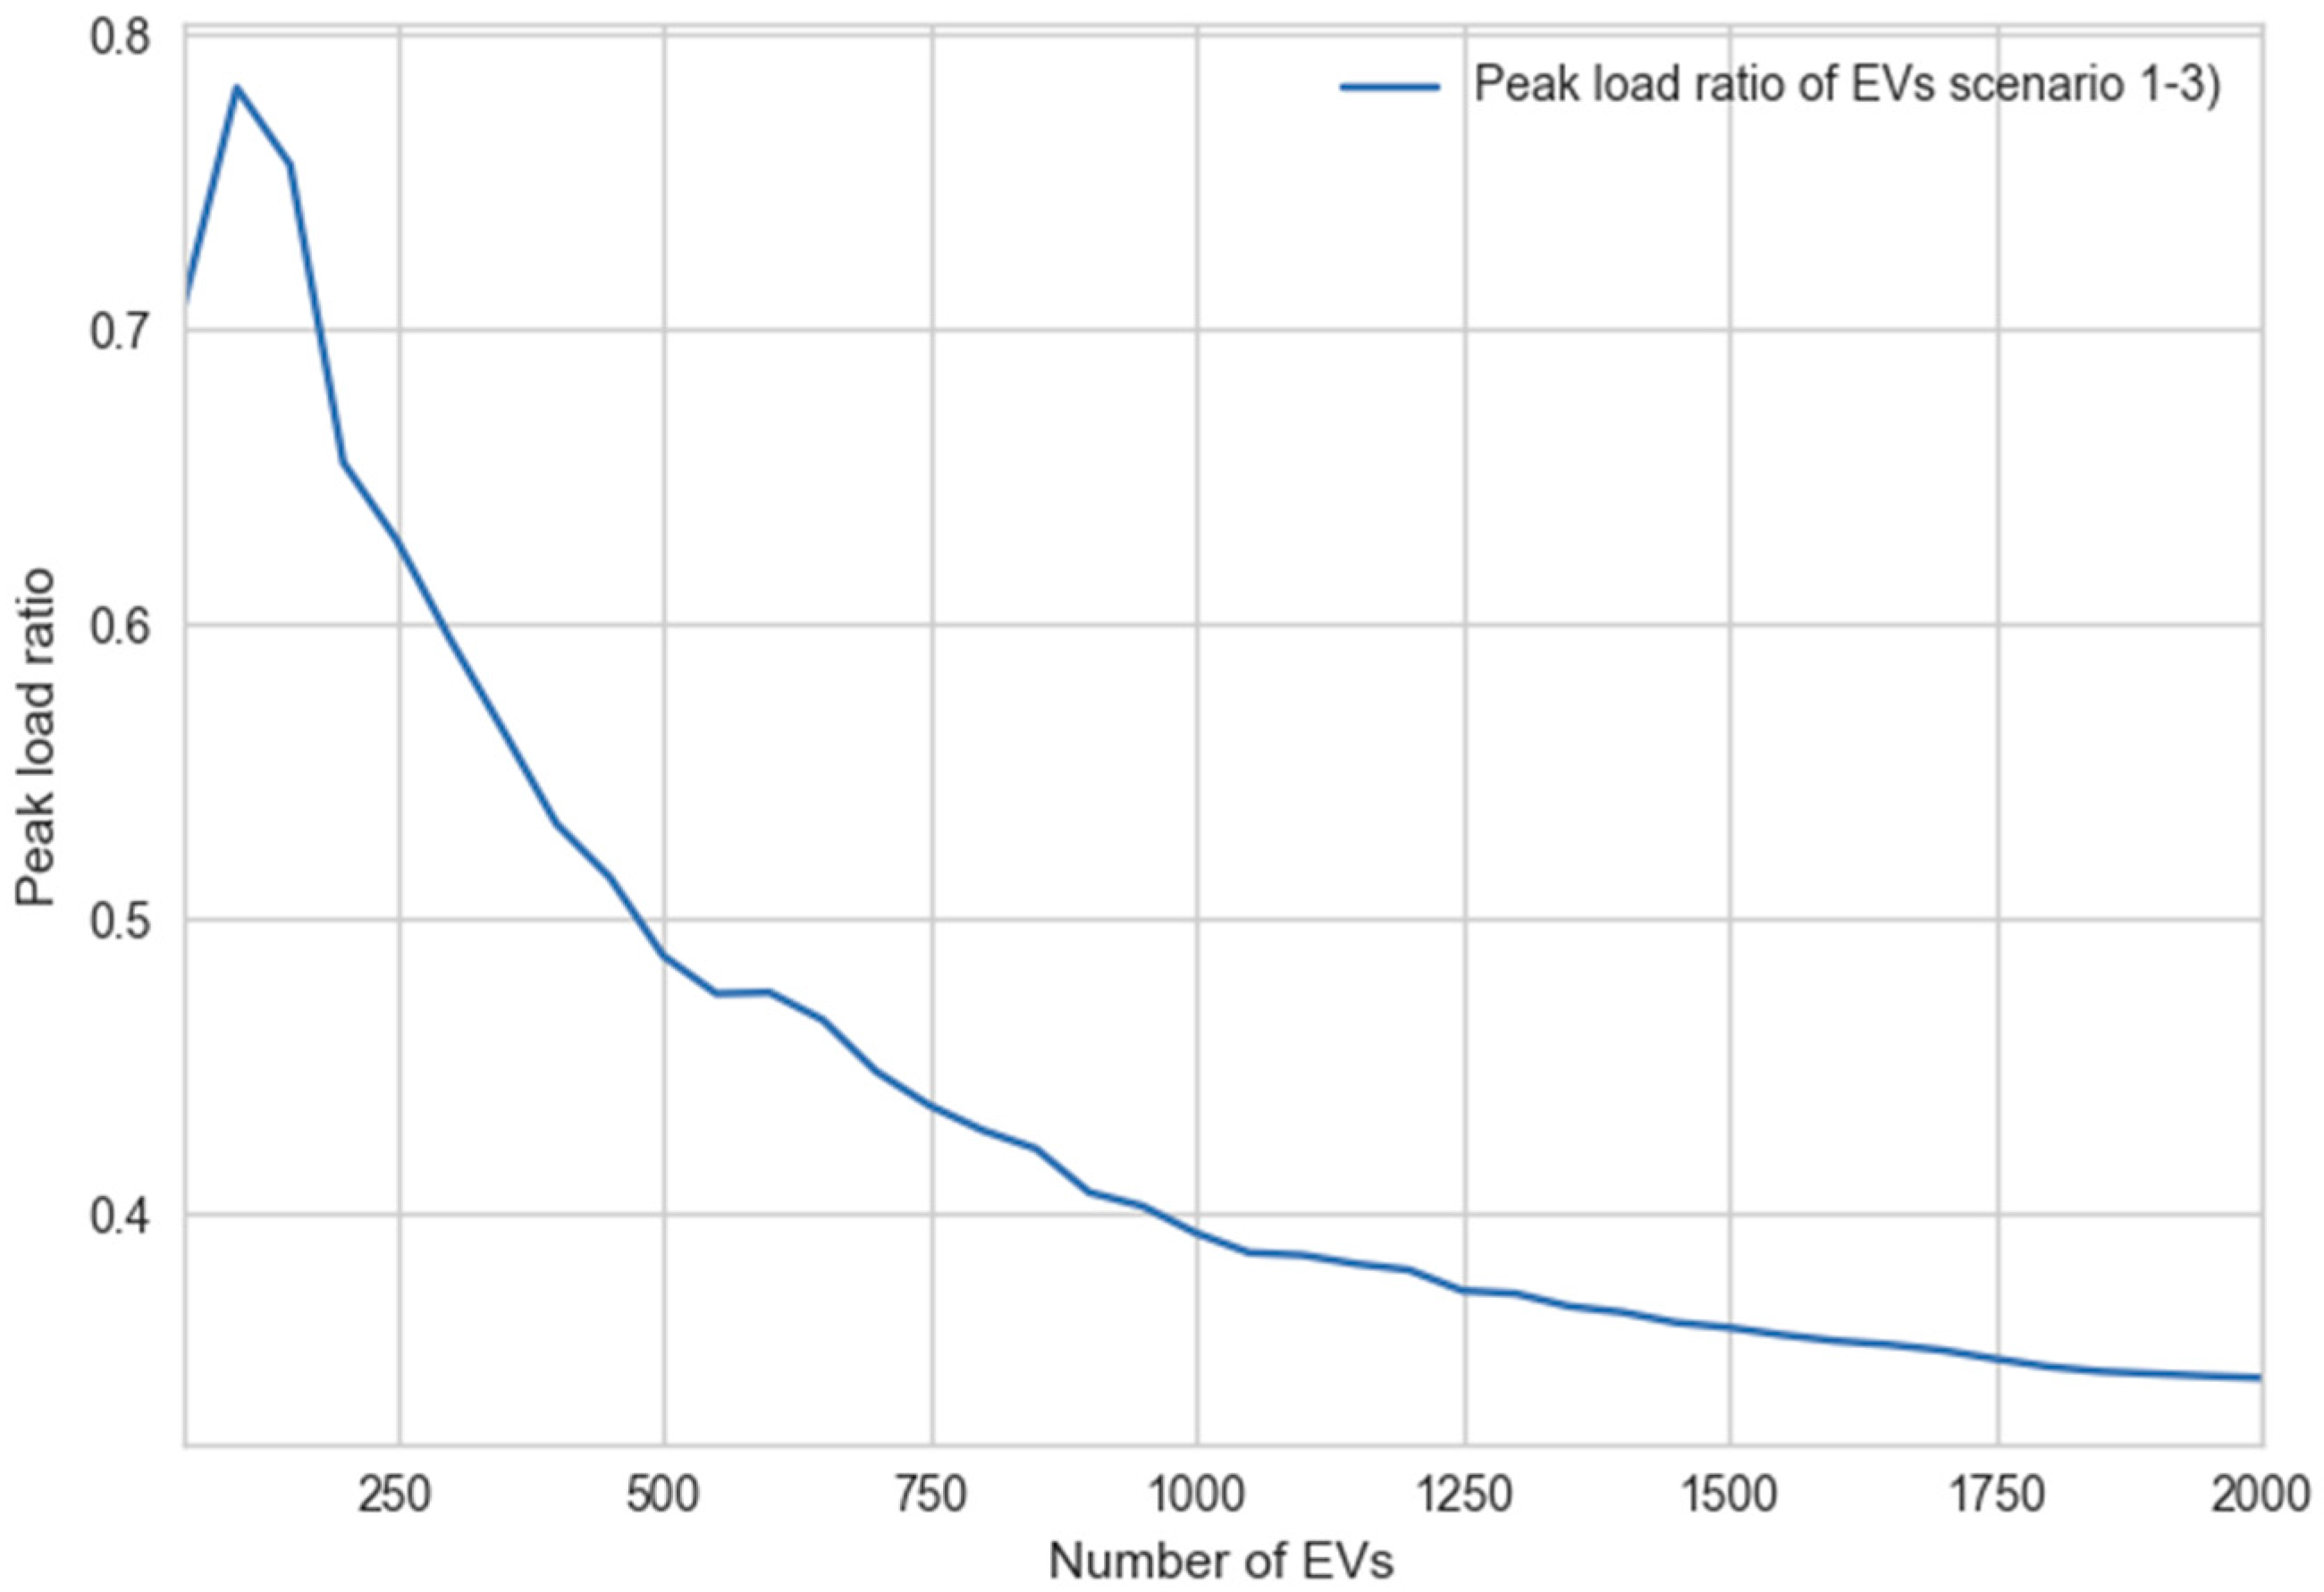
3.3. Specifics of the Scenarios
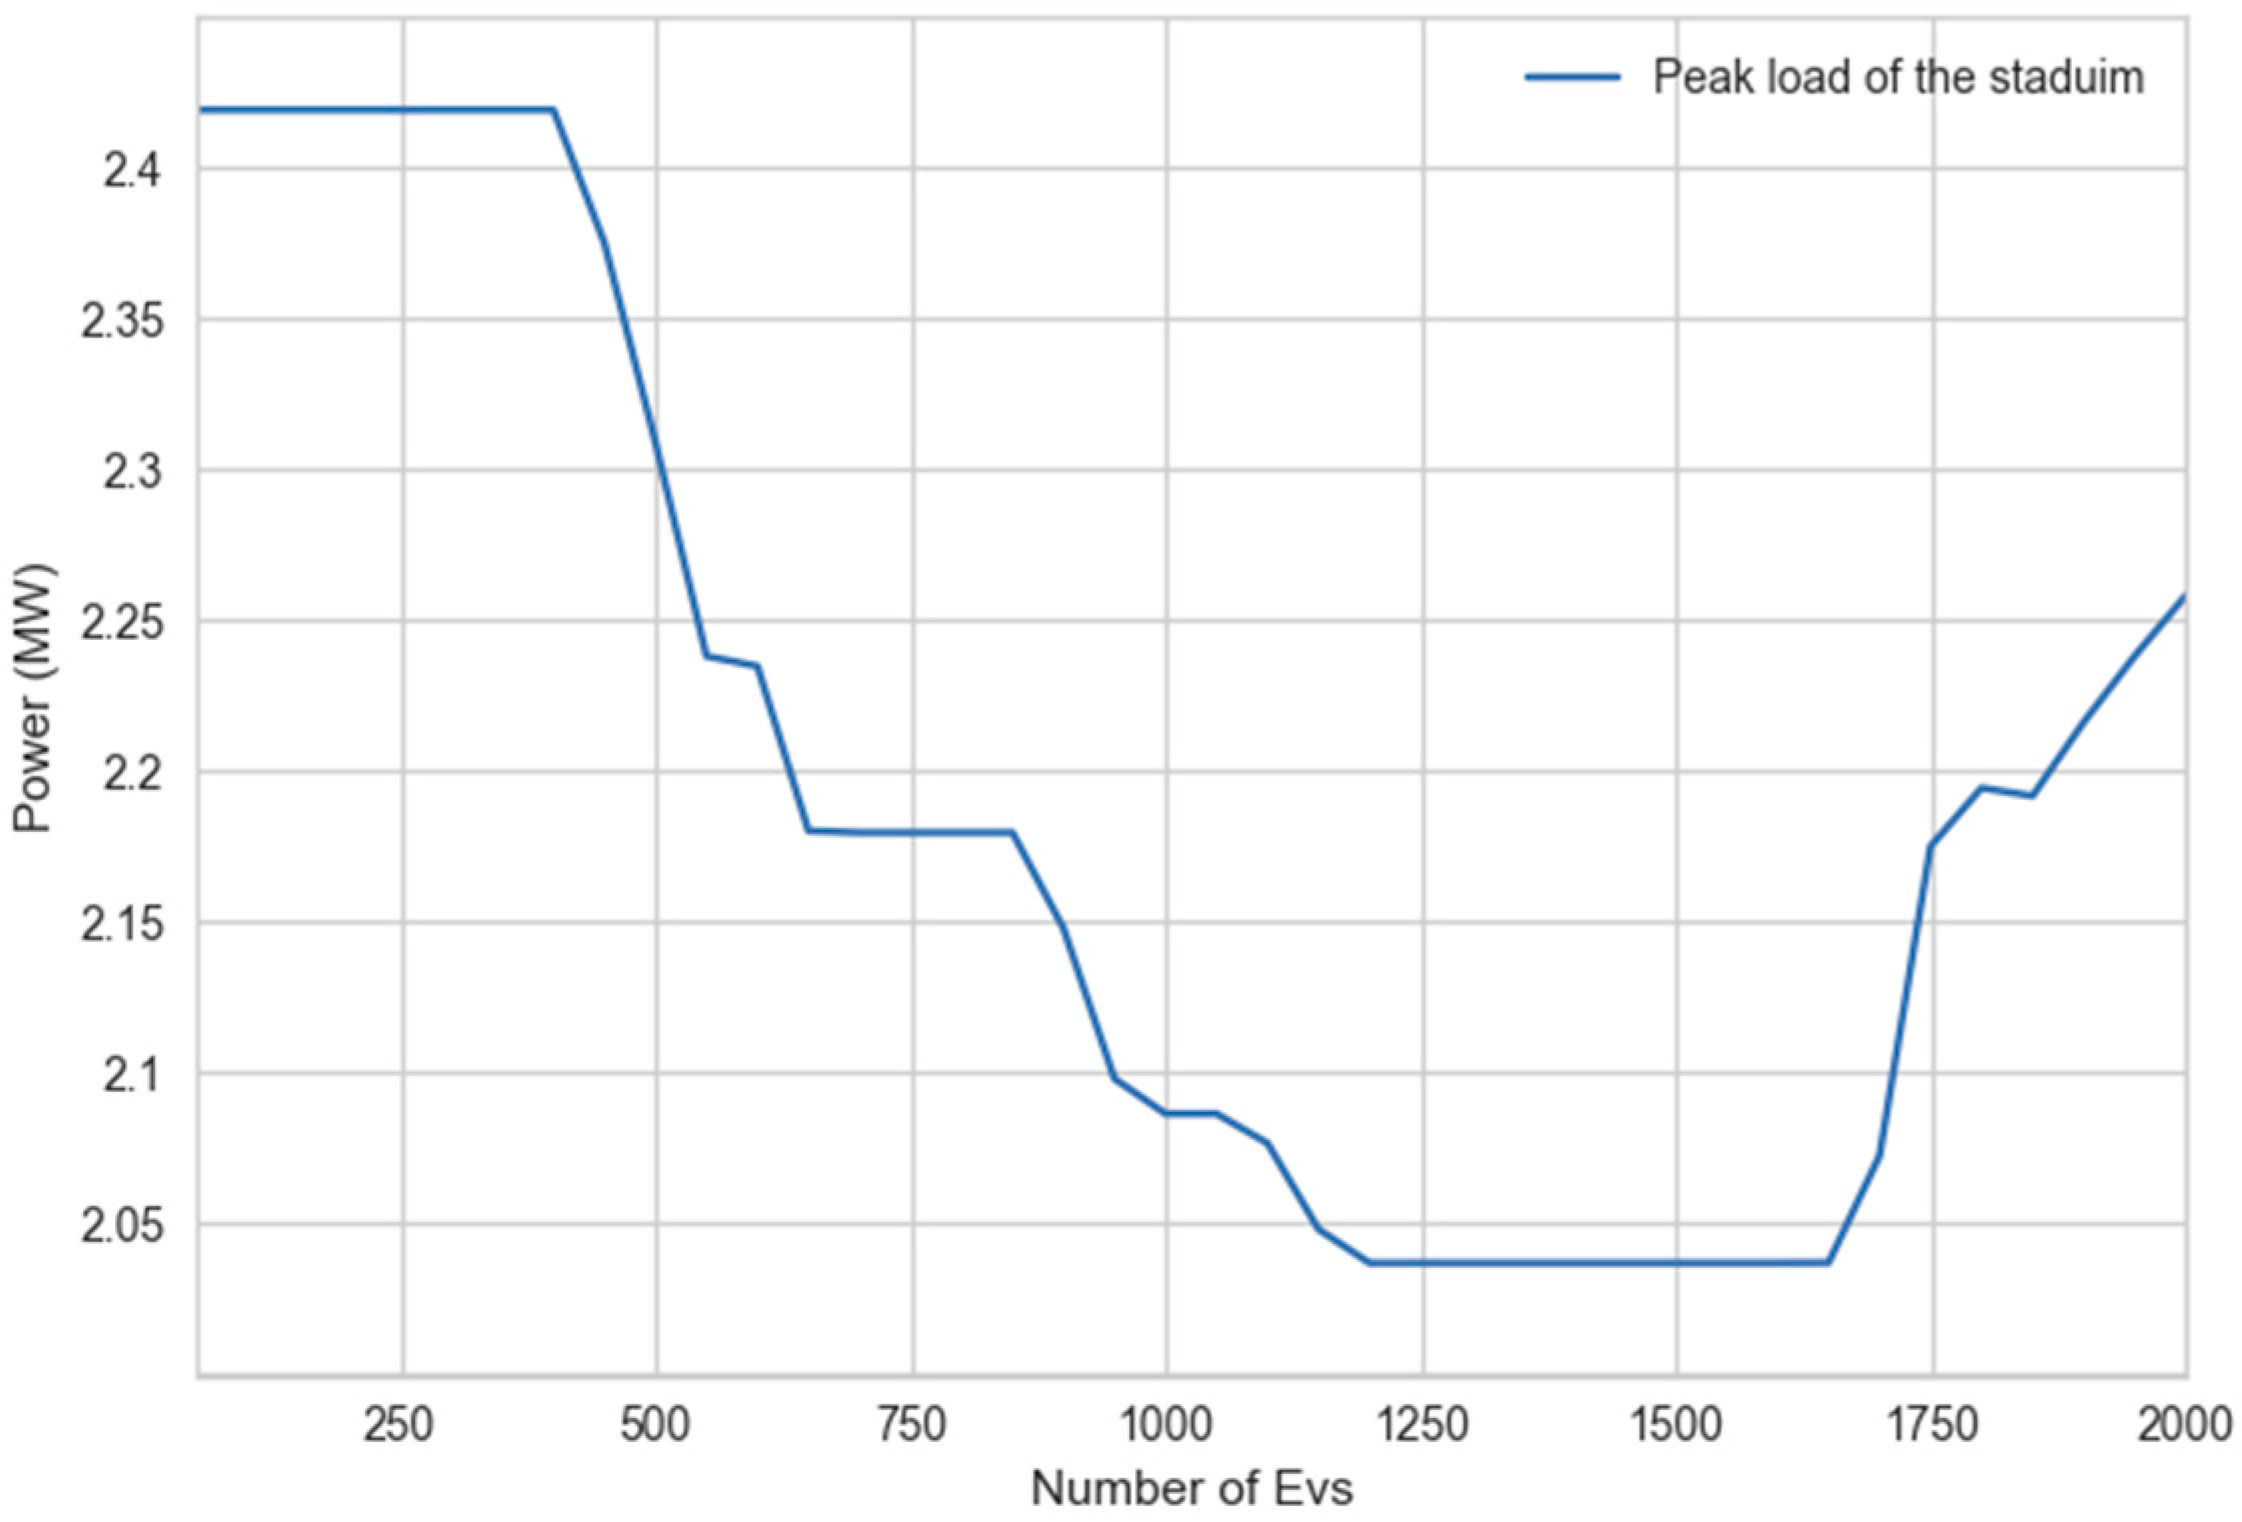
3.4. Results
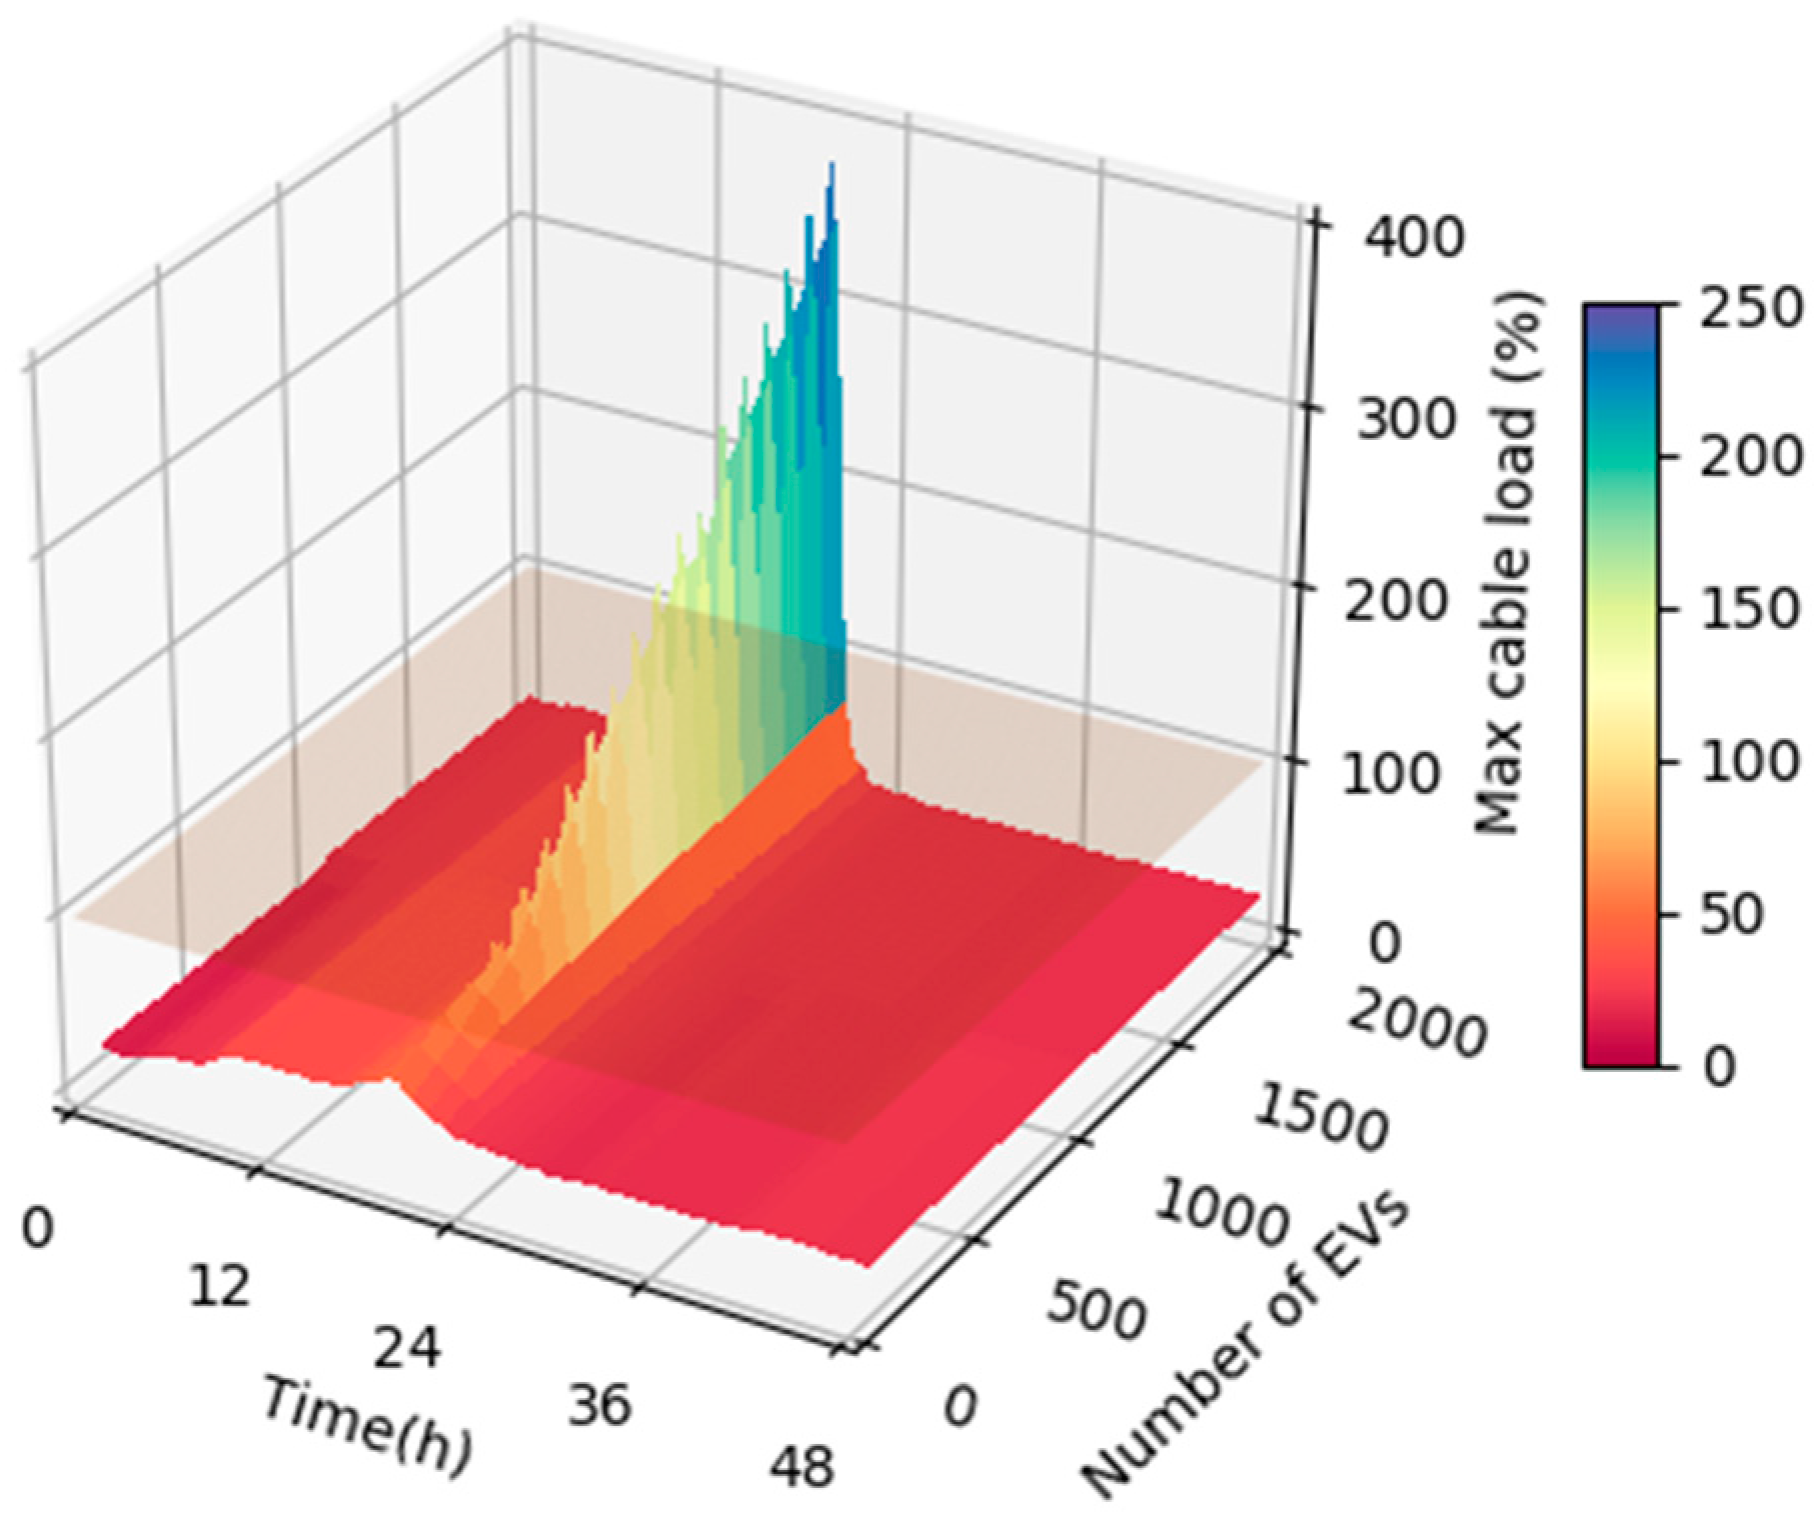
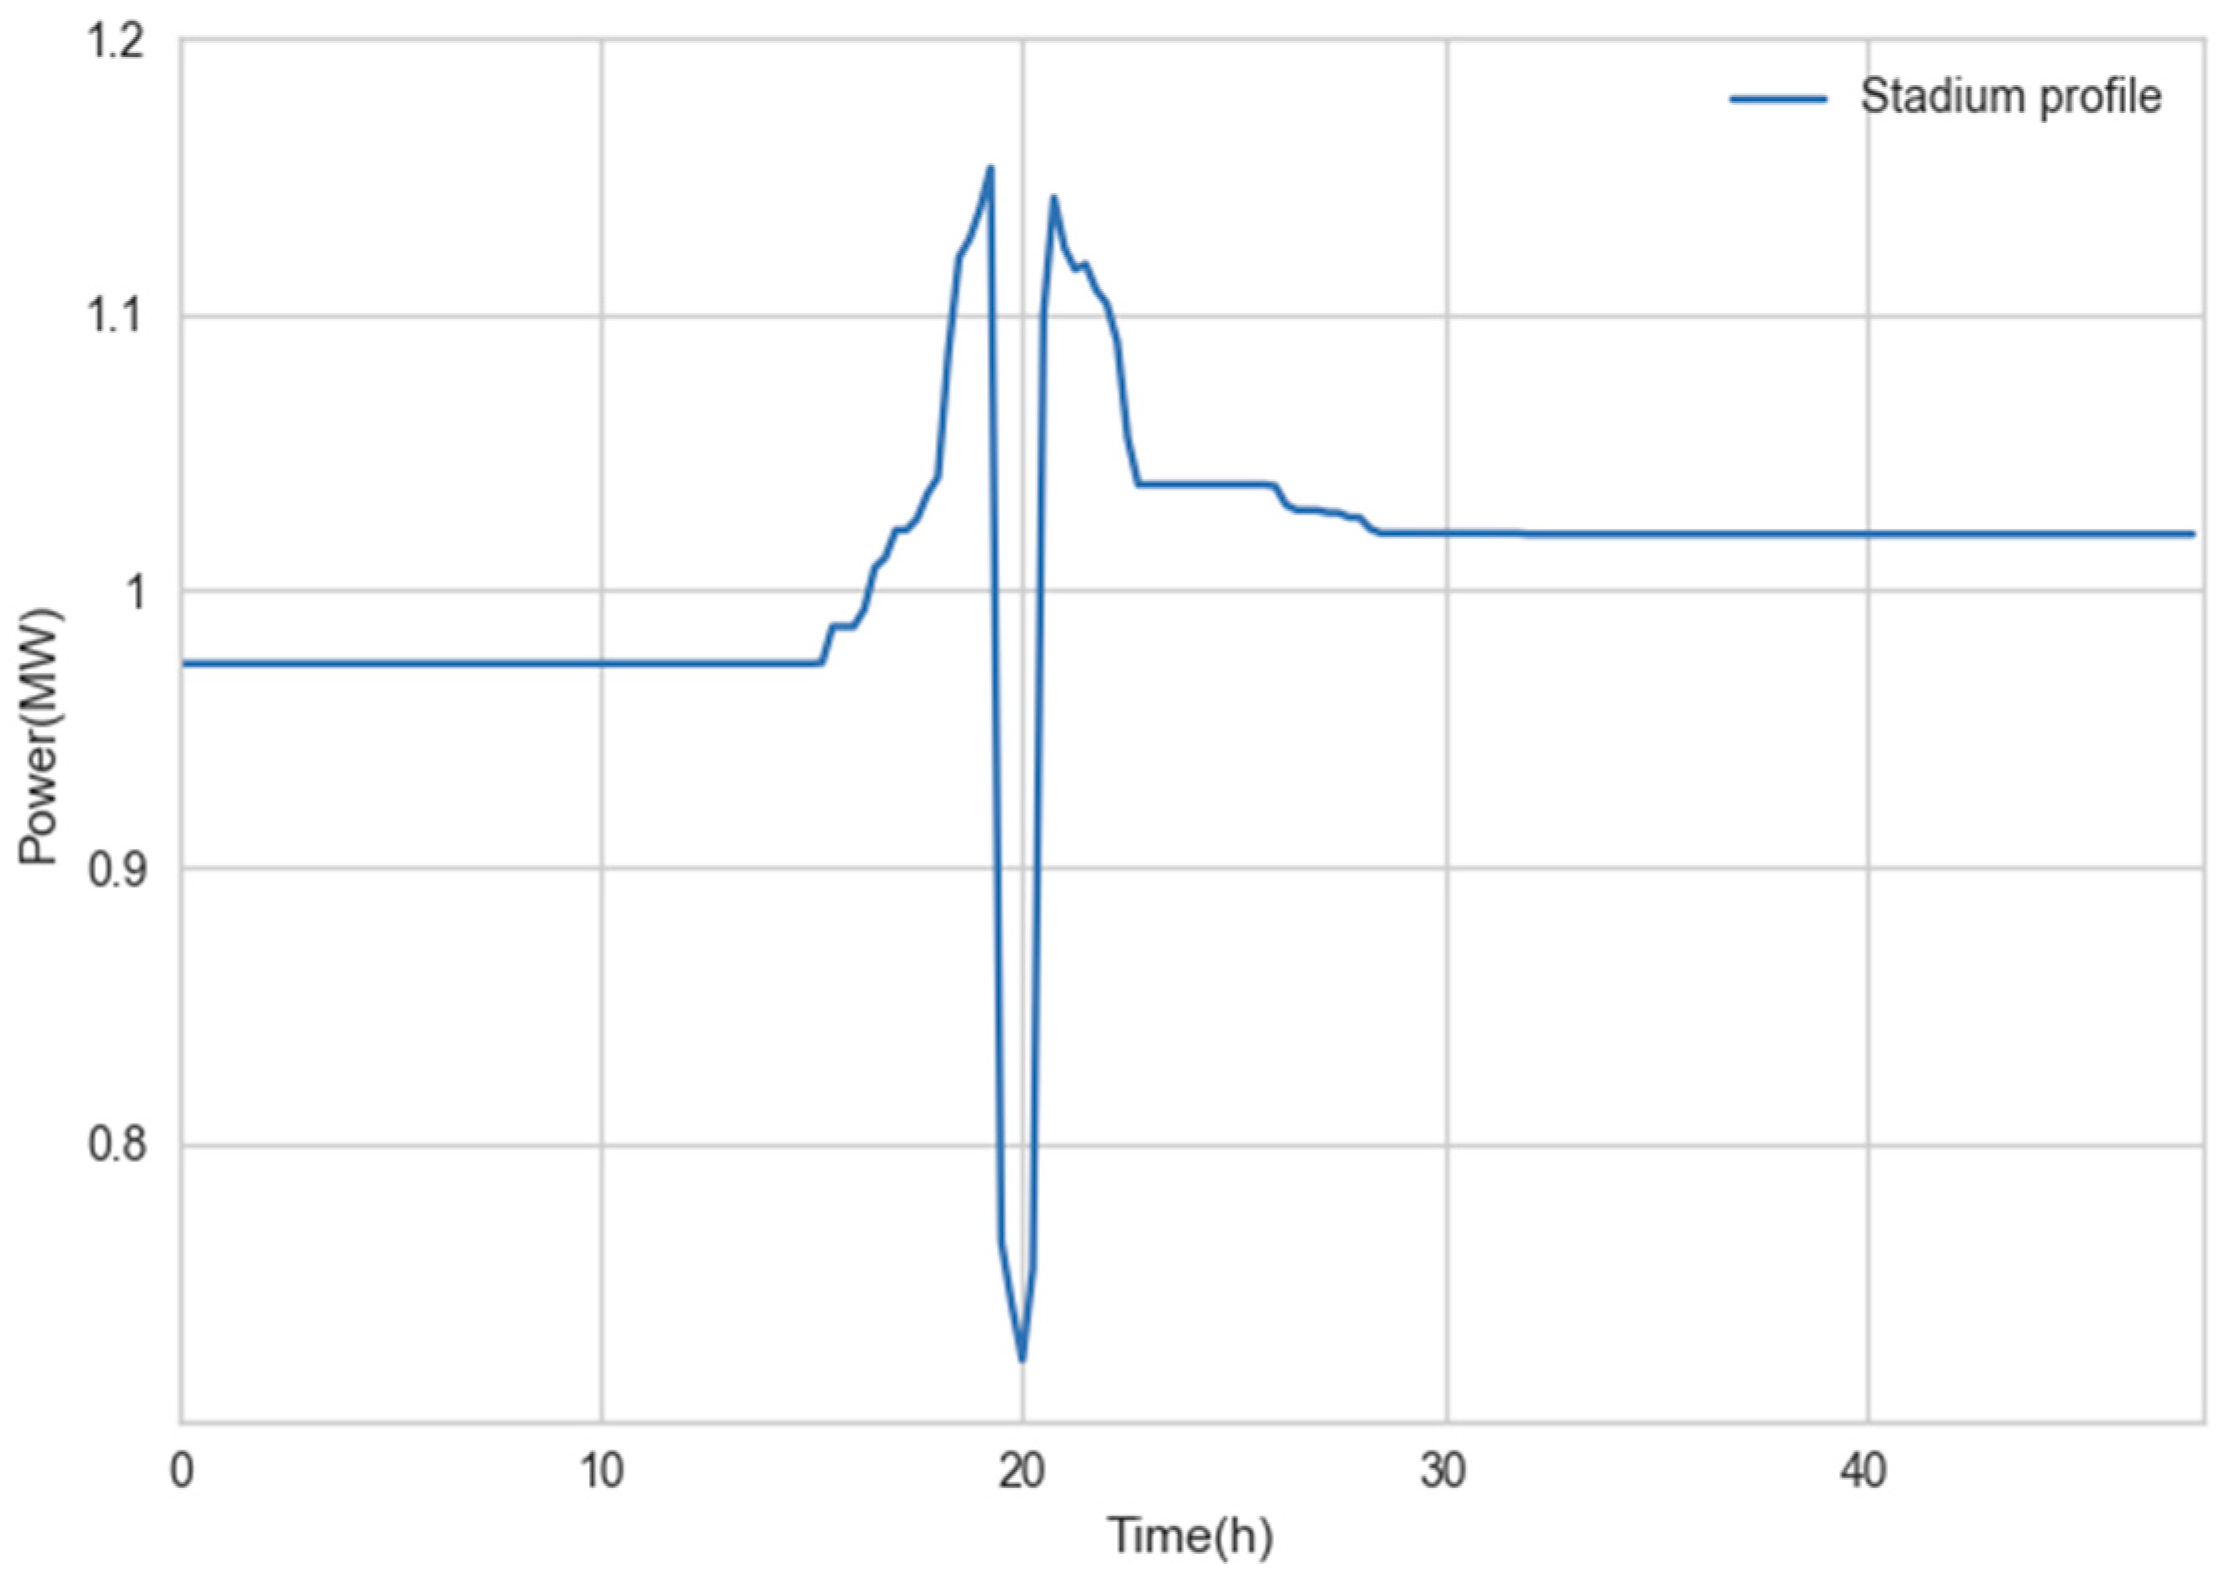
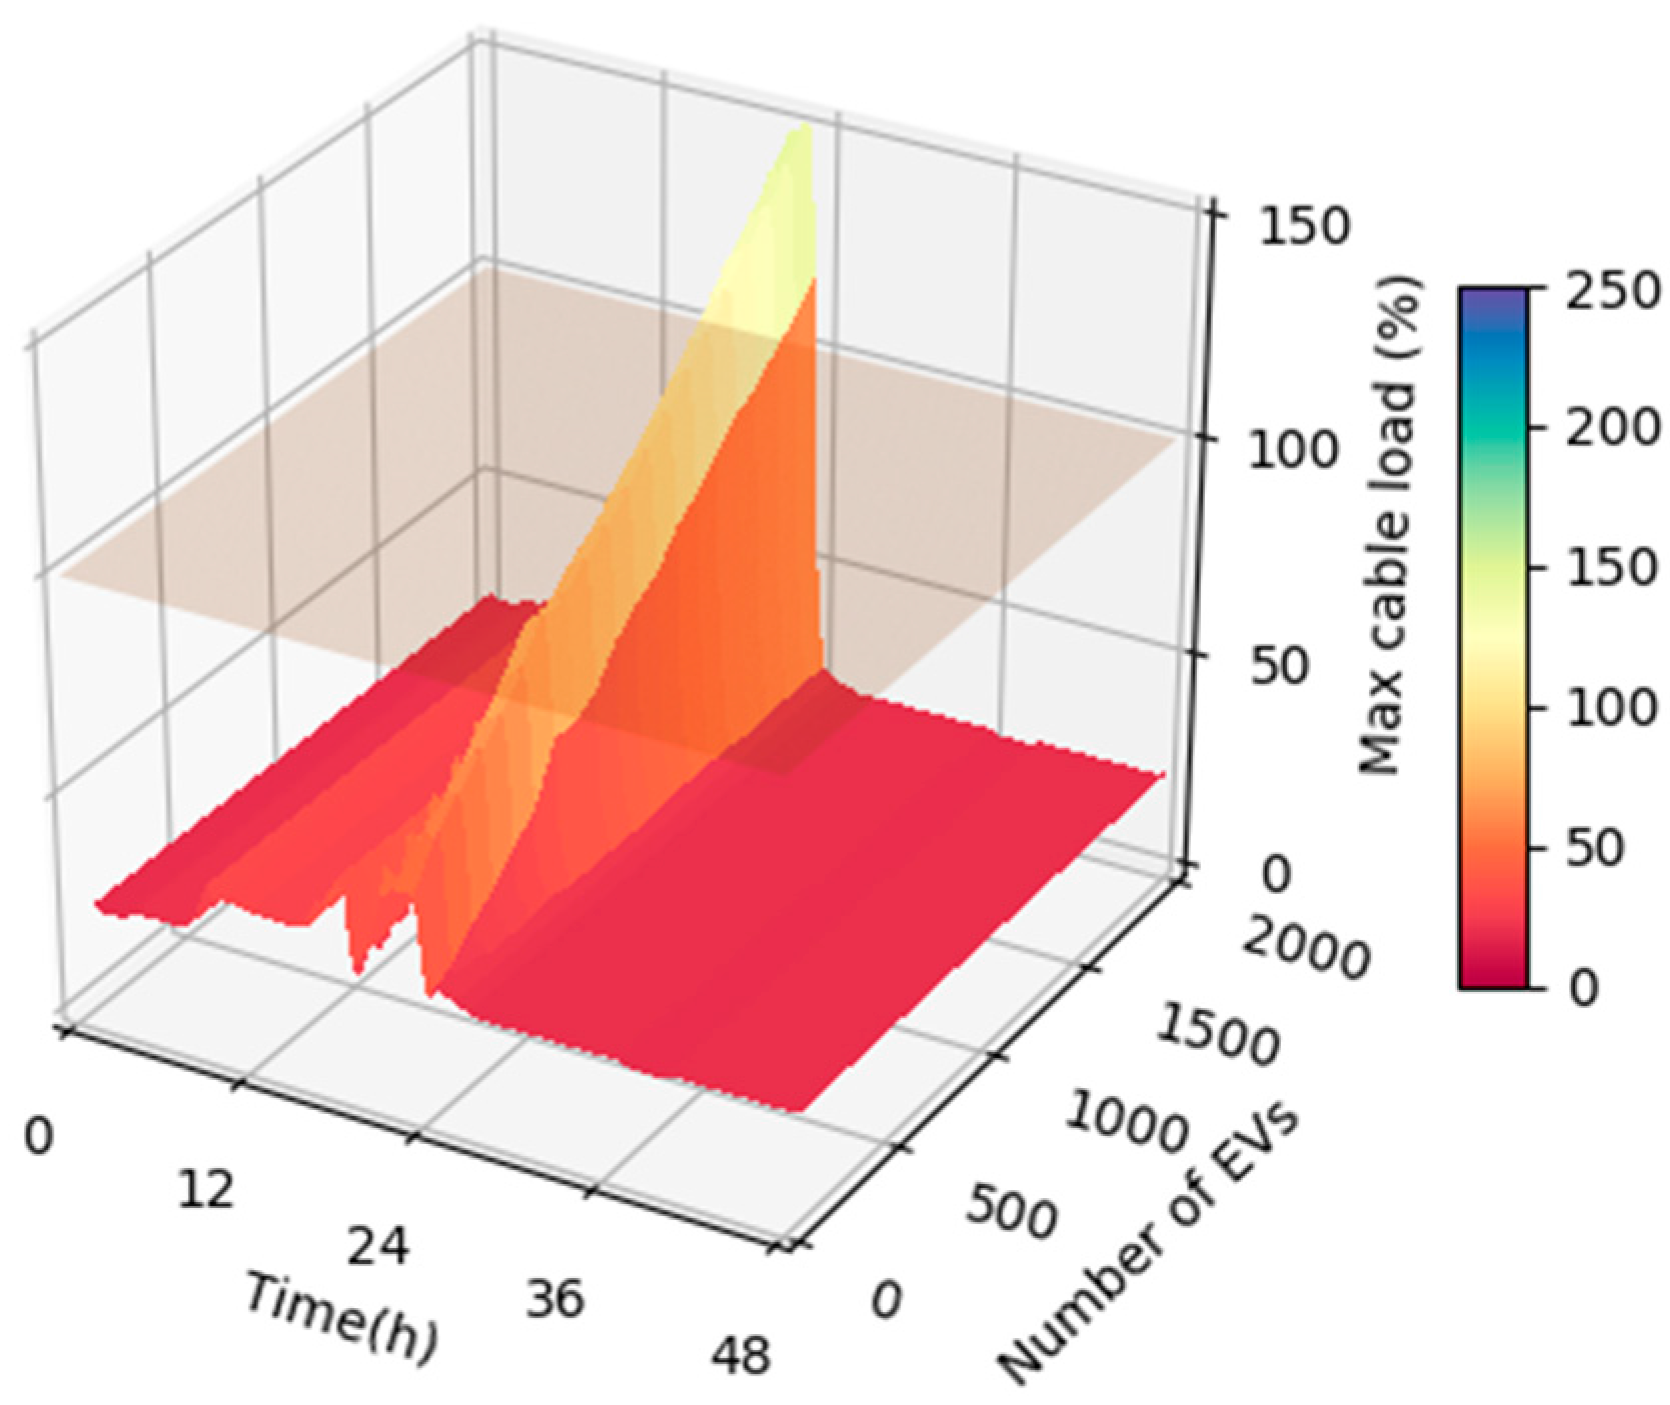
3.4.1. Scenario 1
3.4.2. Scenario 2
3.4.3. Scenario 3
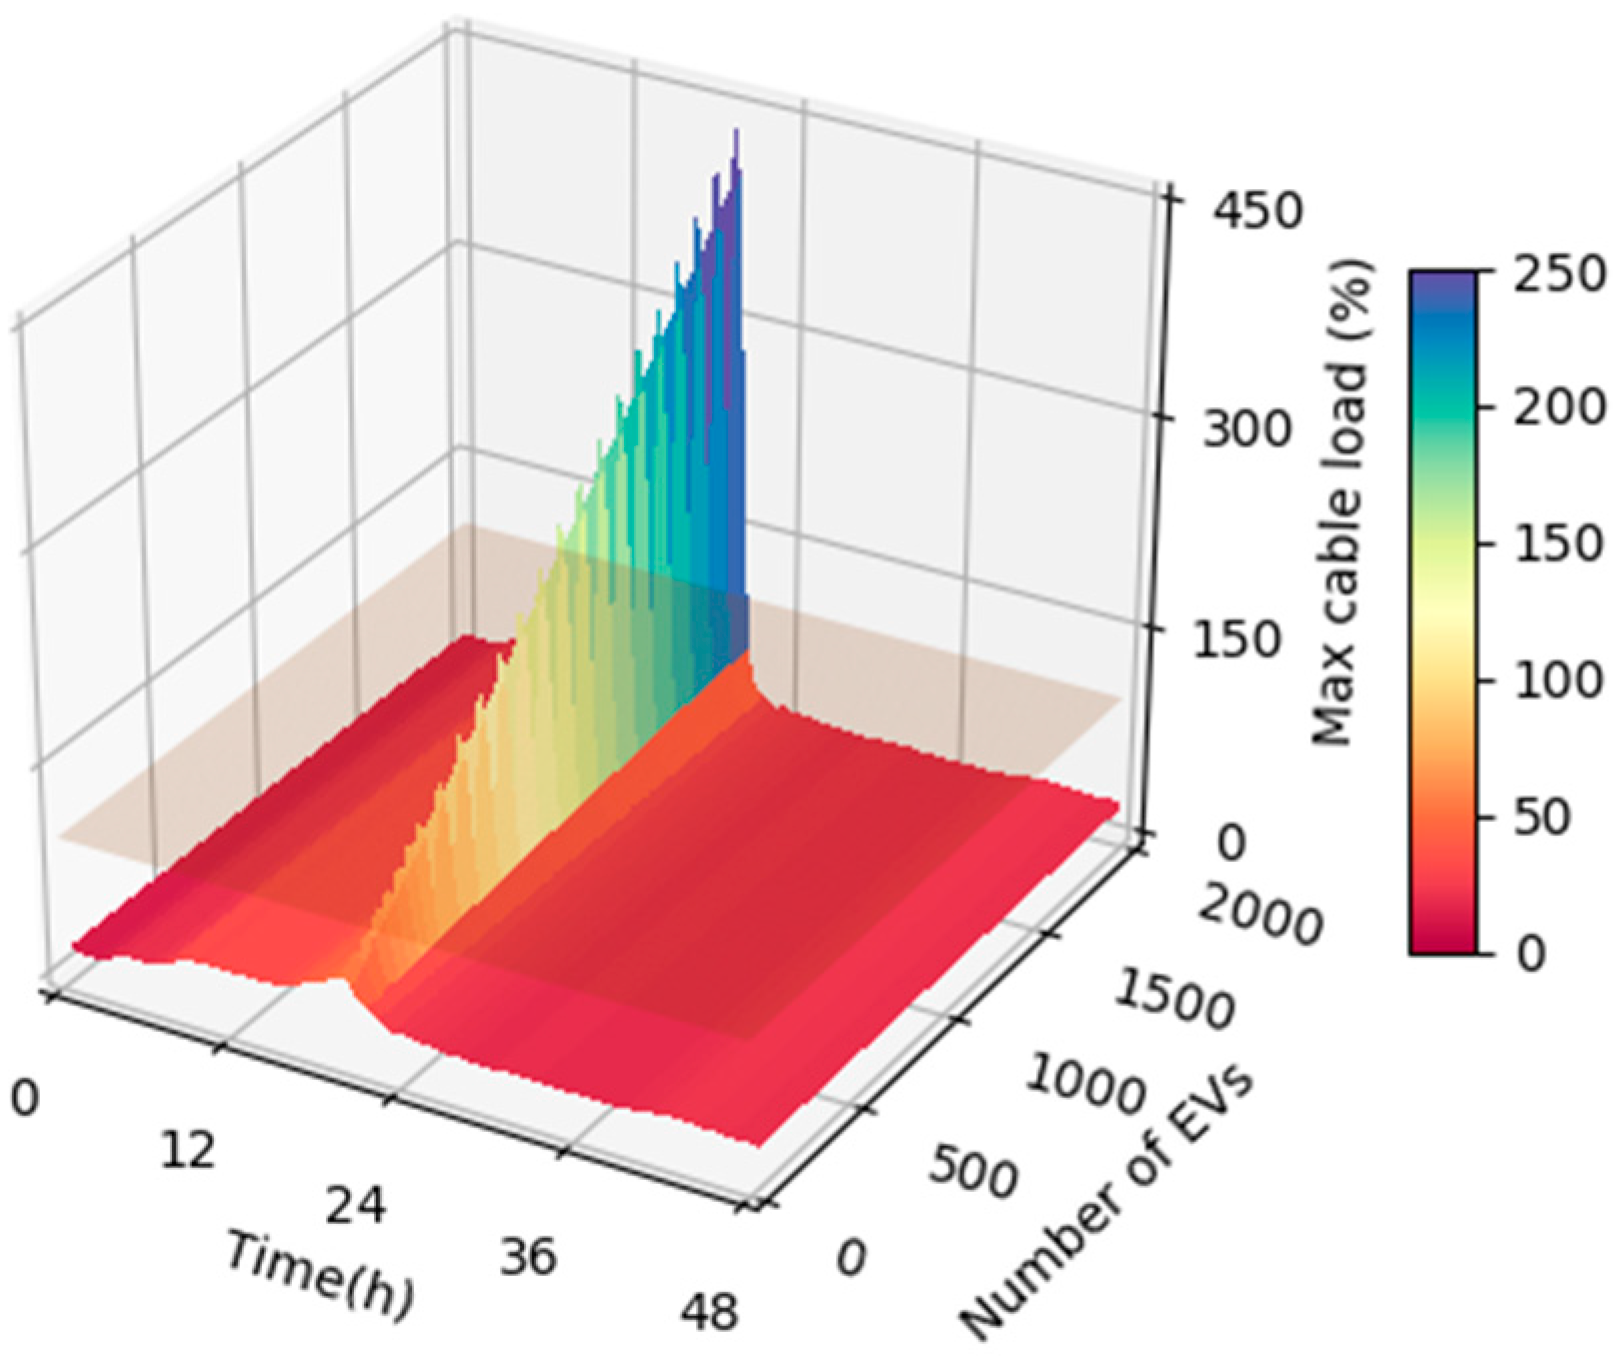
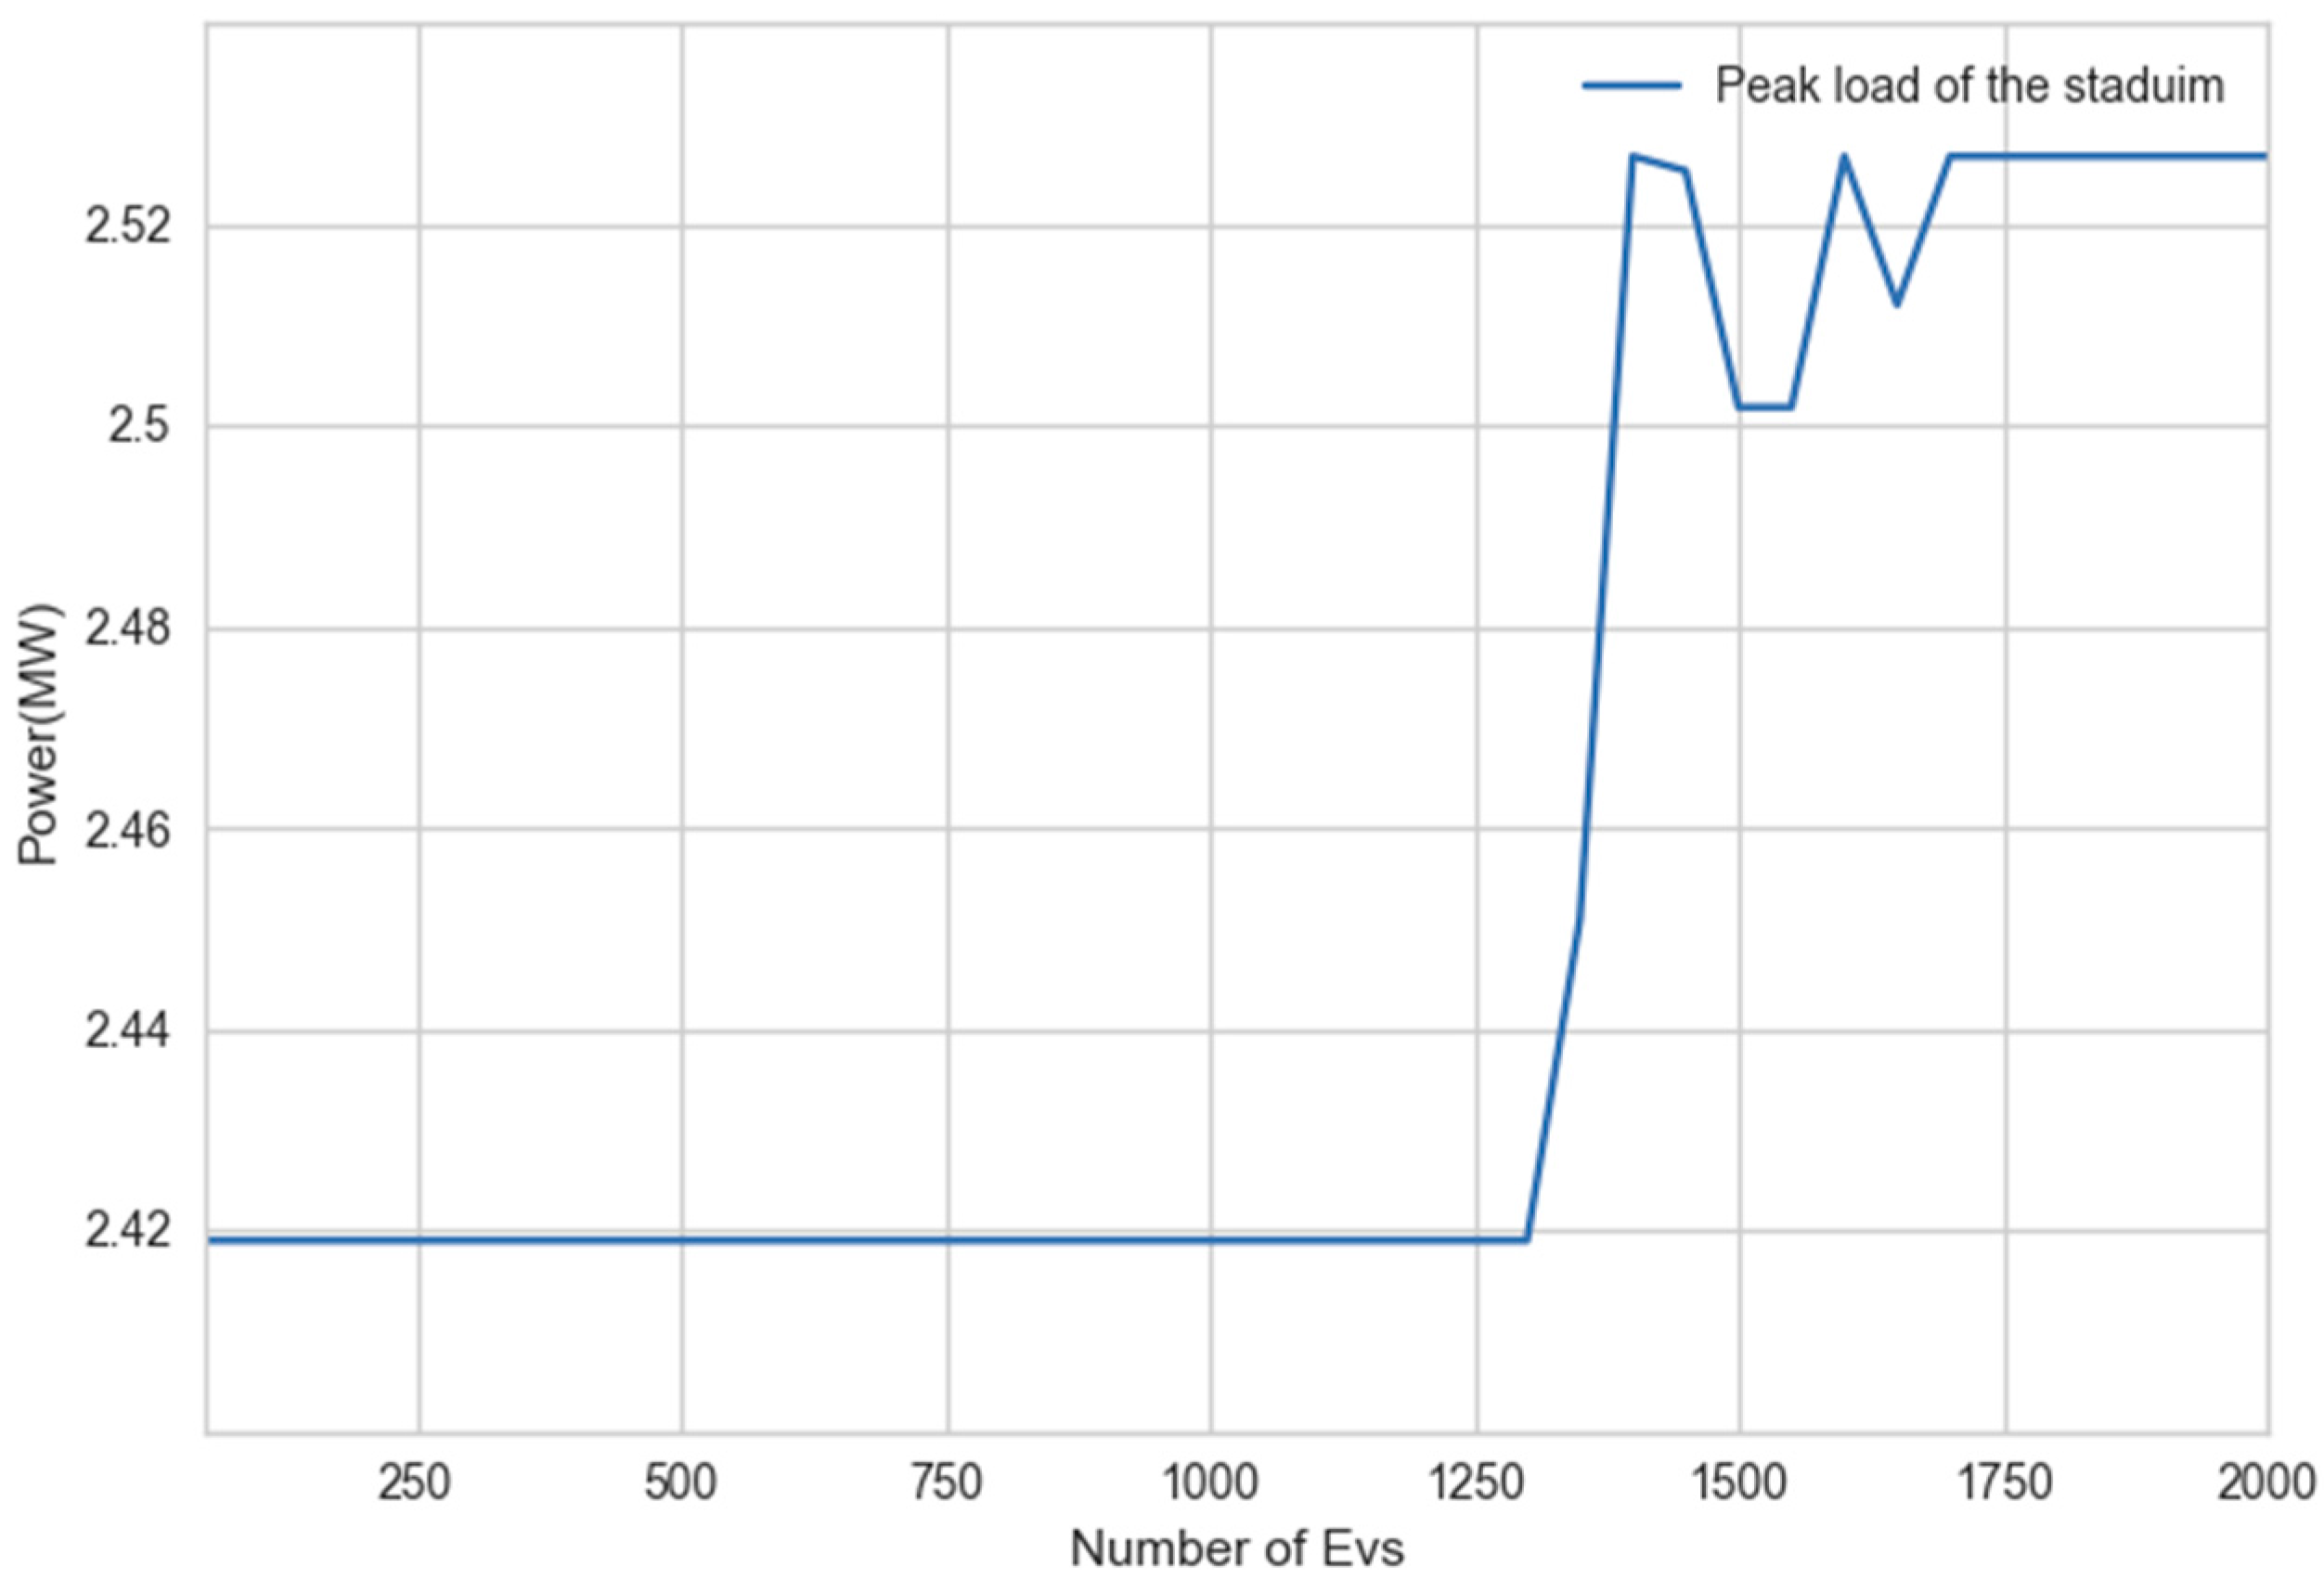
3.4.4. Scenario 4
3.5. Discussion on the Simulation Results
4. Legal Aspects
4.1. Basic Setting: Legal Framework
4.2. Demand Side Management for Optimizing Electricity Portfolio
4.3. Demand Side Management for Solving Network Issues
4.4. Demand Side Management from Electrical Vehicles
4.5. Conclusions
5. Discussion and Conclusions
Acknowledgments
Author Contributions
Conflicts of Interest
Abbreviations
| CPO | Charging Point Operator |
| CTA | Connection and Transportation Agreement |
| DEM | Decentralized Energy Management |
| DSM | Demand Side Management |
| DER | Distributed Energy Resources |
| DSO | Distribution System Operator |
| EU | European Union |
| EV | Electrical Vehicle |
| RES | Renewable Energy Sources |
| MSP | Mobility Service Provider |
| NRA | National Regulatory Authority |
| TSO | Transmission System Operator |
Nomenclature
| Set of time intervals used within the simulations. | |
| Charging or discharging value of the planned storage system for interval . | |
| Minimum charge/discharge value for the planned storage in any time interval. | |
| Maximum charge/discharge value for the planned storage in any time interval. | |
| State-of-charge of the planned storage system in interval . | |
| Maximum state-of-charge of the planned storage system. | |
| Set of EVs used within the simulations. | |
| Amount of energy charged into EV in time interval . | |
| Maximum amount of energy charged into EV in any time interval. | |
| Time interval EV arrives at the stadium. | |
| Time interval EV is schedules to leave the stadium. | |
| Amount of energy that needs to be charged into EV while parked at the stadium. |
References and Note
- Nykamp, S.; Bosman, M.; Molderink, A.; Hurink, J.L.; Smit, G.J.M. Value of distributed storage—Competition or cooperation of stakeholders? IEEE Trans. Smart Grid 2013, 4, 1361–1370. [Google Scholar] [CrossRef]
- Siano, P. Demand response and smart grids—A survey. Renew. Sustain. Energy Rev. 2014, 30, 461–478. [Google Scholar] [CrossRef]
- Deng, R.; Yang, Z.; Chow, M. A Survey on Demand Response in Smart Grids: Mathematical Models and Approaches. IEEE Trans. Ind. Inf. 2015, 11, 570–582. [Google Scholar] [CrossRef]
- Kok, K. The PowerMatcher: Smart Coordination for the Smart Electricity Grid. Ph.D. Thesis, Vrije Universiteit, Amsterdam, The Netherlands, 2013. [Google Scholar]
- Iacovella, S.; Ruelens, F.; Vingerhoets, P.; Claessens, B.; Deconinck, G. Cluster Control of Heterogeneous Thermostatically Controlled Loads Using Tracer Devices. IEEE Trans. Smart Grid 2017, 8, 528–536. [Google Scholar] [CrossRef]
- Mohsenian-Rad, A.H.; Wong, V.W.S.; Jatskevich, J.; Schober, R.; Leon-Garcia, A. Autonomous demand-side management based on game-theoretic energy consumption scheduling for the future smart grid. IEEE Trans. Smart Grid 2010, 1, 320–331. [Google Scholar] [CrossRef]
- Alam, M.R.; St-hilaire, M.; Kunz, T. Computational Methods for Residential Energy Cost Optimization in Smart Grids: A Survey. ACM Comput. Surv. 2016, 49, 2. [Google Scholar] [CrossRef]
- Barbato, A.; Capone, A. Optimization models and methods for demand-side management of residential users: A survey. Energies 2014, 7, 5787–5824. [Google Scholar] [CrossRef]
- Vardakas, J.S.; Zorba, N.; Verikoukis, C.V. A Survey on Demand Response Programs in Smart Grids: Pricing Methods and Optimization Algorithms. IEEE Commun. Surv. Tutor. 2014, 17. [Google Scholar] [CrossRef]
- NOW. Distributed Intelligence for Smart Power routing and mATCHing (DISPATCH). Available online: https://www.nwo.nl/en/research-and-results/programmes/URSES+-+Uncertainty+Reduction+in+Smart+Energy+Systems/distributed+intelligence+for+smart+power+routing+and+matching (accessed on 30 November 2017).
- Krüger, H. European Energy Law and Policy; Edward Elgar: Cheltenham, UK, 2016; ISBN 9781786430359. [Google Scholar]
- Hoogsteen, G.; Molderink, A.; Hurink, J.L.; Smit, G.J.M.; Kootstra, B.; Schuring, F. Charging electric vehicles, baking pizzas, and melting a fuse in Lochem. CIRED Open Access Proc. J. 2017, 2017, 1629–1633. [Google Scholar] [CrossRef]
- Nykamp, S.; Rott, T.; Dettke, N.; Küppers, S. The project “ElChe” Wettringen: Storage as an alternative to grid reinforcements—Experiences, benefits and challenges from a DSO point of view. In Proceedings of the International ETG Congress on Die Energiewende, Bonn, Germany, 17–18 November 2015; pp. 521–526. [Google Scholar]
- Clement-Nyns, K.; Haesen, E.; Driesen, J. The impact of charging plug-in hybrid electric vehicles on a residential distribution grid. Power Syst. IEEE Trans. 2010, 25, 371–380. [Google Scholar] [CrossRef] [Green Version]
- Strbac, G. Demand side management: Benefits and challenges. Energy Policy 2008, 36, 4419–4426. [Google Scholar] [CrossRef]
- Humayun, M.; Degefa, M.Z.; Safdarian, A.; Lehtonen, M. Utilization improvement of transformers using demand response. IEEE Trans. Power Deliv. 2015, 30, 202–210. [Google Scholar] [CrossRef]
- Government of the Netherlands. Coalition Agreement ‘Confidence in the Future’; Government of the Netherlands: The Hague, The Netherlands, 2017.
- PhaseToPhase Vision Network Analysis. Available online: http://www.phasetophase.nl/nl_products/vision_network_analysis.html (accessed on 27 December 2017).
- Craig, P.; de Búrca, G. EU Law: Text, Cases, and Materials, 6th ed.; Oxford University Press: Oxford, UK, 2015; ISBN 9780198714927. [Google Scholar]
- Government of the Netherlands. Problem-Free Electric Driving in the Benelux. Available online: https://www.government.nl/topics/environment/news/2017/12/07/problem-free-electric-driving-in-the-benelux (accessed on 27 December 2017).
- Gerards, M.E.T.; Toersche, H.A.; Hoogsteen, G.; Van Der Klauw, T.; Hurink, J.L.; Smit, G.J.M. Demand side management using profile steering. In Proceedings of the 2015 IEEE Eindhoven PowerTech, Eindhoven, The Netherlands, 29 June–2 July 2015. [Google Scholar] [CrossRef]
- Van Der Klauw, T. Decentralized Eneergy Management with Profile Steering. Ph.D. Thesis, University of Twente, Enschede, The Netherlands, 2017. [Google Scholar]
- Hoogsteen, G. A Cyber-Physical Systems Perspective on Decentralized Energy Management; Nederlandse Organisatie voor Wetenschappelijk Onderzoek (NWO): Enschede, The Netherlands, 2017. [Google Scholar] [CrossRef]
- Idaho National Laboratory. Workplace Charging Case Study: Charging Station Utilization at a Work Site with AC Level 1, AC Level 2, and DC Fast Charging Units; Idaho National Laboratory: Idaho Falls, ID, USA, 2014.
- Hajighasemi, M.; Hurink, J.L.; Smit, G.J.M. Planning Based Real-Time Control Using DEMKit. In Proceedings of the PowerTech, Manchester, UK, 18–22 June 2017. [Google Scholar]
- Elektriciteitswet 1998 (Electricity Act), Stb. 1998. Available online: http://wetten.overheid.nl/BWBR0009755/ (accessed on 27 December 2017).
- Roggenkamp, M. Energy Law in the Netherlands. In Energy Law in Europe; Roggenkamp, M., Redgwell, C., Ronne, A., del Guayo, I., Eds.; Oxford University Press: Oxford, UK, 2016; ISBN 9780198712893. [Google Scholar]
- Directive 2009/72/EC repealing Directive 2003/54/EC of the European Parliament and of the Council concerning common rules for the internal market in electricity (Electricity Directive) [2009] OJ L211/55.
- Tarievencode Elektriciteit, 21 April 2016 (Tariff Code), Stcrt. 2016, 21426. Available online: http://wetten.overheid.nl/BWBR0037951/ (accessed on 27 December 2017).
- Leal-Arcas, R.; Lesniewska, F.; Proedrou, F. Smart Grids in the European Union: Assessing Energy Security, Regulation & Social and Ethical Considerations. Columbia J. Eur. Law. 2017. Forthcoming; Queen Mary School of Law Legal Studies Research Paper No. 263/2017. Available online: https://ssrn.com/abstract=3062957 (accessed on 27 December 2017).
- Eid, C.; Codani, P.; Perez, Y.; Reneses, J.; Hakvoort, R. Managing electric flexibility from Distributed Energy Resources: A review of incentives for market design. Renew. Sustain. Energy Rev. 2016, 64, 237–247. [Google Scholar] [CrossRef]
- Ramos, A.; De Jonghe, C.; Gómez, V.; Belmans, R. Realizing the smart grid’s potential: Defining local markets for flexibility. Util. Policy 2016, 40, 26–35. [Google Scholar] [CrossRef]
- Koliou, E. Demand Response Policies for the Implementation of Smart Grids. Ph.D. Thesis, Delft University of Technology, Delft, The Netherlands, 2016. [Google Scholar]
- USEF: The Framework Explained. Available online: https://www.usef.energy/download-the-framework/ (accessed on 27 December 2017).
- Nobel, F.A. On Balancing Market Design; Technische Universiteit Eindhoven: Eindhoven, The Netherlands, 2016. [Google Scholar]
- Mäntysaari, P. EU Electricity Trade Law: The Legal Tools of Electricity Producers in the Internal Electricity Market; Springer International Publishing: New York, NY, USA, 2015; ISBN 9783319165127. [Google Scholar]
- Baljon, L. Juridische aspecten van het plaatsen van laadpalen voor elektrisch vervoer. Nederlands Tijdschrift Voor Energierecht 2015, 2, 66–74. [Google Scholar]
- Wet Waardering Onroerende Zaken, 15 December 1994, Stb. 1994. Available online: http://wetten.overheid.nl/BWBR0007119/ (accessed on 27 December 2017).
- Reehuis, W.H.; Heisterkamp, A.H.T. Goederenrecht; Kluwer: Deventer, The Netherlands, 2006. [Google Scholar]
- Codebesluit Meerdere Leveranciers op een Aansluiting, 17 July 2017, Stcrt. 2017, 39821. Available online: zoek.officielebekendmakingen.nl/stcrt-2017-39821.html (accessed on 27 December 2017).
- ACM. ACM/DE/2016/2005880V, 15.0772.53 Afsluiting Onderzoek Activiteiten Allego. Available online: https://www.acm.nl/sites/default/files/old_publication/publicaties/15461_brief-acm-afsluiting-onderzoek-activiteiten-allego-2016-02-08.pdf (accessed on 27 December 2017).
- Allego. Available online: https://www.allego.eu/?sl=eu (accessed on 27 December 2017).
- Vandebron (only in Dutch). Available online: https://energie.vandebron.nl/elektrisch-rijden-pr (accessed on 27 December 2017).
- Allego. “Overeenkomst Met Betrekking tot Interoperatibiliteit Openbare Oplaadpunten Elektrisch Vervoer” (Interoperatibility Agreement). Available online: https://www.allego.eu/wp-content/uploads/2015/07/Allego-vs-MSP-InteroperabiliteitsContract-Standaard-v.201507.pdf (accessed on 27 December 2017).
- Vandebron. “Algemene Voorwaarden Laadpas” (General Terms Charging Card). Available online: https://vandebron.nl/assets/pdf/Algemene_voorwaarden_Laadpas_2017.pdf (accessed on 27 December 2017).
- Pérez-Arriaga, I.J. Regulation of the Power Sector; Pérez-Arriaga, I.J., Ed.; Power Systems; Springer: London, UK, 2013; ISBN 978-1-4471-5033-6. [Google Scholar]
- Diestelmeier, L.; Kuiken, D. Smart Electricity Systems. Eur. Compet. Regul. Law Rev. 2017, 1, 40. [Google Scholar] [CrossRef]
- Neuteleers, S.; Mulder, M.; Hindriks, F. Assessing fairness of dynamic grid tariffs. Energy Policy 2017, 108, 111–120. [Google Scholar] [CrossRef]


| Gr. | Provider | No. | Ratings | uk (%) | P0 (kW) |
|---|---|---|---|---|---|
| A | Pauwels | 2 | 10500/400 V—1000 kVA | 5.8 | 1.1 |
| HOLEC | 2 | 10250/400 V—1000 kVA | 6.3 | 1.1 | |
| B | Smit | 2 | 10250/400 V—1000 kVA | 6.0 | 1.1 |
| IEO | 2 | 10500/400 V—630 kVA | 3.8 | 0.9 | |
| C | Smit | 1 | 10250/400 V—1000 kVA | 5.1 | 1.4 |
| IEO | 1 | 10500/400 V—1000 kVA | 5.7 | 1.1 |
| Type | R0 (mΩ/km) | X0 (mΩ/km) | R0/X0 |
|---|---|---|---|
| 150Al (3 × 150Al VGPLK 10 kV) | 229 | 78 | 2.94 |
| 150Al X (6/10 kV 3 × 150Al + as70) | 265 | 93 | 2.85 |
| 240Al (3 × 240Al VGPLK 10 kV) | 139 | 74 | 1.88 |
| 240Al X (6/10 kV 3 × 240Al + as70) | 162 | 98 | 1.65 |
© 2018 by the authors. Licensee MDPI, Basel, Switzerland. This article is an open access article distributed under the terms and conditions of the Creative Commons Attribution (CC BY) license (http://creativecommons.org/licenses/by/4.0/).
Share and Cite
Kuiken, D.; Más, H.F.; Haji Ghasemi, M.; Blaauwbroek, N.; Vo, T.H.; Van der Klauw, T.; Nguyen, P.H. Energy Flexibility from Large Prosumers to Support Distribution System Operation—A Technical and Legal Case Study on the Amsterdam ArenA Stadium. Energies 2018, 11, 122. https://doi.org/10.3390/en11010122
Kuiken D, Más HF, Haji Ghasemi M, Blaauwbroek N, Vo TH, Van der Klauw T, Nguyen PH. Energy Flexibility from Large Prosumers to Support Distribution System Operation—A Technical and Legal Case Study on the Amsterdam ArenA Stadium. Energies. 2018; 11(1):122. https://doi.org/10.3390/en11010122
Chicago/Turabian StyleKuiken, Dirk, Heyd F. Más, Maryam Haji Ghasemi, Niels Blaauwbroek, Thai H. Vo, Thijs Van der Klauw, and Phuong H. Nguyen. 2018. "Energy Flexibility from Large Prosumers to Support Distribution System Operation—A Technical and Legal Case Study on the Amsterdam ArenA Stadium" Energies 11, no. 1: 122. https://doi.org/10.3390/en11010122