Impedance Characterization and Modeling of Lithium-Ion Batteries Considering the Internal Temperature Gradient

1
National Fuel Cell Vehicle & Powertrain System Research & Engineering Center, No. 4800, Caoan Road, Shanghai 201804, China
2
School of Automotive Studies, Tongji University, No. 4800, Caoan Road, Shanghai 201804, China
*
Author to whom correspondence should be addressed.
Energies 2018, 11(1), 220; https://doi.org/10.3390/en11010220
Submission received: 30 December 2017
/
Revised: 11 January 2018
/
Accepted: 13 January 2018
/
Published: 17 January 2018
(This article belongs to the Special Issue 2nd Young Scholar’s Symposium on Battery Design and Management (BDM 2017))
Abstract
:Battery impedance is essential to the management of lithium-ion batteries for electric vehicles (EVs), and impedance characterization can help to monitor and predict the battery states. Many studies have been undertaken to investigate impedance characterization and the factors that influence impedance. However, few studies regarding the influence of the internal temperature gradient, which is caused by heat generation during operation, have been presented. We have comprehensively studied the influence of the internal temperature gradient on impedance characterization and the modeling of battery impedance, and have proposed a discretization model to capture battery impedance characterization considering the temperature gradient. Several experiments, including experiments with artificial temperature gradients, are designed and implemented to study the influence of the internal temperature gradient on battery impedance. Based on the experimental results, the parameters of the non-linear impedance model are obtained, and the relationship between the parameters and temperature is further established. The experimental results show that the temperature gradient will influence battery impedance and the temperature distribution can be considered to be approximately linear. The verification results indicate that the proposed discretization model has a good performance and can be used to describe the actual characterization of the battery with an internal temperature gradient.
1. Introduction
Currently, the world faces increasingly severe environmental problems, including the greenhouse effect and industrial pollution [1]. It is also beset by the shortage of resources, especially fossil fuel energy. To resolve these urgent problems, people consider green cars including battery electric vehicles (BEVs), fuel cell electric vehicles (FCEVs), hybrid EVs (HEVs), and so on, to be critically important [2]. As key components of green cars, batteries have attracted great attention in recent years. Among the current commercial batteries, lithium-ion batteries (LIBs) are considered as the best choice for automobile application, due to their high power/energy density, long life cycle, safety, and environmental friendliness [3,4,5]. However, safe operating conditions are hard to ensure for LIBs, so the battery management system (BMS) is essential when LIBs are used in vehicles [6,7]. To monitor and better manage LIBs in the battery pack, the pack voltage, pack current, cell voltage, cell temperature, cell impedance and so on must be detected.
Battery impedance has been regularly employed to investigate battery parameters and states. Buller et al. [8] proposed an impedance-based simulation model for supercapacitors and LIBs, and the results showed that the simulated and measured voltage data were in excellent agreement. Xu et al. [9] analyzed the impedance spectra of LIBs and derived a simplified impedance model for the estimation of battery state of charge (SOC). Based on the different value of the simplified equivalent circuit elements at different SOCs, Westerhoff et al. [10] developed a novel method to estimate the battery SOC, and this method could be considered as complementary to the ampere-hour integral method. Moreover, battery impedance has been employed to estimate the battery’s internal temperature and determine the thermal model parameters [11,12,13,14].
Considering the importance of battery impedance, many researchers have studied the impedance characterization during practical applications. Schönleber et al. [15] derived the impedance of a LIB electrode from the intercalation reaction of lithium and studied its dependency on SOC, and the results showed that the electrolyte diffusion impedance is independent of the SOC. Huang et al. [16] systematically analyzed how different SOCs of 7.5~93.0% can influence battery impedance, and the results indicated that both charge transfer resistance and diffusion resistance increased dramatically when SOC is below 26.5%. Jiang et al. [17] investigated the impedance of batteries with different life cycles (up to 520 cycles) and found that when the frequency is higher than 100 Hz, the impedance phase of different, aging batteries would be different to each other. Other than the influence of SOC and battery aging status on battery impedance, battery temperature also has a great impact on impedance. Andre et al. [18] investigated the influence of temperature and SOC on LIBs and, through the cell impedance, the non-linear correlation between temperature and impedance was found. Raijmakers et al. [19] studied the impedance characterization of a pristine nickel cobalt aluminum oxide battery (NCA) cell at different temperatures and found that ohmic resistance would decrease as the temperature increases and inductive characteristics barely change. Xiao et al. [20] found that the battery impedance is sensitive to temperature because the ions’ mobility and permittivity are dependent on temperature.
During operation, heat generation caused by charge/discharge may contribute to the temperature rise, and undoubtedly, the temperature rise is inhomogeneous. Usually, the cell internal temperature will always be higher, and the temperature will decrease from inside to outside, which can be called the temperature gradient. It is a common phenomenon, but very few studies have investigated the influence of the temperature gradient. In references [21,22], a lumped-parameter electro-thermal model was proposed and applied. The parameters of the electrical model were modified according to the average battery temperature. However, the core temperature was obviously higher than the surface temperature, and the influence of the temperature gradient was ignored. The influence of the temperature gradient on an LIB’s impedance characterization has not been extensively studied either. Troxler et al. [23] designed an artificial temperature gradient for the battery and analyzed the performance of LIBs. For a cell with similar average temperature, the larger the temperature gradient, the greater the behavior deviation from a cell with a uniform temperature will be. However, that study only focused on the charge transfer resistance. In reference [11], the overall resistance of the battery with inhomogeneous temperature distribution was similar to the resistance of the battery with homogeneous temperature distribution, and the homogeneous temperature was the mean value of the inhomogeneous temperature.
The objective of this paper is to investigate battery impedance characterization considering the internal temperature gradient, and then prove that the model considering the temperature gradient will perform better. We will propose a novel discretization model and experiments with the design of artificial temperature gradients for the battery with the help of a heating plate. The remaining part of this paper is organized as follows: Section 2 will introduce the battery impedance, and a discretization model, based on the non-linear impedance model, is proposed to study the influence of the battery internal temperature gradient on impedance. In Section 3, several experiments are conducted to investigate the impact on battery impedance, and a heating plate is used to construct the artificial temperature gradient. Section 4 will provide some experimental results and discuss the influencing factors on battery impedance. The verification results of the proposed discretization model are also shown in order to verify the model performance. Finally, some conclusions are drawn and summations provided in Section 5.
2. Methodology
2.1. Battery Non-Linear Impedance Model
Electrochemical impedance spectroscopy (EIS) is the method most used to obtain the impedance characterization of LIBs, due to its accuracy and non-damaging effects. During EIS measurement, the electrochemical system is loaded with a specific amplitude but different frequency sine current; after measuring the corresponding electrical feedback voltage signal, characterization of the electrochemical system will be obtained. Figure 1 shows the impedance spectroscopy of a lithium-ion battery at 50% SOC and ambient temperature if 0 °C. The measurement frequency ranges from 0.01 Hz to 10 kHz. Obviously, the whole impedance spectroscopy consists of three main regions: the low-frequency region, middle-frequency region and high-frequency region [9]. The low-frequency region ranges from 0.01 Hz to 0.16 Hz, the middle-frequency region ranges from 0.16 Hz to 630 Hz, and the high-frequency region ranges from 630 Hz to 10 kHz.
In the low-frequency region, impedance spectroscopy looks like a straight line with a constant slope, a typical phenomenon of diffusion [24]. In the middle-frequency region, the impedance spectroscopy is a depressed semicircle caused by the charge transfer reaction at the electrode surfaces. In the high-frequency region, the impedance spectroscopy forms a small curve and intersects with the abscissa axis. The high-frequency region reflects the battery’s inductance and ohmic resistance.
According to the above battery impedance spectroscopy and the battery equivalent circuit models widely used, we employ the following model shown in Figure 2 to analyze battery impedance. The model consists of four parts to represent the physical and electrochemical reaction processes inside the battery. The inductance L and resistance Ro describe the battery behaviors at high frequency, where the resistance Ro equals the value of the intersection of the impedance spectroscopy and the abscissa axis. To better capture the non-linear behavior of the battery, a new equivalent circuit element with a constant, frequency-independent phase has been widely applied in lithium-ion equivalent circuit models [23,24,25]. The middle-frequency region is modeled by a constant phase element (CPE) (CPE1) and a resistance (R1) connected in parallel. In the low-frequency region, another CPE (CPE2) instead of a Warburg impedance is used to describe the diffusion characterization, because the Warburg impedance may lead to fitting failure and a CPE can also produce the characterization of an infinite-length Warburg element [25].
The impedance of a CPE can be expressed in fractional calculus as:
where ZCPE is the impedance of the CPE; s is the Laplace operator; Q is the fractional coefficient; and α is the fractional order, , . It should be noted that the CPE represents a resistance when α = 0, and represents a capacitance when α = 1.
The mathematical expression of the impedance of the whole equivalent circuit model is:
where Zmodel denotes the impedance of the equivalent circuit model; L and Ro are the inductance resistance in the high-frequency region; R1 is the resistance in the middle-frequency region; Q1 and α are the fractional coefficient and order of the CPE1; and Q2 and β are the fractional coefficient and order of the CPE2.
2.2. Discretization Model Considering the Temperature Gradient
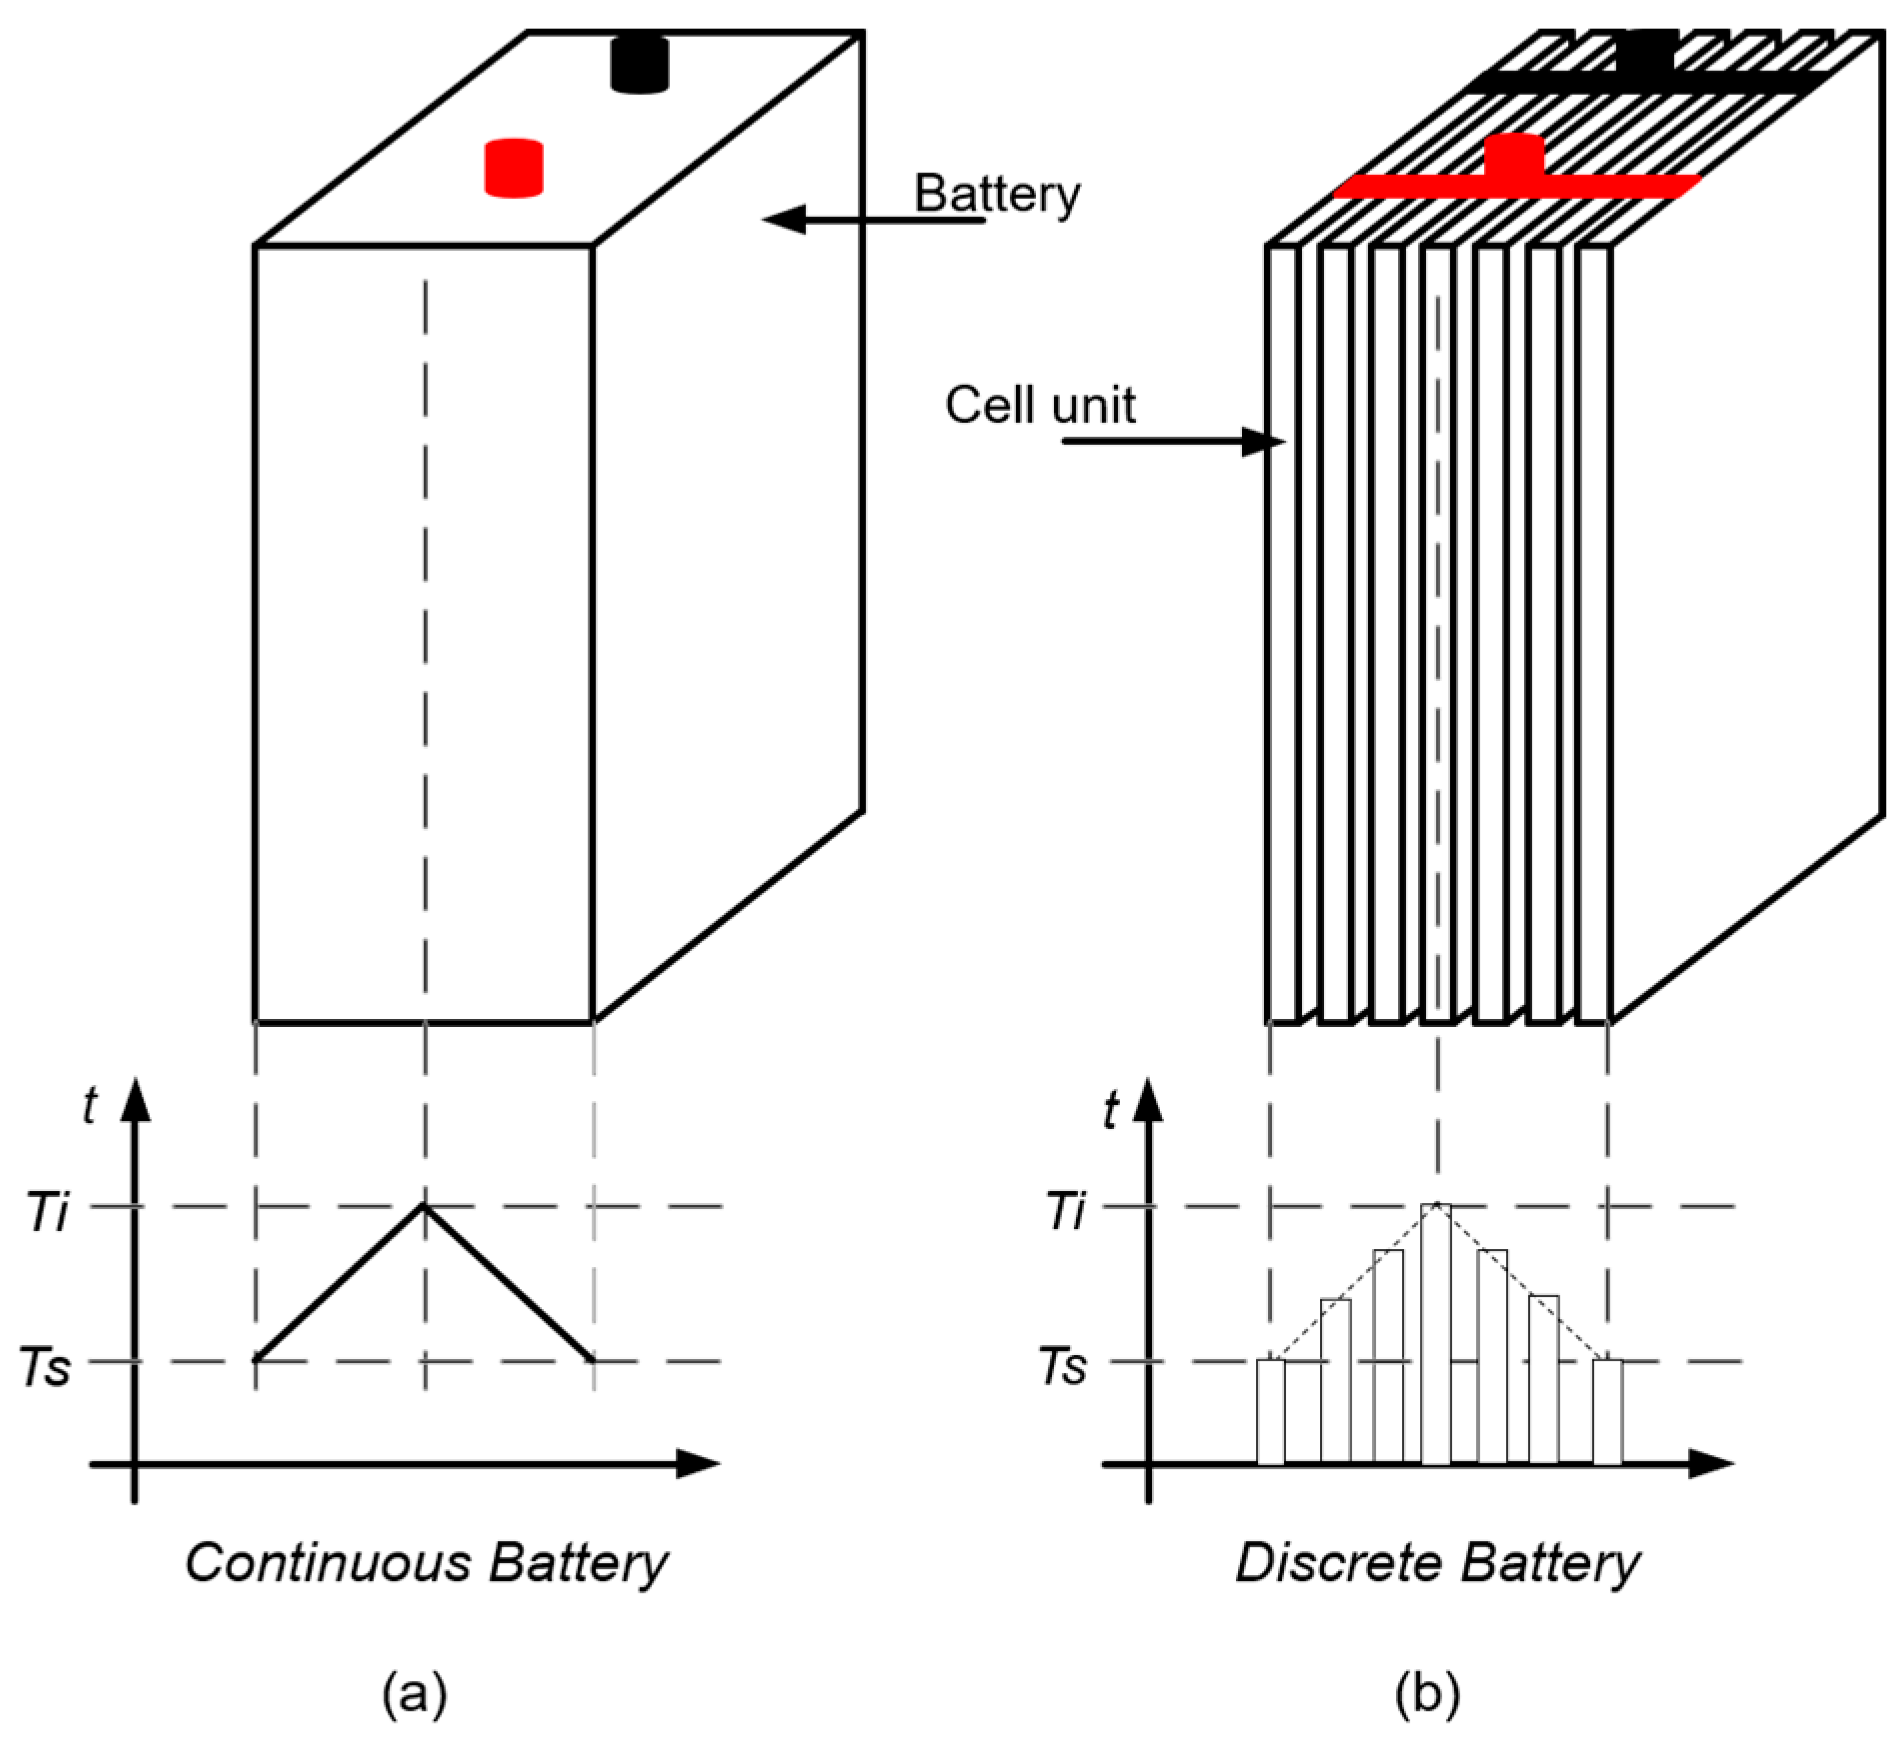
As mentioned above, heat will be generated during charging and discharging, and the heat will lead to a temperature difference between core and surface. Usually, a battery consists of several electrode layers in which the positive layer and the negative layer are separated by the separator. The positive and negative tabs are connected in parallel and then constitute a battery. According to this view, we can consider one electrode layer or several electrode layers as a cell unit, and several cell units form a battery. The thickness of each cell unit is small so that the temperature of each cell unit can be considered as uniform. Every cell unit’s temperature is different if there exists a temperature gradient internal to the battery, and every unit’s temperature can be determined if the internal temperature distribution is obtained.
In Schmidt’s [11] study, three assumptions about the battery internal temperature distribution perpendicular to the electrodes have been made, including the constant distribution, linear distribution, and polynomial distribution. Constant distribution is that the temperature of each electrode is a constant equal to the mean value of the temperature of two surfaces. For polynomial distribution, the temperature distribution inside the battery is a polynomial function.
In our study, we assume the temperature distribution inside the battery is linear. On the one hand, considering the battery thickness, the curvature of the temperature distribution line is small, and it can be approximated as linear. On the other hand, the calculation of each cell unit’s temperature will become more complicated if the temperature distribution line is non-linear. The assumption is shown below:
Assumption 1.
The temperature distribution is linear in the direction vertical to the battery tabs if the battery thickness is far less than the battery height.
Figure 3 shows the diagram of the battery discretization. In Figure 3a, the battery is considered as a continuous battery, and Ti is the internal temperature and Ts is the surface temperature. In most case, the temperature of the two surfaces is similar, and Ti is the maximum battery temperature. According to the above assumption, the temperature distribution is linear and symmetrical. In Figure 3b, we discretize the continuous battery into individual cell units and the battery can be considered as these several cell units connected in parallel. Every cell unit has a uniform temperature.
In Figure 4, we place a heating source on the left side of the battery, and Ts1 is the temperature of the battery’s left surface and Ts2 is the temperature of the battery’s right surface. If the heating source provides enough heat and the battery does not produce heat itself, Ts1 can be considered as the maximum temperature of the battery and Ts2 is the minimum. From Ts1 to Ts2, the temperature inside the battery is in a linear distribution. Every cell unit’s temperature can be determined if we obtain Ts1 and Ts2. After the determination of the temperature of each cell unit, the cell unit’s impedance will be determined. For example, in Figure 4, the impedance of the leftmost cell unit performs like the continuous battery at high temperature, and the impedance of the rightmost cell unit acts as the continuous battery at low temperature. The continuous battery is made up of several cell units connected in parallel.
After dividing a battery with an external heating source like Figure 4 into N cell units, the temperature of each cell unit will be as follows:
where Ti is the temperature of the ith cell unit, and the 1st is the leftmost cell unit.
According to the relationship of each cell unit, the impedance of the discretization model can be listed as:
where ZD-model is the impedance of the discretization model, and Zi is the impedance of the ith cell unit.
In the following sections, the influence of temperature on battery impedance will be investigated. After the relationship between Zi and Ti in ith cell unit is obtained, the impedance of the discretization model will be known according to Equations (3) and (4).
According to the above methodology, the flowchart of the discretization modeling of the battery impedance can be illustrated in Figure 5.
3. Experiment
EIS experiments are undertaken to investigate the battery’s characteristics. A pouch-type LiFePO4 battery with a nominal capacity of 40 Ah is used in the experiment, and there are 51 electrode layers stacked inside the battery. The size of the battery is 133 mm × 16.1 mm × 184 mm.
Experiments with temperature gradients or not are designed and conducted in this section. In the experiment without a temperature gradient, usually little heat is generated in the EIS experiment, so the environmental chamber temperature is considered as the battery temperature. In the experiment with temperature gradients, a heating plate is used to construct an artificial temperature gradient in order to obtain an accurate and qualitative result. One side of the battery is covered with the heating plate, and the other side is exposed to the environment. Apparently, due to heat convection, the real temperature of the side coated with the heating plate may be lower than the heating plate temperature, and due to heat conduction, the real temperature of the side exposed to the environment may be higher than the environmental temperature. We use thermocouples to obtain the actual temperature and the temperature gradient of the battery. In addition to this, in order to confirm the assumption that the temperature gradient is linearly distributed, two thermocouples are placed inside the battery.
Figure 6 shows the position of the thermocouples inside the battery. T-type thermocouples are used in the experiments, and the diameter of the thermocouples is 0.28 mm. One thermocouple is placed in the halfway point within the battery, and another is situated at the quarter point within the battery. The battery cell under experiment is shown in Figure 7a.
Figure 7 shows the EIS experimental setup. An electrochemical workstation, as shown in Figure 7b, including the electrochemical interface and the frequency response analyzer, is used to generate the sinusoidal current and then analyze the frequency response of the cell in order to obtain the battery impedance. A power booster (Figure 7c) can enlarge the sinusoidal current generated by the electrochemical workstation. A temperature measurement station (Figure 7d), including the wireless temperature unit and the wireless logging station, is used to obtain the temperature and log the data. The battery cell is placed in an environment chamber, as shown in Figure 7e.
3.1. Experiments without the Temperature Gradient
To acquire the characterization of battery impedance and the relationship between the parameters of the battery’s non-linear impedance model and temperature, the EIS experiment without the temperature gradient is conducted first. Figure 8 shows the diagram of battery EIS experiment without the temperature gradient.
Table 1 shows the detailed EIS experiment steps without the temperature gradient. Enough rest time is necessary before the test to improve the accuracy of the experiment. A sinusoidal current with 2 A amplitude and a frequency ranging from 0.01 Hz to 10 kHz is loaded on the battery.
3.2. Experiments with Artificial Temperature Gradients
As mentioned above, a heating plate is used to construct the temperature gradient. Figure 9 shows the diagram of the battery EIS experiment with temperature gradients. One side of the battery cell is covered with a heating plate. Besides the thermocouples inside the battery, there are thermocouples stuck to the surface of the battery. Although the heating plate temperature and the chamber temperature can be set to specific values, the actual temperature of the battery surface measured by the thermocouples will be used to analyze the temperature gradient. The battery maintains 50% SOC during the experiment with an artificial temperature gradient in order to focus on the correlation of the temperature gradient.
Table 2 shows the detailed EIS experiment steps with a temperature gradient. Enough rest time is also necessary before the test to improve the accuracy of the experiment.
4. Results and Discussion
4.1. Battery EIS Characterization without the Temperature Gradient
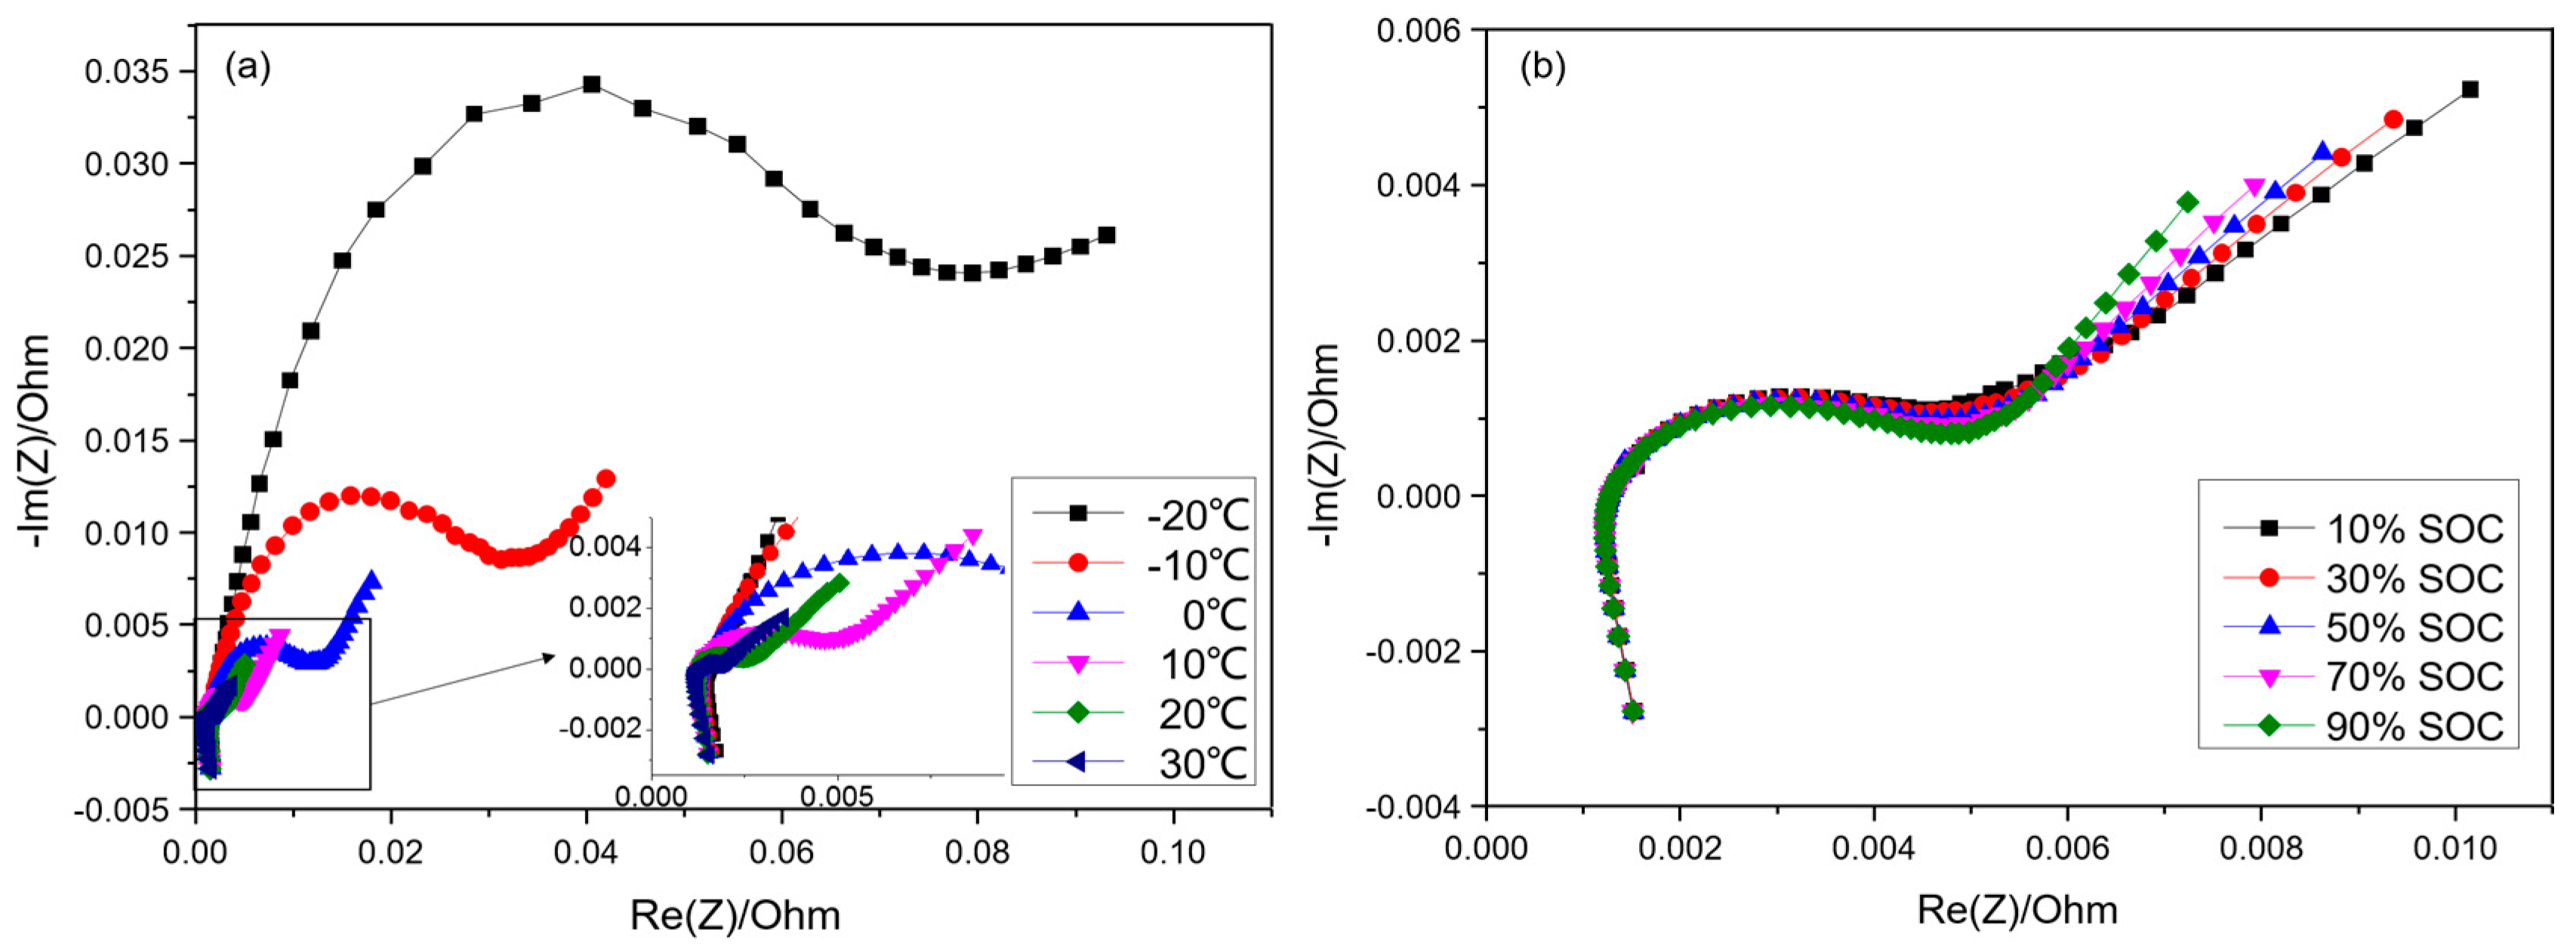
Figure 10 shows the EIS experiment results of the battery with a uniform temperature. Figure 10a shows the EIS of the battery at different temperatures, and from this we can see that, with the increase of temperature, the impedance becomes smaller when the frequency is low. While in the high-frequency region, the EIS curves with different temperatures coincide with each other and this is clearer in the enlarged part of Figure 10a. This indicates that the temperature mainly influences the battery diffusion and charge transfer reaction processes, while the battery’s inductance and ohmic resistance are not affected by the temperature. Figure 10b shows the EIS of a battery with the same temperature but different SOCs. From this picture, we can see that all the curves are close to each other in the middle and high frequencies, and in the low-frequency region, the most obvious difference is the slope. With the increase of the SOC, the slope of the straight line becomes larger. This indicates that SOC mainly impacts the battery diffusion process.
The EIS results of the battery with uniform temperature are shown in Figure 11 with the frequency as a variable; Figure 11a,b shows the impedance magnitude and phase of the battery under different temperatures, while Figure 11c,d is the impedance magnitude and phase of the battery at different SOCs. Figure 11a shows that the battery impedance will increase as the temperature decreases, and the battery impedance at −20 °C is almost 10 times the impedance at 20 °C at the frequency of 0.01 Hz to 0.1 Hz. The impedance phase curves shown in Figure 11b have a great discrimination between 1 Hz and 10 Hz, and that is why the impedance phase can be used to estimate battery temperature [12]. In a similar way to Figure 10b, the impedance magnitude curves in Figure 11c and the phase curves in Figure 11d are close to each other in all frequency ranges, and it can be concluded that the SOC has little impact on the battery impedance.
4.2. Battery EIS Characterization with Temperature Gradients
Temperature distribution inside the battery is analyzed before obtaining the EIS experiment results of the battery with the artificial temperature gradients. Figure 12 shows the temperature distribution inside the battery with the artificial gradients. Due to the battery’s thickness and heat transfer, the actual temperature gradient may be different to the temperature gradient that is set. Six groups of data are shown in this figure, including three groups with a smaller set temperature gradient (10 °C), and three groups with a larger set temperature gradient (35 °C). To get a more intuitive view of these data, we give them a linear fit, and the fitting results are also shown in the figure. From this, we can see that the fitting results are excellent, and the R-Square of all fitting results are greater than 0.98. It can be concluded that the temperature inside the battery is linearly distributed, and the assumption proposed in Section 2 is reasonable.
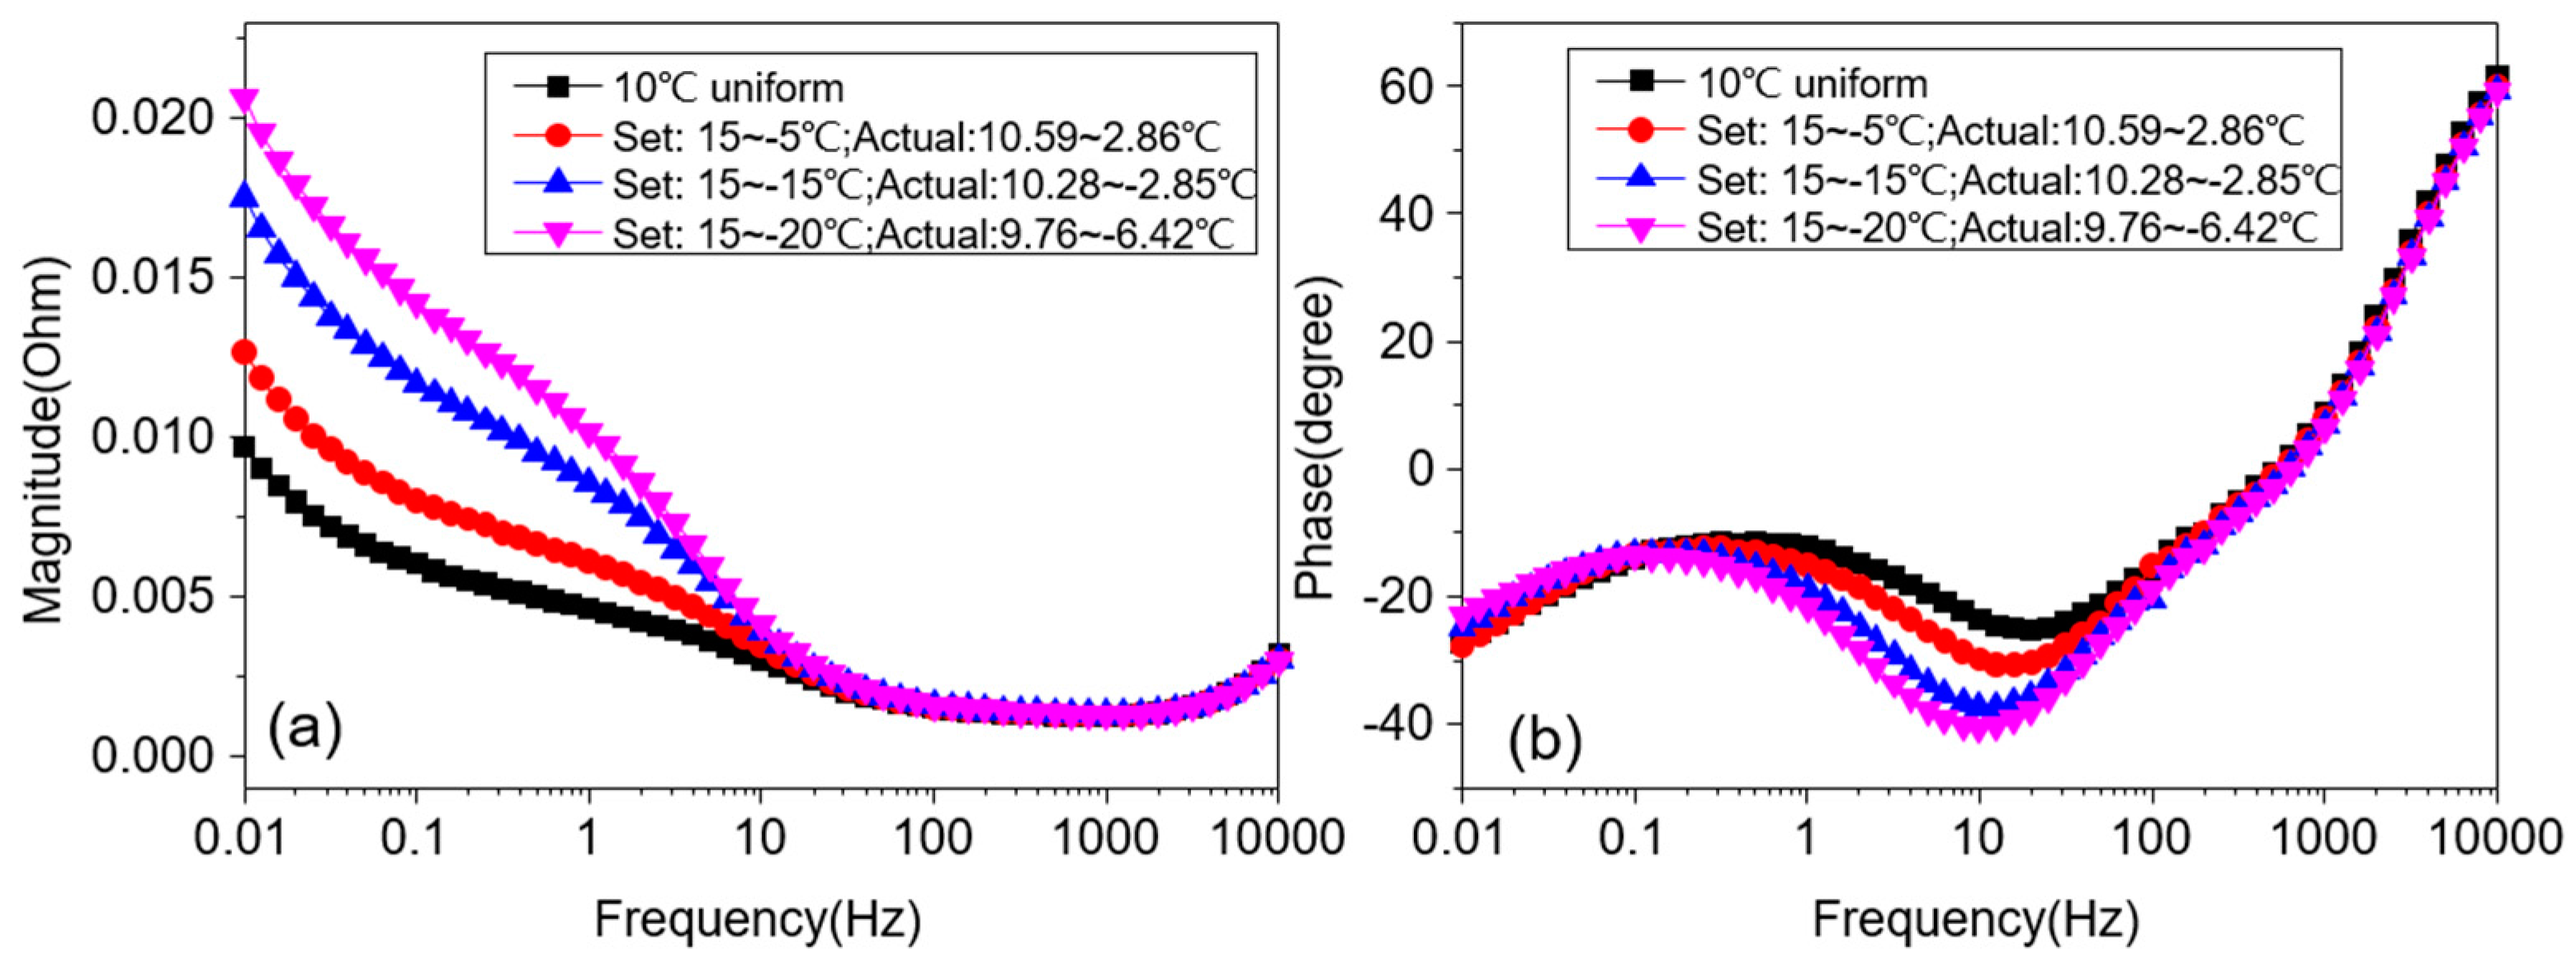
As mentioned above, the temperature has a great impact on battery impedance. The next point to study is the influence of the temperature gradient on the impedance. Figure 13 shows four sets of data, including one experiment at a 10 °C uniform temperature and three experiments with different temperature gradients. In the experiment at a 10 °C uniform temperature, the battery temperature gradient is considered as zero. Although the other three experiments are implemented in different environmental temperature, they have one thing in common, the actual heating plate temperature is about 10 °C (10.59 °C, 10.28 °C, 9.76 °C), so these experiments are considered to have a similar maximum temperature. In the figure, from the black line to the magenta line, the temperature gradient becomes larger. Figure 13a shows that battery impedance will increase as the temperature gradient becomes greater from 0.01 Hz to 10 Hz, and Figure 13b shows that the battery impedance phase will decrease as the temperature gradient becomes greater from 1 Hz to 100 Hz. It may be concluded that if the maximum battery temperature is fixed, the smaller the minimum temperature, the greater the battery impedance magnitude.
There is another point worth noting in Figure 12: the magenta line and the olive line intersect at the half of the battery. According to the assumption that the temperature is linearly distributed, the temperature at the battery’s center can be considered as the average battery temperature. A situation whereby several experiments under different temperature gradients but the same battery average temperature demonstrate similar impedance characterization should be verified and discussed.
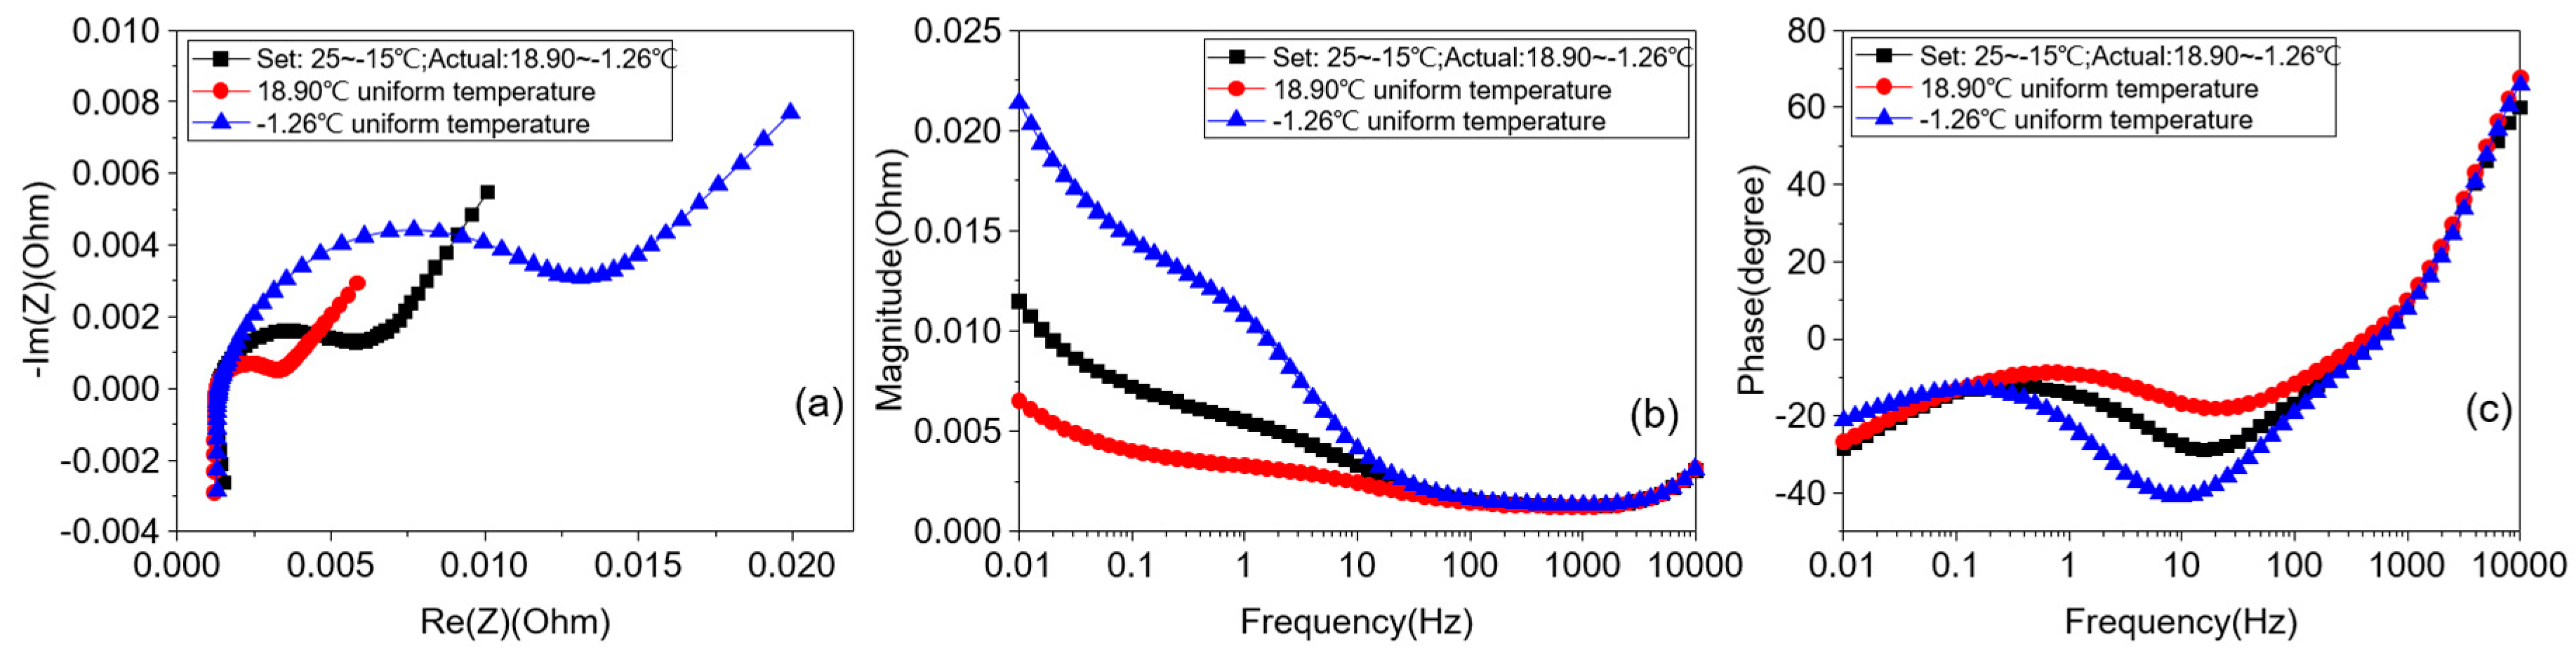
We select some experiments with approximate average temperature, including the lower average temperature (1 °C) and the higher average temperature (21 °C). Besides these, we also supplement the experiments with those of 1 °C and 21 °C uniform temperature. Figure 14 shows the experimental EIS of a battery with approximate average temperature, and in Figure 14b,d, the impedance phase of a battery with different temperature gradients, but in both cases the similar average temperatures almost coincide with each other. In Figure 14a,c, the impedance magnitude of each temperature gradient differs from each other in the low frequency range and is unrelated to the temperature. It may be concluded that batteries with similar average temperature possess similar impedance characterizations.
Some summaries and conclusions about the battery impedance characterization can be drawn according to the above experimental results:
- (1)
- Temperature mainly influences the diffusion and charge transfer reaction processes, while the battery inductance and the ohmic resistance are not affected. SOC only has an impact on the battery diffusion process. In general, the temperature has a greater impact on battery impedance than SOC.
- (2)
- For batteries with the same maximum temperature, battery impedance will increase as the temperature gradient becomes greater, especially in the low-frequency region, and the battery impedance phase will decrease as the temperature gradient become greater in the middle-frequency region.
- (3)
- In our experiment with artificial temperature gradients, we find that the temperature distribution can be approximately considered to be linear, so the central temperature is equal to the average temperature. The experiments with similar average temperature possess similar impedance characterization, and this is consistent with the idea of lumped parameter model.
4.3. Determination of the Parameters of a Battery Non-Linear Impedance Model
The results of experiments without the temperature gradient are used to fit the equivalent circuit model, and one of the fitting results is shown in Figure 15. This indicates that the experimental data and the fitting data almost coincide at all the experimental frequencies, and Figure 15a shows that in the high-frequency region the EIS is not a straight line perpendicular to the abscissa axis; so, maybe a resistance parallel with inductance L can improve the fitting. Overall, the fitting results are acceptable and can be used in the discretization model.
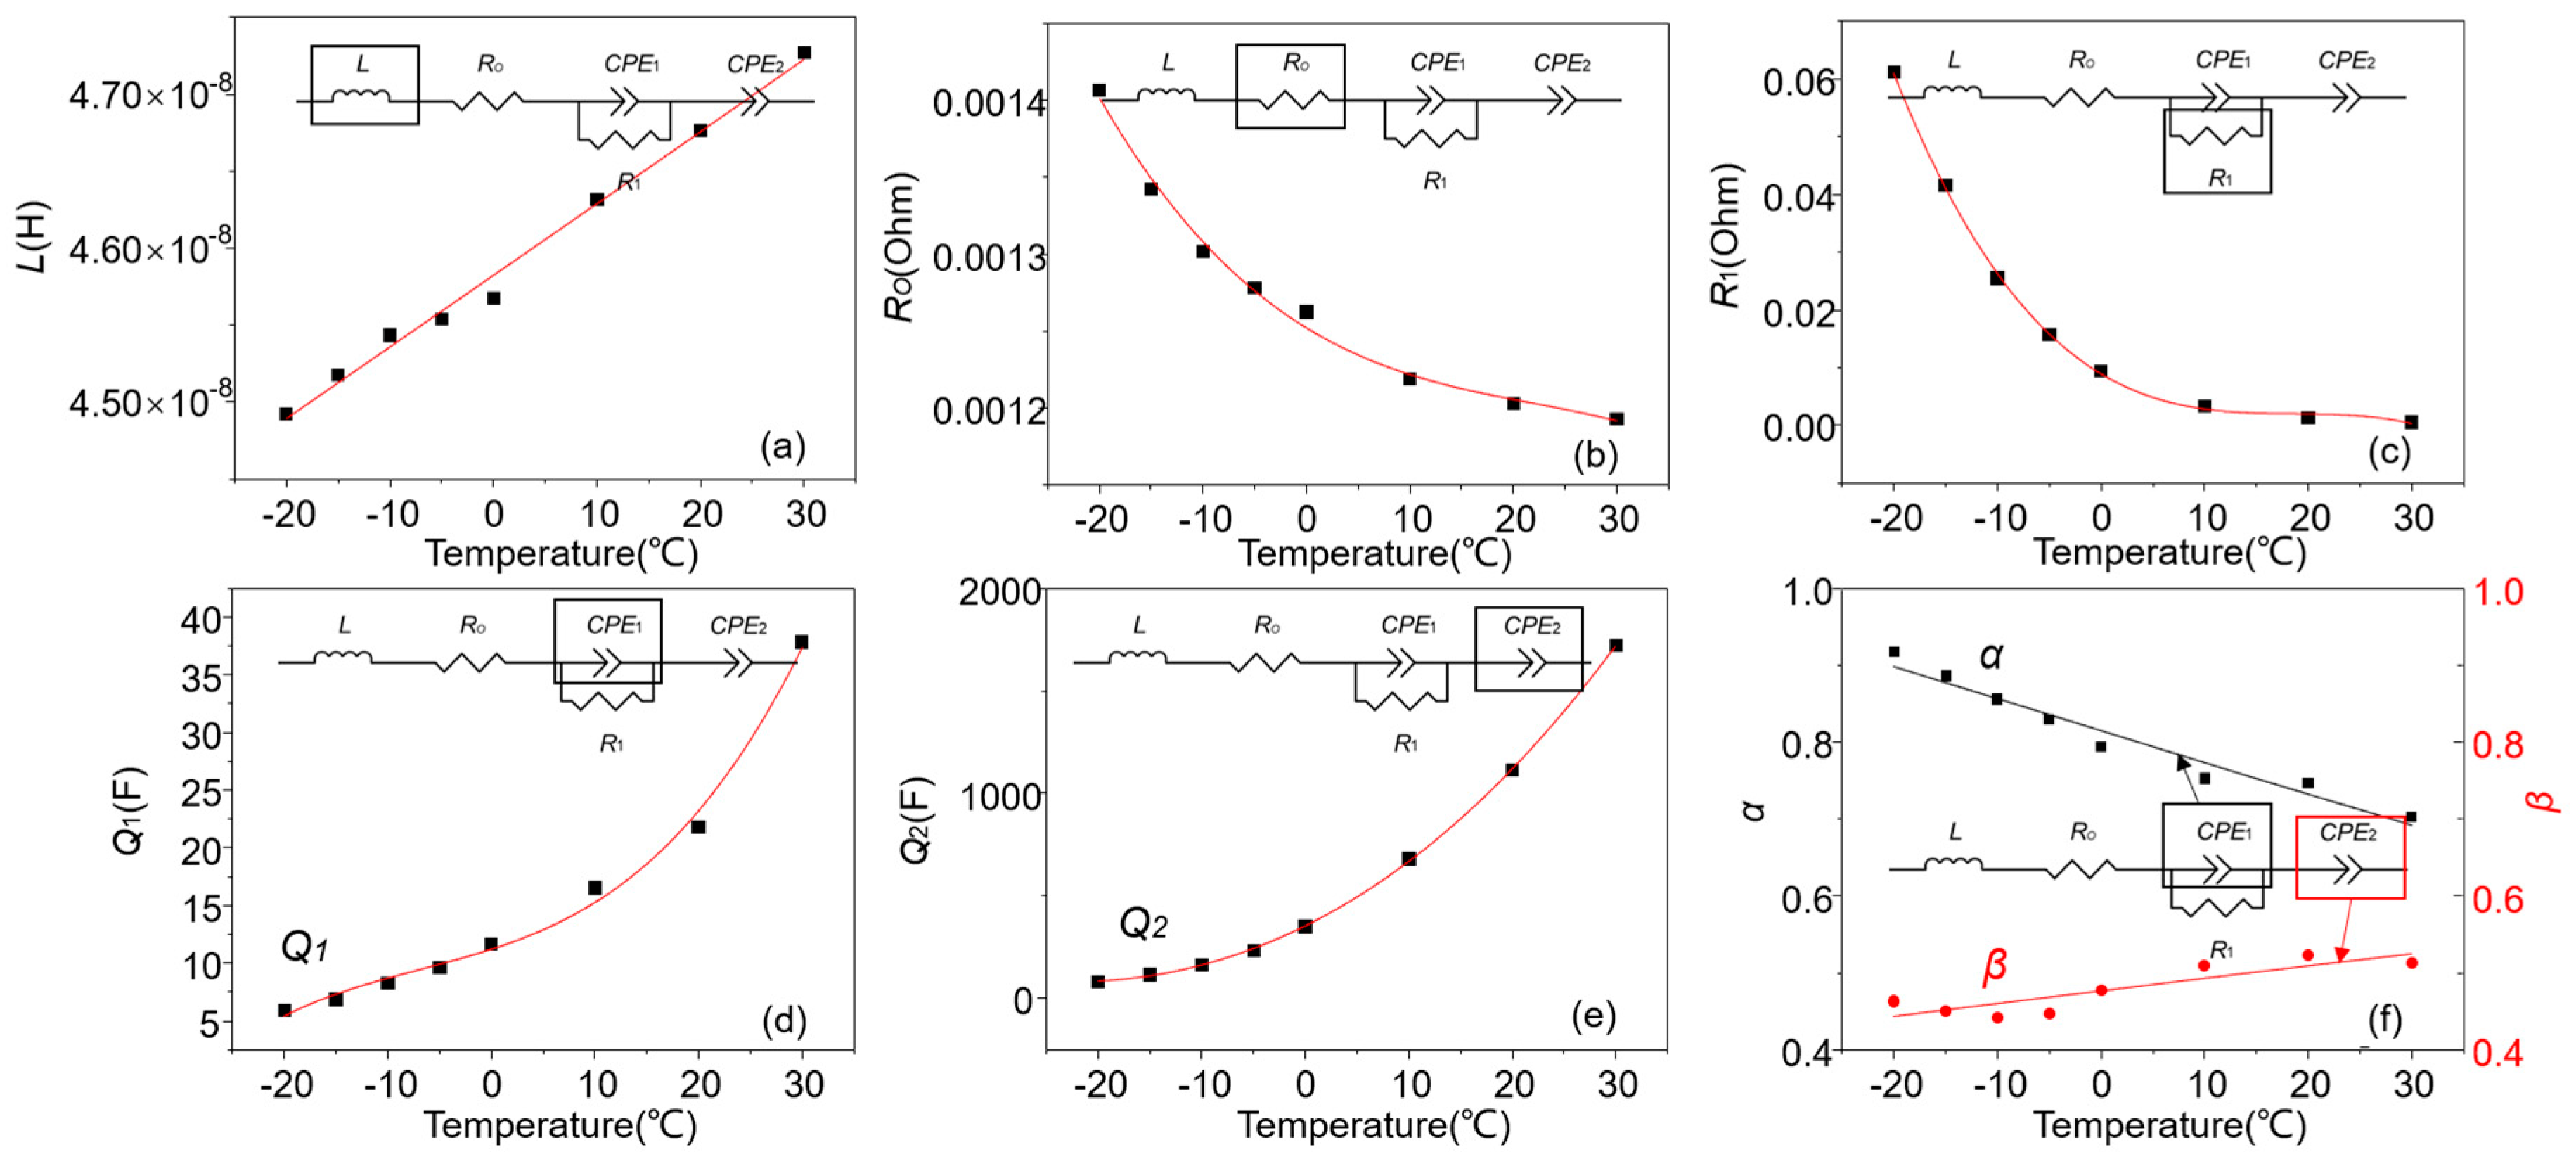
Figure 16 shows the fitting parameters of the battery model, and Ro and R1 decrease exponentially with temperature increase, while Q1, and Q2 increase exponentially when the temperature increases.
We employ a polynomial fit to get the relationship between the battery impedance model parameters and temperature, and the formula can be listed as:
where t is the temperature in centigrade, and L, Ro, R1, Q1, Q2, α and β are the model parameters.
The above work has enabled the relationship between the battery impedance model parameters and the temperature to be obtained, and the relationship will be used in the battery discretization model.
4.4. Verification of Battery Impedance Model Considering the Temperature Gradient
In most cases, the battery’s surface temperature or average temperature is used to modify the battery’s impedance. However, the above analysis makes it obvious that the internal temperature gradient has a great influence on battery impedance. Figure 17 shows the comparison of the experimental results and lumped model impedance modified by the surface temperature. The parameters of the lumped model are obtained according to Equation (5) and battery surface temperature. Plainly, there are large deviations between the experimental results and the lumped model impedance modified by the surface temperature, no matter what the maximum surface or minimum surface temperatures are.
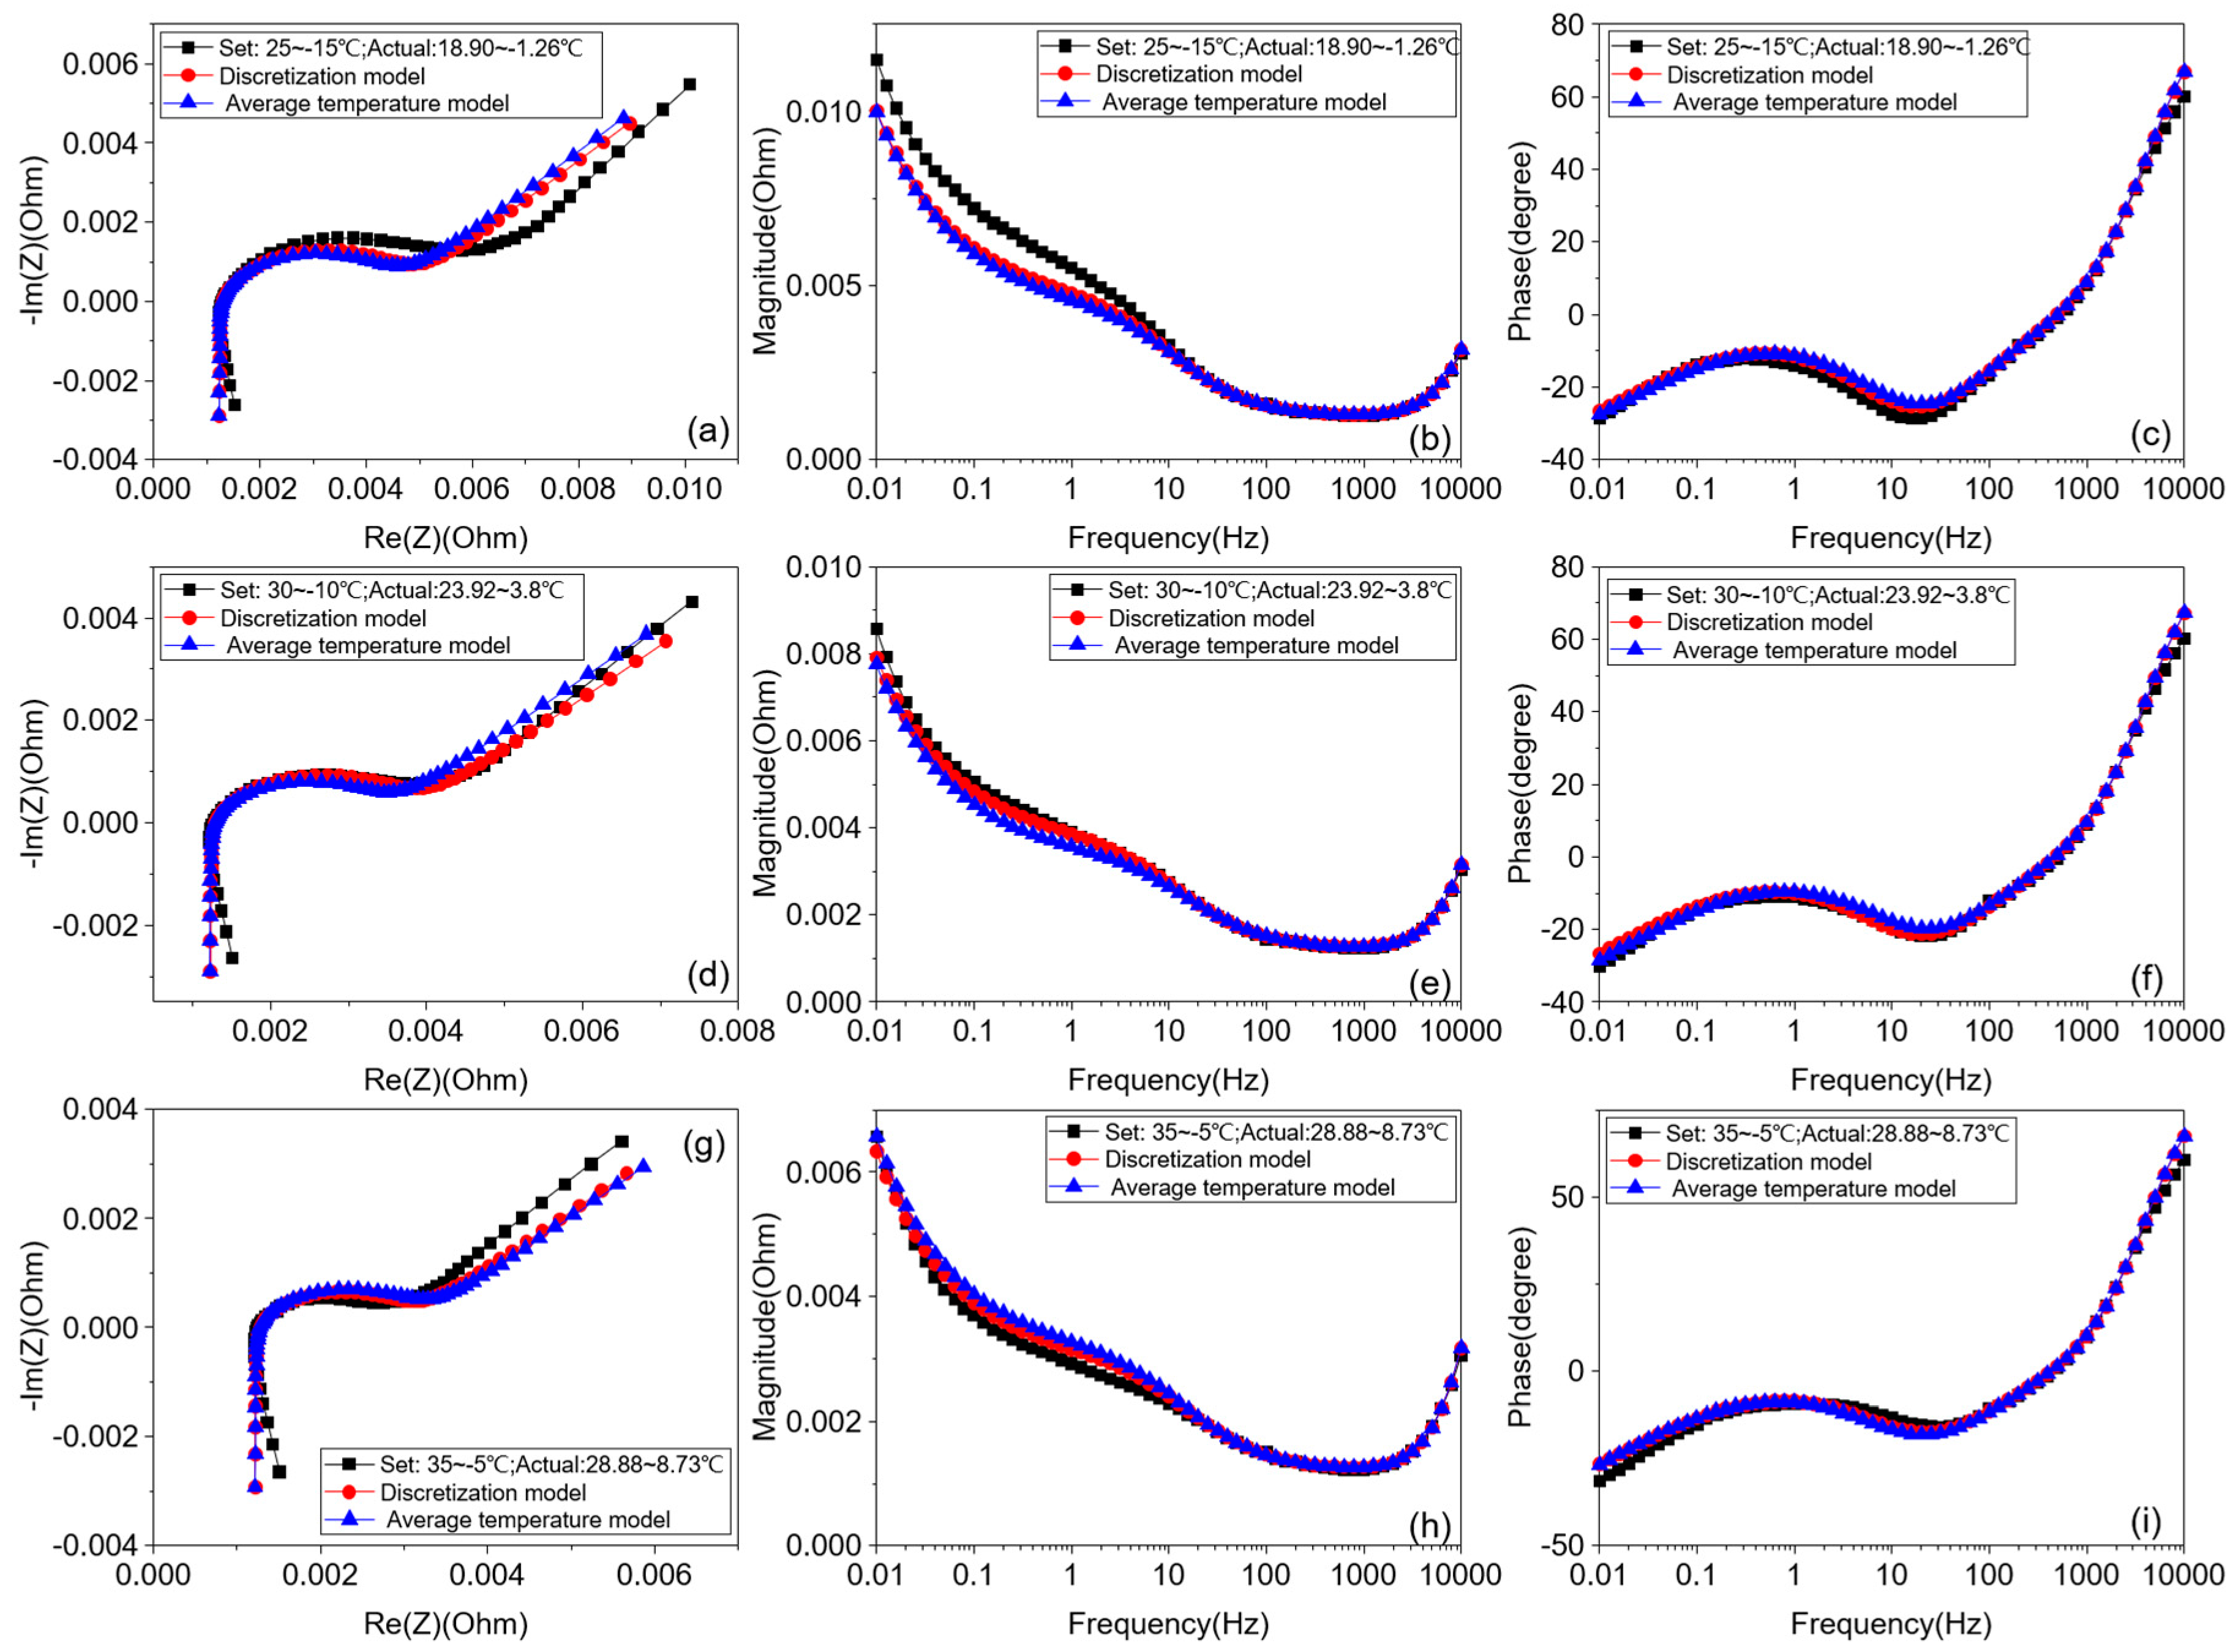
According to the discretization model shown in Equation (4) and the relationship between the impedance model parameters and temperature in Equation (5), the impedance of a battery with artificial temperature gradients can be obtained. Three experiments with a higher temperature gradient (the actual temperature difference between battery surfaces is greater than 20 °C) are chosen to verify the battery discretization model. Figure 18 shows the verification of the battery discretization model. The discretization model considering the temperature gradient and the lumped model considering only the average temperature are also compared.
Overall, the proposed battery discretization model is closer to the actual experimental data than the lumped model. From Figure 18b,e,h, we can see that both the proposed model and the lumped model deviate from the actual experimental data from 0.01 Hz to 10 Hz. This may be because that the relationship between temperature and the fractional order of CPE1 and CPE2 may not be linear. From Figure 18c,f,i, in most cases, the proposed model’s impedance phase is closer to the experimental data, which proves the accuracy of the proposed model.
Figure 19 shows the errors of the discretization model and the lumped model. Obviously, the magnitude error of the discretization model is smaller in the whole frequency range, while the phase errors in Figure 19d–f show that the lumped model performs a little better than the discretization model in the low-frequency region. Apparently, the lower the temperature, the greater the magnitude error. In Figure 19a–c, the experiment with the lower average temperature has a greater error in the low frequency range. In the high-frequency region, the relationship between the phase error and the frequency is approximately linear and independent of temperature. This may be due to the battery impedance model’s inherent defect that a single inductor may not represent the real characterization of battery impedance in the high-frequency region. In the whole frequency range, the maximum impedance magnitude error of the battery discretization model is 1.46 mOhm, and the maximum impedance phase error is 6.96°.
Table 3 compares the statistical data of the discretization model and the average temperature model. Obviously, the accuracy of the discretization model is higher, especially the impedance magnitude of the proposed model. Among the three experiments with different temperature gradients, the root mean squared error (RMSE) of the proposed model is at least 15% smaller than that of the average temperature model. For the model impedance phase, the proposed model is slightly superior.
Through the above analysis, the performance of the proposed model is proved to be accurate and effective. Compared with the lumped model with the average temperature, the proposed model is identical to the actual battery impedance. With the help of the discretization model, we can obtain a more accurate characterization of the battery.
4.5. Limitations and Future Work
In the proposed discretization model, the temperature distribution in the direction parallel to the battery taps is ignored. In fact, the temperature distribution is inhomogeneous in this direction. The temperature of the part close to the battery taps is higher. Moreover, this model may not be suitable for cylindrical-type batteries because the volume of inner and outer layers is different and the calculation of each layer impedance will become complex.
The proposed discretization model is based on the battery non-linear impedance model. It is worth noting that this model is generic for batteries with similar characterizations like the impedance spectroscopy shown in Figure 1. For other lithium-ion batteries with different battery chemistries, the battery non-linear impedance model may be different and should be determined first. In that case, the discretization method can be applied to batteries with various chemical materials. Verification of the adaptability of this discretization method to other battery chemistries shall be conducted in future work.
Considering the thickness of the battery used in this paper, the temperature distribution is assumed to be linear. Unlike the artificial temperature gradient in this paper, the core and surface temperatures will construct the temperature gradient in actual applications of batteries. Future work will focus on the temperature distribution of the battery with a larger size. Based on an electrothermal model, the core temperature will be estimated online, and then the model parameters will be modified according to the proposed discretization model. The modified model parameters will eventually improve the precision of the battery electrothermal model.
5. Conclusions
This paper proposed a battery discretization model and designed some experiments to investigate the impedance characterization of a battery with internal temperature gradients. Some conclusions and summations are drawn below:
- (1)
- Temperature has a more significant impact on battery impedance than SOC. In the low-frequency region, the temperature gradient will influence the impedance magnitude, and in the middle-frequency region, the temperature gradient will influence the impedance phase. For batteries with the same maximum temperature, battery impedance will increase as the temperature gradient gets greater, especially in the low-frequency region.
- (2)
- The temperature distribution inside the battery can be approximately considered to be linear, and batteries with the similar average temperature have a similar impedance characterization.
- (3)
- A discretization model was proposed to investigative the impedance of a battery with temperature gradients, and experimental results show that the model performs well. The maximum impedance magnitude error is 1.46 mOhm. Compared to the lumped model with average temperature, the impedance produced by the proposed model is identical to the actual battery impedance, and the RMSE of the proposed model is at least 15% smaller than that of the average temperature model.
Acknowledgments
This work is financially supported by the National Natural Science Foundation of China (NSFC, Grant No. 51677136) and the National Key Research and Development Program of China (Program No. 2017YFB0103105).
Author Contributions
Haifeng Dai designed the experiments and wrote the paper; Bo Jiang performed the experiments and analyzed the results; Xuezhe Wei reviewed and revised the paper. All authors read and approved the manuscript
Conflicts of Interest
The authors declare no conflict of interest.
References
- Hannan, M.A.; Lipu, M.S.H.; Hussain, A.; Mohamed, A. A review of lithium-ion battery state of charge estimation and management system in electric vehicle applications: Challenges and recommendations. Renew. Sustain. Energy Rev. 2017, 78, 834–854. [Google Scholar] [CrossRef]
- Waag, W.; Fleischer, C.; Sauer, D.U. Critical review of the methods for monitoring of lithium-ion batteries in electric and hybrid vehicles. J. Power Sources 2014, 258, 321–339. [Google Scholar] [CrossRef]
- Fotouhi, A.; Auger, D.J.; Propp, K.; Longo, S.; Wild, M. A review on electric vehicle battery modelling: From lithium-ion toward lithium–sulphur. Renew. Sustain. Energy Rev. 2016, 56, 1008–1021. [Google Scholar] [CrossRef]
- Berecibar, M.; Gandiaga, I.; Villarreal, I.; Omar, N.; Mierlo, J.V.; Bossche, P.V.D. Critical review of state of health estimation methods of Li-ion batteries for real applications. Renew. Sustain. Energy Rev. 2016, 56, 572–587. [Google Scholar] [CrossRef]
- Zou, C.; Manzie, C.; Nesic, D.; Kallapur, A.G. Multi-time-scale observer design for state-of-charge and state-of-health of a lithium-ion battery. J. Power Sources 2016, 335, 121–130. [Google Scholar] [CrossRef]
- Lu, L.; Han, X.; Li, J.; Hua, J.; Ouyang, M. A review on the key issues for lithium-ion battery management in electric vehicles. J. Power Sources 2013, 226, 272–288. [Google Scholar] [CrossRef]
- Sun, F.; Hu, X.; Yuan, Z.; Li, S. Adaptive unscented Kalman filtering for state of charge estimation of a lithium-ion battery for electric vehicles. Energy 2011, 36, 3531–3540. [Google Scholar] [CrossRef]
- Buller, S.; Thele, M.; Doncker, R.W.A.A.D.; Karden, E. Impedance-based simulation models of supercapacitors and Li-ion batteries for power electronic applications. IEEE Trans. Ind. Appl. 2005, 41, 742–747. [Google Scholar] [CrossRef]
- Xu, J.; Mi, C.C.; Cao, B.; Cao, J. A new method to estimate the state of charge of lithium-ion batteries based on the battery impedance model. J. Power Sources 2013, 233, 277–284. [Google Scholar] [CrossRef]
- Westerhoff, U.; Kroker, T.; Kurbach, K.; Kurrat, M. Electrochemical impedance spectroscopy based estimation of the state of charge of lithium-ion batteries. J. Energy Storage 2016, 8, 244–256. [Google Scholar] [CrossRef]
- Schmidt, J.P.; Arnold, S.; Loges, A.; Werner, D.; Wetzel, T.; Ivers-Tiffée, E. Measurement of the internal cell temperature via impedance: Evaluation and application of a new method. J. Power Sources 2013, 243, 110–117. [Google Scholar] [CrossRef]
- Zhu, J.; Sun, Z.; Wei, X.; Dai, H. Battery internal temperature estimation for lifepo4 battery based on impedance phase shift under operating conditions. Energies 2017, 10, 60. [Google Scholar] [CrossRef]
- Swierczynski, M.; Stroe, D.I.; Stanciu, T.; Kær, S.K. Electrothermal impedance spectroscopy as a cost-efficient method for determining thermal parameters of lithium ion batteries: Prospects, measurement methods and the state of knowledge. J. Clean. Prod. 2016, 155, 63–71. [Google Scholar] [CrossRef]
- Beelen, H.P.G.J.; Raijmakers, L.H.J.; Donkers, M.C.F.; Notten, P.H.L.; Bergveld, H.J. A comparison and accuracy analysis of impedance-based temperature estimation methods for Li-ion batteries. Appl. Energy 2016, 175, 128–140. [Google Scholar] [CrossRef] [Green Version]
- Schönleber, M.; Uhlmann, C.; Braun, P.; Weber, A.; Ivers-Tiffée, E. A consistent derivation of the impedance of a lithium-ion battery electrode and its dependency on the state-of-charge. Electrochim. Acta 2017, 243, 250–259. [Google Scholar] [CrossRef]
- Huang, Q.A.; Shen, Y.; Huang, Y.; Zhang, L.; Zhang, J. Impedance characteristics and diagnoses of automotive lithium-ion batteries at 7.5% to 93.0% state of charge. Electrochim. Acta 2016, 219, 751–765. [Google Scholar] [CrossRef]
- Jiang, J.; Lin, Z.; Ju, Q.; Ma, Z.; Zheng, C.; Wang, Z. Electrochemical impedance spectra for lithium-ion battery ageing considering the rate of discharge ability. Energy Procedia 2017, 105, 844–849. [Google Scholar] [CrossRef]
- Andre, D.; Meiler, M.; Steiner, K.; Wimmer, C.; Soczka-Guth, T.; Sauer, D.U. Characterization of high-power lithium-ion batteries by electrochemical impedance spectroscopy. I. Experimental investigation. J. Power Sources 2011, 196, 5349–5356. [Google Scholar] [CrossRef]
- Raijmakers, L.H.J.; Danilov, D.L.; Lammeren, J.P.M.V.; Lammers, M.J.G.; Notten, P.H.L. Sensorless battery temperature measurements based on electrochemical impedance spectroscopy. J. Power Sources 2014, 247, 539–544. [Google Scholar] [CrossRef]
- Xiao, M.; Choe, S.Y. Impedance model of lithium ion polymer battery considering temperature effects based on electrochemical principle: Part I for high frequency. J. Power Sources 2015, 277, 403–415. [Google Scholar] [CrossRef]
- Lin, X.; Perez, H.E.; Mohan, S.; Siegel, J.B.; Stefanopoulou, A.G.; Ding, Y.; Castanier, M.P. A lumped-parameter electro-thermal model for cylindrical batteries. J. Power Sources 2014, 257, 1–11. [Google Scholar] [CrossRef]
- Zou, C.; Hu, X.; Wei, Z.; Tang, X. Electrothermal dynamics-conscious lithium-ion battery cell-level charging management via state-monitored predictive control. Energy 2017, 141, 250–259. [Google Scholar] [CrossRef]
- Troxler, Y.; Wu, B.; Marinescu, M.; Yufit, V.; Patel, Y.; Marquis, A.J.; Brandon, N.P.; Offer, G.J. The effect of thermal gradients on the performance of lithium-ion batteries. J. Power Sources 2014, 247, 1018–1025. [Google Scholar] [CrossRef]
- Alavi, S.M.M.; Birkl, C.R.; Howey, D.A. Time-domain fitting of battery electrochemical impedance models. J. Power Sources 2015, 288, 345–352. [Google Scholar] [CrossRef]
- Deng, Z.; Zhang, Z.; Lai, Y.; Liu, J.; Li, J.; Liu, Y. Electrochemical impedance spectroscopy study of a lithium/sulfur battery: Modeling and analysis of capacity fading. J. Electrochem. Soc. 2013, 160, A553–A558. [Google Scholar] [CrossRef]
Figure 1.
Impedance spectroscopy of a battery at 50%, 0 °C.

Figure 2.
Equivalent circuit of the battery impedance model.

Figure 3.
Diagram of battery discretization: (a) continuous battery; (b) discrete battery.

Figure 4.
Diagram of battery discretization with a heating source.

Figure 5.
Flowchart of the discretization modeling of a battery.

Figure 6.
Position of the thermocouples inside the battery: (a) quarter point of the battery; (b) halfway within the battery; (c) diagram of the thermocouples inside the battery.
Figure 6.
Position of the thermocouples inside the battery: (a) quarter point of the battery; (b) halfway within the battery; (c) diagram of the thermocouples inside the battery.

Figure 7.
Experimental setup: (a) the battery cell; (b) the electrochemical workstation; (c) the power booster; (d) the temperature measurement station; (e) the environment chamber.
Figure 7.
Experimental setup: (a) the battery cell; (b) the electrochemical workstation; (c) the power booster; (d) the temperature measurement station; (e) the environment chamber.

Figure 8.
Diagram of battery electrochemical impedance spectroscopy (EIS) experiment without the temperature gradient.
Figure 8.
Diagram of battery electrochemical impedance spectroscopy (EIS) experiment without the temperature gradient.

Figure 9.
Diagram of battery EIS experiment with the temperature gradients.

Figure 10.
EIS of battery with uniform temperature: (a) 50% state of charge (SOC), different temperatures; (b) 10 °C, different SOCs.
Figure 10.
EIS of battery with uniform temperature: (a) 50% state of charge (SOC), different temperatures; (b) 10 °C, different SOCs.

Figure 11.
EIS of the battery in Bode plots with uniform temperature: (a,b) impedance magnitude and phase of battery at 50% SOC, different temperatures; (c,d) impedance magnitude and phase of battery at 10 °C, different SOCs.
Figure 11.
EIS of the battery in Bode plots with uniform temperature: (a,b) impedance magnitude and phase of battery at 50% SOC, different temperatures; (c,d) impedance magnitude and phase of battery at 10 °C, different SOCs.

Figure 12.
Temperature distribution inside battery.

Figure 13.
EIS of battery in Bode plots with different artificial temperature gradients: (a) impedance magnitude; (b) impedance phase.
Figure 13.
EIS of battery in Bode plots with different artificial temperature gradients: (a) impedance magnitude; (b) impedance phase.

Figure 14.
EIS of battery with approximate average temperature: (a,b) impedance magnitude and phase of battery with approximate 1 °C average temperature; (c,d) impedance magnitude and phase of battery with approximate 21 °C average temperature.
Figure 14.
EIS of battery with approximate average temperature: (a,b) impedance magnitude and phase of battery with approximate 1 °C average temperature; (c,d) impedance magnitude and phase of battery with approximate 21 °C average temperature.

Figure 15.
Fitting result: (a) EIS; (b) impedance magnitude; (c) impedance phase.

Figure 16.
Parameters of battery non-linear impedance model: (a) inductance L; (b) resistance Ro; (c) resistance R1; (d) fractional coefficient of CPE1, Q1; (e) fractional coefficient of CPE2, Q2; (f) fractional order of CPE1 and CPE2, α and β.
Figure 16.
Parameters of battery non-linear impedance model: (a) inductance L; (b) resistance Ro; (c) resistance R1; (d) fractional coefficient of CPE1, Q1; (e) fractional coefficient of CPE2, Q2; (f) fractional order of CPE1 and CPE2, α and β.

Figure 17.
Comparison of the experimental results and lumped model impedance modified by the surface temperature: (a) EIS; (b) impedance magnitude; (c) impedance phase.
Figure 17.
Comparison of the experimental results and lumped model impedance modified by the surface temperature: (a) EIS; (b) impedance magnitude; (c) impedance phase.

Figure 18.
Verification of battery discretization model: (a–c) EIS, impedance magnitude and phase of battery with heating plate temperature set at 25 °C and −15 °C environmental temperature; (d–f) EIS, impedance magnitude and phase of battery with heating plate temperature set at 30 °C and −10 °C environmental temperature; (g–i) EIS, impedance magnitude and phase of battery with heating plate temperature set at 35 °C and −5 °C environmental temperature.

Figure 19.
Errors of the discretization model and the lumped model: (a–c) impedance magnitude errors; (d–f) impedance phase errors.
Figure 19.
Errors of the discretization model and the lumped model: (a–c) impedance magnitude errors; (d–f) impedance phase errors.


Table 1.
EIS experiments without the temperature gradient. CC-CV: constant current-constant voltage.
Table 1.
EIS experiments without the temperature gradient. CC-CV: constant current-constant voltage.
| Step | Experiment Description |
|---|---|
| 1 | Rest the battery for 4 h at 25 °C |
| 2 | Charge the battery to 100% SOC in CC-CV mode at 25 °C |
| 3 | Rest the battery for 4 h at 30 °C |
| 4 | EIS Test |
| 5 | Set the chamber temperature to −20 °C, −15 °C, −10 °C, −5 °C, 0 °C, 10 °C and 20 °C, and rest the battery for 4 h, repeat Step 4 |
| 6 | Rest the battery for 4 h at 25 °C |
| 7 | Discharge the battery to 90% SOC, 70% SOC, 50% SOC, 30% SOC, and 10% SOC, repeat Step 3 to Step 6 |
| 8 | End |
Table 2.
EIS experiment with the temperature gradients.
| Step | Experiment Description |
|---|---|
| 1 | Rest the battery for 4 h at 25 °C |
| 2 | Charge the battery to 100% SOC in CC-CV mode at 25 °C |
| 3 | Rest the battery for 4 h at 25 °C |
| 4 | Discharge the battery to 50% SOC in 0.5 C (1 C = 40 A ) at 25 °C |
| 5 | Set the heating plate temperature to 30 °C and the chamber temperature to 20 °C |
| 6 | Rest the battery for 4 h at 25 °C |
| 7 | EIS Test |
| 8 | Change the heating plate temperature (every 5 °C), and repeat Step 6 to Step 7 |
| 9 | Set the chamber temperature to −20 °C, −15 °C, −10 °C, −5 °C, 0 °C, 10 °C and 15 °C, and rest the battery for 4 h, repeat Step 5 to Step 8 |
| 10 | End |
Table 3.
Statistical data of the discretization model and the average temperature model.
| Root Mean Squared Error (RMSE) | Magnitude Error (mOhm) | Phase Error (°) | ||
|---|---|---|---|---|
| Discretization Model | Average Temperature Model | Discretization Model | Average Temperature Model | |
| Set: 25~−15 °C | 0.67 | 0.77 | 2.20 | 2.54 |
| Set: 30~−10 °C | 0.16 | 0.32 | 1.77 | 1.84 |
| Set: 35~−5 °C | 0.15 | 0.23 | 2.22 | 2.34 |
© 2018 by the authors. Licensee MDPI, Basel, Switzerland. This article is an open access article distributed under the terms and conditions of the Creative Commons Attribution (CC BY) license (http://creativecommons.org/licenses/by/4.0/).
Share and Cite
MDPI and ACS Style
Dai, H.; Jiang, B.; Wei, X. Impedance Characterization and Modeling of Lithium-Ion Batteries Considering the Internal Temperature Gradient. Energies 2018, 11, 220. https://doi.org/10.3390/en11010220
AMA Style
Dai H, Jiang B, Wei X. Impedance Characterization and Modeling of Lithium-Ion Batteries Considering the Internal Temperature Gradient. Energies. 2018; 11(1):220. https://doi.org/10.3390/en11010220
Chicago/Turabian StyleDai, Haifeng, Bo Jiang, and Xuezhe Wei. 2018. "Impedance Characterization and Modeling of Lithium-Ion Batteries Considering the Internal Temperature Gradient" Energies 11, no. 1: 220. https://doi.org/10.3390/en11010220
Note that from the first issue of 2016, this journal uses article numbers instead of page numbers. See further details here.