Practical On-Board Measurement of Lithium Ion Battery Impedance Based on Distributed Voltage and Current Sampling


1
Clean Energy Automotive Engineering Center, Tongji University, Shanghai 201804, China
2
School of Automotive Studies, Tongji University, Shanghai 201804, China
*
Author to whom correspondence should be addressed.
Energies 2018, 11(1), 64; https://doi.org/10.3390/en11010064
Submission received: 4 December 2017
/
Revised: 25 December 2017
/
Accepted: 26 December 2017
/
Published: 1 January 2018
(This article belongs to the Special Issue 2nd Young Scholar’s Symposium on Battery Design and Management (BDM 2017))
Abstract
:Battery impedance based state estimation methods receive extensive attention due to its close relation to internal dynamic processes and the mechanism of a battery. In order to provide impedance for a battery management system (BMS), a practical on-board impedance measuring method based on distributed signal sampling is proposed and implemented. Battery cell perturbing current and its response voltage for impedance calculation are sampled separately to be compatible with BMS. A digital dual-channel orthogonal lock-in amplifier is used to calculate the impedance. With the signal synchronization, the battery impedance is obtained and compensated. And the relative impedance can also be obtained without knowing the current. For verification, an impedance measuring system made up of electronic units sampling and processing signals and a DC-AC converter generating AC perturbing current is designed. A type of 8 Ah LiFePO4 battery is chosen and the valuable frequency range for state estimations is determined with a series of experiments. The battery cells are connected in series and the impedance is measured with the prototype. It is shown that the measurement error of the impedance modulus at 0.1 Hz–500 Hz at 5 °C–35 °C is less than 4.5% and the impedance phase error is less than 3% at <10 Hz at room temperature. In addition, the relative impedance can also be tracked well with the designed system.
1. Introduction
The research and development of electric vehicles (EV), i.e., pure electric vehicles and plug-in hybrid electric vehicles, is globally supported by governments and enterprises due to the energy and environmental crises. Lithium ion batteries are proved to be suitable power storage batteries for EV applications. Many state estimation methods for the battery management are proposed. Electrochemical impedance spectroscopy (EIS) is used as a direct indicator to character battery states besides estimating states with Kalman filter [1], Particle filter [2,3] and other state observers [4,5,6] using equivalent circuit models. It is internally related to battery physical and chemical processes, i.e., the faradaic process, the non-faradaic processes including the ion transportation through the solid electrolyte interphase (SEI) and the double layer capacitance, the ion diffusion and transportation in the electrolyte and the solid particles of the electrodes, and the conduction of the electrons in the current collectors [7,8,9,10,11]. The impedance spectra can be fitted with lumped impedance models in a certain frequency range to characterize state of charge (SOC) [12,13,14,15] and state of health (SOH) [16,17,18,19,20] of lithium ion batteries and can also at single frequency point indicate battery states, e.g., average temperature [21] and SOH [22].
As the effective application of EIS in the battery state estimation, many impedance measuring methods are proposed. Single frequency sweep and wideband measuring methods are typical methods to obtain battery impedance. The former is traditional with excitation signals of different frequency one after another injected into batteries [9]. The time taken is longer than the wideband impedance measuring methods. In the wideband method, a square wave [23,24], a pseudo-random binary sequence [25,26], a chirp signal [27], or a signal during a driving cycle [28] may be applied to calculate the battery impedance with Fast Fourier transform, time-sharing Fourier transform processing the voltage and the current profiles. Considering a non-stationary excitation signal [29], wavelet transform can also be applied to calculate the battery impedance in the wideband methods. Whatever kind of impedance measuring method is adopted, linearity, causality, and stability requirements of the electrochemical system inside the battery during measurement should be satisfied. Otherwise, the measurement results could be erroneous or meaningless. DC offset, current amplitude, relaxation time after charge/discharge for the impedance measurement should be carefully considered [30]. For the less time consumed wideband methods, the excitation signals, e.g., the square wave signals or the signals during driving cycle, can desequilibrate internal processes, change SOC or temperature failing to keep linear and time invariant of the batteries. The wideband signal usually cannot make the amplitude of the harmonic signal in the wide frequency range large enough to be accurately detected. Although the single frequency sweep method is time consuming, it can be used in occasions where real-time requirements are low, e.g., SOH estimation during a battery charging process. And the method is simple and practical when impedance at only one or several frequency points needs to be measured, for it can provide sufficient power of the excitation and improve the signal-to-noise ratio satisfying the requirements during impedance measuring simultaneously. As for the time consumed by the frequency sweep method, it is insignificant for a charging process lasting for several hours.
And many system solutions for the implementation of on-board impedance measurement based on the frequency sweep method are developed. A distributed impedance measuring units mounted on the battery cell injects perturbing signals into the battery cells separately. The current and the response voltage are sampled locally to calculate the impedance [31,32]. In a centralized impedance measuring method, a high power converter perturbs the battery module. A DC-DC converter based on the Buck/Boost topology and was designed in [33]. The duty cycle of PWM (Pulse Width Modulation) signals controlling the switching devices of the converter are sinusoidally perturbed and generates a sinusoidal current with DC offset when the battery is charged. In [34] a charger based on a bidirectional DC-DC converter integrated with the impedance measuring function for a lead-acid battery was proposed. The output voltage of the charger is controlled and a frequency sweep perturbing current appears at the battery terminals. In the aforementioned works, the impedance measuring system with only one battery cell perturbed and its signal acquisition units are not fully deigned for EV applications. The voltage and current acquisition for impedance calculation is not considered to be compatible with BMS in EVs as for one electronic control unit in a regular BMS cannot directly measure battery cell current and response voltage simultaneously as they are sampled separately. In addition, the compatibility is quite necessary for the on-board battery impedance measurement to reduce cost.
In the paper, an impedance measuring system for EV applications is designed and implemented considering the practicability for batteries connected in series. The remainder of the paper is organized as follows: in Section 2, the distributed signal sampling solution and the impedance calculation method including the absolute and relative impedance is proposed. The implementation of the impedance measuring system based on the proposed method is introduced in Section 3. The impedance measurement results are shown and discussed in Section 4. Section 5 gives the conclusions.
2. Analyses and Methods
Unlike measuring the impedance of single battery cell in a laboratory, there are numbers of battery cells in a battery pack of electric vehicles. All the voltage of the battery cells and the excitation current should be sampled to calculate the batteries’ impedance. In this paper, we only consider the battery pack with the battery cells connected in series. The excitation current of each battery cell is identical and measured by the central electronic control unit (CECU). And the response voltage of the battery cells is measured by the local electronic control units (LECUs) in the battery modules. And the ECUs are connected with CAN bus. The multifunctional signal acquisition units sample the battery voltage and the current with low frequency, e.g., 10 Hz, to monitor and estimate battery state and high frequency up to dozens of kilohertz to track and calculate the impedance. As the current and the voltage signals are sampled in different units, signal synchronization is necessary before the battery impedance is calculated.
2.1. Signal Synchronization
The simple idea is that the time stamp should be recorded for synchronization when the signals are sampled in different units. However, there is no global clock in the CAN network and the offset Toffset between the respective clock of the master node CECU and the slave node LECUs always exists. The clock offset should be measured and eliminated to synchronize signals. In the paper, a synchronization method is applied. Before the impedance measurement, a synchronization message is sent from CECU to LECU first. The sent time T1 of the message is recorded by CECU and transmitted to LECU in the follow-up message. The signal is delayed for Tdelay when transmitted from one node to another. LECU records the received time T2 of the synchronization message sent from CECU. Then, LECU sends a delay-request message to CECU and records the sent time T3. CECU records the received time T4 and sends a delay-response message containing T4 to LECU. The synchronization process is shown in Figure 1. The clock offset Toffset can be calculated with the relationship:
T1 − Toffset + Tdelay = T2,
T3 + Toffset + Tdelay = T4.
T3 + Toffset + Tdelay = T4.
During the impedance measuring process, the current and the voltage with the frequency of f0 are sampled at a fixed frequency fs. The first sample point is stamped with the local clock, i.e., TLECU and TCECU. Therefore, the sampling time of each sampling point is determined with fs, TLECU, and TCECU. After the signal measurement completion, the current signal is transmitted from the CECU to the LECU as mentioned before. The phase difference between the voltage and the current resulting from the non-synchronized clock is:
Δφnonsync = 2πf0(TLECU + Toffset − TCECU).
2.2. Impedance Calculation and Correction
As the impedance of the battery cell is quite small and the response voltage during the impedance measurement is around 10 mV, a method to improve the signal-to-noise ratio is needed to detect the weak response signal for the impedance calculation. In the paper, a digital lock-in amplifier (DLIA) based on the cross correlation method is introduced.
The signal to be measured with the noise is expressed as:
where UU and f0 is the amplitude and the frequency of the sinusoidal response signal to be measured, φU is the phase shift of the signal U0(t) compared to the reference signal, and n(t) is the noise signal independent of the measured signal U0(t). We obtain the sampled signal U(k) as Equation (4) at the signal sampling frequency fs = Nf0 (N ≥ 3):
U(t) = U0(t) + n(t) = UUcos(2πf0t + φU) + n(t),
U(k) = UUcos(2πk/N + φU) + n(k).
The basis of cross-correlation detection method is to use a reference signal with the same frequency of the signal to be measured. The reference signal is sampled or generated as:
yc(k) = cos(2πk/N).
For a sampled signal segment containing m signal periods, the total number of the sample points is expressed as M = mN. Since the noise signal is irrelevant to the sinusoidal reference signal, the cross correlation between the noise signal and the reference signal is zero. Thus the cross correlation between the sampled signal and the reference signal is:
It is can be seen that the amplitude of the signal to be measured can be confirmed once the phase shift φU and the cross-correlation result RUyc is calculated. However, the phase shift φU is not feasible to obtain. In order to overcome the shortcoming, an orthogonal reference signal is applied in addition to the original in-phase reference signal. The sampled orthogonal reference signal is:
and the cross correlation between the signal to be measured and the orthogonal reference signal is:
ys(k) = sin(2πk)/N.
Combining Equations (6) and (8), we obtain the amplitude and the phase shift of the signal relative to the reference signals as:
Similarly, we obtain the current amplitude UI and phase shift φI. The battery impedance is calculated with:
|Z| = UU/UI,
φ’ = φU − φI.
Considering the clock offset Toffset between CECU and LECU, the phase of the battery impedance can be compensated with:
φ = φ’ − Δφnonsync
2.3. Relative Impedance Calculation
The relative impedance between different battery cells can describe the battery impedance inconsistency. Thus, it shows the inconsistency of the battery state, e.g., temperature, SOC, and SOH. In the battery pack with the battery cells connected in series, the current of each battery cell is identical. The relative impedance between different battery cells is reflected in the difference of the response voltage. In other words, the relative impedance can be obtained without measuring the excitation current. The relative impedance modulus (RIM) is expressed as the ratio of the impedance modulus of different battery cells or the ratio of the different battery response voltage. And the relative impedance phase (RIP) is defined as the difference of the phase shift of the battery response voltage. For a battery module with n battery cells connected in series, the relative impedance between different battery cells is expressed as:
3. Implementation
To implement the proposed impedance measuring method, a prismatic LiFePO4 battery with a nominal capacity of 8 Ah is used. The battery cells are connected in series to act as a battery module. And the impedance measuring requirements for the purpose of accurate and valuable impedance measurement is put forward with a series of experiments. And a battery impedance measuring system is designed. A LECU is used to sample the cells’ voltage and a CECU samples the excitation current injected into the battery module. And a DC-AC converter is also designed to generate the AC current with specific amplitude and frequency.
3.1. Impedance Measuring Requirements
3.1.1. AC Perturbing Current Amplitude Determination
AC perturbing current amplitude should be determined to make the impedance measurement accurate and repeatable. To quantify the effect of AC current amplitude, a linear test Kramers-Kronig (K-K) fit is applied on the impedance spectroscopy measured with different AC perturbing current amplitude at different temperature and SOC. A smaller goodness of K-K fit indicates a less nonlinear impedance measuring result [35] and the current is optimized. The battery electrochemical impedance in the frequency range of 0.01 Hz–10 kHz is measured with an electrochemical workstation (Solartron 1287/1255B, Solartron Mobrey, Durham, UK) equipped with a PBi250-10 power booster (Toyo Corporation, Tokyo, Japan).
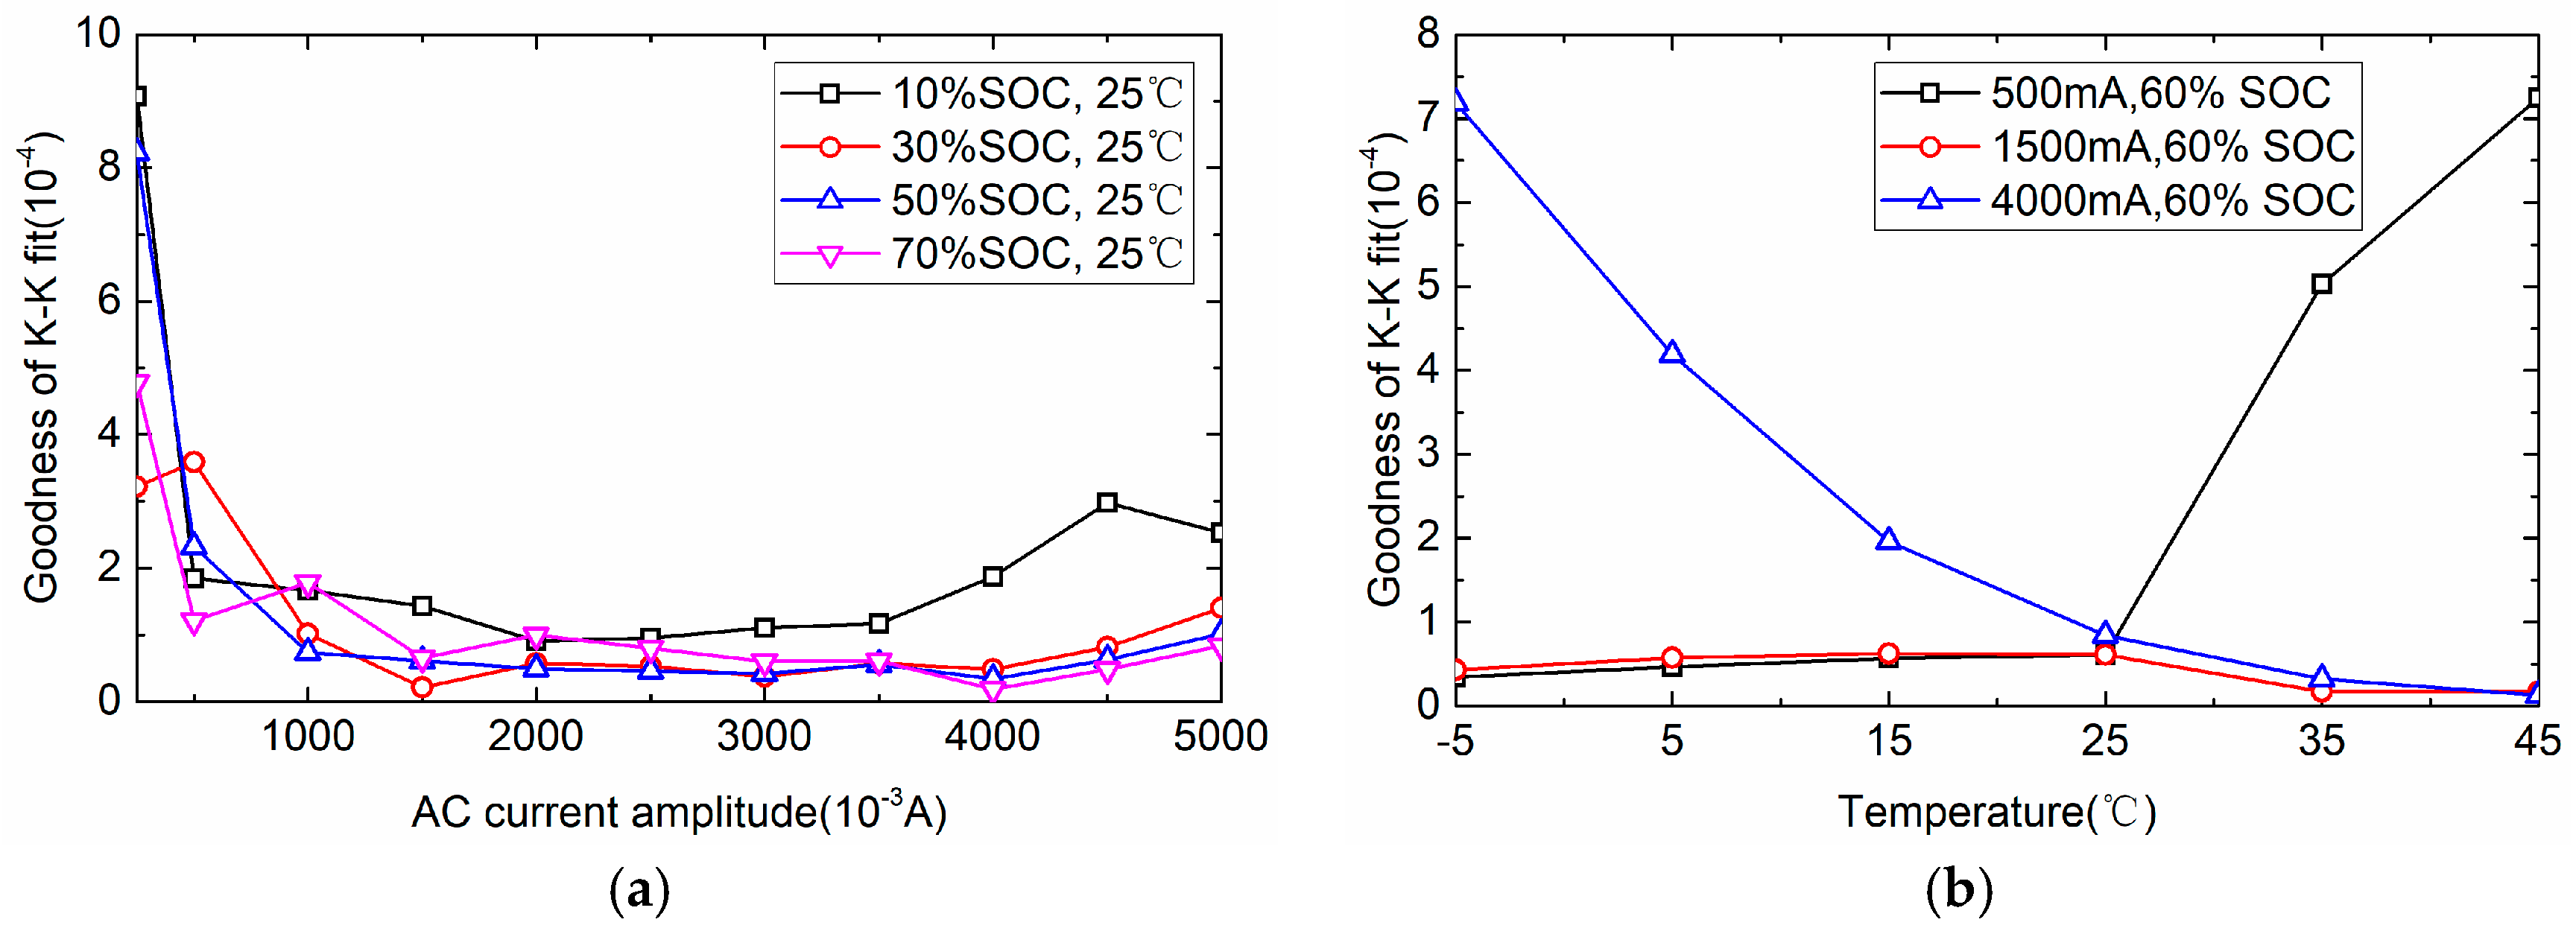
As is shown in Figure 2a, the goodness of K-K fit results for the impedance measured with different AC current amplitude from 1000 mA to 4000 mA are nearly not affected by SOC. In the current range, the goodness of K-K fit is no bigger than 2 × 10⁻⁴, however, the AC current amplitude of 500 mA and 4000 mA leads to poorer goodness of K-K fit at higher and low temperature, respectively, in Figure 2b. It is noted that the reason lies in the fact the trends of the curves are not the same. Since the battery impedance decreases as the temperature rises, a small AC current amplitude will obtain response voltage with poor signal-to-noise ratio resulting in a less accurate impedance measuring result. More nonlinear properties of the battery appear when the impedance is measured with bigger AC current amplitude as the temperature falls. For convenience, we finally apply the AC current with the amplitude of 1500 mA to measure the battery impedance as it can ensure an acceptable goodness of K-K fit in a wide temperature and SOC range.
3.1.2. Valuable Frequency Range Determination
With the amplitude of 1500 mA, a rest of 1.5 h is also needed to avoid the impact of historical conditions on the impedance of the battery after SOC or temperature changes. To determine the valuable frequency range from the impedance spectroscopy as SOC, temperature and aging state changes, a series of EIS experiments are performed. The test profile is shown as below:
- Charge the battery to 3.7 V with a constant current of 8 A at 45 °C,
- Rest for 30 min at 45 °C,
- Discharge the battery to 2.5 V with a constant current of 16 A at 45 °C,
- Repeat Step (1) to (3) for 100 cycles,
- Measure EIS at different temperature at different SOC,
- Repeat Step (1) to (5) for six times.
Figure 3 shows the battery impedance spectra at different states. The changing temperature has a significant effect on the electrochemical reaction rate and the ion diffusion process [36] leading to an obvious change to the impedance spectra as is shown in Figure 3a. The arcs of the spectra are enlarged as the temperature falls down. SOC has an insignificant effect on the impedance spectra, especially in the high frequency range. A second arc with much bigger radius appears when SOC decreases from 90% to 10% in Figure 3b. The ohmic resistance of the battery, corresponding to the intersection on the real axis, moves a little as the temperature and SOC changes. However, the aging process has mainly increased the ohmic resistance of the battery and the impedance spectra shift rightwards with little shape deformation as is shown in Figure 3c.
In order to determine the valuable frequency range as the battery state changes, the Bode plots are shown in Figure 4 corresponding to the electrochemical spectra in Figure 3. It is indicated that the impedance modulus in the low frequency range varies with the temperature, SOC and the aging state in Figure 4a–e obviously. To estimate the state with the impedance, the low frequency impedance may be measured. However, it will take much time to measure the low frequency impedance without more information as the spectrum section in the low frequency range is almost a straight line. On the other hand, the impedance in a very high frequency range becomes inductive, which does not match the characteristics of the battery. To cover the change of the ohmic resistance, the frequency, here 500 Hz, when the spectrum crosses the real axis is selected as the maximum frequency. And the valuable frequency range for the 8 Ah LiFePO4 battery is finally focused to 0.1 Hz to 500 Hz.
3.2. Impedance Measuring Method Implementation
The experimental system is shown in Figure 5. A battery module with six battery cells connected in series are used. The voltage of the battery module is 15 V~22.2 V with the corresponding voltage from 0% SOC to 100% SOC. A designed DC-AC converter based on full bridge injects the sinusoidal current into the battery module. The current is measured by the CECU and the response voltage is measured by the LECU. Then the sampled excitation current is transmitted from the CECU to LECU via CAN bus. And the impedance of the battery cells is calculated in the LECU.
In the signal acquisition units, differential amplifiers (Texas Instruments, Dallas, TX, USA) are used to measure the voltage of the battery cells satisfying the high common voltage in the application. The output of the amplifiers is connected to a bipolar eight-channel Analog-to-Digital (AD) converter with 18 bits resolution, AD7608 (Analog Devices, Norwood, MA, USA). The results of the AD converter are measured by a digital signal processor, TMS320F2812 (Texas Instruments, Dallas, TX, USA). The LECU is powered by the battery module with six battery cells connected in series. In the CECU, the excitation current is measured with 0.01 Ω shunt (Yunkai Microelectronics, Shenzhen, China). The main circuits of the LECU and CECU are shown in Figure 6.
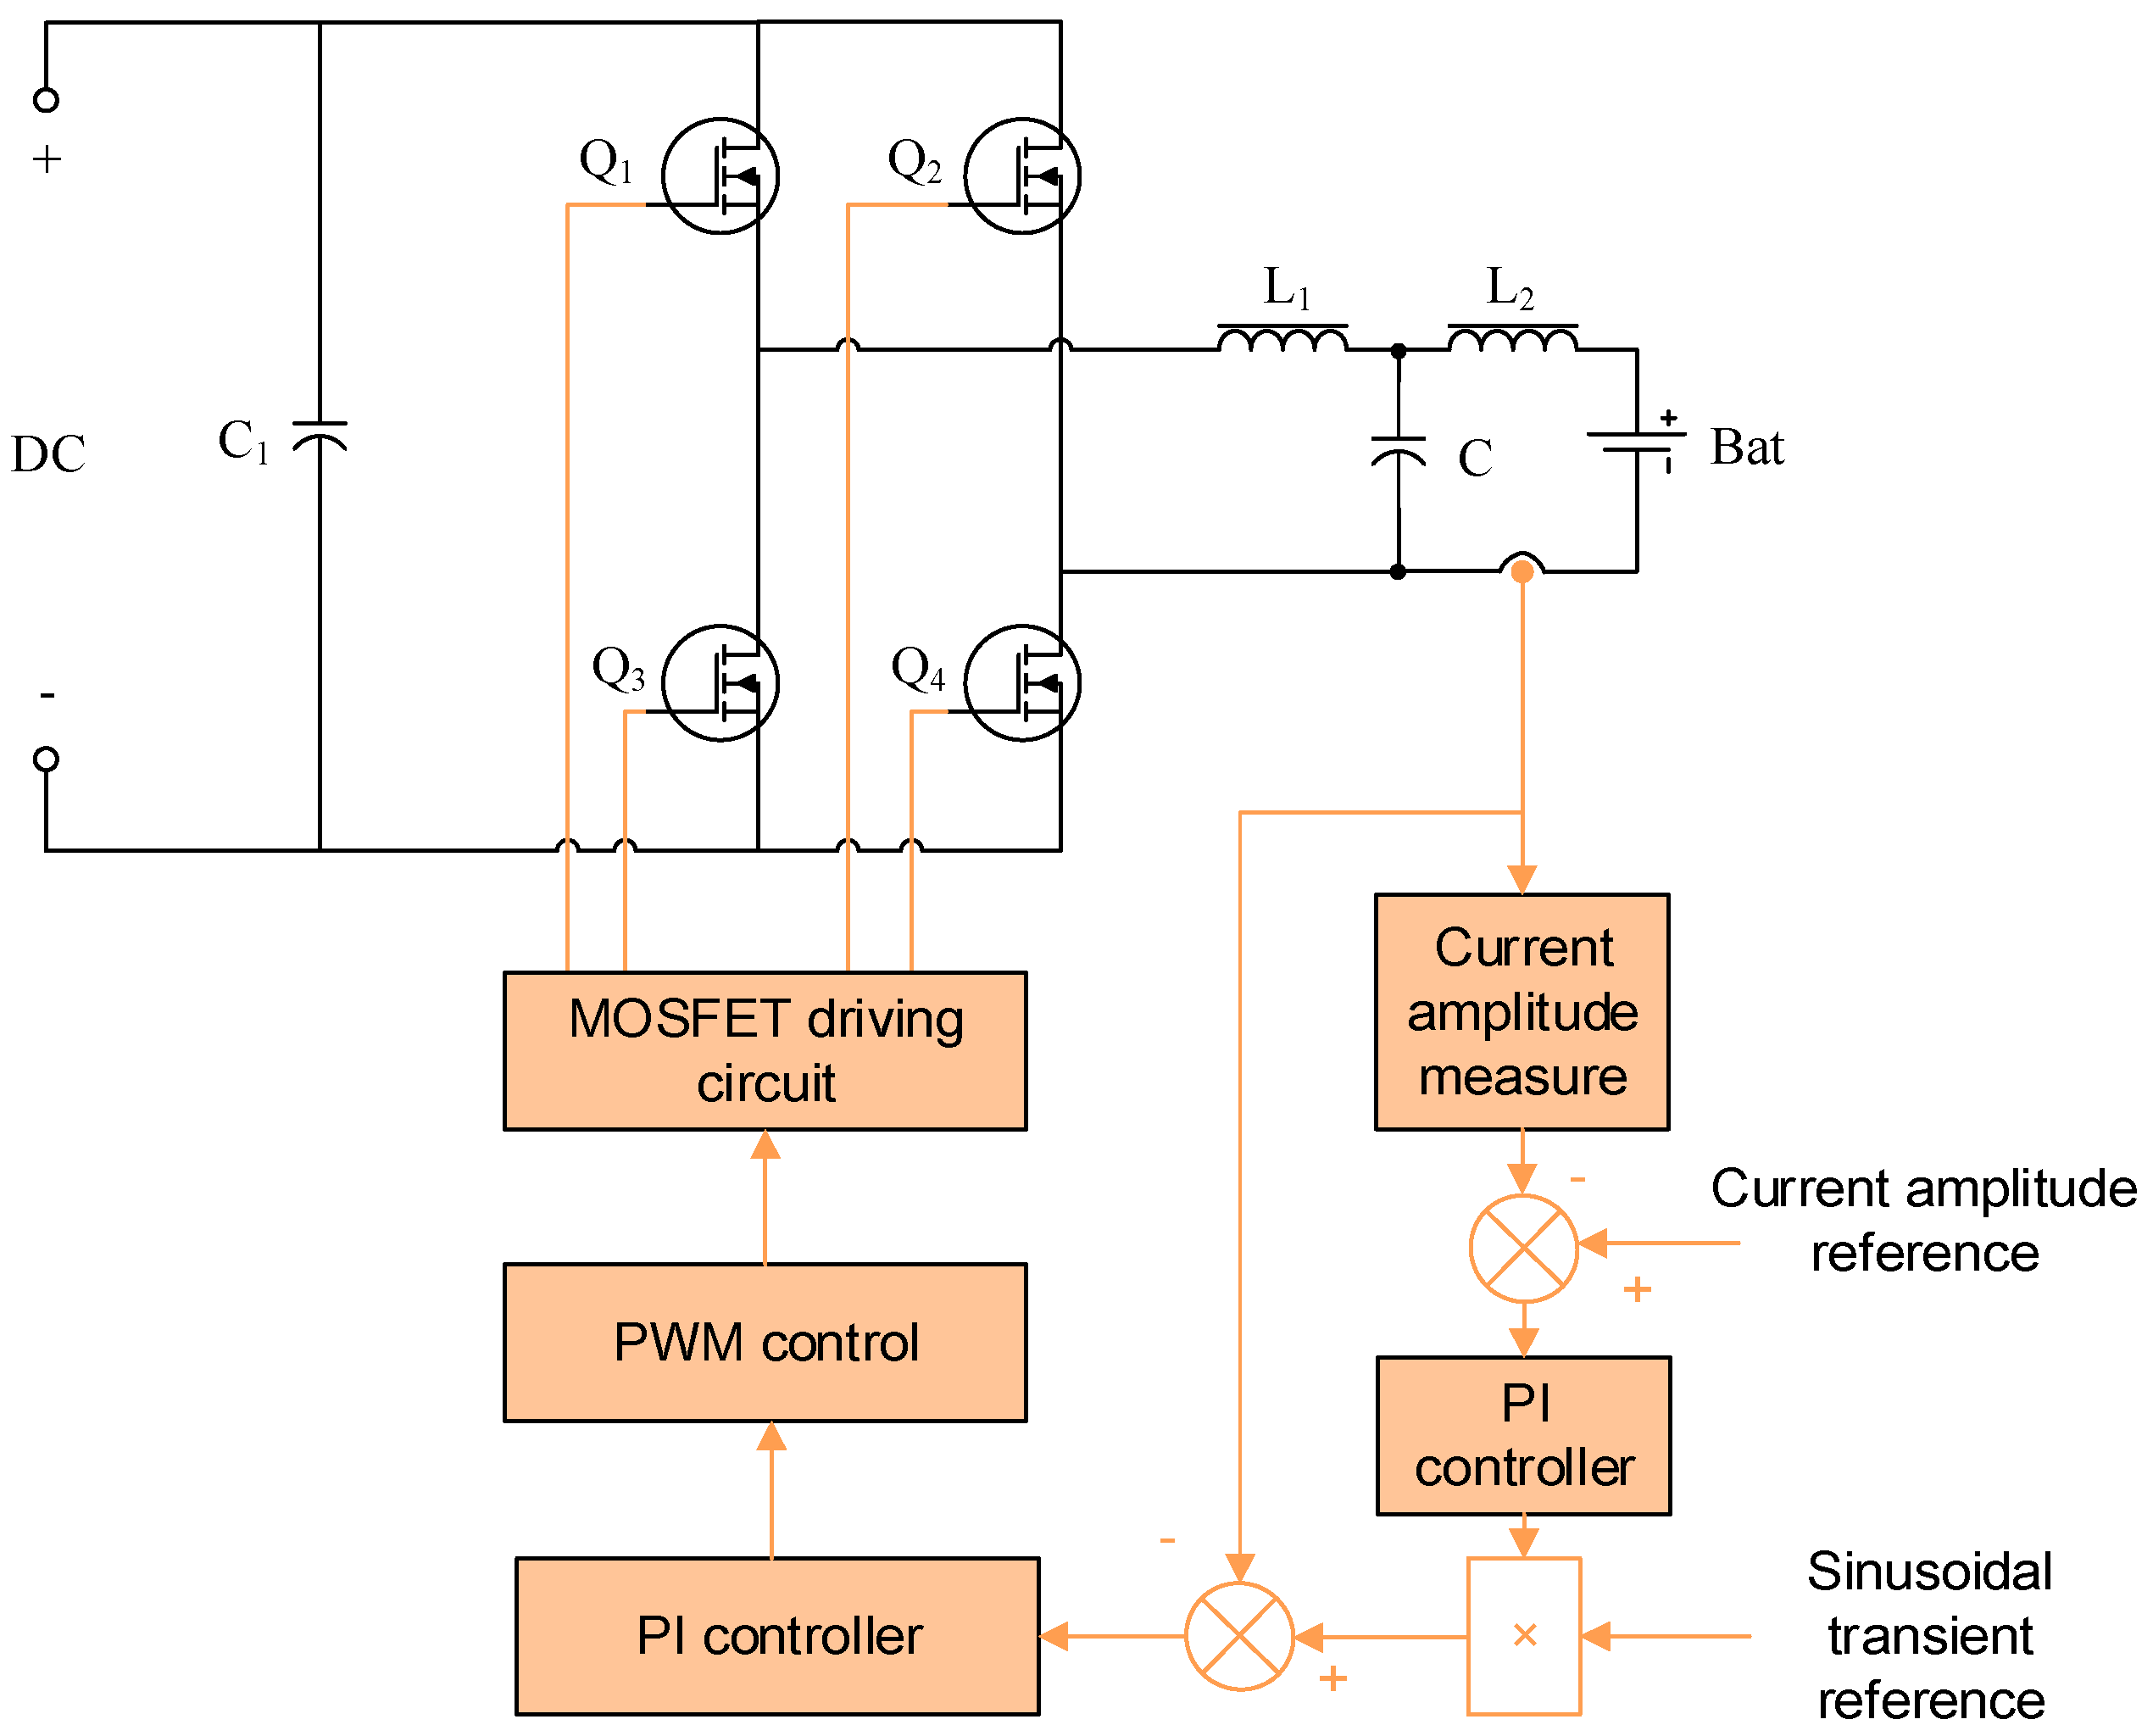
For the DC-AC converter, a designed LCL low pass filter is used to filter out the harmonic in the output of the full bridge composed of Q1, Q2, Q3 and Q4. Considering the 1500 mA excitation current, Metal-oxide-semiconductor field effect transistors (MOSFETs, (Infineon, Neubiberg, Germany)) are chosen as the power switches. A Proportional-Integral (PI) controller called the amplitude controller controls the current amplitude. The current amplitude is multiplied with the given sinusoidal instantaneous value. Then the modified sinusoidal instantaneous value is compared with the instantaneous output current. Another PI controller called the waveform controller integrates the comparing error and generate the duty cycle of four PWM signals driving the MOSFETs. Then, the output current of the DC-AC converter is controlled as the given sinusoidal reference with a specific amplitude. The compound control method in Figure 7 controls the DC-AC converter to generate AC current from 0.1 Hz to 500 Hz with the amplitude of 1500 mA.
4. Results and Discussions
In order to analyze the measuring error of the designed impedance measuring prototype, the impedance of the battery cells in the battery module at the frequency of 500, 400, 250, 200, 125, 100, 80, 50, 40, 20, 10, 5, 2, 1, 0.5 and 0.1 Hz is measured with the electrochemical workstation, which is treated as the real impedance of the battery cells. Then the impedance at the frequency points is measured respectively with the designed on-board impedance measuring system. The experiments and the measurement are performed at room temperature (about 25 °C) if it is not specified.
4.1. Effect of Sampling Frequency
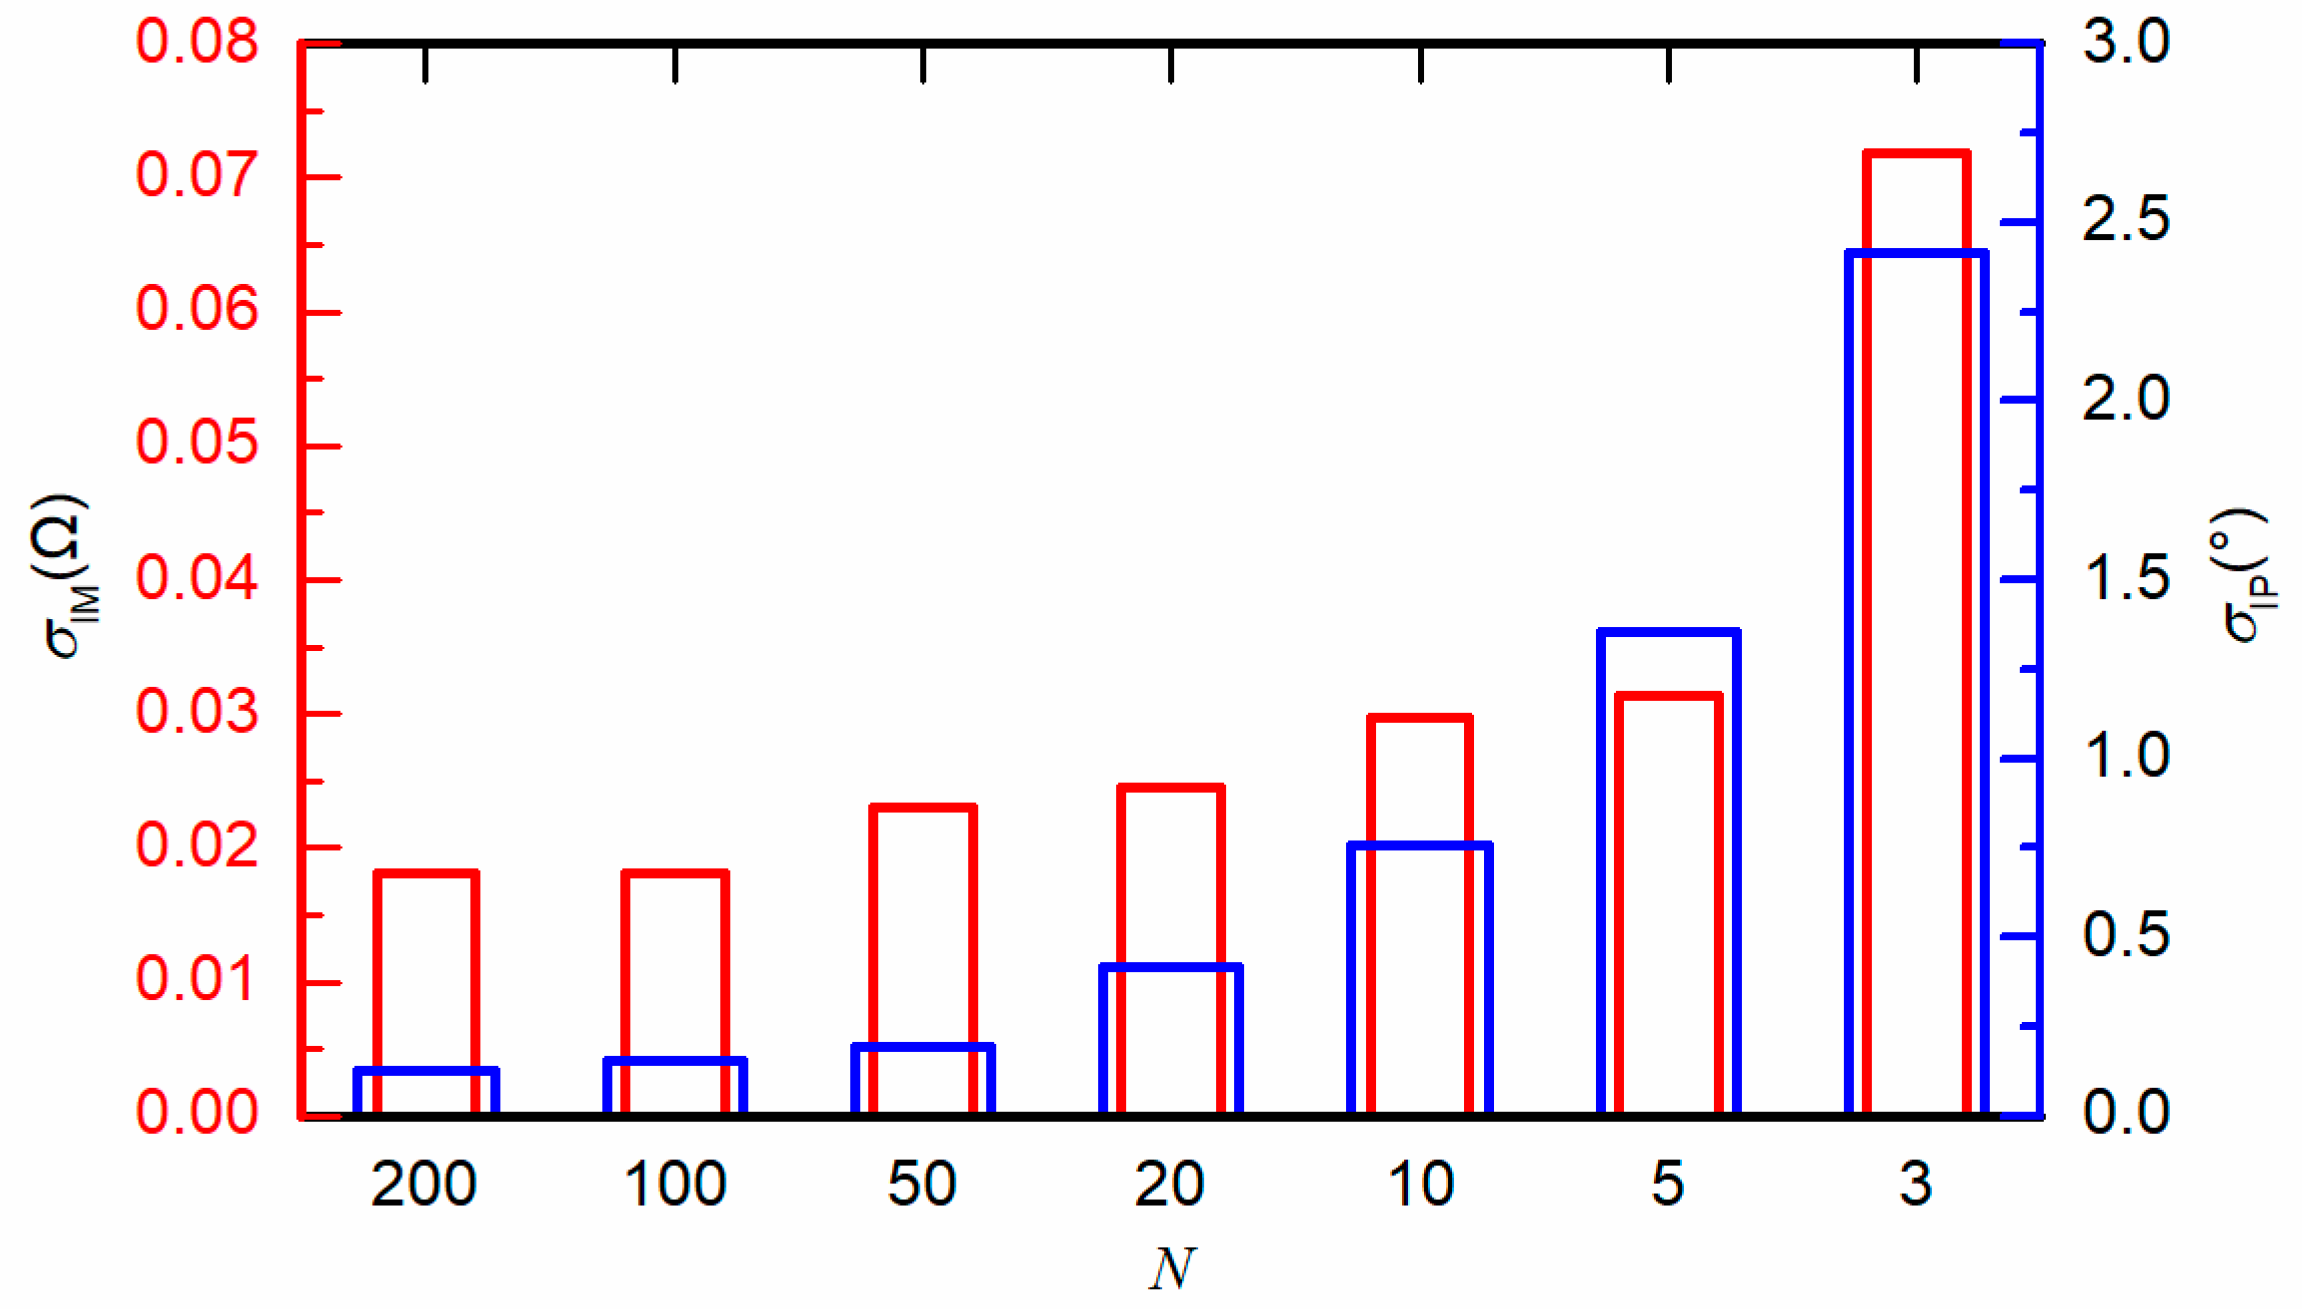
In the proposed on-board impedance measuring system, an AD converter is used to sample the response voltage of the battery cells under the excitation current. In order to study the effect of the sampling frequency on the impedance measurement accuracy, the impedance measurement is performed at different N. The measurement results of the 200 Hz excitation signal at different sampling frequency are shown in Figure 8. It is indicated that a bigger N can obtain a more accurate and stable measurement result as the standard derivation becomes smaller. The sampling frequency ratio has less effect on the impedance modulus compared to the effect on the impedance phase. N has a stronger effect on the impedance phase when N < 50. Taking into account the sampling error and the difficulty of system implementation, we adopt N = 100 in the following impedance measurement. Correspondingly, the sampling frequency of the system also varies with the frequency of the signal being measured from 10 Hz to 50 kHz. The authors have reviewed the existing monitoring chip. The conventional voltage sampling method is based on multi-cell battery monitors. And the existing solution is aimed to monitor the battery cell voltage and protect the battery cell from over charge or over discharge. The voltage sampling rate for the protection is not fast enough to satisfy the impedance calculation. Besides, the accuracy is also not enough because the battery monitor need not so much high accuracy at all. Therefore, the high sampling frequency and high accuracy put forward new requirements for the battery monitoring chips.
4.2. Measurement of Battery Impedance
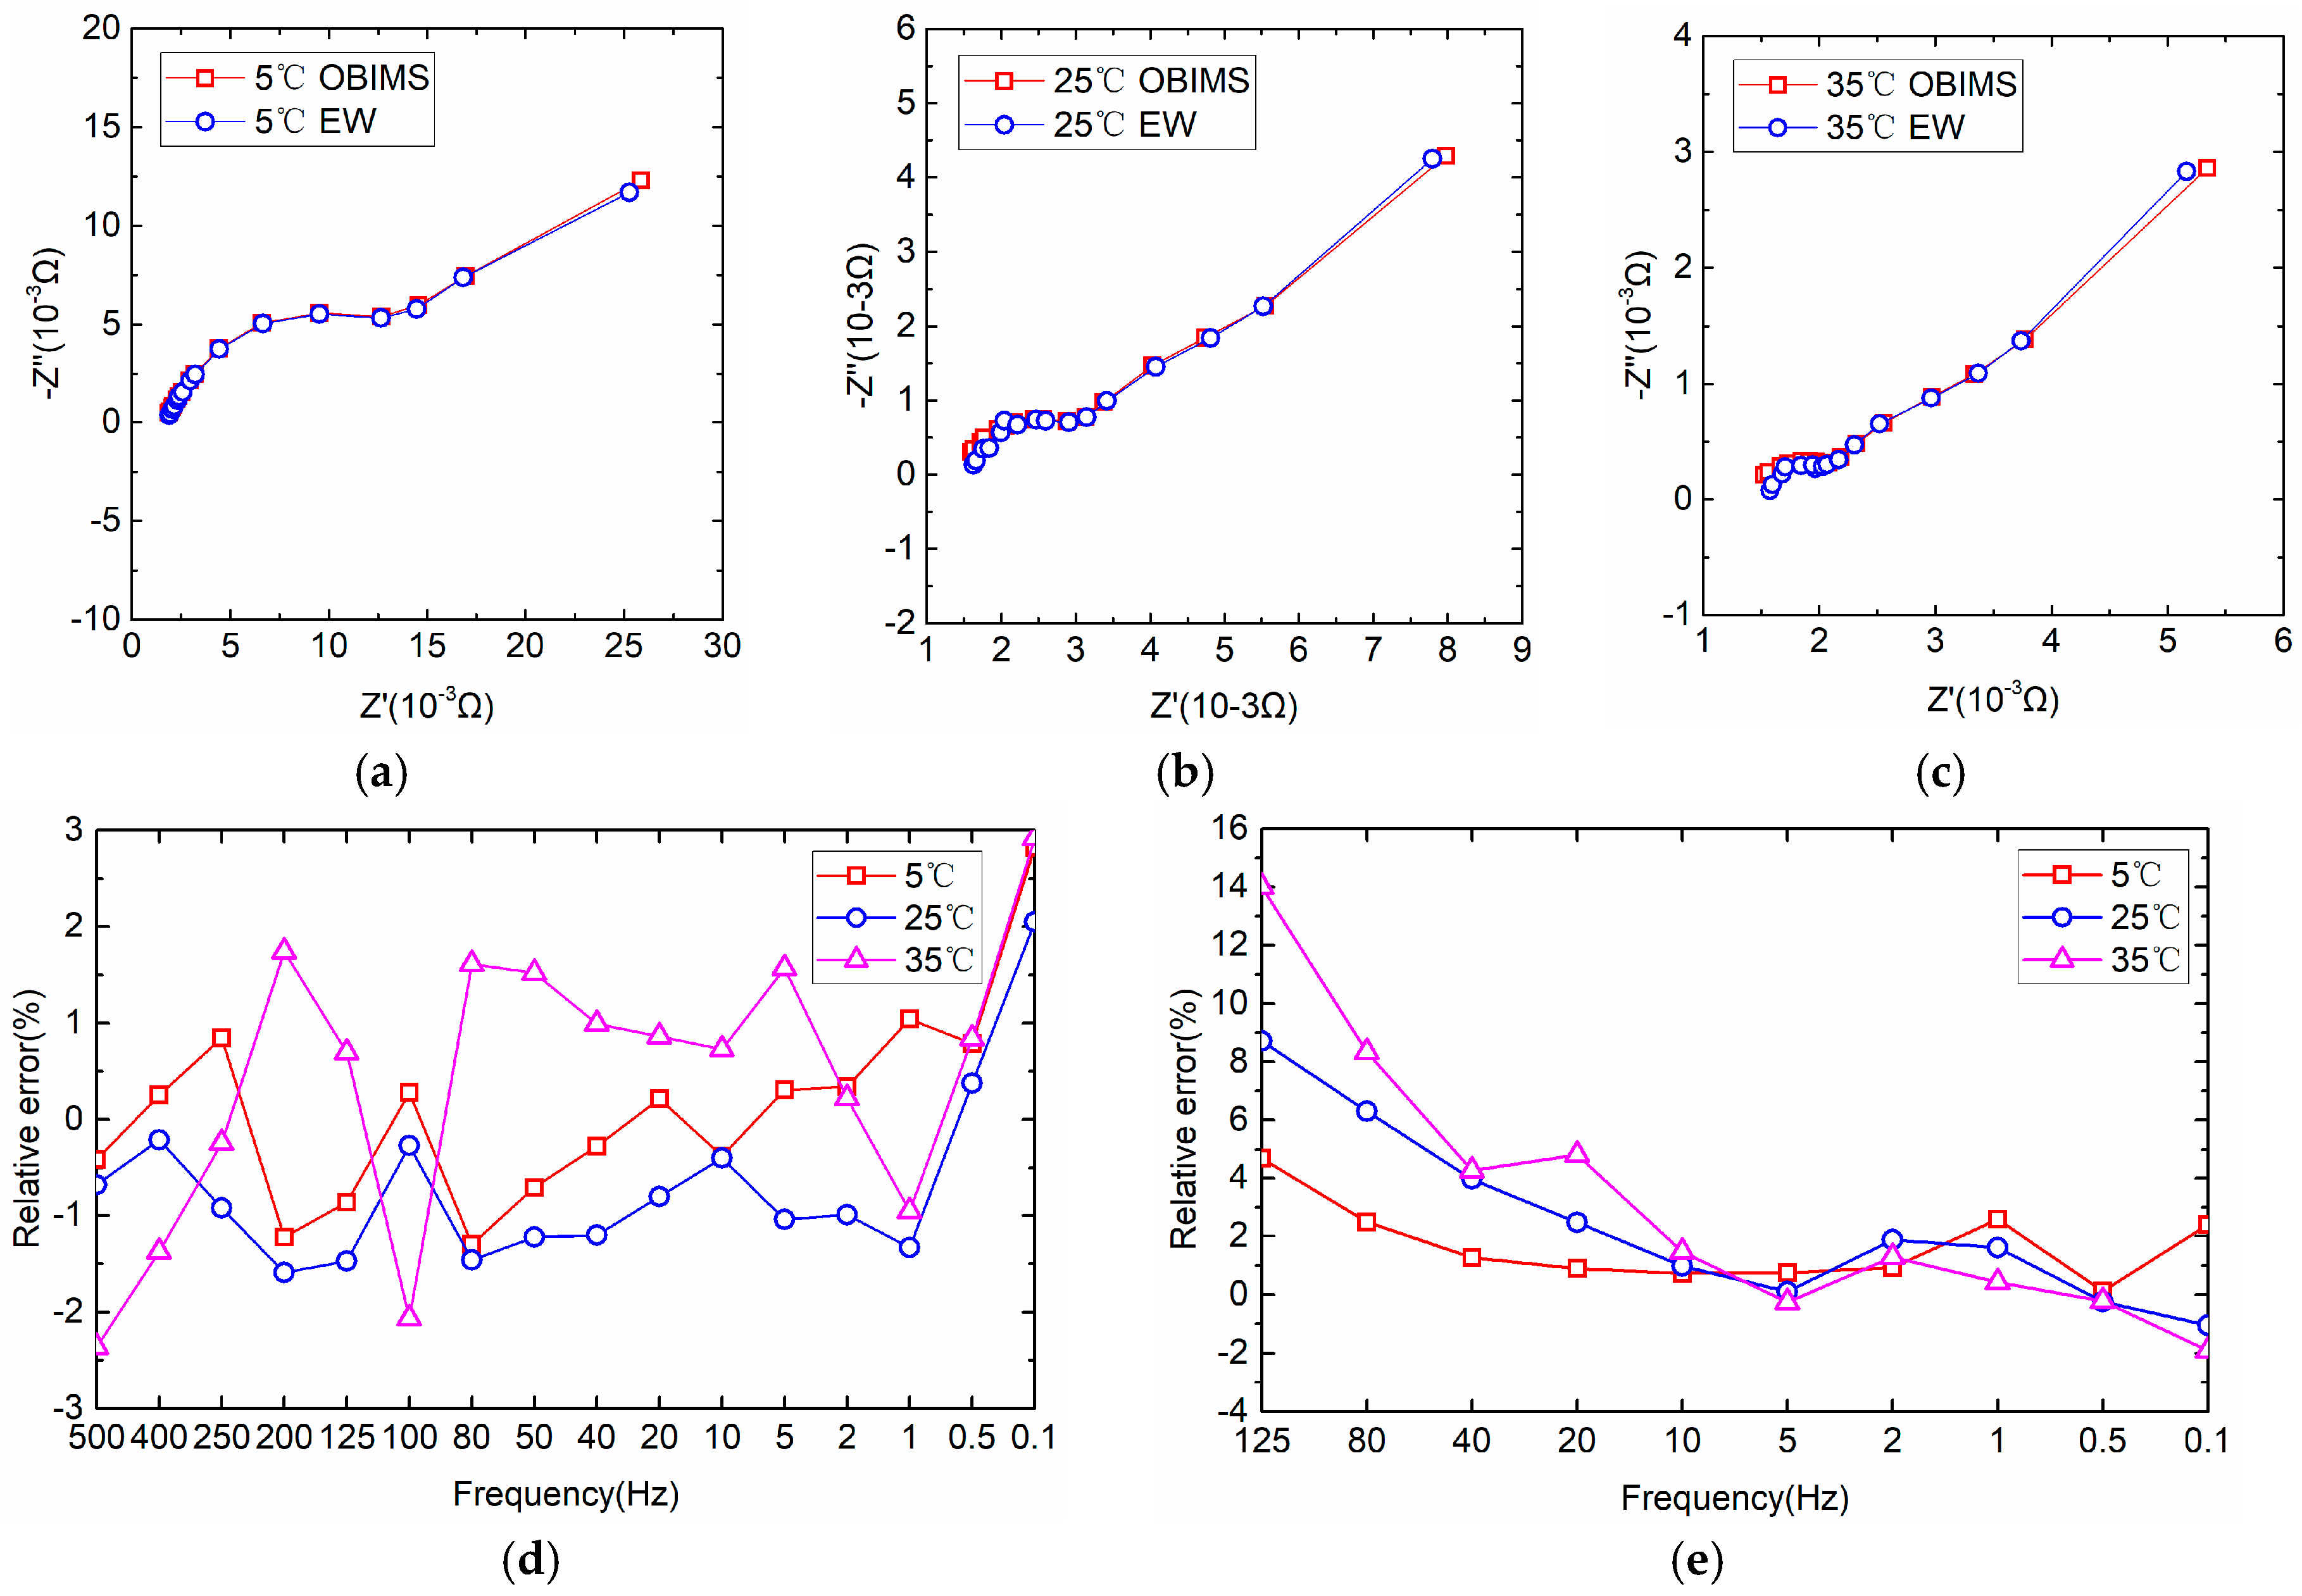
The battery impedance measurement results at 5 °C, 25 °C and 35 °C with the designed prototype are shown in Figure 9. The impedance spectra measured are compared with the results measured with electrochemical impedance workstation. It is seen from Figure 9a–c that the two measurement results agree well with each other at different temperature except for the impedance in high frequency range. It results from the measurement error of the impedance phase. As is shown in Figure 9e, the relative error of the impedance phase increases to 14% as the temperature rises, which is mainly due to low Signal-to-Noise ratio (SNR) when the battery impedance becomes smaller at higher temperature. In contrast, the effect of the temperature on the measurement accuracy of the battery impedance modulus is not obvious as is shown in Figure 9d. The measurement error of the impedance modulus in the frequency range of 0.1 Hz–500 Hz at different temperature is less than 3%.
The impedance of the six battery cells can be measured simultaneously with the designed prototype. Figure 10 shows the measurement results and the relative error of the battery cells’ impedance at room temperature. The error of the impedance modulus at different frequency (0.1 Hz–500 Hz) is less than 4.5% compared to the impedance measured with the electrochemical workstation. And the measured error of the impedance modulus at 500 Hz is less than 2%, which is very helpful to determine the ohmic resistance of the battery. The impedance phase error is less than 17%, 6% in the frequency range lower than 125 Hz, 10 Hz respectively. In the case of satisfying the linear condition, the author believes that it is possible to increase the excitation current to improve the measurement accuracy of the impedance phase.
4.3. Measurement of Battery Relative Impedance
The relative impedance is used to describe the difference of the impedance between different battery cells calculated with Equation (12). The designed impedance measuring system can obtain the battery relative impedance properly. The relative impedance is characterized with the relative impedance modulus and the relative phase as shown in Figure 11.
It can be seen that the relative impedance modulus of different battery cells is around 1, indicating a good consistence between the different battery cells. The change trends of the relative impedance modulus and phase measured with the prototype are almost the same as the ‘real’ trends obtained with electrochemical workstation. The tracking error of the relative impedance is much smaller than the absolute error measured, especially for the impedance phase shift. It should be noted that there are abnormal data points at 100 Hz, which are due to interference from the AC power supply to the electrochemical workstation. The effects can be seen more clearly in Bode and Nyquist plots in Figure 4.
5. Conclusions
To be compatible with the existing BMS, current and response voltage are sampled separately during the impedance measurement. The absolute and the relative impedance calculation methods are proposed based on the distributed signal sampling, which is considering to be the achievement of the paper. An impedance measuring system based on the method is designed and the impedance measurement results are compared to the results measured by an electrochemical workstation. The battery impedance modulus error is less than 4.5% in the frequency range from 0.1 Hz–500 Hz and the impedance phase error is less than 3% in the frequency range lower than 10 Hz and the designed impedance measuring system can catch the battery relative impedance properly.
It is believed that the distributed signal sampling benefits the implementation of impedance measurement on board. Besides, the proposed system to measure the battery impedance depends on the analog-front chip with high sampling frequency and accuracy. It puts forward new requirements for battery management system in future for a comprehensive monitoring or diagnosis of batteries in electric vehicles.
Acknowledgments
This work is financially supported by the National Natural Science Foundation of China (NSFC, Grant No. U1764256, No. 51576142,).
Author Contributions
Xueyuan Wang proposed the method, designed the experiments, designed the prototype, and wrote the paper; Haifeng Dai reviewed the paper; Xueyuan Wang and Haifeng Dai revised the paper; Xuezhe Wei provided guidance, key suggestions and test conditions.
Conflicts of Interest
The authors declare no conflict of interest. The founding sponsors had no role in the design of the study; in the collection, analyses, or interpretation of data; in the writing of the manuscript, and in the decision to publish the results.
References
- Plett, G.L. Extended Kalman filtering for battery management systems of LiPB-based HEV battery packs—Part 3. State and parameter estimation. J. Power Sources 2004, 134, 277–292. [Google Scholar] [CrossRef]
- Sbarufatti, C.; Corbetta, M.; Giglio, M.; Cadini, F. Adaptive prognosis of lithium-ion batteries based on the combination of particle filters and radial basis function neural networks. J. Power Sources 2017, 344, 128–140. [Google Scholar] [CrossRef]
- Ye, M.; Guo, H.; Xiong, R.; Mu, H. An Online Model-based Battery Parameter and State Estimation Method Using Multi-scale Dual Adaptive Particle Filters. Energy Procedia 2017, 105, 4549–4554. [Google Scholar] [CrossRef]
- Hu, X.; Sun, F.; Zou, Y. Estimation of State of Charge of a Lithium-Ion Battery Pack for Electric Vehicles Using an Adaptive Luenberger Observer. Energies 2010, 3, 1586–1603. [Google Scholar] [CrossRef]
- Kim, I.S. The novel state of charge estimation method for lithium battery using sliding mode observer. J. Power Sources 2006, 163, 584–590. [Google Scholar] [CrossRef]
- Lin, C.; Mu, H.; Xiong, R.; Shen, W. A novel multi-model probability battery state of charge estimation approach for electric vehicles using H-infinity algorithm. Appl. Energy 2016, 166, 76–83. [Google Scholar] [CrossRef]
- Jacobsen, T.; West, K. Diffusion impedance in planar, cylindrical and spherical symmetry. Electrochim. Acta 1995, 40, 255–262. [Google Scholar] [CrossRef]
- Zhuang, Q.-C.; Qiu, X.-Y.; Xu, S.-D.; Qiang, Y.-H.; Sun, S.-G. Diagnosis of electrochemical impedance spectroscopy in lithium-ion batteries. In Lithium Ion Batteries-New Developments; InTech: Rijeka, Croatia, 2012. [Google Scholar]
- Macdonald, D.D. Reflections on the history of electrochemical impedance spectroscopy. Electrochim. Acta 2006, 51, 1376–1388. [Google Scholar] [CrossRef]
- Macdonald, J.R. Impedance spectroscopy. Ann. Biomed. Eng. 1992, 20, 289–305. [Google Scholar] [CrossRef] [PubMed]
- Huang, Q.A.; Shen, Y.; Huang, Y.H.; Zhang, L.; Zhang, J.J. Impedance Characteristics and Diagnoses of Automotive Lithium-Ion Batteries at 7.5% to 93.0% State of Charge. Electrochim. Acta 2016, 219, 751–765. [Google Scholar] [CrossRef]
- Lee, J.H.; Choi, W. Novel State-of-Charge Estimation Method for Lithium Polymer Batteries Using Electrochemical Impedance Spectroscopy. J. Power Electron. 2011, 11, 237–243. [Google Scholar] [CrossRef]
- Rodrigues, S.; Munichandraiah, N.; Shukla, A.K. A review of state-of-charge indication of batteries by means of a.c. impedance measurements. J. Power Sources 2000, 87, 12–20. [Google Scholar] [CrossRef]
- Westerhoff, U.; Kroker, T.; Kurbach, K.; Kurrat, M. Electrochemical impedance spectroscopy based estimation of the state of charge of lithium-ion batteries. J. Energy Storage 2016, 8, 244–256. [Google Scholar] [CrossRef]
- Xiong, R.; Sun, F.; Chen, Z.; He, H. A data-driven multi-scale extended Kalman filtering based parameter and state estimation approach of lithium-ion olymer battery in electric vehicles. Appl. Energy 2014, 113, 463–476. [Google Scholar] [CrossRef]
- Troltzsch, U.; Kanoun, O.; Trankler, H.R. Characterizing aging effects of lithium ion batteries by impedance spectroscopy. Electrochim. Acta 2006, 51, 1664–1672. [Google Scholar] [CrossRef]
- Galeotti, M.; Cina, L.; Giammanco, C.; Cordiner, S.; Di Carlo, A. Performance analysis and SOH (state of health) evaluation of lithium polymer batteries through electrochemical impedance spectroscopy. Energy 2015, 89, 678–686. [Google Scholar] [CrossRef]
- Stroe, D.I.; Swierczynski, M.; Stan, A.I.; Knap, V.; Teodorescu, R.; Andreasen, S.J. Diagnosis of lithium-ion batteries state-of-health based on electrochemical impedance spectroscopy technique. In Proceedings of the 2014 IEEE Energy Conversion Congress and Exposition (ECCE), Pittsburgh, PA, USA, 14–18 September 2014; pp. 4576–4582. [Google Scholar]
- Yuan, H.-F.; Dung, L.-R. Offline State-of-Health Estimation for High-Power Lithium-Ion Batteries Using Three-Point Impedance Extraction Method. IEEE Trans. Veh. Technol. 2017, 66, 2019–2032. [Google Scholar] [CrossRef]
- Hu, C.; Ye, H.; Jain, G.; Schmidt, C. Remaining useful life assessment of lithium-ion batteries in implantable medical devices. J. Power Sources 2018, 375, 118–130. [Google Scholar] [CrossRef]
- Zhu, J.; Sun, Z.; Wei, X.; Dai, H. Battery Internal Temperature Estimation for LiFePO4 Battery Based on Impedance Phase Shift under Operating Conditions. Energies 2017, 10, 60. [Google Scholar] [CrossRef]
- Raijmakers, L.H.J.; Danilov, D.L.; van Lammeren, J.P.M.; Lammers, M.J.G.; Notten, P.H.L. Sensorless battery temperature measurements based on electrochemical impedance spectroscopy. J. Power Sources 2014, 247, 539–544. [Google Scholar] [CrossRef]
- Qahouq, J.A.A.; Xia, Z. Single-Perturbation-Cycle Online Battery Impedance Spectrum Measurement Method with Closed-Loop Control of Power Converter. IEEE Trans. Ind. Electron. 2017, 64, 7019–7029. [Google Scholar] [CrossRef]
- Yokoshima, T.; Mukoyama, D.; Nara, H.; Maeda, S.; Nakazawa, K.; Momma, T.; Osaka, T. Impedance Measurements of Kilowatt-Class Lithium Ion Battery Modules/Cubicles in Energy Storage Systems by Square-Current Electrochemical Impedance Spectroscopy. Electrochim. Acta 2017, 246, 800–811. [Google Scholar] [CrossRef]
- Al Nazer, R.; Cattin, V.; Granjon, P.; Montaru, M.; Ranieri, M. Broadband identification of battery electrical impedance for hevs. IEEE Trans. Veh. Technol. 2013, 62, 2896–2905. [Google Scholar] [CrossRef]
- Howey, D.A.; Mitcheson, P.D.; Yufit, V.; Offer, G.J.; Brandon, N.P. Online Measurement of Battery Impedance Using Motor Controller Excitation. IEEE Trans. Veh. Technol. 2014, 63, 2557–2566. [Google Scholar] [CrossRef]
- Bullecks, B.; Suresh, R.; Rengaswamy, R. Rapid impedance measurement using chirp signals for electrochemical system analysis. Comput. Chem. Eng. 2017, 106, 421–436. [Google Scholar] [CrossRef]
- Lohmann, N.; Haussmann, P.; Wesskamp, P.; Melbert, J.; Musch, T. Employing real automotive driving data for electrochemical impedance spectroscopy on lithium-ion cells. SAE Int. J. Altern. Powertrains 2015, 4, 308–317. [Google Scholar] [CrossRef]
- Hoshi, Y.; Yakabe, N.; Isobe, K.; Saito, T.; Shitanda, I.; Itagaki, M. Wavelet transformation to determine impedance spectra of lithium-ion rechargeable battery. J. Power Sources 2016, 315, 351–358. [Google Scholar] [CrossRef]
- Fernández Pulido, Y.; Blanco, C.; Anseán, D.; García, V.M.; Ferrero, F.; Valledor, M. Determination of suitable parameters for battery analysis by Electrochemical Impedance Spectroscopy. Measurement 2017, 106, 1–11. [Google Scholar] [CrossRef]
- Raijmakers, L.H.J.; Shivakumar, K.M.; Donkers, M.C.F.; Lammers, M.J.G.; Bergveld, H.J. Crosstalk Interferences on Impedance Measurements in Battery Packs. IFAC-PapersOnLine 2016, 49, 42–47. [Google Scholar] [CrossRef]
- Din, E.; Schaef, C.; Moffat, K.; Stauth, J.T. A Scalable Active Battery Management System with Embedded Real-Time Electrochemical Impedance Spectroscopy. IEEE Trans. Power Electron. 2017, 32, 5688–5698. [Google Scholar] [CrossRef]
- Huang, W.X.; Abu Qahouq, J.A. An Online Battery Impedance Measurement Method Using DC-DC Power Converter Control. IEEE Trans. Ind. Electron. 2014, 61, 5987–5995. [Google Scholar] [CrossRef]
- Nguyen, T.T.; Tran, V.L.; Choi, W.J. Development of the Intelligent Charger with Battery State-Of-Health Estimation Using Online Impedance Spectroscopy. In Proceedings of the 2014 IEEE 23rd International Symposium on Industrial Electronics (ISIE), Istanbul, Turkey, 1–4 June 2014; pp. 454–458. [Google Scholar]
- Boukamp, B.A. A Linear Kronig-Kramers Transform Test for Immittance Data Validation. J. Electrochem. Soc. 1995, 142, 1885–1894. [Google Scholar] [CrossRef]
- Momma, T.; Matsunaga, M.; Mukoyama, D.; Osaka, T. Ac impedance analysis of lithium ion battery under temperature control. J. Power Sources 2012, 216, 304–307. [Google Scholar] [CrossRef]
Figure 1.
Clock synchronization process between LECU (Local Electronic Control Unit) and CECU (Central Electronic Control Unit).
Figure 1.
Clock synchronization process between LECU (Local Electronic Control Unit) and CECU (Central Electronic Control Unit).
Figure 2.
Goodness of Kramers-Kronig (K-K) fit of impedance spectroscopy measured with different AC current amplitude. (a) Goodness of K-K fit at different State of Charge (SOC); (b) Goodness of K-K fit at different temperature.
Figure 2.
Goodness of Kramers-Kronig (K-K) fit of impedance spectroscopy measured with different AC current amplitude. (a) Goodness of K-K fit at different State of Charge (SOC); (b) Goodness of K-K fit at different temperature.

Figure 3.
Electrochemical Impedance Spectroscopy (EIS) of the LiFePO4 battery from 0.01 Hz to 10 kHz at different state. (a) EIS at 60% SOC at different temperature; (b) EIS at different SOC at 25 °C; (c) EIS at 25°C, 50% SOC after different aging cycles.
Figure 3.
Electrochemical Impedance Spectroscopy (EIS) of the LiFePO4 battery from 0.01 Hz to 10 kHz at different state. (a) EIS at 60% SOC at different temperature; (b) EIS at different SOC at 25 °C; (c) EIS at 25°C, 50% SOC after different aging cycles.
Figure 4.
Bode plots of the LiFePO4 battery at different states. (a,b) Bode plot at 60% SOC at different temperature; (c,d) Bode plot at different SOC at 25 °C; (e,f) Bode plot at 25 °C, 50% SOC after different aging cycles.
Figure 4.
Bode plots of the LiFePO4 battery at different states. (a,b) Bode plot at 60% SOC at different temperature; (c,d) Bode plot at different SOC at 25 °C; (e,f) Bode plot at 25 °C, 50% SOC after different aging cycles.
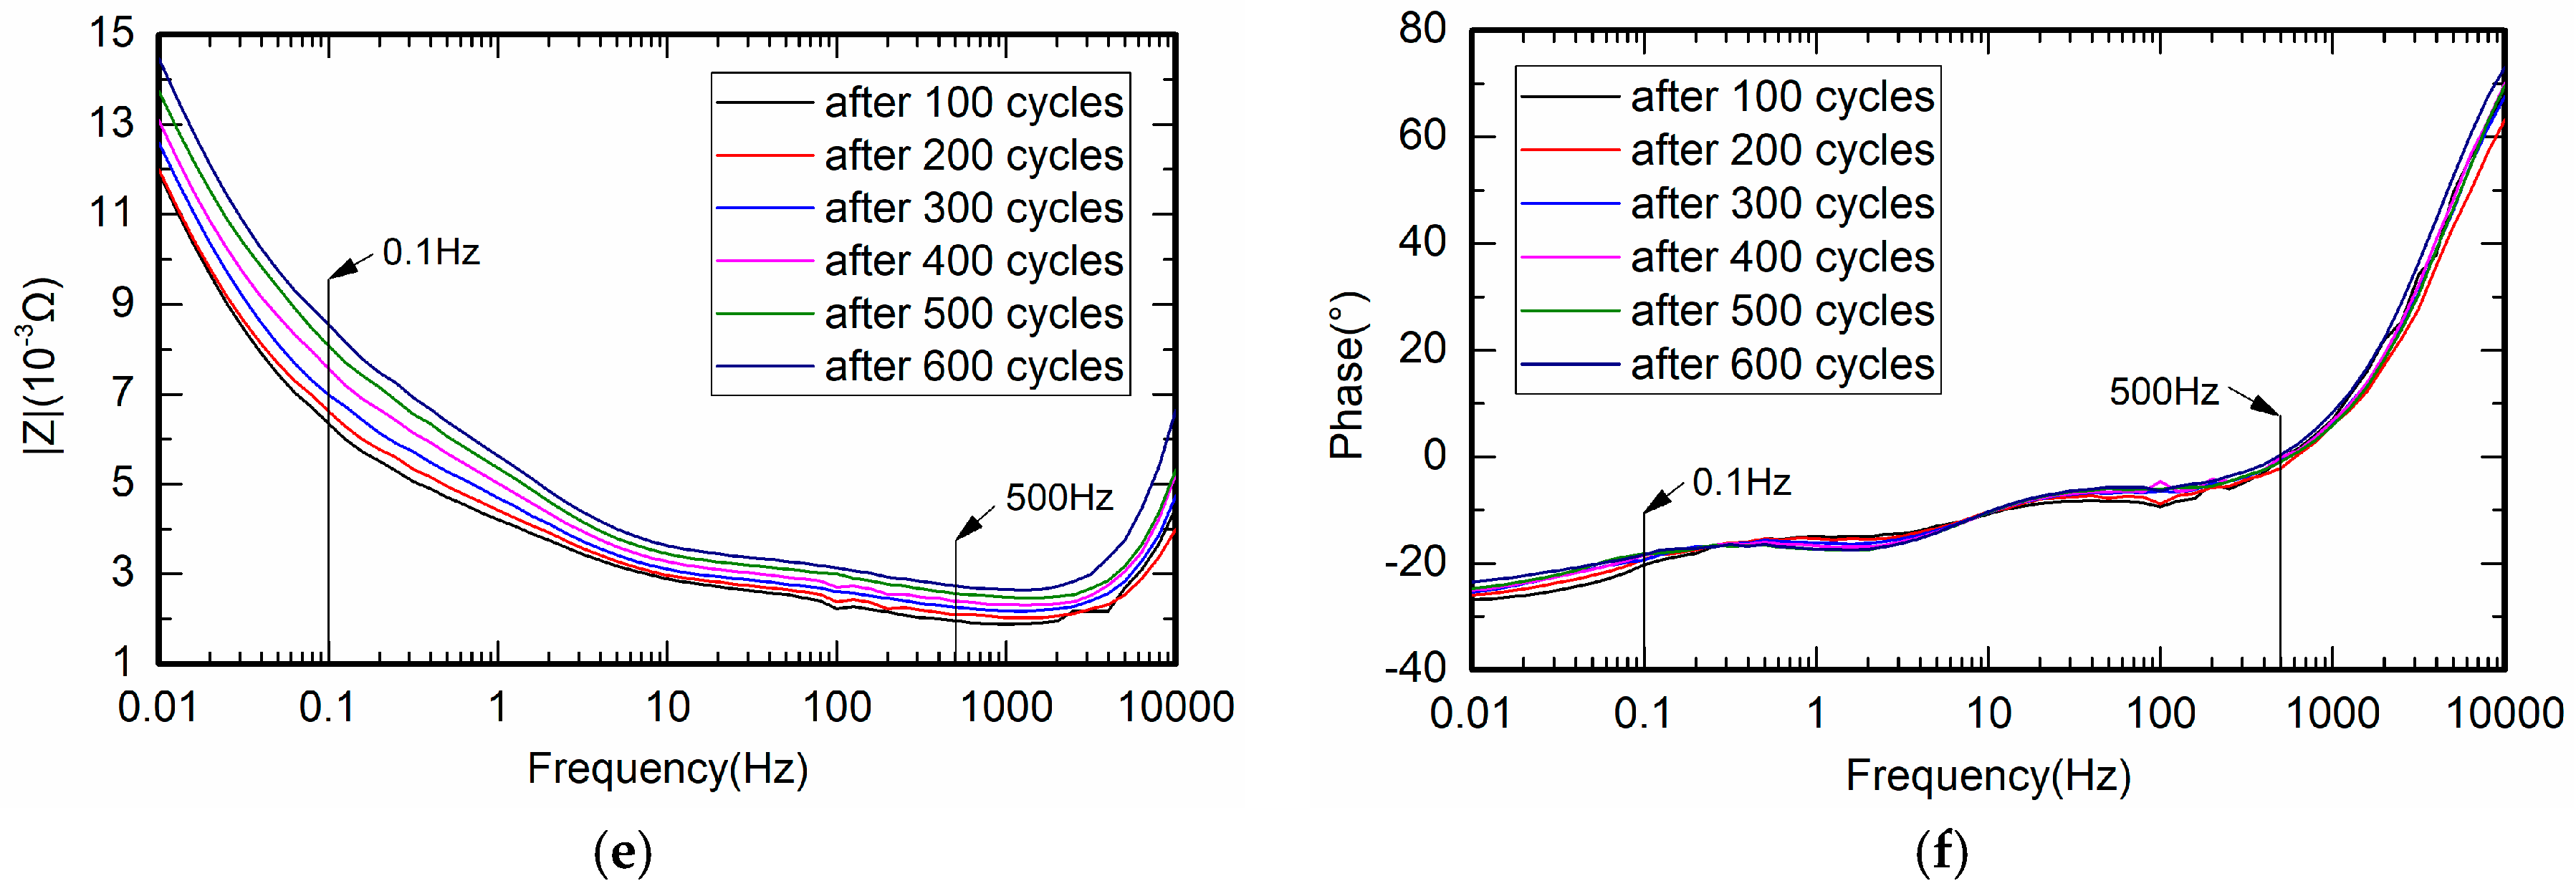
Figure 5.
Experimental devices and prototype for the impedance measuring system.
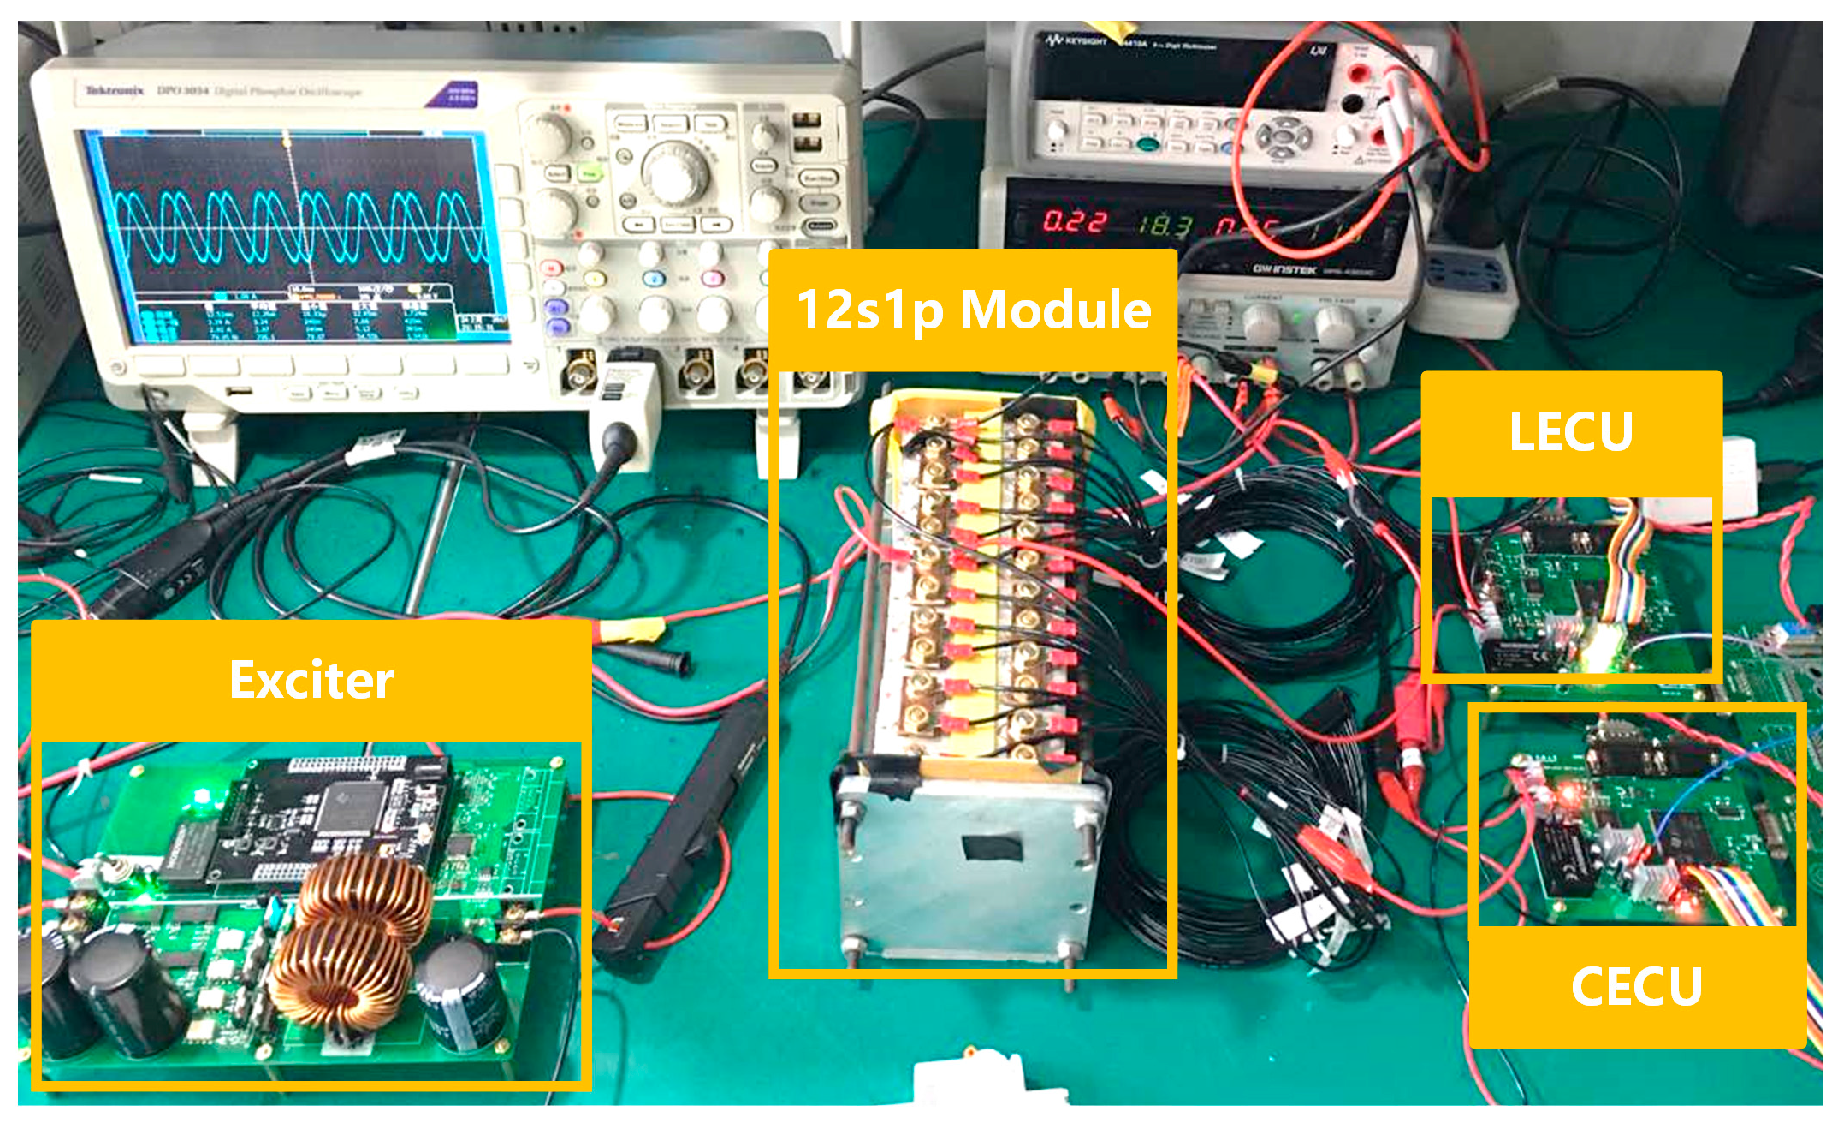
Figure 6.
Voltage and current sampling circuits.
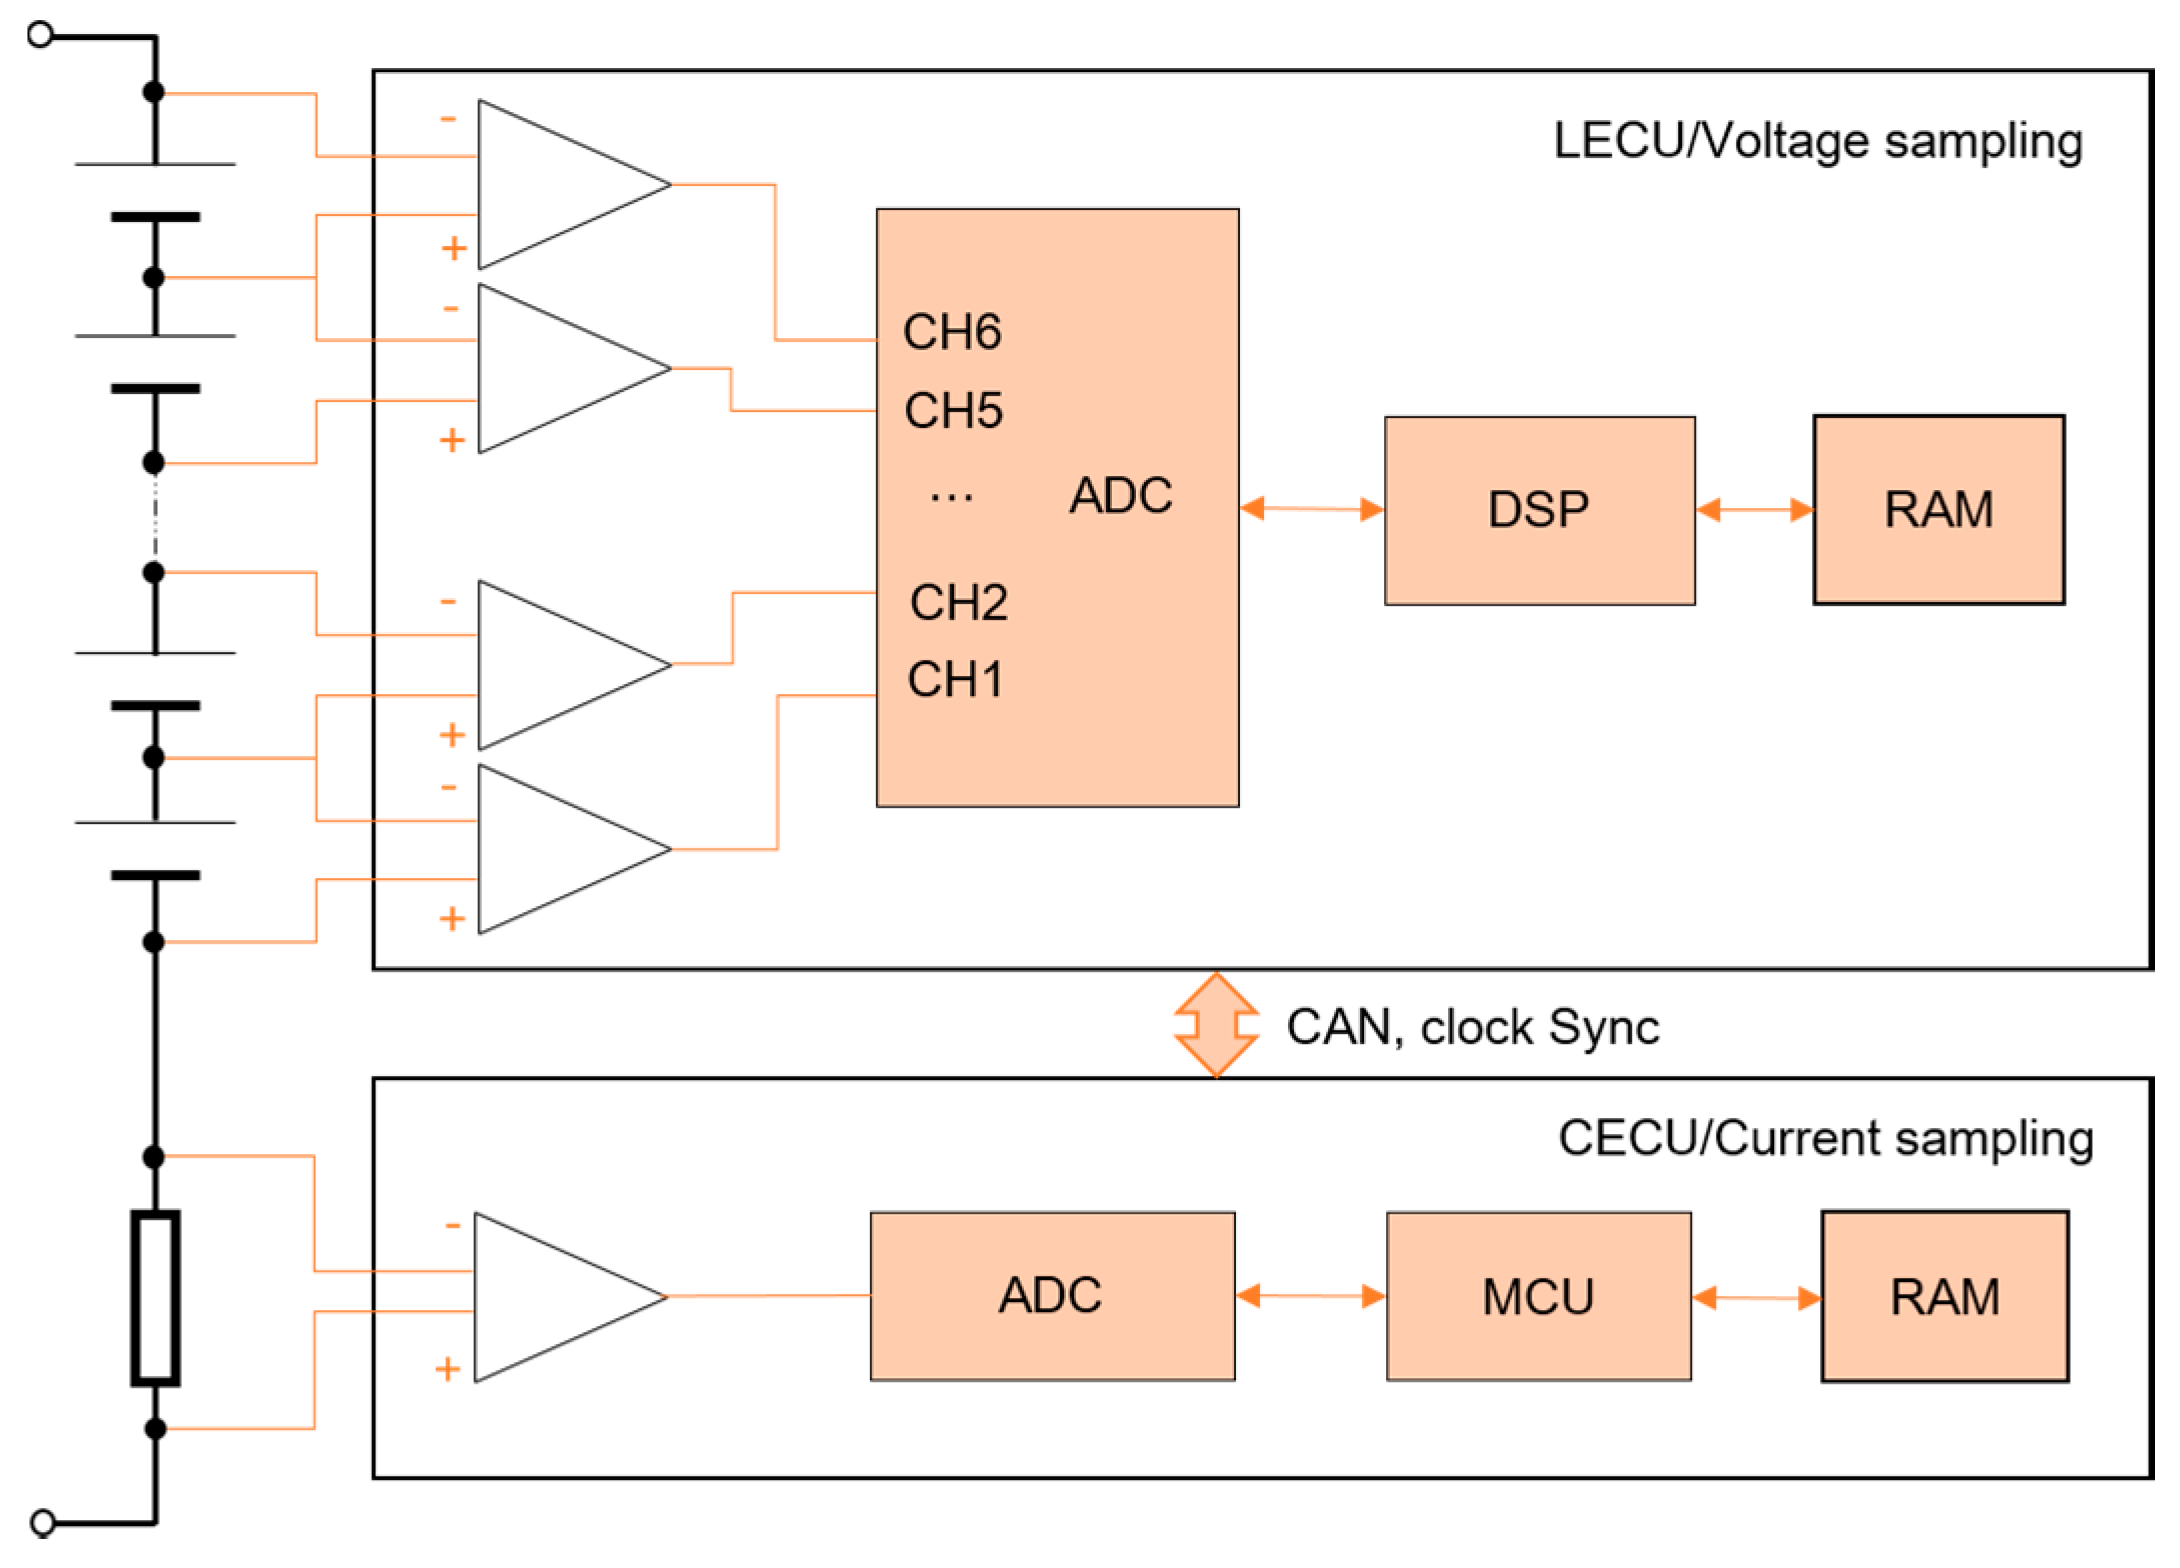
Figure 7.
Main circuit and control block of the DC-AC converter.

Figure 8.
Standard derivation of the measured battery impedance modulus and phase at different frequency ratio.
Figure 8.
Standard derivation of the measured battery impedance modulus and phase at different frequency ratio.

Figure 9.
Battery cells’ impedance measured and measurement error with the designed impedance measuring system at 5 °C, 25 °C, 35 °C. (a–c) Comparison of measured impedance spectra with designed impedance measuring system (OBIMS) and electrochemical workstation (EW); (d) Relative error of measured impedance modulus at different temperature; (e) Relative error of measured impedance phase at different temperature.

Figure 10.
Battery cells’ impedance measured and measurement error with the designed impedance measuring system at room temperature (about 25 °C). (a–f) Measured impedance spectra of different battery cells; (g) Relative error of measured impedance modulus; (h) Relative error of measured impedance phase.
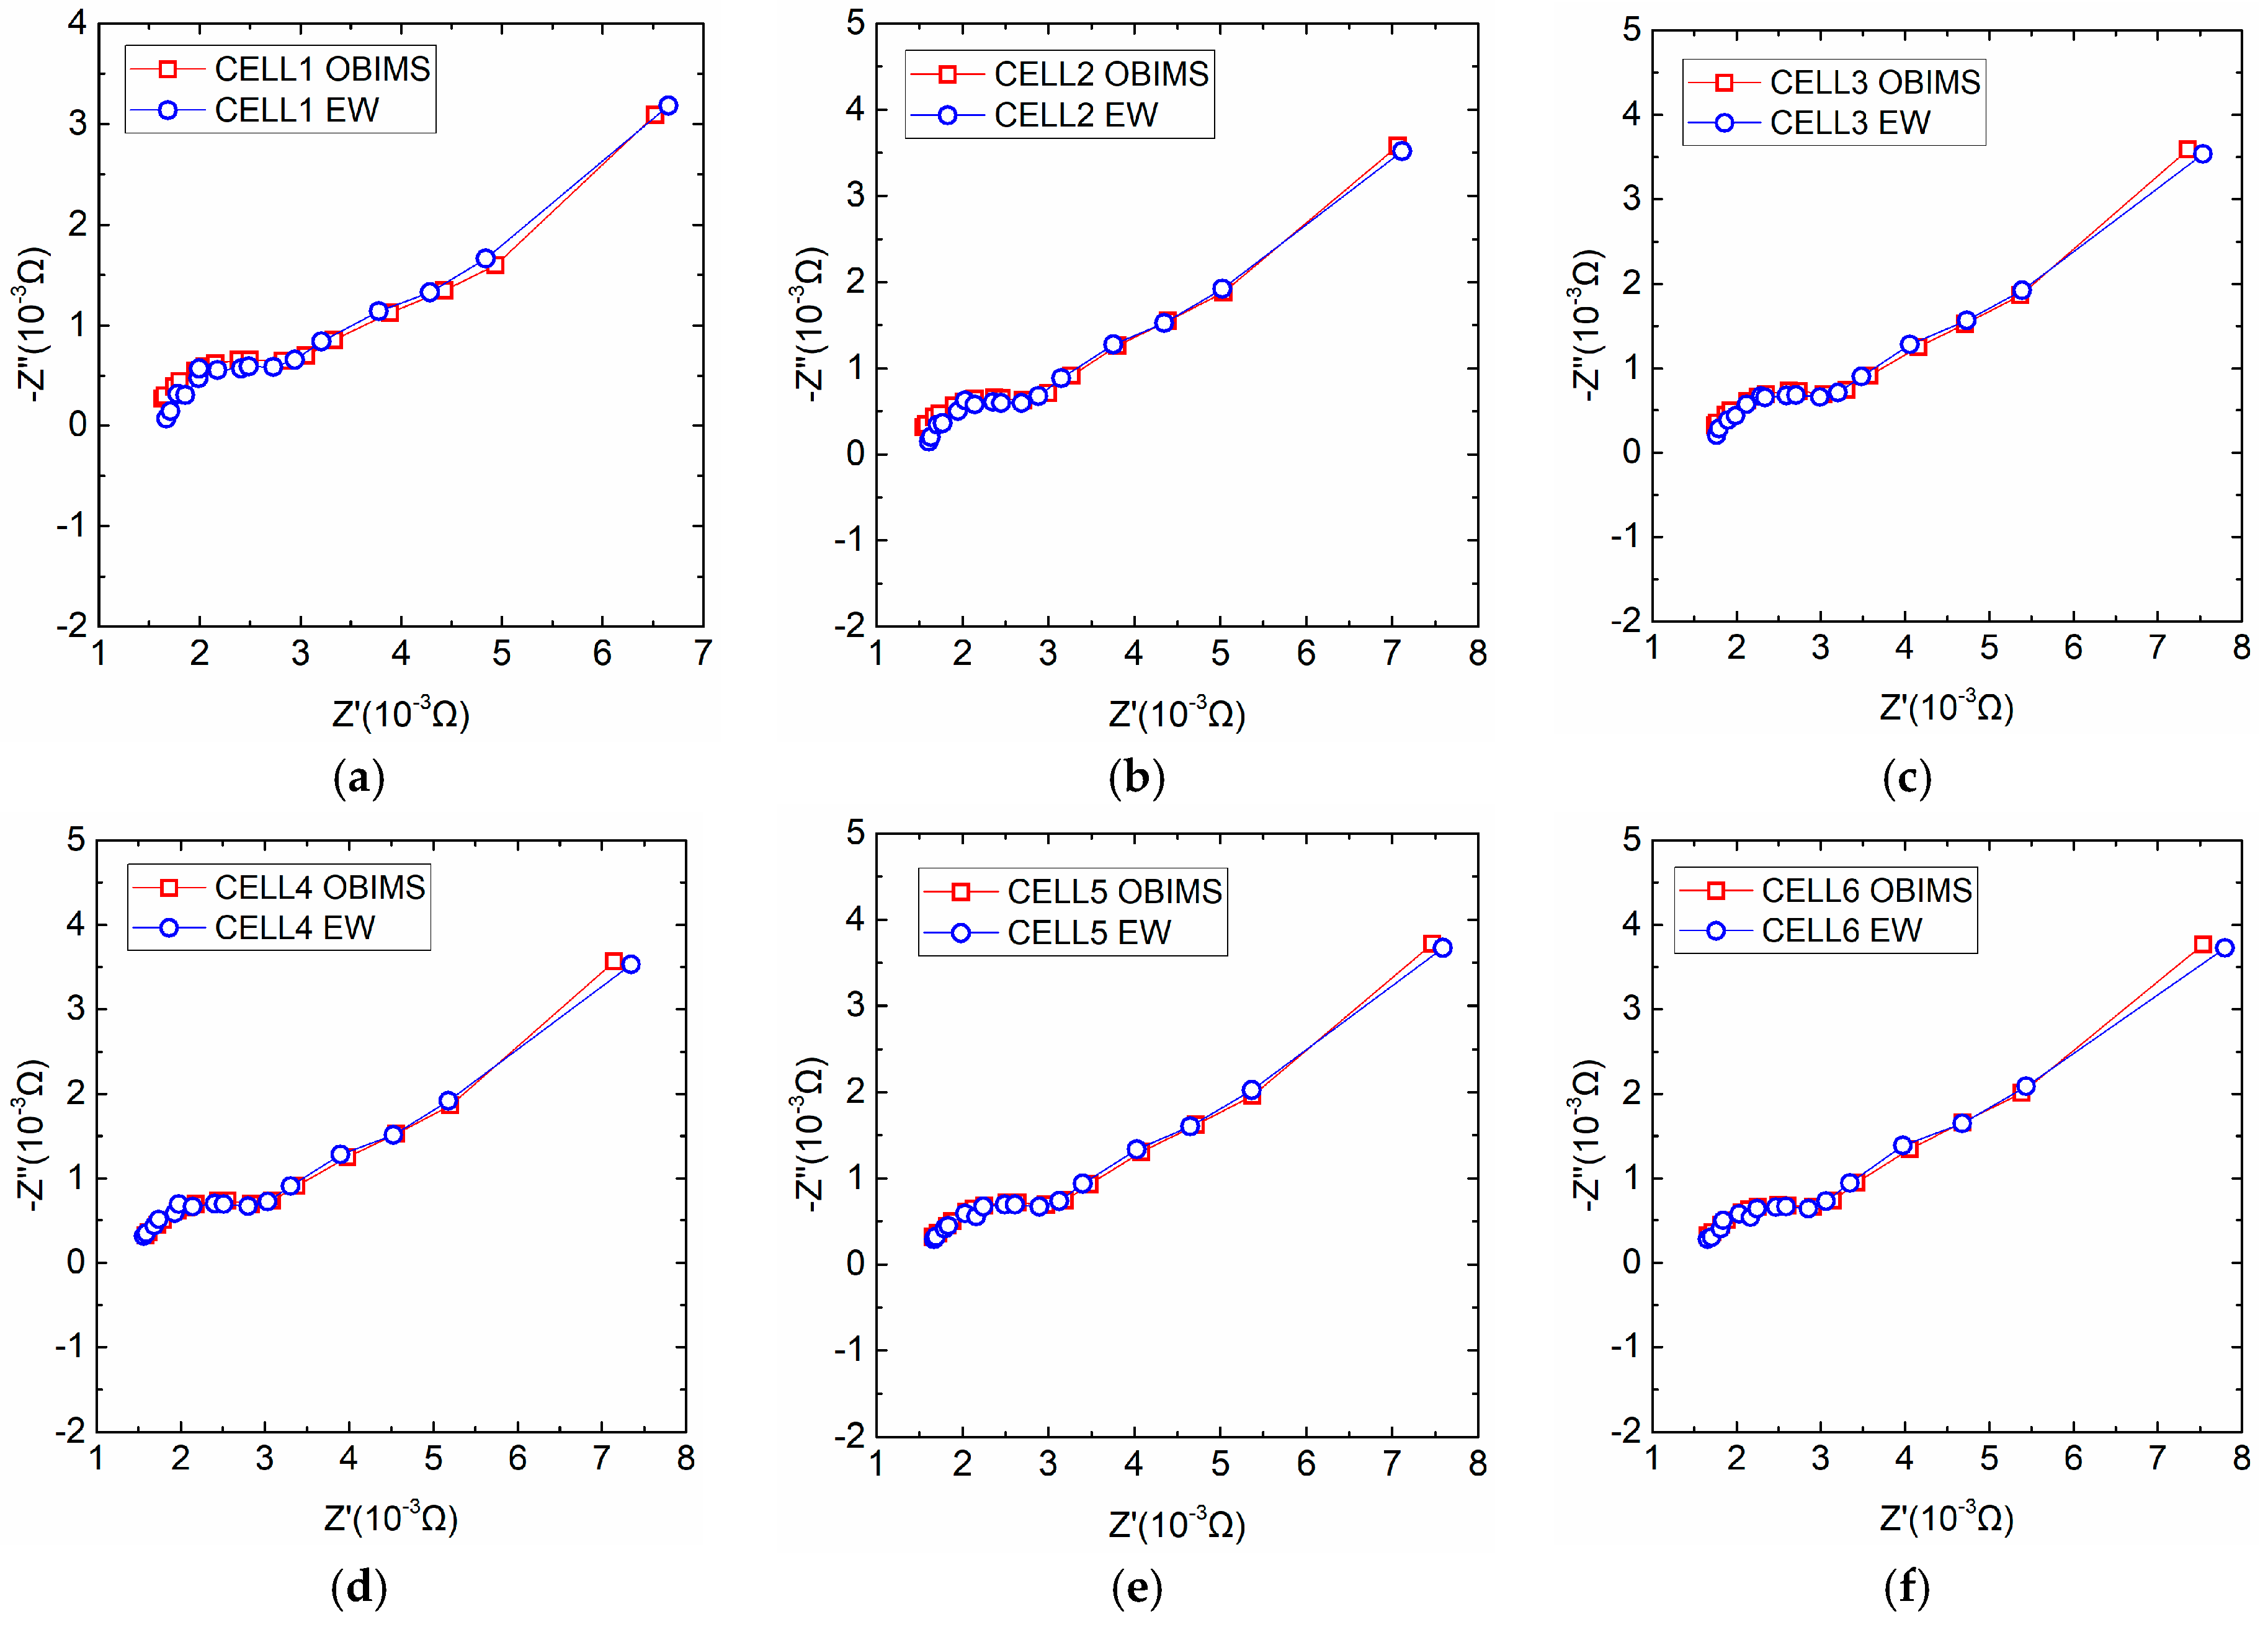
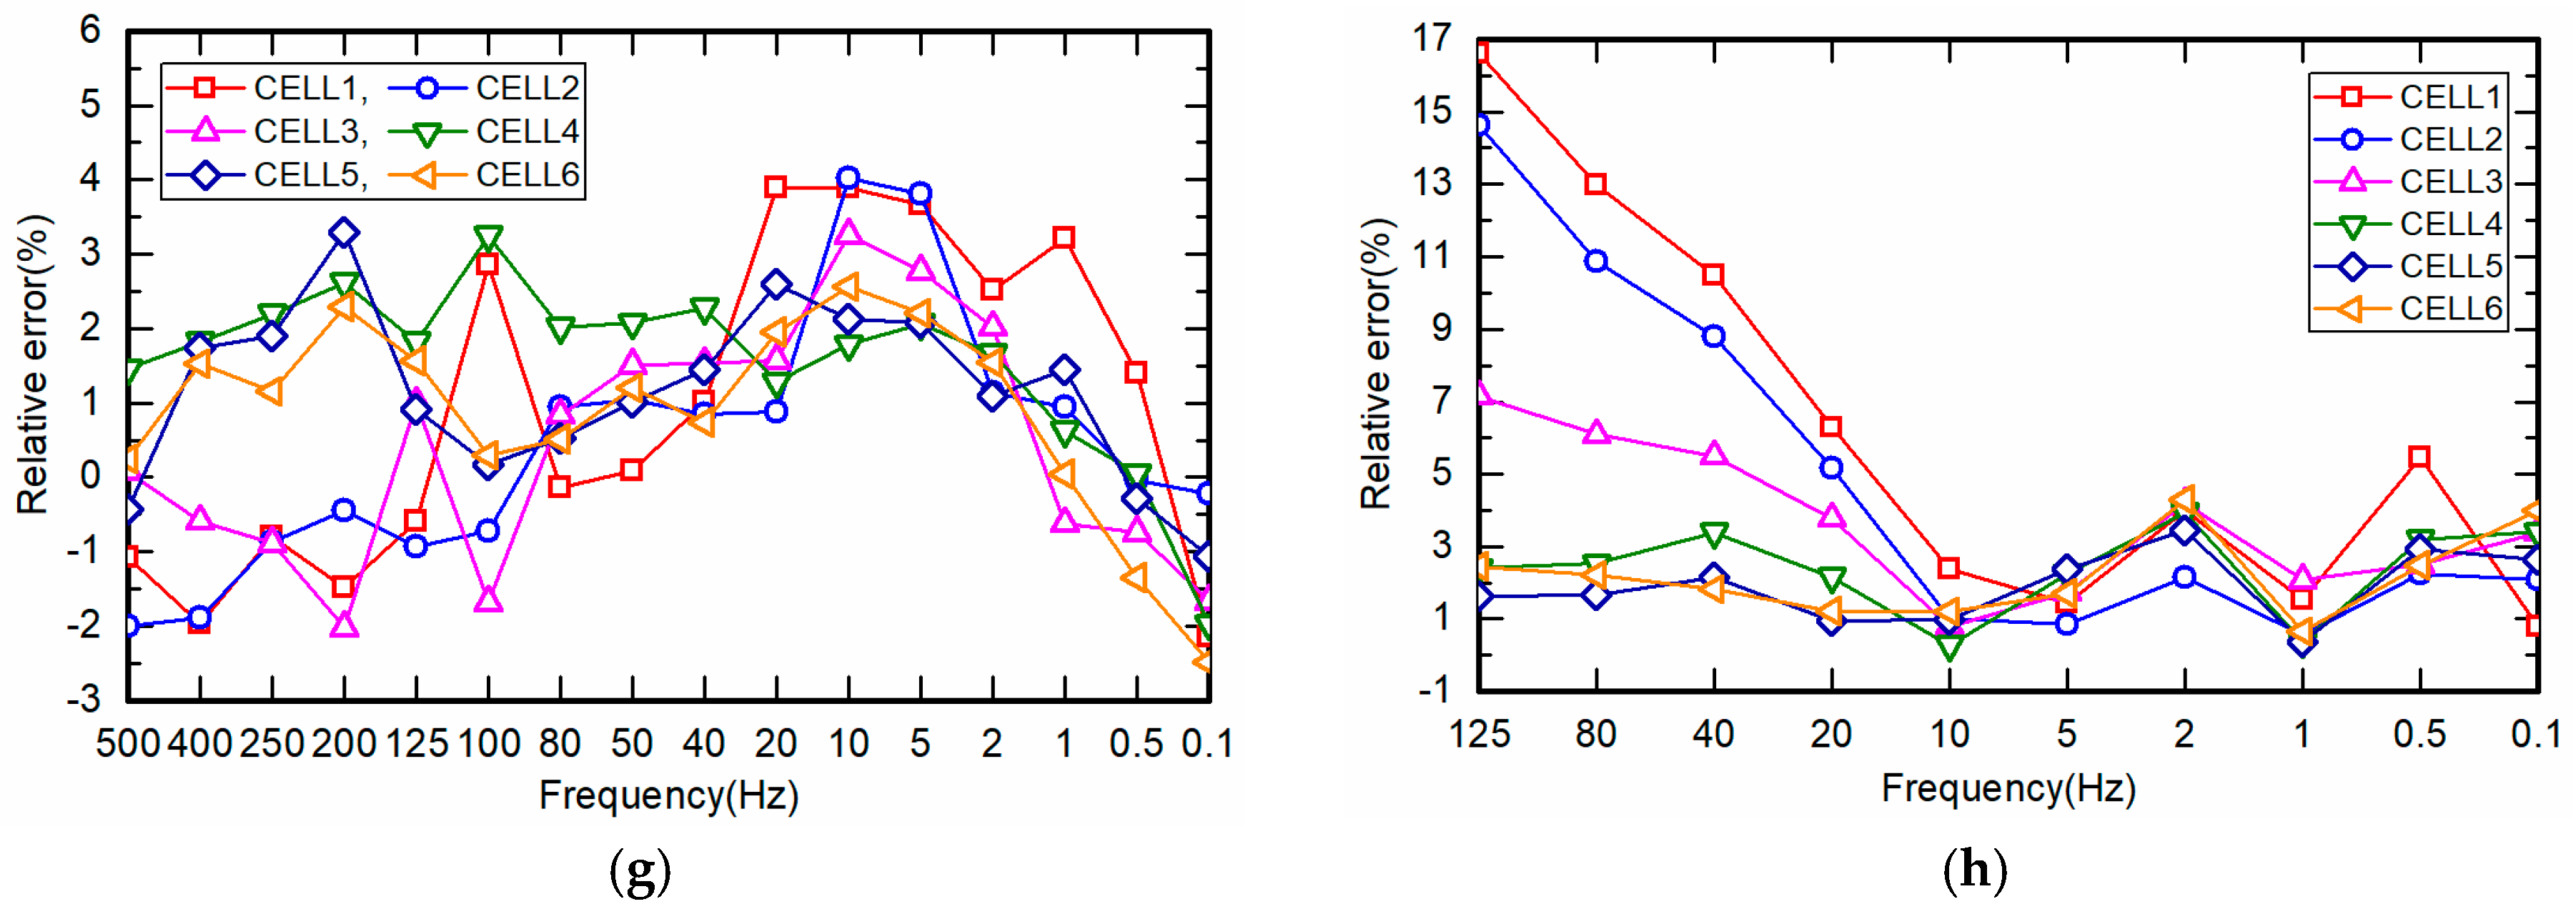
Figure 11.
Relative impedance between different batteries obtained with designed impedance measuring system and electrochemical workstation (EW). (a) Relative impedance modulus (RIM) between different battery cells; (b) Relative impedance Phase (RIP) between different battery cells.
Figure 11.
Relative impedance between different batteries obtained with designed impedance measuring system and electrochemical workstation (EW). (a) Relative impedance modulus (RIM) between different battery cells; (b) Relative impedance Phase (RIP) between different battery cells.

© 2018 by the authors. Licensee MDPI, Basel, Switzerland. This article is an open access article distributed under the terms and conditions of the Creative Commons Attribution (CC BY) license (http://creativecommons.org/licenses/by/4.0/).
Share and Cite
MDPI and ACS Style
Wei, X.; Wang, X.; Dai, H. Practical On-Board Measurement of Lithium Ion Battery Impedance Based on Distributed Voltage and Current Sampling. Energies 2018, 11, 64. https://doi.org/10.3390/en11010064
AMA Style
Wei X, Wang X, Dai H. Practical On-Board Measurement of Lithium Ion Battery Impedance Based on Distributed Voltage and Current Sampling. Energies. 2018; 11(1):64. https://doi.org/10.3390/en11010064
Chicago/Turabian StyleWei, Xuezhe, Xueyuan Wang, and Haifeng Dai. 2018. "Practical On-Board Measurement of Lithium Ion Battery Impedance Based on Distributed Voltage and Current Sampling" Energies 11, no. 1: 64. https://doi.org/10.3390/en11010064
Note that from the first issue of 2016, this journal uses article numbers instead of page numbers. See further details here.