Article

Investigation of Sectional-Stage Loading Strategies on a Two-Stage Turbocharged Heavy-Duty Diesel Engine under Transient Operation with EGR

State Key Laboratory of Automotive Simulation and Control, Jilin University, Changchun 130025, China
*
Author to whom correspondence should be addressed.
Energies 2018, 11(1), 69; https://doi.org/10.3390/en11010069
Submission received: 7 December 2017 / Revised: 26 December 2017 / Accepted: 26 December 2017 / Published: 1 January 2018

Abstract

:
The influence of loading strategies on combustion and emissions parameters is experimentally and numerically studied under typical 5 s transient conditions of constant speed and increasing torque. The experiment is conducted on a two-stage turbocharged heavy-duty diesel engine with a constant opening valve high-pressure exhaust gas recirculation (EGR) system. The test results show that: compared with the full-stage loading (FSL) strategy (constant loading rate during the entire transient process), the sectional-stage loading (SSL) strategies (holding a certain time at 50% load) can significantly reduce soot emissions (by 41.3%); the greater the first-stage loading rate, the better the torque response performance, which maximally increases by 56.7%. Besides, longer loading holding time can effectively restrain the overshoot of EGR rate and advance the combustion phase (CA10, CA50) at medium and large loads. However, the larger second-stage loading rate slightly deteriorates the combustion and emission performance. This deterioration situation can be markedly suppressed by adopting a suitable loading hold time.

1. Introduction

The working conditions of the vehicle engine on urban roads are mostly in transient processes such as starting, acceleration and deceleration, and the proportion of constant speed and changing torque conditions is larger [1,2]. However, the transient combustion, emissions and economy performance are extremely deteriorated [3,4]. In particular, the overshoot of EGR rate occurs in turbocharging diesel engine under transient process conditions [5]. The main reason for this is the response delay of combustion boundary conditions caused by the air supply delay [6,7,8]. Aiming at addressing the increasingly serious environmental problems and stringent emission regulations, optimization of transient combustion and emission performance has become a focus of vehicle engine research. Thus, the two-stage turbocharging system can not only raise intake air and decrease emissions, but also optimize the dynamic response performance and obtain high EGR rates, which is widely utilized in engines [9,10,11].
Shi et al. [12] matched a regulated two-stage turbocharger for a D6114 diesel engine to raise the low-speed torque, owing to its wider flow range and higher pressure ratio level. Wu et al. [13] combined a late intake valve closing (LIVC) system with a two-stage turbocharger, adopting variable geometry turbocharger (VGT) on the high-pressure turbine, to effectively adjust the operating range of the turbocharging system. They highlighted that, the application of VGT control strategy and Miller cycle resulted in promising trade-off emissions and torque response performances during transient operation. Grönman et al. [14] experimentally and computationally studied a two-stage electrically assisted turbocharging system. It inferred that overall efficiency could be increased by 2.5% compared with the conventional single-stage turbocharger. Certainly, increasing the intake air can improve the transient combustion deterioration, however, it will inevitably lead to complexity of the intake system structure and increased cost, which have hindered implementation of the optimizing effect of the technology discussed above. Therefore, the main method is to optimize the combustion and reduce the emissions by adjusting the fuel supply strategy.
Additionally, with the rapid development of high-pressure common rail technology, the fuel injection parameters (injection pressure, injection timing and injection quantity etc.) can be controlled more flexibly to strengthen the air-fuel mixing process and decrease emissions [15,16,17]. Zhang et al. [18] proposed that changing the injection pressure decreased the differences in performance between transient conditions and steady state. Liu et al. [19] introduced sectional-stage rail pressure strategies for optimizing the transient performance of a two-stage turbocharging diesel engine. Their results indicated that the smoke opacity peak was maximally reduced by 56.3% and deterioration of BSFC was significantly restrained. Furthermore, Agarwal et al. [20,21,22] revealed that fuel injection timing was another main factor that affected the combustion, emissions and performance characteristics of diesel engines. Zhang et al. [18] suggested that advancing the fuel injection timing restricted the delay of combustion phasing, and effectively elevated thermal efficiency under transient conditions. Han et al. [23] concluded that advancing the injection timing could strengthen the air-fuel mixing energy (ME) to compensate the adverse impacts caused by turbocharger lag during transient conditions. Besides, the change of fuel quantity has significant effects on engine performance. Darlington et al. [24] proved that the peak value of smoke could be reduced by changing the injected fuel quantity under the loading process condtions, but it inevitably caused deterioration of the torque response. Rakopoulos et al. [25] proposed that the torque response and emission could be effectively improved by reasonable fuel quantity control mode and injection timing calibration. Han et al. [23] presented that, the faster the loading process, the higher the smoke and nitrogen oxides (NOX) emissions. The primary reason for this was the increasingly rich mixture in the cylinder, caused by a lack of air-fuel mixing energy (ME).
In conclusion, the performance of the diesel engine can be optimized by adjusting the injection parameters. However, there are few studies on the fuel supply mode, especially with reference to transient conditions. Hence, a reasonable fuel supply control mode (loading rate) has great potential of shortening the transient response time, improving fuel economy and reducing emissions. Besides, this paper has focused on both aspects of fuel and air under transient operation. Therefore, it is of practical and applied significance to investigate the influence of different loading strategies on transient performance of a two-stage turbocharging diesel engine.
The purpose of this paper is to reduce soot emissions as much as possible, while improving the dynamical response performance during typical 5 s transient conditions, with reference to increasing torque from 10% to 100% and constant speed at 1650 rpm over 5 s transient time [19,26]. Thus, the influence of loading strategies on the transient performance of a two-stage turbocharged diesel engine with high-pressure exhaust gas recirculation (HP-EGR) is numerically and experimentally studied. Initially, different the first-stage loading rates and loading stagnation times were investigated to improve the transient combustion and emissions performance. Afterwards, the radical reason for the effects of loading hold time on the transient performance is researched by computational simulation. Finally, different the second-stage loading rates and loading hold times are discussed to select an optimal loading strategy, offering a basis for the further application of loading strategies during transient operation.

2. Experimental Work

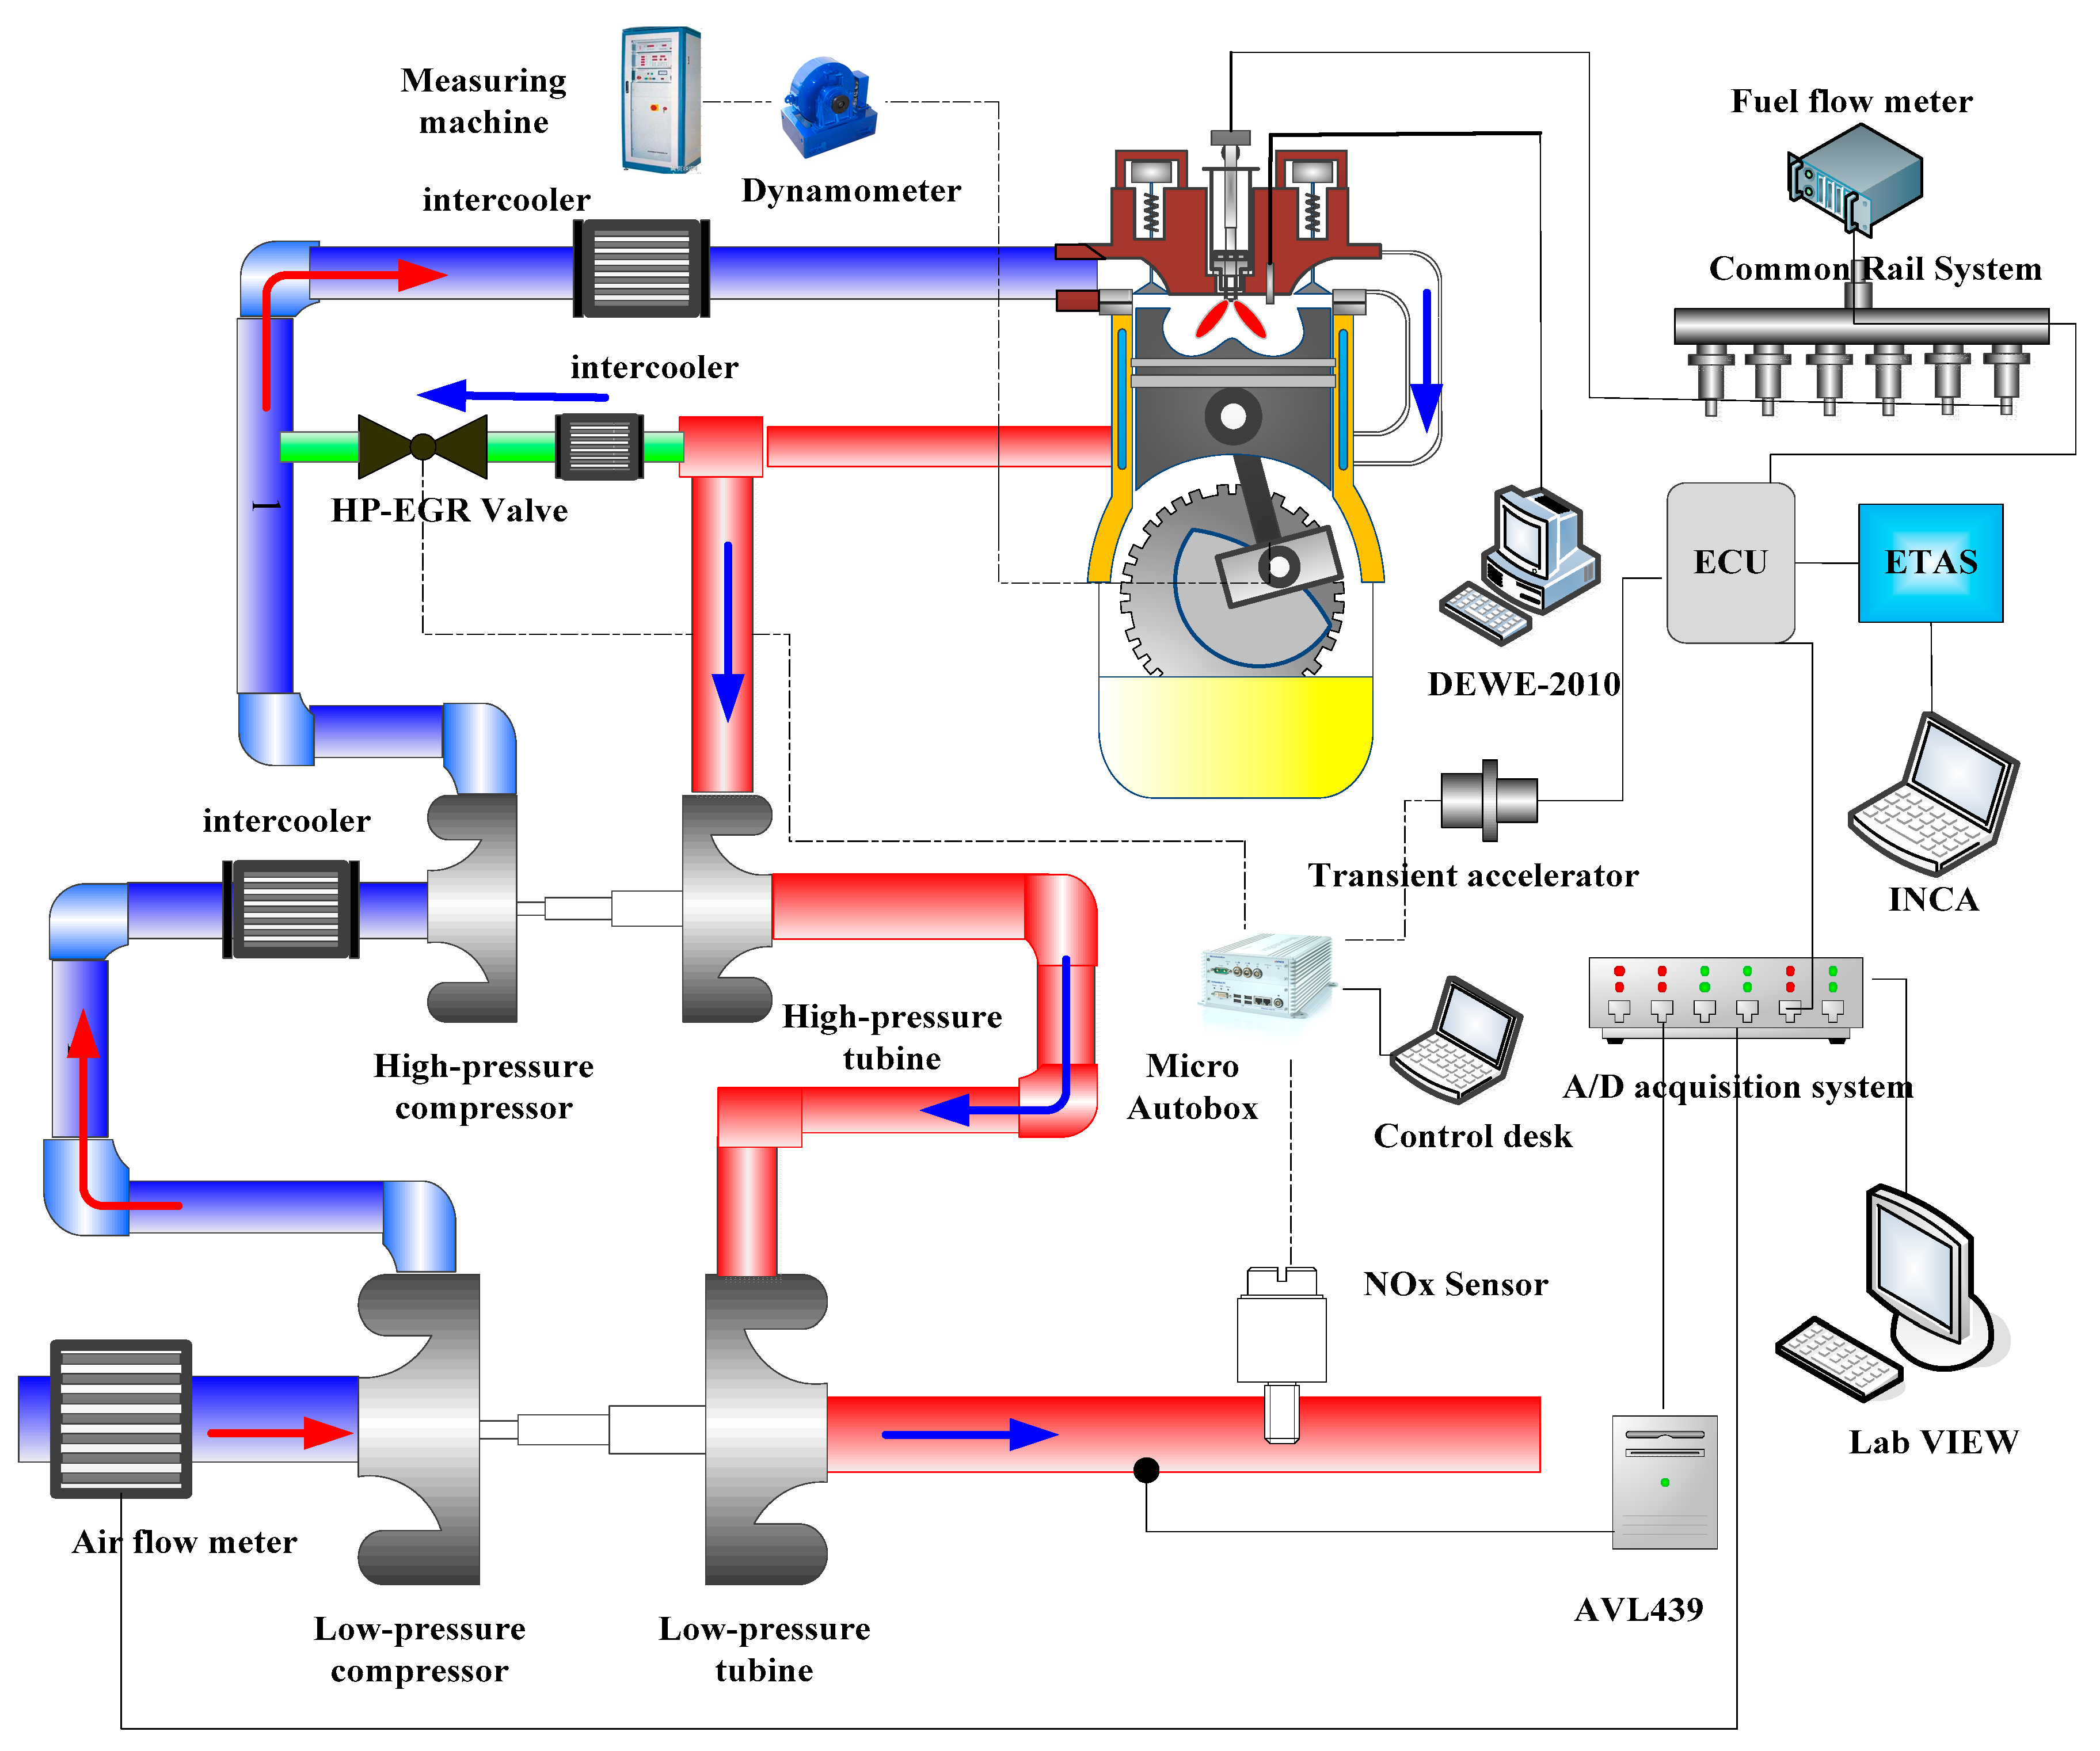
2.1. Experimental Setup and Procedure

Table 1 shows the test engine specifications. The experiment is conducted in an inter-cooled turbocharged diesel engine, which includes a high- pressure common rail injection system, a Bosch electronic control unit (ECU), an integrated calibration and acquisition system V5.4 software (INCA), a two-stage turbocharger and high-pressure EGR loop. Figure 1 shows the schematic diagram of the control and measurement platform. Before the experiment, the test engine has been equipped with a two-stage turbocharger manufactured by Hunan Tyen Machinery Co., Ltd. (TYEN, Hengyang, Hunan, China). Table 2 illustrates the major instruments and accuracy. An eddy current dynamometer, dSPACE platform, and high response rate sensors are used as the measurement system under typical 5 s transient operation, which measures and records experimental data parameters such as engine torque, speed, intake air, temperature, inlet and exhaust pressure, soot and NOX emissions, etc. Moreover, combustion characteristic parameters (CA10, CA50) are required through a DEWE-2010 combustion analyzer. Additionally, the cycle injected fuel quantity is calculated by the Bosch ECU. The response time of NOX sensor and opacimeter is within 1.5 s and 0.1 s, respectively.

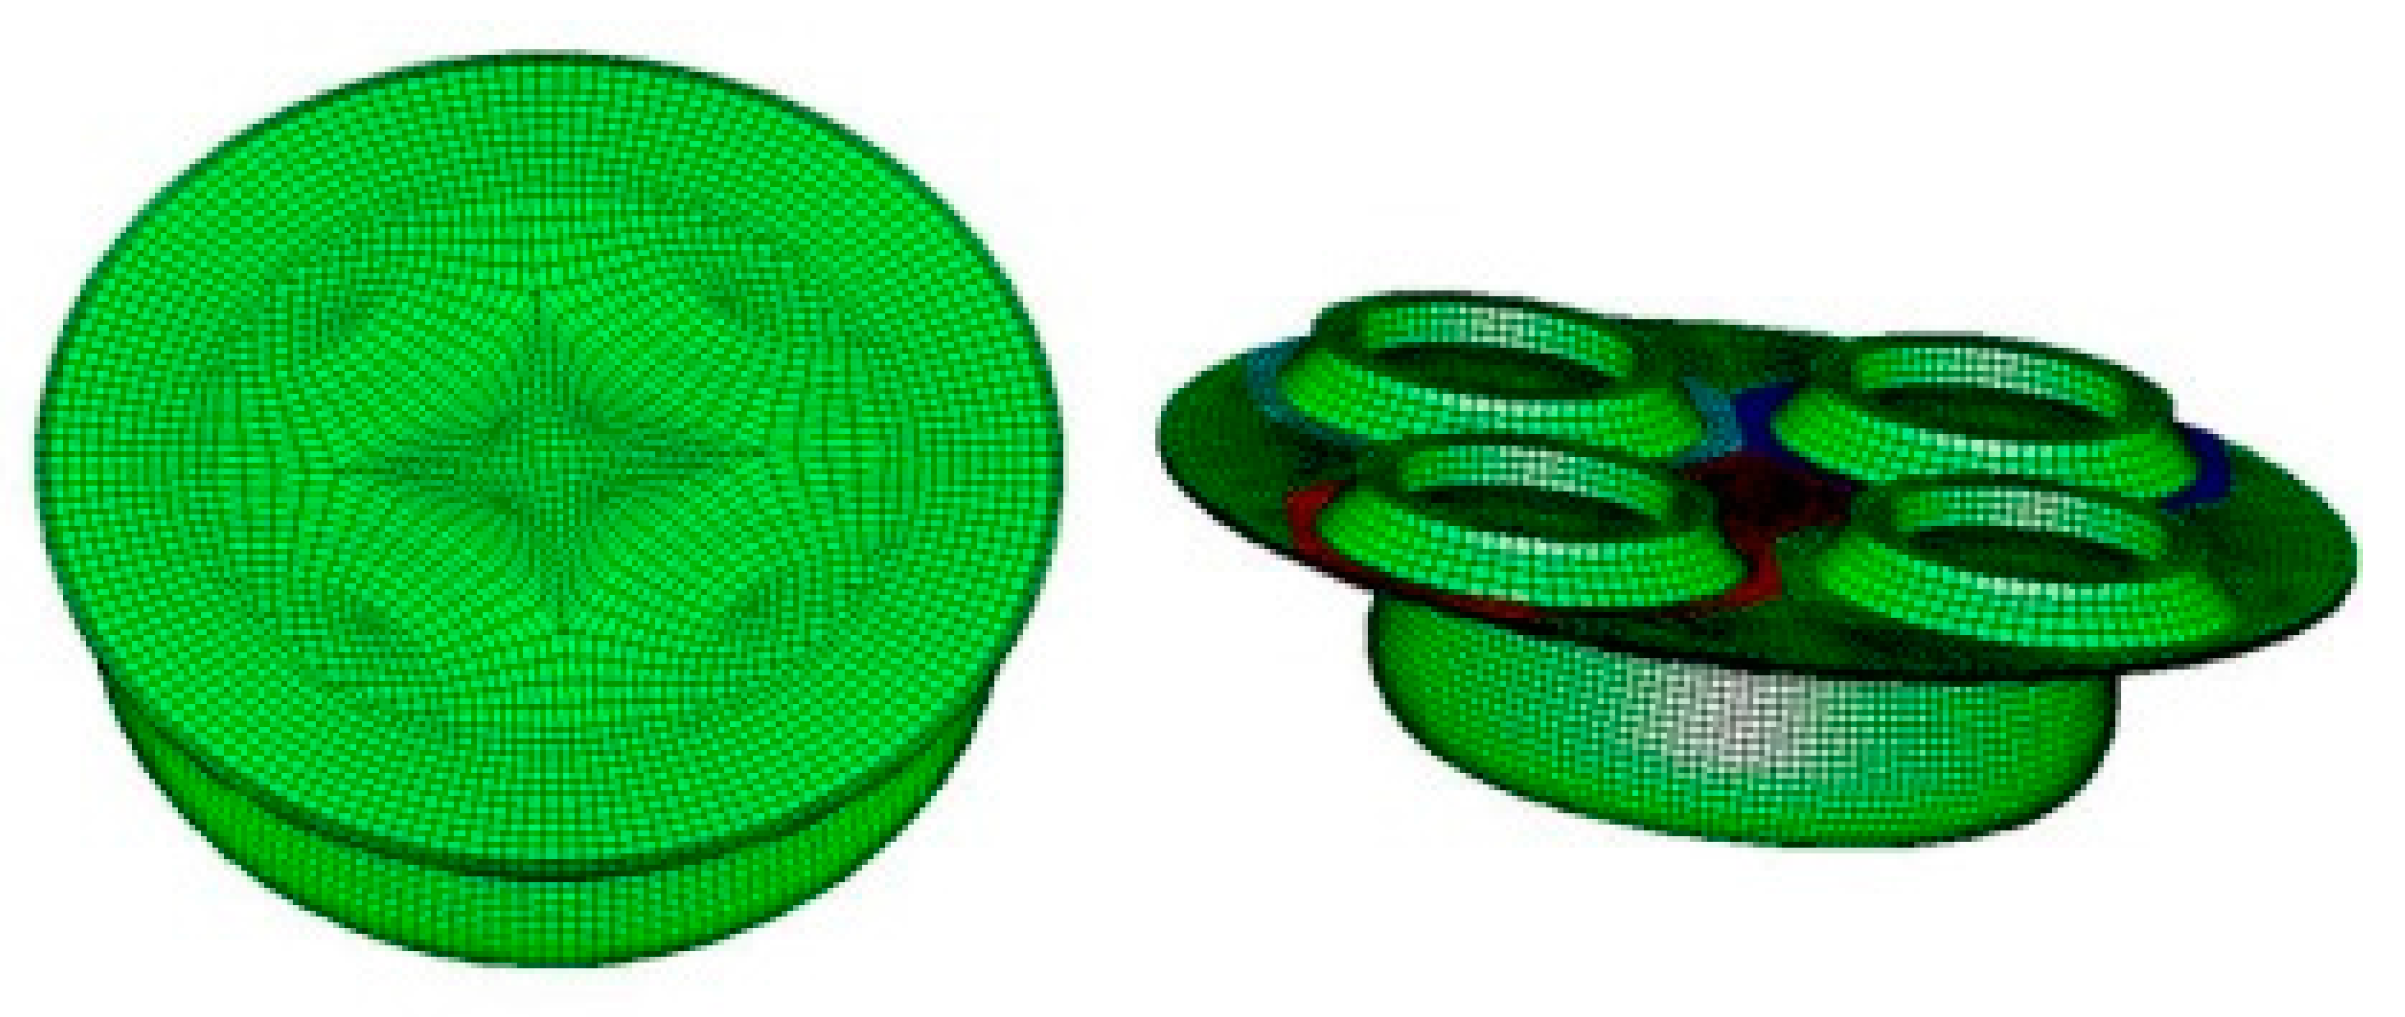
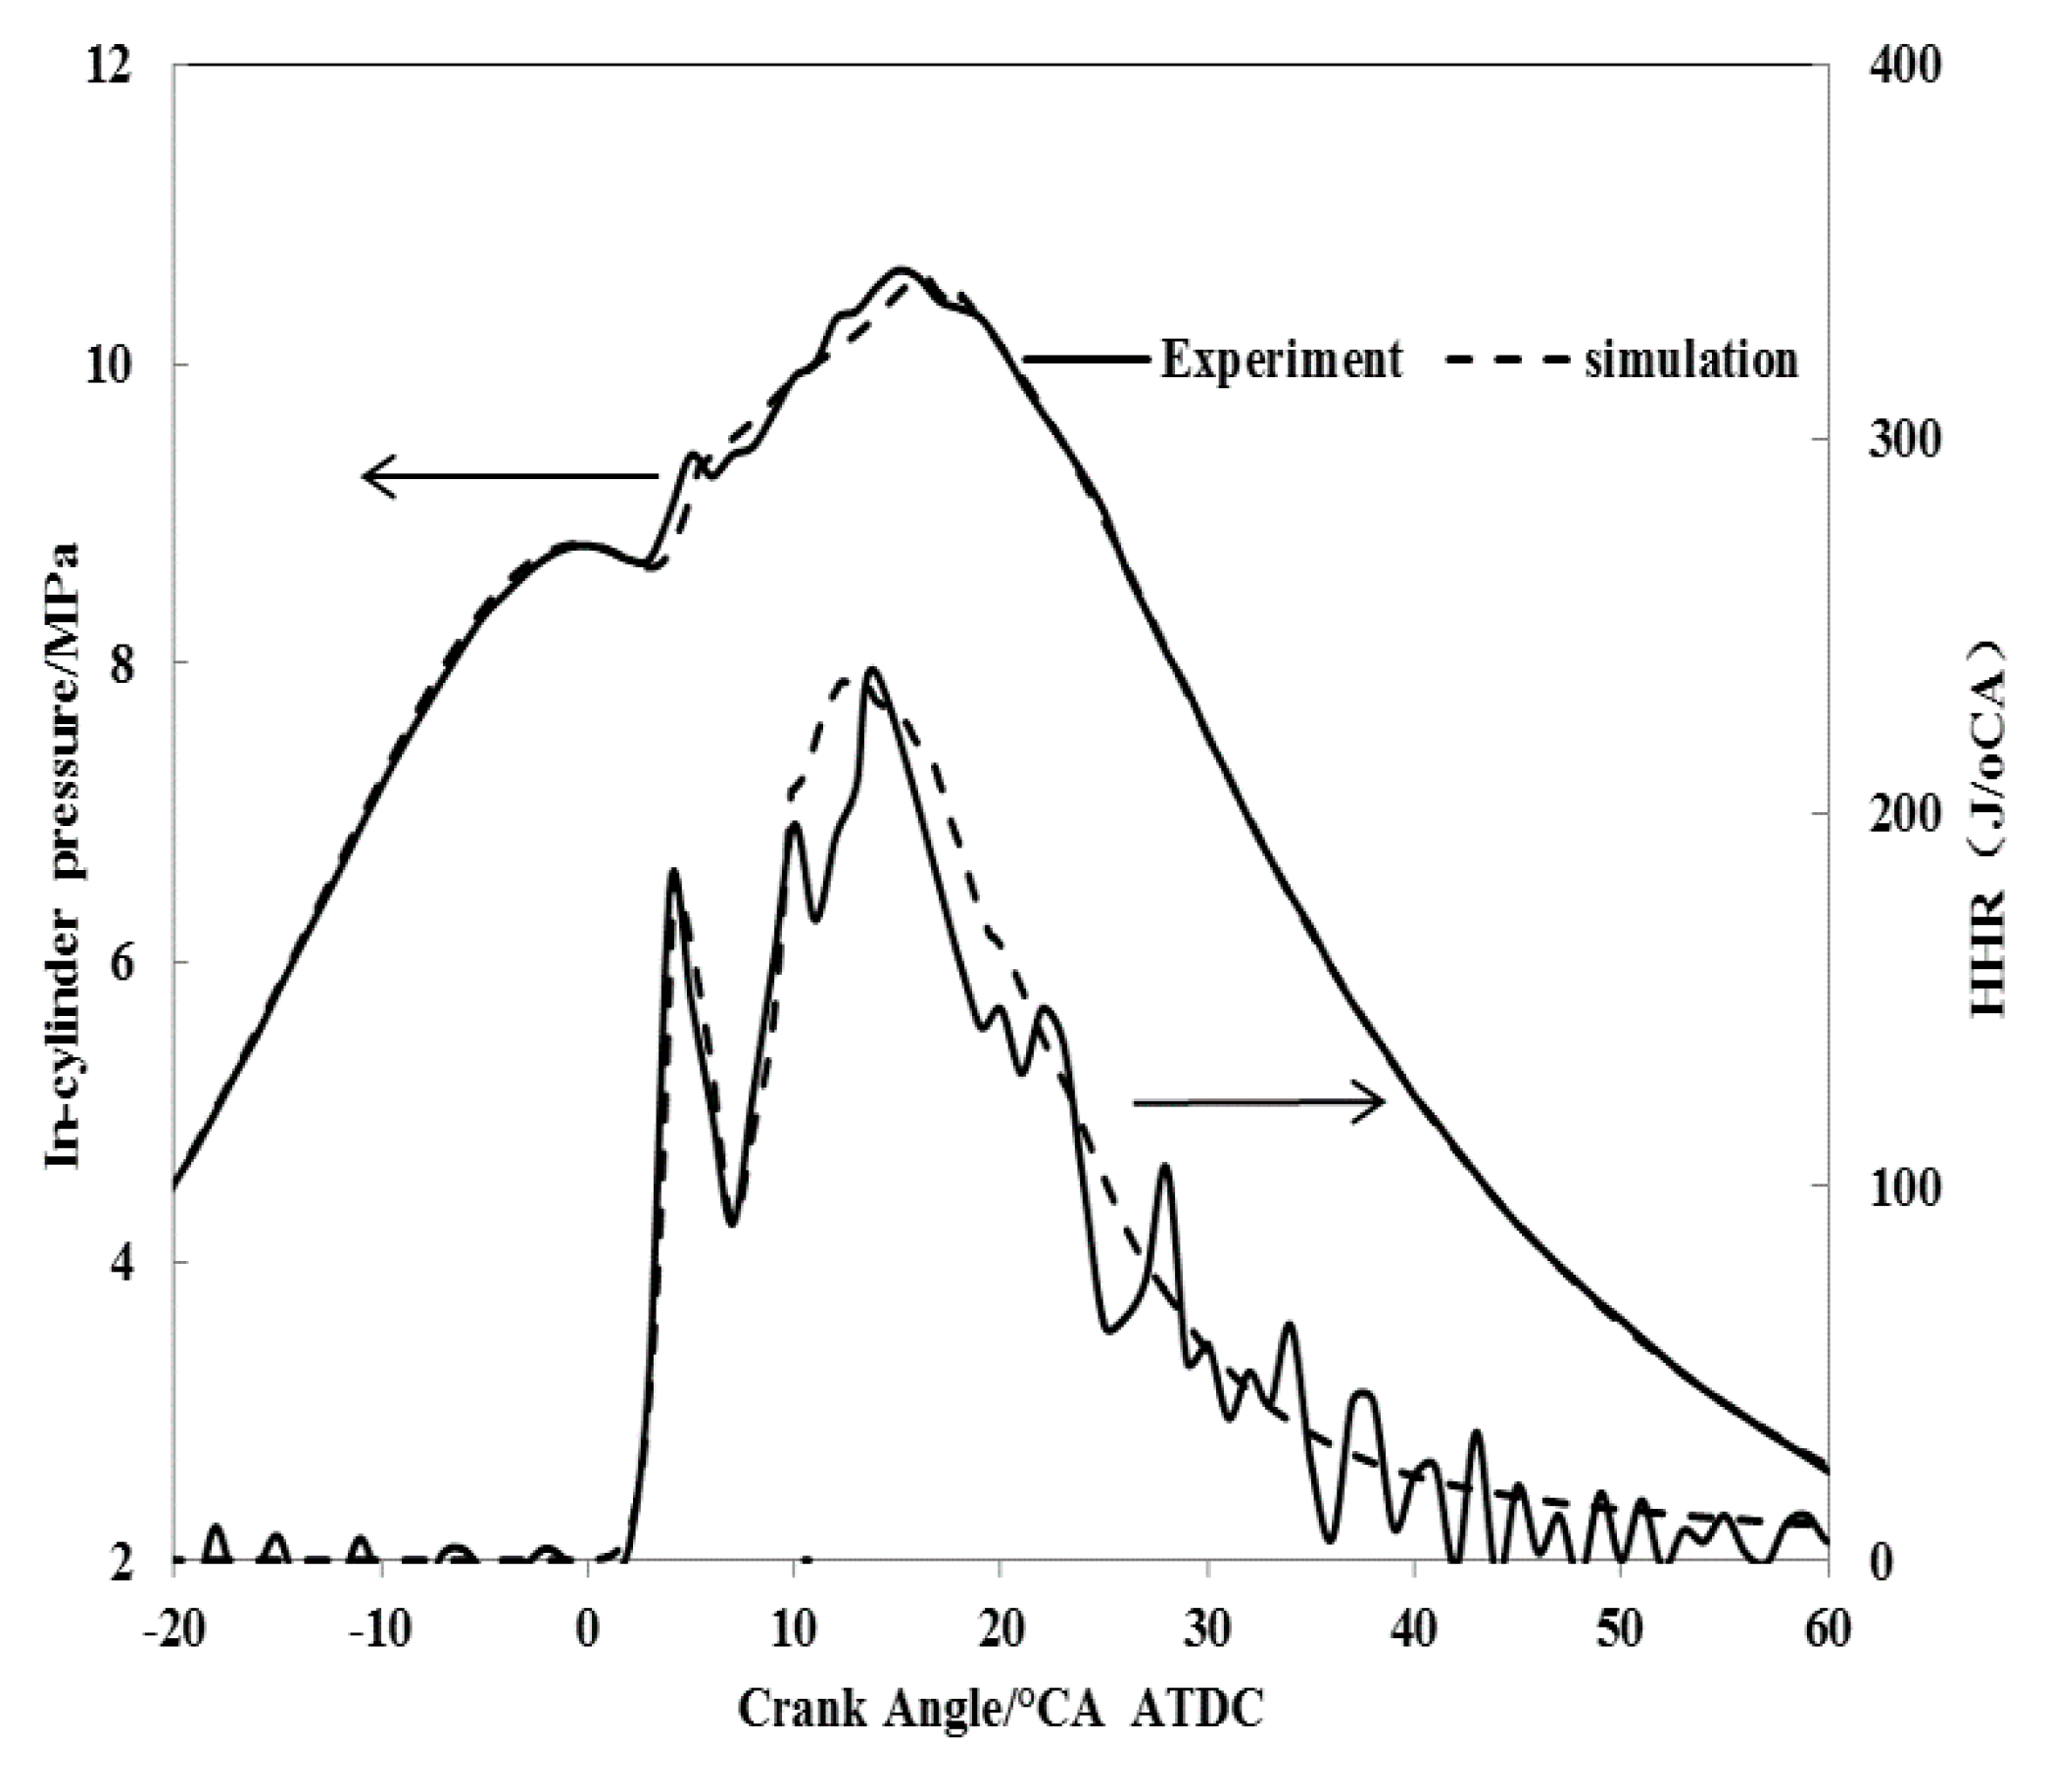
2.2. Simulation Model

The typical 5 s transient operation is considered as the accumulation of about 70 working cycles during a 5 s transition time. Thus, continuously transient experimental data can be transformed into some independent, cyclic test points. To further investigate the combustion and air-fuel mixing process, a simulation method can be employed to analyze the crucial working cycles during the transient conditions [27].
In the present study, simulations were computed by the Star-CD code 3.26. The computational grid of the tested engine is illustrated in Figure 2. Primary numerical models are provided in Table 3, such as eddy break-up and laminar-and-turbulent characteristic-time combustion model (EBU LATCT), Reitz and Diwakar Atomization model (Reitz/Diwakar), RNG k-ε turbulence model (k-Epsilon/RNG).
The simulation model is set up based on the tested engine, and proved reasonable by comparing the experimental and predicted results. Figure 3 illustrates the comparison of heat release rate (HRR) and in-cylinder pressure between the measured and simulated results on a CA6DL2-E35 diesel engine under the conditions of 1650 rpm, 50% load. The simulation values are in good agreement with the experimental results. The relative errors between experiment and simulation data are less than 5%, which is within the allowable range of engineering. It indicates that simulation model can be applied to research of the combustion and mixing process in the cylinder during transient operation.
The corresponding working cycle of the conditions at 1650 r/min and 50% load is achieved from transient process under different loading hold times and calculated by numerical simulation. This work defines the compression top dead center (TDC) as the zero crank angle, where the crank angle transforms from negative values into positive values. Besides the calculation range is from −30 °CA to 120 °CA after top dead center (ATDC).

2.3. Test Conditions

Before the transient conditions started, the diesel engine has run steadily for 5 s under 10% loads. On the basis of accelerator voltage signal produced by the Simulink program, the ECU can adjust the cycle injected fuel quantity. Then the test engine outputs the required torque. Additionally, the dynamometer works in constant speed and changing torque mode.
Table 4 demonstrates that the SSL strategy experiments are divided into two parts. Firstly, part one keeps the constant second-stage loading rate at 233.3 N·m/s, and changes the first-stage loading rate and loading hold time, as shown in Figure 4a. Part two keeps the constant first-stage loading rate at 700 N·m/s, and changes the second-stage loading rate and loading hold time, as provided in Figure 4b. Besides, the stagnation load is set at 50% load, and the loading hold time is the holding time at 50% load under transient conditions.

3. Results and Discussion

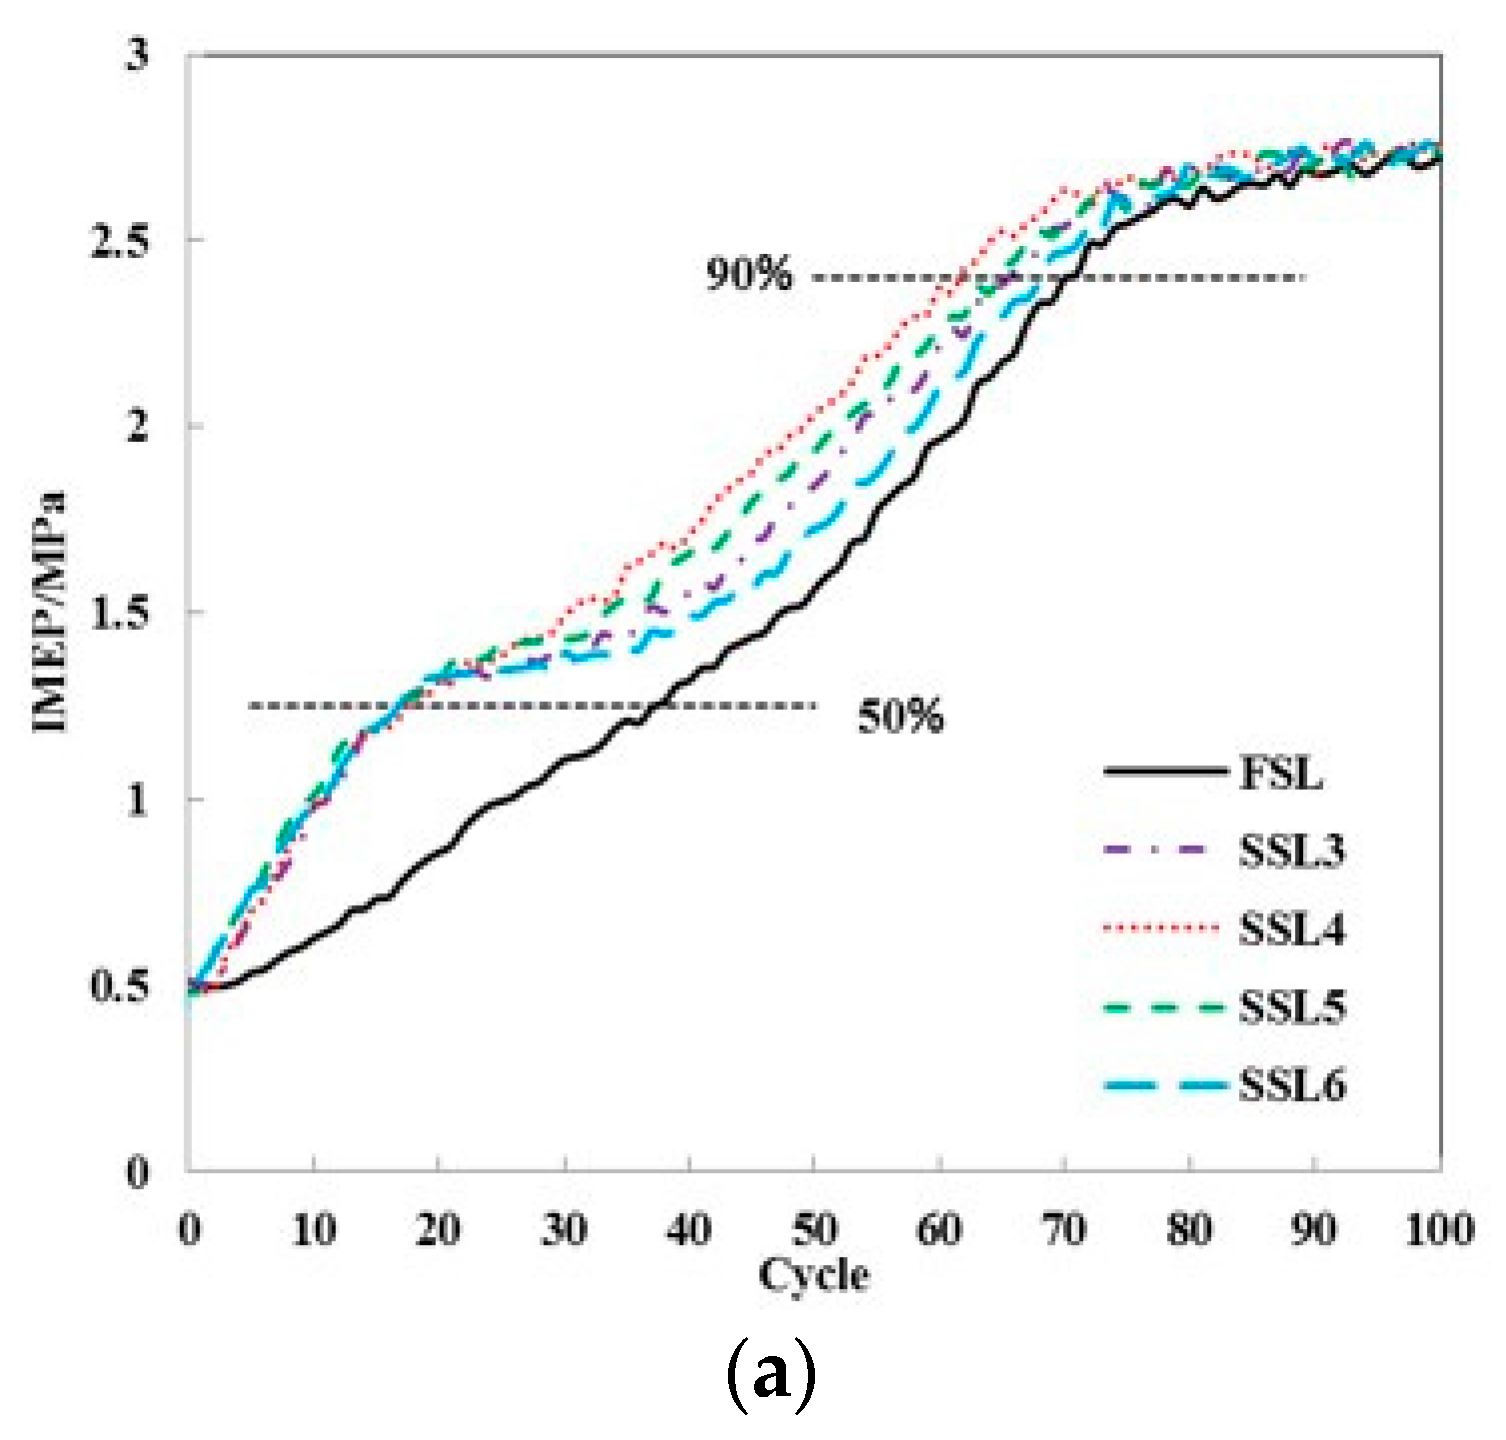
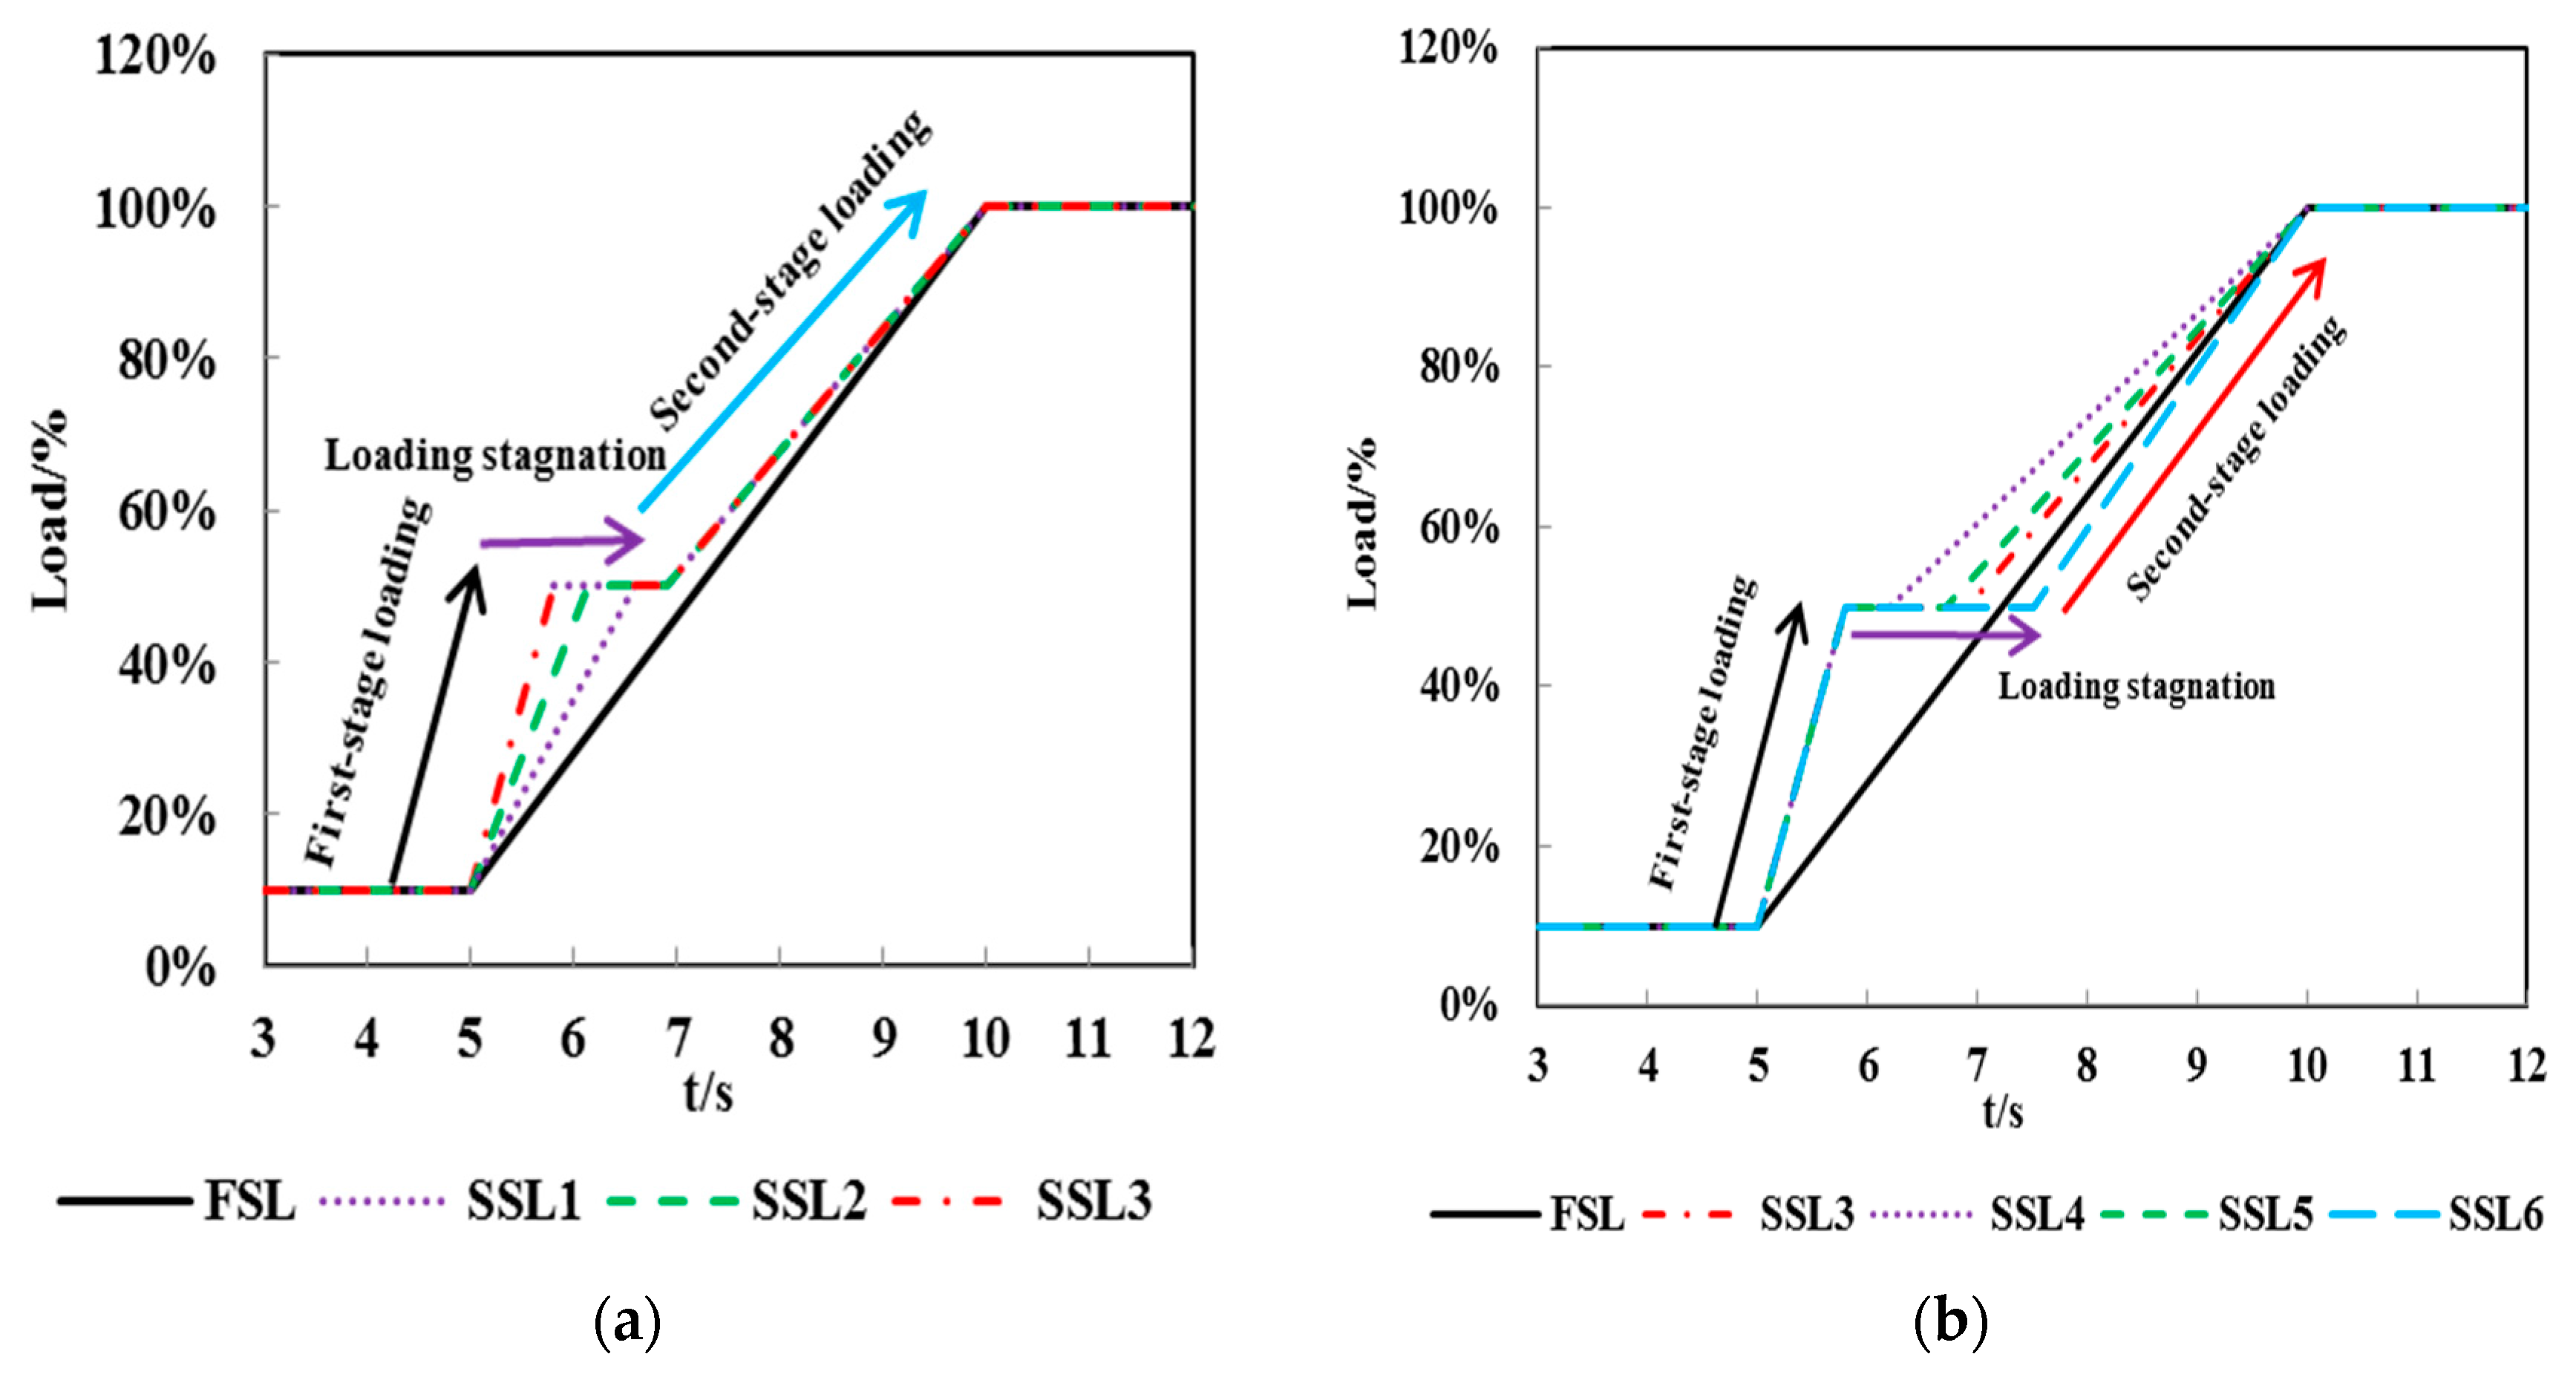
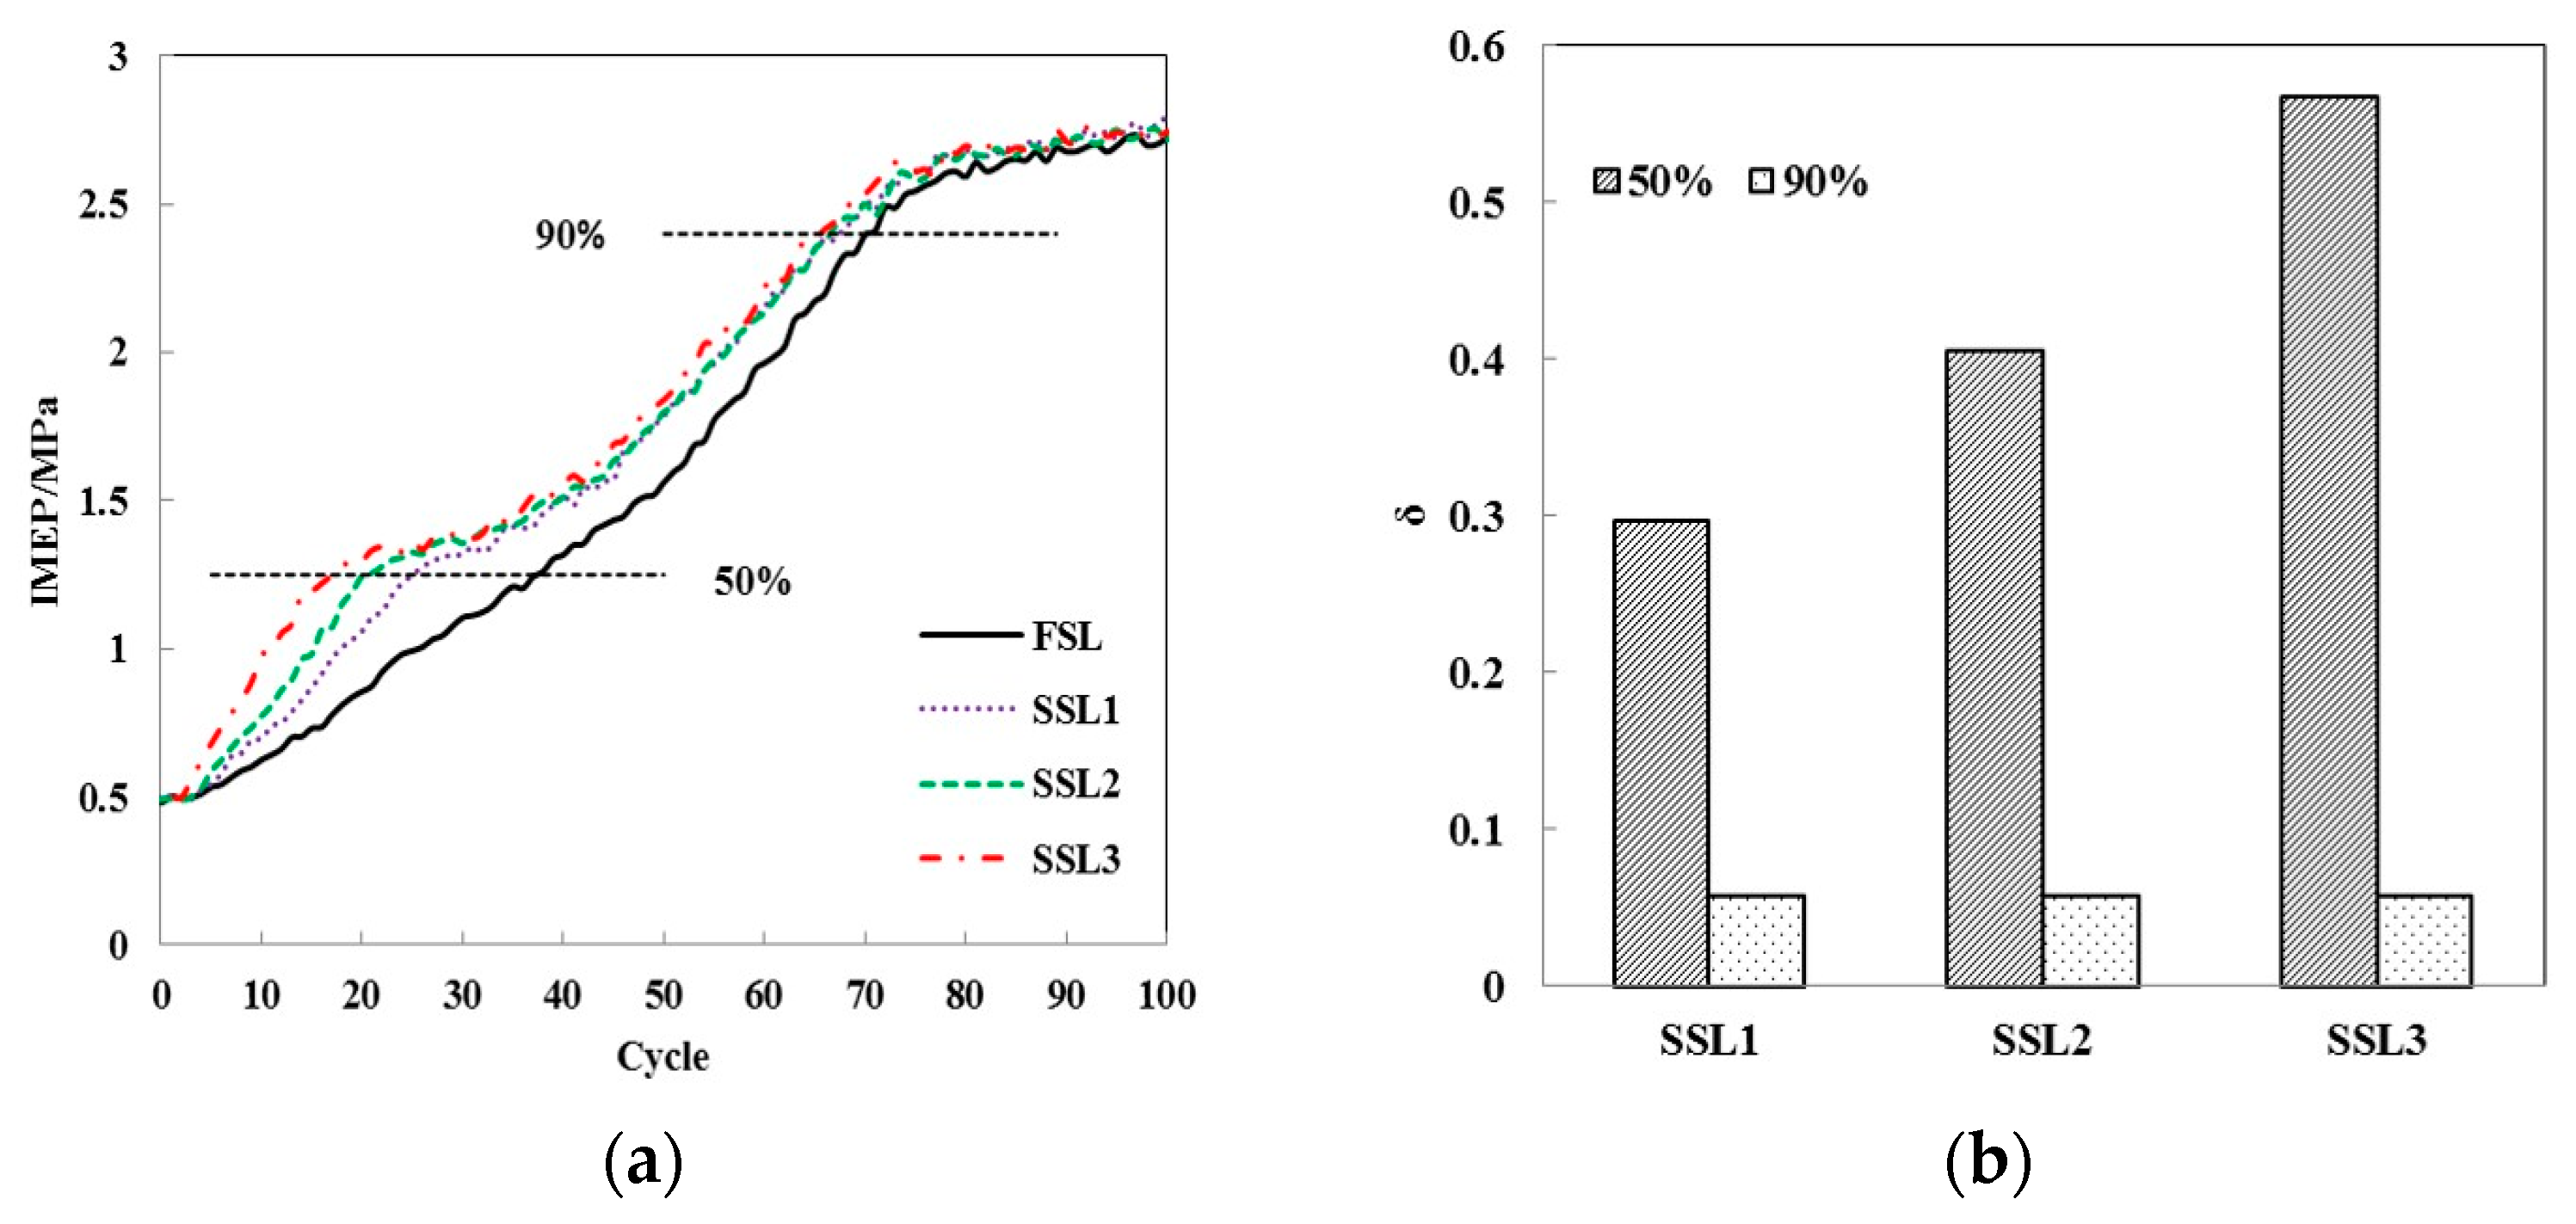
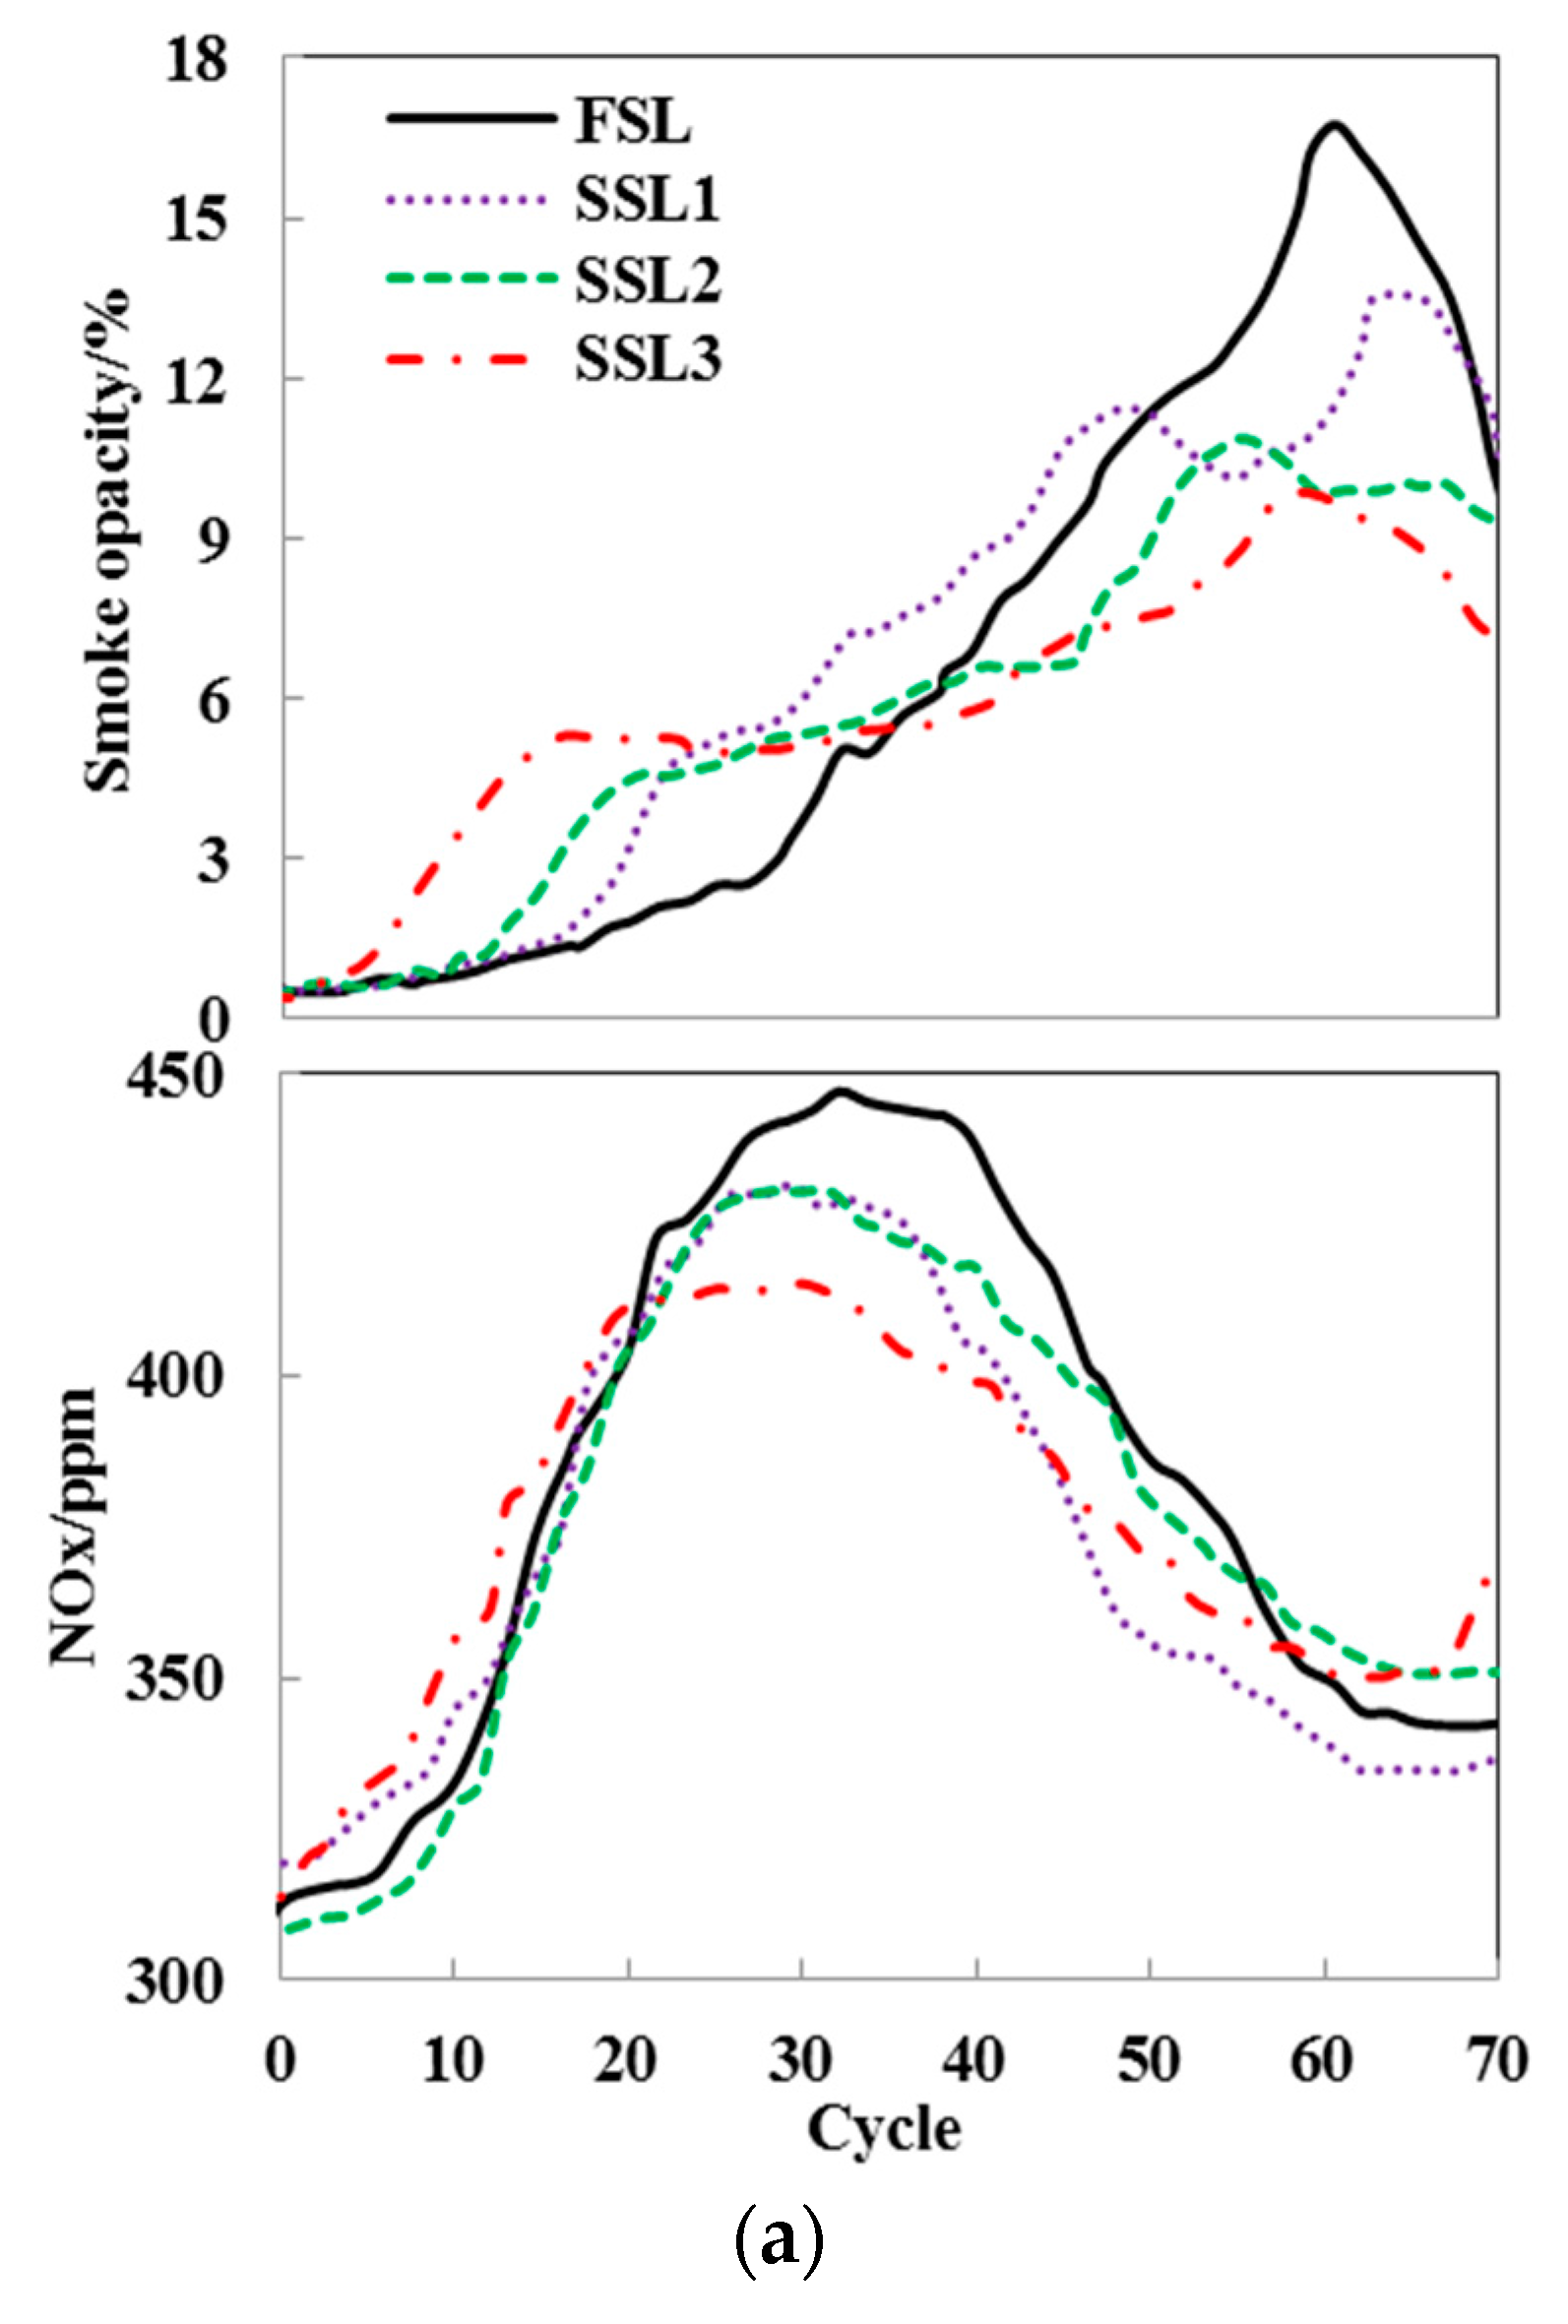
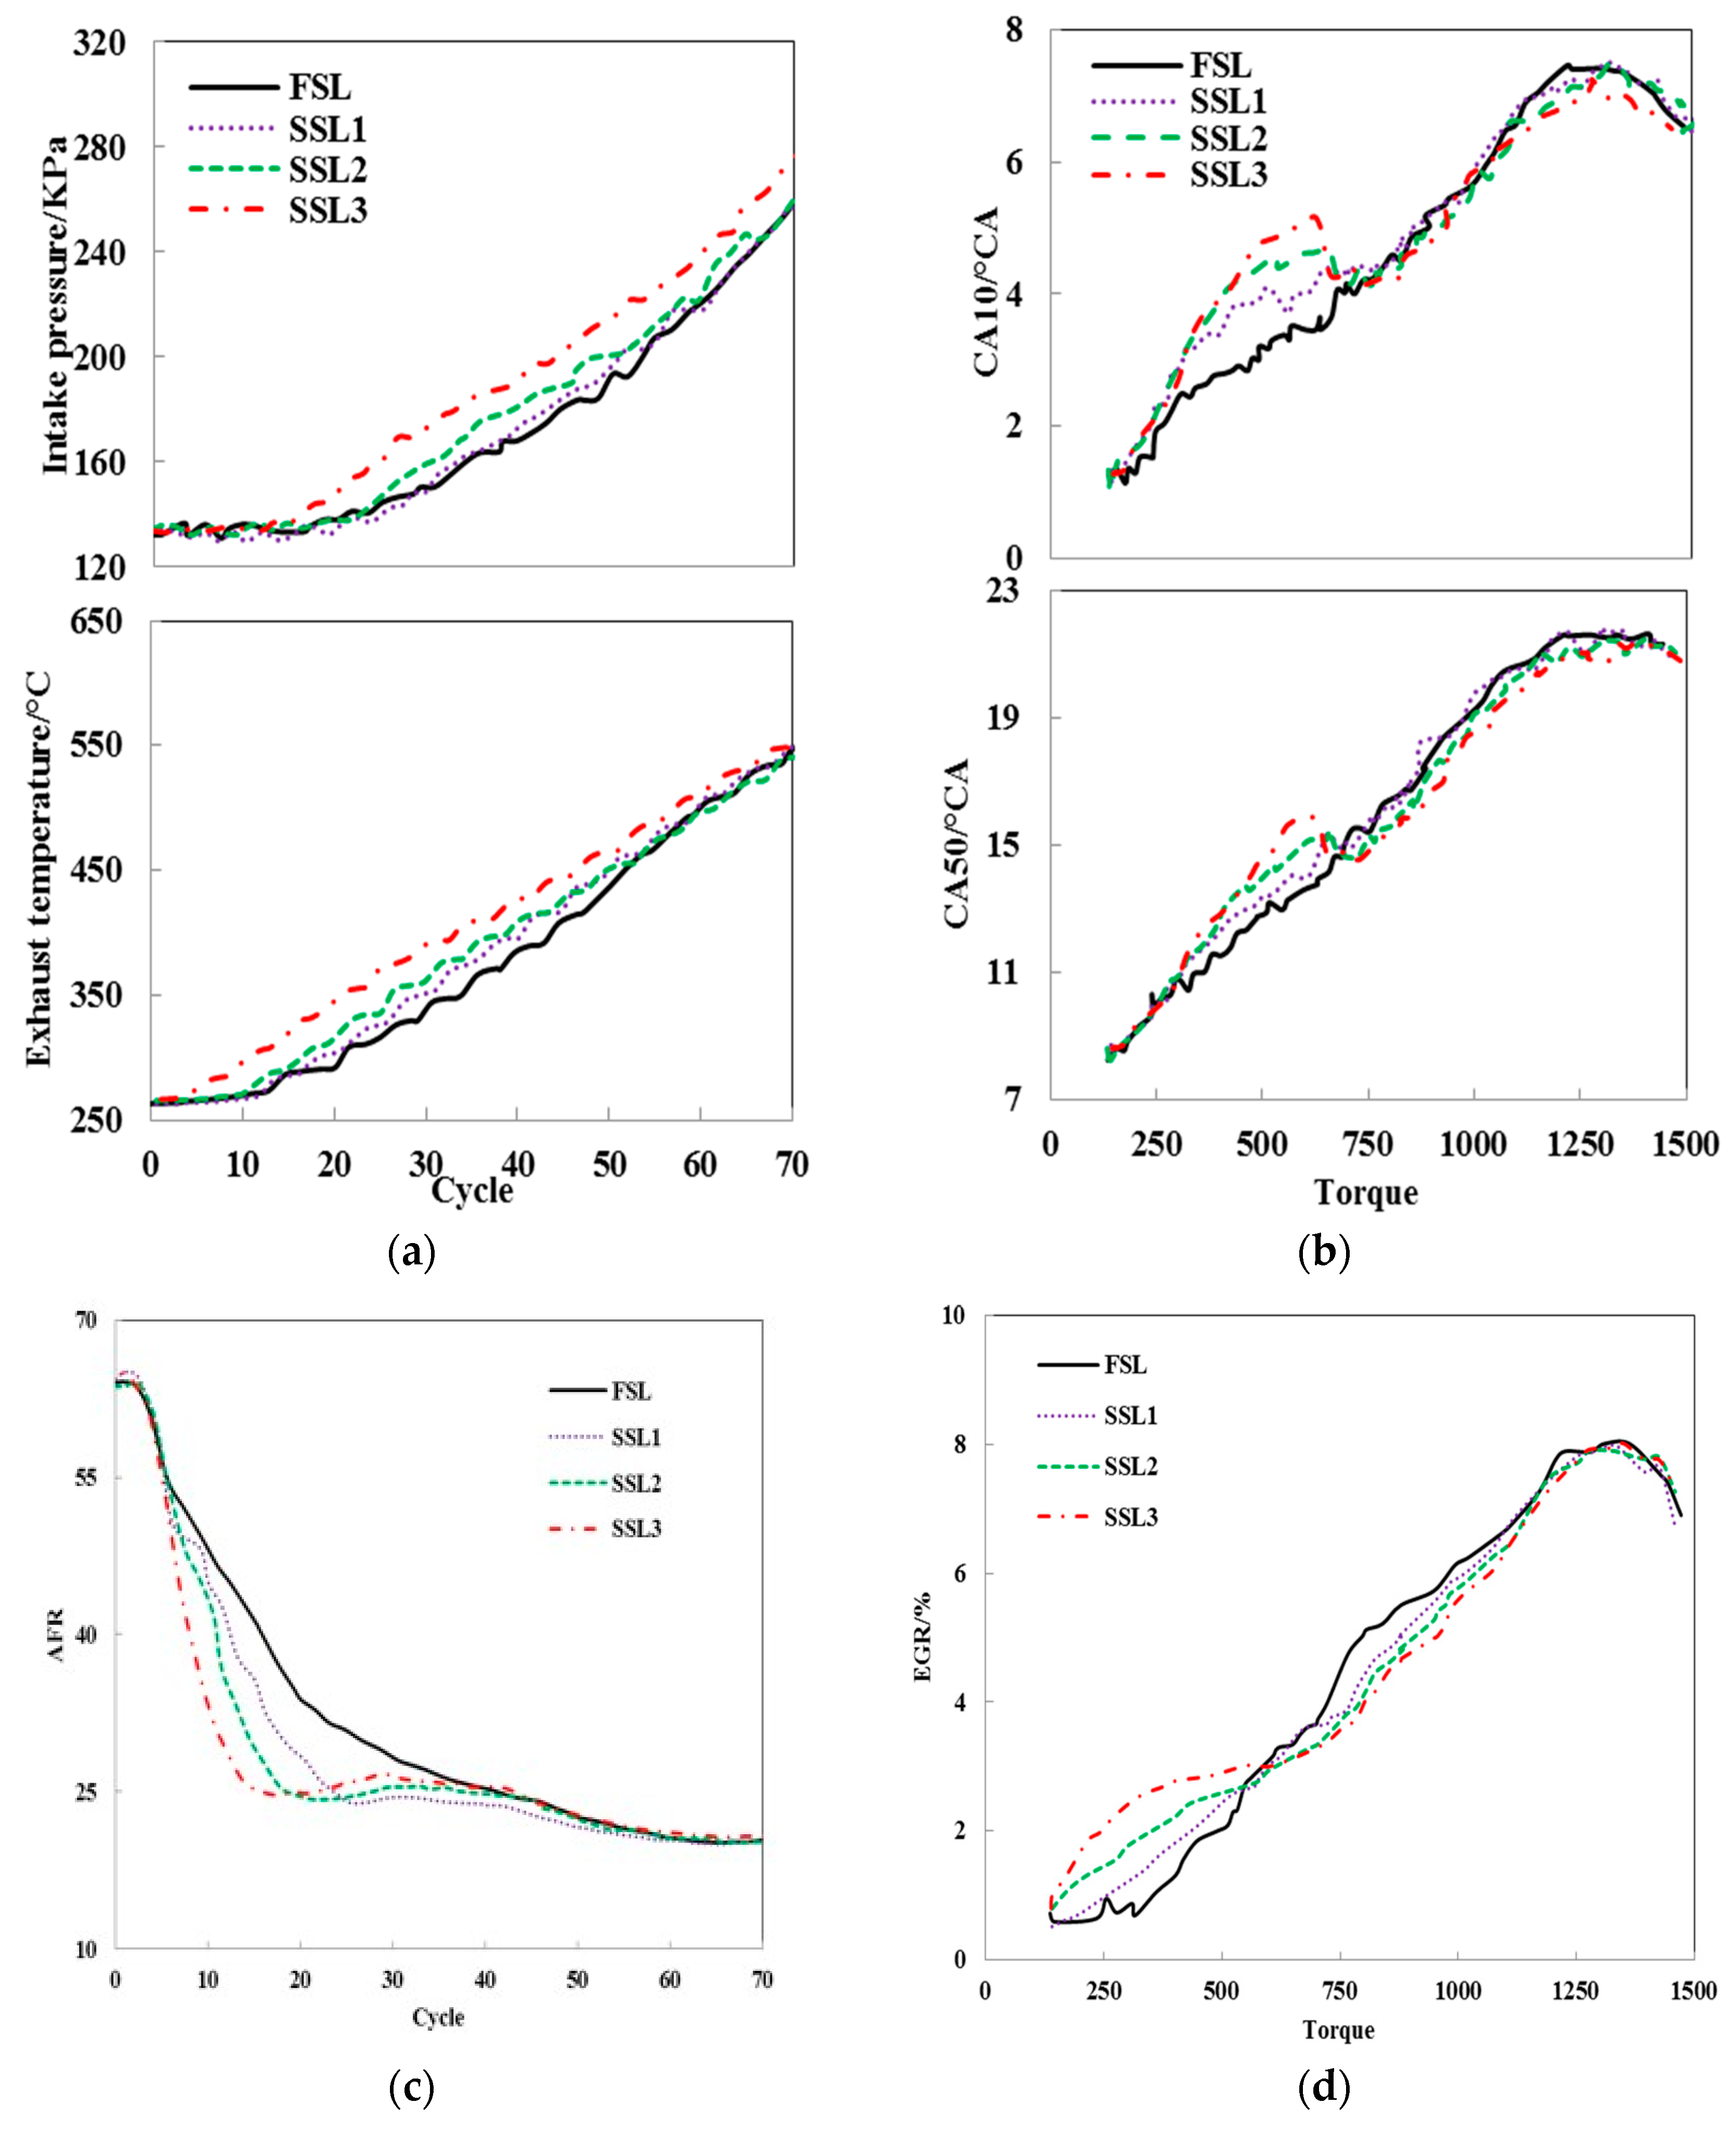
3.1. Influence of Different First-Stage Loading Rates and Loading Hold Times on Transient Performance

The air supply delay weakened the fuel evaporation, atomization and mixture process, which was the primary reason for combustion and emission deterioration under transient operations [23]. Thus, SSL strategies of holding for a certain time at 50% load can improve the poor thermal conditions and turbocharger lag. It is beneficial to optimize both the torque response and emissions performance.
The percentage of advancing the time of torque response for SSL strategies relative to the FSL strategy is defined by the torque response rate (δ). The larger the δ, the better the dynamical response performance. δ is expressed as follows:
δ = t f t s t f
where tf is the torque response time for FSL strategy, where ts is the torque response time for the SSL strategies. Due to the response delay of torque measurement and the short duration of the transient process, IMEP response at 50% and 90% loads is selected to indicate the torque response performance. As shown in Figure 5a, compared with the FSL strategy, all the SSL strategies can improve the torque response performance. Besides, the larger the first-stage loading rate, the shorter the torque response time of 50% load becomes. Figure 5b illustrates that the torque response rate (δ) of FSL 3 is 56.7% at 50% load, and 5.7% at 90% load, respectively. The results manifest that SSL strategies can increase torque response rate (δ) and shorten the transient response time.
The emissions performance of different loading strategies is plotted in Figure 6a. With the first-stage loading rate larger and the loading hold time longer, emissions of soot and NOX become lower. Compared with the FSL strategy, taking SSL 3 strategy reduces the smoke opacity and NOX peak by 41.3% (from 16.7% to 9.8%), and 7.3% (from 447 ppm to 414.4 ppm), respectively. Moreover, in Figure 6b, the accumulated emission levels of smoke are the smallest under the SSL 3 strategy, showing an 11% decrease compared with the FSL strategy.
As is shown in Figure 7a, under the larger first-stage loading rate, the SSL 3 strategy raises the intake pressure and exhaust temperature, which contributes to enhancing the work capacity and transient response performance of turbocharger. Thus, it can increase air flow and improve the in-cylinder thermal conditions under medium and large loads. However, more seriously the overshoot of EGR rate leads to deterioration of soot emissions under SSL strategies during the early stage of transient operation as seen in Figure 7d. Besides, the larger the first-stage loading rate, the faster the air-fuel ratio (AFR) deceleration rate (Figure 7c). It is inferred that the gas supply lags behind fuel supply more seriously during the first-stage loading period. Furthermore, with the loading stagnation time being relatively longer, AFR of the SSL 3 strategy is higher than SSL 1 and 2 during the loading hold period. It means that loading hold measures can effectively alleviate the lag between air and fuel supply, by maintaining a constant fuel supply quantity and increasing the air inflow at 50% loads. Afterwards, during the second-stage loading process, the overshoot of EGR rate and AFR deceleration rate of all the SSL strategies are less than that of the FSL strategy (Figure 7c,d). The reason is that the faster speed of the turbocharger brings about a shorter gas supply response time, and the smaller second-stage loading rate slows down the fuel supply rate. Consequently, the improving quality of air-fuel mixture formation significantly decreases smoke emissions during the later stages of the transient process.
The larger the first-stage loading rate, the more the injected fuel quantity in a cycle, but the more intensive air-supply delay results in a worsening air-fuel mixture and prolonged premixed combustion duration. Eventually, it leads to farther deviation of the CA10 and CA50 from the TDC at small and medium loads (Figure 7b). However, during the second-stage loading process, the CA10 and CA50 of SSL 2 and 3 strategies are closer to the TDC than that of the FSL strategy. This is due to the following factors: firstly, under medium and large loads, the intake pressure increases as the turbocharger speed rises higher. This enhances the turbulent kinetic energy in the cylinder and promotes air-fuel mixing. Secondly, the longer loading hold time can produce a higher combustion temperature, maintain a better combustion thermo-atmosphere, and accelerate the diffusion combustion rate. In summary, the SSL 3 strategy can improve transient emissions performance, thanks to an increasing combustion rate and advanced combustion phasing (CA10 and CA50) during the later stages of transient processes.

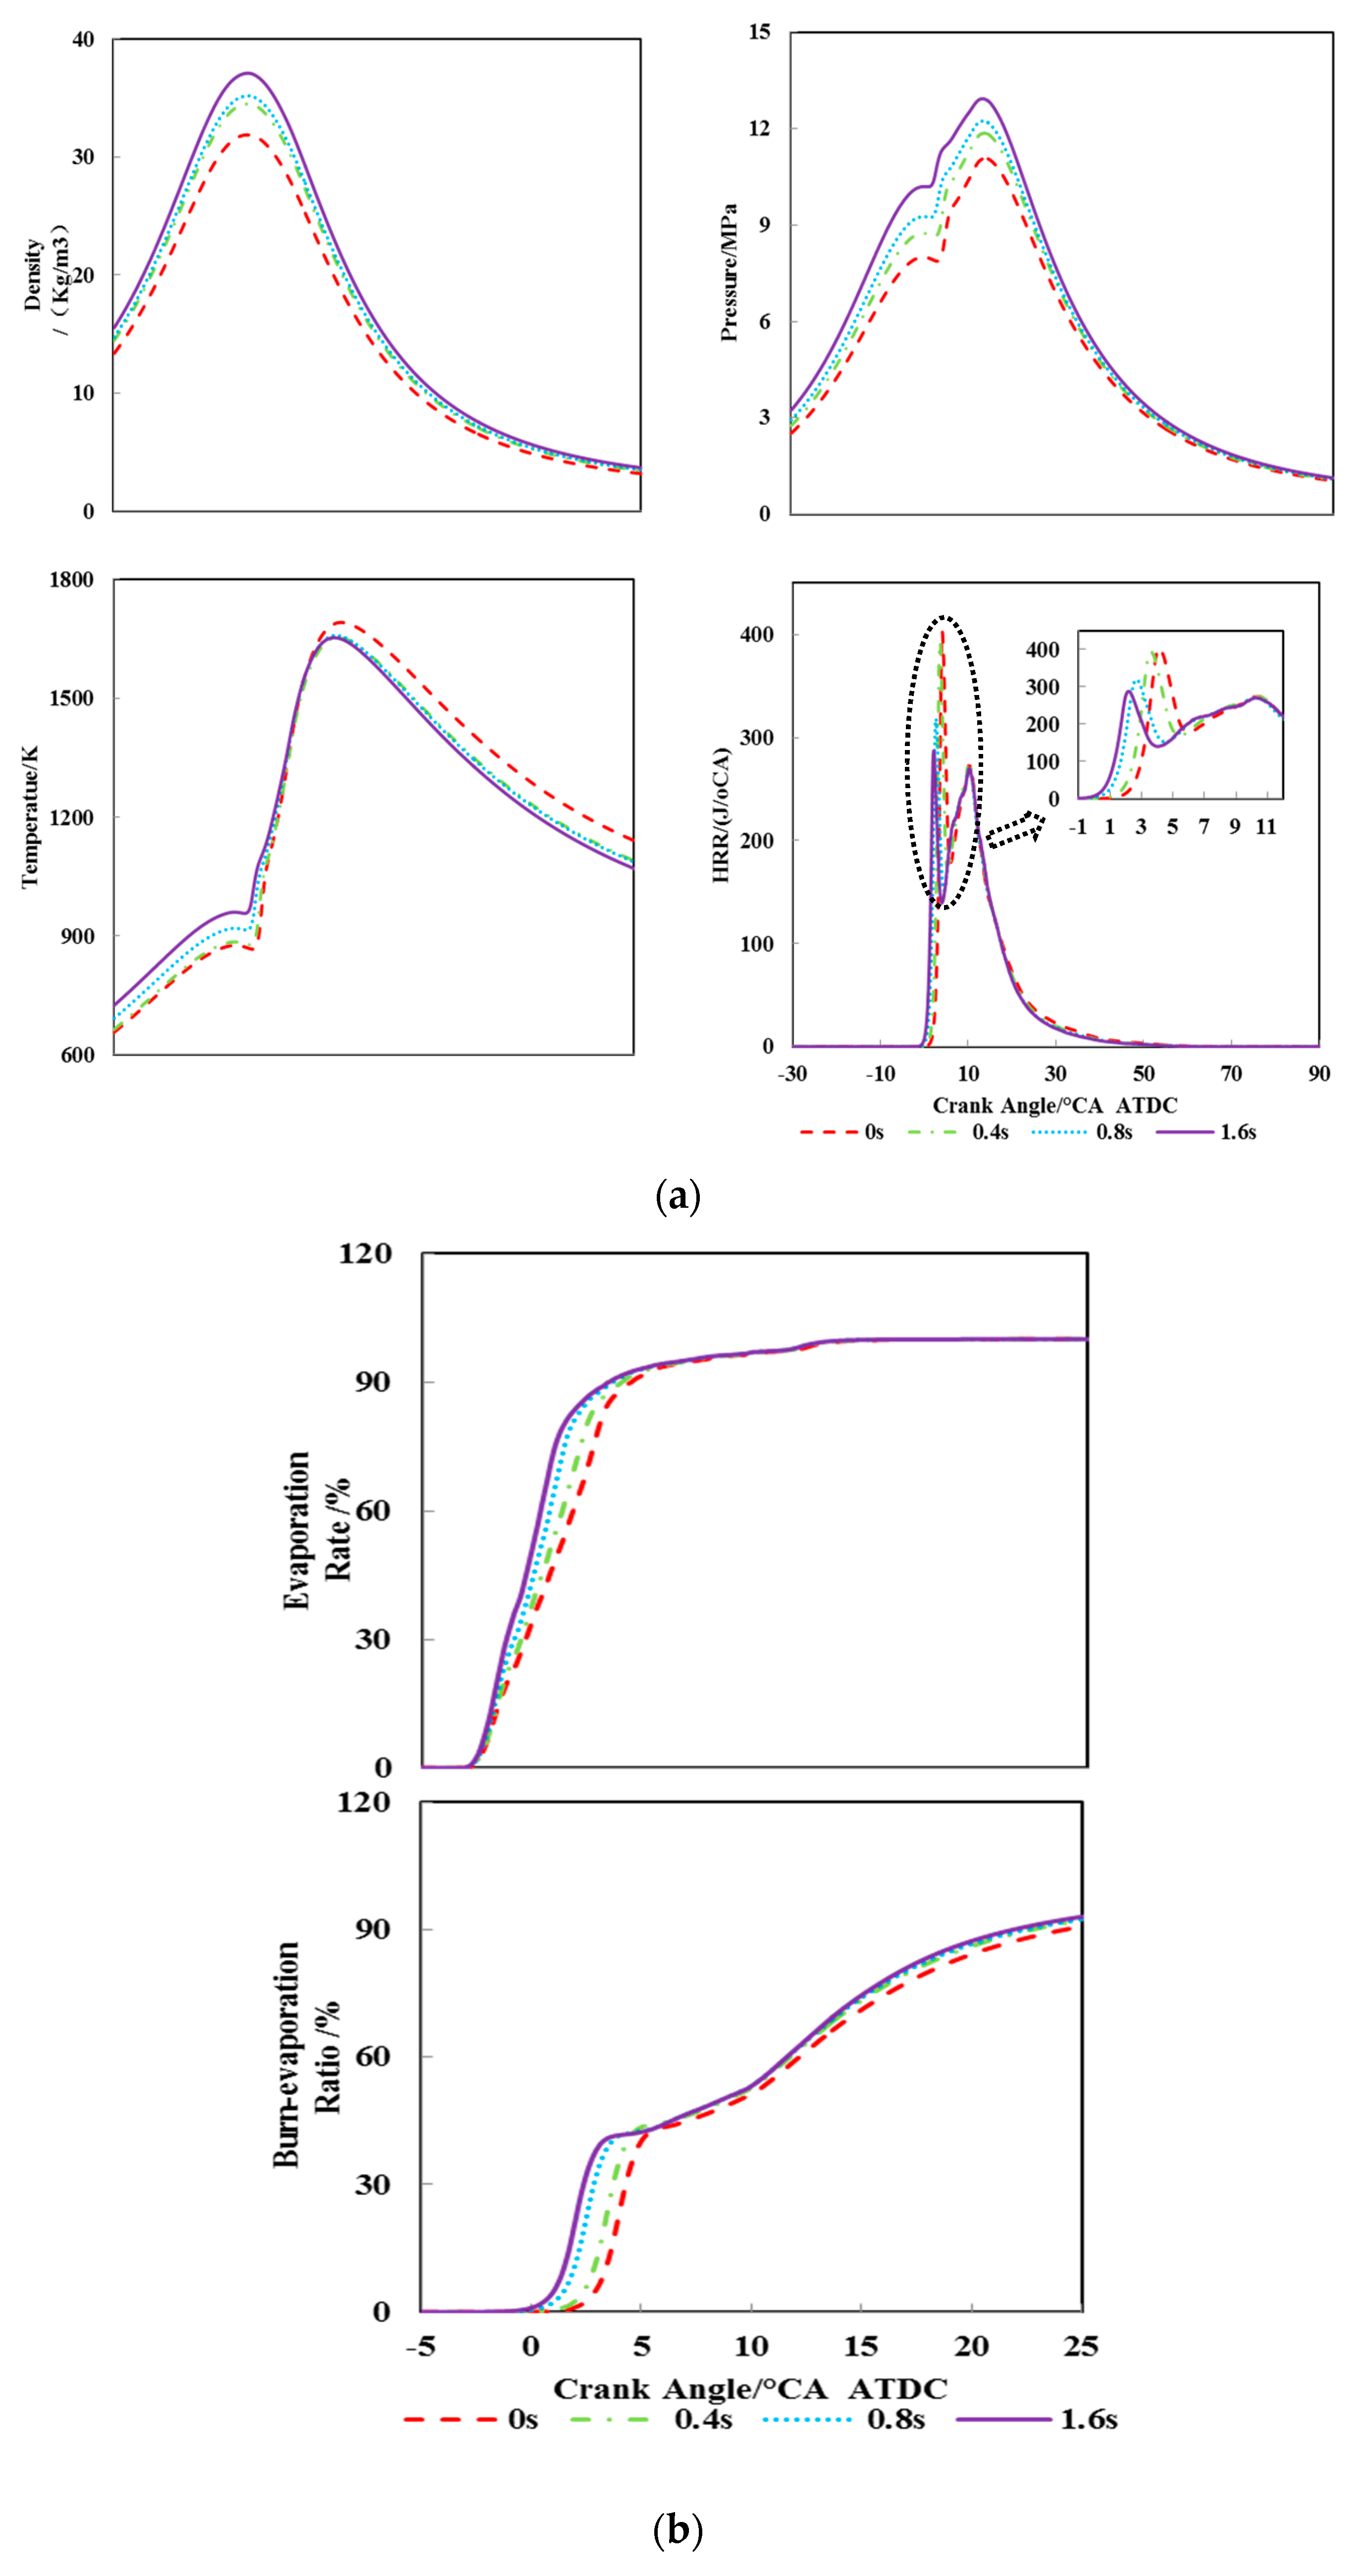
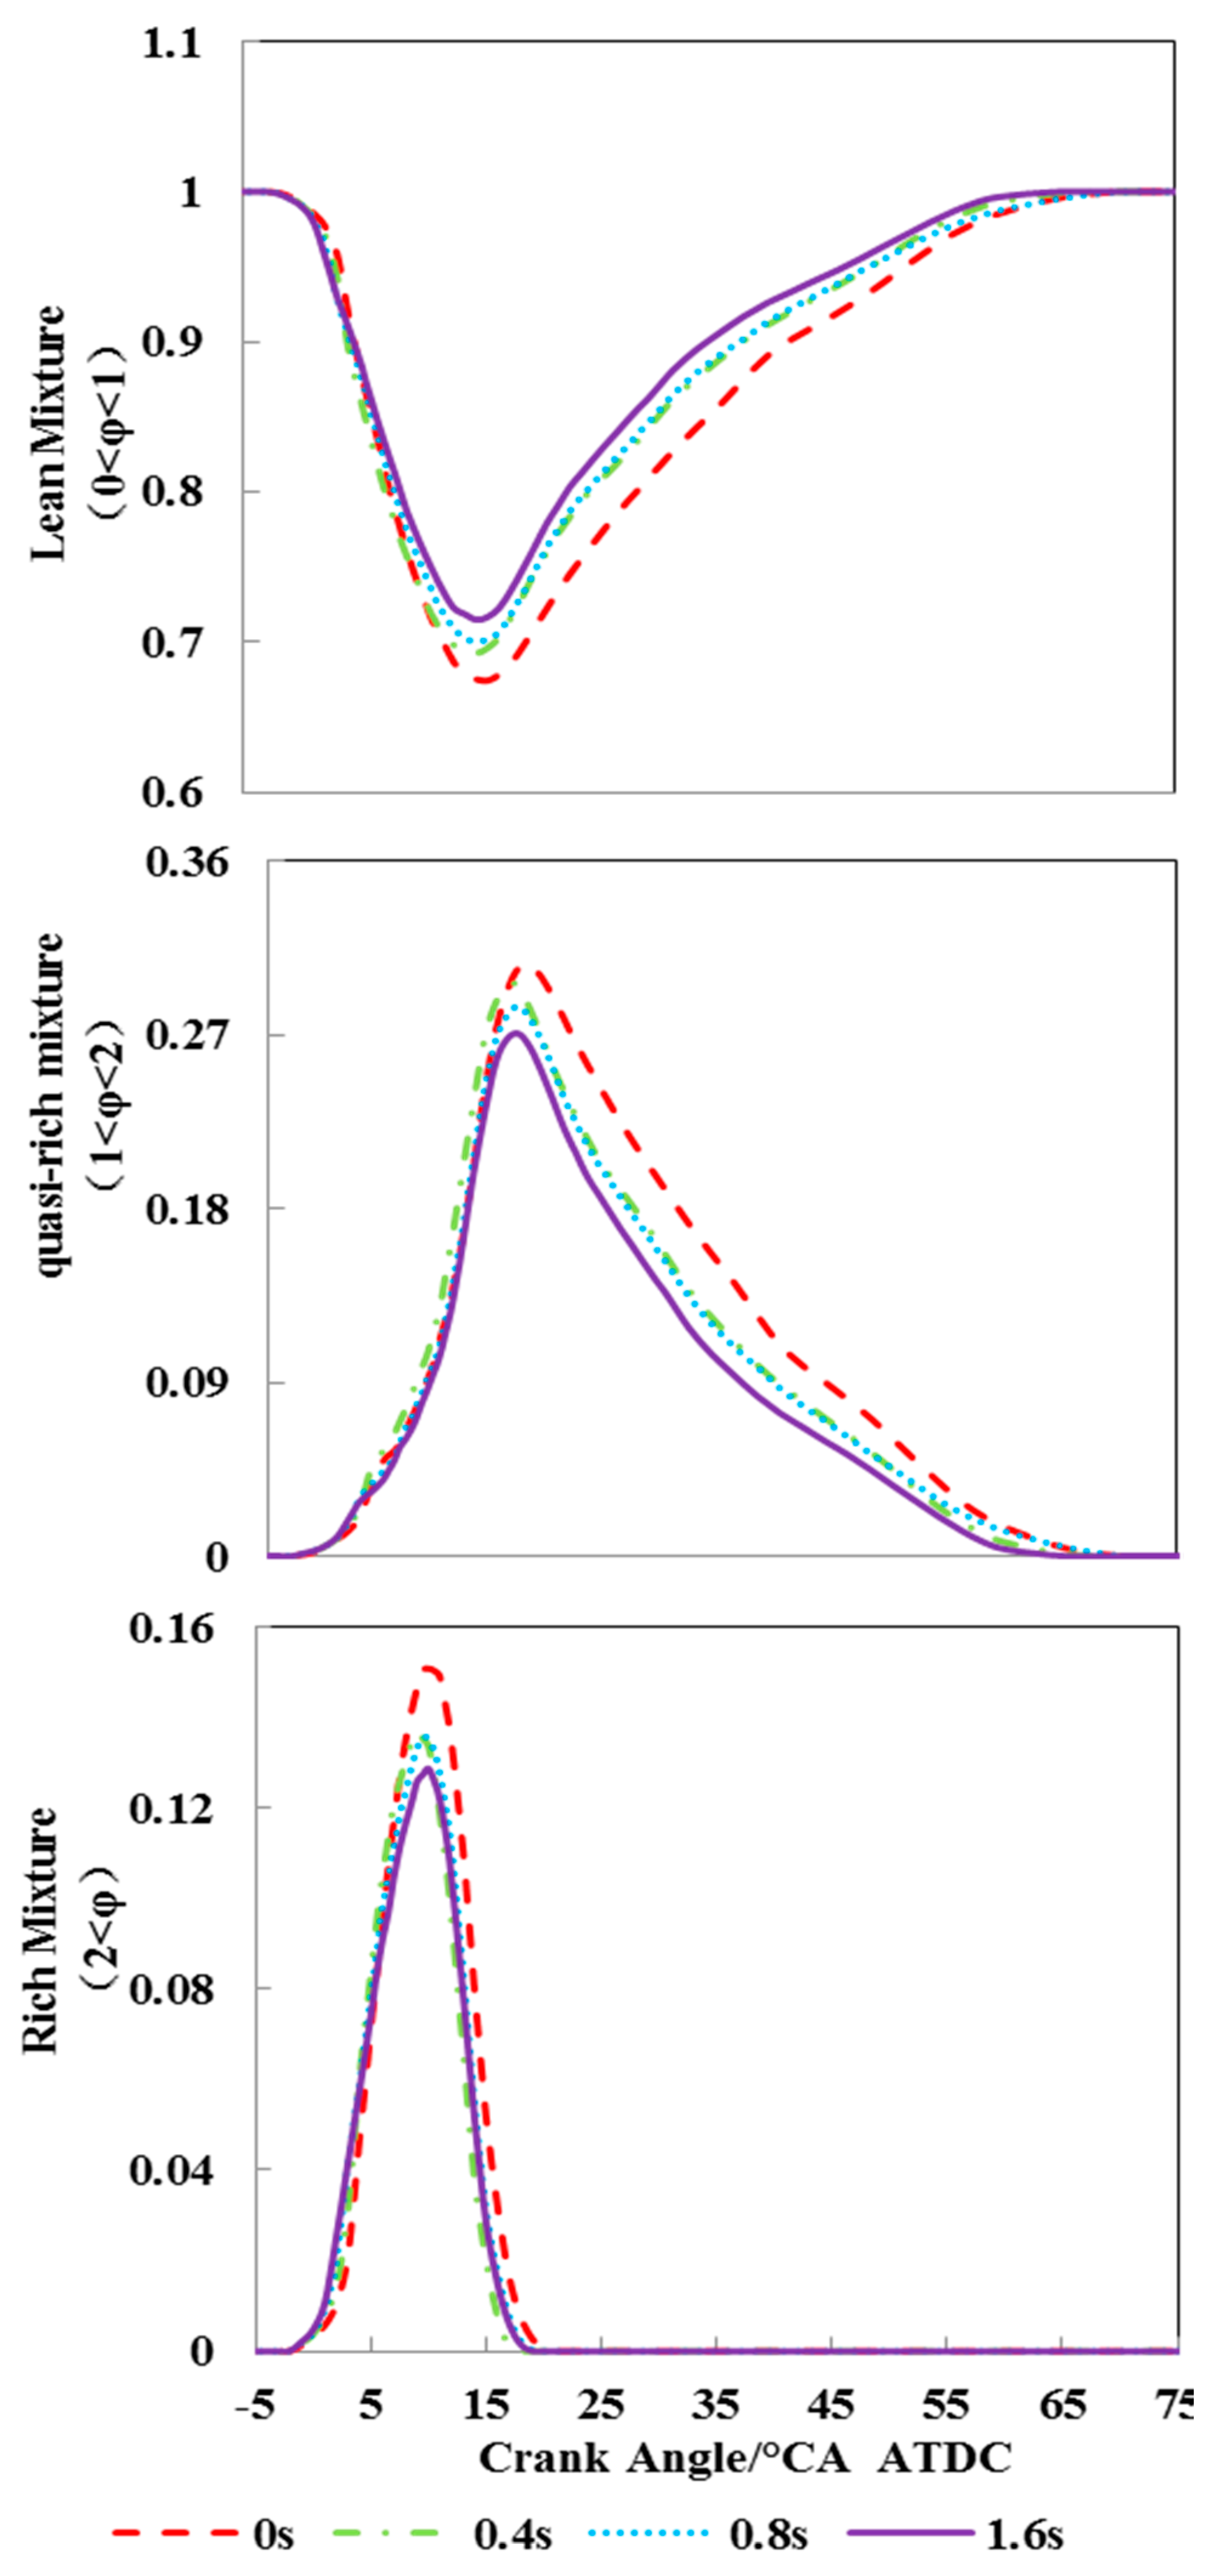
3.2. Simulation Analysis of Loading Hold Time on Transient Performance

As is concluded according to the experiment, the loading hold time could alleviate the degree of mis-match between the air and fuel supply, and improve in-cylinder thermal conditions. Thus, the essential reason for effects of loading hold time on the transient performance should be further studied by numerical simulation. The simulated operating point is shown in Table 5.
Figure 8a shows the effects of loading hold time on the combustion process in the cylinder. With the longer loading hold time, the in-cylinder pressure, charge density, and average temperature before ignition increase gradually. Because prolonging the loading hold time can increase working medium density and improve thermal conditions, it significantly promotes atomization, evaporation and mixing rate of the fuel and gas (Figure 8b). Besides, amount of premixed mixture and ignition delay period decrease during the combustion process. Hence, these results contribute to the decline of the first peak values of heat release rate (HRR) and the start of combustion closer to TDC.
Aiming at clearly analyzing the mixture in the cylinder, the equivalence ratio is divided into three different categories: rich mixture (φ > 2), quasi-rich mixture (1 < φ < 2) and lean mixture (0 < φ < 1) [23]. Figure 9 illustrates that, compared with FSL strategy, the cell proportion of quasi-rich mixture (1 < φ < 2) and rich mixture (φ > 2) reduces by 13.3% and 20%, respectively, at 1.6 s loading hold time. However, the proportion of lean mixture (0 < φ < 1) increases by 6.1%, which gradually has a major role in the combustion process. Hence, a longer loading hold time is beneficial to the complete combustion of the mixture and oxidation of soot, by effectively increasing the proportion of lean mixture and improving the quality of air-fuel mixture formation.
Table 6 shows the comparison of φ-T MAP for different loading hold times. The combustion reaction groups at 4 °CA ATDC earlier enter into the soot and NOX generation zone at 1.6 s loading hold time, thanks to the higher in-cylinder temperature and better thermo-atmosphere. Besides, at 8 °CA ATDC, the operating point 4 (1.6 s) approaches to NOX generation zone more deeply, which is responsible for the increase of NOX emissions. In addition, only the operating point 1 (0 s) is not completely out of the soot generation zone at 16 °CA ATDC. Therefore, with a longer loading hold time, combustion reactive groups enter into the soot generation zone with shorter dwelling time and smaller volume ratio in φ-T MAP. This contributes to decreasing the proportion of rich mixture and quasi-rich mixture, besides improving soot emissions. In conclusion, the loading hold can increase the air-fuel mixing energy, improve the quality of the air-fuel mixture formation, and reduce the proportion of rich mixture in the cylinder. Thus, SSL strategies can be the crucial applied means to improve the transient performance under transient conditions.

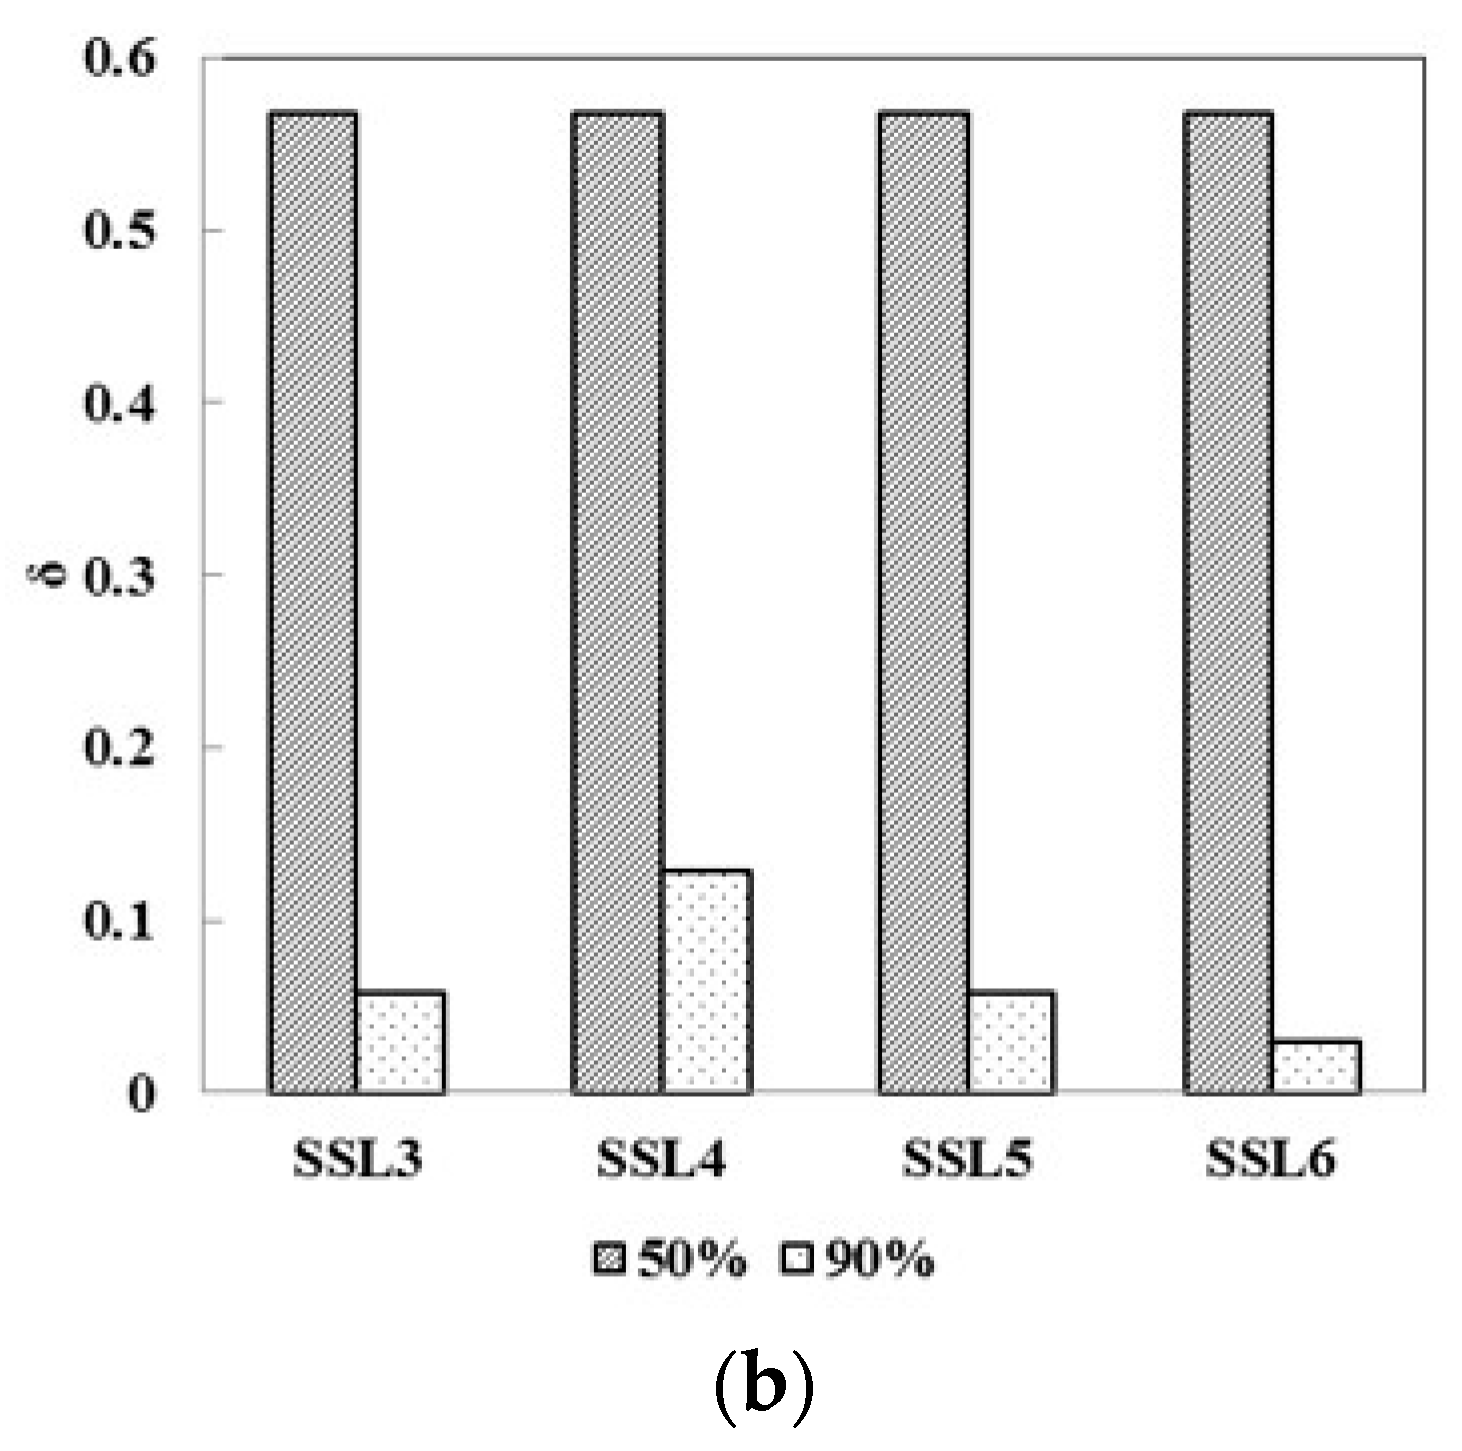
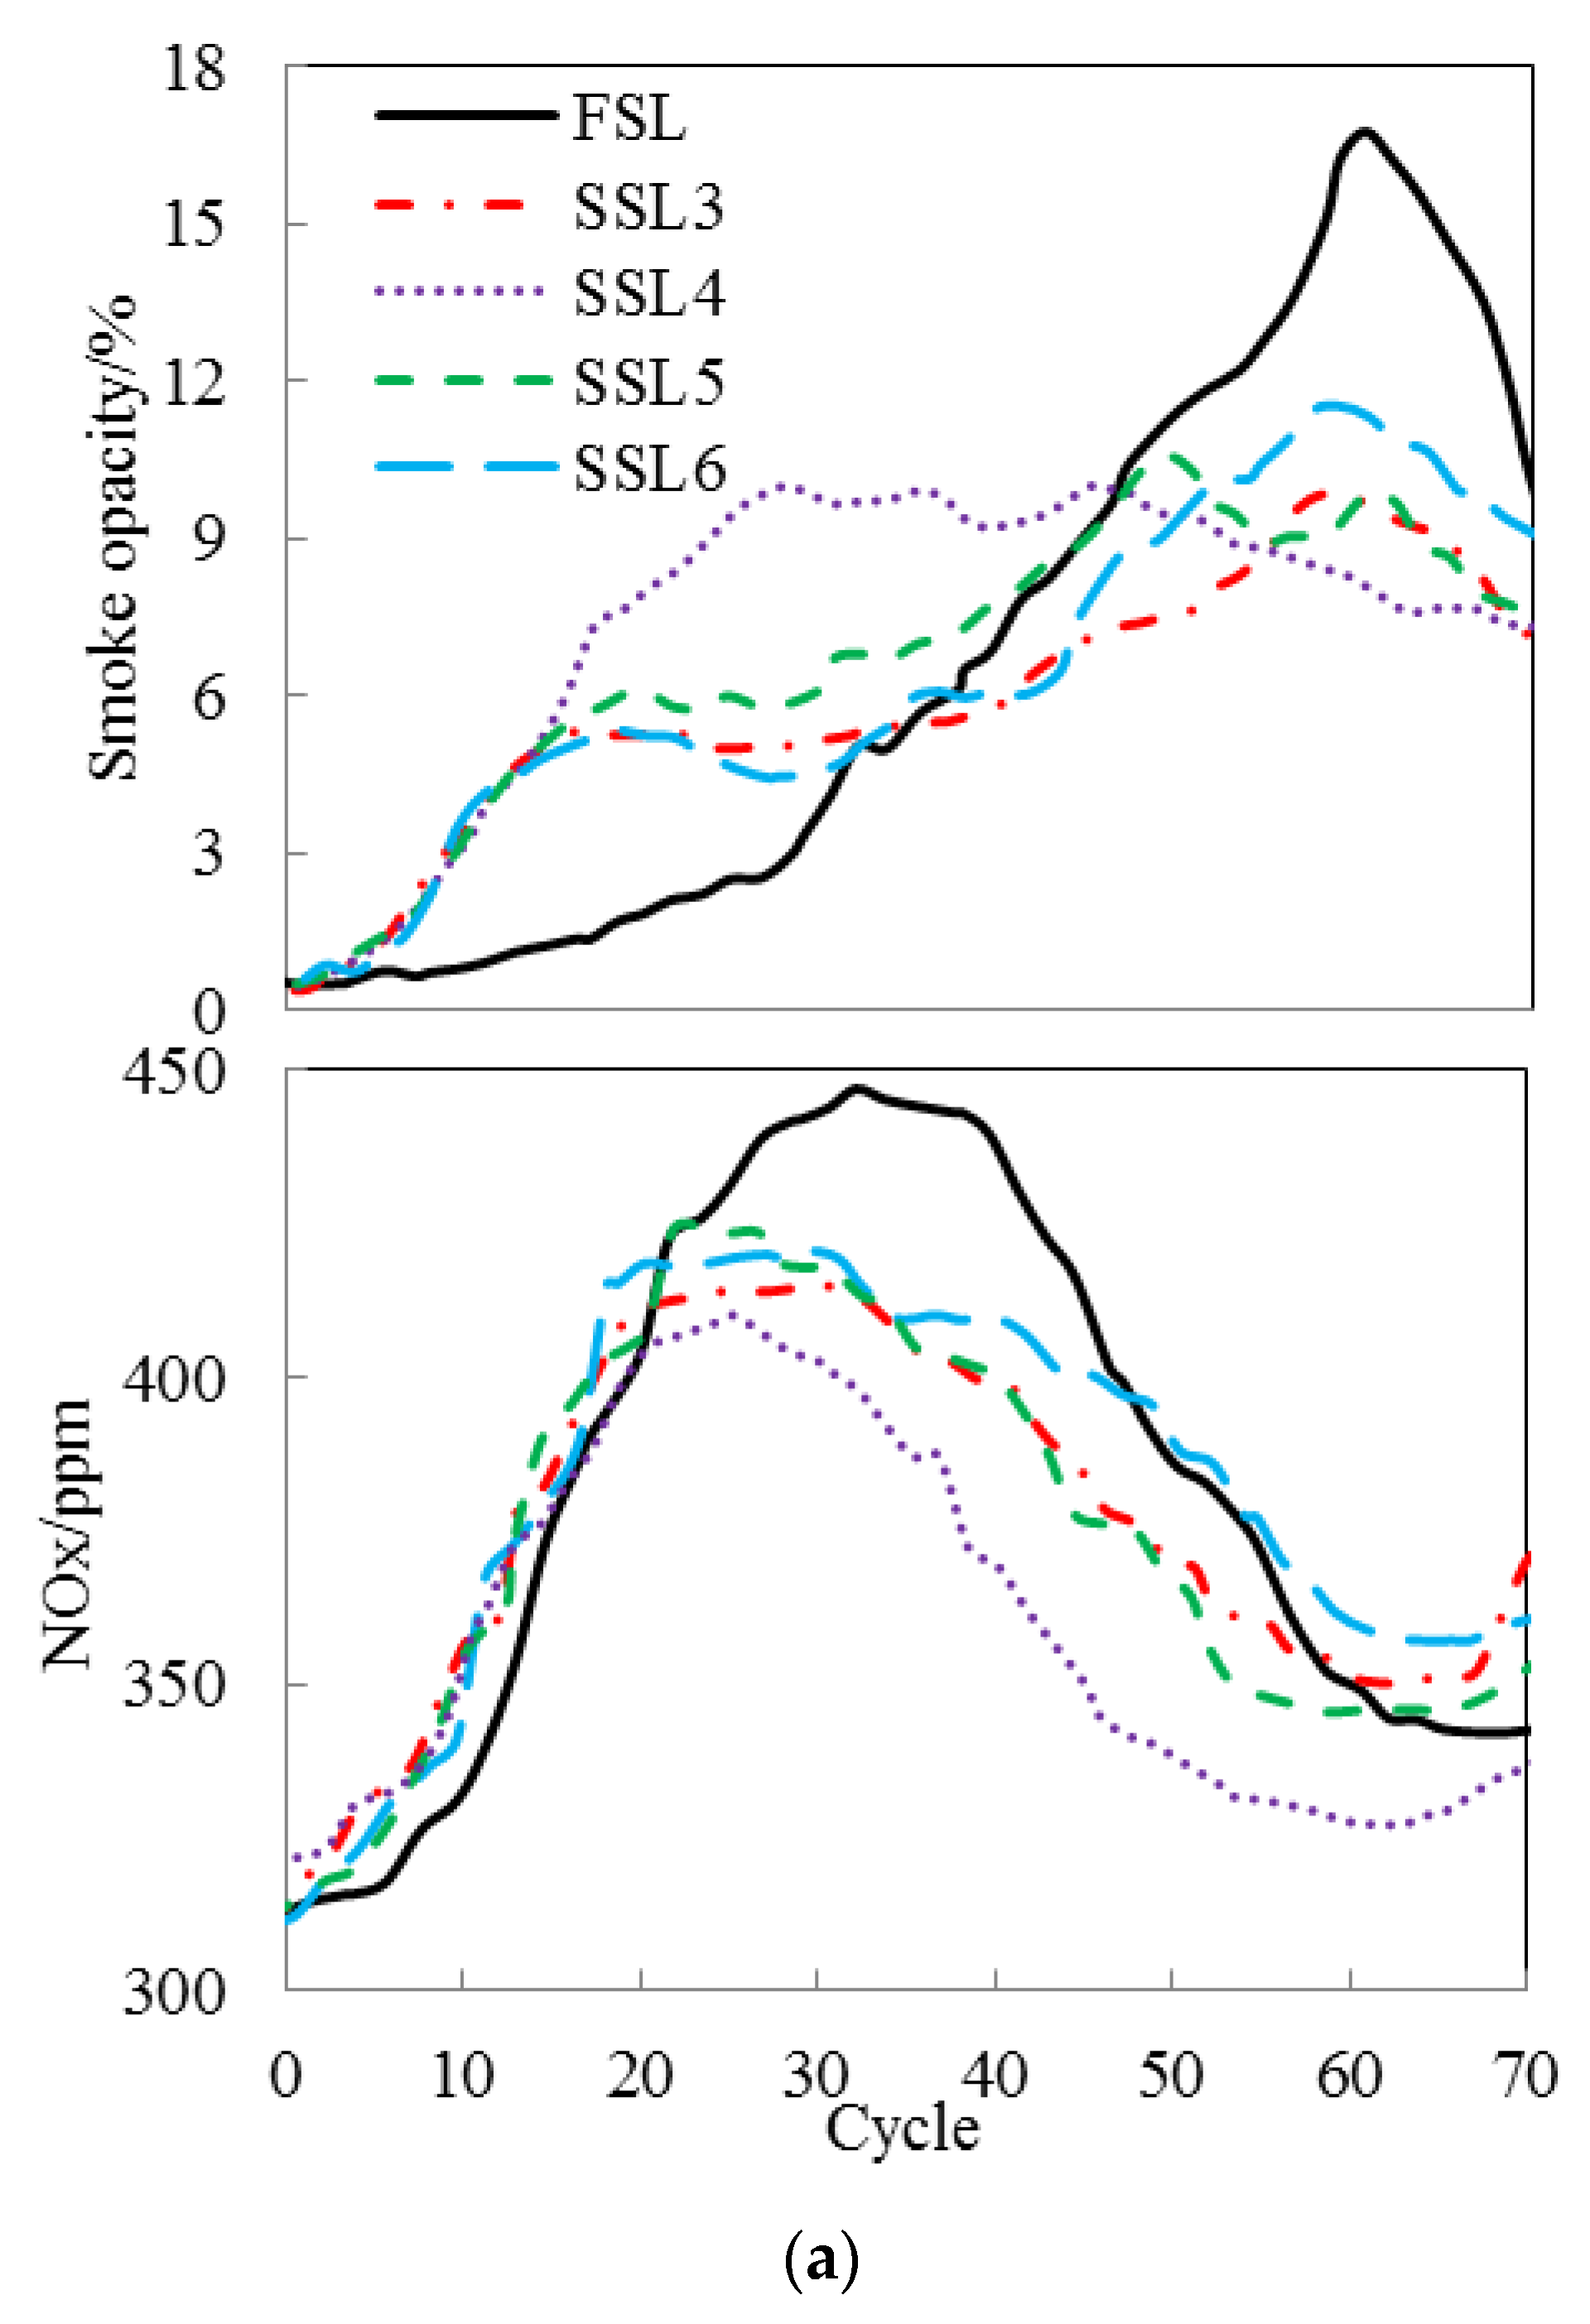
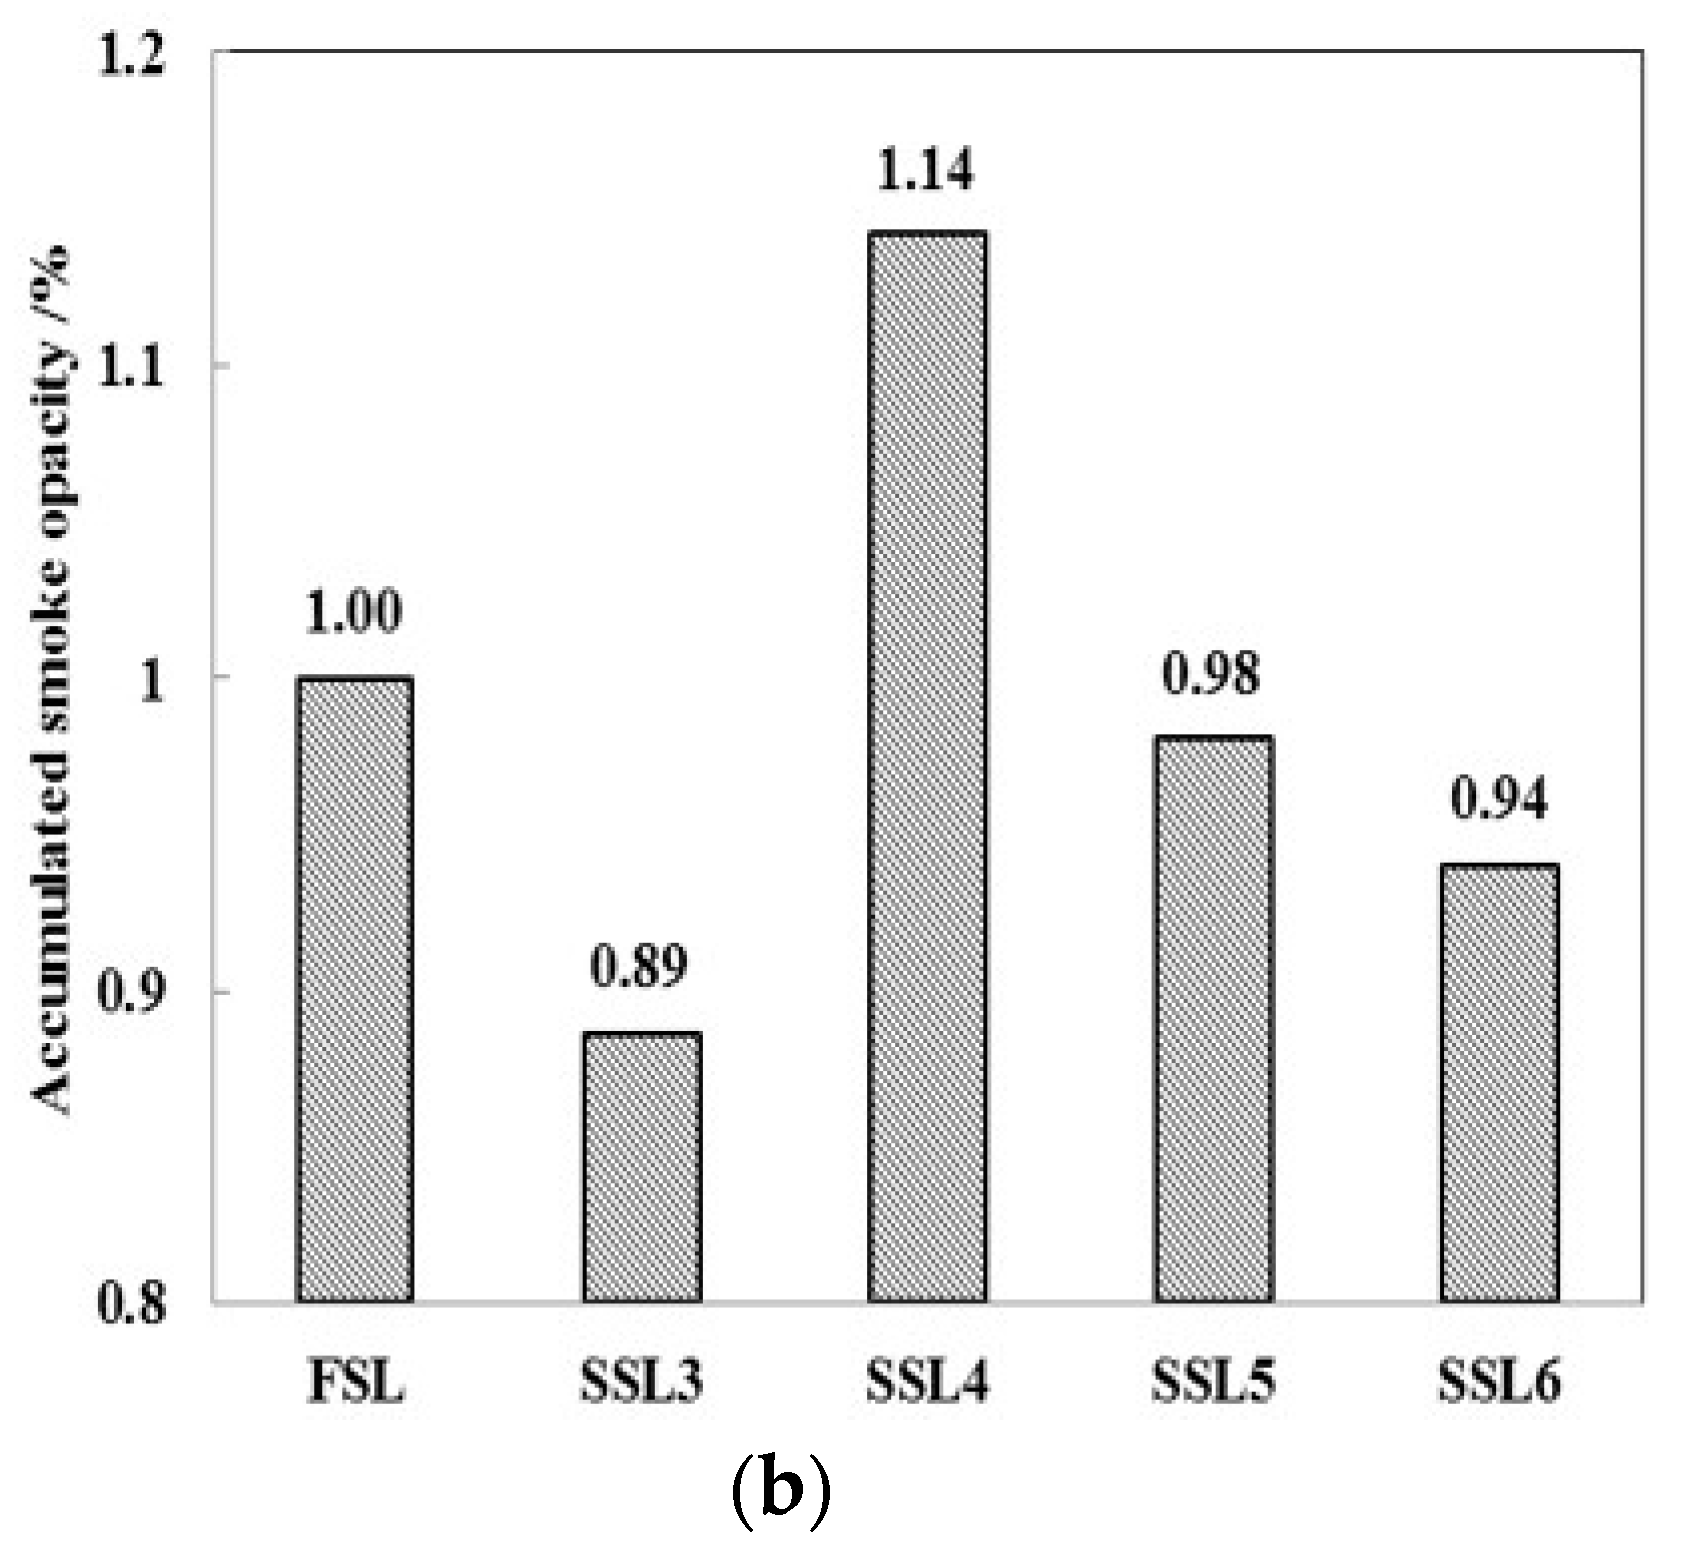
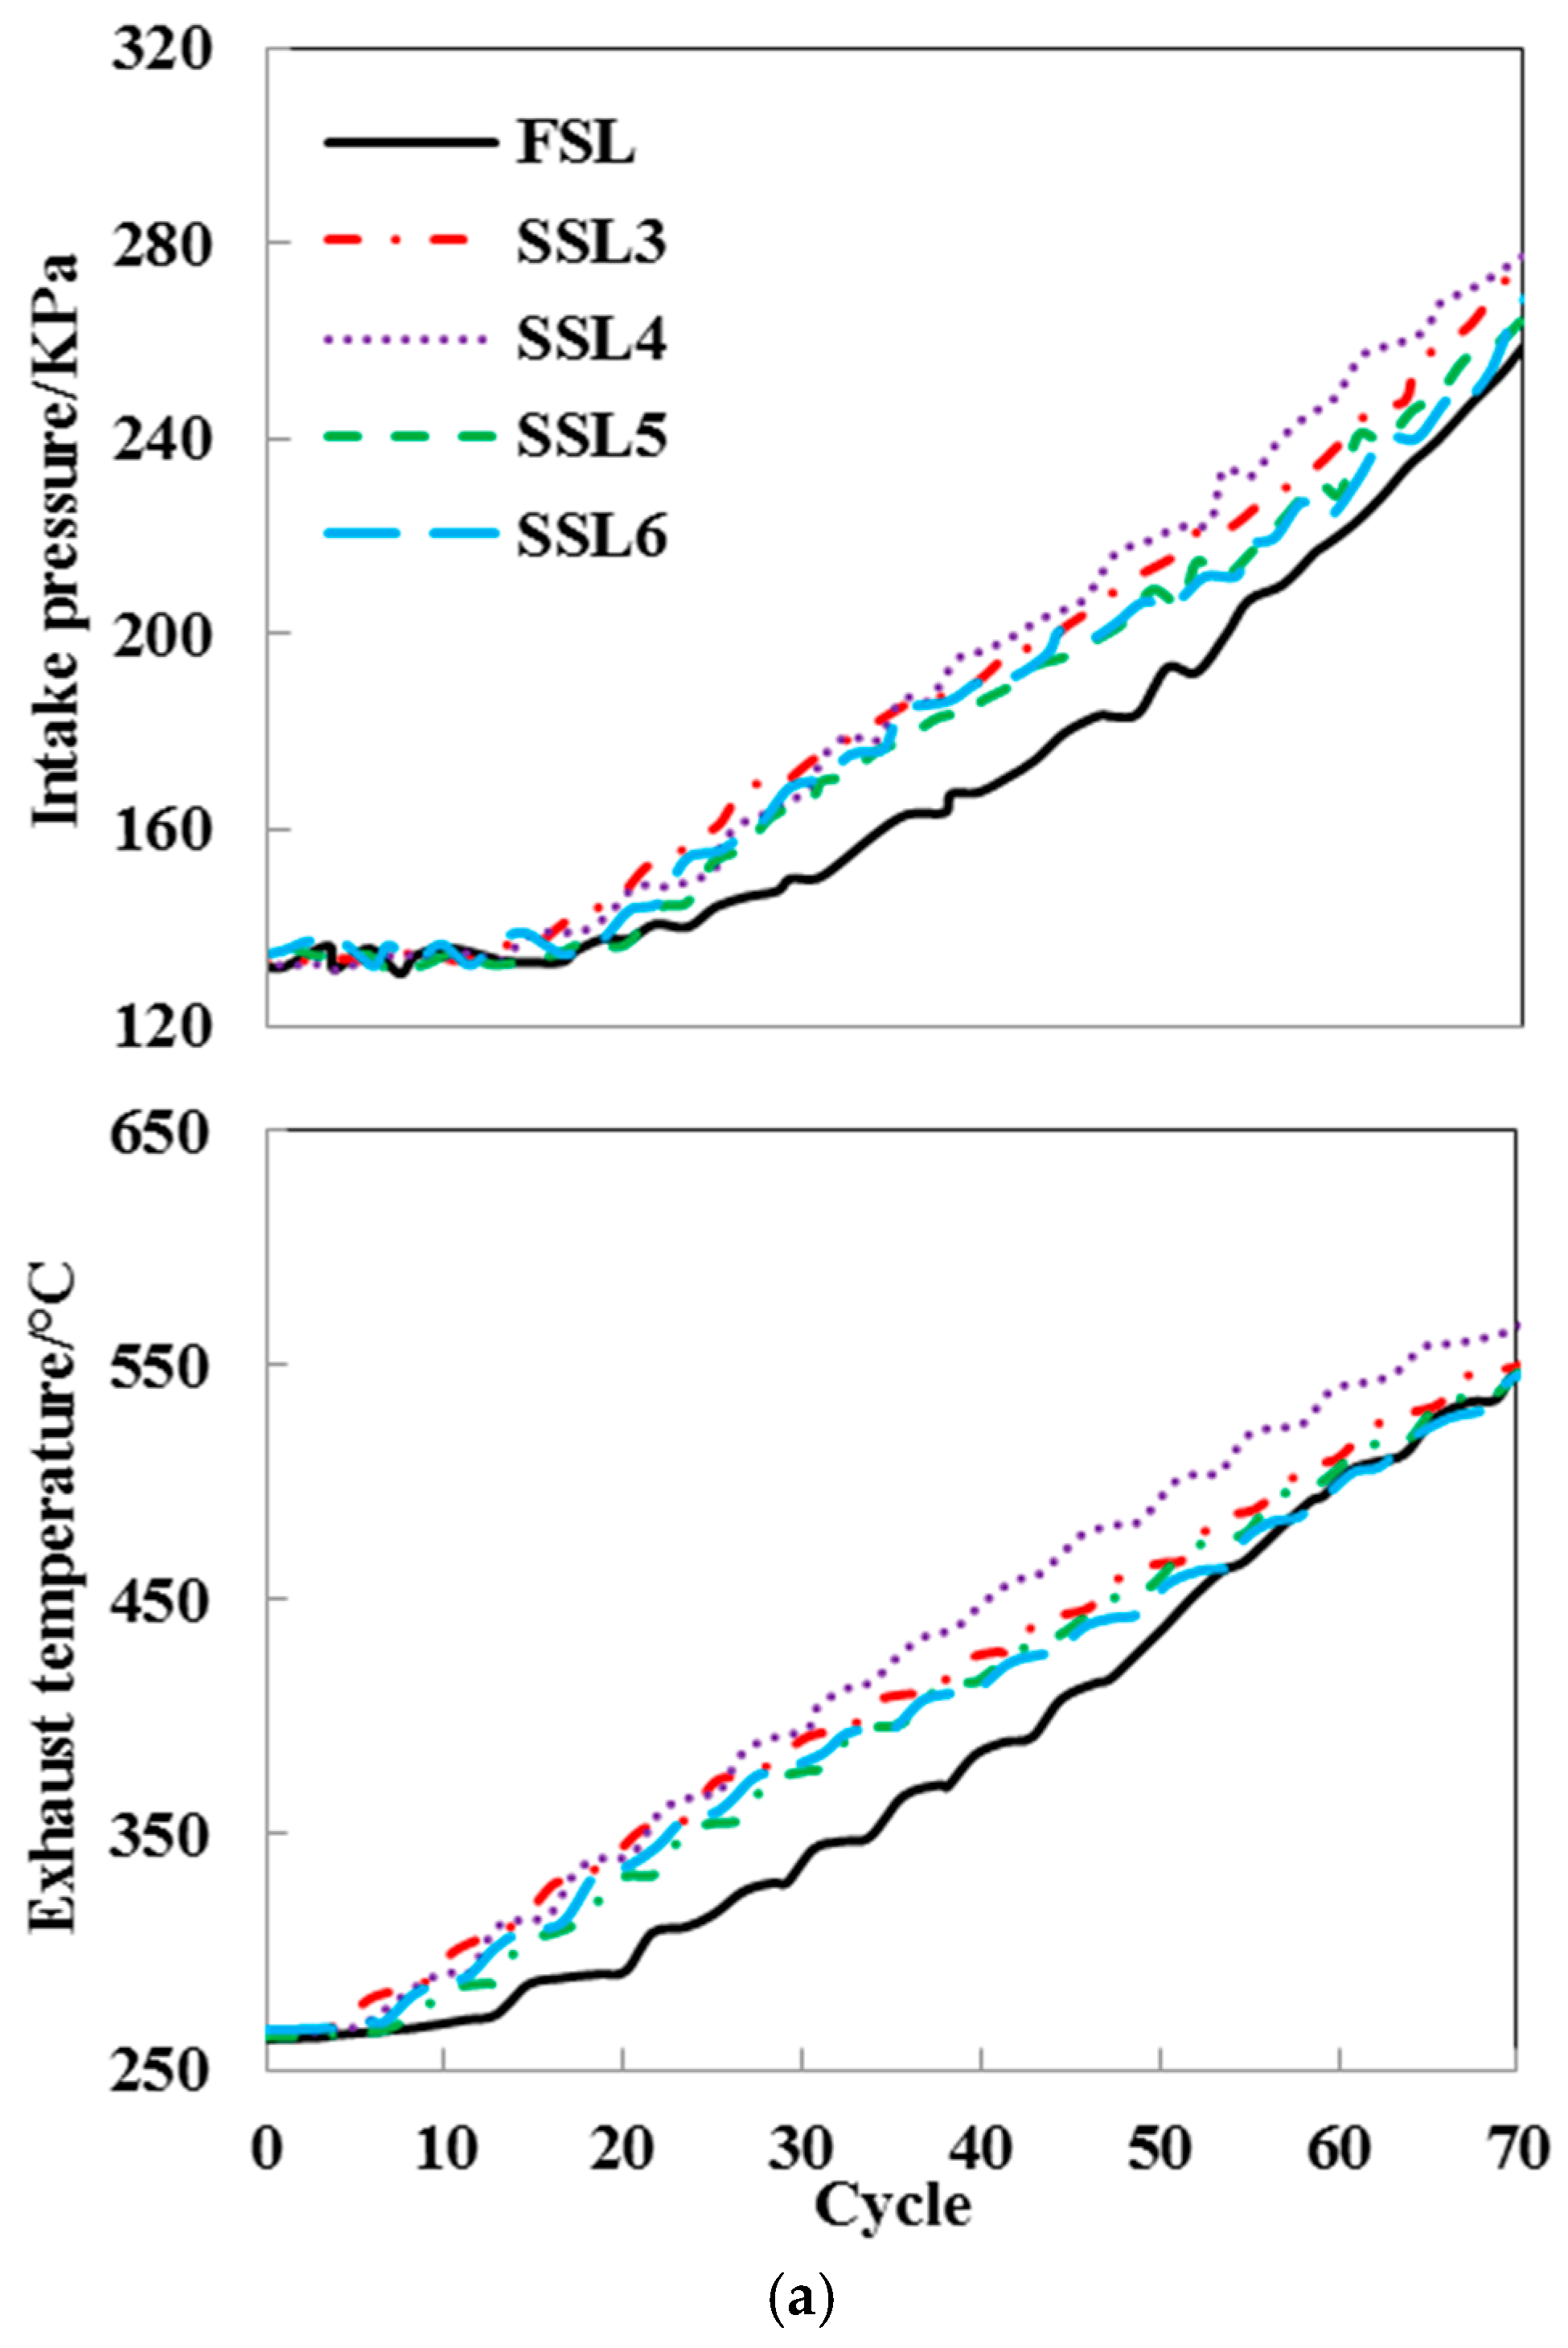
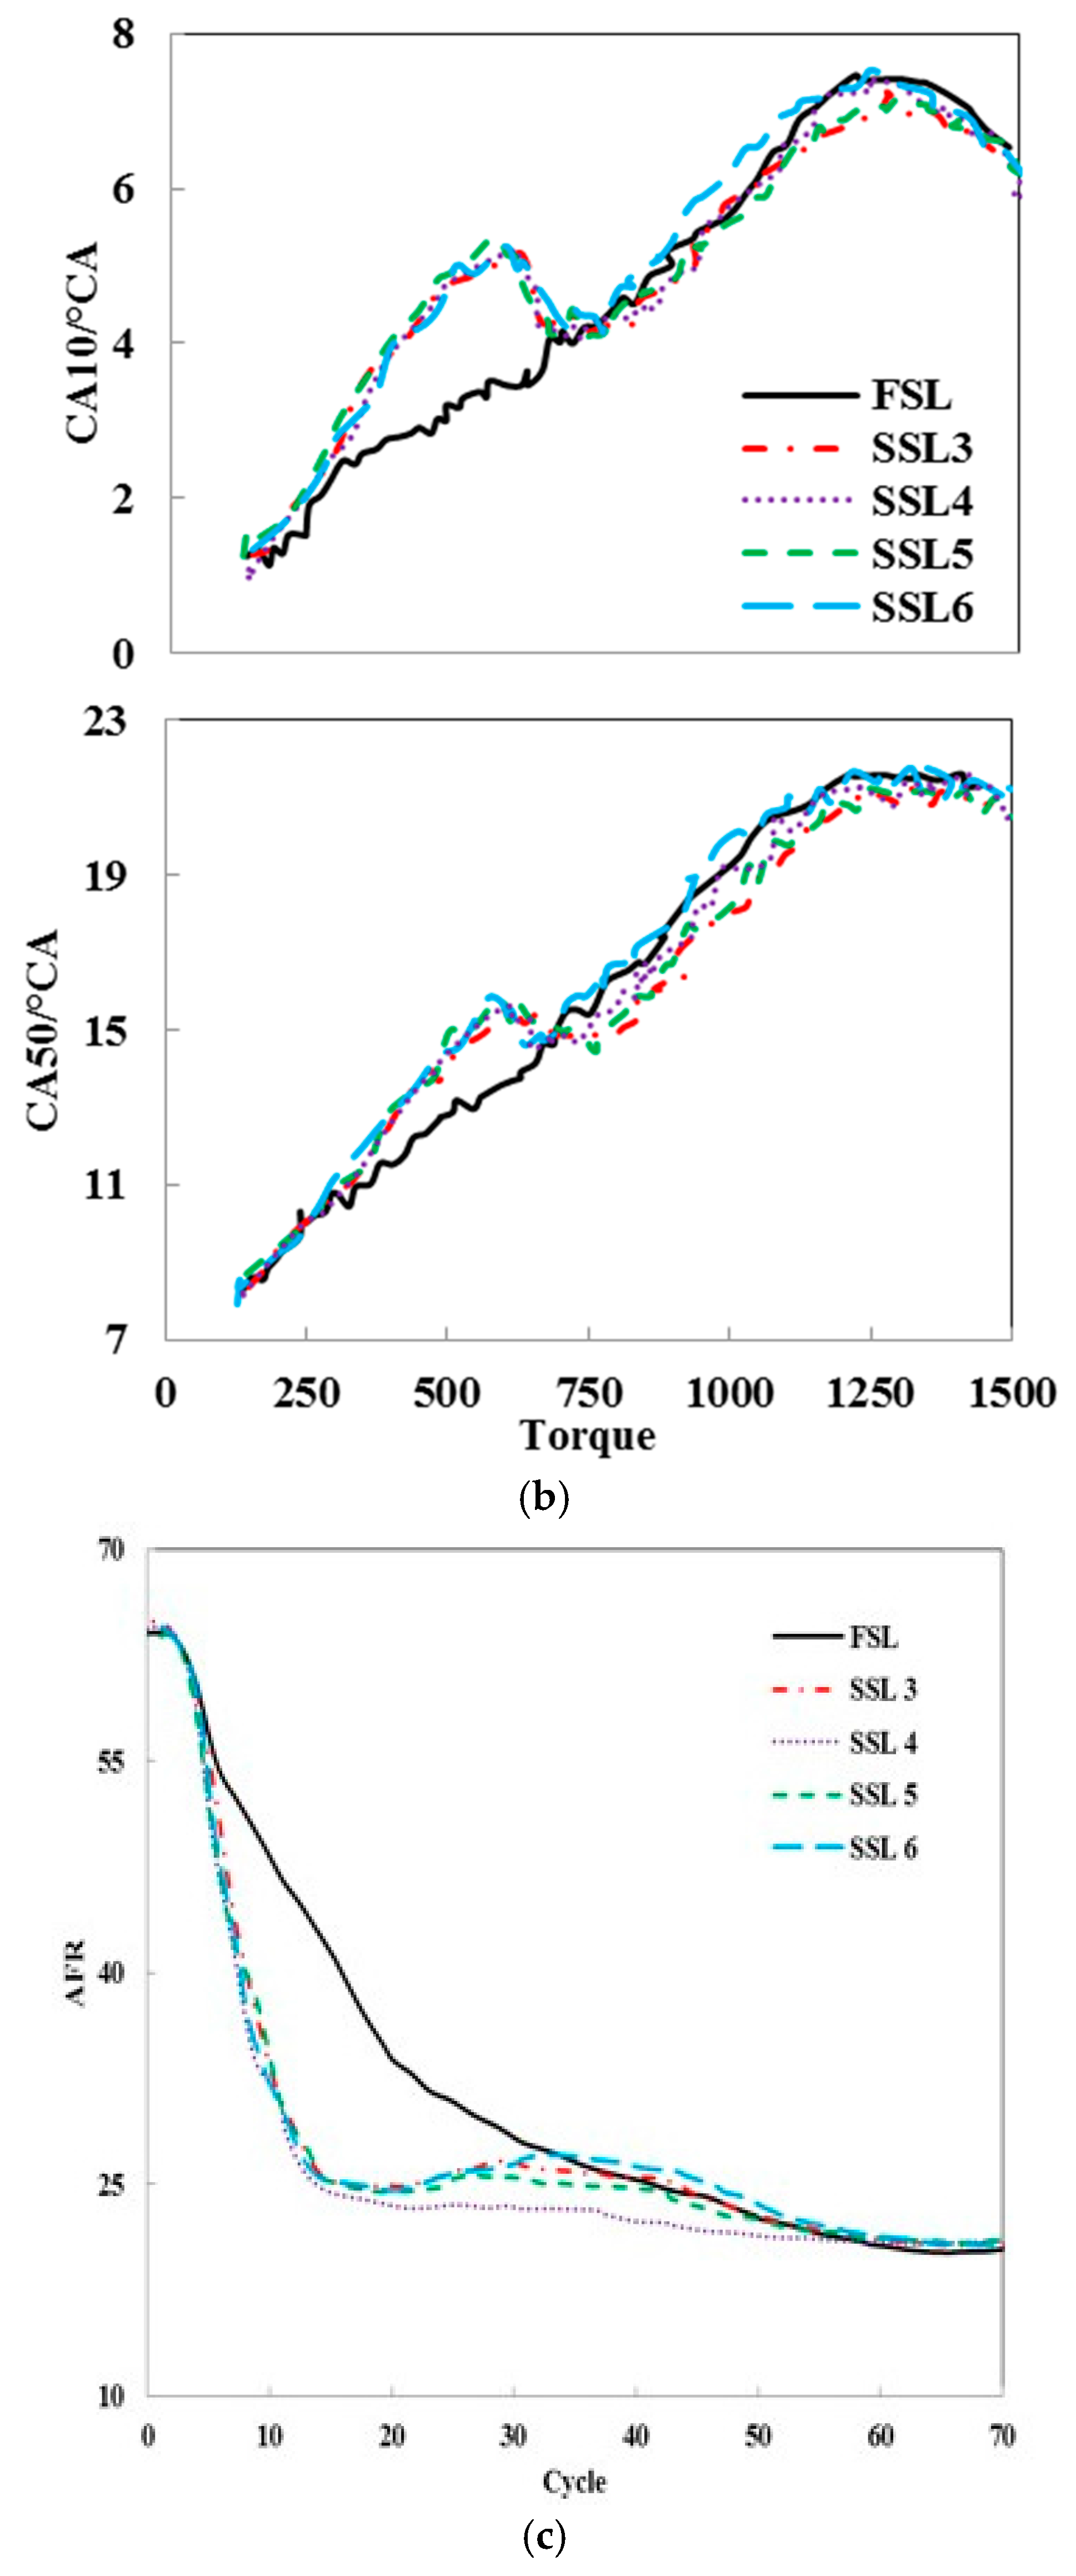
3.3. Influence of Different the Second-Stage Loading Rate and Loading Hold Time on Transient Performance

From the results presented in Section 3.1 and Section 3.2, it can be concluded that the larger first-stage loading rate can shorten the torque transient response time, and the loading hold for a certain time can reduce the peak of smoke and NOX emissions. However, whether the longer the loading hold time is, the more the smoke and NOX peak will decrease should be further investigated. For this reason, loading strategies involving different loading hold times have been studied. Detailed test conditions are given in Table 4 and Figure 4b.
Figure 10a illustrates that, the torque transient response time of 50% load is basically same under SSL 3–6 strategies. Besides, the smaller the loading hold time, the shorter the torque transient response time of 90% load. In Figure 10b, the torque response rate (δ) of SSL 4 strategy at 90% load is the highest about 12.9%, whereas the δ value of the SSL 6 strategy at 90% load is the smallest (about 2.8%).
Figure 11a shows that the smoke peak of SSL 6 strategy is higher than that of other SSL strategies. In the condition of the same first-stage loading rate, the longer the loading hold time, the greater the second-stage loading rate.
Thus, this gives rise to slightly worsening EGR rate overshoot at medium and large loads (Figure 12d). Besides, in Figure 12a, with the lower intake pressure and exhaust temperature of the SSL 6 strategy, the air inflow is relatively smaller.
However, the cycle injected fuel quantity increases with larger loading rate. Therefore, compared with other SSL strategies, the air supply lags behind the fuel supply more intensively under the second-stage loading process. Moreover, with increasing second-stage loading rate, decrease of air-fuel mixing energy (ME) weakens the turbulent kinetic energy and mixing of oil and gas [23]. In addition, the longer loading hold time causes a higher in-cylinder average temperature. Consequently, the factors above lead to deterioration of smoke emissions under the SSL 6 strategy, but not higher than that of the FSL strategy. In Figure 11b, the accumulated emission levels of smoke are the largest under the SSL 4 strategy, which deteriorates by 14% compared with the FSL strategy. Due to the shorter loading hold time, the AFR is lower than other loading strategies, during the medium and later stage of transient process in Figure 12c. Therefore, it’s extremely critical to apply a suitable loading hold time for optimizing transient performance.
With the longer loading hold time, the combustion phasing (CA10 and CA50) of the SSL strategies is not closer to the TDC than that of the FSL strategy, under the second-stage loading process illustrated in Figure 12b. Especially, the SSL 6 strategy has the longest loading hold time, but its combustion phase is almost the same as the FSL strategy. The results indicate that, too large a second-stage loading rate deteriorates the degree of the mis-match between air and fuel supply, and the quality of air-fuel mixture formation. Therefore, the deterioration of combustion thermo-atmosphere and reduction of the air-fuel mixing energy caused by the larger second-stage loading rate counteract the beneficial impact of the extending the loading hold time. To sum up, considering the torque dynamic response performance, combustion phase and emission performance, the SSL 3 strategy (the first-stage loading rate is 700 N·m/s, loading hold time is 1.2 s, and the 233.3 N·m/s second-stage loading rate) has the optimal transient performance and greatest applied potential.

4. Conclusions

In this study, SSL strategies are proposed to improve the transient performance of a two-stage turbocharged diesel engine with HP-EGR system of constant opening valve conditions in a typical 5 s transient process. The conclusions may be summarized as follows:
  • The SSL strategies can enhance the intake air energy during the early stage of transient conditions. Hence, it raises the combustion rate and advances the combustion phase significantly under medium and large loads.
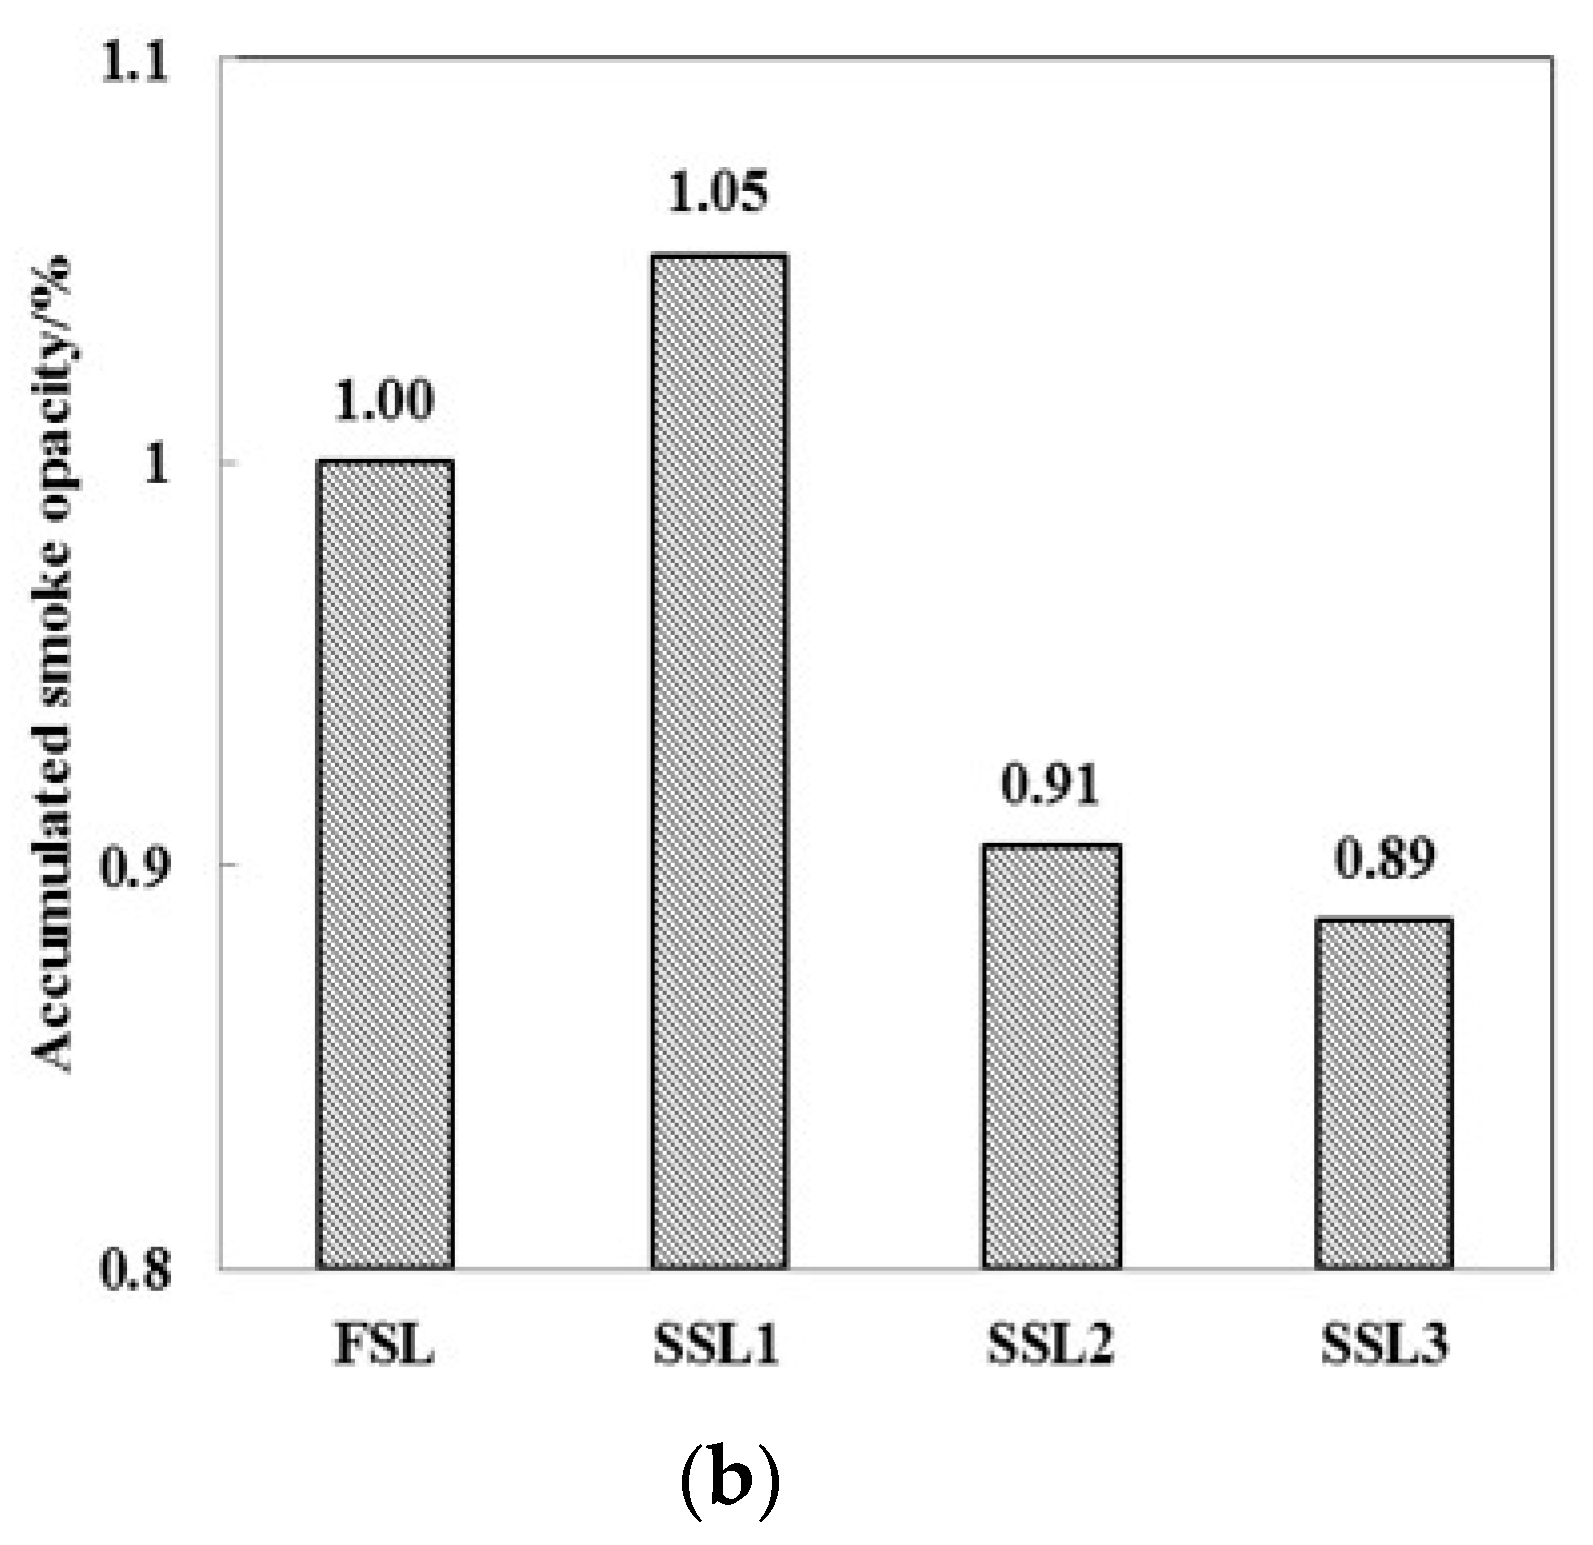
  • Compared with the FSL strategy, the SSL strategies maximally increase the torque response performance by 56.7%. Meanwhile, the maximum decreases of smoke opacity and NOX peak are 41.3 % and 7.3 %, respectively.
  • Thanks to extending the loading hold time, an evident reduction of rich mixture is an essential reason for the soot emission improvement.
  • The application of the SSL 3 strategy obviously restrains the deterioration of thermal conditions caused by larger second-stage loading rate, then achieves an outstanding trade-off between torque response and emissions performance.

Acknowledgments

This work was supported by the National Key R&D Program of China (Grant No.2017YFB0103503) and the National Natural Science Foundation of China (Grant No.51576089).

Author Contributions

Zhongchang Liu, Xing Yuan, Jing Tian and Yongqiang Han conceived and designed the experiments; Xing Yuan and Guanlong Gao performed the experiments; Xing Yuan and Guanlong Gao analyzed the data; Runzhao Li contributed reagents/materials/analysis tools; Xing Yuan wrote the paper.” All authors read and approved the manuscript.

Conflicts of Interest

All authors declare no conflict of interest.

Nomenclature

FSLfull-stage loading
SSLsectional-stage loading
ATDCafter top dead center
°CAdegrees of crank angle
CA10crank angle where 10% total heat released
CA50crank angle where 50% total heat released
EGRexhaust gas recirculation
TDCtop dead center
ECUelectronic control unit
DACdigital to analog converter
ADCanalog to digital converter
rpmrevolutions per minute
AFRair-fuel ratio
BSFCbrake specific fuel consumption
ppmparts per million
φequivalence ratio

References

  1. Glewen, W.; Heuwetter, D.; Foster, D.E.; Andrie, M.; Krieger, R. Analysis of deviations from steady state performance during transient operation of a light duty diesel engine. Cryogenics 2012, 5, 909–922. [Google Scholar] [CrossRef]
  2. Giakoumis, E.G.; Lioutas, S.C. Diesel-engined vehicle nitric oxide and soot emissions during the European light-duty driving cycle using a transient mapping approach. Trans. Res. Part D Trans. Environ. 2010, 15, 134–143. [Google Scholar] [CrossRef]
  3. Serrano, J.; Climent, H.; Guardiola, C.; Piqueras, P. Methodology for characterization and simulation of turbocharged diesel engines combustion during transient operation. Appl. Therm. Eng. 2009, 29, 142–149. [Google Scholar] [CrossRef]
  4. Xia, M.; Zhao, C.L.; Zhang, F.J.; Huang, Y. Modeling the performance of a new speed adjustable compound supercharging diesel engine working under plateau conditions. Energies 2017, 10, 689. [Google Scholar] [CrossRef]
  5. Han, Y.; Liu, Z.; Zhu, J.; Xu, Y.; Li, J.; Li, K. EGR response in a turbo-charged and after-cooled DI diesel engine and its effects on smoke opacity. SAE Tech. Pap. 2012. [Google Scholar] [CrossRef]
  6. Nilsson, T.; Froberg, A.; Aslund, J. Optimal operation of a turbocharged diesel engine during transients. SAE Tech. Pap. 2012. [Google Scholar] [CrossRef]
  7. Rakopoulos, C.D.; Dimaratos, A.M.; Giakoumis, E.G.; Rakopoulos, D.C. Evaluation of the effect of engine, load and turbocharger parameters on transient emissions of diesel engine. Energy Convers. Manag. 2009, 50, 2381–2393. [Google Scholar] [CrossRef]
  8. Giakoumis, E.G.; Rakopoulos, C.D.; Dimaratos, A.M.; Rakopoulos, D.C. Exhaust emissions with ethanol or n-butanol diesel fuel blends during transient operation: A review. Renew. Sustain. Energy Rev. 2013, 17, 170–190. [Google Scholar] [CrossRef]
  9. Watel, E.; Pagot, A.; Pacaud, P.; Schmitt, J. Matching and evaluating methods for euro 6 and efficient two-stage turbocharging diesel engine. SAE Tech. Pap. 2010. [Google Scholar] [CrossRef]
  10. Gautier, P.; Albrecht, A.; Chasse, A.; Moulin, P.; Pagot, A.; Fontvieille, L.; Issartel, D. A simulation study of the impact of LP EGR on a two-stage turbocharged diesel engine. Oil Gas Sci. Technol. 2009, 64, 361–379. [Google Scholar] [CrossRef]
  11. Albin, T.; Ritter, D.; Liberda, N.; Abel, D. Boost pressure control strategy to account for transient behavior and pumping losses in a two-stage turbocharged air path concept. Energies 2016, 9, 530. [Google Scholar] [CrossRef]
  12. Shi, L.; Li, H.L.; Zhang, H.Y.; Mao, X.J.; Deng, K.Y.; Liu, B.; Hua, L. The effect of bypass valve control on the steady-state and transient performance of diesel engines with regulated two-stage turbocharging system. SAE Tech. Pap. 2015. [Google Scholar] [CrossRef]
  13. Wu, B.Y.; Zhan, Q.; Yu, X.Y.; Lv, G.J.; Nie, X.K.; Liu, S. Effects of miller cycle and variable geometry turbocharger on combustion and emissions in steady and transient cold process. Appl. Therm. Eng. 2017, 118, 621–629. [Google Scholar] [CrossRef]
  14. Grönman, A.; Sallinen, P.; Honkatukia, J.; Backman, J.; Uusitalo, A. Design and experiments of two-stage intercooled electrically assisted turbocharger. Energy Convers. Manag. 2016, 111, 115–124. [Google Scholar] [CrossRef]
  15. Jeong, K.; Lee, D.G.; Park, S.W.; Lee, C.S. Effect of two-stage fuel injection parameters on NOX reduction characteristics in a DI diesel engine. Energies 2011, 411, 2049–2060. [Google Scholar] [CrossRef]
  16. Li, G.; Zhang, C.H.; Li, Y.Y. Effects of diesel injection parameters on the rapid combustion and emissions of an HD common-rail diesel engine fueled with diesel-methanol dual-fuel. Appl. Therm. Eng. 2016, 108, 1214–1225. [Google Scholar] [CrossRef]
  17. Xie, H.Z.; Song, L.B.; Xie, Y.Z.; Pi, D.; Shao, C.Y.; Lin, Q.Z. An experimental study on the macroscopic spray characteristics of biodiesel and diesel in a constant volume chamber. Energies 2015, 8, 5952–5972. [Google Scholar] [CrossRef]
  18. Zhang, L.P.; Liu, Z.C.; Tian, J.; Sun, S.J. Investigation of the combustion deterioration of an automotive diesel engine under transient operation. Sci. China Technol. Sci. 2014, 57, 480–488. [Google Scholar] [CrossRef]
  19. Liu, Z.C.; Yu, K.B.; Tian, J.; Han, Y.Q.; Qi, S.L.; Teng, P.K. Influence of rail pressure on a two-stage turbocharged Heavy-duty diesel engine under transient operation. Int. J. Automot. Technol. 2017, 18, 19–29. [Google Scholar] [CrossRef]
  20. Agarwal, A.K.; Dhar, A.; Gupta, J.G.; Kim, W.I.; Choi, K.; Lee, C.S.; Park, S. Effect of fuel injection pressure and injection timing of Karanja biodiesel blends on fuel spray, engine performance, emissions and combustion characteristics. Energy Convers. Manag. 2015, 91, 302–314. [Google Scholar] [CrossRef]
  21. Agarwal, A.K.; Srivastava, D.K.; Dhar, A.; Maurya, R.K.; Shukla, P.C.; Singh, A.P. Effect of fuel injection timing and pressure on combustion, emissions and performance characteristics of a single cylinder diesel engine. Fuel 2013, 111, 374–383. [Google Scholar] [CrossRef]
  22. Agarwal, A.K.; Dhar, A.; Gupta, J.G.; Kim, W.I.; Lee, C.S.; Park, S.W. Effect of fuel injection pressure and injection timing on spray characteristics and particulate size-number distribution in a biodiesel fuelled common rail direct injection diesel engine. Appl. Energy 2014, 130, 212–221. [Google Scholar] [CrossRef]
  23. Han, Y.Q.; Zhang, L.P.; Liu, Z.C.; Tian, J. Investigation of transient deterioration mechanism and improved method for turbocharged diesel engine. Energy 2016, 116, 250–264. [Google Scholar] [CrossRef]
  24. Darlington, A.; Glover, K.; Collings, N. A simple diesel engine air-path model to predict the cylinder charge during transients Strategies for reducing transient emissions spikes. SAE Tech. Pap. 2006. [Google Scholar] [CrossRef]
  25. Rakopoulos, C.D.; Dimaratos, A.M.; Giakoumis, E.G. Experimental assessment of turbocharged diesel engine transient emissions during acceleration, load change and starting. SAE Tech. Pap. 2010. [Google Scholar] [CrossRef]
  26. Giakoumis, E.G.; Alafouzos, A.I. Study of diesel engine performance and emissions during a transient cycle applying an engine mapping-based methodology. Appl. Energy 2010, 87, 1358–1365. [Google Scholar] [CrossRef]
  27. Shen, Z.J.; Liu, Z.C.; Tian, J.; Liu, J.W. Investigation of in-cylinder gas stratification of diesel engine during intake and compression stroke. Energy 2014, 72, 671–679. [Google Scholar] [CrossRef]
Figure 1. Schematic diagram of the transient control and measurement platform.
Energies 11 00069 g001
Figure 2. Simulation model of diesel engine.
Energies 11 00069 g002
Figure 3. Comparison of HRR and in-cylinder pressure between simulation and experiment results during combustion process.
Energies 11 00069 g003
Figure 4. Schematic diagram of different loading strategies: (a) constant second-stage loading rate; (b) constant first-stage loading rate.
Energies 11 00069 g004
Figure 5. Comparison of dynamical response performance under different loading strategies: (a) IMEP; (b) torque response rate (δ).
Energies 11 00069 g005
Figure 6. Comparison of dynamical response performance under different loading strategies: (a) IMEP; (b) torque response rate (δ).
Energies 11 00069 g006aEnergies 11 00069 g006b
Figure 7. Comparison of transient performance parameters under different loading strategies: (a) intake pressure and exhaust temperature; (b) CA10 and CA50; (c) AFR; (d) EGR.
Energies 11 00069 g007
Figure 8. Effects of loading stagnation time on the combustion process: (a) density, pressure, temperature, HRR; (b) evaporation rate, burn-evaporation ratio.
Energies 11 00069 g008
Figure 9. Comparison of the cell proportion of lean mixture, quasi-rich mixture, and rich mixture under different loading stagnation time.
Energies 11 00069 g009
Figure 10. Comparison of dynamical response performance under different loading strategies: (a) IMEP; (b) torque response rate (δ).
Energies 11 00069 g010aEnergies 11 00069 g010b
Figure 11. Comparison of emissions performance under different loading strategies: (a) soot and NOX; (b) Accumulated emission smoke.
Energies 11 00069 g011aEnergies 11 00069 g011b
Figure 12. Comparison of transient performance parameters under different loading strategies: (a) intake pressure and exhaust temperature; (b) CA10 and CA50; (c) AFR; (d) EGR.
Energies 11 00069 g012aEnergies 11 00069 g012bEnergies 11 00069 g012c
Table 1. Detailed technical specifications of the test engine.
Engine ParametersSpecifications
Bore × Stroke112 × 145 mm
Number of cylinders6
Volume8.6 L
Rated power/speed260 kW/2100 rpm
Compression ratio17.0:1
Piston bowlω
Number of injector nozzle holes8
Injection SystemThe 2nd generation of Common-rail (Bosch)
TurbochargedHOLSET400
EGR coolingIntercooling
Table 2. Main instruments and accuracy.
EquipmentManufacturerTypeAccuracy
Eddy current dynamometerCAMACW440Speed: ±1 rpm
Torque: ±0.2~0.3% FS
Electrically operated EGR valveMitsubishiSBZB1N-0013±1.0% FS
NOX sensorContinental5WK9-6614H±0.2% FS
In-cylinder pressure sensorKistler6125C±0.4% FS
Air flow meterAVLAVL1000±1.0% FS
OpacimeterAVLAVL439±0.1% FS
Fuel mass flow meterToCeiL-ShanghaiCMFD/G±0.4% FS
Combustion analyzerDEWETRONDEWE-2010Resolution: 0.2 °CA
dSPACEdSPACEMicroAutoBoxII 1401ADC: 12-bit
DAC: 12-bit
Table 3. Primary numerical model.
ItemModel
Turbulence modelk-Epsilon/RNG
Cavitation modelMPI-2
Atomization modelReitz/Diwakar
Droplet-wall interaction modelBai
Spray modelHuh
Droplet breakupReitz
IgnitionShell auto-ignition
Reaction modelEBU LATCT
AlgorithmPISO
Table 4. Experimental scheme of different loading strategies.
Exp No.The First-Stage Loading Rate (N·m/s)The Loading Stagnation Time (s)The Second-Stage Loading Rate (N·m/s)
FSL2520252
SSL 13500.4233.3
SSL 24900.8233.3
SSL 37001.2233.3
SSL 47000.4184.2
SSL 57000.8212.1
SSL 67001.6269.2
Table 5. Simulation scheme of the different loading stagnation time.
Exp No.Operating Point 1Operating Point 2Operating Point 3Operating Point 4
Loading hold time/s00.40.81.6
Stagnation load50%50%50%50%
Table 6. Comparison of φ-T MAP under different loading hold times.
4 °CA ATDC8 °CA ATDC16 °CA ATDC
Energies 11 00069 i001 Energies 11 00069 i002 Energies 11 00069 i003
Energies 11 00069 i004

