Experimental Method and Setup for Laboratory Fluidized Bed Reactor Testing


Energy and Materials, Chemistry and Chemical Engineering, Chalmers University of Technology, 412 96 Gothenburg, Sweden
*
Author to whom correspondence should be addressed.
Energies 2018, 11(10), 2505; https://doi.org/10.3390/en11102505
Submission received: 6 September 2018
/
Revised: 17 September 2018
/
Accepted: 17 September 2018
/
Published: 20 September 2018
(This article belongs to the Special Issue Recent Advances in the Development of Novel Solid State Materials as Oxygen Carriers: Thermodynamics, Synthesis and Energetic Applications)
Abstract
:A small laboratory fluidized bed reactor is used to test the chemical reactivity of solid particles fluidized with a gas. The novelty of the system is that it can be used for testing any solid particles, and, in this work, oxygen carriers with Mn/Si oxide supported on TiO2 are used to present the possibilities and layout of the laboratory system. The system is equipped with automatic valves that make it possible to rapidly change the gas conditions in the reactor. The setup facilitates solid particle testing using a sample of a few grams with gas-solid contact conditions relevant for a full-scale fluidized bed. With this small system, it is possible to mimic a section or a part of a larger system. It is also possible to test extreme conditions that can occur in a bigger unit. The system is designed for determining chemical reactivity in combustion, gasification, and reforming, but it can be used for investigating any type of gas-solid reaction in fluidized bed conditions. The setup presented here is one of the smallest possible devices that can be realized while maintaining fluidized bed conditions.
1. Introduction
Fluidized beds are commonly used in a wide range of applications such as the energy sector, the food industry, as well as process and chemical engineering. The main feature is the very high surface area contact between a fluid and the solid particles in the bed [1]. The applications that use fluidized beds are mostly large-scale units, often with tons of materials at elevated temperatures. These conditions are difficult to scale down, which makes it hard to develop and test solid particles at conditions relevant for large-scale operation.
The primary purpose of this article is to present the general layout of a small laboratory fluidized bed quartz reactor. Variants of how the system can be used are also included. The setup here is one of the smallest possible systems that can be realized while maintaining fluidized bed conditions, which makes it possible to evaluate chemical properties and behavior. If the diameter of the reactor is made any smaller, the wall effects will be significant. In addition, work on new oxygen carriers with Mn/Si oxide supported on TiO2 is presented. The purpose of this is partly to show the feasibility of these materials as oxygen carriers and to present the possibilities and the layout of the laboratory system. Therefore, this paper focuses on the laboratory set-up, the procedure, how parameters are selected, and how they can be altered. Also, possible fetchers of the system, not used to obtain the result detailed in this work, are also included.
The laboratory fluidized bed in this work facilitates the testing of solid particles using a sample of a few grams in gas-solid contact conditions relevant for large-scale applications that can use tons of material. It is possible to test smaller samples in fixed-bed conditions [2] or TGA [3,4,5], but this entails less gas-solid contact and introduces significant solid-solid contact between particles. As a consequence, the chemical reactivity would be drastically altered, which would make the scale-up of the results inaccurate. Constructing a larger system and using more sample is possible [6,7,8]; however, this would require more costly equipment and make it harder to effectively test different samples or different parameters. Nevertheless, larger equipment enables higher gas velocities and, thereby, physical conditions closer to the real application. It is, therefore, important to stress that with this system chemical reactivity is primarily investigated. Some information about the physical behavior of the fluidized bed is obtained, but other methods are needed in order to obtain reliable data on particle hardness or attrition [9,10].
The comparably small sample size and reactor volume in this work also enable more or less homogeneous conditions during the experiments. A larger experimental reactor would produce temperature or concentration gradients; and, the larger the reactor is, the larger the gradients. This also occurs in full-size commercial systems, hence, the homogeneous character of this setup might seem superficial. However, it is possible to mimic a section or a part of a larger system with this small system. One can set temperatures and concentration according to the conditions of the inlet, outlet, or any other part of a much larger system. It is also possible to test extreme conditions that involve significant risk of agglomeration or other types of failure that might lead to the destruction of the sample and even the test unit. This can be tolerated in smaller systems, whereas this creates a huge amount of work and cleanup in bigger units. However, since this system generally has lower fluidization velocities than larger scale systems, physical properties and wall effects cannot be scaled up as easily, or in some cases not at all, from this reactor. However, the chemical properties from this work are scalable to bigger units.
Redox experiments were performed on metal oxides (oxygen carriers) meant to be used to provide oxygen in combustion, reforming, or gasification. Oxygen carriers come in many different forms. The most common form is particles with a chemically active metal oxide such as NiO, CuO Mn2O3, or Fe2O3 [11,12]. A support material can be added in order to give physical stability. This enables the particle to be easily operated in a fluidized bed. Examples of supports are Al2O3, ZrO2, TiO2 or other, more or less, chemically inert materials [11,12]. The size of the particles is governed by the application, but, for fluidized beds in combustion, a size of 100 µm to a few mm is usually used. The active part of the carrier provides oxygen by moving from an oxidized state (M-O) to a reduced state (M), as shown for combustion in reaction (1). The carrier is regenerated according to reaction (2).
CnHm + (2n + ½m) M-O → n CO2 + ½m H2O + (2n + ½m) M
M + ½ O2 → M-O
The goal of this investigation was the full conversion of the fuel to CO2 and water, as in Chemical-Looping Combustion (CLC) [13] or Oxygen Carrier Aided Combustion (OCAC) [14]. If less oxygen is provided to the oxygen carrier, the fuel will only be converted to CO and hydrogen, which is useful in reforming or gasification [8,15,16]. These are the conditions for which the current system was designed and mostly used for. However, it is possible to use the same system for hydration, nitration, temperature cycling, or any other application that requires fluidized bed conditions.
2. Materials and Methods
2.1. General Setup
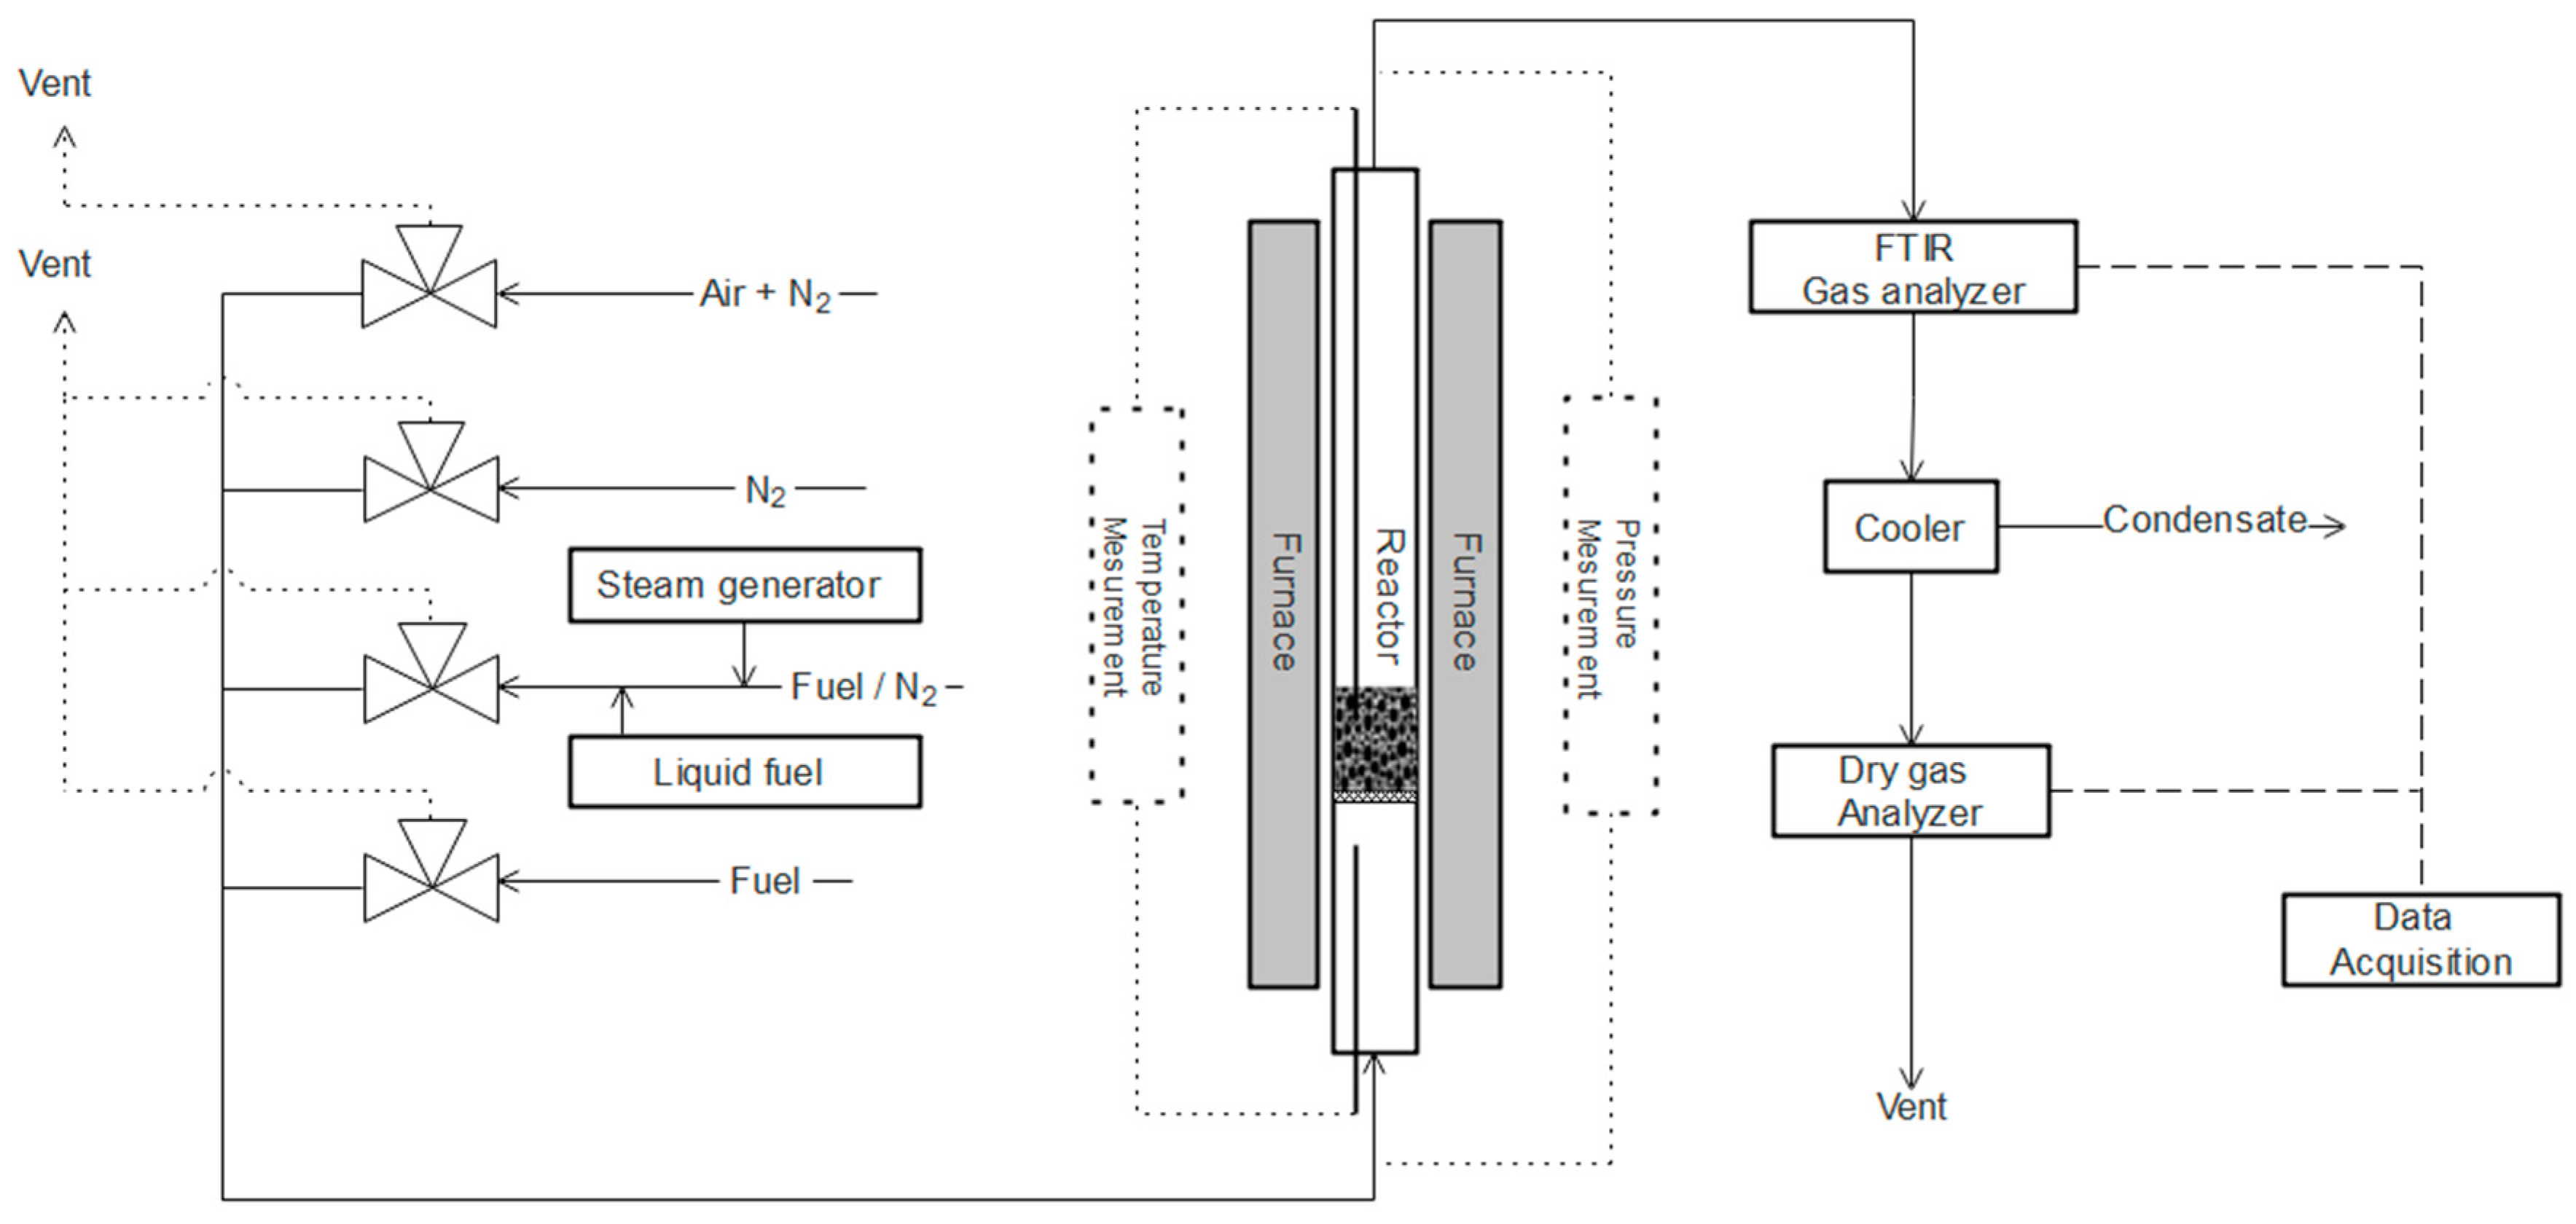
A reactor was placed in a furnace with gas-tight connections (Swagelok) at the top and bottom. A quartz plate with the sample was placed in the middle of the reactor. The temperature was measured by thermocouples (Type K). This was done for both the inflowing gas, just under the porous plate, and the actual bed of particles. A thermocouple was placed in the furnace outside the reactor to regulate the temperature of the furnace. Gases were fed from the bottom of the reactor and the flow of gas was regulated using mass flow controllers. Computer-controlled magnetic valves could be switched according to a pre-defined schedule to provide gases from different gas lines. The pressure drop over the reactor was measured at a frequency of 20 Hz. This frequency made it possible to see if the bed was fluidized or not; a rapidly fluctuating pressure drop over the reactor means that the bed is fluidized while a stable pressure drop without fluctuations indicates a defluidized bed. This component is essential for the system to determine the state of the fluidized bed as visual inspection will influence the experiment; opening the furnace would affect the reactor temperature. The rather small dimensions of the system entailed that the reactor wall influenced the fluidization. Chemical reactions or heat released from chemical reactions can have a large effect on fluidization and defluidize the bed. It is, therefore, important to monitor fluctuations in pressure drop at all times during the experiments. However, due to the small size of the reactor, the connections to the pressure sensor had to be placed after the filters. This, unfortunately, had the effect that absolute measurements of the pressure could not be used since it is influenced by what is caught in the filter and varies throughout the experiment. Pressure measurements only give an on/off indication of whether a bed is fluidized or not. The alternative is to open the furnace and, through the Quartz glass of the reactor, check if the bed is fluidized. This has previously been done in order to check the reliability of the pressure measurement but, of course, can strongly influence the experiment. If fixed-bed conditions are needed instead of fluidized conditions, the gas flow can be reversed and added from the top of the reactor. This action pushes the particles down against the porous plate and creates a fixed bed.
If needed, a liquid, such as water or hydrocarbon liquid, can be added in the form of steam. This can be done either by leading the incoming gas through a water bath with controlled temperature [17] or by using a micro-pump that injects the liquid so that it evaporates in the hot-gas stream [18]. If a liquid is added, heating cords and insulation must be added to all pipes downstream of the injection point to prevent condensation. Due to difficulty in keeping the lines heated, the dew point of the liquid should not be more than 150 °C. No liquid was added in the work presented here.
A solid sample of particles is placed in the reactor before the experiment starts. Additional solid particles, such as solid fuel particles, can also be added from the top of the reactor if a valve is placed there [17,18]. If this is done, a sweeping gas will be necessary to prevent condensation in the solid particle inlet and to help push the solids into the reactor. This sweeping gas is inert, with a comparably small-volume flow, and it never reaches the reaction zone of the reactor. However, the added solids will fall down the reactor and meet a gas that lifts them; for this reason, sufficiently large and dense particles are required. The system is operated at hot conditions, and if the added solids contain volatile components, it is likely that these will leave with the gas flow before the solids reach the fluidized bed [17].
Downstream of the reactor, the gas was lead through heated lines into a cooler where liquid components were condensed. Depending on the experiments, the gas can also go through different types of filters. The remaining gas was analyzed depending on the type of experiment. An on-line IR/UV/paramagnetic/thermal conductivity gas analyzer (Rosemount NGA-2000) was used to measure O2, CO2, CO, CH4, H2, and SO2 [19]. In addition, an online chemiluminescence NO/NOx analyzer (CLD 700 ELht, Eco Physics) [20] or an FTIR (Thermo-Scientific iS50 FT-IR) [16] can be used. In the event an FTIR is used, it is placed before the cooler because it has a heated measuring cell. This is practical if condensable components, such as tar components, are to be measured. The NO/NOx analyzer has a pump that extracts part of the flow and is placed in parallel with the Rosemount analyzer. All gas measurement data was logged together with flow, temperature, and pressure measurements using a Labview program. Extractions of gas that can’t be measured online can be collected for later analysis, for example, via bag sampling for gas chromatography [21]. It is also possible to lead the gas through a trap of some kind, where, for example, NH3 can be absorbed in deionized water mixed with sulphuric acid and analyzed in batches at a later time [20]. However, all additional traps and filters upstream of the dry gas analyzer will add to the residence time in the system and back mixing of the gas. Consequently, it is beneficial to solely measure what is essential for the specific experiment conducted and, thereby, increase the accuracy of the measurements. A schematic overview of the system when steam is added with and the FTIR used for measuring is given in Figure 1. In the present work, no steam was added and only the Rosemount NGA-2000 dry gas analyzer was used.
2.2. The Reactor
A straight reactor made of quartz glass with an inner diameter of 22 mm and a height of 820 mm was used. This reactor had a porous quartz plate placed 370 mm from the bottom to support the bed material. Quartz is used since it is, in most cases, inert, can withstand temperatures up to at least 1100 °C, and can be washed in strong acid. The main drawback with quartz is that it is brittle, and getting the connections between the quartz reactor and the steel pipes sufficiently gas tight is an issue. These problems can be avoided by using a steel reactor and screwing on the connections. However, such a reactor can, in some cases, affect the chemistry by providing catalytic surfaces. Steel also puts a lower limit on the temperature and is harder to clean. With quartz, it is only possible to work at atmospheric pressure. Pressurized conditions are possible with a steel reactor but would require significant modification, essentially a complete rebuild of the current setup.
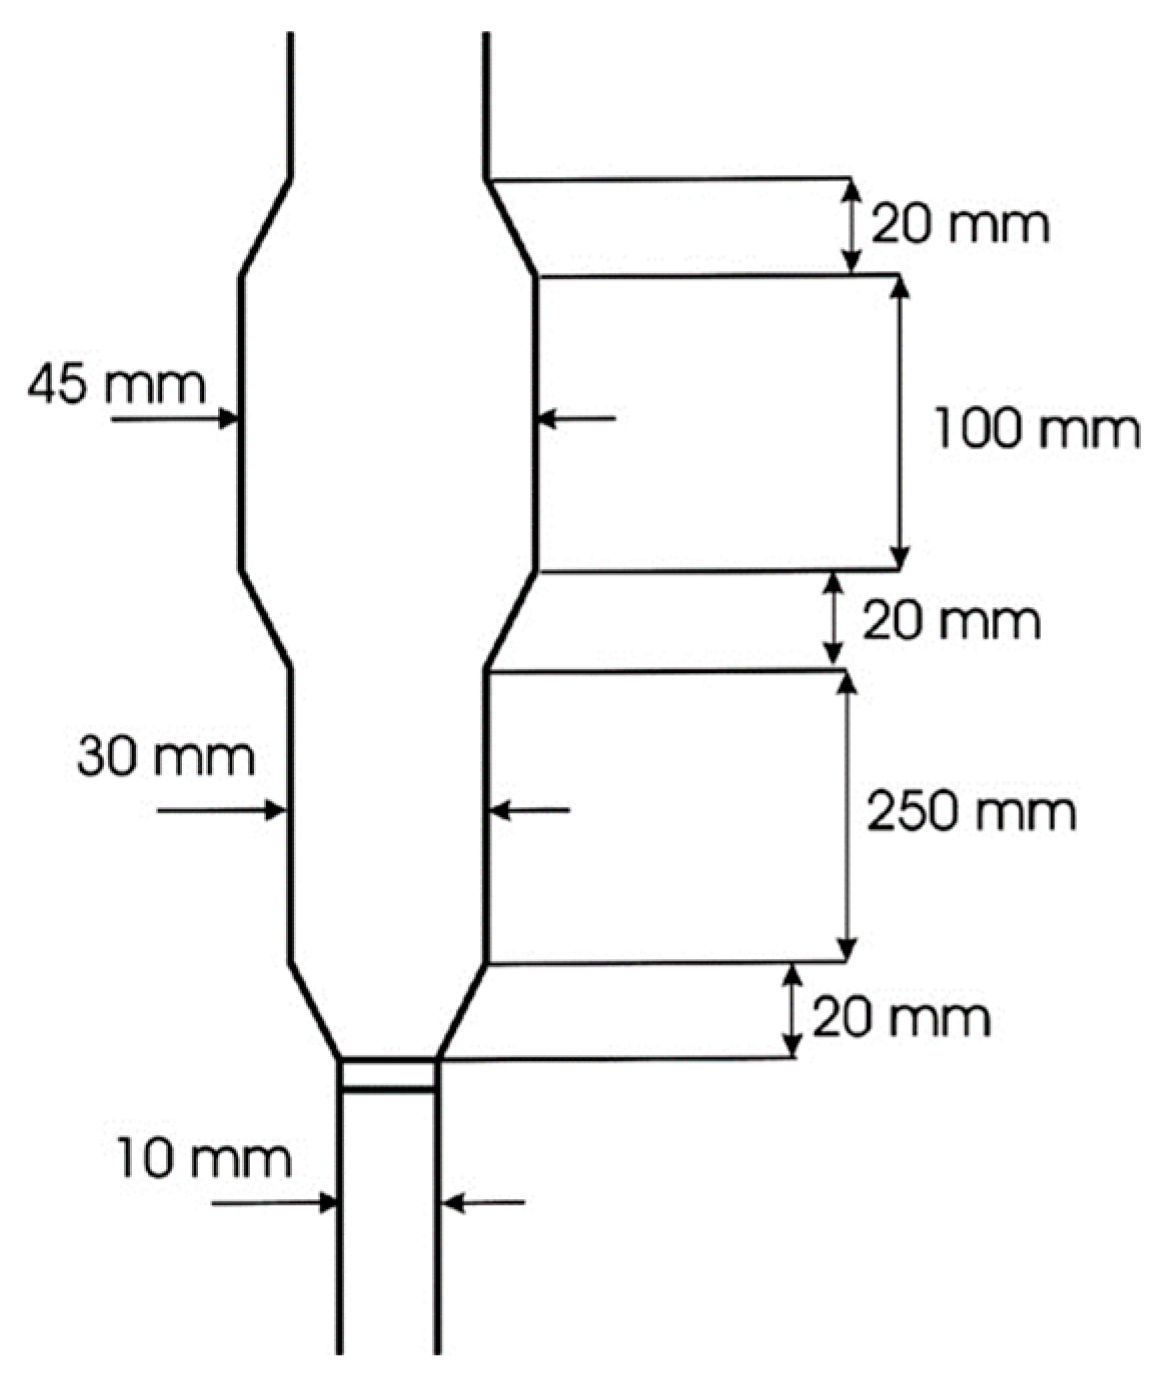
The diameter of the reactor can be altered if required, which will affect the velocity of the gas [17]. This is one of the parameters that influence the fluidization of the sample and will be discussed below. The shape of the reactor can also be altered. For example, the conical reactor shown in Figure 2 is narrower under the plate in order to increase the velocity of the gas. This decrease in diameter promotes the mixing of solid particles in the reactor. The reactor also has a wider section at the top, giving a lower gas velocity to prevent smaller particles from leaving the reactor. The wider part can usually be placed outside the furnace where the temperature is lower; this gives even lower gas velocities. This is practical if a fuel is converted in the reactor and forms small ash particles, and the ash particles are intended to stay in the reactor [18].
2.3. Outline of Experiments
Metal oxide particles (15 g) with a size of 125–180 µm were placed on the porous plate inside the reactor. As the reactor was heated to the operating temperature (850–1050 °C), the particles were fluidized in oxidizing conditions (5 vol.% O2 in N2). This oxygen concentration was chosen since it resembles the approximate O2 concentration in the outlet of a large-scale combustion boiler. However, using an O2 concentration less than that of air also decreases temperature spikes if exothermic oxidation takes place. It is possible to do the heating in any atmosphere. Inert nitrogen is often used to avoid any reaction until the desired temperature has been reached [22]. Oxidizing conditions during heating were used since the particle in this work releases O2 in inert atmospheres. The operating temperature (850–1050 °C) was chosen since it is a reasonable combustion temperature for a CLC unit and the Mn/Si oxide also has interesting phase transitions at these temperatures. For practical reasons, only three temperatures could be tested.
When the desired bed temperature was reached, the sample was exposed to oxidizing, inert, and reducing conditions according to a procedure developed in previous work [22]. The sequence is controlled using magnetic valves that switch the gases on and off. A sequence of one reducing period followed by one oxidizing period is referred to as a cycle. In-between each reduction and oxidation, the reactor is flushed for 60 s with an inert gas (nitrogen) to avoid mixing the gases from the reduction and oxidation phases. All cycles were conducted at least twice to guarantee steady chemical behavior. It can often take a few cycles to reach a stable condition, but, in this work, cycles conducted under the same conditions were more or less identical. During the re-oxidation of the particles, the oxidizing flow was maintained until the oxygen concentration in the outlet was stable and equal to the feed concentration of 5 vol.%.
Syngas, a mixture of 50/50 CO and H2, was used to evaluate the reactivity of the oxygen carriers. Since one mole of methane consumes four moles of oxygen, as compared to one mol for CO or H2, the feeding of syngas should be four times longer than the feeding of methane to reach the same reduction level of the oxygen carrier. This is assuming a constant flow and the same level of conversion for the reducing gas, which is not always the case. The length of the reduction was selected in order to obtain a 1–2% mass reduction of the materials since this corresponds to what can be expected in a CLC system. The release of gas-phase oxygen (Chemical-Looping with Oxygen Uncoupling, CLOU [23]) was investigated during the exposure of N2 for 360 s. However, only the last 300 s were used for evaluation due to the risk of back-mixing during the first part of the exposure phase. Back-mixing makes it hard to determine if the O2 originated from the oxygen carrier particles or the gas flow in the previous oxidation. In order to see if the material was damaged by the high-temperature operation at 1050 °C, the experiments at 950 °C were repeated before the experiments were terminated. A presentation of how each material was tested is given in Table 1.
A large number of different types of experiments can be conducted with this set-up. The results presented here are primarily relevant for oxygen carrier tests for CLC applications. However, a slightly altered procedure and set-up can be used for conventional combustion [14], gasification [15], or reforming experiments [16]. Basically, any gas, and most liquids, can be added to more or less any type of solid particles in fluidized conditions. It is possible to change between different gases by using the automatic magnetic valves that can open and close in any preprogrammed order. It is possible to add solids during experiments, but this must be done manually [21]. The temperature of the reactor can be changed independently even if the response of the system is slow. It is, however, possible to quickly cool the sample by turning off and opening the furnace [24].
2.4. Flows and Fluidization
To have a stable fluidized bed, the flow through the reactor must be well above the minimum fluidization velocity (Umf) [1]. During oxidation in this study, the flow rate was 900 mL/min. This was 10–14 times the minimum fluidization velocity (0.014 m/s < Umf,oxidizing < 0.016 m/s) since temperature influences the gas volume. Flow rates of 450 mL/min and 600 mL/min were chosen for the inert and reduction phases (syngas and methane). These conditions give 4–5 and 7–9 times, respectively, the minimum fluidization velocity (0.019 m/s < Umf,fuel < 0.023 m/s, 0.014 m/s < Umf,inert < 0.016 m/s). Ideally, the same gas flow should be used throughout the experiment since this would give more stable conditions in the reactor and simplify gas measurements and evaluation. However, in the present study, oxygen was consumed during oxidation, which lowered the flow. Gas is generated during reduction with CH4 since one mole of CH4 produces two moles of H2O and one mole of CO2.
Fluidization is influenced by a large number of parameters [1]. First, the size, shape, and density of the particles affect fluidization. Particle size can often be altered simply by sieving. However, it is important to keep in mind that a different particle size can also influence the rate of the chemical reactivity of the material. The velocity of the gas is a primary parameter. The density of the fluidizing gas is influenced by the composition of the gas and the temperature. Both parameters can be affected by the experiment. Finally, as mentioned above, the diameter and shape of the reactor influence fluidization. All these parameters must be considered when the experiment is set up and usually, a trade-off between different parameters is needed. However, the fluidization regime is wide. Good experiments can be conducted with as little as twice the minimum fluidization velocity. If a reactor with a wide top part is used, even velocities over the fly-off gas velocity can occasionally give good data since the wider top makes particles fall back into the reaction zone. However, if possible, an interval of 5 to 15 times the minimum fluidization velocity is recommended.
2.5. Particles
The aim of the present experiments was to test the redox behavior of oxygen carriers used in CLC. The oxygen carriers were prepared from commercial raw materials by VITO in Belgium through spray-drying [22]. First, these raw materials were milled to a powder and dispersed in deionized water together with organic additives, such as binders and dispersants. The slurry was pumped through a nozzle into the spray-dryer. As the slurry formed droplets, the water evaporated. The particles formed by the dried droplets were calcined in air at defined conditions. Table 2 gives an overview of the particles and the conditions during production. Due to calcination temperatures that were too high, some materials melted and could not be tested. Calcination or heat treatment of particles prior to fluidized bed experiments is an effective way to increase the hardness of most materials, however, this often comes at the price of denser particles and decreased chemical reactivity [25]. It is also a good way to remove organic additives or impurities from the sample. Prior to testing, the samples were sieved through stainless steel screens to obtain particles in the size range of 125–180µm for fluidized bed testing and of 180–250µm for crushing strength measurement. The combined manganese silica particles supported on TiO2 were used. The Mn/Si ratio was the same for all of the particles while the TiO2 content and sintering temperature were varied. These are particles that have known CLOU properties [26], other types of Mn/Si particles have been tested in other work [19,27,28,29].
There are many other ways to produce particles [30], but particle production is not necessary. Often ores, sand, or other materials can be used as received after only mechanical crushing followed by sieving [14,21].
The density of particles strongly affects the minimum fluidization velocity needed to fluidize them [1]. For this reason, density was measured by weighing a defined volume of the material. It is also important to quantify mechanical durability, which was done by measuring crushing strength and testing attrition resistance. Crushing strength is the average force required to break 30 individual particles in the size range of 180–250 µm. This was done by using a digital force gauge (Shimpo FGN-5). Attrition resistance was obtained in a jet cup attrition rig when particles were exposed to a high-velocity gas jet. The fines produced, after specific time intervals, were collected in a filter and weighed. The attrition index Ai can be used to compare materials and is calculated according to Equation (3).
mf,t is the cumulative elutriated mass at time t, and ms is the initial mass of the sample. The attrition index is not to be interpreted as an estimation of the expected lifetime of the oxygen carrier. This measurement is only the relative mechanical durability of the particles. A thorough description of the set-up and procedure for attrition measurements can be found elsewhere [10]. A measure of the mechanical properties of the particles is required for most applications. The fluidizing conditions in the small quartz reactor do not put much physical stress on the particles, however, if break-down of the particles occurs in this setup it is a sure indication of them being too soft. For oxygen carrier applications, it has been concluded that the crushing strength is not a good measurement of the particles’ physical properties during hot fluidized conditions. For this reason, the attrition index measurement was introduced [10].
The specific surface area (BET) of the oxygen carriers was measured. This was done both before (fresh state) and after (used state) reactor testing. N2 adsorption was measured in a Micromeritics TriStar 3000 apparatus. The phase composition was determined using powder X-ray diffractometry (Siemens D5000, Cu Kα1 radiation). All materials were analyzed before and after reactor testing.
It is possible to use other methods to analyze the solid particles before and/or after the fluidized-bed experiments. Apart from the techniques above, thermogravimetric analyzer (TGA), SEM, EDX, and elemental analysis ICP-MC are the most frequently used in the work of the authors. The method used to analyze the samples strongly depends on the type of experiment being conducted and the intended use of the investigated materials.
2.6. Data Evaluation
The most used parameters for oxygen carrier performance are fuel conversion, which is expressed by the CO2 gas yield (γ), and the degree of oxygen carrier conversion (ω). These are calculated in Equations (4) and (5).
The symbols γCO2, γCO, and γCH4 are the molar fraction of CO2, CO, and CH4 in the off-gas stream, m is the mass at any level of reduction or at any time of the experiment, and mox is the mass of the oxygen carrier in its fully oxidized condition. Since the oxygen carrier conversion ω cannot be directly measured in a fluidized bed, it was calculated as a function of time from the measured outgoing gas concentrations and the mass balance over the reactor. Equation (6) was used for syngas and Equation (7) for methane.
MO is the molar mass of oxygen, and ń is the molar flow rate at the reactor outlet. In the present study, the average values for the CO2 yield have been calculated for ω ranging from 1 to 0.99.
3. Results
3.1. Raw Data
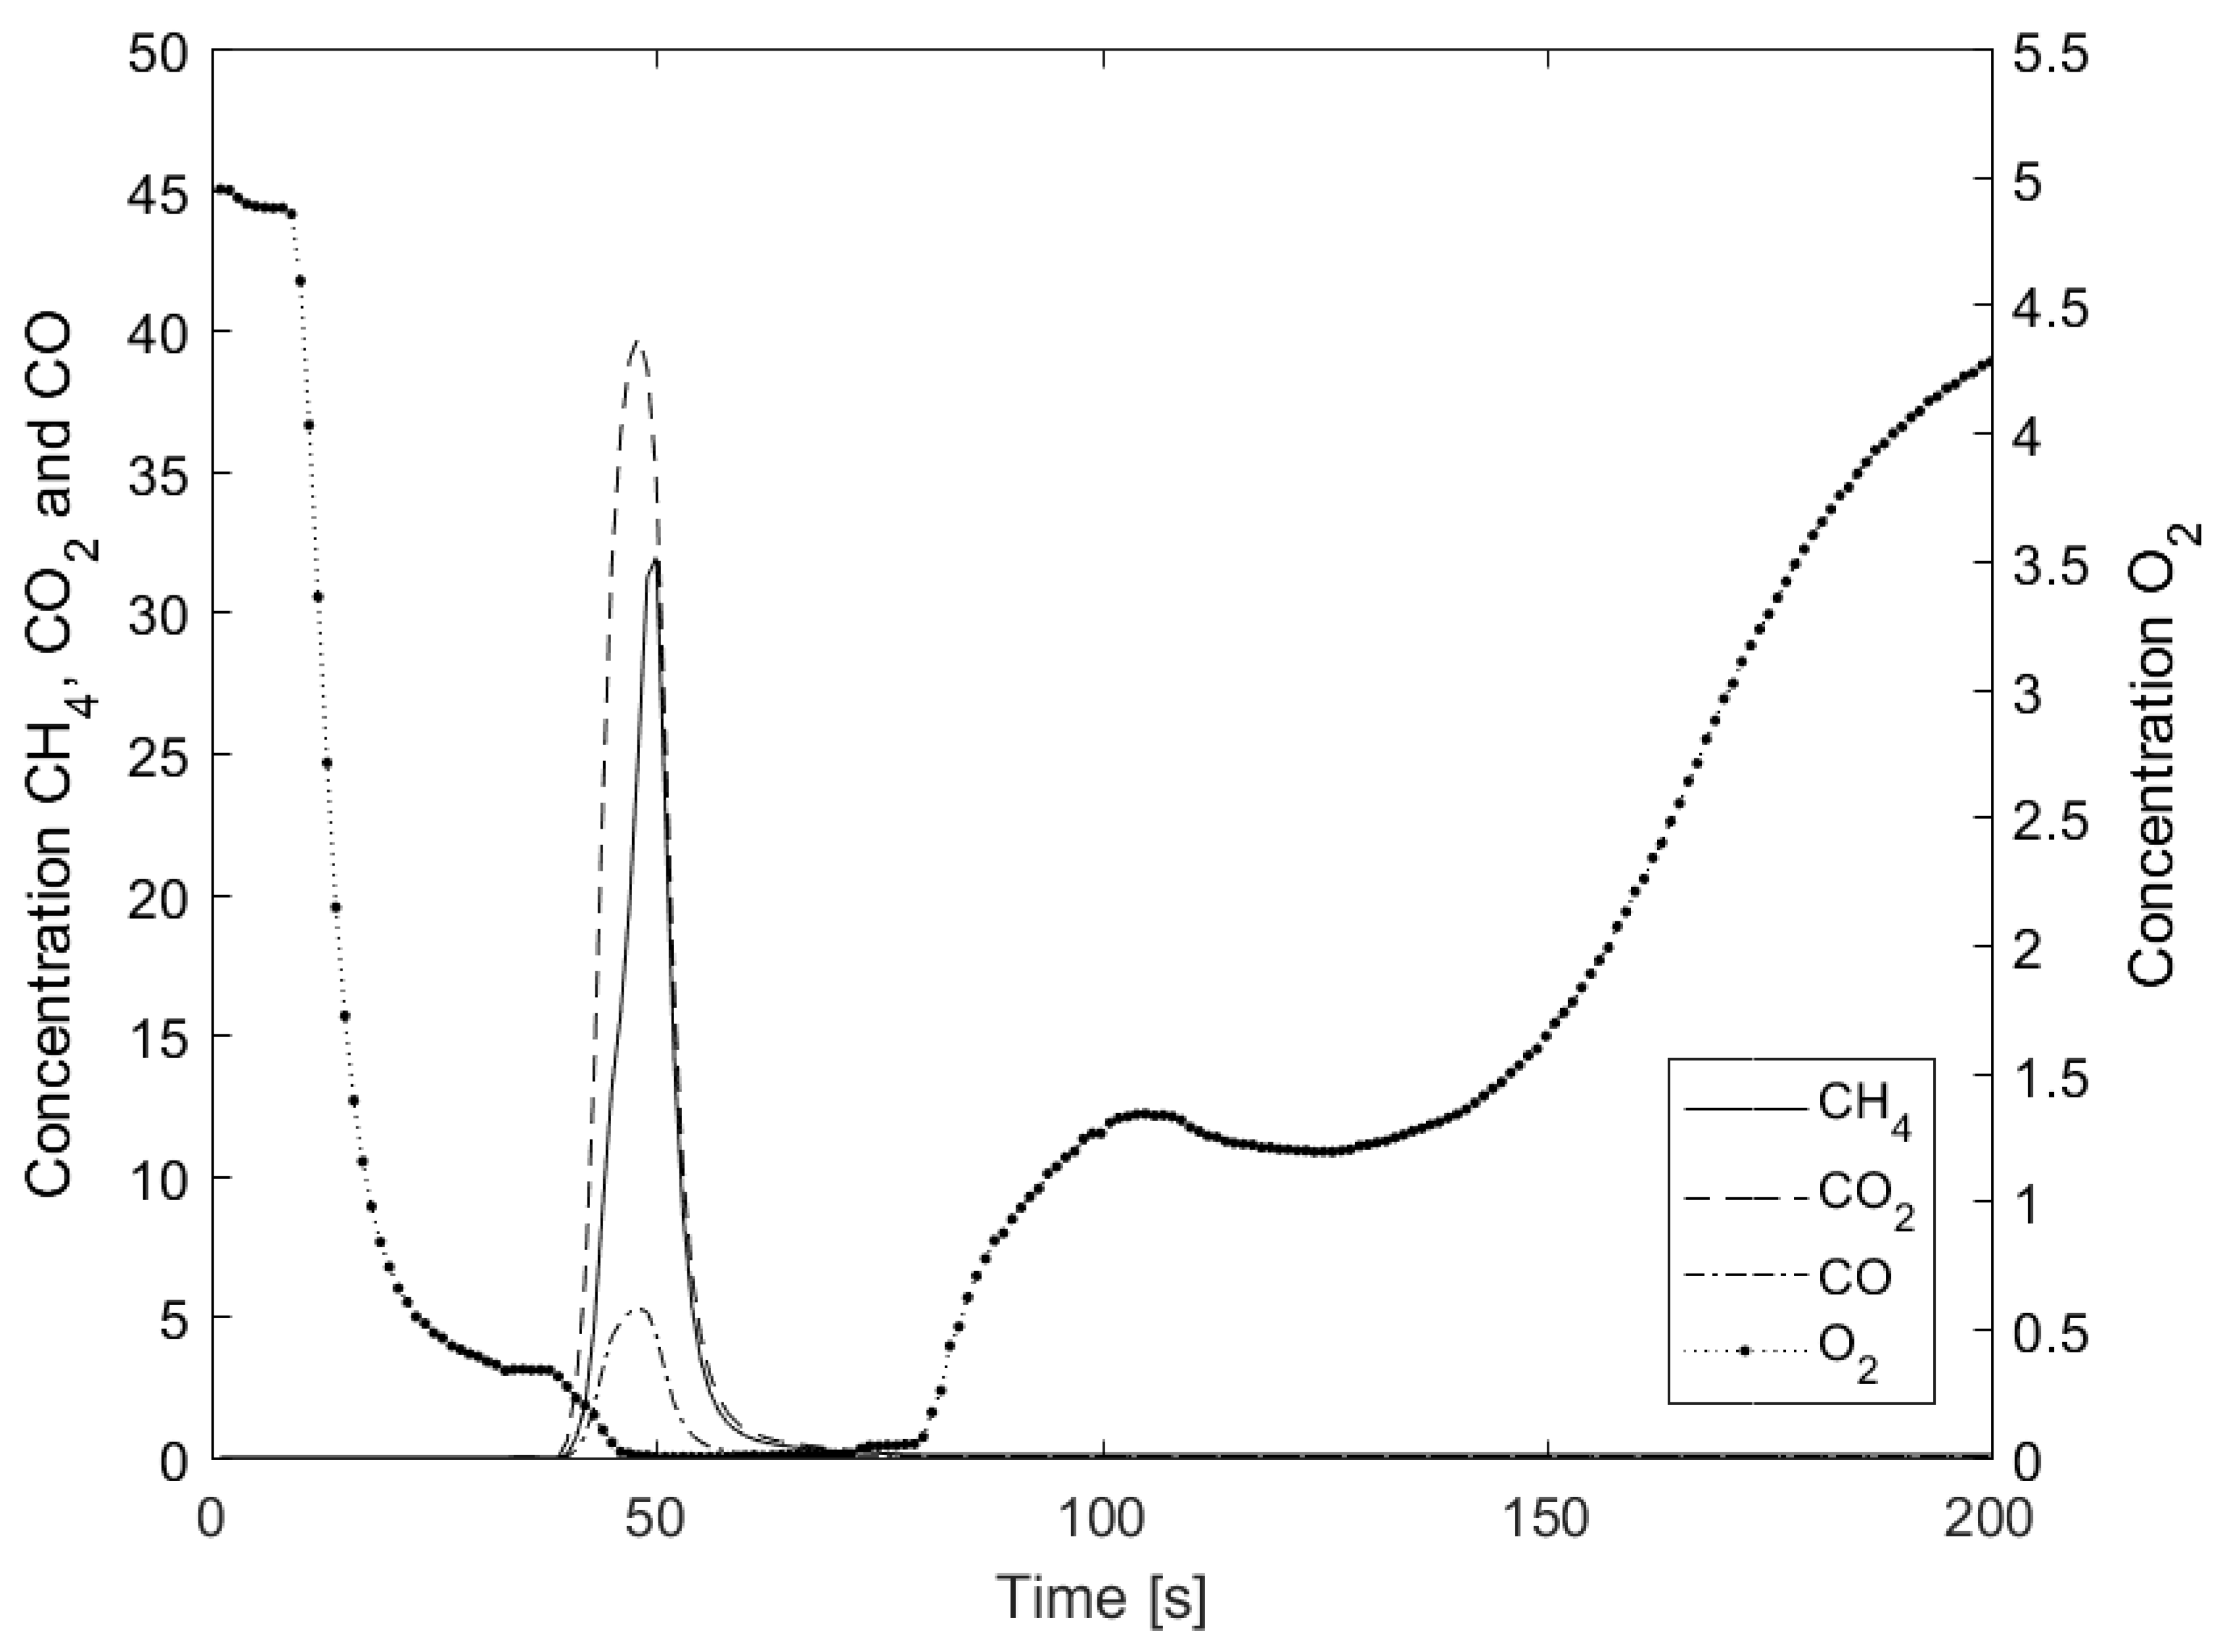
Figure 3 presents the logged raw data of one cycle. At time 0, the inert gas was turned on, but due to a delay in the system, the response in the form of a decrease in O2 concentration appeared after 20 to 25 s. This response time is dependent on the flow, the length of the pipe, whether additional traps or coolers are added, and all the other components the gas passes through. The more analytical equipment, traps, and piping that the gas must pass through, the longer this transient. There is always a trade-off between what can be analyzed and the accuracy of the experiments. Reference experiments are needed to accurately evaluate the data in which the same gas flows are injected using the same schedule for gas switches, but with an empty reactor or a reactor with inert bed material. By correlating the actual experiments to the reference with an empty reactor [17], a better evaluation of the data can be made. Nevertheless, factors such as a change in gas flow due to chemical reaction must be accounted for.
As a gas flow is switched from 5% air to inert N2 there is usually a gradual transient before the O2 concentration falls to zero. However, in this particular experiment, the O2 concentration never reached zero. This was because the particles used in this experiment had the ability to release gas-phase O2 according to CLOU [23]. For this reason, all O2 released after about 50 s following the gas switch originated from the particles in the bed and not the previous oxidation period.
After 60 s, the inert N2 was replaced with CH4, and again there was a delay in the system, but, eventually, the CO2 increased rapidly as the injected CH4 was converted. The amount of CH4 that passed through without being converted increased throughout the whole cycle. As the particles in the bed were depleted of oxygen, there was also some CO due to the partial conversion of the CH4.
When the CH4 was turned off and replaced with N2, the gas concentration of CO, CO2, and CH4 dropped to zero. The O2 reached zero since the particles had become so reduced that they no longer released oxygen. As the inert was replaced with 5% O2 in N2, the O2 concentration increased. However, since the reactivity of the particles in O2 was fast, most O2 was consumed by the particles during the first part of the oxidation. After some time, however, the O2 concentration increased, and when the incoming O2 concentration was reached, which took around 1000–1500 s (not included in the figure), the particles had been fully oxidized and a new cycle could start. If the parameters of the experiments were changed for the next cycle, for example to a different temperature, this should be done at this stage when no reactions occur.
3.2. Syngas Conversion
Conversion of gaseous fuels under different conditions can easily be investigated using the current setup. Here, methane and syngas (50 vol.% H2 in CO) were used to reduce the oxygen carrier. The CO2 yield from the conversion of syngas as a function of oxygen carrier conversion at 950 °C is presented in Figure 4. CO2 yield from syngas conversion as a function of oxygen carrier conversion at 950 °C.
It is evident that all Mn-Si-Ti materials calcined at 1100 °C fully convert syngas in an ω range from 1–0.98. For the conversion of syngas, all materials have a measured oxygen transfer capacity of about 2.3 wt.%. This would probably be higher for several of the materials if the reduction time had been longer. Materials calcined at 1150 °C showed decreasing CO2 yields for increasing Ti content. M60ST20_1150 had the worst syngas conversion with an oxygen transfer capacity for syngas of about 1.4 wt.%. The purpose of the experiments with syngas was partly to check that the material had sufficient oxygen transfer capacity and, partly, to activate the oxygen carriers [31]. First, the almost complete reduction and oxidation of the particles under activation is a way of stabilizing the conditions so that the oxygen carriers are more similar to the particles used in a real system. Second, this ensures that any remaining effect of the heavy oxidation during calcination no longer influences the particles chemically.
If the intention is to investigate the reactivity of the oxygen carriers with syngas, the set-up used here is far from optimal. Figure 4 shows that the difference in reactivity between the investigated materials is small with close to 100% fuel conversion for most materials. This makes it very hard to distinguish what material actually has the best reactivity with respect to syngas. Perhaps all particles had more or less the same reactivity, but this is not very likely. In order to get better data, a new experiment could have been set up with either a higher gas flow or a lower bed mass so that the particles will be in an environment where full conversion is not possible. That way, it is easier to differentiate between the different materials. However, since CH4 is more difficult to convert than both H2 and CO, CH4 is the limiting parameter, and methane conversion, therefore, is the most interesting factor to investigate here. The experiments with syngas were done under the same conditions as those used for methane in order to save time.
3.3. Methane Conversion
Figure 5 shows that the methane conversion clearly decreased with increasing titanium content of the oxygen carrier material. This is especially obvious for the materials calcined at 1150 °C. The same is true for the oxygen transfer capacity, ω. In Figure 5, left side, it can be seen that the conversion decreases for materials calcined at 1150 °C from 1.25 wt.% to 0.5 wt.% when the TiO2 content in the raw material is increased from 2 wt.% to 20 wt.%. M74ST2_1100 and M72ST5_1100 show almost identical and overall the highest methane conversion for all investigated bed temperatures, as shown in Figure 5, right side. The experimental set-up here displays the differences between the materials and makes it possible to determine the particles with the highest conversion rate.
When comparing the average CO2 yield at 950 °C before and after operation at 1050 °C, it can be seen that the conversion decreased by a small amount for most materials. A larger decline of more than 20% can be seen only for the two materials produced from 20 wt.% TiO2. No agglomerations were found in any Mn-Si-Ti material after exposure to alternating oxidizing and reducing conditions at temperatures from 850–1050 °C. These results are in line with previous research on Mn/Si oxides but without the addition of any TiO2 [28].
3.4. Release of O2
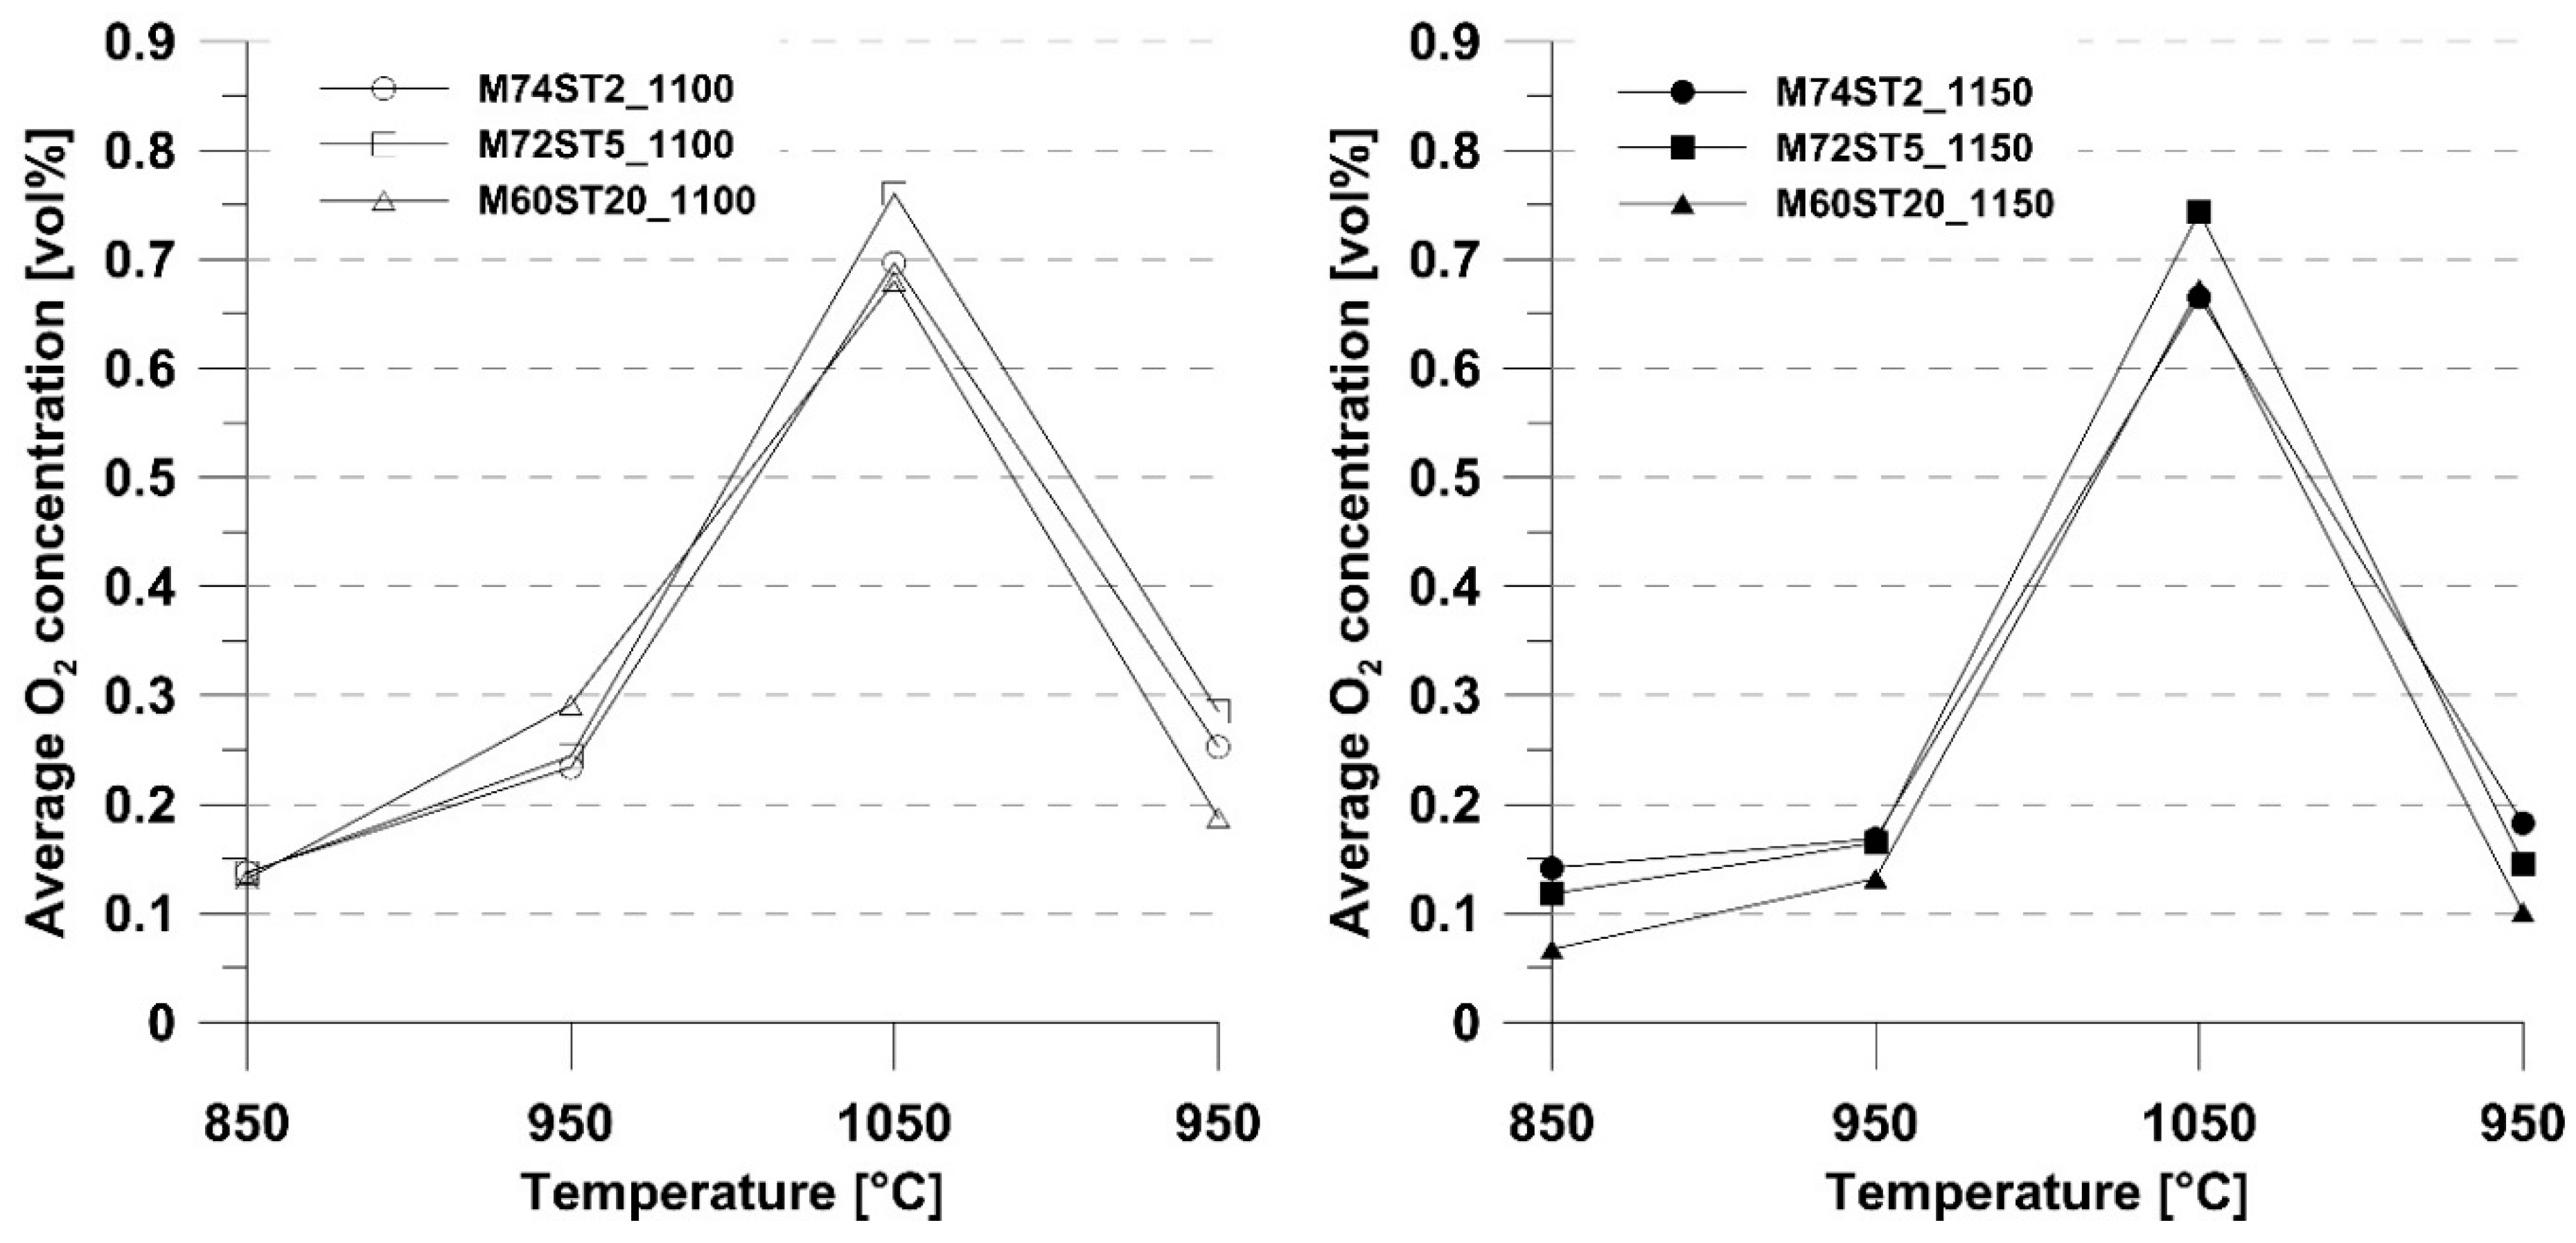
Figure 6 shows the release of gas-phase oxygen in inert nitrogen at temperatures ranging from 850–1050 °C. It is obvious that the oxygen released from the particles in an inert atmosphere increased significantly with increasing bed temperature. This can also be explained by the phase diagram for the Mn/Si oxide system [28]. For a specific temperature, the oxygen concentration, observed for all materials, is quite similar, which is expected based on the phase diagram of the material [28]. Noticeable is the higher value at 1050 °C for both materials with 5.4 mol.% Ti. The materials with a lower Ti content (M74ST2, N72ST5) proved to be superior to those with a high Ti content (M60ST20) for the cycles run at 950 °C after operation at 1050 °C.
3.5. Physical Changes and Mechanical Durability
Bulk density and specific surfaces areas are parameters that help to describe changes in the morphology of the oxygen carriers. The corresponding values for the Mn-Si-Ti oxygen carriers are listed in Table 3.
It is obvious in the table that the bulk density increased for all Mn-Si-Ti-based materials with increasing calcination temperature. Furthermore, a slight increase can be seen with increasing Ti content, especially for materials calcined at 1150 °C. The densities remained similar during the test in the batch fluidized bed reactor.
The specific surface area decreased considerably with increasing calcination temperature. This is in line with previous observations [25]. The table shows a trend towards smaller surface areas for larger Ti contents. A comparison of fresh and used particles shows that materials calcined at 1100 °C decreased in surface area, whereas those calcined at 1150 °C increased in surface area.
Mechanical durability was surveyed by measuring the crushing strength of the different Mn-Si-Ti materials in the fresh state and testing them in an attrition rig after exposure to alternating reducing and oxidizing conditions in the batch-fluidized-bed reactor. The results are summarized and presented in Table 4. The crushing strength measured for fresh particles showed a trend towards higher values for particles containing larger amounts of Ti. This was more obvious for materials calcined at 1150 °C. It can be concluded that materials calcined at a higher temperature exhibit a higher crushing strength value.
When the results from the attrition rig are examined, it can be seen that even the used materials calcined at 1100 °C were more prone to mechanical attrition than the materials calcined at a higher temperature. The two weakest materials were destroyed halfway into the attrition test. Such behavior has been explained at length elsewhere together with a discussion of the benefits of attrition testing over measuring crushing strength [10].
3.6. X-ray Diffraction
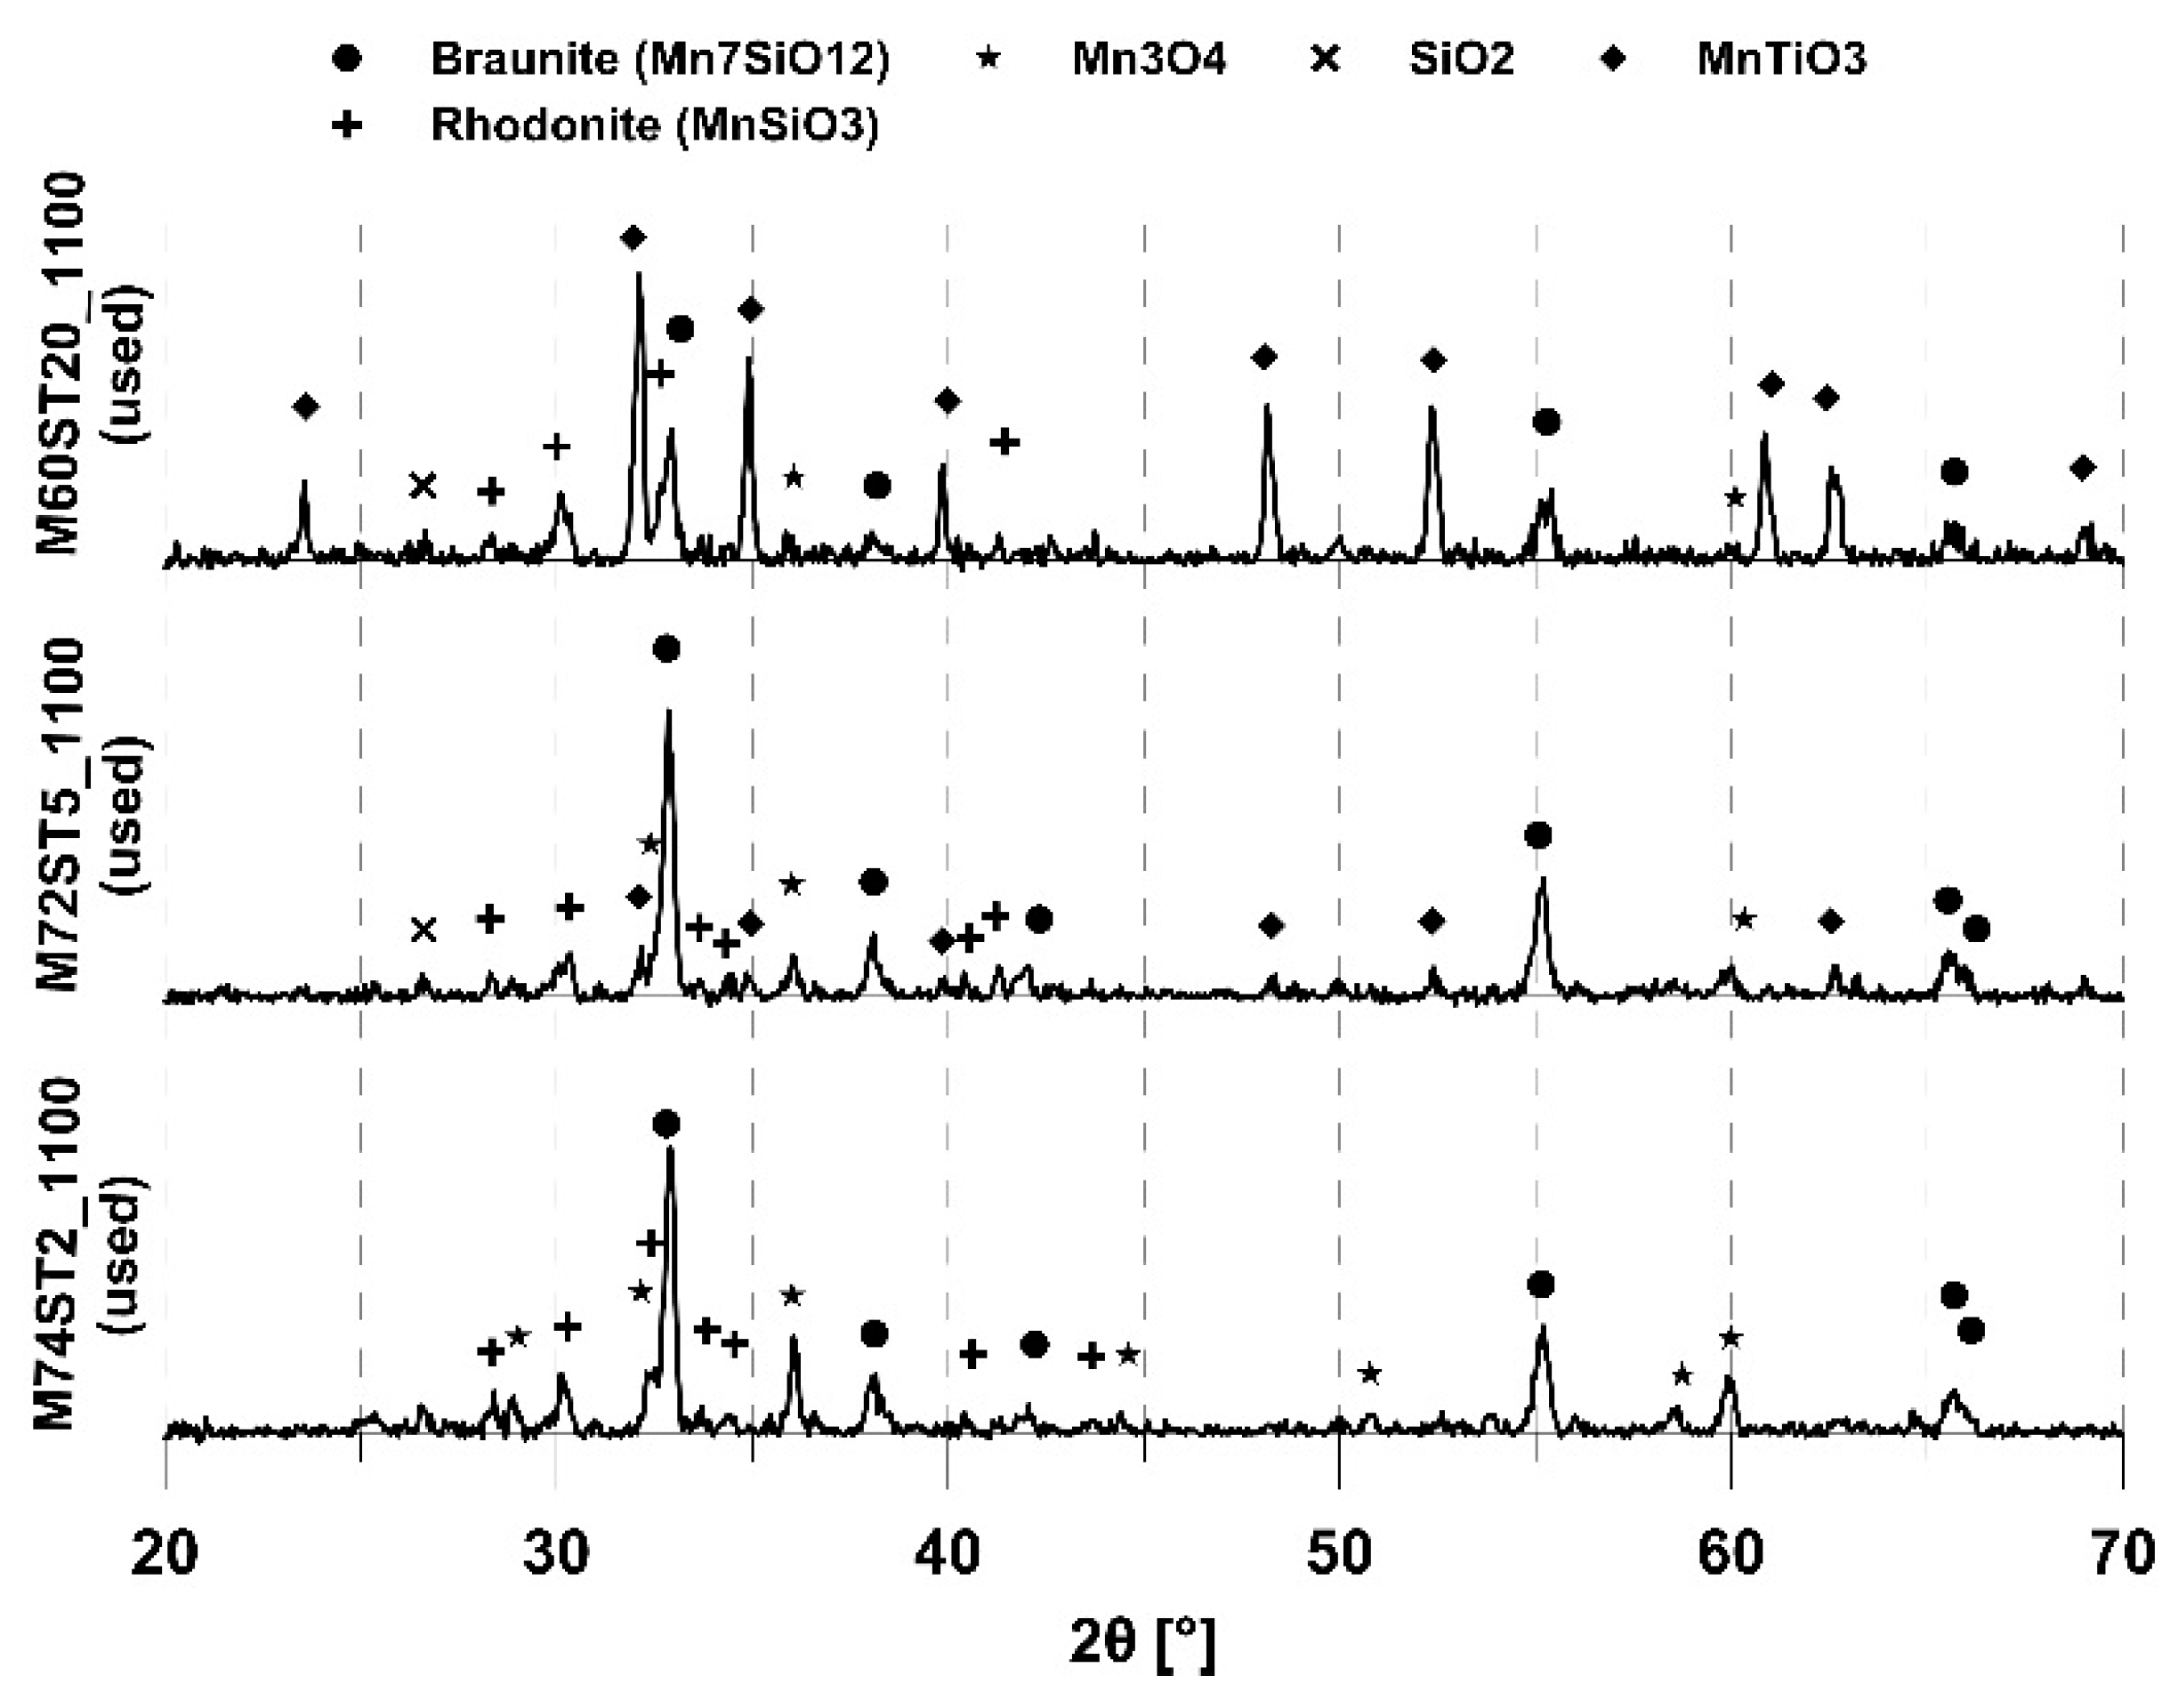
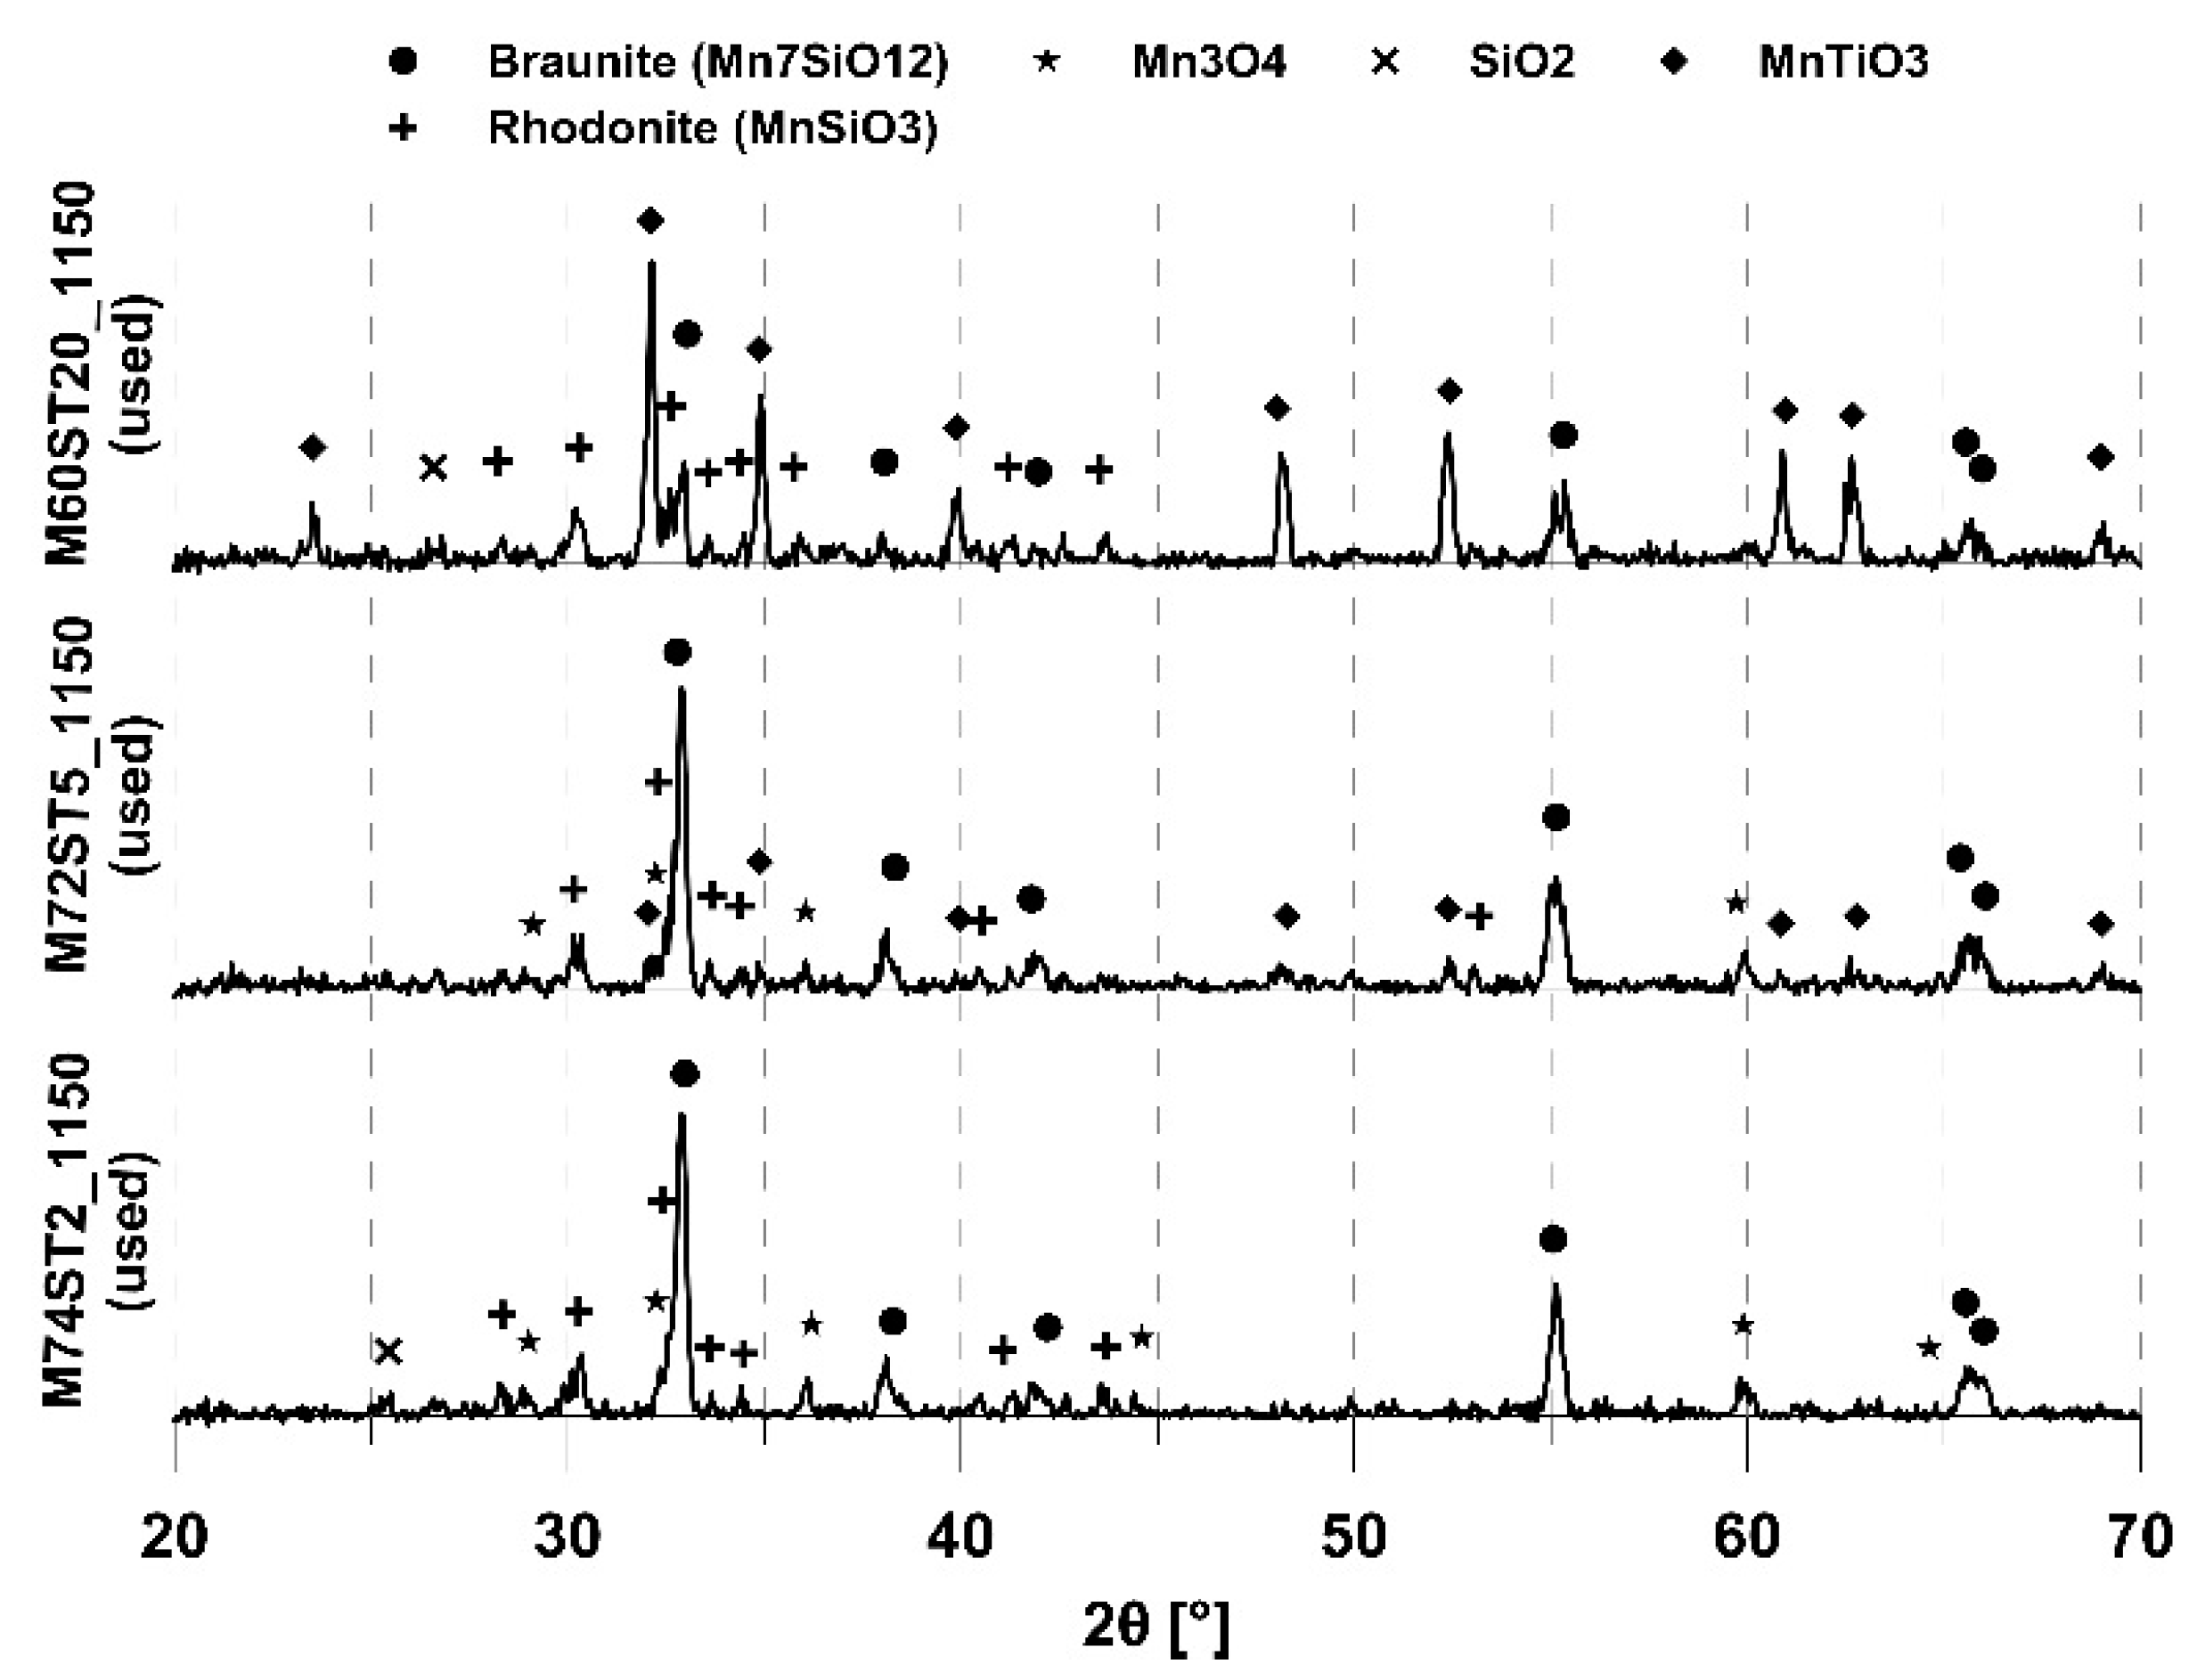
To detect crystalline phases, X-ray diffraction experiments were performed on fresh particles and the samples used in the batch fluidized bed reactor. The identified phases agree well with the expected phases [28]. The predominant phases detected in the used samples were Braunite (Mn7SiO12), Rhodonite (MnSiO3), and Manganese titanate (MnTiO3). Some Silicon dioxide (SiO2) and Manganese oxide (Mn3O4) were also identified. Interestingly, Mn3O4 was almost exclusively detected in the used samples, whereas TiO2 was only found in the fresh ones. This indicates that it was not possible to oxidize MnTiO3 back to TiO2 and Mn3O4 back to Mn7SiO12, which are the predominant phases in the fresh samples. Diffractograms of the used samples are shown in Figure 7 and Figure 8.
3.7. SEM Images
Electron images were taken with a magnification of 2000× and 10,000× to identify changes in particle morphology. Figure 9 presents the SEM images for M60ST20_1150 before and after the reactor experiments.
Figure 9 shows that there is hardly any difference before and after the reactor experiments, and this was also found for the other investigated materials.
4. Discussion
When a material is developed for a process or application, small-scale testing is often needed to screen candidates or test the material under specific conditions. Testing should be done using conditions relevant to the application, but, for practical or economic reasons, testing conditions may have to be simplified or adapted. A material or sample in a fluidized bed will experience very different conditions compared to a sample in static or fixed-bed conditions. The setup presented here is one of the smallest possible systems that can be realized while maintaining fluidized bed conditions. The small size makes it easy to use for experiments and requires less sample.
In CLC [17] or OCAC [14] the goal is full conversion of the fuel to CO2 and water. If less oxygen is provided to the oxygen carrier, the fuel will only be converted to CO and hydrogen, which is useful in reforming [16] or gasification [15]. These are conditions that can be investigated in the present fluidized-bed reactor system, and this is what the system is mostly used for. However, it is possible to use the same system for sulfurization [32], hydration, nitration, temperature cycling, or any other application that requires fluidized-bed conditions. Other applications where the current system has been used are: Determining fluidization parameters for modeling; extracting reaction kinetics for combustion and gasification; pyrolysis of electronic waste; oxidation and reduction of metal oxides when a specific oxidation or reduction degree of the sample is needed; nitration and hydration of uranium and zirconium to test production methods for nuclear fuels; burning of impurities from inorganic samples; and recycling of TiO2 from paints using gasification of organics. The system has even been used to determine the enthalpy of a reaction [33]; therefore, the real beauty of the system is its flexibility.
5. Conclusions
Mn/Si oxygen carriers with added TiO2 were evaluated in this work. The general trend observed was that a lower fraction of TiO2 increased the chemical reactivity but lowered the physical integrity (higher attrition) of the oxygen carriers. The sample with 2% Ti converted twice as much methane but had an attrition index magnitude that was higher than the sample with 20% Ti. The use of a higher temperature during production heat treatment lowered the chemical reactivity but increased the physical integrity (lower attrition) of the materials. For this reason, a trade-off must be made depending on which is the most important, chemical reactivity or physical integrity.
The novel reactor system described is available at Chalmers University of Technology. The corresponding author is open to new ways of using and improving it. The proposal for cooperation is always of interest, and it is also possible to arrange visits were students or researchers can use the described laboratory system if the issue of funding can be solved.
Author Contributions
Conceptualization, Methodology, Writing-Review & Editing, Supervision, Project Administration, Funding Acquisition mainly by H.L.; Formal Analysis, Investigation, Data Curation, Writing-Original Draft Preparation, mainly by V.F. and F.H.
Funding
The work in this paper was funded by Formas and a joint project between Preem and the Swedish Energy Agency STEM.
Acknowledgments
The authors acknowledge the work of the late Dongmei Zhao (deceased 18 December 2016). Up until the point of her death, she was closely involved with the practical work and methodology and made many important contributions.
Conflicts of Interest
The authors declare no conflict of interest. The funders had no role in the design of the study; in the collection, analyses, or interpretation of data; in the writing of the manuscript, or in the decision to publish the results.
References
- Kunii, D.; Levenspiel, O. Fluidization Engineering, 2nd ed.; Butterworth-Heinman: Oxford, UK, 1991. [Google Scholar]
- Keller, M.; Arjmand, M.; Leion, H.; Mattisson, T. Interaction of Mineral Matter of Coal with Oxygen Carriers in Chemical-Looping Combustion (CLC). Chem. Eng. Res. Des. 2014, 92, 1753–1770. [Google Scholar] [CrossRef]
- Rubel, A.; Liu, K.; Neathery, J.; Taulbee, D. Oxygen carriers for chemical looping combustion of solid fuels. Fuel 2009, 88, 876–884. [Google Scholar] [CrossRef]
- Abad, A.; García-Labiano, F.; de Diego, L.F.; Gayán, P.; Adánez, J. Reduction Kinetics of Cu-, Ni-, and Fe-Based Oxygen Carriers Using Syngas (CO + H2) for Chemical-Looping Combustion. Energy Fuels 2007, 21, 1843–1853. [Google Scholar] [CrossRef]
- Leion, H.; Zhan, X.; Frick, V. Determining CLOU Reaction Kinetics for Combined Oxygen Carriers—Discussing the Experimental Methods. Energy Technol. 2016, 4, 1247–1253. [Google Scholar] [CrossRef]
- Adanez, J.; Gayán, P.; Celaya, J.; de Diego, L.F.; García-Labiano, F.; Abad, A. Chemical Looping Combustion in a 10 kWth Prototype Using a CuO/Al2O3 Oxygen Carrier: Effect of Operating Conditions on Methane Combustion. Ind. Eng. Chem. Res. 2006, 45, 6075–6080. [Google Scholar] [CrossRef]
- Shen, L.; Wu, J.; Xiao, J.; Song, Q.; Xiao, R. Chemical-Looping Combustion of Biomass in a 10 kWth Reactor with Iron Oxide As an Oxygen Carrier. Energy Fuels 2009, 23, 2498–2505. [Google Scholar] [CrossRef]
- Lind, F.; Seemann, M.; Thunman, H. Continuous Catalytic Tar Reforming of Biomass Derived Raw Gas with Simultaneous Catalyst Regeneration. Ind. Eng. Chem. Res. 2011, 50, 11553–11562. [Google Scholar] [CrossRef]
- Bemrose, C.R.; Bridgwater, J. A review of attrition and attrition test methods. Powder Technol. 1987, 49, 97–126. [Google Scholar] [CrossRef]
- Rydén, M.; Moldenhauer, P.; Lindqvist, S.; Mattisson, T.; Lyngfelt, A. Measuring attrition resistance of oxygen carrier particles for chemical looping combustion with a customized jet cup. Powder Technol. 2014, 256, 75–86. [Google Scholar] [CrossRef] [Green Version]
- Adanez, J.; Abad, A.; Garcia-Labiano, F.; Gayan, P.; Luis, F. Progress in Chemical-Looping Combustion and Reforming technologies. Prog. Energy Combust. Sci. 2012, 38, 215–282. [Google Scholar] [CrossRef] [Green Version]
- Fang, H.; Haibin, L.; Zengli, Z. Advancements in Development of Chemical-Looping Combustion: A Review. Int. J. Chem. Eng. 2009. [Google Scholar] [CrossRef]
- Lyngfelt, A.; Leckner, B.; Mattisson, T. A fluidized-bed combustion process with inherent CO2 separation; application of chemical-looping combustion. Chem. Eng. Sci. 2001, 56, 3101–3113. [Google Scholar] [CrossRef]
- Wang, P.; Leion, H. Oxygen-Carrier-Aided Combustion in a Bench-Scale Fluidized Bed. Energy Fuels 2017, 31, 6463–6471. [Google Scholar] [CrossRef]
- Keller, M.; Leion, H.; Mattisson, T.; Lyngfelt, A. Gasification inhibition in Chemical Looping Combustion with solid fuels. Combust. Flame 2011, 158, 393–400. [Google Scholar] [CrossRef]
- Keller, M.; Leion, H.; Mattisson, T.; Thunman, H. Investigation of natural and synthetic bed materials for their utilization in chemical looping reforming for tar elimination in biomass-derived gasification gas. Energy Fuels 2014, 28, 3833–3840. [Google Scholar] [CrossRef]
- Leion, H.; Mattisson, T.; Lyngfelt, A. The use of petroleum coke as fuel in chemical-looping combustion. Fuel 2007, 86, 1947–1958. [Google Scholar] [CrossRef]
- Azis, M.M.; Leion, H.; Jerndal, E.; Steenari, B.M.; Mattisson, T.; Lyngfelt, A. The effect of bituminous and lignite ash on performance of ilmenite as oxygen carrier in chemical-looping combustion (CLC). Chem. Eng. Technol. 2013, 36, 1460–1468. [Google Scholar] [CrossRef]
- Arjmand, M.; Rydén, M.; Leion, H.; Mattisson, T.; Lyngfelt, A. Sulfur tolerance and rate of oxygen release of combined Mn-Si oxygen carriers in chemical-looping with oxygen uncoupling (CLOU). Ind. Eng. Chem. Res. 2014, 53, 19488–19497. [Google Scholar] [CrossRef]
- Cheng, M.; Normann, F.; Zhao, D.; Li, Z.; Cai, N.; Leion, H. Oxidation of Ammonia by Ilmenite under Conditions Relevant to Chemical-Looping Combustion. Energy Fuel 2015, 29, 8126–8134. [Google Scholar] [CrossRef]
- Leion, H.; Jerndal, E.; Steenari, B.M.; Hermansson, S.; Israelsson, M.; Jansson, E.; Johnsson, M.; Thunberg, R.; Vadenbo, A.; Mattisson, T.; et al. Solid fuels in chemical-looping combustion using oxide scale and unprocessed iron ore as oxygen carriers. Fuel 2009, 88, 1945–1954. [Google Scholar] [CrossRef]
- Frick, V.; Leion, H.; Magnus, R. Investigation of Cu-Fe and Mn-Ni oxides as oxygen carriers for chemical-looping combustion. Fuel Process. Technol. 2016, 150, 30–40. [Google Scholar] [CrossRef]
- Azimi, G.; Rydén, M.; Leion, H.; Mattisson, T.; Lyngfelt, A. (MnzFe1─z)yOx combined oxides as oxygen carrier for chemical-looping with oxygen uncoupling (CLOU). AIChE J. 2013, 89, 582–588. [Google Scholar] [CrossRef]
- Iggland, M.; Leion, H.; Mattisson, T.; Lyngfelt, A. Effect of fuel particle size on reaction rate in chemical looping combustion. Chem. Eng. Sci. 2010, 65, 5841–5851. [Google Scholar] [CrossRef]
- Johansson, M.; Mattisson, T.; Lyngfelt, A. Investigation of Fe2O3 with MgAl2O4 for Chemical-Looping Combustion. Ind. Eng. Chem. Res. 2004, 43, 6978–6987. [Google Scholar] [CrossRef]
- Rydén, M.; Leion, H.; Mattisson, T.; Lyngfelt, A. Combined oxides as oxygen carrier material for chemical-looping combustion with oxygen uncoupling. Appl. Energy 2014, 113, 1924–1932. [Google Scholar] [CrossRef]
- Jing, D.; Hermans, E.; Leion, H.; Rydén, M.; Mattisson, T.; Van Noyen, J.; Lyngfelt, A. Manganese-silica combined oxides as oxygen carrier for chemical-looping combustion. In Proceedings of the 2nd International Conference on Chemical Looping, Darmstadt, Germany, 26–28 September 2012. [Google Scholar]
- Jing, D.; Arjmand, M.; Mattisson, T.; Rydén, M.; Snijkers, F.; Leion, H.; Lyngfelt, A. Examination of oxygen uncoupling behaviour and reactivity towards methane for manganese silicate oxygen carriers in chemical-looping combustion. Int. J. Greenh. Gas Control 2014, 29, 70–81. [Google Scholar] [CrossRef]
- Frick, V.; Rydén, M.; Leion, H.; Mattisson, T.; Lyngfelt, A. Screening of supported and unsupported Mn–Si oxygen carriers for CLOU (chemical-looping with oxygen uncoupling). Energy 2015, 93, 544–554. [Google Scholar] [CrossRef]
- Pour, N.M.; Azimi, G.; Leion, H.; Rydén, M.; Mattisson, T.; Lyngfelt, A. Investigation of Manganese–Iron Oxide Materials based on Manganese Ores as Oxygen Carriers for Chemical Looping with Oxygen Uncoupling (CLOU). Energy Technol. 2014, 2, 469–479. [Google Scholar] [CrossRef]
- Schwebel, G.L.; Leion, H.; Krumm, W. Comparison of natural ilmenites as oxygen carriers in chemical-looping combustion and influence of the water gas shift reaction on the gas composition. Chem. Eng. Res. Des. 2012, 90, 1351–1360. [Google Scholar] [CrossRef]
- Teyssié, G.; Leion, H.; Schwebel, G.L.; Lyngfelt, A.; Mattisson, T. Influence of lime addition to ilmenite in chemical-looping combustion (CLC) with solid fuels. Energy Fuels 2011, 25, 3843–3853. [Google Scholar] [CrossRef]
- Hallberg, P.; Leion, H.; Lyngfelt, A. An experimental method for determining the reaction enthalpy of an oxygen carrier in CLC. Thermochim. Acta 2011, 524, 62–67. [Google Scholar] [CrossRef]
Figure 1.
A schematic overview of the laboratory fluidized bed system.

Figure 2.
An example of alternative reactor shape.

Figure 3.
Example of obtained raw data logged from the Rosemount NGA-2000 dry gas analyzer. Data is logged every two seconds.
Figure 3.
Example of obtained raw data logged from the Rosemount NGA-2000 dry gas analyzer. Data is logged every two seconds.

Figure 4.
CO2 yield from syngas conversion as a function of oxygen carrier conversion at 950 °C.

Figure 5.
CO2 yield from methane conversion as a function of oxygen carrier conversion at 950 °C (left) and average CO2 yield as a function of temperature (right). The straight lines between the points are only meant to increase readability and do not have a physical meaning.
Figure 5.
CO2 yield from methane conversion as a function of oxygen carrier conversion at 950 °C (left) and average CO2 yield as a function of temperature (right). The straight lines between the points are only meant to increase readability and do not have a physical meaning.

Figure 6.
Average O2 concentration during last 300 s of inert period as a function of bed temperature for materials calcined at 1100 °C (left side) and 1150 °C (right side). The straight lines between the points are only meant to increase readability and do not have a physical meaning.
Figure 6.
Average O2 concentration during last 300 s of inert period as a function of bed temperature for materials calcined at 1100 °C (left side) and 1150 °C (right side). The straight lines between the points are only meant to increase readability and do not have a physical meaning.

Figure 7.
Diffractograms of the used samples calcined at 1100 °C.

Figure 8.
Diffractograms of the used samples calcined at 1150 °C.

Figure 9.
SEM images of M60ST20_1150 in fresh (left) and used (right) states. The main image has a magnification of 2000× and the inset image has a magnification of 10,000×.
Figure 9.
SEM images of M60ST20_1150 in fresh (left) and used (right) states. The main image has a magnification of 2000× and the inset image has a magnification of 10,000×.


Table 1.
Experimental procedure used to investigate oxygen release and gas conversion.
| Gas Composition | Bed Temperature [°C] | No. of Cycles | Duration Inert Period (CLOU) [s] | Duration N2-Purge [s] | Duration Reduction Period [s] |
|---|---|---|---|---|---|
| 50 vol.% CO in H2 | 950 | 2 | - | 60 | 80 |
| 100 vol.% CH4 | 850 | 2 | - | 60 | 20 |
| 100 vol.% N2 | 850 | 2 | 360 | - | - |
| 100 vol.% CH4 | 950 | 2 | - | 60 | 20 |
| 100 vol.% N2 | 950 | 2 | 360 | - | - |
| 100 vol.% CH4 | 1050 | 2 | - | 60 | 20 |
| 100 vol.% N2 | 1050 | 2 | 360 | - | - |
| 100 vol.% CH4 | 950 | 2 | - | 60 | 20 |
| 100 vol.% N2 | 950 | 2 | 360 | - | - |
Table 2.
Properties of oxygen carriers assessed in this study.
| Oxygen Carrier | Calcination Temperature [°C] | Calcination Time [h] | Synthesis Composition [wt.%] | ||
|---|---|---|---|---|---|
| M74ST2_1100 | 1100 | 4 | 73.3% Mn3O4 | 24.5% SiO2 | 2.2% TiO2 |
| M74ST2_1150 | 1150 | 4 | |||
| M74ST2_1200 | 1200 * | ||||
| M72ST5_1100 | 1100 | 4 | 70.8% Mn3O4 | 23.7% SiO2 | 5.5% TiO2 |
| M72ST5_1150 | 1150 | 4 | |||
| M72ST5_1200 | 1200 * | ||||
| M60ST20_1100 | 1100 | 4 | 58.5% Mn3O4 | 19.5% SiO2 | 22.0% TiO2 |
| M60ST20_1150 | 1150 | 4 | |||
| M60ST20_1200 | 1200 * | ||||
* Material melted during calcination.
Table 3.
Bulk density (tapped) and specific surface area (BET) for Mn-Si-Ti particles.
| Oxygen Carrier | Bulk Density [g/cm3] | Specific Surface Area (BET) [m2/g] | ||
|---|---|---|---|---|
| Fresh | Used | Fresh | Used | |
| M74ST2_1100 | 0.8 | 0.8 | 2.6 | 1.8 |
| M74ST2_1150 | 1.2 | 1.1 | 0.9 | 1.3 |
| M72ST5_1100 | 0.8 | 0.8 | 2.5 | 1.8 |
| M72ST5_1150 | 1.5 | 1.4 | 0.4 | 0.7 |
| M60ST20_1100 | 1.0 | 1.0 | 1.9 | 1.3 |
| M60ST20_1150 | 1.7 | 1.7 | 0.2 | 0.3 |
Table 4.
Attrition index (used particles) and crushing strength.
| Oxygen Carrier | Attrition Index [wt.%/h] | Crushing Strength [N] |
|---|---|---|
| M74ST2_1100 | (1.2) * | 0.2 |
| M74ST2_1150 | 33.3 | 0.7 |
| M72ST5_1100 | (1.0) * | 0.2 |
| M72ST5_1150 | 2.9 | 1.1 |
| M60ST20_1100 | 33.0 | 0.4 |
| M60ST20_1150 | 0.4 | 1.3 |
* Samples destroyed during attrition testing are marked with parenthesis.
© 2018 by the authors. Licensee MDPI, Basel, Switzerland. This article is an open access article distributed under the terms and conditions of the Creative Commons Attribution (CC BY) license (http://creativecommons.org/licenses/by/4.0/).
Share and Cite
MDPI and ACS Style
Leion, H.; Frick, V.; Hildor, F. Experimental Method and Setup for Laboratory Fluidized Bed Reactor Testing. Energies 2018, 11, 2505. https://doi.org/10.3390/en11102505
AMA Style
Leion H, Frick V, Hildor F. Experimental Method and Setup for Laboratory Fluidized Bed Reactor Testing. Energies. 2018; 11(10):2505. https://doi.org/10.3390/en11102505
Chicago/Turabian StyleLeion, Henrik, Volkmar Frick, and Fredrik Hildor. 2018. "Experimental Method and Setup for Laboratory Fluidized Bed Reactor Testing" Energies 11, no. 10: 2505. https://doi.org/10.3390/en11102505
Note that from the first issue of 2016, this journal uses article numbers instead of page numbers. See further details here.