Modelling Offshore Wave farms for Coastal Process Impact Assessment: Waves, Beach Morphology, and Water Users


Plymouth University, School of Biological and Marine Sciences, Drake Circus PL4 8AA, UK
*
Author to whom correspondence should be addressed.
Energies 2018, 11(10), 2517; https://doi.org/10.3390/en11102517
Submission received: 26 July 2018
/
Revised: 19 September 2018
/
Accepted: 19 September 2018
/
Published: 21 September 2018
(This article belongs to the Special Issue Wave and Tidal Energy)
Abstract
:The emerging global wave energy industry has the potential to contribute to the world’s energy needs, but careful consideration of potential impacts to coastal processes in the form of an impact assessment is required for each new wave energy site. Methods for conducting a coastal processes impact assessment for wave energy arrays vary considerably in the scientific literature, particularly with respect to characterising the energy absorption of a wave energy converter (WEC) array in a wave model. In this paper, modelling methods used in the scientific literature to study wave farm impacts on coastal processes are reviewed, with the aim of determining modelling guidance for impact assessments. Effects on wave climate, beach morphology, and the surfing resource for coastal water users are considered. A novel parameterisation for the WEC array transmission coefficient is presented that, for the first time, uses the permitted power rating of the wave farm, which is usually well defined at the impact assessment stage, to estimate the maximum likely absorption of a permitted WEC array. A coastal processes impact assessment case study from a wave farm in south-west Ireland is used to illustrate the application of the reviewed methods, and demonstrates that using the new ‘rated power transmission coefficient’ rather than a WEC-derived transmission coefficient or complete energy absorption scenario can make the difference between significant and non-significant levels of coastal impacts being predicted.
1. Introduction
The extraction of wave energy from the world’s oceans and seas has the potential to contribute significantly to the global energy mix. In Europe, the emerging wave energy industry could eventually contribute to European Union (EU) renewable energy targets [1,2,3], if and when full-scale operational wave energy converter (WEC) arrays are deployed. To accommodate these deployments, suitable marine areas for wave energy capture will need to be sought, and for each new WEC test site or operational WEC array, national and international regulations usually require an environmental impact assessment (EIA) to be performed, in order to demonstrate that the project will not have any unreasonable impacts on the ecology and coastal processes in the surrounding environment [3]. In many cases, potential impacts to water users such as surfers will also have to be considered as part of the coastal processes impact assessment, as such groups have a shared interest in the wave resource, are of economic importance to coastal regions [4], and have raised significant concerns and opposition during previous WEC siting proposals, e.g., [5].
In this contribution, methods for conducting a coastal processes impact assessment for wave energy arrays are discussed, with the aim of determining a set of recommended guidelines for a wave farm coastal processes impact assessment. Effects on wave climate, beach morphology, and the surfing resource are considered, while other effects that are more generic to marine engineering, such as those occurring during the installation and decommissioning of a WEC site are omitted, as they are addressed elsewhere in the literature. In Section 1.1, Section 1.2 and Section 1.3, methods for investigating the effects of wave energy extraction on wave climate, beach morphology, and water users are discussed, respectively. A novel parameterisation for the WEC array transmission coefficient is presented in Section 1.1.1. In Section 1.4, a coastal processes impact assessment case study for a WEC test site in south-west Ireland is introduced, while the methods and results from the assessment are described in Section 2 and Section 3. Section 4 and Section 5 conclude the paper by discussing the applied methods and proposing guidance for coastal processes impact assessments based on the methods reviewed throughout the paper.
1.1. Effects of Wave Energy Extraction on Wave Climate
The world’s first full-scale, grid-connected offshore WEC was tested at the European Marine Energy Centre (EMEC) in Scotland by Pelamis Wave Power in 2004 (www.emec.org.uk/about-us/wave-clients/pelamis-wave-power). However, due to the hostility of the ocean environment and vast costs involved in trialling a WEC in real seas, there have been few prototype-scale deployments like this globally. As a result, the shadow effects from offshore WECs are yet to be fully researched at prototype scale. Instead, scaled physical models and numerical models have been used far more extensively to determine the likely near-field (close to WEC) and far-field (close to shore) effects, respectively, of offshore wave farms. Numerical modelling of such coastal effects has been undertaken for case studies in England [6,7,8,9,10,11,12], Scotland [13], Spain [14,15,16], Portugal [17,18,19], Mexico [15], Romania [20,21,22], and the United States [23,24], as well as for generalised cases with idealised bathymetry [25,26,27].
To quantify the magnitude and characteristics of wave energy capture, the most common approach has been to model WECs as partially transmitting barriers that allow a portion of wave energy to transmit through them, using a numerical wave model. The proportion can be quantified using a transmission coefficient, , which describes the ratio of wave energy (or in some cases wave height) transmitted through a WEC array over that incident upon it. Unsurprisingly, initial modelling studies demonstrated that the near- and far-field attenuation of waves increases with increasing energy absorption (decreasing ), and decreases with increasing distance from the WEC array [6,7,10,12,26,27], while array width has been shown to affect the along-coast extent of the resulting wave shadow [18]. Transmission coefficients used in the literature have been determined in various ways, including by estimating device efficiency [6,8], employing breakwater designs [7], or using physical test data [11,14,17,18,19], and have varied significantly. For example, when modelling the Wave Hub WEC test site in Cornwall, UK, wave height transmission coefficients considered to be ‘realistic’ ranged from 0 to 0.95 [6,7], and were applied to individual WECs in one study, while being applied over the whole siting area in the other.
Theoretically, the transmission coefficient of an individual WEC can be precisely quantified using the ratio of the device ‘capture width’ to the spacing [19,27] or width of the devices [28], known as the capture width ratio. Conceptually, capture width describes the length of wave crest completely absorbed by a WEC, and is in the order of 2–21 m, or 12–37% of the device width for the most common types of WEC [28]. In reality, capture width is likely to vary with wave height and period [19], and the absorbed energy may be spread over a greater length of the wave crest than the capture width indicates. Although capture width ratios have now been defined for a wide range of WEC types [28], there is some disparity in how the derived transmission coefficients are applied in modelling studies, with some applying a coefficient across an entire WEC array area, e.g., [17,18], while others have applied transmission coefficients to the precise location of each individual WEC e.g., [10,19]. As spectral wave models do not yet sufficiently simulate device–device interactions, the former approach arguably offers a more conservative method for assessing the impact of a new WEC array site, especially given that WEC array layout (device spacing and alignment) has not yet been optimised for many WEC technologies.
Another key factor that influences the change in wave height at the coast, and the along-coast extent of the impact, is the directional spread, , of the waves transmitting past the WEC site [27,29]. A large acts to reduce the impact in the lee of a WEC site, as the energy deficit is diffused over a greater area, and wave energy not affected by the WECs can spread into the shadow zone, regenerating some of the lost wave energy. At the same time, a large would result in a greater length of coastline being affected by the wave shadow in some way. Swell waves (which are generally preferred by water-users) typically have a small , and under such conditions a WEC array would cause a more concentrated reduction in wave height at the coast than during wind-sea or bimodal sea states, which have a larger [8,26,27]. Therefore, appropriate characterisation of sea states in the area of interest, and in particular the directional spread of sea states, is essential to the results of a WEC modelling study.
Wave frequencies containing the bulk of energy are logically the most attractive for wave energy capture, and as such, it is likely that WECs will be tuned to resonate optimally at those frequencies [8,25,26]. The resonant frequency of a WEC is likely to be aligned to the average energy period, Te, of the incident wave climate during the design of the WEC, so as to maximise energy capture [8,26,27,30,31], while frequencies far removed from Te are likely to be decreasingly affected. The application of a constant transmission coefficient, i.e., one that is applied equally to all wave frequencies, in a number of previous WEC modelling studies [6,7,10,20,21,32] has ignored the fact that devices will naturally resonate at certain frequencies while being less sensitive to others, as demonstrated by published WEC power matrices [28]. However, frequency-dependent modelling of WECs at Wave Hub [8] suggests that the effects would only be slightly lower than those predicted by a comparable frequency-independent study [6]. Therefore, although frequency-dependent modelling is likely to give a more precise representation of energy extraction, it is arguably more conservative to model WECs using a single frequency-independent transmission coefficient in cases where WEC absorption characteristics are not well defined at the impact assessment stage in order to avoid under-prediction of impacts at some frequencies.
WECs have other physical effects on the transmitted wave field that are comparatively less well studied; namely, diffraction of wave energy into the shadow zone, and the transmission of radiated waves caused by the vertical and horizontal motion of the WECs themselves [29,33]. It is likely that for the majority of sea states these effects will not have a significant impact at the coast, however, as numerical modelling by [29,33] indicates that regeneration of lost wave energy by directional spreading is likely to mitigate the effects of diffraction, and any radiated waves should be low in energy and will disperse rapidly with distance. Additionally, modelling by [34] indicates that at distances greater than 500 m from a WEC array, the effects of device–device interaction can be neglected. Ultimately, diffraction and radiation effects are likely to reduce the impact of a WEC array at the coast [34], but the physics are not yet adequately represented in spectral (i.e., phase-averaged) wave models. Such models are currently the only tools capable of efficiently simulating WEC effects at field scales, and have therefore been used widely for this purpose, but the physics of diffraction and wave reflection need to be more accurately parameterised before they will be able to simulate the physics of WEC arrays comprehensively.
Because of the importance of the directional and frequency characteristics of the background wave climate on the potential far-field effects of a WEC array, characterisation of the wave climate is an important step in a WEC impact assessment. The importance of understanding the most common spectral shapes at a potential WEC site have been illustrated by [8], who showed that they can directly affect the degree of wave shadowing predicted (if frequency dependent modelling is applied), especially in the presence of bimodal spectra. Recent work by [35,36,37] has sought to further characterise wave spectra at a given location for the purposes of wave energy resource assessment, including during bimodal wave conditions. Previous WEC modelling at Wave Hub [6] was critiqued [27] for applying default wave directional spreading values that were not representative of the site under study, or of wave conditions of interest to surfers. Methods for quantifying the directional spread of sea states are discussed by [8], who found that spreading values of around 45° were common at Wave Hub; however, narrow-banded wave conditions of interest to surfers may be less than half of this value, and would be subject to greater wave shadowing in the lee of a WEC array. This demonstrates that although the background wave climate is an important consideration, wave impacts also need to be modelled during conditions that are of importance to specific impact receptors, and that characterisation of the wave climate should include the definition of such conditions.
1.1.1. A New Parameterisation for Wave Energy Converter (WEC) Site Transmission Coefficient,
A common deficiency of previous WEC impact studies is a lack of consideration for the maximum permitted energy capture of the WEC array. At the impact assessment stage, the permitted array power (i.e., the maximum amount of energy that is allowed to be captured) is usually well defined, and modelling studies therefore need not exceed this level of absorption. Equally, the most conservative approach to modelling a WEC array is to model the maximum amount of energy absorption possible at a site. Therefore, the maximum permitted array power should clearly inform the level of energy absorption, and hence the value of , applied in a WEC modelling study.
To achieve this, one must determine the total amount of power removed from the wave field due to the presence of the WEC array, , based on the array’s expected power rating. Assuming the efficiency of the array is equivalent to the device efficiency, , this is:
where is the permitted power rating of the wave farm (in Watts), which is equivalent to the product of and as it is assumed that some energy will be removed from the wave field by the array that cannot be harnessed due to mechanical and electrical inefficiencies represented by . In addition, the total wave power transiting the site during design wave conditions, , needs to be determined. Assuming a normally incident wave passing through the site, this is simply:
where is the power density of the design wave conditions, and is the length of the permitted array area, as measured parallel to the incident wave crests. The exact array layout is immaterial, as the important considerations are the total power removed by the array and the length of wave crest from which the power is removed; these are the same whether the devices in an array are deployed across multiple lines or a single line (under the assumption of a normally incident wave angle).
The ‘rated power’ transmission coefficient, , is then related to the ratio of wave power removed to the total wave power transiting the site as:
, therefore, represents a realistic yet conservative level of wave energy transmission, and is informed by the maximum likely energy absorption (assumed to be achieved during design wave conditions) and area of ocean over which energy extraction is permitted. This parameterisation is analogous to computing the capture width ratio of the entire WEC array by working backwards from the maximum permitted array power. Of the four parameters required to calculate , and are likely to be well defined at the impact assessment stage, but and may not be known; strategies to estimate these values are presented in Section 2.1.
Table 1 demonstrates the application of the parameter to scenarios from previous WEC modelling studies at two WEC array sites where the permitted array power, Pa, has been defined—Wave Hub in Cornwall, England, and the Maritime Pilot Zone in Sao Pedro de Moel, Portugal. As only a selection of wave conditions were modelled in each study, it was not straightforward to determine design wave conditions, so either the highest-occurrence wave scenario or scenario that generated the most power was selected. As device efficiency was not specified in the studies, = 1 was applied in all cases, although in reality the value would be lower than 1. For Wave Hub, the worst-case scenario modelled by [6] far exceeded the maximum power rating of the wave farm (final column in Table 1), representing a level of energy capture that would not be permitted and that would overestimate the level of subsequent coastal impacts (indeed, they refer to this as an ‘unachievable scenario’). Conversely, for the Portuguese Maritime Pilot Zone, the selected scenarios [17,18] both heavily under-represent the permitted energy extraction at the site (final column in Table 1) and therefore potentially underestimated the maximum likely wave impacts.
1.2. Effects of Wave Energy Extraction on Coastal Sedimentation and Beach Morphology
In a situation where waves are altered by the presence of a WEC site as they propagate toward the coast, knock-on effects to coastal sedimentation and beach morphology may occur [7,9,10,11,12,15,19,26,38]. Before the altered waves reach intermediate waters, their influence on sediments is likely to be negligible, as they will not interact with the seabed or influence wave-driven currents significantly prior to this point [9]. It is therefore assumed here that the potential effects of WECs on sedimentation and morphology are concentrated within shallow water at the coast. Existing studies agree that reduced wave heights in the lee of a wave farm are likely to result in accretion of the beach face, and some have therefore concluded that it is possible for wave farms to provide coastal protection in addition to renewable energy [9,10,11,15], although the extent and magnitude of the benefits are likely to vary with distance offshore, and with wave directional variation and spreading, as per other forms of coastal protection [39,40]. Wave farms could also affect littoral drift rates, as modelling has shown that longshore current velocity is sensitive to small WEC induced changes in wave conditions [19].
Various approaches have been used to model the effects of WECs on coastal sedimentation. A simple approach is to use the nearshore output from a wave model to indicate potential changes in sedimentation, without running any numerical morphological models [15,16,19,26]. For example, changes in cross-shore and alongshore surf-zone radiation stress gradients were examined by [26] using a spectral wave model to indicate how trends in sediment transport might be affected. A threshold in the alongshore forcing of 0.44 N/m2 (~0.2 m/s current) was defined in their study to indicate whether a WEC array was likely to induce a significant change in sedimentation. Although this approach has the advantage of lower computational cost compared to running additional numerical models, it ultimately does not quantify the magnitude or location of morphological change that may occur with WECs in place, and may not therefore satisfy the requirements of an impact assessment. Additionally, the threshold they used to define a significant change may be small or large relative to the local variation in forcing and could have instead been informed by the local variability in hydrodynamic or morphodynamic parameters, or sensitivity of local receptors.
Another method involves first modelling the WECs in a numerical wave model (Section 1.1) then propagating the altered wave field into the coast. The altered inshore waves are then used as boundary conditions for one or more additional hydrodynamic and morphodynamic models. For example, process-based morphological models have been used to predict specifically where erosion or accretion of the beach face in the lee of a wave farm may occur, over time scales of hours to months [9,10,11]. Tidal elevation should be varied during such simulations as it influences wave shoaling and bottom shear stresses [9], and hence, the potential effect of WECs on sedimentation will also vary over tidal cycles and with changes in tidal range. Changes in beach profile in the lee of a hypothetical wave farm were investigated by [10] using the process-based model XBeach [41] to quantify the degree of coastal protection offered by the wave farm at varying distances from the coast. They concluded that significant coastal protection was possible depending on the size, power, and distance of the wave farm. However, this and other similar studies have omitted to allow the measured beach profile to adjust to the background forcing conditions (i.e., without WECs in place) prior to assessing WEC-induced changes. The degree of disequilibrium between the selected beach profile and boundary wave conditions will, therefore, have influenced the degree of impact interpreted from the simulations. In order to truly determine the effect of WECs on profile response, the initial profile should be allowed to equilibrate with the boundary wave condition before any WEC-affected wave conditions are implemented in the model (Section 2.2 presents an example of this), otherwise the choice of measured beach profile can influence the conclusions drawn unduly.
Another potential effect of wave energy extraction is a change in the morphological classification of a beach. Such a change could alter a beach’s vulnerability to storms due to the presence or absence of bars [42], the level of bathing hazard via the presence or absence of rip channels [43], or the surfing amenity at the beach via the shape of the bars [44,45]. Changes in beach state are yet to be reliably recreated using process-based numerical models, as the required assumptions and non-linear effects within process models are compounded over large spatial and temporal scales [46,47]. Instead, more traditional sequential beach state models [48,49,50] that associate relative tide range (RTR) and dimensionless fall velocity (Ω) to different morphological states have been used to predict the beach state likely to develop under wave conditions altered by wave energy extraction [12,38]. Although such models distinguish the key reflective, intermediate, and dissipative states relatively effectively, a number of studies have found that the intermediate sub-states that most affect beach water users are not well distinguished by such models [50,51,52,53,54], and more complex, data-driven behavioral models for bathymetric three-dimensionality have, therefore, been sought for WEC impact studies on intermediate beaches [55,56].
1.3. Effects of Wave Energy Extraction on Water Users
Significant opposition was raised by surfers during the Wave Hub consultation in England [5], demonstrating that even a relatively small-scale wave farm can provoke opposition at distant surfing beaches. As this case shows, regions with an optimal wave resource for energy extraction can also be highly valued by water users who have a shared interest in the wave resource. As a result, future interactions between wave energy projects and beach water users are highly likely, and understanding the wave conditions preferred by different groups is, therefore, vital for impact assessment.
The wave conditions most suitable for surfing and other similar activities depend on the level of ability and preferences of individual water users [56,57]. However, globally, very little research has been conducted to determine the preferences of different water-user groups. In general terms, optimum surfing conditions require swell waves with a narrow spread of frequencies and directions [27], effectively approaching monochromatic conditions [7], but this rarely occurs in reality. It was found by [56] that novice to expert water users participating in a variety of surfing-based activities in Cornwall, UK, shared a common preference for wave periods between 9 ≤ T1/3 ≤ 20 s, but that different water-user groups preferred different ranges of breaking wave height. For example, women and novice water users preferred smaller waves (significant breaking wave height, 0.8 ≤ Hm0,b ≤ 2.3 m) than men and expert water users (1.9 ≤ Hm0,b ≤ 3.7 m); on average, preferred breaking wave heights ranged between 1.2 m ≤ Hm0,b ≤ 3.1 m. There are no comparable studies to confirm whether the identified preferences apply elsewhere in the world, but it is likely that they are relevant for locations with similar beach morphology and wave climates to the Atlantic coast of Cornwall, where these ranges were determined.
The degree to which waves of interest to water users (for example, those with frequencies of 0.11–0.05 Hz) are affected by wave energy extraction will depend on the frequency response of the WECs deployed. A WEC tuned to extract optimally within the preferred frequency range, or one that simply affects a wide range of frequencies, will reduce the energy of preferred surfing conditions more than a WEC with a narrow frequency response that targets wave frequencies outside the preferred range [56,58]. In cases where the WEC frequency response is known, wave modelling could be used to investigate the precise degree to which preferred surfing waves are likely to be affected, but only if the aforementioned preferences apply to local water users. In other cases, frequency-independent modelling of WECs will provide a more conservative assessment of the likely attenuation of surfing waves.
Additionally, spilling and plunging waves are the only breaker types suitable for most surfing-based activities [59], so potential changes in breaker type should be considered through assessment of the Irribarren number [60]. Similarly, peel angle, which describes how quickly a wave breaks along a bottom contour [61], could be affected by wave energy extraction. Aerial photographs and bathymetric surveys determined that peel angles of 30–70° are suitable for the majority of surfers, while smaller peel angles are only surfable by experts [57]. However, WEC-induced changes to wave peel angle would be impractical to predict without detailed modelling of wave shoaling and breaking within the surf zone.
The effects of wave energy extraction on water users are not limited to changes to inshore wave conditions; knock on effects to beach morphology could also affect the safety and amenity of the surf-zone. Previous research indicates that three-dimensional (3D) ‘bar and rip’ beach morphology, synonymous with intermediate beach states [48,49,50], significantly increases the bathing hazard for water users by enhancing rip current circulation [43,50,62,63]. Interestingly, these morphology types also enhance the quality of surfing conditions, as 3D bathymetry can increase the peel angle of breaking waves to within limits suitable for wave riding [44,45,57,64]. As wave height and period are key parameters governing beach state change [48], an alteration to either parameter by wave energy extraction could alter the morphological state, and subsequently the bathing hazard and surfing amenity provided by beaches in the lee of a wave farm [38,55,56,65].
1.4. Case Study: Westwave, South-West Ireland
To explore the application of some of the methods discussed in the previous sections, a WEC impact assessment case study is presented in this paper. ‘Westwave’ is a WEC test site currently under proposal for installation off the coast of County Clare, south-west Ireland, and would be permitted to operate at 5 MW power capacity. The project aims to demonstrate that a pilot wave energy project can be designed, consented, developed and operated in Ireland using innovative wave energy conversion technologies. As part of the consenting process for the site, a coastal processes impact assessment was undertaken which considered potential impacts from both the operation of WECs at the site (alteration to the wave climate, beach morphology, and surfing amenity), as well as physical impacts that could occur during installation and decommissioning (e.g., disturbance of benthic sediments). Only the aspects of the assessment covering the operation of WECs are discussed in this paper.
The proposed WEC array considered here consists of 6 floating or semi-submerged WECs covering an area of ocean up to 2 km in length, and would be moored at depths of up to 70 m and at distances of up to 12 km from the coast. Commercially operable WEC devices that have been identified as potentially suitable for this array include those in development by Carnegie (CETO 6), Well Oy (Penguin) or Ocean Energy (OE Buoy). However, for the present study these individual devices and their precise spacing or array layout are not simulated, as the focus is on the application of the new generic transmission parameter presented in Equation (3), which is intended for use at proposed WEC sites where only the permitted array power and leased deployment area are known, and for which the exact devices to be deployed may or may not be known a priori.
2. Materials and Methods
2.1. Modelling Effects on Wave Climate
Effects on wave conditions in the lee of Westwave were modelled using the open-source third-generation spectral wave model SWAN [66]. SWAN was designed to simulate the propagation of wind-generated surface gravity waves in the near-shore and accounts for refraction and shoaling due to currents and variations in bathymetry as well as reflection or transmission due to obstacles, making it suited to simulating the effects of WECs, e.g., [6,8,10]. Wave energy dissipation is accounted for in the model by activating processes such as whitecapping, bottom friction, depth-induced wave breaking, and wave–wave interaction. SWAN is based on the spectral action balance equation [66]:
where the first term represents the rate of change in action density per unit frequency () and direction (), , through time; the second and third terms represent the spatial propagation of in and space, with celerity components and ; the fourth term represents the change in relative frequency due to variations in bathymetry and current velocity; and the fifth term represents directional change caused by depth and current induced refraction. The term on the right hand side of the action balance equation is the energy density source term that represents wave generation, dissipation, and wave–wave interactions [66].
The wave model configuration used in the Westwave case is summarised in Figure 1, and comprised a nest of three SWAN grids with increasing resolution towards the WEC site, which were forced unilaterally along the western-most boundary by publicly available wave conditions from a single National Oceanic and Atmospheric Administration (NOAA) Wave Watch III model node. The model bathymetric grid was constructed from bathymetry data acquired from the European Marine Observation and Data Network (www.emodnet-bathymetry.eu). Wind forcing and wind induced wave growth were not included in the model, but varying tidal elevation was applied for validation runs using data from Admiralty tide charts. Simulated inshore wave conditions were validated against 2 months of wave data from a directional wave rider buoy (Figure 1), which demonstrated that the model could replicate observed wave conditions at the proposed WEC array location (Figure 2). Root-mean-square error (RMSE) for significant wave height, Hm0, peak period, Tp, and peak wave direction, Dp, was 0.63 m, 1.3 s, and 12° respectively.
Three different wave scenarios arriving from three directional sectors (north-west: 285°–360°, west: 255°–284°, south-west: 180°–254°) were simulated, providing a total of nine wave cases (Table 2). Results from the westerly wave scenarios are presented in Section 3:
- The highest-occurrence wave condition for each directional sector was determined by examining joint probability histograms of Hm0 vs. Tp, Hm0 vs. Dp, and Dp vs. for each directional sector. These were generated from 10 years of NOAA WWIII hindcast acquired for the study at the model’s offshore boundary.
- 1-year return period wave height for each directional sector was determined using a generalised Pareto distribution fitted to peak wave heights greater than the mean of the data plus one standard deviation, and separated by at least four days. To estimate a suitable wave period and directional spread associated with these wave heights, a one-term power function was fitted to values of Hm0 vs. Tp and to values of Hm0 vs. from the 10-year NOAA WWIII hindcast time series.
- The ‘optimum’ surfing wave condition for each directional sector was determined from the average wave preference expressed by water users in Cornwall (Section 2.3). was set at 20°, representing very narrowly spread waves for the region ( ≤ 20° occurred <1% of the time in the 10 year NOAA WWIII hindcast acquired for this study).
The proposed WEC array was simulated in the highest resolution (50 m) nested model grid as a partially transmitting obstacle, using a constant (frequency-independent) transmission coefficient, . The standard SWAN model (version 40.72) was used, which allows frequency independent energy absorption from obstacles. However, if frequency dependent absorption was to be simulated, the SNL-SWAN (Sandia National
Laboratories—Simulating WAves Nearshore) model could have been applied, which allows this functionality. Three different transmission coefficient cases were tested:
- A #x2018;rated power’ scenario, = = 0.9, calculated with the new parameterisation in Equation (3), using the parameters in Table 3
- A ‘WEC derived absorption’ scenario that represents the absorption of a single WEC, = = 0.58, derived from scaled physical model tests [67]
- An extreme and unfeasible ‘complete absorption’ scenario where = = 0
It should be noted that the latter two coefficients were modelled for comparison purposes only, as is considered the maximum realistic absorption permitted at the site. From the values in Table 3, it can be seen that using the WEC derived transmission coefficient ( = 0.58) is equivalent to increasing the permitted array power from 5 MW to 12 MW. Using the complete absorption transmission coefficient ( = 0) is equivalent to increasing the permitted array power from 5 MW to 52 MW.
Assumptions about had to be made as no single device had been chosen for deployment at Westwave. Given a notable paucity of device efficiency data for commercial WECs, was set at 30% ( = 0.3), in line with other studies in the literature [17]. The design wave power, , was estimated using values of wave height and period at which maximum energy absorption occurs for a number of pre-existing commercial WECs (Figure 3). This generic value was determined from published WEC performance data in the form of power matrices [68]; the WECs from which the data were derived may or may not ever be deployed at Westwave and were selected purely on the availability of their performance data. The design wave conditions in Figure 3 range between 4 ≤ Hm0 ≤ 6 m and 6 ≤ Te ≤ 8.5 s and represent a spectrum of device types. Specifically, Aqua Buoy and Pelamis (this WEC is now defunct, but still provides a useful reference for the performance characteristics of a commercial WEC) are examples of offshore devices; Wave Dragon is an intermediate depth device; and Oyster (also now defunct) is an example of a shallow-water device. The values were averaged in order to determine a generic design wave condition for devices of any type: Hm0 = 5 m, Te = 7 s (Figure 3, dashed lines), and these values were used to calculate under the assumptions of linear wave theory. Determining a generic transmission coefficient from such a range of devices was suitable for the Westwave assessment, as both a nearshore and offshore siting option were tested in the original EIA. Although only the offshore WEC array is studied here, the averaged wave conditions are still deemed suitable, as they closely align to the peak performance conditions for the deep water device Aqua Buoy—a point absorber device not dissimilar to the Carnegie CETO 6 device earmarked for Westwave.
2.2. Modelling Effects on Beach Morphology
A morphological modelling study was undertaken which considered the potential for Westwave to alter the morphological classification and profile shape of the beaches in its lee. Morphology results from Doughmore beach (Figure 4), where the largest wave effects were predicted to occur, are presented in Section 3 of this paper. The potential for Westwave to affect the long-term (annual time-scale) three-dimensional shape of the beach was investigated using a conceptual beach state model, while the potential for it to affect the short-term (storm event time-scale) two-dimensional (i.e., ‘2D-vertical’) shape of the beach profile was studied separately using a process-based numerical model. This two-stage approach was taken, rather than modelling the three-dimensional evolution of the beach in a single (i.e., ‘2D-horizontal’) process-based numerical model, as process-based models are not yet capable of reliably recreating measured three-dimensional morphology over the temporal and spatial scales relevant to a WEC impact study [46,47]. Shoreline change modelling was not undertaken as littoral drift was not deemed to be a relevant process for the embayed beaches in the region, and as any alongshore wave height gradients from the WEC shadow are expected to be insignificant at the distance of 10 km, especially given the maximum magnitudes of wave height change that were predicted. However, alongshore varying (three-dimensional) morphology occurs at Doughmore beach (Figure 4), which was accounted for through the beach classification study.
The potential to alter the morphological classification of the beach was investigated with the sequential beach state model of [49]. The model considers nine key beach states and predicts that changes in state are influenced by changes in RTR and Ω which are respectively defined as:
where MSR is the mean spring tide range, here determined from Admiralty tide charts at Galway; Hb is a representative breaking wave height, here calculated using the method of [69]; Ws is the sediment fall velocity, here determined from mid-intertidal surficial sediment samples analysed in a laboratory settling tube; and T is wave period. For this assessment, the highest-occurrence wave height (Hm0) and peak period (Tp) were simulated in SWAN and output at the 10 m depth contour adjacent to Doughmore beach, and were subsequently used to calculate RTR and Ω with and without the influence of WECs at Westwave.
RTR = MSR/Hb
Ω = Hb/Ws T
Next, the process-based numerical model XBeach was used to investigate whether WECs at Westwave could alter localised patterns of accretion and erosion in the beach profile under either highest-occurrence or storm wave conditions. XBeach can simulate the propagation of incident and infragravity waves, wave induced currents, sediment transport, and morphological changes, solving the time-dependent short wave action-balance equations, roller energy equations, the non-linear shallow water equations of mass and momentum, sediment transport formulations, and bed updating [70]. In the instationary or ‘surf beat’ mode of XBeach used in this study, short-wave motion is solved using the wave action equation, estimating the variation of the short-wave envelope on the scale of individual wave groups [71]. Wave group dissipation is modelled [72,73], and a roller model [74,75,76] is used to represent the momentum carried after wave breaking. Radiation stress gradients [77,78] then drive infragravity motion and unsteady currents in the model, which are solved with the non-linear shallow water equations [79]. The surf beat mode of XBeach is valid for dissipative and intermediate beaches, where swash motions are predominantly in the infragravity band, and short waves are mostly dissipated by the time they reach the shore [71]. Since its development, XBeach has proved effective in reproducing measured hydrodynamics and beach profile response under a wide range of scenarios [41,80,81,82,83] making it a suitable tool for examining WEC-induced profile changes.
Combined data from a topographic drone survey and hydrographic multibeam survey were interpolated to a 2 m grid using a loess quadratic interpolation method [84], and a single representative beach profile was extracted for use in XBeach (Figure 4). A two-dimensional (i.e., cross-shore profile) non-equidistant grid was employed in XBeach, where the grid resolution was defined as a function of the water depth and offshore wave conditions, with a minimum resolution of 1 m in shallow water. For this purpose, the Courant condition was used to find the optimal grid size in terms of sufficiently resolving physical processes, as well as yielding maximum computational efficiency and grid smoothness. The XBeach morphological acceleration parameter, Morfac, was set to a value of 5, which is within the recommended parameter range. All other model free parameters were set to their default values. Boundary wave conditions for XBeach were provided by SWAN model output at the 20 m depth contour.
Results from two wave cases are presented in Section 3:
- The highest-occurrence wave condition. This case was run continuously in XBeach until the measured profile reached equilibrium with the wave forcing, or in other words, until profile changes no longer varied significantly from one tidal cycle to the next. This occurred after five spring-to-spring tidal cycles (approximately 75 days) at Doughmore. The water level was varied in the simulation using a spring-neap-spring tidal signal, where the tide range varied between 2 m (neap tides) and 4.5 m (spring tides). The profile at the end of the simulation represents the equilibrium profile shape under the most commonly occurring waves.
- The 1-year return period wave condition. This case was run for 24 h with a 4.5 m spring tide range to simulate a single storm event coincident with large tides. This simulation followed immediately from wave case 1 and, therefore, acted upon the equilibrium beach profile. The profile at the end of this simulation represents the storm profile shape.
The background variability of the equilibrium profile (Figure 4c) was quantified as two standard deviations of the profile changes occurring over a spring-to-spring tidal cycle after equilibrium had been reached. This ‘baseline profile variation’ represents the changes that occur solely due to the action of the tides moving the shoaling, surf, and swash zones up and down the beach profile. WEC induced changes to the beach profile that are smaller than the baseline variation can be considered insignificant, as they are smaller than the level of day-to-day noise in the natural profile. This threshold was used as the context by which to assess the significance of any WEC-induced changes in the profile.
2.3. Modelling Effects on Water Users
To investigate whether WEC operation at Westwave could have any effect on water users at the coast, its potential to change inshore surfing conditions and beach morphological state were considered. Wave model output was extracted at the 10 m depth contour adjacent to eight known surfing locations in the region (Lahinch, Cregg, Spanish Point, Doughmore, Doonbeg, Whitestrand, Teachmore West, and Kilkee, Figure 1) and the nearshore changes predicted by the wave modelling exercise were examined at each site. For brevity, only changes at Doughmore beach are presented in Section 3.
As there is a lack of data to indicate the wave preferences of the local surfing community, wave preferences from water users in the lee of Wave Hub in Cornwall, England (Section 1.3), were used as a proxy for optimal surfing conditions in the Westwave region. Given that the two regions have similar beach morphology types, a similar tidal range, and are both exposed to Atlantic Ocean waves, it is likely that preferred surfing conditions are similar at the two sites. The preferred wave conditions were reverse shoaled using linear wave theory to the depth of the NOAA WWIII data node (143 m) in order to provide SWAN model boundary conditions. At that depth, the average preferred wave conditions for surfing equate to Hm0 = 1.4 m and Tp = 14.7 s. Breaking wave height was not simulated, as breaker height is influenced locally by wind strength, wind direction, surf-zone currents, and beach morphology, and is therefore impractical to predict. Potential change to the breaker type (spilling, plunging, or surging) was considered by quantification of the Irribarren number [60].
3. Results
3.1. Effects on Waves
The most common wave conditions at the NOAA wave buoy in deep water off the coast of Westwave (Figure 1) are Hm0 = 1–4 m and Tp = 7–12 s, which predominantly originate from a westerly direction with varying between approximately 10–80° and mean = 36°. At the location of the inshore Westwave wave buoy (~49 m depth) the waves have refracted towards the coast, and approach from predominantly a west north-west direction. The 1-year and 10-year return period westerly wave heights at the deep-water NOAA WWIII node are predicted to be 11.4 m and 15 m, respectively. The wave climate at the Westwave site is, therefore, extremely energetic, and is predominantly driven by Atlantic swell waves. Figure 5 shows the modelled wave field at the Westwave site under highest-occurrence wave conditions (Hm0 = 2 m, Tp = 10 s, Dp = 275°, = 30°), demonstrating that there is along-coast variability in the wave conditions in shallow water without WECs in operation at Westwave.
Figure 6 compares SWAN model simulations of the Westwave WEC array with the value of varied between = 0 (complete absorption), = 0.58 (WEC derived absorption), and = 0.9 (rated power absorption) under highest-occurrence wave conditions. As expected, the selected absorption level has a marked difference on the transmitted wave shadow in the lee of the site. At the 10 m depth contour at the coast (Figure 7), maximum wave height change is predicted to be 44% for = 0, 16% for = 0.58, and 4% for = 0.9 under the three westerly wave scenarios simulated. These maximum changes occur along the rocky coast between Whitestrand beach and Teachmore West (Figure 1), while the maximum predicted changes at Doughmore beach (where the morphological study described in Section 3.2 was undertaken) are predicted to be 10% for = 0, 5% for = 0.58, and 1.3% for = 0.9 (Table 4). Despite being a conservative method for estimating wave energy transmission, the rated power scenario ( 0.9) results in the smallest wave impacts of the three approaches.
3.2. Effects on Morphology
The beach state model of [49] demonstrates that even under the largest predicted changes to inshore wave height caused by the complete absorption scenario (red square in Figure 8), the slight decrease in and increase in (Table 4) are far smaller than the parameter shift required to cause a true change in beach state—the equivalent distance between the centres of two regions in the model. Under the unrealistic complete absorption scenario, the beach could exhibit slightly more alongshore variability, but predicting such subtle changes is beyond the capabilities of a conceptual beach state model. Under the rated power scenario, the changes in Ω and RTR are predicted to be around 3% and 8% less than under the WEC-derived absorption and complete absorption scenarios, respectively.
The XBeach simulations predict that once in equilibrium with the highest-occurrence wave conditions, the background profile variation at Doughmore beach (without WECs in operation) is at most 50 cm, and is greatest around the foot of the dune, with lesser variations also occurring lower on the profile (Figure 9). With WECs in operation, the intertidal area and dune face (250–900 m cross-shore) are predicted to have more sediment, while the subtidal area around the break in slope (150–250 m cross-shore) is predicted to have less sediment during equilibrium and storm wave conditions, representing shoreward transport of sediment and beach steepening. Under all three absorption scenarios the active beach profile is predicted to have more sediment volume than without WECs in operation, indicating that some degree of coastal protection would be provided by the presence of WECs at Westwave.
Changes to the equilibrium and storm profiles well outside the baseline profile variation were predicted by the model under the complete absorption and WEC-derived absorption scenarios. Conversely, under the rated power scenario almost all of the changes in the equilibrium and storm profiles were predicted to be within the baseline profile variation of the beach. At most, a few centimetres of vertical change outside the baseline profile variation was predicted for the rated power scenario, and the overall shape and gradient of the profile was not predicted to change. The predicted profile changes under the rated power scenario are, therefore, not considered significant, while under the WEC-derived and complete absorption scenarios the predicted changes were considered to be potentially significant.
3.3. Effects on Water Users
In deep water off the coast of Doughmore, suitable wave conditions for surfing are estimated to be 0.5 ≤ Hm0 ≤ 2.8 m, with periods of 9 ≤ Tp ≤ 20.6 s. The average ‘optimal’ conditions for surfers and other water users of all abilities in deep water off the coast of Killard are estimated to be narrow-banded swell waves with height and period of Hm0 = 1.4 m and Tp = 14.7 s. From Table 4, the predicted change in wave height at 10 m depth during such optimal surfing conditions is 0.89%, 3.39%, and 8.11% for the rated power scenario, WEC-derived absorption scenario, and complete absorption scenario, respectively. In absolute terms, this equates to reductions in Hm0 (from 0.94 m at 10 m depth with no WECs in operation) of 1 cm, 3 cm, and 8 cm, respectively. Wave period was predicted to change less than 0.25 s, for all absorption scenarios; however, frequency dependent extraction was not simulated. With these predicted changes, an assessment of the Irribarren number indicates that the natural breaker type would not change from plunging waves. It is assumed that due to the relatively minor predicted changes in the wave height and period, changes in the angle of incidence of waves arriving at the coast will not have a significant influence on wave peel angle for surfing, as this is primarily influenced by localised refraction in the shoaling and breaking zones caused by bathymetric features. However, changes in wave direction caused by wave energy absorption are not yet adequately represented in spectral (phase-averaged) wave models, and the magnitude of such effects therefore remains uncertain.
4. Discussion
Previous WEC impact assessments in the scientific literature have not explicitly accounted for the permitted array power when devising WEC transmission characteristics. Instead, some have modelled a suite of transmission coefficients (including complete energy absorption) in order to capture the full possible range of impacts, e.g., [6,8]; however, as the permitted array power is usually well defined at the impact assessment stage, a conservative maximum absorption value can be estimated for a permitted WEC array, reducing the possibility for over-or under-estimation of the potential coastal impacts. The rated power transmission coefficient, , presented in this paper offers a conservative maximum absorption level analogous to the capture width ratio of the entire wave farm. It is conservative in that it represents a realistic worst-case scenario (as the absorption level is at full permitted array power capacity) and assumes that WECs operate at design efficiency under all wave conditions, when in reality it is likely that they will operate at a lower absorption efficiency during wave conditions far removed from the design conditions. It also allows the user to be conservative by applying a low efficiency factor (γ), which, for a given permitted array power, has the effect of decreasing the wave transmission due to absorption that does not contribute to the generated power.
Other more precise methods for quantifying and modelling wave energy absorption exist and have been documented in the literature; for example, frequency dependent extraction [8,24] modelled using individual WEC devices [23] offers a more precise estimate of wave shadowing in the lee of a WEC array. However, as frequency response and WEC array layout vary from device to device, modelling these characteristics with great precision will only increase the accuracy of the modelling results if the exact devices to be deployed over the entire lifetime of the permitted array are known with certainty at the impact assessment stage. We propose that this is unlikely to be the case for many WEC sites. Conversely, the permitted array power describes the potential for coastal process impacts without making assumptions about WEC frequency response or array layout. therefore offers a simple, generic, conservative and robust approach for estimating coastal process impacts over the lifetime of a permitted WEC array, although it is acknowledged that ignoring WEC array layout and frequency response would be an unnecessary limitation of the presented method, if such parameters were well defined at the impact assessment stage.
The estimation of design wave conditions and the mechanical/electrical efficiency (γ) of energy conversion within WECs are both required in order to calculate . As these factors require assumptions about the design characteristics of WECs, they are sources of remaining uncertainty. One approach for estimating a generic design wave power value is presented in Section 2.1, based on averaged data from commercially developed WECs presented by [68]; other WEC databases also exist that could be used to inform this value [28]. It is acknowledged, however, that γ should also be informed by published performance data when these are available.
In the Westwave case study presented here, predicted beach profile changes with WECs in operation at Westwave were almost entirely within the magnitude of background profile variation when using to quantify the WEC array transmission coefficient. Conversely, cases where the WEC-derived transmission coefficient () or complete energy absorption transmission coefficient () were used showed potential profile changes well outside the background profile variability. Therefore, the choice of over more traditional transmission coefficients entirely determined whether the impacts were predicted to be significant or not in this case study.
Methods for determining impact thresholds have received relatively little attention in the scientific literature, and conclusions about the significance of the predicted effects on, for example, surfing waves or coastal sedimentation have often been subjective, despite being informed by objective modelling, e.g., [6,7]. Using a measure of natural variability offers one objective approach for identifying a significant impact threshold that is relevant to the local dynamics [85]. However, the significance of an impact actually depends on the sensitivity of the local receptors of the impact, and more research is required to provide guidance on identifying these sensitivities for WEC impact assessments. It should also be noted that bias towards erosion or accretion, even when small compared to the natural variability, may have a potentially significant cumulative impact.
In the case of surfing wave impacts, the number of ‘surfable’ days per year (i.e., days where the wave conditions are within a defined range of preferred wave heights and periods) with and without WECs in operation could be quantified. It is possible for this to increase or decrease in the presence of WECs, as waves previously larger than the preferred range may be reduced to a surfable height, while smaller waves may be made too small to surf. Describing surfing impacts in terms of the number of surfable days may provide a metric that is more comprehensible to water users than the marginal percentage changes in wave height used in the case study presented here and elsewhere in the literature, including [6,7]. However, this approach would require long hindcast wave model runs (at least 1 year in duration) to be conducted at great computational cost, and was, therefore, not undertaken for the Westwave case study.
5. Conclusions
This paper aimed to identify a number of recommended modelling practices for a wave farm coastal processes impact assessment. From a review of studies in the literature, and the subsequent application of modelling techniques for a wave farm case study in southwest Ireland, the following guidelines are proposed:
- Appropriate characterisation of the sea states of interest to the assessment must be made. In particular, attention should be paid to the local directional spread of sea states, as this has a primary effect on the predicted wave shadow in the lee of an offshore wave farm.
- Frequency-dependent modelling of individual WEC devices is likely to offer the most precise representation of WECs for wave model studies, but only in cases where WEC absorption characteristics and array layout are comprehensively defined at the impact assessment stage. In cases where the absorption characteristics are not well defined or where the WECs to be deployed over the whole lifetime of the wave farm are not known with certainty, it is more conservative to model a WEC array using a single frequency-independent transmission coefficient that represents the effects of the entire WEC array.
- To calculate such a transmission coefficient, a novel parameterisation for the frequency-independent WEC array ‘rated power’ transmission coefficient, , is presented in this study. This uses the permitted power rating of the WEC array, the area of ocean over which energy extraction is permitted, an estimate of the design wave power, and an estimate of WEC electrical efficiency to inform the maximum likely absorption of a permitted WEC array. As it can be assumed that the permitted array power will not be exceeded over the lifetime of the array, represents a generic method for quantifying a realistic worst-case scenario for wave energy absorption.
- When studying potential morphological impacts from a wave farm, variation in tidal elevation should be simulated, as it influences wave shoaling and bottom shear stresses, and will therefore modulate the potential effects of WECs on sedimentation.
- When using a process-based model to study morphological changes under WEC operation, the measured coastal morphology should initially be allowed to equilibrate to new boundary conditions before implementing WEC-affected boundary conditions, otherwise the degree of disequilibrium between the measured morphology and the boundary wave conditions will influence the degree of WEC induced impact interpreted from the simulations.
- The morphological classification of beaches in the lee of a WEC site should be studied with and without WECs in operation, as beach state can influence coastal vulnerability to storms, the level of bathing hazard, and the surfing amenity at the beach. However, traditional beach classification models do not provide the precision required to predict subtle changes in bathymetric three-dimensionality (i.e., the presence or absence of rip channels), and more complex models may need to be sought where a change in such features would cause an issue.
- Impacts on coastal water-users can range from a change in the available surfing wave resource, to changes in bathing hazards and surfing wave quality as a result of morphological impacts.
- Optimum surfing conditions require swell waves with a narrow spread of frequencies and directions, and preferred wave conditions determined from water-users in Cornwall of 1.2 m ≤ Hm0,b ≤ 3.1 m, and 9 ≤ T1/3 ≤ 20 s may provide a suitable proxy for water-user preferences elsewhere. However, water-users of differing ability levels, activities, and locations are likely to have specific preferences which may also need to be considered.
- Even though some degree of reduction in the height of preferred surfing waves is likely to be predicted under the influence of WECs, a wave farm could actually increase the number of ‘surfable’ days available per year, depending on the WEC absorption characteristics, wave resource, and wave preferences of local water-users. This may provide a more suitable metric for stakeholder engagement than the traditional use of percentage changes in wave height, but requires a significantly higher computational cost.
- Generic thresholds for ‘significant’ WEC induced impacts do not yet exist, and are likely to be site specific. Morphological impacts could be set in the context of the natural variability occurring in the region of interest; however, bias towards erosion or accretion, even when small compared to the natural variability, may have a potentially significant cumulative impact. For water-users, opinions on what constitutes a significant change to surfing waves are likely to vary widely. More research is required in order to provide guidance on identifying the sensitivities of local receptors for WEC impact assessments.
Author Contributions
Conceptualization, C.S. and D.C.; Data curation, C.S.; Formal analysis, C.S.; Funding acquisition, C.S. and D.C.; Investigation, C.S.; Methodology, C.S. and D.C.; Project administration, C.S.; Resources, C.S. and D.C.; Supervision, D.C.; Validation, C.S.; Visualization, C.S.; Writing–original draft, C.S.; Writing—review and editing, C.S. and D.C.
Funding
This research was partly funded by the school of Biological and Marine Sciences at Plymouth University, and partly by the Electricity Supply Board of Ireland.
Conflicts of Interest
The authors declare no conflict of interest. The funders had no role in the design of the study; in the collection, analyses, or interpretation of data; in the writing of the manuscript, and in the decision to publish the results.
References
- Heath, T.; Sarmento, A.; Neumann, F.; Brito E Melo, A.; Prado, M.; Yemm, R.; Tedd, J.; Friis-Madsen, E.; Kofoed, J.P.; Knapp, W. Ocean Wave Energy: Current Status and Future Perspectives; Springer: Berlin/Heidelberg, Germany, 2008. [Google Scholar]
- de O Falcão, A.F. The development of wave energy utilisation. In 2009 Annual Report, Implementing Agreement on Ocean Energy Systems, (IEA-OES); IEAOES Secretary: Lisbon, Portugal, 2009; pp. 30–36. [Google Scholar]
- Greaves, D.; Conley, D.; Magagna, D.; Aires, E.; Leitão, J.C.; Witt, M.; Embling, C.B.; Godley, B.J.; Bicknell, A.W.J.; Saulnier, J.-B.; et al. Environmental Impact Assessment: Gathering experiences from wave energy test centres in Europe. Int. J. Mar. Energy 2016, 14, 68–79. [Google Scholar] [CrossRef]
- Guidance on Environmental Impact Assessment of Offshore Renewable Energy Development on Surfing Resources and Recreation. Available online: https://www.sas.org.uk/wp-content/uploads/sas-guidance-on-environmental-impact-assessment.pdf (accessed on 19 May 2018).
- McLachlan, C. ‘You don’t do a chemistry experiment in your best china’: Symbolic interpretations of place and technology in a wave energy case. Energy Policy 2009, 37, 5342–5350. [Google Scholar] [CrossRef]
- Millar, D.L.; Smith, H.C.M.; Reeve, D.E. Modelling analysis of the sensitivity of shoreline change to a wave farm. Ocean Eng. 2007, 34, 884–901. [Google Scholar] [CrossRef]
- Li, B.; Phillips, M. South West wave energy hub: Coastal impact and wave energy. Proc. ICE-Energy 2010, 163, 17–29. [Google Scholar] [CrossRef]
- Smith, H.C.M.; Pearce, C.; Millar, D.L. Further analysis of change in nearshore wave climate due to an offshore wave farm: An enhanced case study for the Wave Hub site. Renew. Energy 2012, 40, 51–64. [Google Scholar] [CrossRef]
- Gonzalez-Santamaria, R.; Zou, Q.-P.; Pan, S. Impacts of a wave farm on waves, currents and coastal morphology in south west England. Estuaries Coast. 2015, 38, 159–172. [Google Scholar] [CrossRef]
- Abanades, J.; Greaves, D.; Iglesias, G. Coastal defence through wave farms. Coast. Eng. 2014, 91, 299–307. [Google Scholar] [CrossRef]
- Abanades, J.; Greaves, D.; Iglesias, G. Wave farm impact on the beach profile: A case study. Coast. Eng. 2014, 86, 36–44. [Google Scholar] [CrossRef]
- Abanades, J.; Greaves, D.; Iglesias, G. Wave farm impact on beach modal state. Mar. Geol. 2015, 361, 126–135. [Google Scholar] [CrossRef]
- Venugopal, V.; Smith, G.H. Wave climate investigation for an array of wave power devices. In Proceedings of the 7th European Wave and Tidal Energy Conference, Porto, Portugal, 11–14 September 2007; pp. 11–14. [Google Scholar]
- Carballo, R.; Iglesias, G. Wave farm impact based on realistic wave-WEC interaction. Energy 2013, 51, 216–229. [Google Scholar] [CrossRef]
- Mendoza, E.; Silva, R.; Zanuttigh, B.; Angelelli, E.; Lykke Andersen, T.; Martinelli, L.; Nørgaard, J.Q.H.; Ruol, P. Beach response to wave energy converter farms acting as coastal defence. Coast. Eng. 2014, 87, 97–111. [Google Scholar] [CrossRef]
- Iglesias, G.; Carballo, R.; Abanades, J.; Greaves, D. Wave farm layout and coastal impacts. Coast. Eng. Proc. 2014, 1, 36. [Google Scholar] [CrossRef]
- Le Crom, I.; Brito-Melo, A.; Sarmento, A. Maritime portuguese pilot zone for wave energy conversion: Modelling analysis of the impact on surfing conditions. In Proceedings of the 2nd International Conference on Ocean Energy (ICOE 2008), Brest, France, 15–17 October 2008. [Google Scholar]
- Palha, A.; Mendes, L.; Fortes, C.J.; Brito-Melo, A.; Sarmento, A. The impact of wave energy farms in the shoreline wave climate: Portuguese pilot zone case study using Pelamis energy wave devices. Renew. Energy 2010, 35, 62–77. [Google Scholar] [CrossRef]
- Rusu, E.; Guedes Soares, C. Coastal impact induced by a Pelamis wave farm operating in the Portuguese nearshore. Renew. Energy 2013, 58, 34–49. [Google Scholar] [CrossRef]
- Diaconu, S.; Rusu, E. The environmental impact of a Wave Dragon array operating in the Black Sea. Sci. World J. 2013, 2013. [Google Scholar] [CrossRef] [PubMed]
- Andrei-Tanase, Z.; Florin, O.; Alina, R. Coastal Impact Simulation of a Wave Dragon Farm Operating in the Nearshore of Mangalia. Univ. Marit. Constanta Analele 2014, 15, 65–70. [Google Scholar]
- Zanopol, A.T.; Onea, F.; Rusu, E. Coastal impact assessment of a generic wave farm operating in the Romanian nearshore. Energy 2014, 72, 652–670. [Google Scholar] [CrossRef]
- Chang, G.; Ruehl, K.; Jones, C.A.; Roberts, J.; Chartrand, C. Numerical modeling of the effects of wave energy converter characteristics on nearshore wave conditions. Renew. Energy 2016, 89, 636–648. [Google Scholar] [CrossRef] [Green Version]
- O’Dea, A.; Haller, M.C.; Özkan-Haller, H.T. The impact of wave energy converter arrays on wave-induced forcing in the surf zone. Ocean Eng. 2018, 161, 322–336. [Google Scholar] [CrossRef]
- Alexandre, A.; Stallard, T.; Stansby, P.K. Transformation of wave spectra across a line of wave devices. In Proceedings of the 8th European Wave and Tidal Energy Conference, Uppsala, Sweden, 7–10 September 2009. [Google Scholar]
- O’Dea, A.M.; Haller, M.C. Analysis of the impacts of wave energy converter arrays on the nearshore wave climate. In Proceedings of the 2nd Annual Marine Energy Technology Symposium, Seattle, WA, USA, 15–17 April 2014. [Google Scholar]
- Black, K.P. Review of Wave Hub Technical Studies: Impacts on Inshore Surfing Beaches. Available online: https://tethys.pnnl.gov/sites/default/files/publications/Impacts_on_Inshore_Surfing_Beaches.pdf (accessed on 9 May 2018).
- Babarit, A. A database of capture width ratio of wave energy converters. Renew. Energy 2015, 80, 610–628. [Google Scholar] [CrossRef]
- Monk, K.; Zou, Q.; Conley, D. An approximate solution for the wave energy shadow in the lee of an array of overtopping type wave energy converters. Coast. Eng. 2013, 73, 115–132. [Google Scholar] [CrossRef]
- Mollison, D. Assessing the Wave Energy Resource. Available online: http://www.macs.hw.ac.uk/~denis/wave/spruce.pdf (accessed on 9 May 2018).
- Lenee-Bluhm, P.; Paasch, R.; Özkan-Haller, H.T. Characterizing the wave energy resource of the US Pacific Northwest. Renew. Energy 2011, 36, 2106–2119. [Google Scholar] [CrossRef]
- Bento, A.R.; Rusu, E.; Martinho, P.; Soares, C.G. Assessment of the changes induced by a wave energy farm in the nearshore wave conditions. Comput. Geosci. 2014, 71, 50–61. [Google Scholar] [CrossRef]
- Monk, K.U.; Zou, Q.; Conley, D. The effect of diffraction on the redistribution of wave energy in the lee of an overtopping type wave enegry converter array. Coast. Eng. Proc. 2012. [Google Scholar] [CrossRef]
- Babarit, A. Impact of long separating distances on the energy production of two interacting wave energy converters. Ocean Eng. 2010, 37, 718–729. [Google Scholar] [CrossRef]
- Pastor, J.; Liu, Y.C. Hydrokinetic energy: Overview and it’s renewable energy potential for the Gulf of Mexico. In Proceedings of the 2012 IEEE Green Technologies Conference, Tulsa, OK, USA, 19–20 April 2012. [Google Scholar]
- Pastor, J.; Liu, Y. Wave energy resource analysis for use in wave energy conversion. J. Offshore Mech. Arct. Eng. 2015, 137, 11901–11903. [Google Scholar]
- Pastor, J.; Liu, Y. Wave climate resource analysis based on a revised gamma spectrum for wave energy conversion technology. Sustainability 2016, 8, 1321. [Google Scholar] [CrossRef]
- Poate, T.G. Morphological Response of High-Energy Macrotidal Beaches. Ph.D. Thesis, Plymouth University, Plymouth, UK, 2011. [Google Scholar]
- Black, K.P.; Andrews, C.J. Sandy shoreline response to offshore obstacles Part 1: Salient and tombolo geometry and shape. J. Coast. Res. 2001, 82–93. [Google Scholar]
- Hsu, J.R.C.; Silvester, R. Accretion behind single offshore breakwater. J. Waterw. Port Coast. Ocean Eng. 1990, 116, 362–380. [Google Scholar] [CrossRef]
- Roelvink, D.; Reniers, A.; van Dongeren, A.; van Thiel de Vries, J.; McCall, R.; Lescinski, J. Modelling storm impacts on beaches, dunes and barrier islands. Coast. Eng. 2009, 56, 1133–1152. [Google Scholar] [CrossRef]
- Thornton, E.B.; MacMahan, J.; Sallenger, A.H., Jr. Rip currents, mega-cusps, and eroding dunes. Mar. Geol. 2007, 240, 151–167. [Google Scholar] [CrossRef] [Green Version]
- Scott, T.M.; Russell, P.E.; Masselink, G.; Wooler, A.; Short, A. High volume sediment transport and its implications for recreational beach risk. Coast. Eng. 2008, 4250–4262. [Google Scholar]
- Mead, S.; Black, K. Field studies leading to the bathymetric classification of world-class surfing breaks. J. Coast. Res. 2001, 5–20. [Google Scholar]
- Scarfe, B.E.; Healy, T.R.; Rennie, H.G. Research-based surfing literature for coastal management and the science of surfing-a review. J. Coast. Res. 2009, 25, 539–557. [Google Scholar] [CrossRef]
- de Vriend, H.J.; Capobianco, M.; Chesher, T.; de Swart, H.E.; Latteux, B.; Stive, M.J.F. Approaches to long-term modelling of coastal morphology: A review. Coast. Eng. 1993, 21, 225–269. [Google Scholar] [CrossRef] [Green Version]
- Morphodynamic Models: An Overview. Available online: ftp://ftp.geosc.psu.edu/pub/geosc/sling/PUBLICATIONS_SLINGERLAND/2001-2010/Syvtitskietal2009.pdf (accessed on 10 January 2013).
- Wright, L.D.; Short, A.D. Morphodynamic variability of surf zones and beaches: A synthesis. Mar. Geol. 1984, 56, 93–118. [Google Scholar] [CrossRef]
- Masselink, G.; Short, A.D. The effect of tide range on beach morphodynamics and morphology: A conceptual beach model. J. Coast. Res. 1993, 9, 785–800. [Google Scholar]
- Scott, T.; Masselink, G.; Russell, P. Morphodynamic characteristics and classification of beaches in England and Wales. Mar. Geol. 2011, 286, 1–20. [Google Scholar] [CrossRef] [Green Version]
- Anthony, E.J. Sediment-wave parametric characterization of beaches. J. Coast. Res. 1998, 14, 347–352. [Google Scholar]
- Jackson, D.W.T.; Cooper, J.A.G.; Del Rio, L. Geological control of beach morphodynamic state. Mar. Geol. 2005, 216, 297–314. [Google Scholar] [CrossRef]
- Jiménez, J.A.; Guillén, J.; Falqués, A. Comment on the article “Morphodynamic classification of sandy beaches in low energetic marine environment” by Gómez-Pujol, L, Orfila, A., Cañellas, B., Alvarez-Ellacuria, A., Méndez, F.J., Medina, R. and Tintoré, J. Marine Geology, 242, pp. 235–246, 2007. Mar. Geol. 2008, 255, 96–101. [Google Scholar] [CrossRef]
- Almar, R.; Castelle, B.; Ruessink, B.G.; Sénéchal, N.; Bonneton, P.; Marieu, V. Two-and three-dimensional double-sandbar system behaviour under intense wave forcing and a meso–macro tidal range. Cont. Shelf Res. 2010, 30, 781–792. [Google Scholar] [CrossRef]
- Stokes, C.; Davidson, M.; Russell, P. Observation and prediction of three-dimensional morphology at a high-energy macrotidal beach. Geomorphology 2015, 243. [Google Scholar] [CrossRef]
- Stokes, C. Coastal Impacts in the Lee of a Wave Energy Site: Waves, Beach Morphology and Water-Users (Wave Hub, Cornwall, UK). Ph.D. Thesis, Plymouth University, Plymouth, UK, 2015. [Google Scholar]
- Hutt, J.A.; Black, K.P.; Mead, S.T. Classification of surf breaks in relation to surfing skill. J. Coast. Res. 2001, 66–81. [Google Scholar]
- Stokes, C.; Beaumont, E.; Russell, P.; Greaves, D. Coastal impacts of marine renewables: Perception of breaker characteristics by beach water users. J. Coast. Res. 2014, 70. [Google Scholar] [CrossRef]
- Mead, S.; Black, K. Functional component combinations controlling surfing wave quality at world-class surfing breaks. J. Coast. Res. 2001, 21–32. [Google Scholar]
- Battjes, J.A. Surf similarity. In Proceedings of the 14th International Conference on Coastal Engineering, Copenhagen, Denmark, 24–28 June 1974. [Google Scholar]
- Walker, J.R.; Palmer, R.Q. Surf Parameters; a General Surf Site Concept; LOOK Laboratory Technical Report; Department of Ocean Engineering, University of Hawaii: Honolulu, HI, USA, 1971; Volume 18. [Google Scholar]
- MacMahan, J.; Reniers, A.; Brown, J.; Brander, R.; Thornton, E.; Stanton, T.; Brown, J.; Carey, W. An introduction to rip currents based on field observations. J. Coast. Res. 2011, 27, 3–6. [Google Scholar] [CrossRef]
- Brighton, B.; Sherker, S.; Brander, R.; Thompson, M.; Bradstreet, A. Rip current related drowning deaths and rescues in Australia 2004–2011. Nat. Hazards Earth Syst. Sci. 2013, 13, 1069–1075. [Google Scholar] [CrossRef] [Green Version]
- Scarfe, B.E.; Elwany, M.H.S.; Mead, S.T.; Black, K.P. The Science of Surfing Waves And Surfing Breaks—A Review. Available online: https://escholarship.org/content/qt6h72j1fz/qt6h72j1fz.pdf (accessed on 12 September 2012).
- Stokes, C.; Russell, P.; Davidson, M. Subtidal and intertidal three-dimensionality at a high energy macrotidal beach. J. Coast. Res. 2016, 75, 472–476. [Google Scholar] [CrossRef]
- Booij, N.; Ris, R.C.; Holthuijsen, L.H. A third-generation wave model for coastal regions: 1. Model description and validation. J. Geophys. Res. Ocean. 1999, 104, 7649–7666. [Google Scholar] [CrossRef] [Green Version]
- Fernandez, H.; Iglesias, G.; Carballo, R.; Castro, A.; Fraguela, J.A.; Taveira-Pinto, F.; Sanchez, M. The new wave energy converter WaveCat: Concept and laboratory tests. Mar. Struct. 2012, 29, 58–70. [Google Scholar] [CrossRef]
- Silva, D.; Rusu, E.; Soares, C.G. Evaluation of various technologies for wave energy conversion in the Portuguese nearshore. Energies 2013, 6, 1344–1364. [Google Scholar] [CrossRef]
- Larson, M.; Hoan, L.X.; Hanson, H. Direct formula to compute wave height and angle at incipient breaking. J. Waterw. Port Coast. Ocean Eng. 2010, 136, 119–122. [Google Scholar] [CrossRef]
- XBeach Model Description and Manual. Available online: https://www.researchgate.net/profile/Arnold_Van_Rooijen/publication/306037851_XBeach_Technical_Reference_Kingsday_Release/links/57ac292f08ae3765c3b88518/XBeach-Technical-Reference-Kingsday-Release.pdf (accessed on 13 June 2016).
- Roelvink, D.; McCall, R.; Mehvar, S.; Nederhoff, K.; Dastgheib, A. Improving predictions of swash dynamics in XBeach: The role of groupiness and incident-band runup. Coast. Eng. 2018, 134, 103–123. [Google Scholar] [CrossRef]
- Roelvink, D.; Reniers, A. Dissipation in random wave groups incident on a beach. Adv. Coast. Eng. 1993, 19, 127–150. [Google Scholar] [CrossRef]
- Daly, C.; Roelvink, D.; van Dongeren, A.; van Thiel de Vries, J.; McCall, R. Validation of an advective-deterministic approach to short wave breaking in a surf-beat model. Coast. Eng. 2012, 60, 69–83. [Google Scholar] [CrossRef]
- Svendsen, I.A. Wave heights and set-up in a surf zone. Coast. Eng. 1984, 8, 303–329. [Google Scholar] [CrossRef]
- Nairn, R.B.; Roelvink, J.A.; Southgate, H.N. Transition zone width and implications for modelling surfzone hydrodynamics. In Proceedings of the 22th International Conference on Coastal Engineering, Delft, The Netherlands, 2–6 June 1990; pp. 68–81. [Google Scholar]
- Dano, R.; Reniers, A. A Guide to Modeling Coastal Morphology. Advances in Coastal Engineering; World Scientific: Singapore, 2011; ISBN 978-981-4304-25-2. [Google Scholar]
- Longuet-Higgins, M.S.; Stewart, R.W. Radiation stress and mass transport in gravity waves, with application to ‘surf beats’. J. Fluid Mech. 1962, 13, 481–504. [Google Scholar] [CrossRef]
- Longuet-Higgins, M.S.; Stewart, R.W. Radiation stresses in water waves; a physical discussion, with applications. Deep Sea Res. Oceanogr. Abstr. 1964, 11, 529–562. [Google Scholar] [CrossRef]
- Phillips, O.M. The Dynamics of the Upper Ocean, 2nd ed.; Cambridge University Press: New York, NY, USA, 1977; ISBN 0-521-29801-6. [Google Scholar]
- Van Dongeren, A.; Bolle, A.; Vousdoukas, M.I.; Plomaritis, T.; Eftimova, P.; Williams, J.; Armaroli, C.; Idier, D.; Van Geer, P.; van Thiel de Vries, J.; et al. MICORE: Dune erosion and overwash model validation with data from nine European field sites. In Proceedings of Coastal Dynamics 2009; World Scientific: Singapore, 2009; Volume 9, pp. 1–15. [Google Scholar]
- McCall, R.T.; van Thiel de Vries, J.S.M.; Plant, N.G.; Van Dongeren, A.R.; Roelvink, J.A.; Thompson, D.M.; Reniers, A.J.H.M. Two-dimensional time dependent hurricane overwash and erosion modeling at Santa Rosa Island. Coast. Eng. 2010, 57, 668–683. [Google Scholar] [CrossRef]
- Bolle, A.; Mercelis, P.; Roelvink, D.; Haerens, P.; Trouw, K. Application and validation of XBeach for three different field sites. Coast. Eng. Proc. 2011, 1, 40. [Google Scholar] [CrossRef]
- Splinter, K.D.; Palmsten, M.L. Modeling dune response to an East Coast Low. Mar. Geol. 2012, 329, 46–57. [Google Scholar] [CrossRef]
- Plant, N.G.; Holland, K.T.; Puleo, J.A. Analysis of the scale of errors in nearshore bathymetric data. Mar. Geol. 2002, 191, 71–86. [Google Scholar] [CrossRef]
- Robins, P.E.; Neill, S.P.; Lewis, M.J. Impact of tidal-stream arrays in relation to the natural variability of sedimentary processes. Renew. Energy 2014, 72, 311–321. [Google Scholar] [CrossRef]
Figure 1.
(a) Location of Westwave in Co. Clare on the south-west coast of Ireland. The outer, middle, and inner dotted regions represent the extents of the 2000 m, 200 m, and 50 m nested wave model grids, respectively, which were forced by the WWIII node on the western boundary of the coarse model grid (diamond); (b) the location of the proposed offshore WEC array at Westwave and known surfing beaches in the region; (c) wave height rose demonstrating the energetic wave climate from the Killard wave buoy (triangle in (b)).

Figure 2.
Validation of SWAN model accuracy (solid lines) against measured wave buoy data from the Westwave wave buoy (Figure 1) in ~49 m depth (dotted lines): (a) significant wave height, Hm0 (root-mean-square error (RMSE) 0.63 m); (b) peak wave period, Tp (RMSE 1.3 s); (c) peak wave direction, Dp (RMSE 12°).

Figure 3.
Significant wave height (Hm0) and energy period (Te) at which maximum wave energy absorption occurs for a number of pre-existing wave energy converters, determined from published power matrices [68]. The dashed lines show the average Hm0 and Te from these data, used as a generic design wave condition.

Figure 4.
Doughmore beach, Co. Clare, Ireland: (a) Location of cross-shore profile used in XBeach (solid line). Imagery courtesy of DigitalGlobe, Data SIO, National Oceanic and Atmospheric Administration (NOAA), U.S. Navy, NGA, and GEBCO; (b) equilibrium and storm profiles from XBeach simulation and tidal elevations of mean low water spring (MLWS), mean low water neap (MLWN), mean high water neap (MHWN), and mean high water spring (MHWS); (c) difference in elevation between the equilibrium and storm profiles (dotted line) and range of background profile variability (filled area, defined in the text).

Figure 5.
Wave height field for highest-occurrence westerly wave conditions. The location of the proposed WEC site is shown as a solid line for reference, but was not simulated in this model run. The location of the panels in Figure 5 is shown as a dashed line. The locations of known surfing beaches are numbered; 1 = Lahinche, 2 = Cregg, 3 = Spanish Point, 4 = Doughmore, 5 = Doonbeg, 6 = Killard, 7 = Teachmore West, 8 = Kilkee. The numbered contour lines show bathymetric depth from Mean Sea Level (MSL).

Figure 6.
Simulated wave height shadow for highest-occurrence westerly wave conditions, under three different absorption scenarios: (a) complete absorption scenario; (b) WEC-derived absorption scenario; (c) rated power absorption scenario. The position of the Westwave array is shown as a solid line in each panel. The arrows show the angle of wave approach at the offshore model boundary. Points 4, 5 and 6 show the location of beaches in the wave shadow (Doughmore, Doonbeg, and Whitestrand, respectively). The numbered contour lines show bathymetric depth from MSL. The location of the panels is shown in Figure 5 as a dashed box.

Figure 7.
Change in wave height at the 10 m depth contour along the coast in the lee of Westwave for different westerly wave cases (solid, dashed, and dotted lines) under different wave energy extraction scenarios ( = 0.9, rated power absorption; = 0.58, WEC derived absorption = 0, complete absorption). The distance along the coast is from north to south, with the along coast distances of Doughmore, Whitestrand, Doonbeg, and Teachmore West beaches shown for reference. The boundary wave conditions for each wave case are detailed in Table 2.

Figure 8.
Naturally occurring (without WECs) equilibrium beach morphology state at Doughmore beach (black squares), as well as equilibrium beach states that may occur with WECs in operation at Westwave (coloured squares) under differing energy extraction scenarios ( = 0.9, rated power absorption; = 0.58, WEC derived absorption; = 0, complete absorption). The beach state model of [49] is used; for definition of axes parameters, see Section 2.2.

Figure 9.
Results of XBeach profile change simulations under different absorption scenarios at Westwave ( = 0.9, rated power absorption; = 0.58, WEC-derived absorption; = 0, complete absorption) for equilibrium conditions (panels (a,b)) and storm conditions (panels (c,d)): (a,c) show the profile shape; (b,d) show the profile change. The shaded areas in panels (b,d) represent the background profile variability; WEC-induced profile changes that lie outside of the shaded areas are used to indicate where a significant impact may occur.


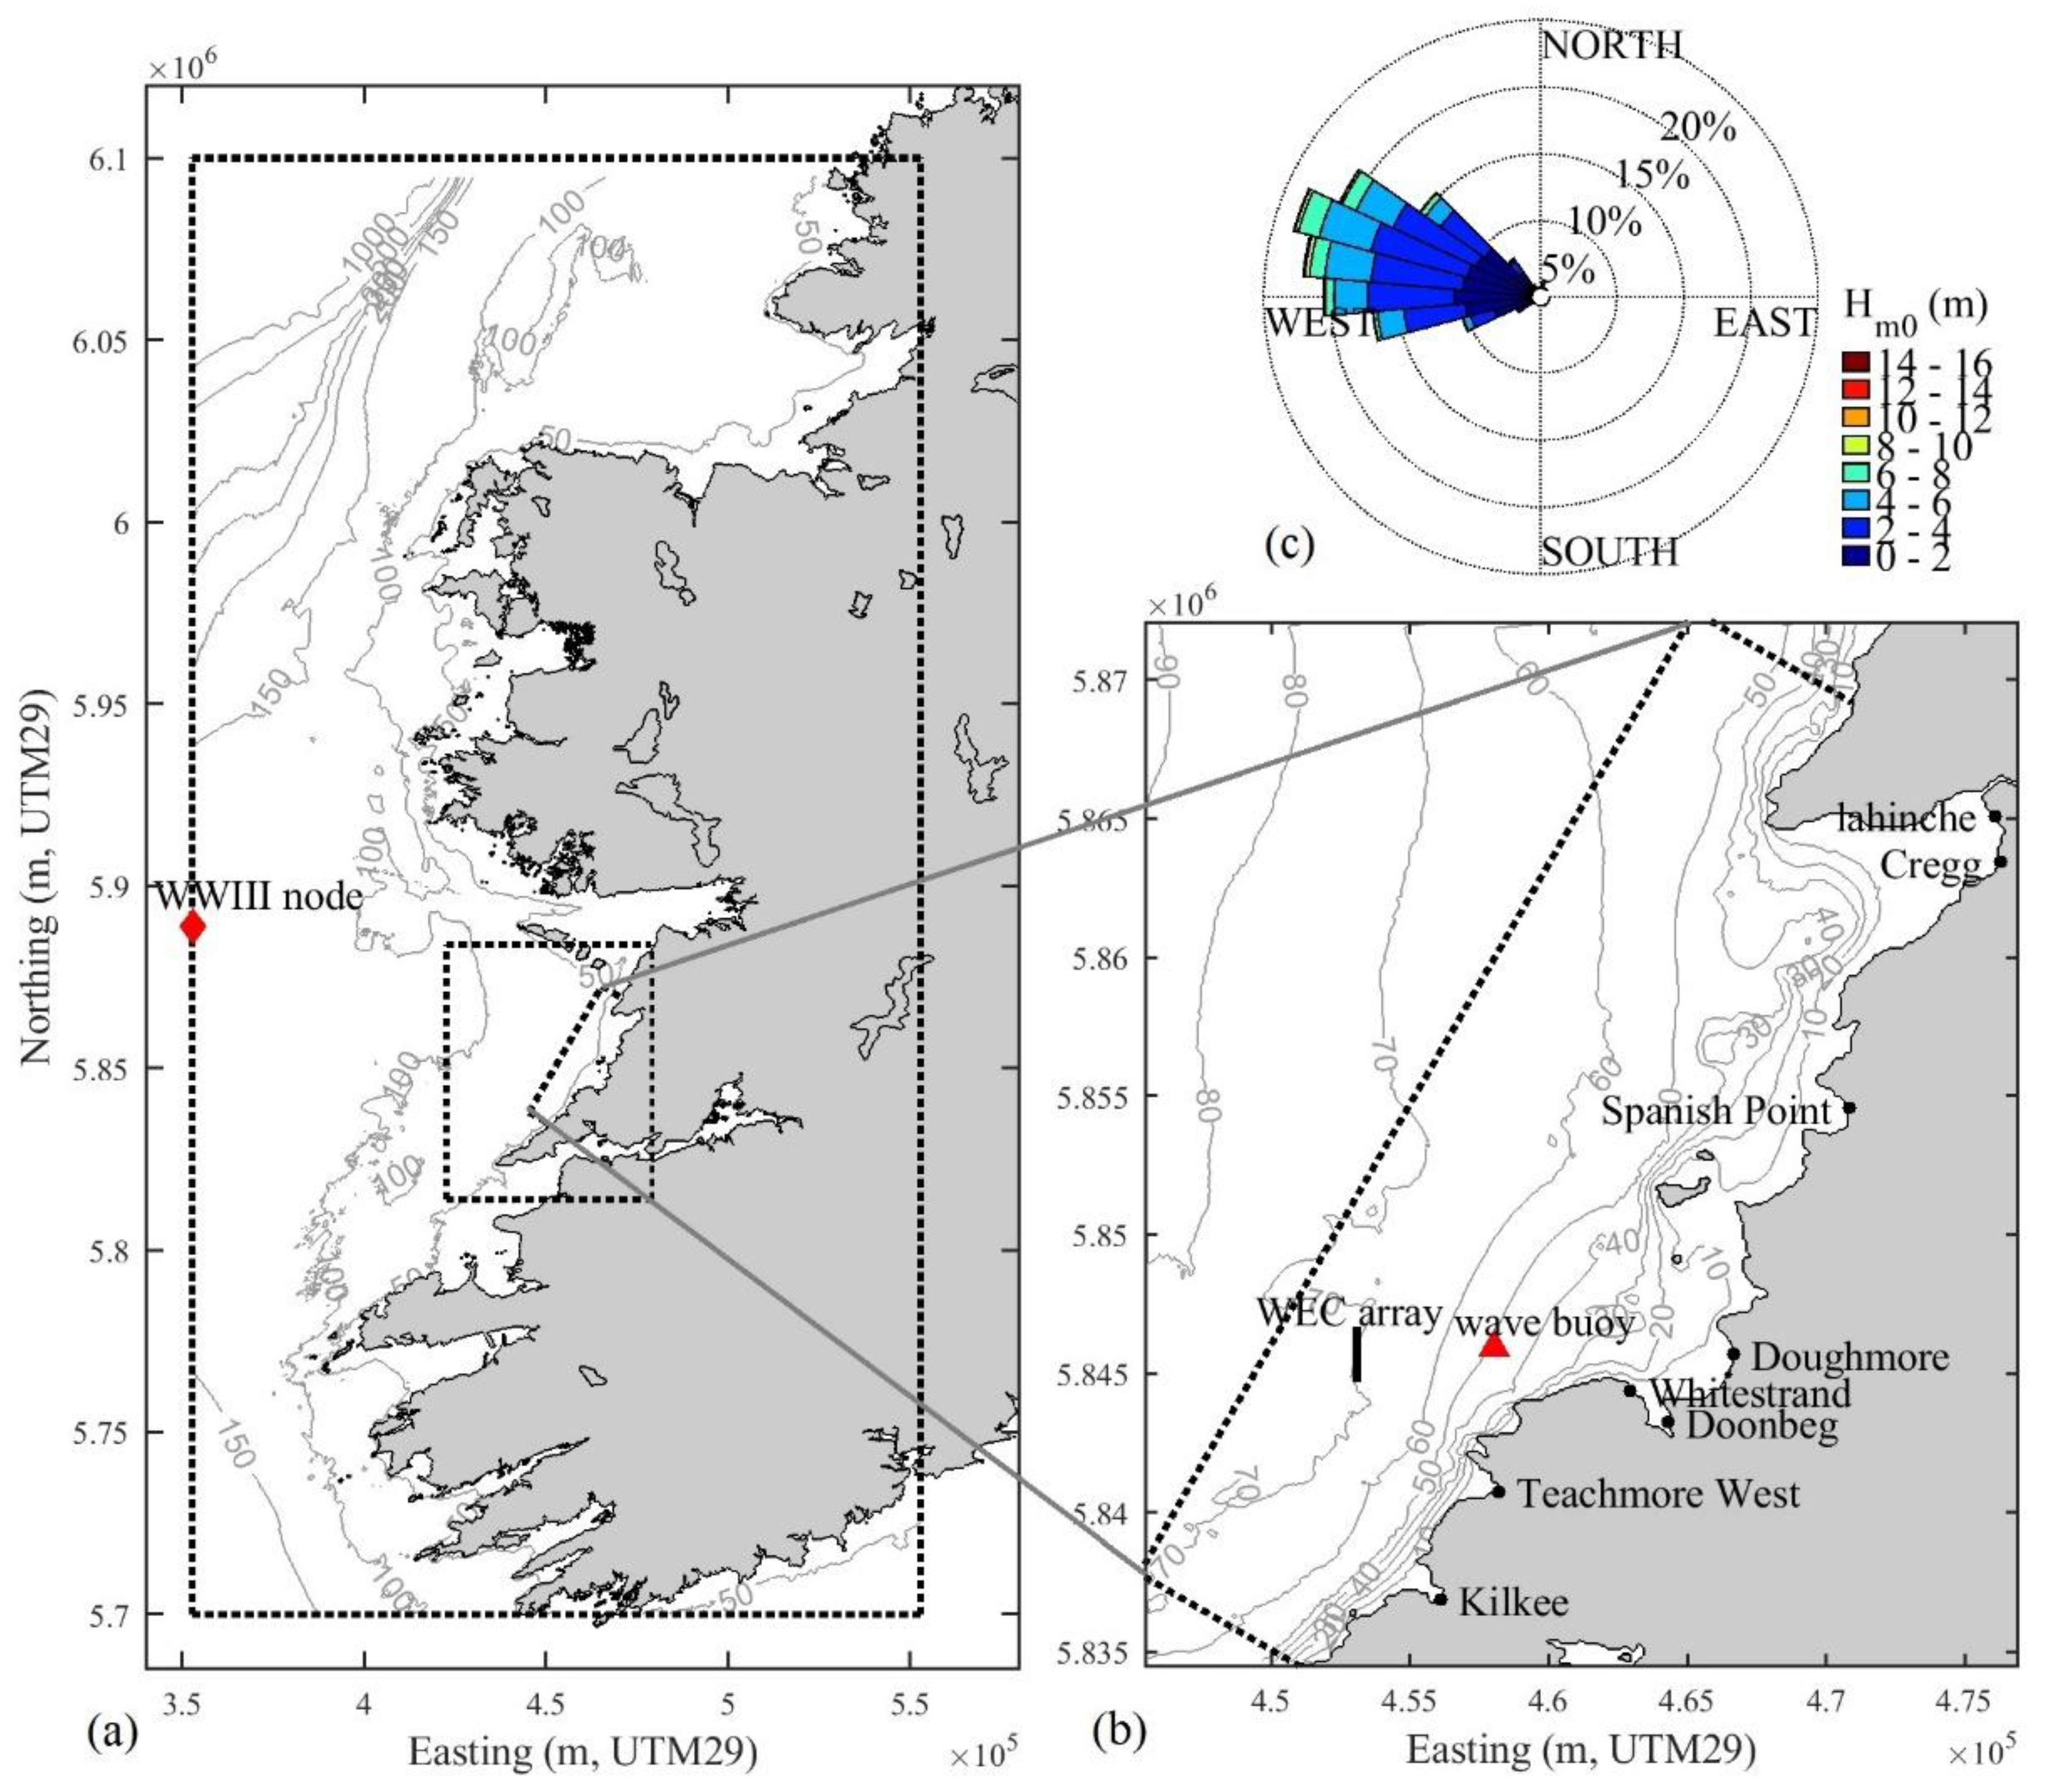
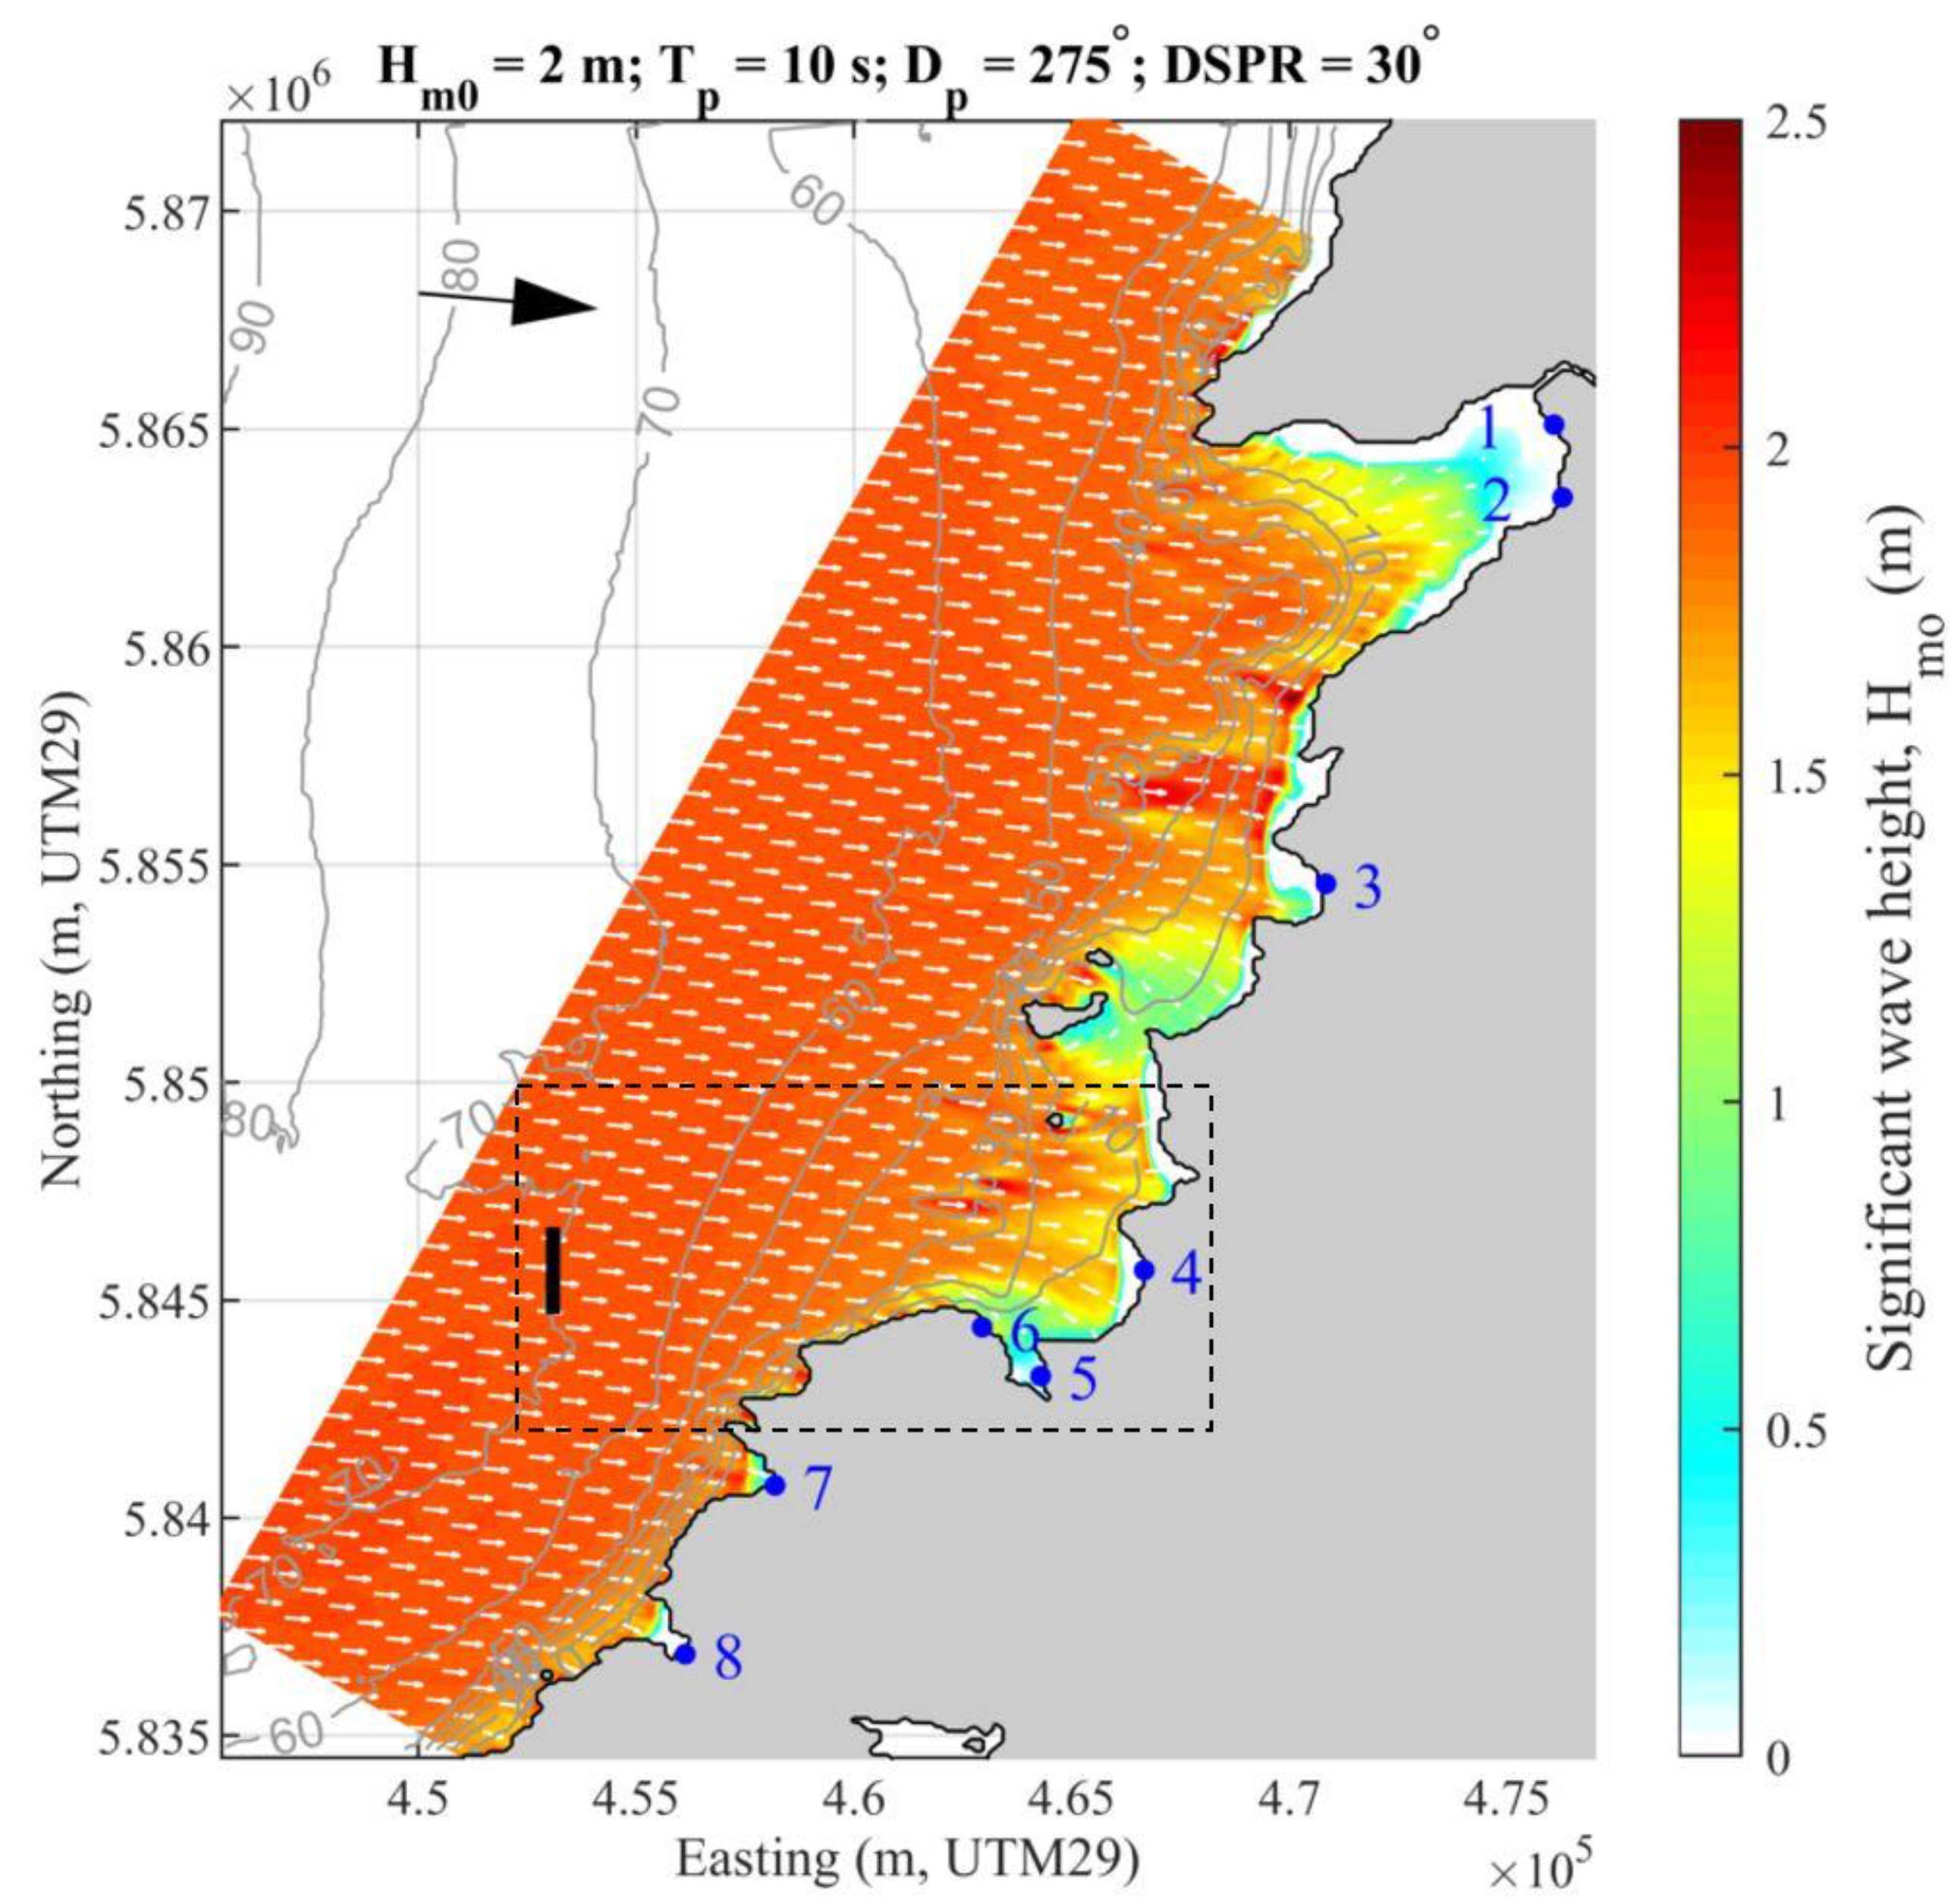
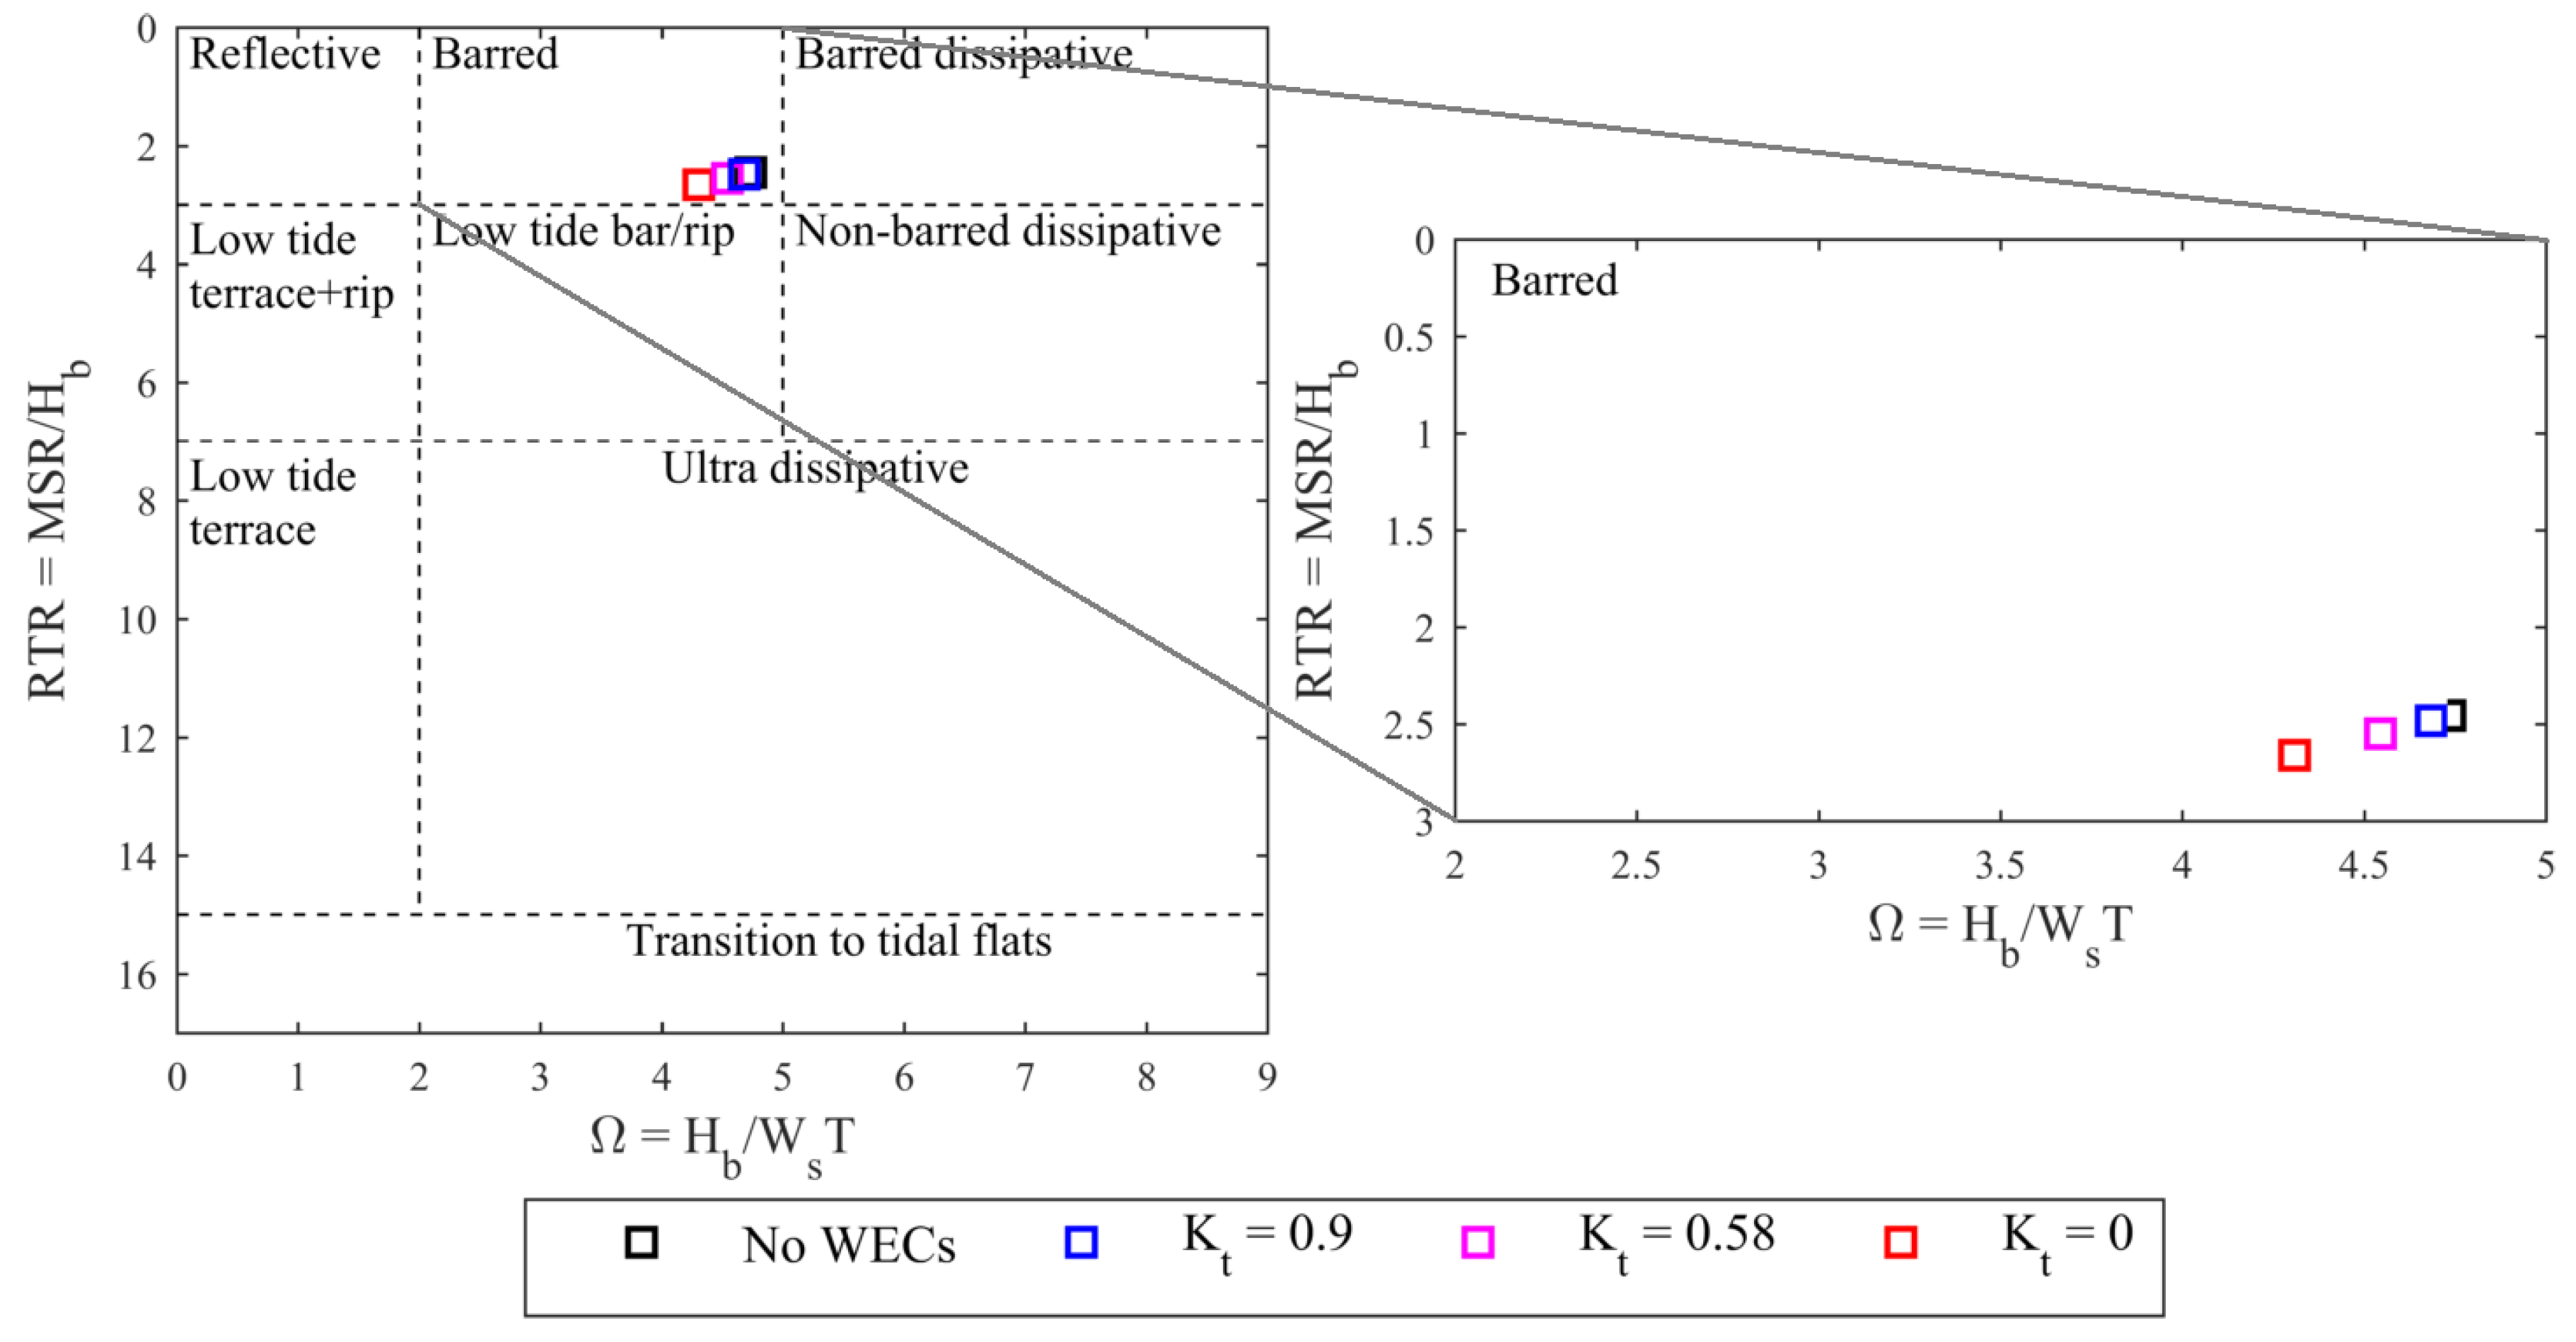
Table 1.
The new ‘rated power’ transmission coefficient, , compared to existing absorption scenarios from wave energy converter (WEC) impact studies in the literature. Either the wave case that generated the most power, or the highest-occurrence wave case was selected as the design wave condition, depending on the availability of information in the studies. = 1 was applied in all cases, as it was not specified in the studies. All and values represent the ratio of transmitted wave energy over incident wave energy.
| WEC Site | Study | Wave Scenario | Modelled Array Characteristics | Permitted Array Characteristics | Diff. | |||||||
|---|---|---|---|---|---|---|---|---|---|---|---|---|
| Hs (m) | Te (s) | |||||||||||
| Wave Hub, Cornwall, UK | Millar, Smith and Reeve 2007 (worst case) | 3.3 | 14.5 | 77,576 | 3000 | 232.7 | 0 | 3000 | 30 | 0.87 | +202.7 | |
| Maritime Pilot Zone, S. Pedro de Moel, Portugal | Palha et al., 2010 (config. A) | 2.9 | 11.1 | 45,798 | 13,500 | 61.8 | 0.9 | 17,000 | 250 | 0.68 | −188.2 | |
| Le Crom et al., 2008 (config. A) | 2 | 9.24 | 18,133 | 13,500 | 12.2 | 0.95 | 17,000 | 250 | 0.19 | −237.8 | ||
Table 2.
Wave scenarios modelled in SWAN. Only results for westerly wave cases are presented in Section 3.
Table 2.
Wave scenarios modelled in SWAN. Only results for westerly wave cases are presented in Section 3.
| Direction of Wave Approach | Highest-Occurrence Wave | 1-Year Return Period Height | Optimum Surf Conditions | ||||||||||
|---|---|---|---|---|---|---|---|---|---|---|---|---|---|
| Hm0 (m) | Tp (s) | Dp (°) | Hm0 (m) | Tp (s) | Dp (°) | Hm0 (m) | Tp (s) | Dp (°) | |||||
| NW | 2.5 | 10 | 290 | 30 | 10.6 | 15.0 | 290 | 25.6 | 1.4 | 14.7 | 290 | 20 | |
| W | 2 | 10 | 275 | 30 | 11.4 | 14.5 | 275 | 26.4 | 1.4 | 14.7 | 275 | 20 | |
| SW | 2.5 | 10 | 250 | 30 | 8.6 | 12.6 | 250 | 25.5 | 1.4 | 14.7 | 250 | 20 | |
Table 3.
Transmission coefficients applied to three absorption scenarios. The parameters in columns 3, 4, and 7 were used to calculate as well as to calculate the equivalent array power modelled under the and scenarios. As demonstrated by the final column, these two scenarios far exceed the 5 MW power rating of Westwave.
| Absorption Scenario | Energy Transmission Coefficient, Kt | Estimated WEC Efficiency, | Array Length, X (M) | Design Wave Height, Hm0 (M) | Design Wave Period, Te (S) | Design Wave Power, Pw (W/M) | Permitted Array Power (W) | Modelled Array Power, Pa (W) |
|---|---|---|---|---|---|---|---|---|
| ‘Rated power’ | 0.90 | 0.3 | 2000 | 5 | 7 | 85,874 | 5,000,000 | 5,000,000 |
| ‘WEC derived absorption’ | 0.58 | 0.3 | 2000 | 5 | 7 | 85,874 | 5,000,000 | 12,365,856 |
| ‘Complete absorption’ | 0.00 | 0.3 | 2000 | 5 | 7 | 85,874 | 5,000,000 | 51,524,400 |
Table 4.
Percentage changes in wave height and morphological parameters under three absorption scenarios ( = 0, complete absorption; = 0.58, WEC derived absorption; = 0.9, rated power absorption). Columns 1–3 show changes in wave height for three westerly wave cases at the 10 m depth contour adjacent to Doughmore beach. The last four columns show changes in morphological parameters at Doughmore beach under equilibrium (highest occurrence) and storm (1-year return period) wave conditions.
| Absorption Scenario | % Change in Wave Height | % Change in Morphological Parameters | |||||
|---|---|---|---|---|---|---|---|
| Highest-Occurrence Wave | 1-Year Return Period | Optimal Surf Conditions | Equilibrium Ω | Equilibrium Relative Tide Range (RTR) | Equilibrium Profile Volume | Storm Profile Volume | |
| = = 0.00 | −10.15 | −1.74 | −8.11 | −8.99 | +8.39 | +0.12 | +0.10 |
| = = 0.58 | −4.54 | −0.70 | −3.39 | −4.01 | +3.78 | +0.07 | +0.05 |
| = = 0.90 | −1.27 | −0.17 | −0.89 | −1.06 | +1.07 | +0.03 | +0.02 |
© 2018 by the authors. Licensee MDPI, Basel, Switzerland. This article is an open access article distributed under the terms and conditions of the Creative Commons Attribution (CC BY) license (http://creativecommons.org/licenses/by/4.0/).
Share and Cite
MDPI and ACS Style
Stokes, C.; Conley, D.C. Modelling Offshore Wave farms for Coastal Process Impact Assessment: Waves, Beach Morphology, and Water Users. Energies 2018, 11, 2517. https://doi.org/10.3390/en11102517
AMA Style
Stokes C, Conley DC. Modelling Offshore Wave farms for Coastal Process Impact Assessment: Waves, Beach Morphology, and Water Users. Energies. 2018; 11(10):2517. https://doi.org/10.3390/en11102517
Chicago/Turabian StyleStokes, Christopher, and Daniel C. Conley. 2018. "Modelling Offshore Wave farms for Coastal Process Impact Assessment: Waves, Beach Morphology, and Water Users" Energies 11, no. 10: 2517. https://doi.org/10.3390/en11102517
Note that from the first issue of 2016, this journal uses article numbers instead of page numbers. See further details here.