Research on Modeling of Microgrid Based on Data Testing and Parameter Identification

1
College of Information Science and Technology, Fudan University, Shanghai 200433, China
2
State Key Laboratory of Operation and Control of Renewable Energy & Storage, China EPRI, Nanjing 210003, China
3
College of Electrical Engineering and Automation, Hefei University of Technology, Hefei 230009, China
*
Authors to whom correspondence should be addressed.
Energies 2018, 11(10), 2525; https://doi.org/10.3390/en11102525
Submission received: 31 July 2018
/
Revised: 15 September 2018
/
Accepted: 19 September 2018
/
Published: 21 September 2018
(This article belongs to the Special Issue Power Quality in Microgrids Based on Distributed Generators)
Abstract
:The model parameter identification based on real operation data is a means to accurately determine the simulation parameters of the microgrid, but the real operation data cannot guarantee the exact agreement with the required data for parameter identification, which has become an important restriction factor in the accurate simulation and analysis of the dynamics of the microgrid. This paper provides a method of modeling of microgrid based on data testing and parameter identification. In this paper, the method of parameter trajectory sensitivity is first introduced. Then, the data testing scheme for parameter identification is presented, and the parameter identification flow chart is given. Thirdly, a microgrid demonstration system in China is taken as an example, the important parameters of the distributed photovoltaic, direct-drive wind turbine and energy storage unit in the system are obtained by data testing and parameter identification, and in the end, the accuracy of the model is verified through the comparison of the simulation data and the test data of the microgrid during grid-connection/island switching process. The obtained microgrid model provides a base model for the analysis of the overall characteristics, such as the transient stability, as well as power quality of the microgrid.
1. Introduction
A microgrid with multiple distributed renewable power sources is conducive to increasing the application of renewable energy power generation, reducing energy consumption, and improving the reliability and flexibility of power systems, thus, is developing rapidly worldwide. At present, there are more than 400 microgrid demonstration projects planned, under construction or put into operation worldwide.
Digital modeling and simulation is one of the main methods of microgrid research, which provides a necessary tool and strong technical support for the study of microgrid operation mechanisms, protection control and other issues. Models developed by manufacturers of wind turbines, photovoltaic (PV) units, and energy storage units can reproduce the behavior of distributed power sources accurately and in detail. However, this level of detail is not suitable for the stability study of large power systems. This is because the use of these models requires a lot of input data, and due to the large number of state variables in the models, the time and complexity of simulations are greatly increased. Therefore, the standards committees in China and abroad have issued general dynamic models for renewable power sources such as wind turbines, PV, energy storage, etc. On one hand, the general models can accurately simulate the dynamic behavior of renewable power supply, on the other hand, it is suitable for large-scale power grid research [1,2,3,4].
With the general models that provide a unified modeling standard for power system analysis, the accuracy of model parameters will directly affect the results of the system analysis, because when the power grid is disturbed, it may cause large economic losses. At present, the following problems exist in obtaining model parameters: Firstly, the manufacturer is unwilling to provide accurate parameters of the model for reasons of confidentiality; secondly, the general model used in system analysis is not completely consistent with the model provided by the manufacturer; thirdly, the model parameters presented by the manufacturer are applied to ideal working conditions of a single component. When multiple components are running at the same time, the interaction between the components, and the interference of various factors during real operation, cause the output result of the model to have errors with the result under the original ideal working conditions. Therefore, determining how to obtain the key parameters in the simulation model is crucial to the accuracy of the system analysis results.
Model parameter identification based on real operation data is currently a method that can accurately determine the simulation parameters. The parameter identification methods of power system mainly include: The time domain identification method, the frequency domain identification method and the intelligent optimization method. The time domain identification method directly identifies model parameters based on the time domain sampling information of the system, and the most commonly used method is the least square method [5]. The frequency domain identification method uses the fast Fourier transform to convert the time domain information of the system into the frequency domain, and obtains the parameter value through the frequency domain response function of the system [6]. The intelligent optimization method is based on the global optimization characteristics of the optimization algorithm itself, and determines the optimal value of the model parameters by calculating the fitness of the objective function. Intelligent optimization algorithms that are popularly used include the ant colony algorithm [7], particle swarm algorithm [8] and genetic algorithm [9].
Parameter identification with simulation data for the study of algorithms is practical, such as references [10,11,12,13,14]. Although, only the parameters identified from the real operation data can be used in the simulation analysis of the actual system [15,16,17,18,19]. However, the real operation data obtained online cannot guarantee the exact agreement with the required data for parameter identification. Therefore, based on the above research, the data testing scheme of an actual microgrid for parameter identification has been presented in this paper, and the data testing scheme and parameter identification are applied to a microgrid demonstration system in Jiangsu province, China for a more accurate simulation model. Characteristics of the grid-connection/island switching process of the microgrid are tested and simulated to verify the effectiveness of the model.
The structure of the paper is as follows: The second part introduces the parameters to be identified, the data testing scheme, the flow chart of parameter identification and the validation index based on parameter trajectory sensitivity analysis. The third part gives the identification results of the actual microgrid and verifies the accuracy of the model by comparing the simulation data and the test data during the grid-connection/island switching process. Finally, the paper gives the conclusions and the issues to be studied in the future.
2. Parameter Identification and Data Testing for Microgrid Based on Sensitivity Analysis
2.1. Parameter Trajectory Sensitivity
The trajectory sensitivity of parameters is a measure of the difficulty of parameter identification. The greater the trajectory sensitivity, the greater the influence of parameters on the dynamic behavior of the system and the easier it is to identify [20]. Trajectory sensitivity (relative value) is defined as the following formula:
where is the trajectory sensitivity of the i-th parameter , and is the given value of the parameter ; y is one of the observed quantities. m is the number of parameters to be identified.
Research shows that if the observed quantity is sensitive to the parameters, that is, the corresponding trajectory sensitivity is relatively large, the parameters can be easily identified according to the observed quantities. On the contrary, if the parameter has little influence on all the observed quantities, then the parameter is not easy to identify. In order to quantitatively compare the sensitivity of each parameter, the average value of the absolute values of each point of the track sensitivity can be calculated according to the following formula:
where k is the total number of points of trajectory sensitivity.
2.2. Determination of Parameters to be Identified and Data Testing Scheme for the Microgrid
2.2.1. Sensitivity Analysis
For the PV, direct-drive wind turbine and energy storage unit in the microgrid discussed in this paper, the converter is the core component. So it is a key technology for distributed generation unit modeling to establish a reasonable model of the converter and its controller and to obtain its parameters accurately.
In this paper, based on the general models discussed in Section 1, and according to the analysis of transient characteristics of microgrids, models of the PV, direct-drive wind turbine and energy storage unit control system are established, respectively.
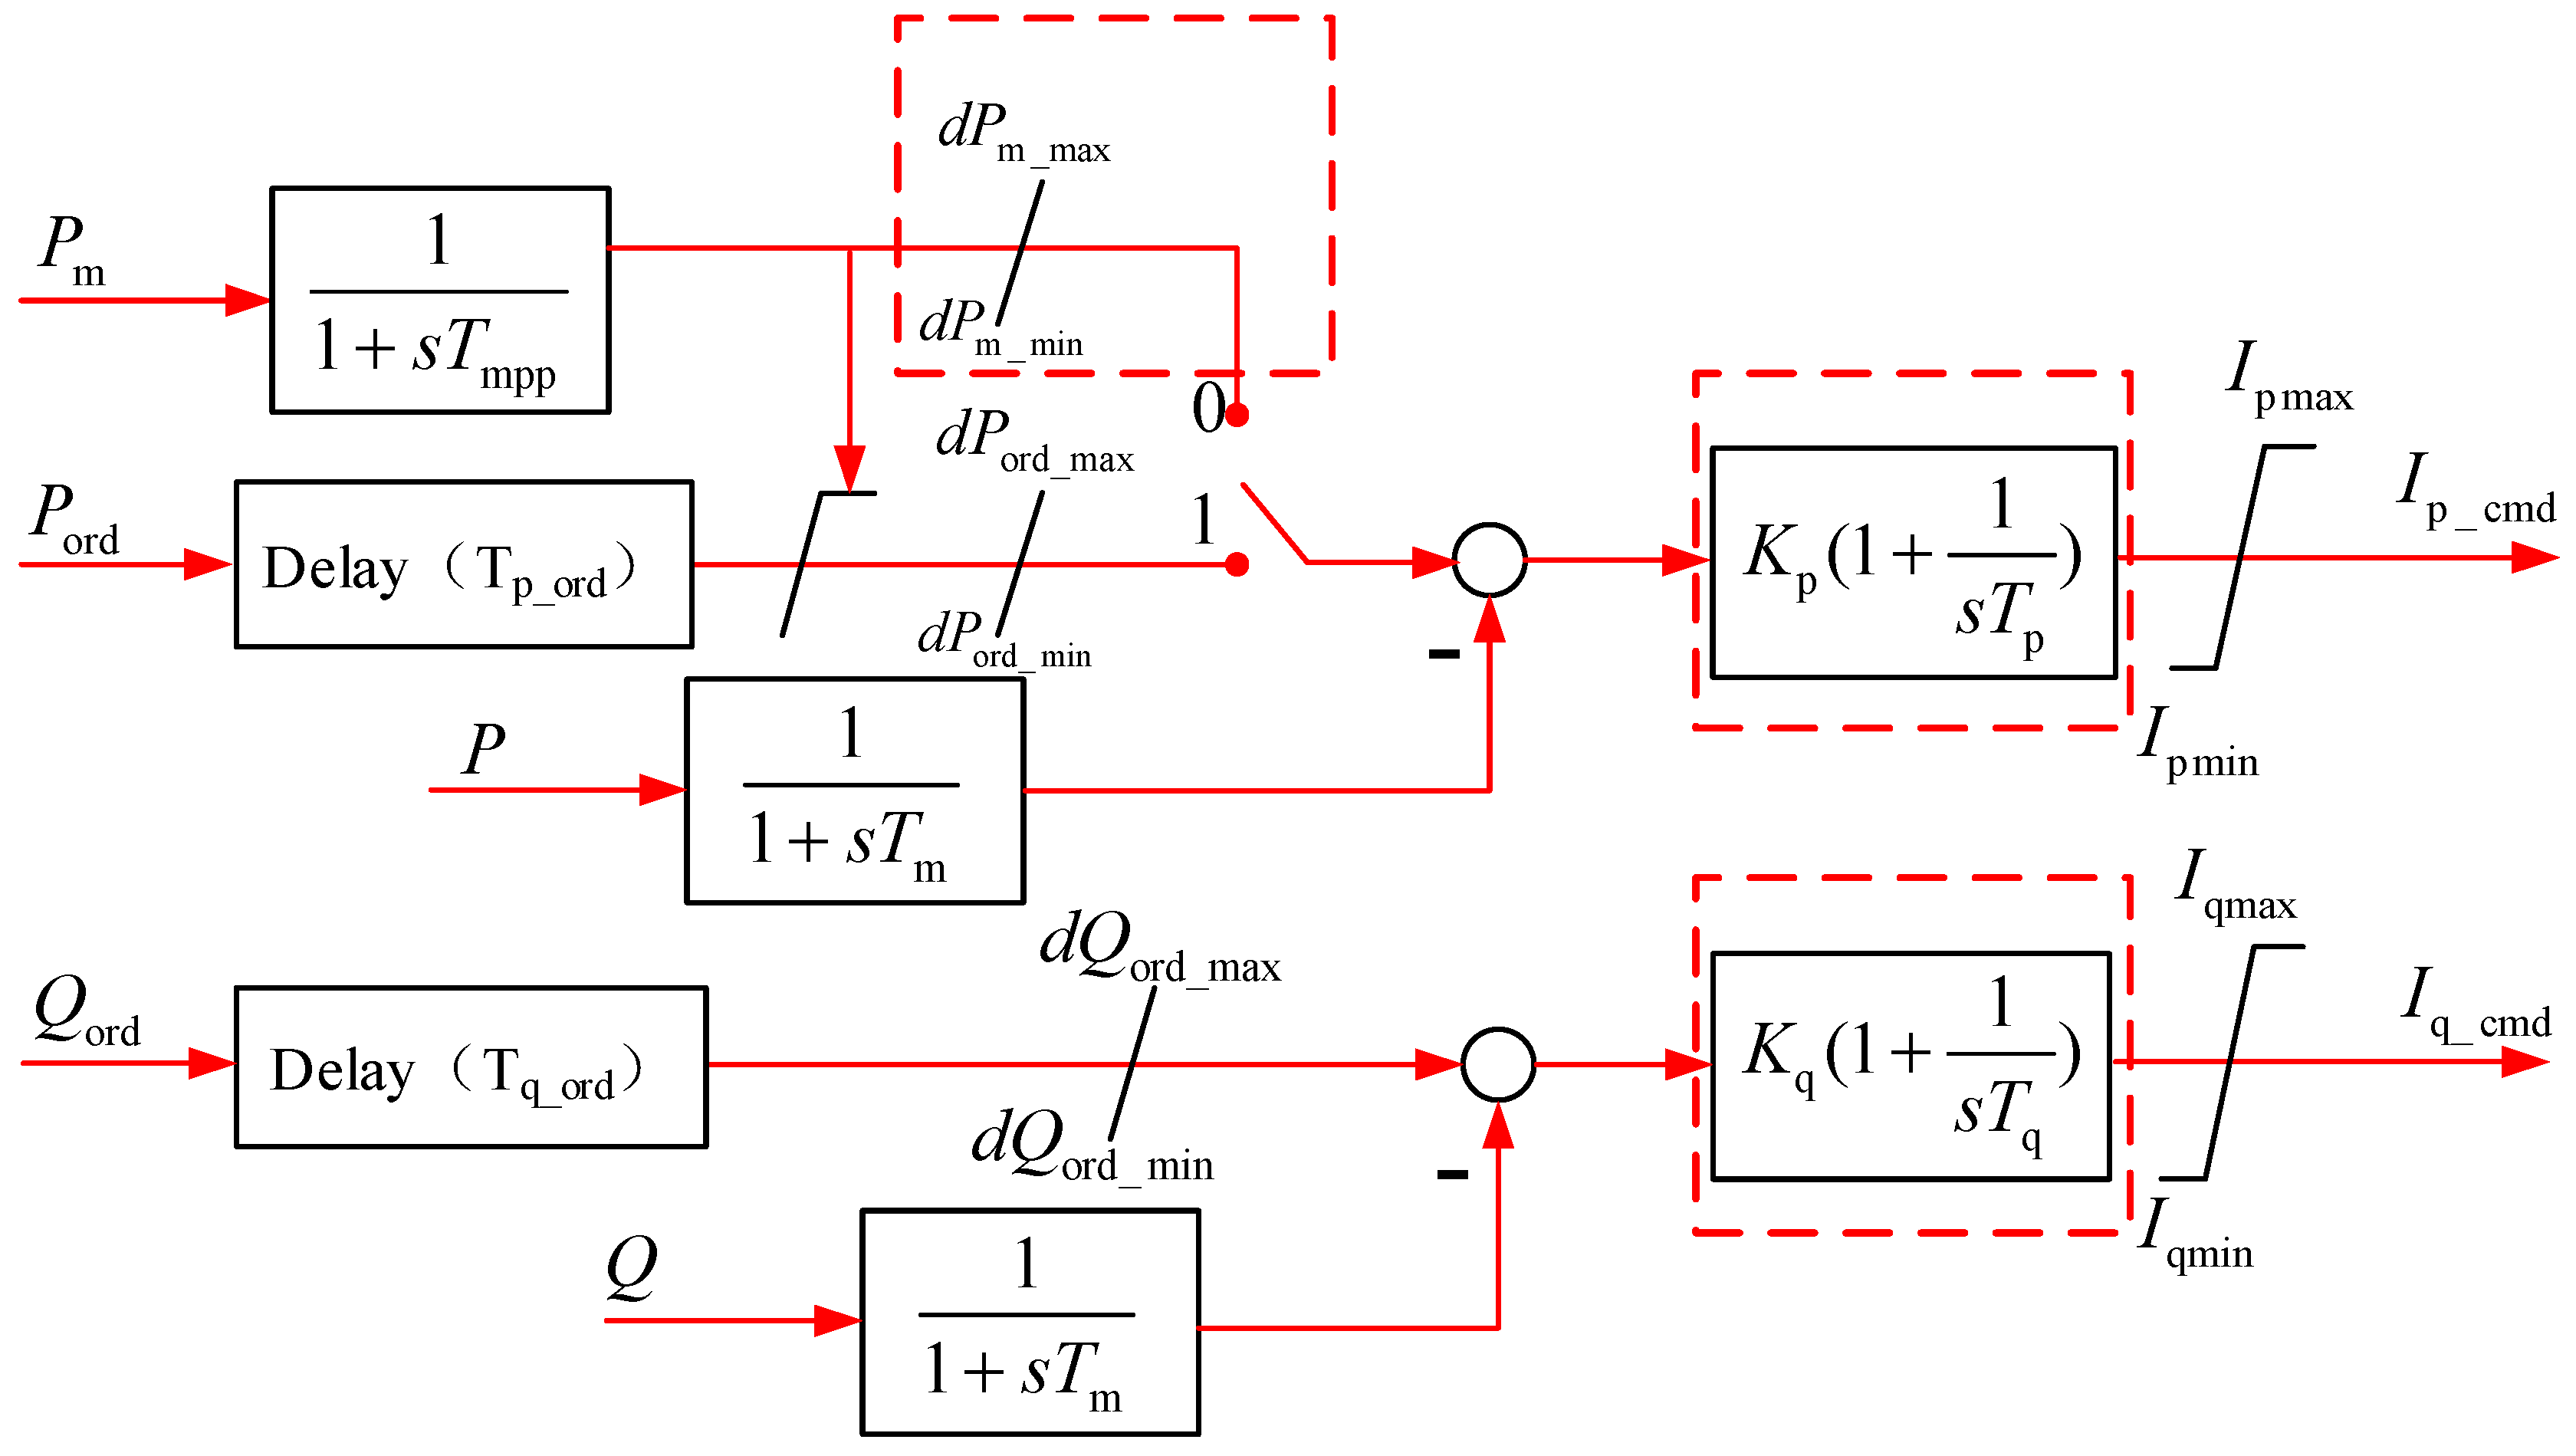
First, for the PV unit, the output of the photovoltaic cell is simulated by an equivalent DC source, and PV has both an MPPT operating mode and a constant power mode. The control structure of the PV unit is shown in Figure 1. The parameters that need identification include the maximum and minimum of power change rate when the PV unit works in MPPT mode and PI (Proportion Integration) parameters of active and reactive power control links. This is because in MPPT mode, a sudden change in the active power output may damage the converter, and a slow change may be harmful to the recovery of the system. The PI control parameters of active and reactive power control links directly affect the dynamic characteristics of PV unit. The parameters to be identified are shown in the red dashed box in Figure 1.
For the trajectory sensitivity analysis, a grid-connected PV system model is built on MATLAB/Simulink platform. The active power P and reactive power Q at the outlet of the PV unit are selected as the observation measurements, sensitivity analysis is done to Kp, Tp, Kq and Tq, all of which are parameters of the PI controllers of the PV unit in Figure 1 and need identification.
In Figure 1, is the general form of PI controller, where, Kp represents the ration coefficient, Tp represents the integral time constants. However, in the simulation model constructed in MATLAB, the form of PI control is , where Kip is used to describe the integral link, and the relationship between Kip and Tp is: Kip = Kp/Tp. Similarly, the relationship between Kiq and Tq is: Kiq = Kq/Tq. Due to the MATLAB platform, the trajectory sensitivity analysis given in Figures 3 and 5 adopts Kip and Kiq instead of Tp and Tq.
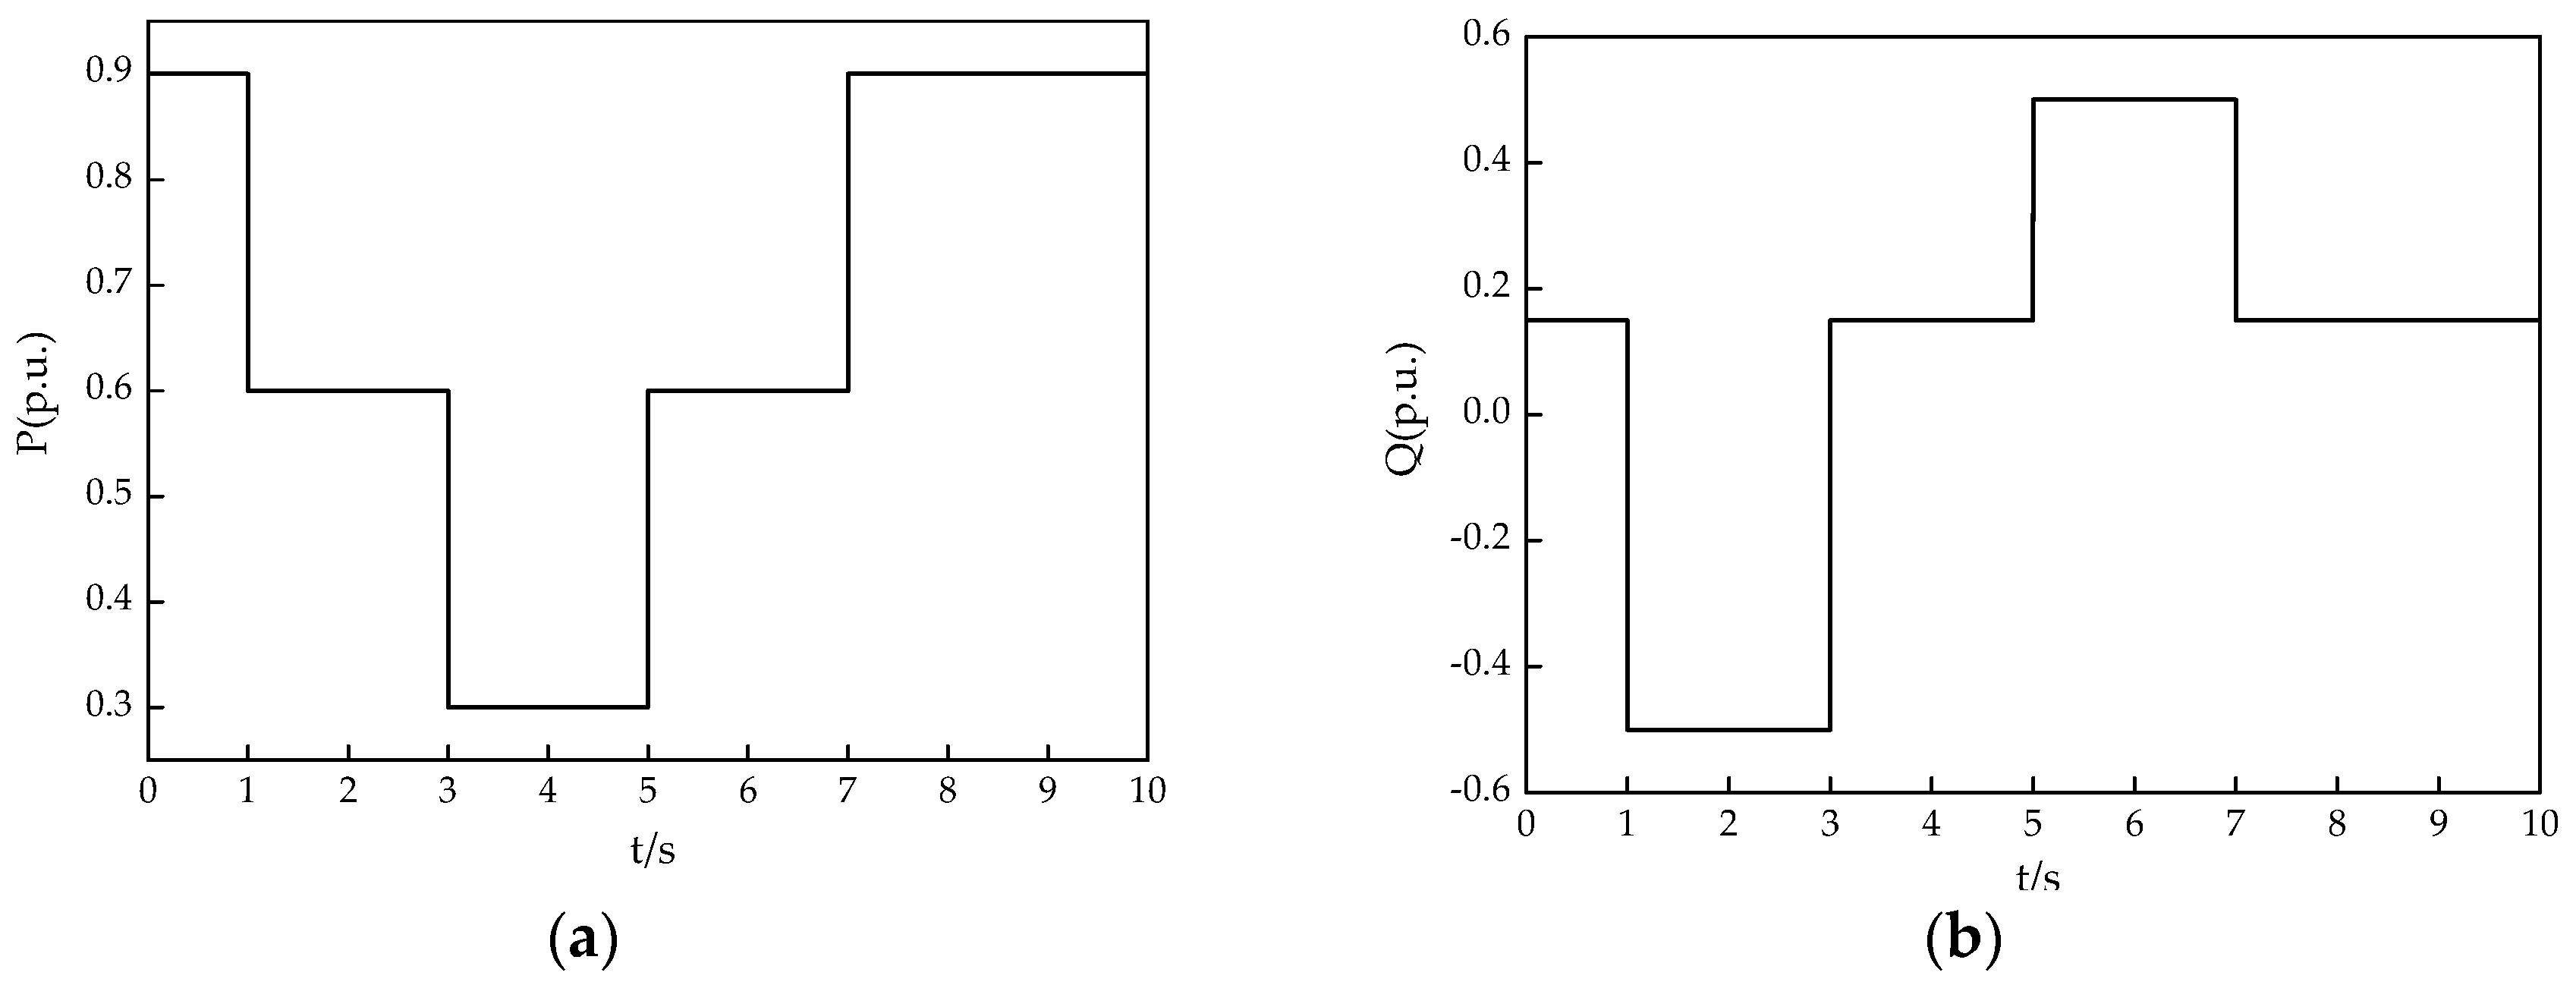
(1) Trajectory sensitivity when power reference value changes.
The reference values of the active power and reactive power of the converter are changed according to Figure 2a,b respectively. The trajectory sensitivity of the parameters to be identified is shown in Figure 3a,b.
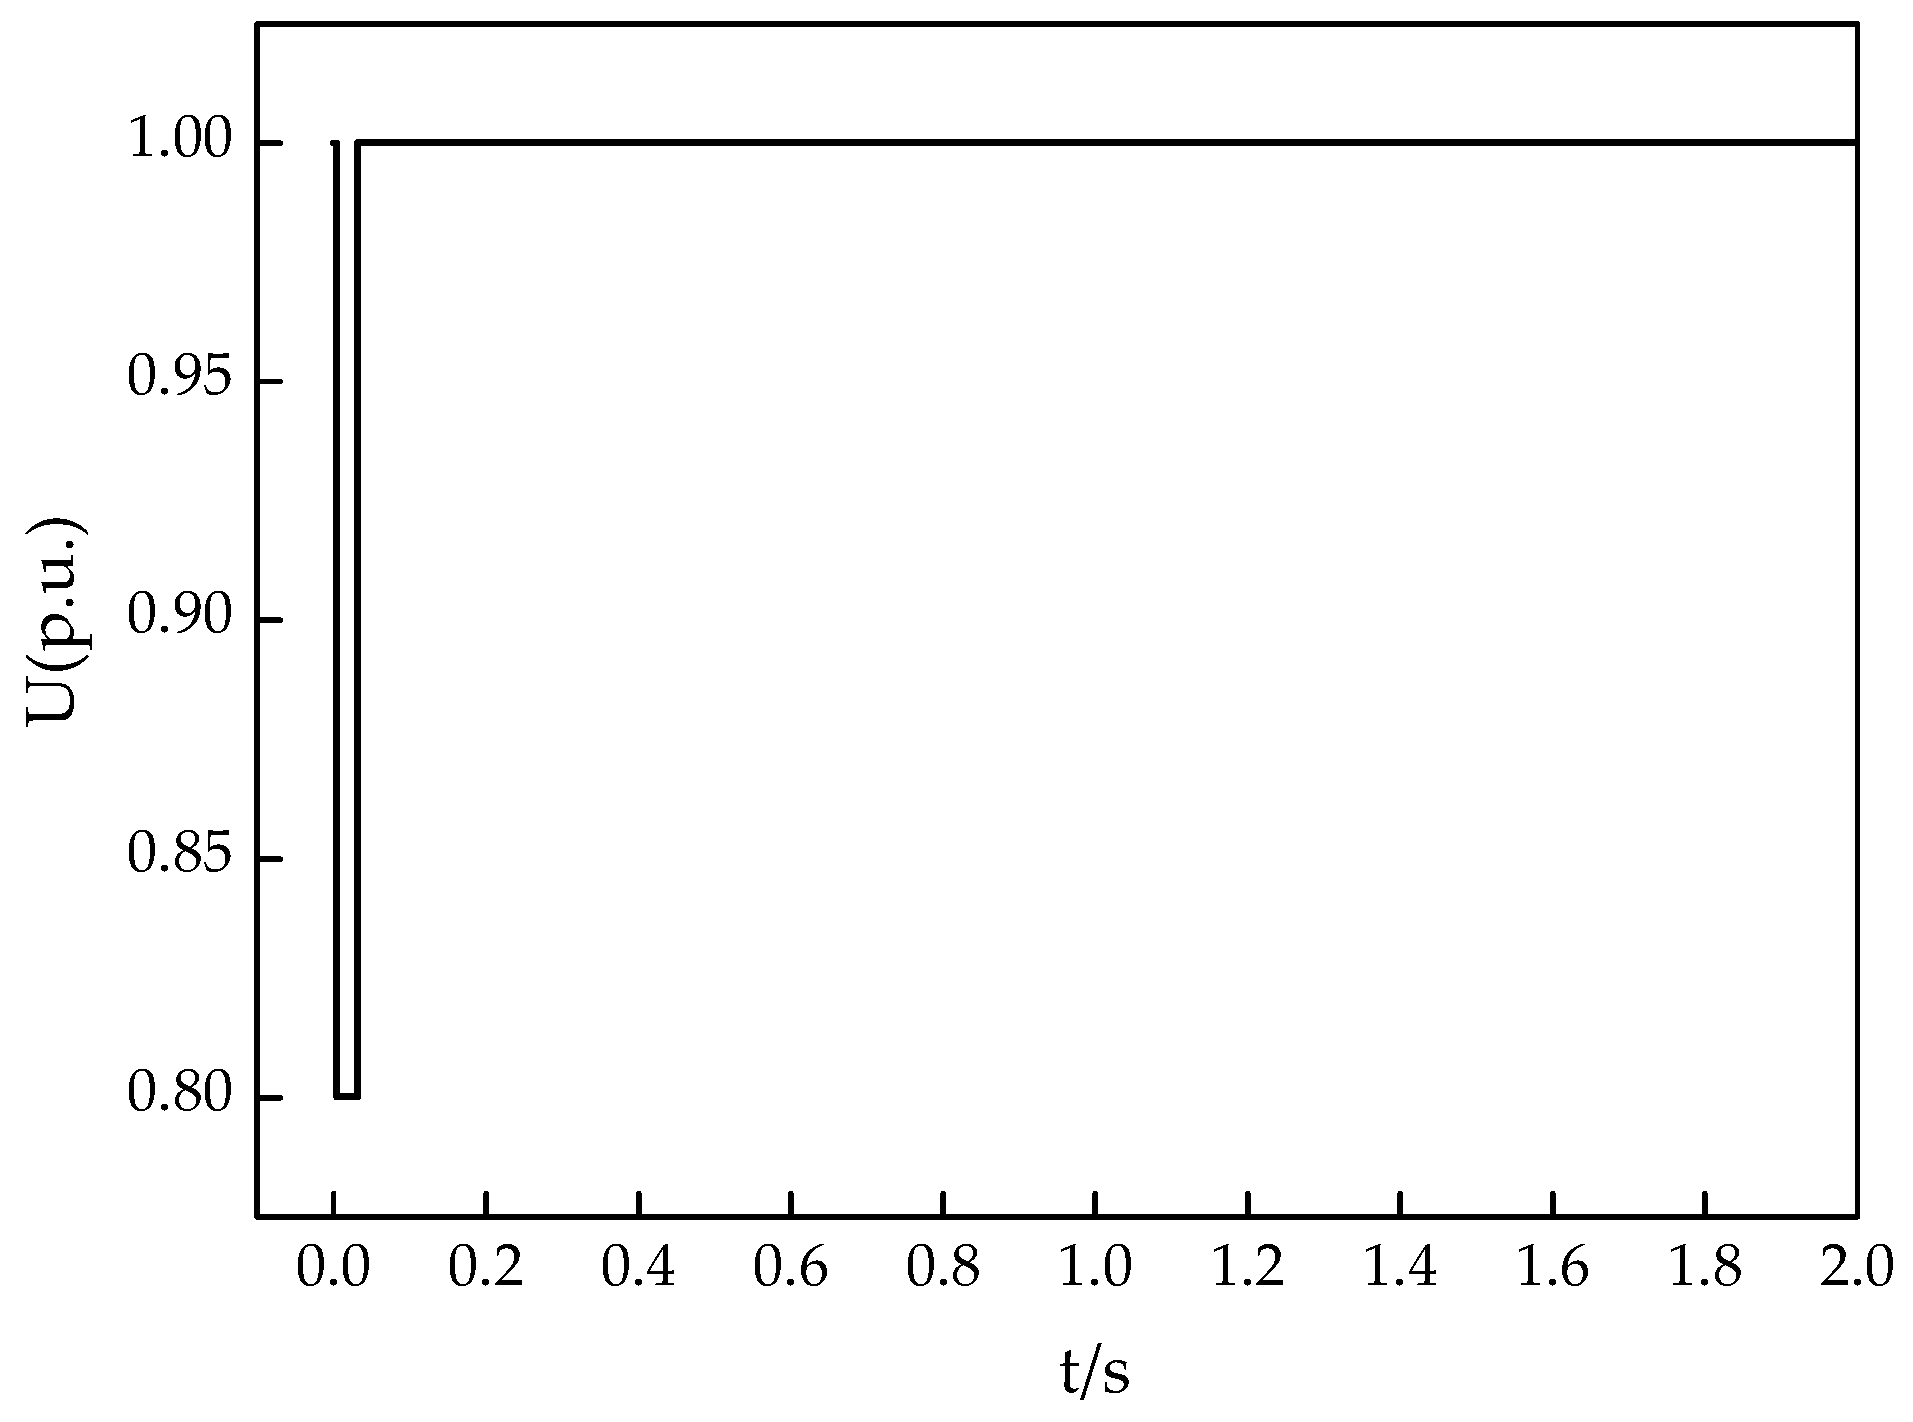
(2) Trajectory sensitivity in the case of short-circuit fault.
At the point of common coupling (PCC), a three-phase short-circuit fault occurs at t = 0 s, and the voltage drops to 0.8 p.u. At t = 0.15 s, the fault is cleared, and the system gradually resumes normal operation. The voltage (U) at PCC is shown in Figure 4. The trajectory sensitivity of the parameters to be identified is shown in Figure 5a,b.
The sensitivity analysis results show that, under the conditions of both reference value change and the short-circuit fault, active power is more sensitive to the parameters Kp and Tp, and reactive power is more sensitive to the parameters Kq and Tq. Therefore, with an appropriate data testing scheme, the dynamic data of the output power of the distributed generation unit under different working conditions can be collected to identify the required parameters.
(3) Sensitivity of upper and lower limits of power change rate.
The acquisition of the upper and lower limits of the power change rate does not require sensitivity analysis, but only needs to set the power change reference value in the actual test process and calculate the power change rate according to the test data.
(4) Sensitivity analysis of direct-drive wind turbine.
For direct-drive wind turbine, the machine-side variables and the grid-side variables are decoupled by the DC link. Only the PI control parameters of DC voltage and reactive power control link of the grid side converter directly affect its dynamic characteristics. Therefore, the machine-side part is replaced by an equivalent DC source, and the control structure is shown in Figure 6. The parameters that need identification include PI parameters of the DC voltage control link and the reactive power control link. The parameters to be identified are shown in the red dashed box in Figure 6.
Adopting the sensitivity analysis method used in the PV unit, the sensitivity analysis is undertaken for the direct-drive wind turbine. The results show that the DC voltage of the direct-drive wind turbine is more sensitive to the parameters Kp and Tp, and the reactive power is more sensitive to the parameters Kq and Tq.
(5) Sensitivity analysis of energy storage unit.
For the energy storage unit, the output of the energy storage battery is also simulated by an equivalent DC source, of which the control structure is shown in Figure 7. In the grid-connected mode of a microgrid, the energy storage unit works in power control mode, and normally the Q command is 0. Therefore, the parameters that need identification include the upper and lower limits of the active power control slope and the PI control parameters of the active and reactive power control links. The parameters to be identified are shown in the red dashed box in Figure 7.
Adopting the sensitivity analysis method used in the PV unit, the sensitivity analysis is undertaken for the energy storage unit. The result show that the active power of the energy storage unit is more sensitive to the parameters Kp and Tp, and the reactive power is more sensitive to the parameters Kq and Tq.
2.2.2. Test Scheme
The sensitivity analysis gives the correlation between system parameters and system external characteristics and helps to determine the observation measurements for parameter identification. According to the sensitivity analysis in the previous section, the test scheme was designed, as shown in Table 1.
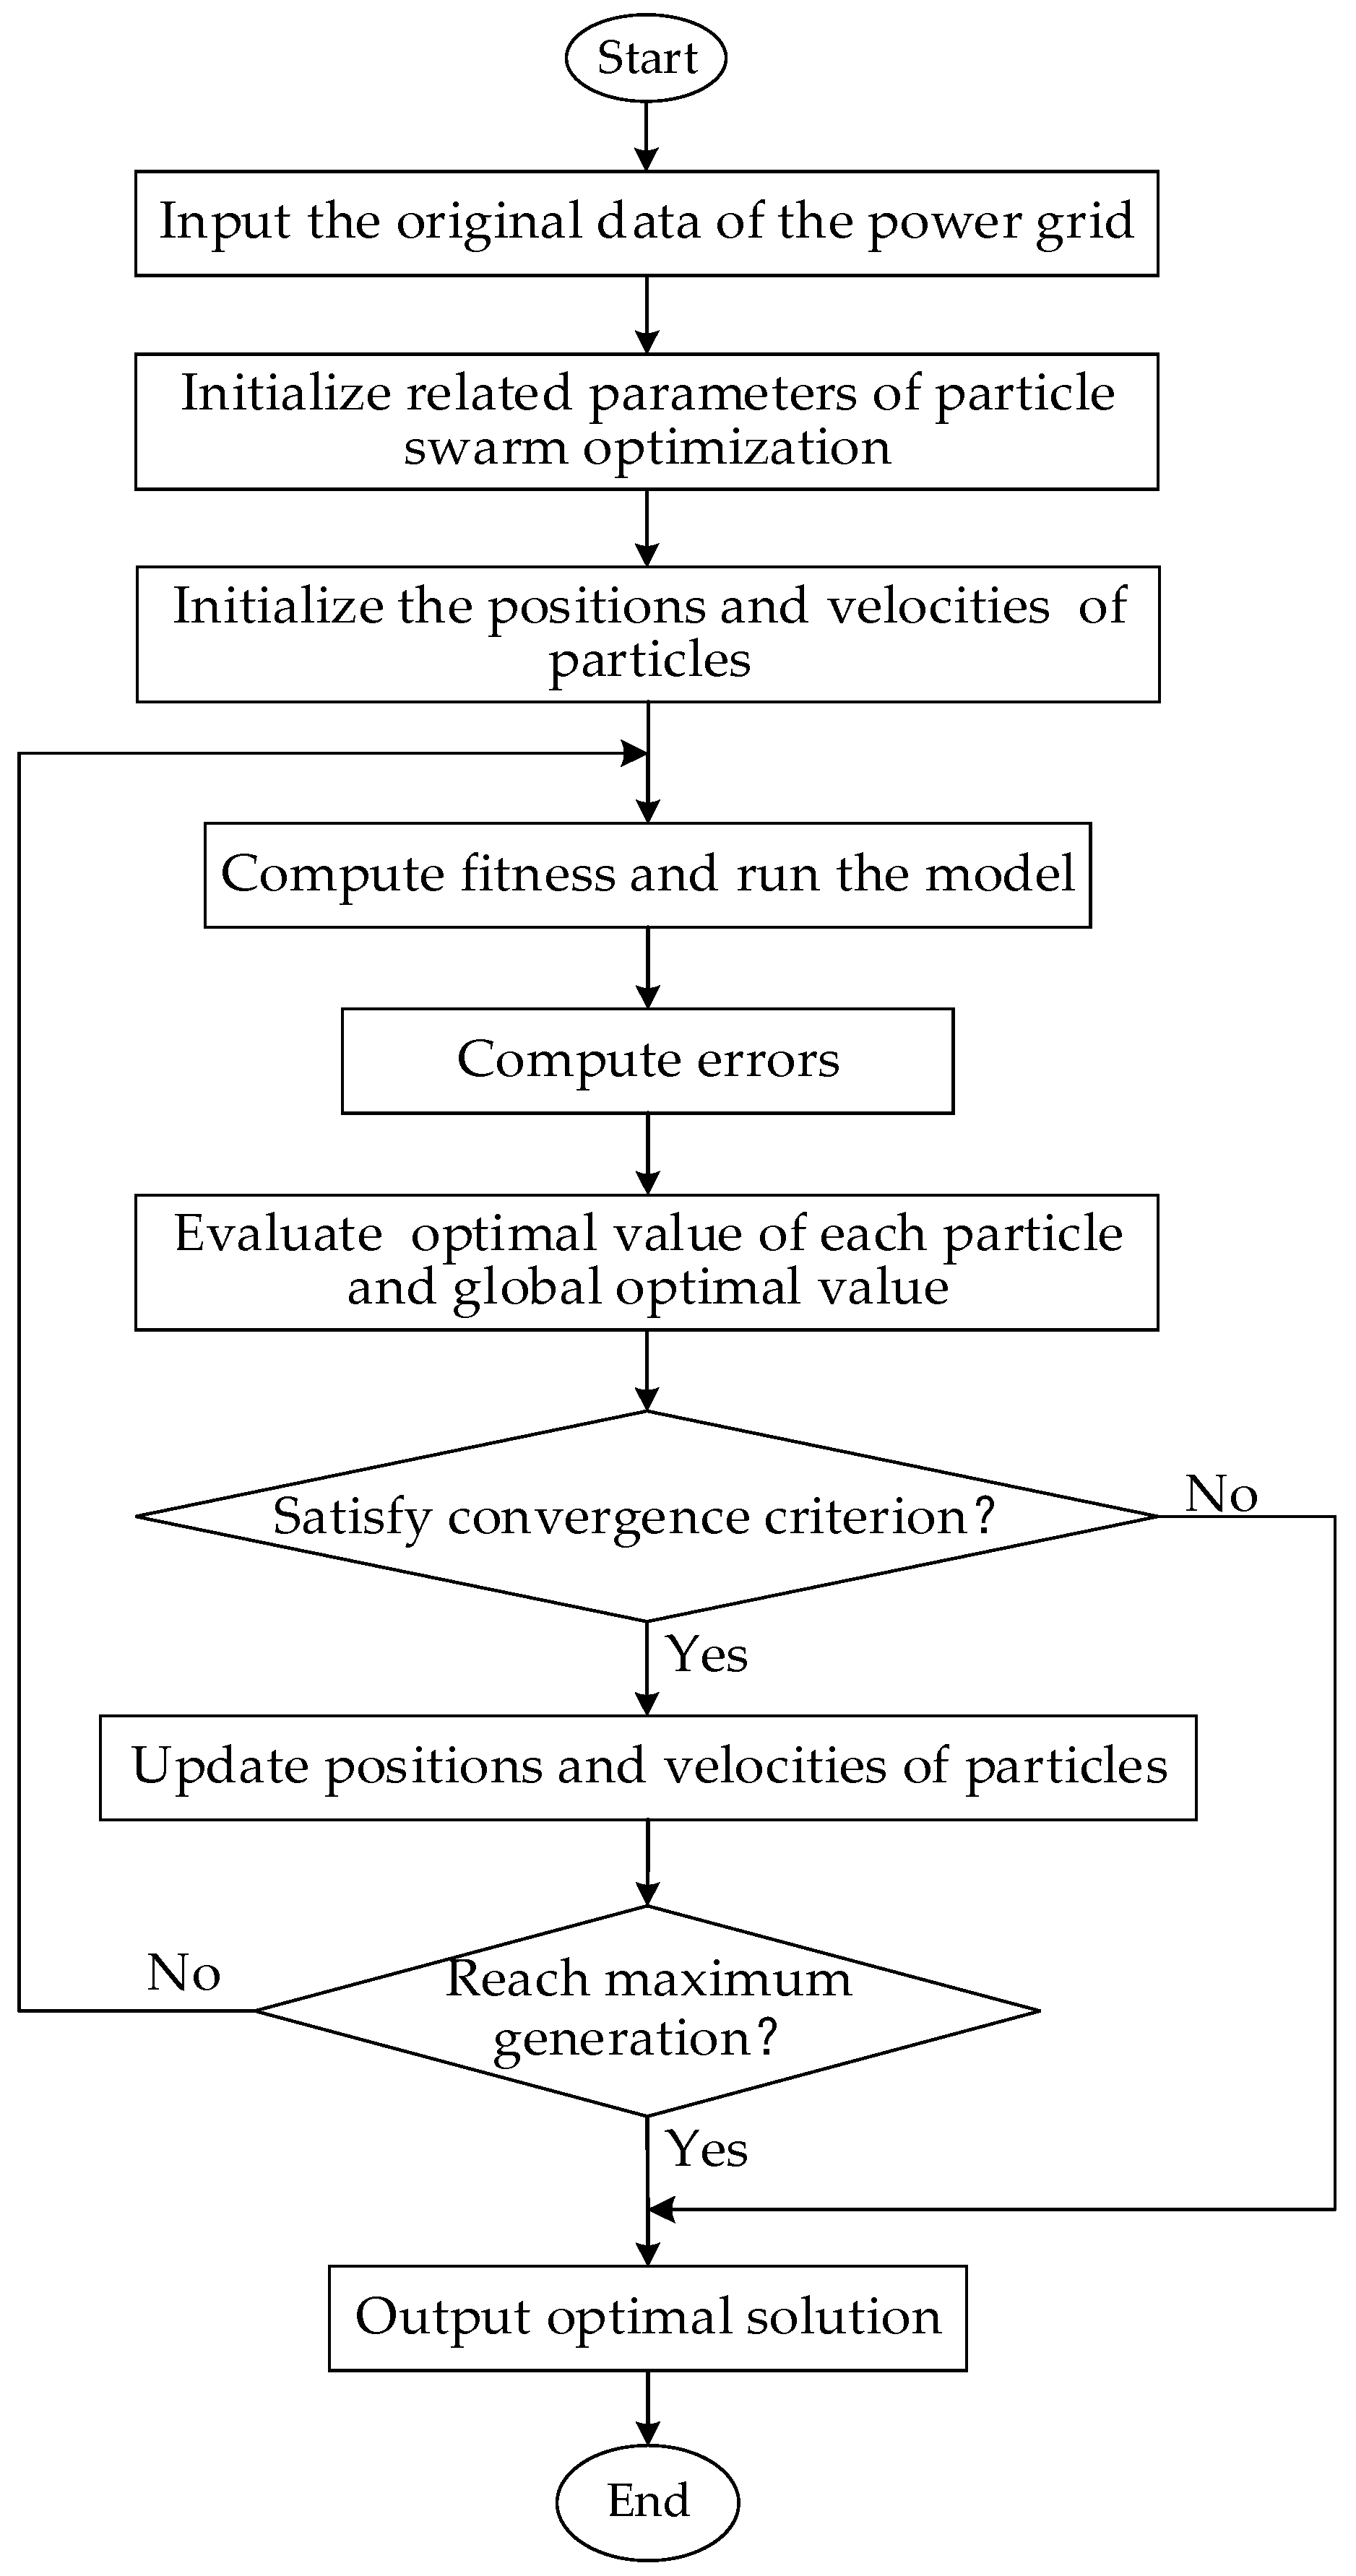
2.3. Parameter Identification Steps Based on Particle Swarm Optimization Algorithm
2.4. Error Indicator
According to the China Recommended Standard GB/T 32892-2016 “photovoltaic power generation system model and parameter testing procedures”, the maximum deviation between the simulation data and the test data during the steady-state interval is adopted to assess the accuracy of the model. The expression is as follows:
where is the standard value of the electrical quantity in the simulation data; is the standard value of the electrical quantity in the test data; and are the first and last serial numbers of the test data in the error calculation interval.
3. Example Analysis
3.1. Basic Information and Selection of Test Points
The modeling and test work are carried out on the wind/PV/storage microgrid demonstration system established by the Electric Power Research Institute of State Grid Jiangsu Electric power corporation. The system is a microgrid infrastructure platform which includes a distributed wind/PV/storage unit, i.e., one 30 kW horizontal axis direct-drive wind turbine, one 5 kW rotor wing direct-drive wind turbine, one 5 kW H airfoil direct-drive wind turbine, one 30 kW fixed polycrystalline PV unit and one 75 kWh lithium battery energy storage unit. The detailed parameters of the microgrid example system are shown in Appendix A.
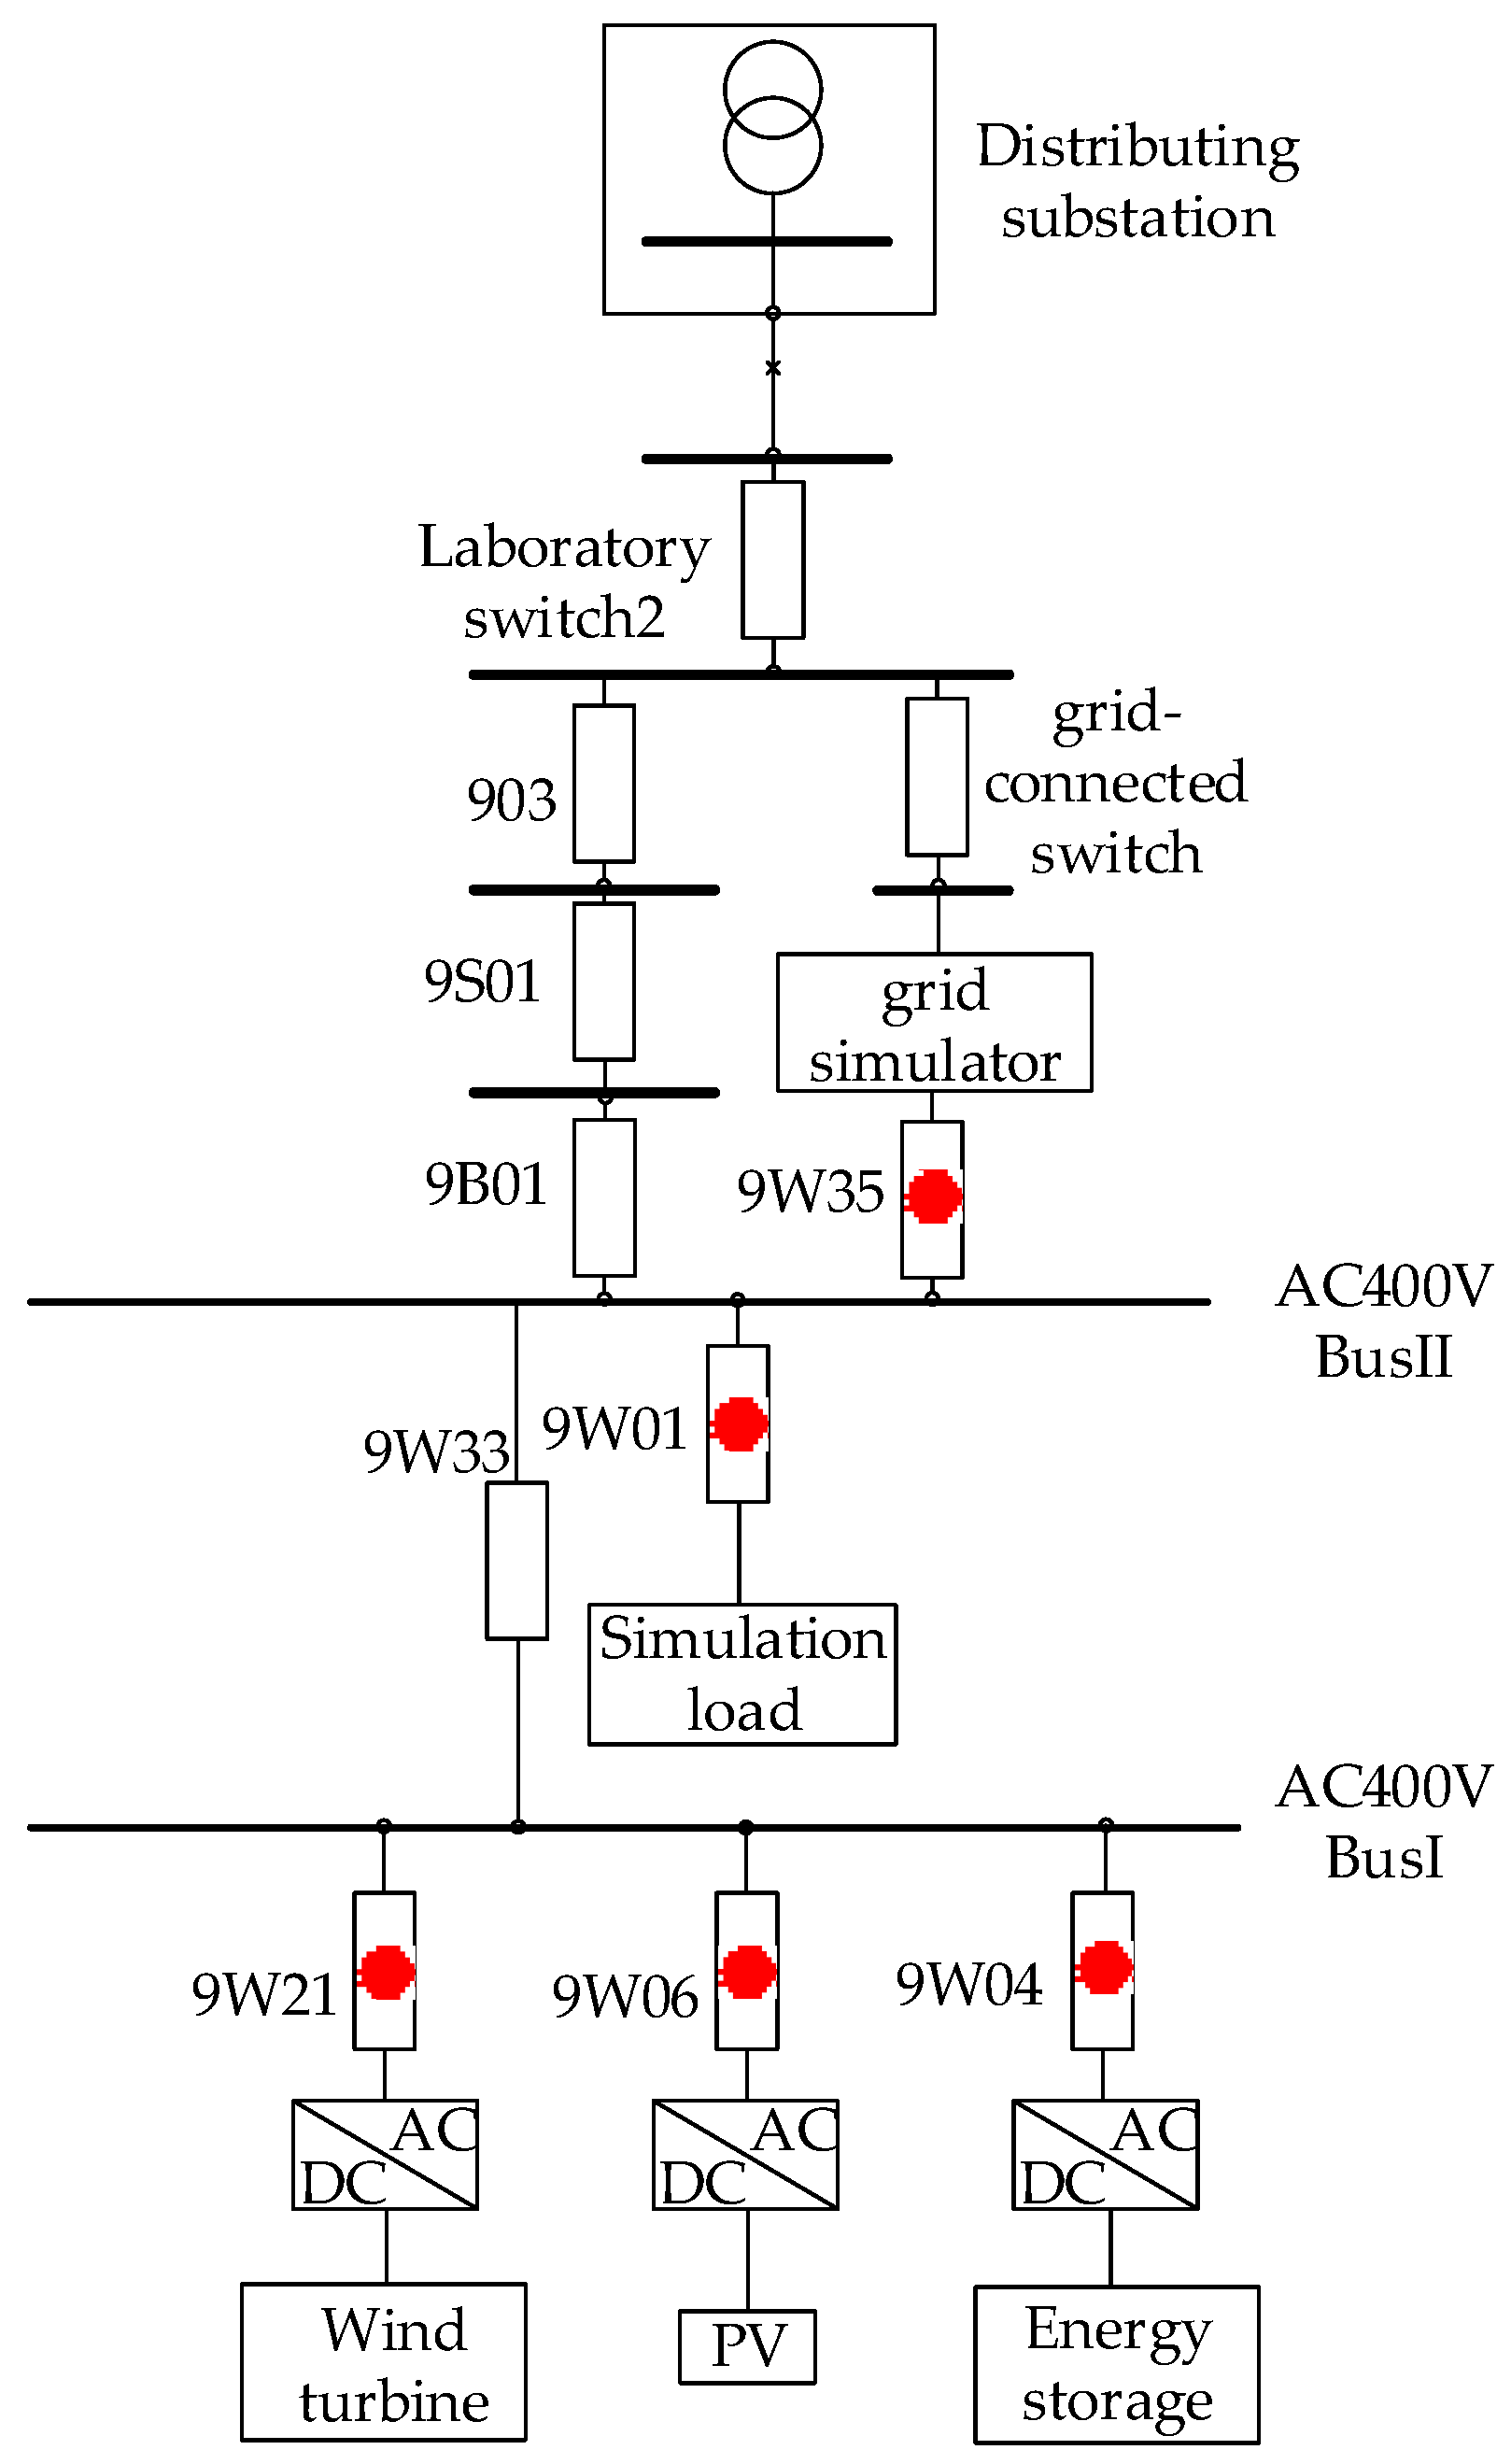
The wind turbines, PV power unit and energy storage unit of the microgrid are connected in parallel to a 0.4 kV bus, which connects to a 10 kV distribution network for power exchange with the main grid.
The test points are selected according to the sensitivity and test scheme determined in Table 1. The test basis is as follows: GB/T 32826-2016 “photovoltaic power generation system modeling guide”, GB/T 32892-2016 “photovoltaic power generation system model and parameter test regulation”, and GB/T 34133-2017 “energy storage converter test technical regulation”.
The test points of the microgrid in the example are shown in Figure 9. The test equipment connection points are shown in red. A total of four test points are used to test the voltage and current of the PV unit, wind turbines, energy storage unit as well as the grid-connection terminal respectively.
3.2. Effectiveness Analysis of the Microgrid Model
3.2.1. Parameter Identification Result
3.2.2. Validity Analysis of the Microgrid Model
The microgrid has two modes: Grid-connected mode and island mode. In the normal operation of the main power grid, the microgrid works in the grid-connected mode. If a fault occurs in the main power grid, the relay protection device of the power system acts, and the connection between the microgrid and the main power grid is disconnected. The microgrid enters the island operating state. During the microgrid grid-connection/island switching process, frequency and voltage fluctuations of the distribution network and the microgrid may occur.
In order to verify the accuracy of the overall model of the microgrid, the grid-connection/island switching tests and simulation analysis were carried out. The test data and the simulation data were compared to verify the validity of the parameter identification results. The test cases and test points are shown in Table 3.
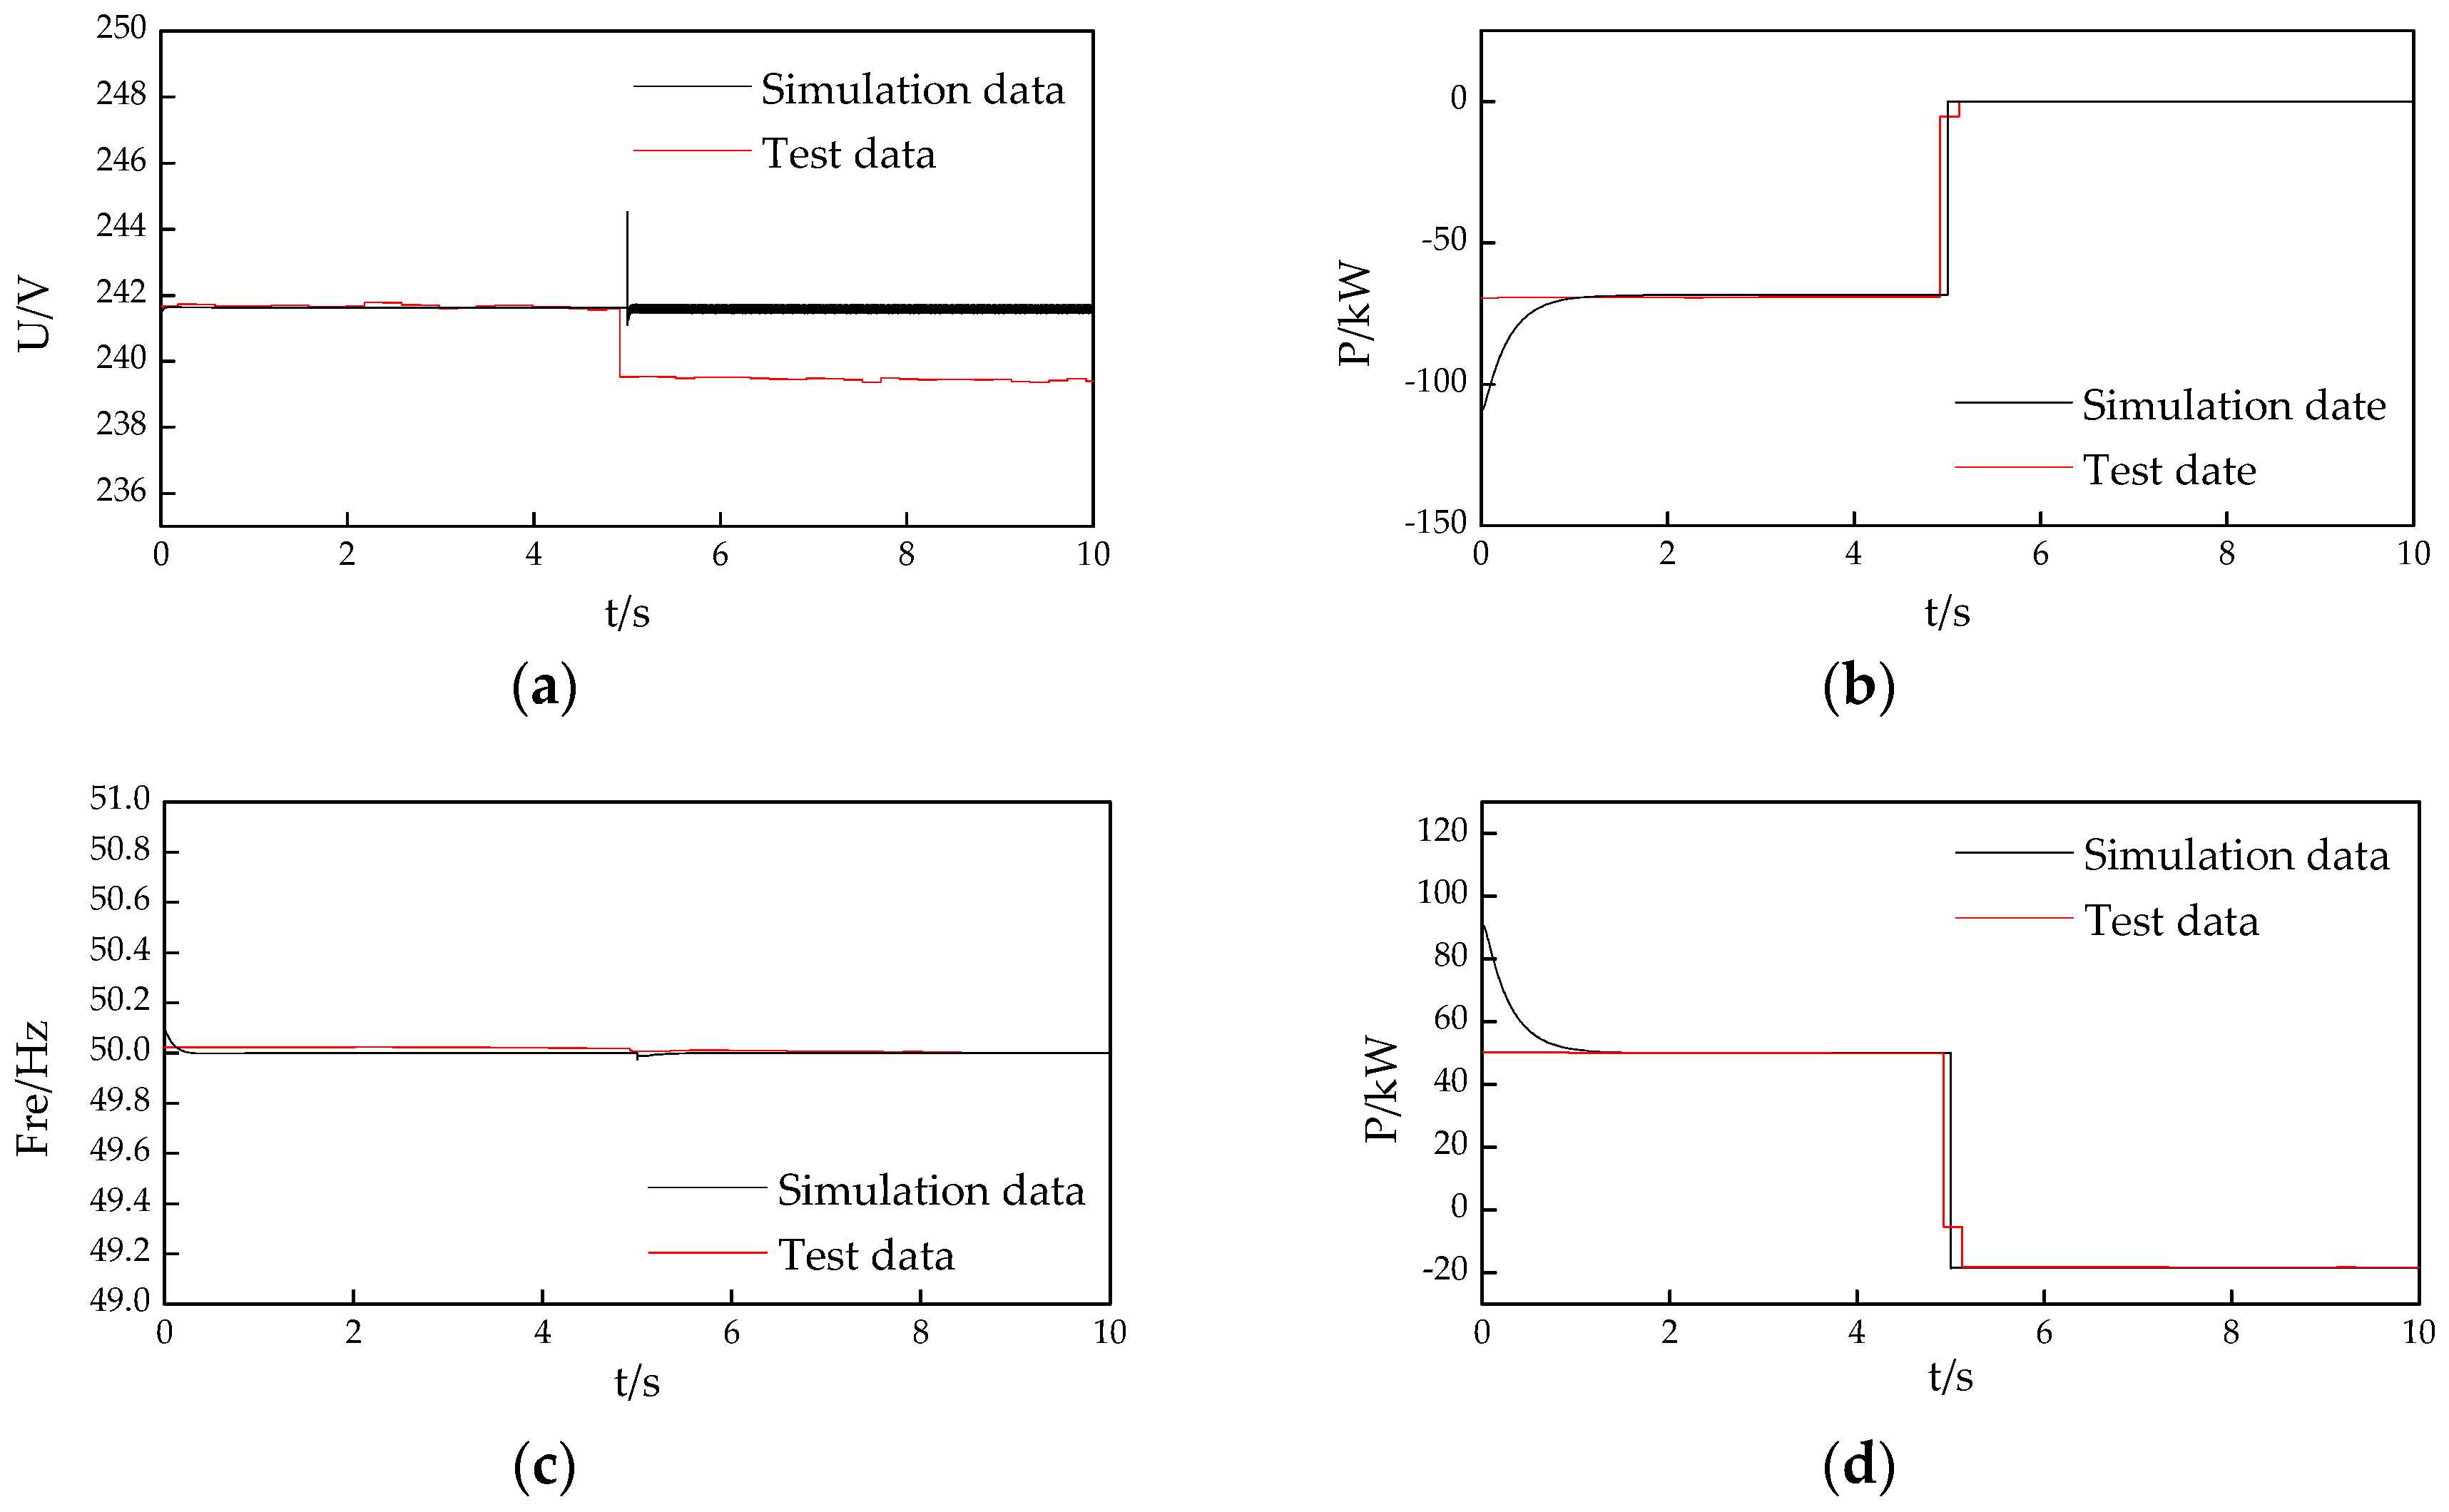
Case 1: Normally, the microgrid works in grid-connected mode, the power supplied by the PV unit is 20 kW, energy storage unit supplies 50 kW. Then, at t = 10 s, the microgrid is switched to island mode from grid-connected mode. The comparison of the simulation results and the test data are shown in Figure 10. The errors are shown in Table 4, the fulfillment of the results is obtained according to GB/T 32892-2016 “photovoltaic power generation system model and parameter test regulation”. The data includes: The voltage, active power and reactive power at PCC, the active power supplied by the energy storage unit and the PV unit respectively.
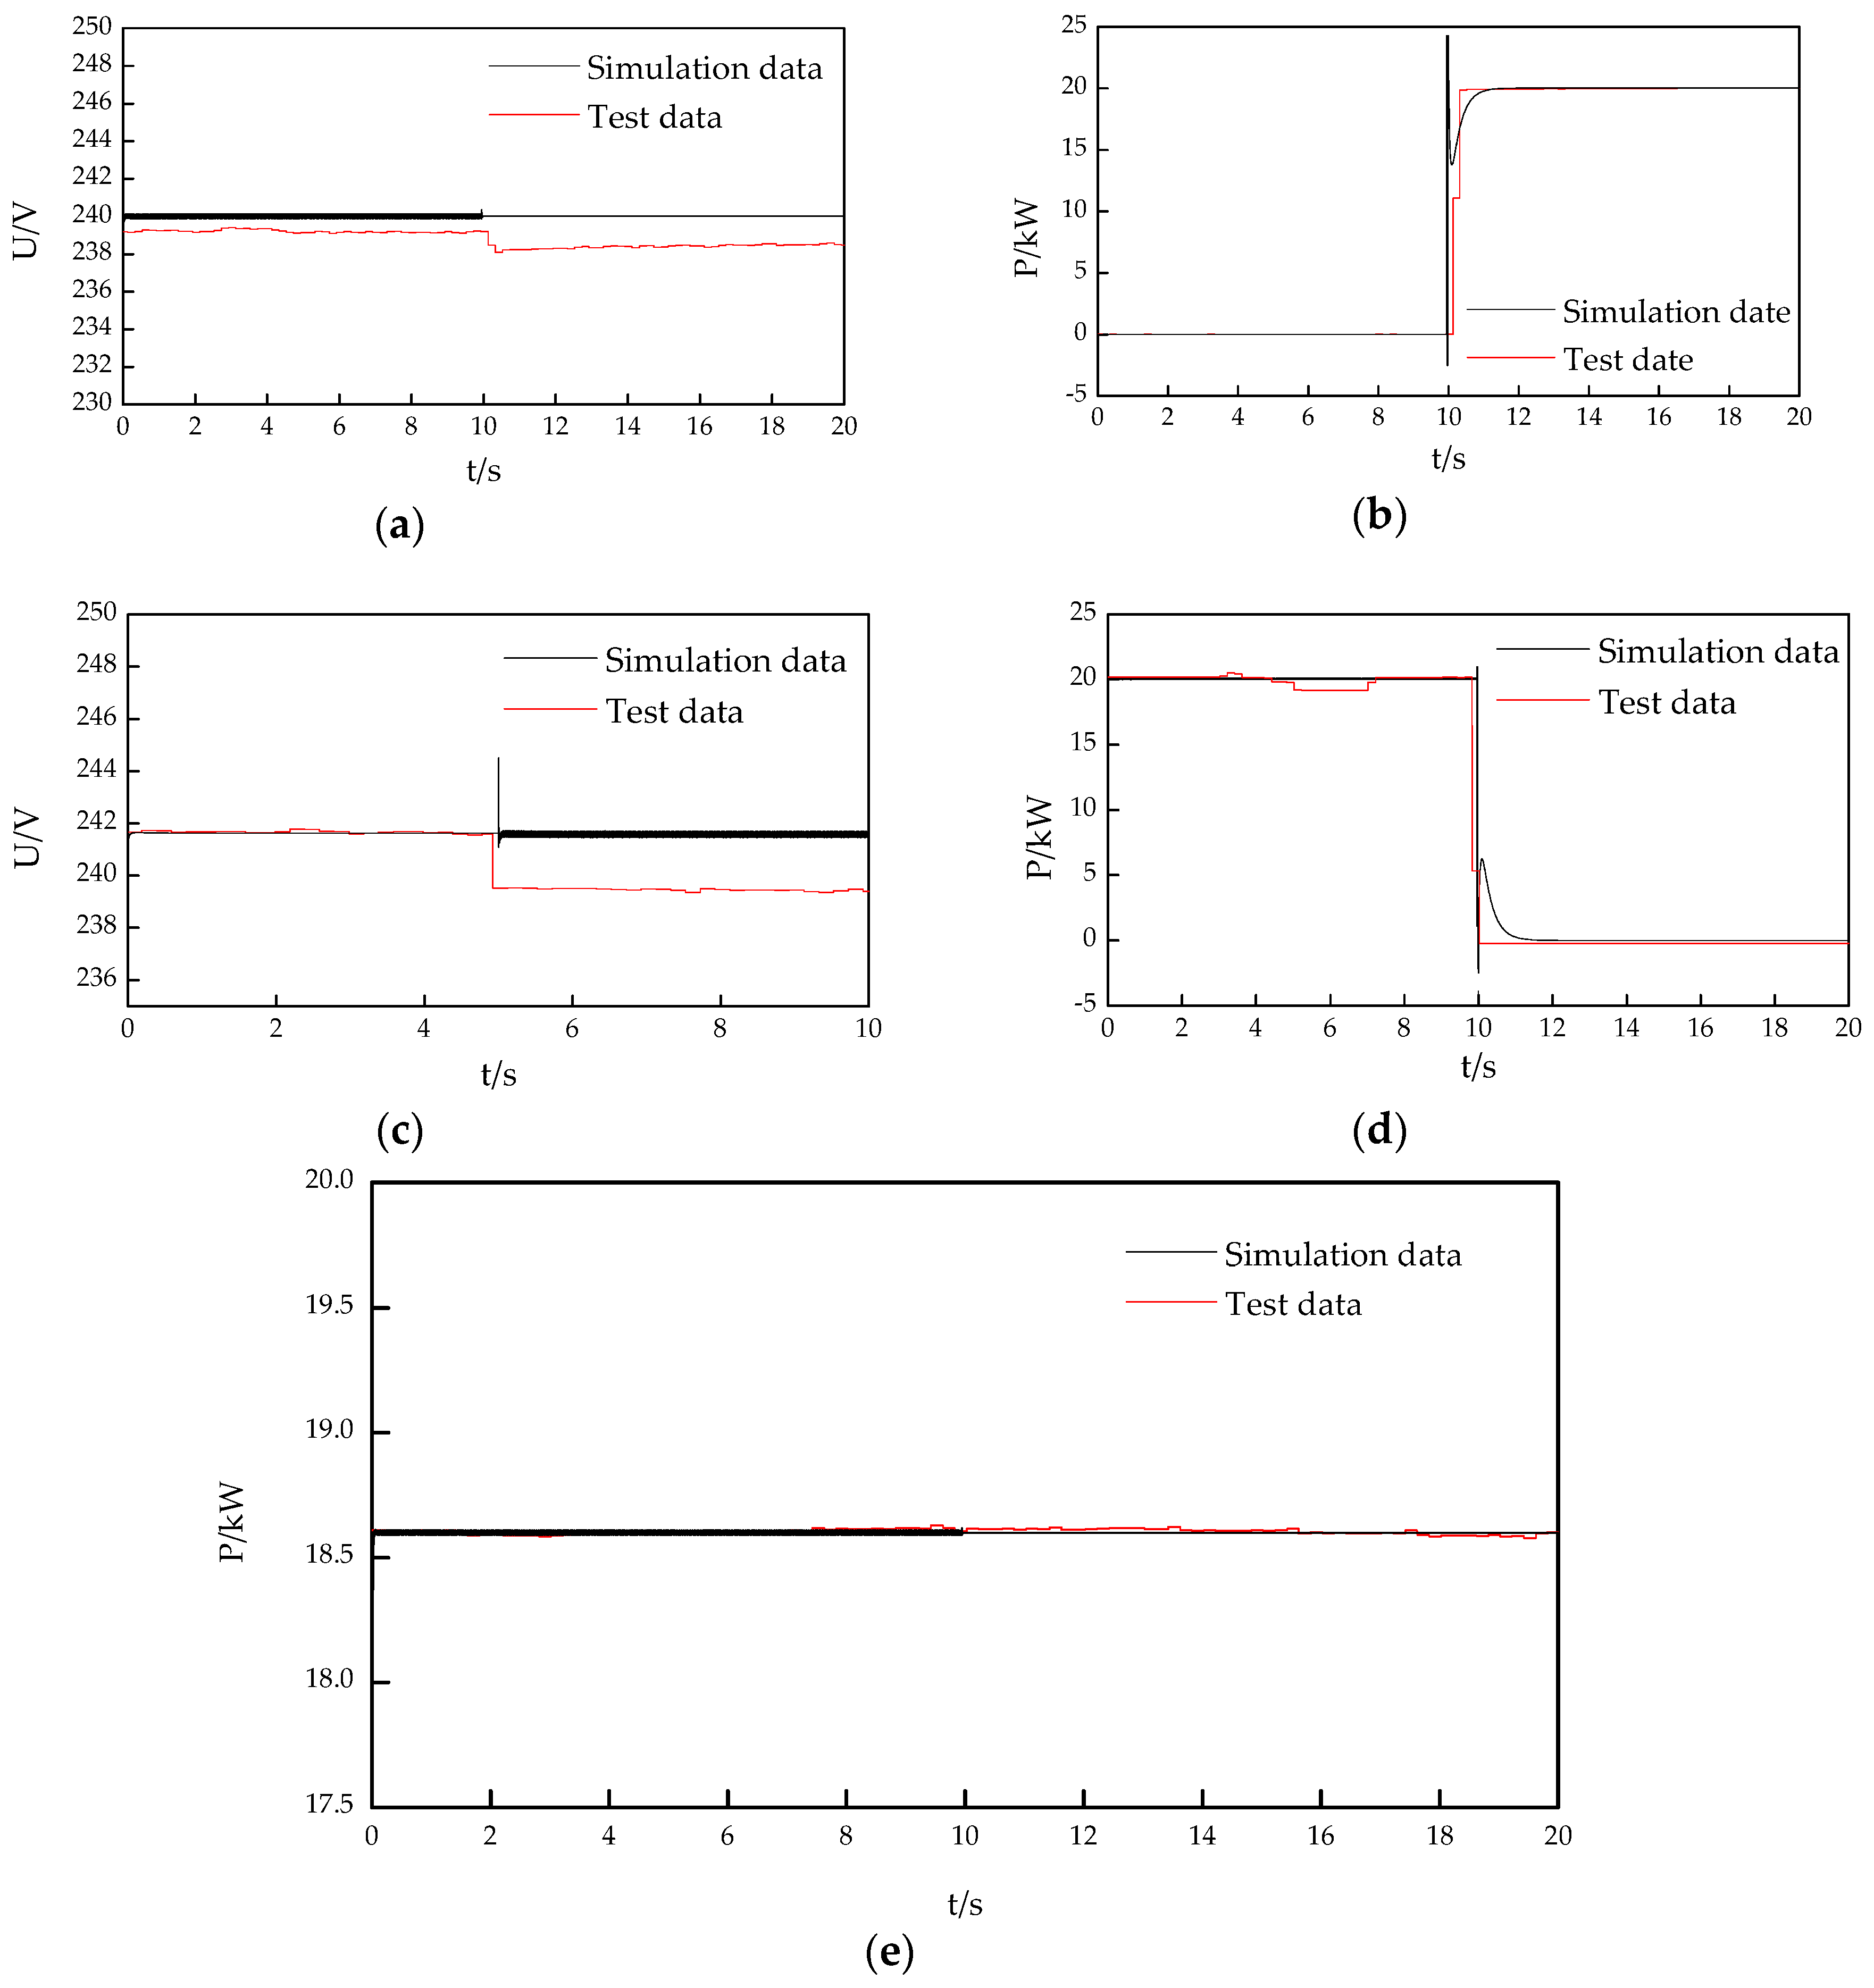
Case 2: Normally, the microgrid works in island mode, the frequency and voltage are controlled by the energy storage unit. The frequency is 50 Hz. The power supplied by the PV unit is 20 kW, and the load is 32 kW. Then, at t = 2.2 s, the microgrid is switched to grid-connected mode from island mode. The comparison of the simulation results and the test data are shown in Figure 11. The errors are shown in Table 5.
3.3. Summary
According to the simulation results, the frequency and voltage are within normal limits during the transient process of grid-connection/island switching. In addition, the simulation model meets the grid guide in terms of error indicators, which provides a reasonable model for the analysis of the overall operating characteristics of the microgrid, and thus help guarantee the stable operation of the microgrid and its practical application in China.
4. Conclusions
In view of the influence of manufacturers, models, and other factors on the accuracy of parameters in microgrid modeling, this paper proposes an accurate modeling method for microgrids, which provides a model basis for the analysis of the overall characteristics of a microgrid and may help popularize the application of microgrids. The conclusions obtained in this paper and issues that require further study include:
- (1)
- The key to accurate modeling of microgrids is that the actual data used for parameter identification are consistent with the actual system operating conditions. Based on the results of the parameter sensitivity analysis, the paper designed a data test scheme to ensure the validity of the data used in the parameter identification.
- (2)
- Taking the microgrid demonstration system in China as an example, the important parameters of the PV, wind turbine, and energy storage unit in the system were obtained, and the accuracy of the model was verified through the comparison of the simulation data and the test data during the grid-connection/island switching process. Therefore, it can be concluded that the modeling method proposed in this paper is effective.
- (3)
- The general model of renewable power generation units were adopted in the paper. When studying the special control structure of the microgrid, the corresponding test scheme and algorithm need to be further improved.
- (4)
- In the microgrid control system, the current parameter identification focuses on the parameters in power and frequency control. Future studies should pay more attention to the increasing demand of low voltage ride through controls of the microgrid.
- (5)
- The workload of parameter identification based on test data is large. When the number of microgrids increases, the workload increases exponentially. It is necessary to develop specialized and commercial software to improve the efficiency of microgrid parameter identification and modeling.
Author Contributions
This paper was a collaborative effort between the authors. The authors contributed collectively to the collation and review of literatures.
Acknowledgments
This paper is based on the China National Key Research and Development Plan “Smart Grid and Equipment” (2016YFB0900600) and Project Supported by Science and Technology Foundation of State Grid Corporation of China (52110417000F).
Conflicts of Interest
The authors declare no conflict of interest.
Appendix A

Table A1.
Basic information of the microgrid of Electric Power Research Institute of State Grid Jiangsu Electric power corporation.
Table A1.
Basic information of the microgrid of Electric Power Research Institute of State Grid Jiangsu Electric power corporation.
| Microgrid Composition | Technical Parameter | |||
|---|---|---|---|---|
| Wind Turbine | Horizontal Axis Wind Turbine 30 kW | Manufacturer | Shanghai Ghrepower Green Energy Co., Ltd. | |
| Type/Quantity | GNW36k3G/1 set | |||
| Rated Power | 36 kW | |||
| Rated Voltage | 380 V ± 15% | |||
| Rotor-Type Wind Turbine 5 kW | Manufacturer | Shanghai Linfeng Wind Energy Technology Co., Ltd. | ||
| Type/Quantity | 1 set | |||
| Rated Power | 5 kW | |||
| Rated Voltage | 380 V | |||
| H-Type Vertical Axis Wind Turbine 5 kW | Manufacturer | Shanghai Linfeng Wind Energy Science and Technology Co., Ltd. | ||
| Type/Quantity | P5000-AB/1 set | |||
| Rated Power | 5 kW | |||
| Rated Voltage | 380 V | |||
| Photovoltaic Inverter | Manufacturer | Sungrow Power Supply Co., Ltd. | ||
| Type/Quantity | SG30K3/1 set | |||
| Rated Power | 30 kW | |||
| Rated Voltage | 380 V | |||
| Energy Storage Converter | Manufacturer | Jiangsu Fangcheng Electric Science and Technology Co., Ltd. | ||
| Type/Quantity | 1 set | |||
| Rated Power | 500 kW | |||
| Rated Voltage | 380 V | |||
| Information about the connection to the power network | The voltage level of access point | 10 kV | ||
| Power supply distance of the grid | / | |||
| The location of point of common coupling | Distributed microgrid base platform 10 kV power distribution room | |||
| Short circuit capacity | Positive sequence short circuit capacity of bus three-phase short circuit in maximum operation mode 289 MVA | |||
| Whether there is a step-up transformer or not | ☑Yes | □ No | ||
| Quantity: 1 | Capacity per unit: 500 kVA | |||
References
- Han, P.P.; Lin, Z.H.; Wang, L.; Fan, G.J.; Zhang, X.A. A Survey on Equivalence Modeling for Large-Scale Photovoltaic Power Plants. Energies 2018, 11, 1463. [Google Scholar] [CrossRef]
- Xu, S. Modeling and Simulation of Hybrid AC and DC Power System Considering Multiple Distributed Energy Sources. Modern Electr. Power 2017, 35, 32–38. [Google Scholar]
- Liu, C.; Shi, W. Comparison of China’s Wind Power Integration Standard with Similar Foreign Standards. Smart Grid 2014, 2, 48–51. [Google Scholar]
- Chi, Y.N.; Zhang, Z.K.; Li, Y.; Wei, L.J. Development of Large-scale Wind Power Grid Integration and Technical Standard. North China Electric Power 2017, 1–7. [Google Scholar] [CrossRef]
- Xiong, X.F.; Chen, K.; Zheng, W.Z.; Shen, Z.J.; Shahzad, N.M. Photovoltaic Inverter Model Identification Based on Least Squares Method. Power Syst. Prot. Control 2012, 40, 52–57. [Google Scholar]
- Liu, L.F. Parameter Identifieation of Generators for Large Power System Dynamic Equivalence. Master’s Thesis, Wuhan University, Wuhan, China, 2004. [Google Scholar]
- Dong, W.; Li, Y.; Xiang, J. Optimal Sizing of a Stand-Alone Hybrid Power System Based on Battery/Hydrogen with an Improved Ant Colony Optimization. Energies 2016, 9, 785. [Google Scholar] [CrossRef]
- Malik, S.; Kim, D.H. Prediction-Learning Algorithm for Efficient Energy Consumption in Smart Buildings Based on Particle Regeneration and Velocity Boost in Particle Swarm Optimization Neural Networks. Energies 2018, 11, 1289. [Google Scholar] [CrossRef]
- Zhu, M.X.; Li, J.C.; Chang, D.G.; Zhang, G.J.; Chen, J.M. Optimization of Antenna Array Deployment for Partial Discharge Localization in Substations by Hybrid Particle Swarm Optimization and Genetic Algorithm Method. Energies 2018, 11, 1813. [Google Scholar] [CrossRef]
- Liu, C.L.; Liang, W.P.; Sun, W.Y.; Su, J. Model Identification of Thermal Process in Power Plant. In Proceedings of the 2004 IEEE Region 10 Conference TENCON 2004, Chiang Mai, Thailand, 24 November 2004. [Google Scholar]
- Shi, L.J.; Zhao, C.Y.; Wu, F.; Zhao, H.Y.; Shi, J.J.; Jiang, X.X. Optimization of ESS PI Controllers Parameters Based on PSO in Smart Grid. In Proceedings of the 2015 5th International Conference on Electric Utility Deregulation and Restructuring and Power Technologies (DRPT), Changsha, China, 26–29 November 2015; pp. 2566–2570. [Google Scholar]
- Shen, W.J.; Li, H.X. A Sensitivity-Based Group-Wise Parameter Identification Algorithm for the Electric Model of Li-ion Battery. IEEE Access 2017, 5, 4377–4387. [Google Scholar] [CrossRef]
- Yang, W.; Shan, L.; Qu, Y.; Yang, B.; Sun, J. Co-Simulation and Parameters Identification Algorithm Research of Servo system based on dynamic module. In Proceedings of the 2015 International Conference on Control, Automation and Information Sciences (ICCAIS), Changshu, China, 29–31 October 2015; pp. 408–413. [Google Scholar]
- Li, Z.; Zhen, S.; Zhen, X.Q.; Bao, W. System Identification of Adaptive Reduced Order Based on PSO Algorithm. Ind. Control Comput. 2017, 30, 112–115. [Google Scholar]
- Xu, Y.; Gao, Z.; Zhu, X.R. Research on Parameter Identification of Photovoltaic Array Based on Measured Data. In Proceedings of the 2017 20th International Conference on Electrical Machines and Systems (ICEMS), Sydney, NSW, Australia, 11–14 August 2017; pp. 1–5. [Google Scholar]
- Yang, H.C.; Cheng, R.F.; Lv, C.Y.; Wang, X.W. Study on Internal Parameter Identification and Output Characteristics of Photovoltaic Module. Appl. Electron. Tech. 2018, 44, 125–128. [Google Scholar] [CrossRef]
- Xu, Y.; Gao, Z.; Zhu, X.R. Multi-scenario Parameters Identification of Photovoltaic Array Based on Hybrid Artificial Fish Swarm and Frog Leaping Algorithm. Renew. Energy 2018, 36, 519–526. [Google Scholar] [CrossRef]
- Chen, C. Research on the Identification of Synchronous Generator Parameters Based on Measured System Disturbance. Master’s Thesis, South China University of Technology, Guangzhou, China, 2017. [Google Scholar]
- Li, P.Q.; Li, H.; Li, X.R. Optimized Identification Strategy for Composite Load Model Parameters Based on Sensitivity and Correlation Analysis. Trans. China Electrotech. Soc. 2016, 31, 181–188. [Google Scholar] [CrossRef]
- Pan, X.P.; Yin, Z.H.; Jv, P.; Wu, F.; Jin, Y.Q.; Ma, Q. Model Parameter Identification of DFIG Based on Short Circuit Current. Electr. Power Autom. Equip. 2017, 37, 27–31. [Google Scholar] [CrossRef]
- Dong, Z.; Han, P.; Wang, D.F.; Jiao, S.M. Thermal Process System Identification Using Particle Swarm Optimization. IEEE Int. Symp. Ind. Electron. 2006, 1, 194–198. [Google Scholar] [CrossRef]
- Xing, H.; Pan, X.J. Application of Improved Particle Swarm Optimization in System Identification. In Proceedings of the 2018 Chinese Control and Decision Conference (CCDC), Shenyang, China, 9–11 June 2018; pp. 1341–1346. [Google Scholar]
- Sonia, S.; Hari, M.P. Genetic Algorithm, Particle Swarm Optimization and Harmony Search: A quick comparison. In Proceedings of the 2016 6th International Conference-Cloud System and Big Data Engineering (Confluence), Noida, India, 14–15 January 2016; pp. 40–44. [Google Scholar]
Figure 1.
Control structure diagram of the photovoltaic (PV) unit.

Figure 2.
(a) Reference value of active power of the converter; (b) reference value of reactive power of the converter.
Figure 2.
(a) Reference value of active power of the converter; (b) reference value of reactive power of the converter.

Figure 3.
(a) Sensitivity curve of active power of the parameter to be identified; (b) sensitivity curve of reactive power of the parameter to be identified.
Figure 3.
(a) Sensitivity curve of active power of the parameter to be identified; (b) sensitivity curve of reactive power of the parameter to be identified.
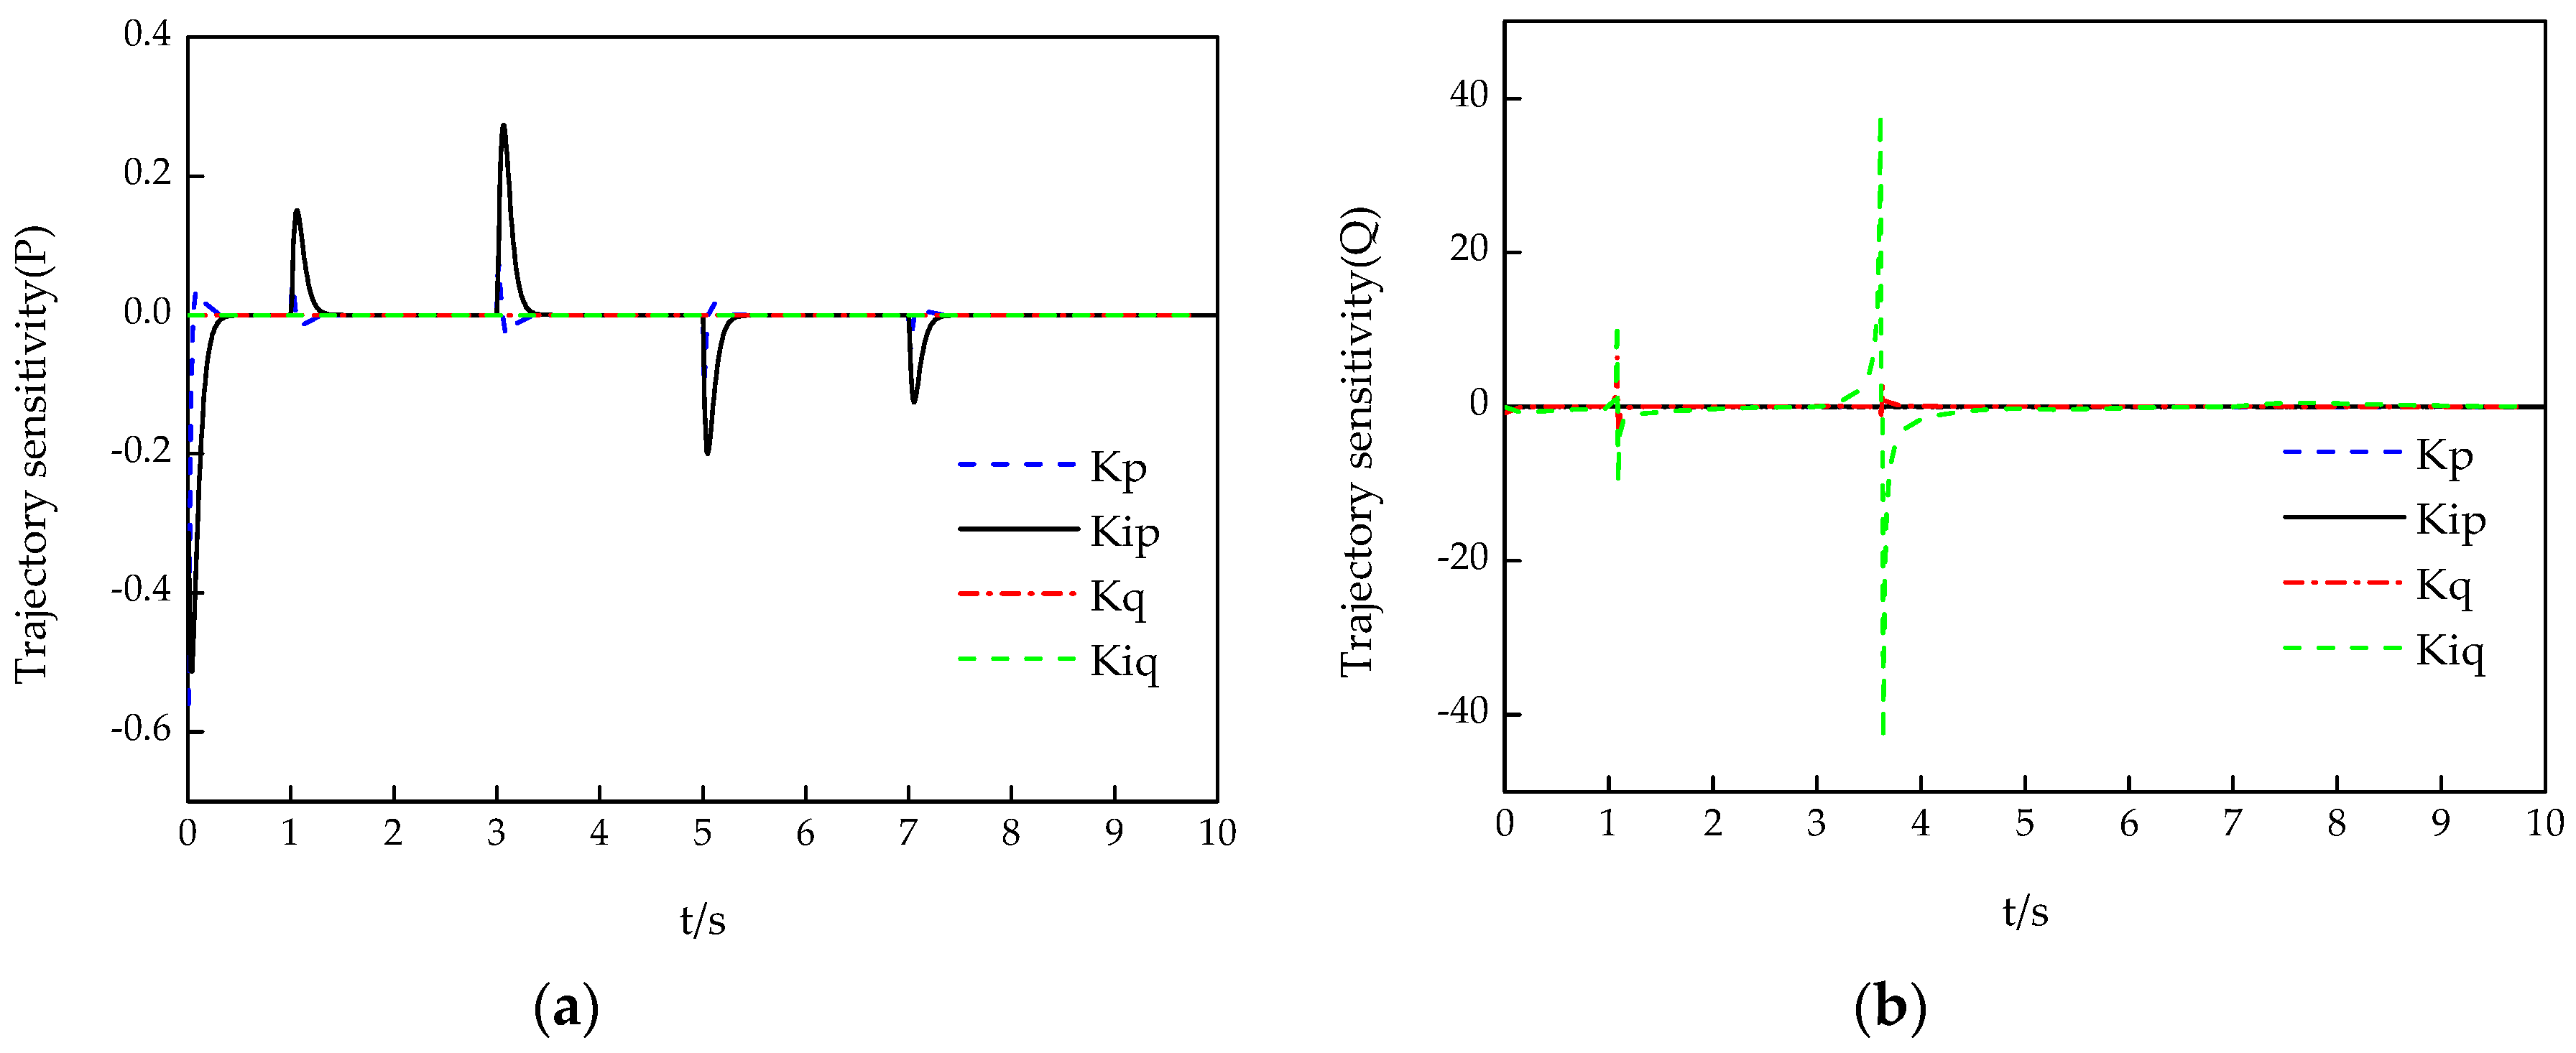
Figure 4.
Reference value of the voltage at the point of common coupling (PCC).

Figure 5.
(a) Sensitivity curve of active power of the parameter to be identified; (b) sensitivity curve of reactive power of the parameter to be identified.
Figure 5.
(a) Sensitivity curve of active power of the parameter to be identified; (b) sensitivity curve of reactive power of the parameter to be identified.
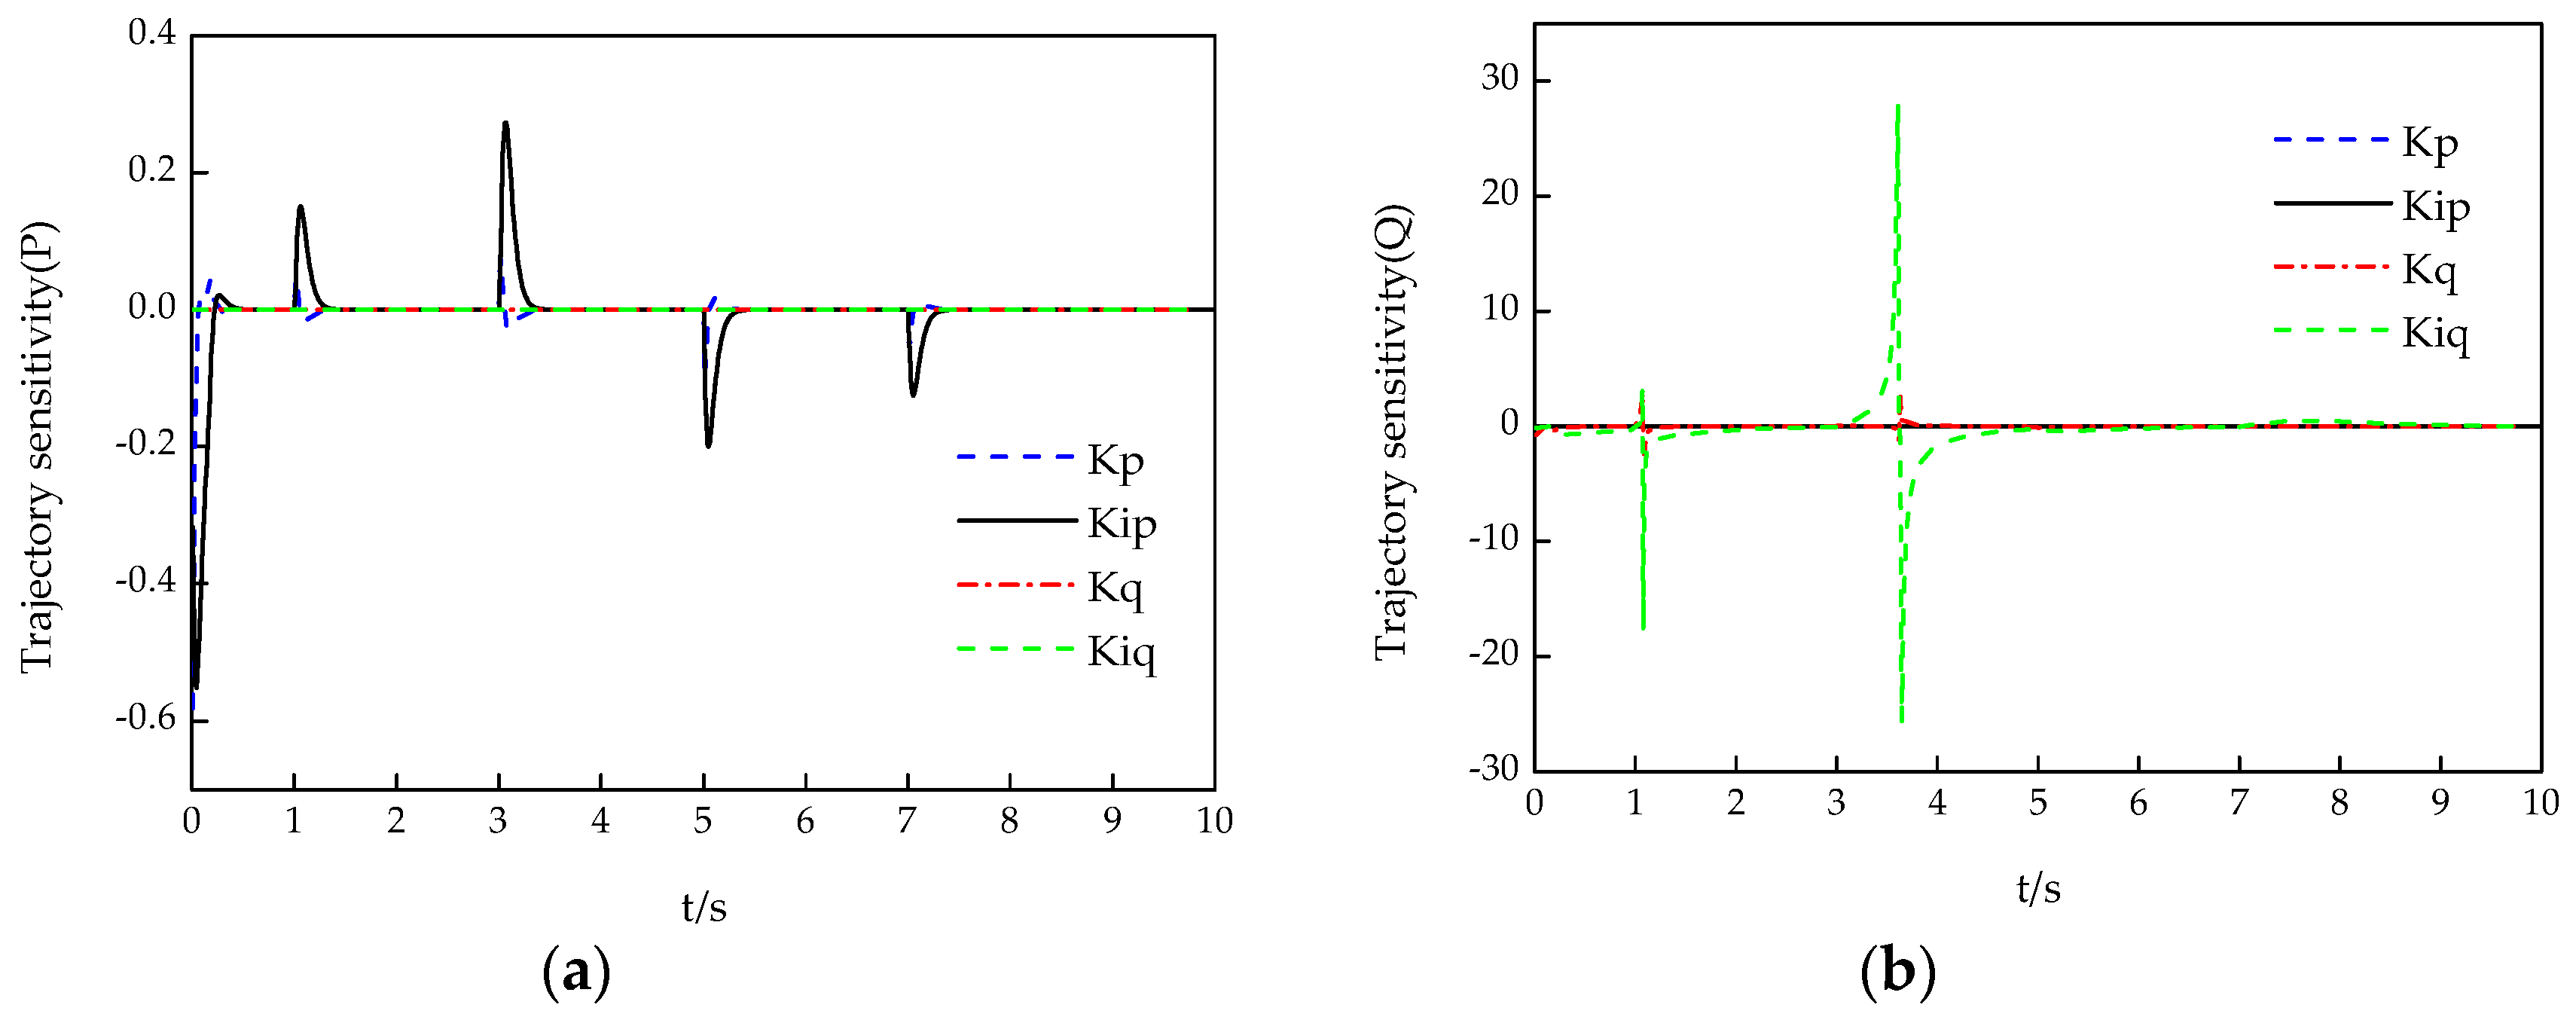
Figure 6.
Control structure diagram of direct-drive wind turbine.
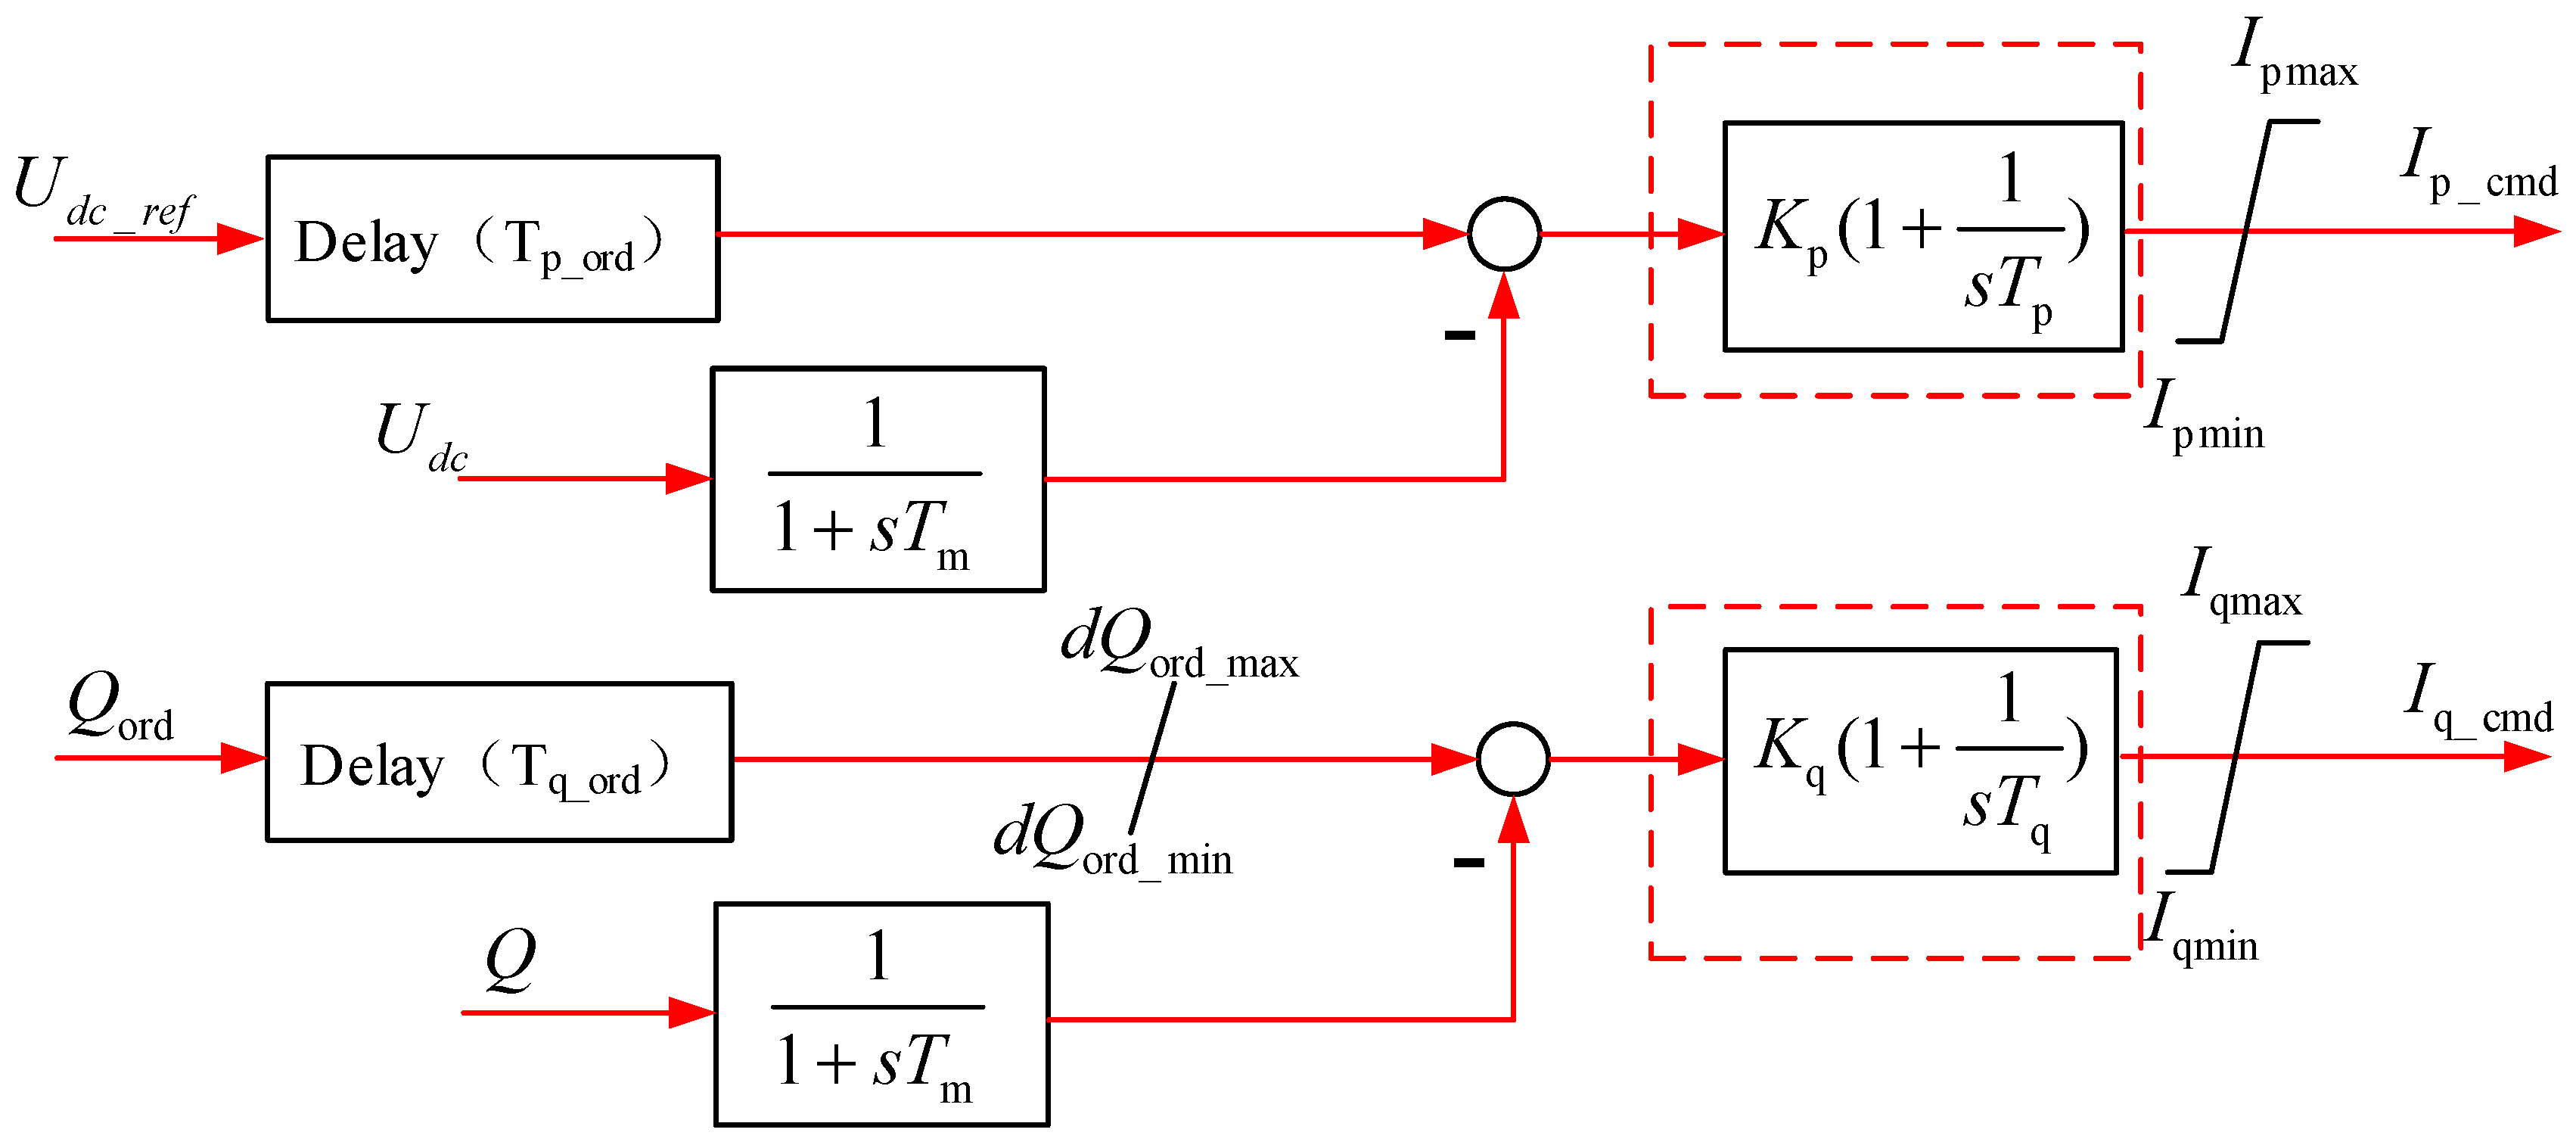
Figure 7.
Control structure diagram of energy storage unit.
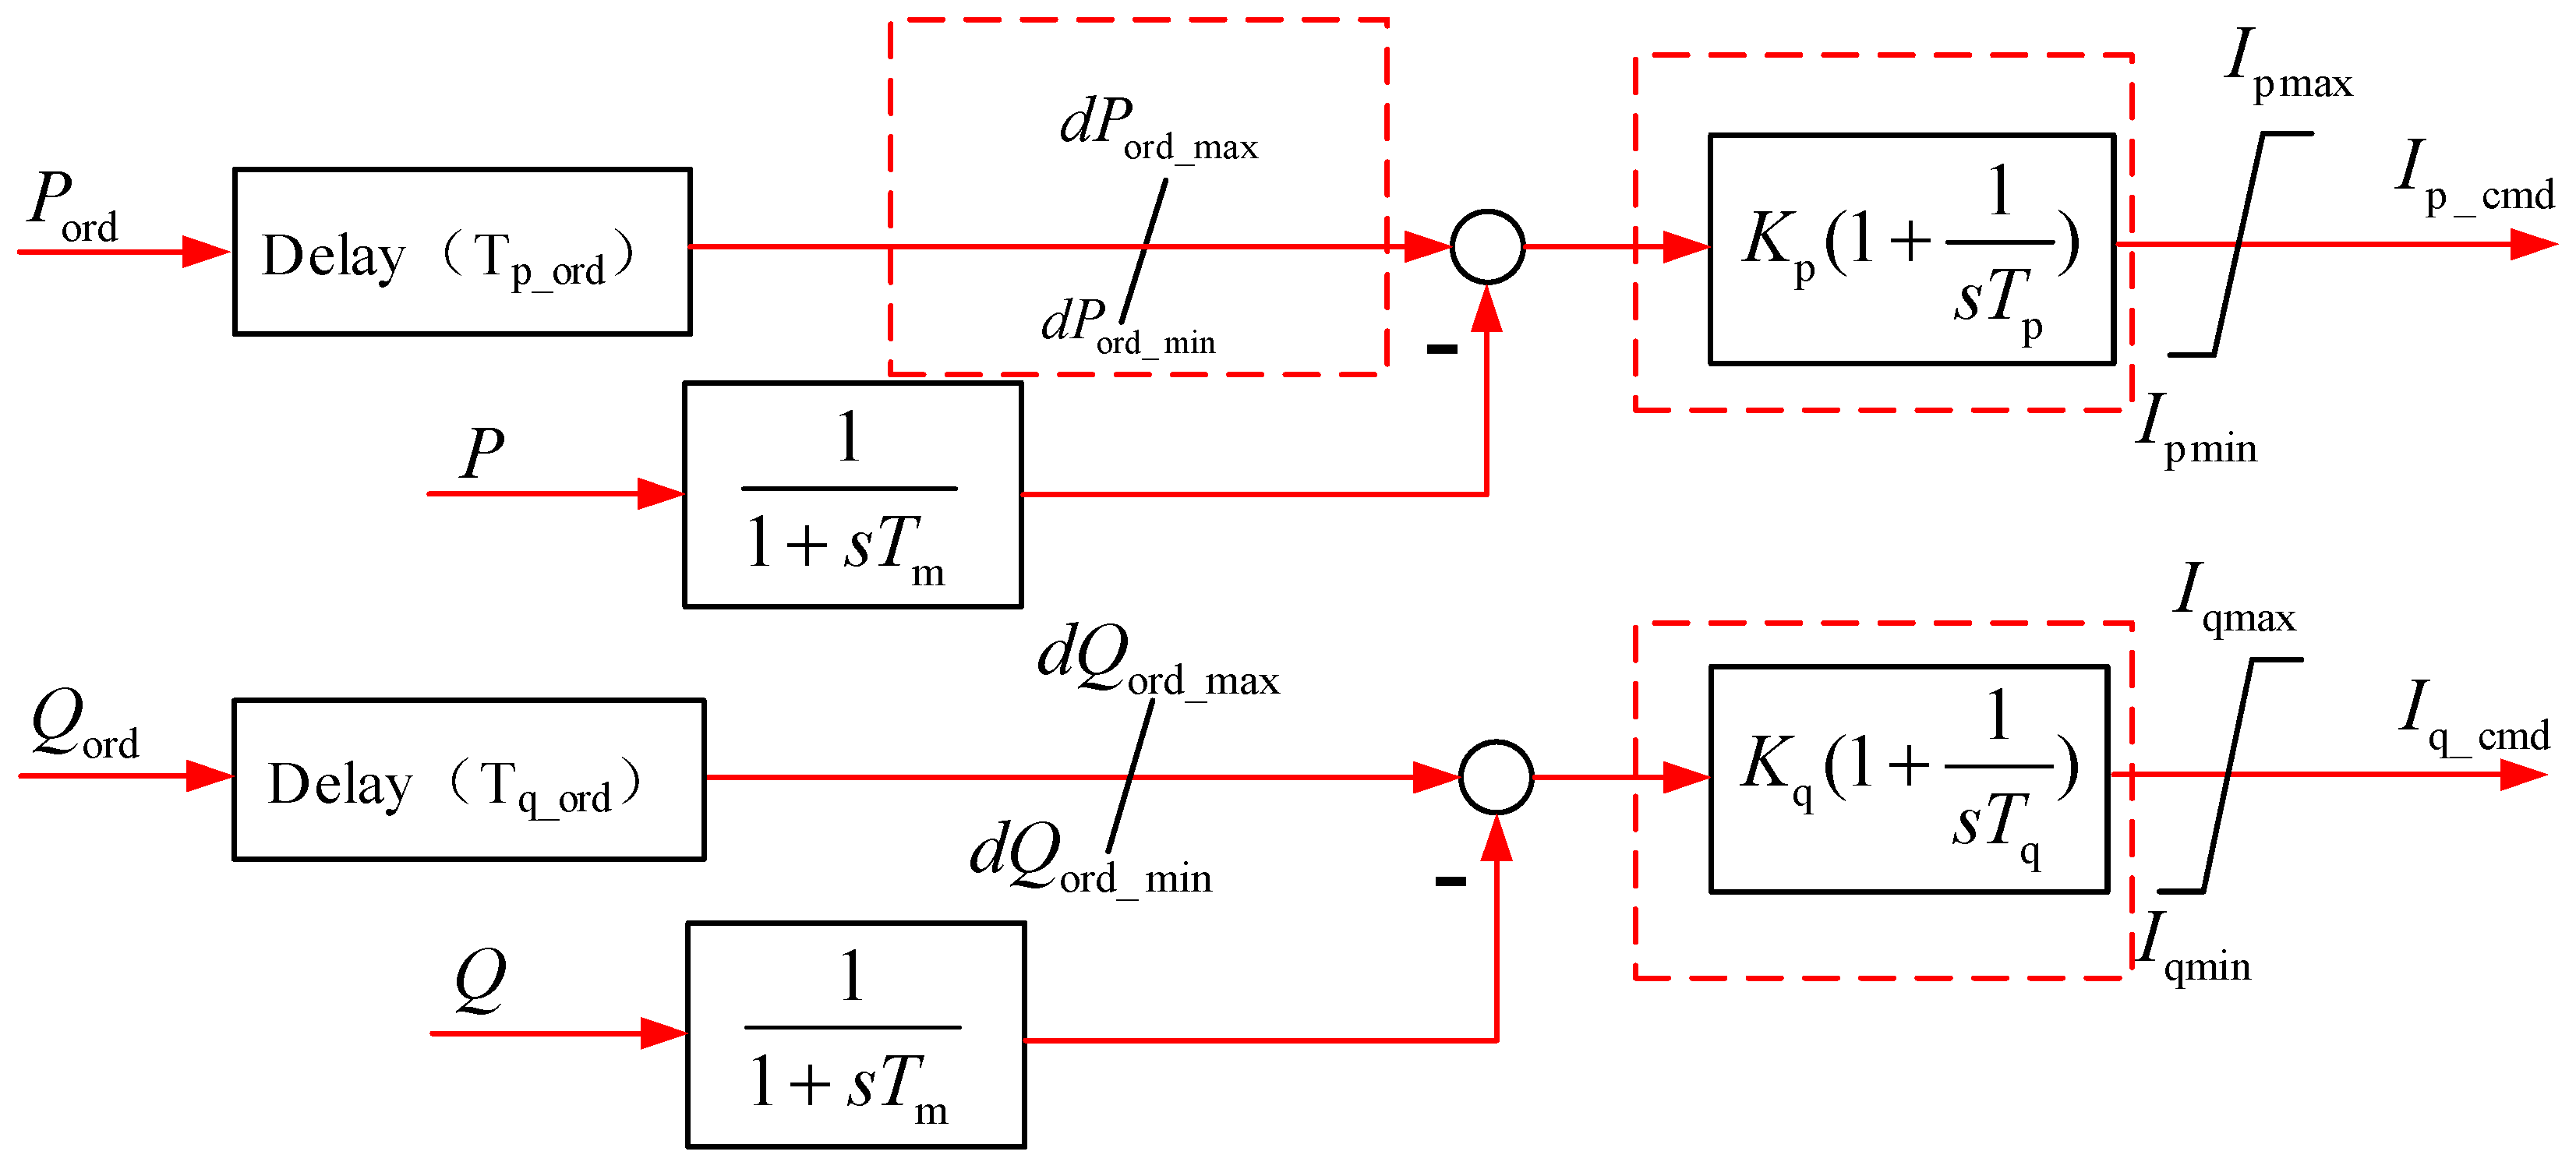
Figure 8.
Flow chart of parameter identification.

Figure 9.
Electrical wiring diagram of modeling simulation and test of the microgrid.

Figure 10.
(a) Comparison of the voltage at PCC; (b) Comparison of the active power at PCC; (c) Comparison of the frequency at PCC; (d) Comparison of the active power of energy storage unit.
Figure 10.
(a) Comparison of the voltage at PCC; (b) Comparison of the active power at PCC; (c) Comparison of the frequency at PCC; (d) Comparison of the active power of energy storage unit.

Figure 11.
(a) Comparison of the voltage at PCC; (b) Comparison of the active power at PCC; (c) Comparison of the frequency at PCC; (d) Comparison of the active power of energy storage unit; (e) Comparison of the active power of PV unit.
Figure 11.
(a) Comparison of the voltage at PCC; (b) Comparison of the active power at PCC; (c) Comparison of the frequency at PCC; (d) Comparison of the active power of energy storage unit; (e) Comparison of the active power of PV unit.

Table 1.
Parameters to be identified and test scheme of the renewable power sources.
| Test Object | Parameters to Be Identified | Test Scheme | Operation Mode |
|---|---|---|---|
| PV unit | Parameters of maximum power tracking control link dPm_max, dPm_min | Test of the DC source input disturbance | MPPT |
| Parameters of power control link Kp, Tp, Kq, Tq | Test of voltage disturbance | Power control | |
| Direct-drive wind turbine | Parameters of power control link Kp, Tp, Kq, Tq | Test of voltage disturbance | Power control |
| Energy storage unit | Parameters of power slope control link dPord_max, dPord_min | Test of power command value disturbance | Power control |
| Parameters of power control link Kp, Tp, Kq, Tq | Test of voltage disturbance | Power control |
Table 2.
Parameter identification results of the wind/PV/energy storage unit in the microgrid.
| Name | Definition | Identification Result of PV Unit | Identification Result of 30 kW Horizontal Axis Wind Turbine | Identification Result of 5 kW Rotor Wing Wind Turbine | Identification Result of 5 kW H Wing Wind Turbine | Identification Result of Energy Storage Unit |
|---|---|---|---|---|---|---|
| dPm_max | Upper limit of maximum power tracking slope (pu/s) | 151.64 | Not included in the test | |||
| dPm_min | Lower limit of maximum power tracking slope (pu/s) | 52.1 | ||||
| Kp | PI control proportional coefficient of the active power control | 0.6372 | 1.55 | 1.72 | 0.77 | 0.53 |
| Tp | PI control integral time constant of the active power control (s) | 0.0049 | 0.0083 | 0.0013 | 0.0013 | 0.0063 |
| Kq | PI control proportional coefficient of the reactive power control | 1.1962 | 1.33 | 1.34 | 0.077 | 0.68 |
| Tq | PI control integral time constant of the reactive power control (s) | 0.0157 | 0.0022 | 0.0013 | 0.0054 | 0.0026 |
| dPord_max | Upper limit of active power control slope (pu/s) | Not included in the test | 12.46 | |||
| dPord_min | Lower limit of active power control slope (pu/s) | 3.87 | ||||
Table 3.
Grid-connection/island switching test of the microgrid.
| Test Cases | Test Points |
|---|---|
| Control from grid-connected mode to island mode | AC side of PV and energy storage unit; PCC |
| Control from island mode to grid-connected mode | AC side of PV and energy storage; PCC |
PCC refers to point of common coupling.
Table 4.
Errors in case 1 condition.
| Name | F | Fulfill the Regulation |
|---|---|---|
| Voltage at PCC | 0.024 | Yes |
| Frequency at PCC | 0.0006 | Yes |
| Active power at PCC | 0.029 | Yes |
| Active power of the energy storage unit | 0.016 | Yes |
| Active power of PV unit | 0.024 | Yes |
Table 5.
Errors in case 2 condition.
| Name | F | Fulfill the Regulation |
|---|---|---|
| Voltage at PCC | 0.023 | Yes |
| Frequency at PCC | 0.00012 | Yes |
| Active power at PCC | 0.030 | Yes |
| Active power of energy storage unit | 0.011 | Yes |
| Active power of PV unit | 0.0047 | Yes |
© 2018 by the authors. Licensee MDPI, Basel, Switzerland. This article is an open access article distributed under the terms and conditions of the Creative Commons Attribution (CC BY) license (http://creativecommons.org/licenses/by/4.0/).
Share and Cite
MDPI and ACS Style
Zhang, J.; Sun, Y.; Liu, M.; Dong, W.; Han, P. Research on Modeling of Microgrid Based on Data Testing and Parameter Identification. Energies 2018, 11, 2525. https://doi.org/10.3390/en11102525
AMA Style
Zhang J, Sun Y, Liu M, Dong W, Han P. Research on Modeling of Microgrid Based on Data Testing and Parameter Identification. Energies. 2018; 11(10):2525. https://doi.org/10.3390/en11102525
Chicago/Turabian StyleZhang, Junjun, Yaojie Sun, Meiyin Liu, Wei Dong, and Pingping Han. 2018. "Research on Modeling of Microgrid Based on Data Testing and Parameter Identification" Energies 11, no. 10: 2525. https://doi.org/10.3390/en11102525
Note that from the first issue of 2016, this journal uses article numbers instead of page numbers. See further details here.