A Study on Combustion Parameters in an Automotive Turbocharged Diesel Engine


Internal Combustion Engines Group (ICEG), Department of Mechanical, Energy, Management and Transportation Engineering (DIME), University of Genoa, via Montallegro 1, 16145 Genoa, Italy
Energies 2018, 11(10), 2531; https://doi.org/10.3390/en11102531
Submission received: 31 August 2018
/
Revised: 17 September 2018
/
Accepted: 20 September 2018
/
Published: 21 September 2018
Abstract
:A wide experimental database on indicated pressure diagrams measured on a turbocharged diesel engine, equipped with high and low pressure exhaust gas recirculation (EGR) circuits and a variable nozzle turbine (VNT), was processed to evaluate a large set of combustion parameters. Available data were referred to different tests in three part load operating conditions, focused on High Pressure EGR trade-off and the development of integrated control strategies for EGR and turbocharging systems aiming at NOX and fuel consumption reduction. According to their definition, combustion parameters were derived from pressure diagrams, its first derivative and heat release curves. Their calculation allowed enlarging the information content of measured in-cylinder pressure diagrams. Several linear correlations were then defined, linking engine operating, energy and environmental quantities to combustion parameters, useful for the analysis and modeling of in-cylinder processes and engine behavior. The influence of testing conditions on these relationships was also analyzed, referring to the investigated operating modes and the adoption of open and closed loop scheme for VNT management. Finally, general correlations were defined, linking NOX and soot emissions to selected quantities.
1. Introduction
Starting with the investigations of Rassweiler and Withrow in the 1930s [1], measurement of indicated pressure diagrams has been developed to become a robust technique for the development and control of internal combustion engines. A proper management of related technical issues [2] allows improving measurements reliability and accuracy. The application of suitable processing procedures leads to the evaluation of rate of heat release (ROHR) curves [2,3], increasing the information derived from experimental observations to deepen the knowledge on combustion process.
Recent works deal with a very wide range of topics, confirming the potential of this technique for both diesel and SI engines. The influence of alternative fuels on combustion process can be supported by the analysis of pressure diagrams and related quantities. In [4], two blends of canola oil and hazelnut soapstock were tested in a single cylinder direct injection diesel engine. Canola oil was also investigated in [5], where an extended comparison of pressure and heat release curves is presented, to outline the differences when using diesel oil, a B20 blend and neat canola oil. Tests were made on a 2.0-L common rail diesel engine, in four different load levels at constant speed. A reduction of maximum pressure and ROHR values was apparent when switching from conventional to alternative fuel. Due to the oxygen content in the canola oil, a shorter ignition delay was also observed.
Innovative combustion processes are another area of major interest, where the comparison of in-cylinder pressure and heat release rate referring to conventional mode helps in clarifying effects. As an example, Premixed Charge Compression Ignition (PCCI) influence on combustion is discussed in [6], where exhaust gas recirculation (EGR) rate and double injection control was applied to enhance emissions in a turbocharged 2.0-L diesel engine, considering six part load operating conditions. When increasing EGR level, lower maximum pressure and ROHR values were obtained, while ignition delay was extended, especially at low load. NO formation was enhanced, as well as soot emission, when achieving PCCI conditions.
The application of more conventional techniques can be supported by pressure diagrams analysis. In [7], internal and low pressure EGR were compared to the high pressure loop in a single cylinder diesel engine, using pressure and ROHR curves to assess the influence of intake valve closing strategies. Among the different results, it was shown that a proper combination of valve overlap, internal and low pressure EGR allowed to decrease pumping losses and fuel consumption, without affecting heat release and emission levels referring to the activation of standard high pressure EGR circuit.
In [8], assigned EGR stratification was numerically compared to uniform EGR also referring to their influence on in-cylinder pressure and heat release in a large (8.6-L) displacement diesel engine. Heat release was not significantly affected by the stratification of recirculated gases, while NOX formation was reduced, due to a higher EGR level in regions of NO formation. Soot was also reduced, as an enhanced oxidation was promoted.
A further example of the use of indicated diagrams is presented in [9] to analyze the influence of in-cylinder steam injection in a turbocharged diesel engine. A rise of maximum pressure values was obtained when increasing the amount of steam injected inside the cylinder, due to the higher mass of working fluid. The same tendency, even if with lower variations, was observed when increasing the steam temperature, due to its higher enthalpy.
Finally, diagnostics is a further field of application of indicating technique, as shown by the development of an on-board pressure-based diagnostics tool for both SI and diesel engine discussed in [10]. In this case, real time calculation is requested, forcing to the direct use of in-cylinder pressure curves, as the calculation of heat release is too much complex and time consuming. Therefore, different approaches for combustion detection are discussed in the paper, referring to pressure-based direct methods, the use of the derivative of pressure signal and time–frequency analysis.
Referring to a topic closer to this paper, investigations on the application of dual loop EGR circuits are presented in [11,12,13], also discussing their influence on pressure diagrams and ROHR. In [11], variations of heat release when switching from high pressure (HP) to low pressure (LP) circuit were numerically assessed at constant EGR rate in a fixed part load working condition for a 2.0-L automotive engine. Increasing contribution from LP loop was considered, showing the rise of ignition delay due to the lower intake temperature. The same result was outlined in [12], while no effects were apparent for maximum pressure rise rate, probably due to minor changes in overall EGR rate. In this case, tests were made on a 2.2-L automotive engine. A large (8.42-L) heavy-duty engine was tested in [13] and heat release variations were considered in a medium load working point to compare HP EGR and dual loop circuits. Minor changes in ignition delay and maximum value of ROHR were apparent, also due to an injection strategy with the main event occurring before top dead center (BTDC).
From the analysis of literature, it is apparent that pressure diagrams and rate of heat release curves are generally evaluated with a qualitative approach. A different way can be followed by applying the second-law analyses to internal combustion engines, as widely reviewed in [14]. An example of the integration of the two methods (heat release and exergy analysis) is presented in [15].
The major goal of this study is to verify if a wide set of selected experimental parameters can integrate the assessment of combustion process according to the calculation of heat release following the first thermodynamics law. Qualitative evaluation of their trends when controlling the main engine sub-systems is replaced by suitable relationships with the engine quantities, taking also into account the requirements of modeling and control. Furthermore, a state-of-the-art downsized engine for automotive application was considered for the investigation, as few examples are referred to current engines, as single cylinder or large displacement engines are commonly tested.
Due to the extended relevance of in-cylinder pressure measurements proven by the previous summary, the investigation presented in this paper is grounded on the availability of a wide experimental database dealing with the application of integrated control strategies to hybrid EGR and turbocharging systems in an automotive diesel engine [16,17]. Different goals were targeted through the processing of pressure diagrams. The first was the evaluation of a significant number of combustion parameters derived from pressure and heat release curves to maximize their outcomes, allowing a quantitative assessment of the influence of test variables on combustion process. The second target was to outline the existing relationships between measured engine operating, energy and environmental quantities and combustion parameters, aiming at their application for modeling and control purposes. The third goal was to assess if these links are affected by testing conditions, considering simple (trade-off of high pressure EGR system) and advanced (simultaneous use of high and low pressure EGR circuits and integrated management of variable nozzle turbine, VNT, opening degree) approaches and different control scheme of specific components (i.e., VNT open or closed loop control).
As far as the paper structure is concerned, methodologies are presented, referring to the description of test rig and engine, with the relevant open control system. Acquisition system and processing procedure for pressure diagram measurements and ROHR calculation are then discussed, followed by an overview of selected combustion parameters, with the relevant definitions. The investigation program is then summarized to introduce the discussion of the most important outcomes.
2. Methods
2.1. Engine Test Facility
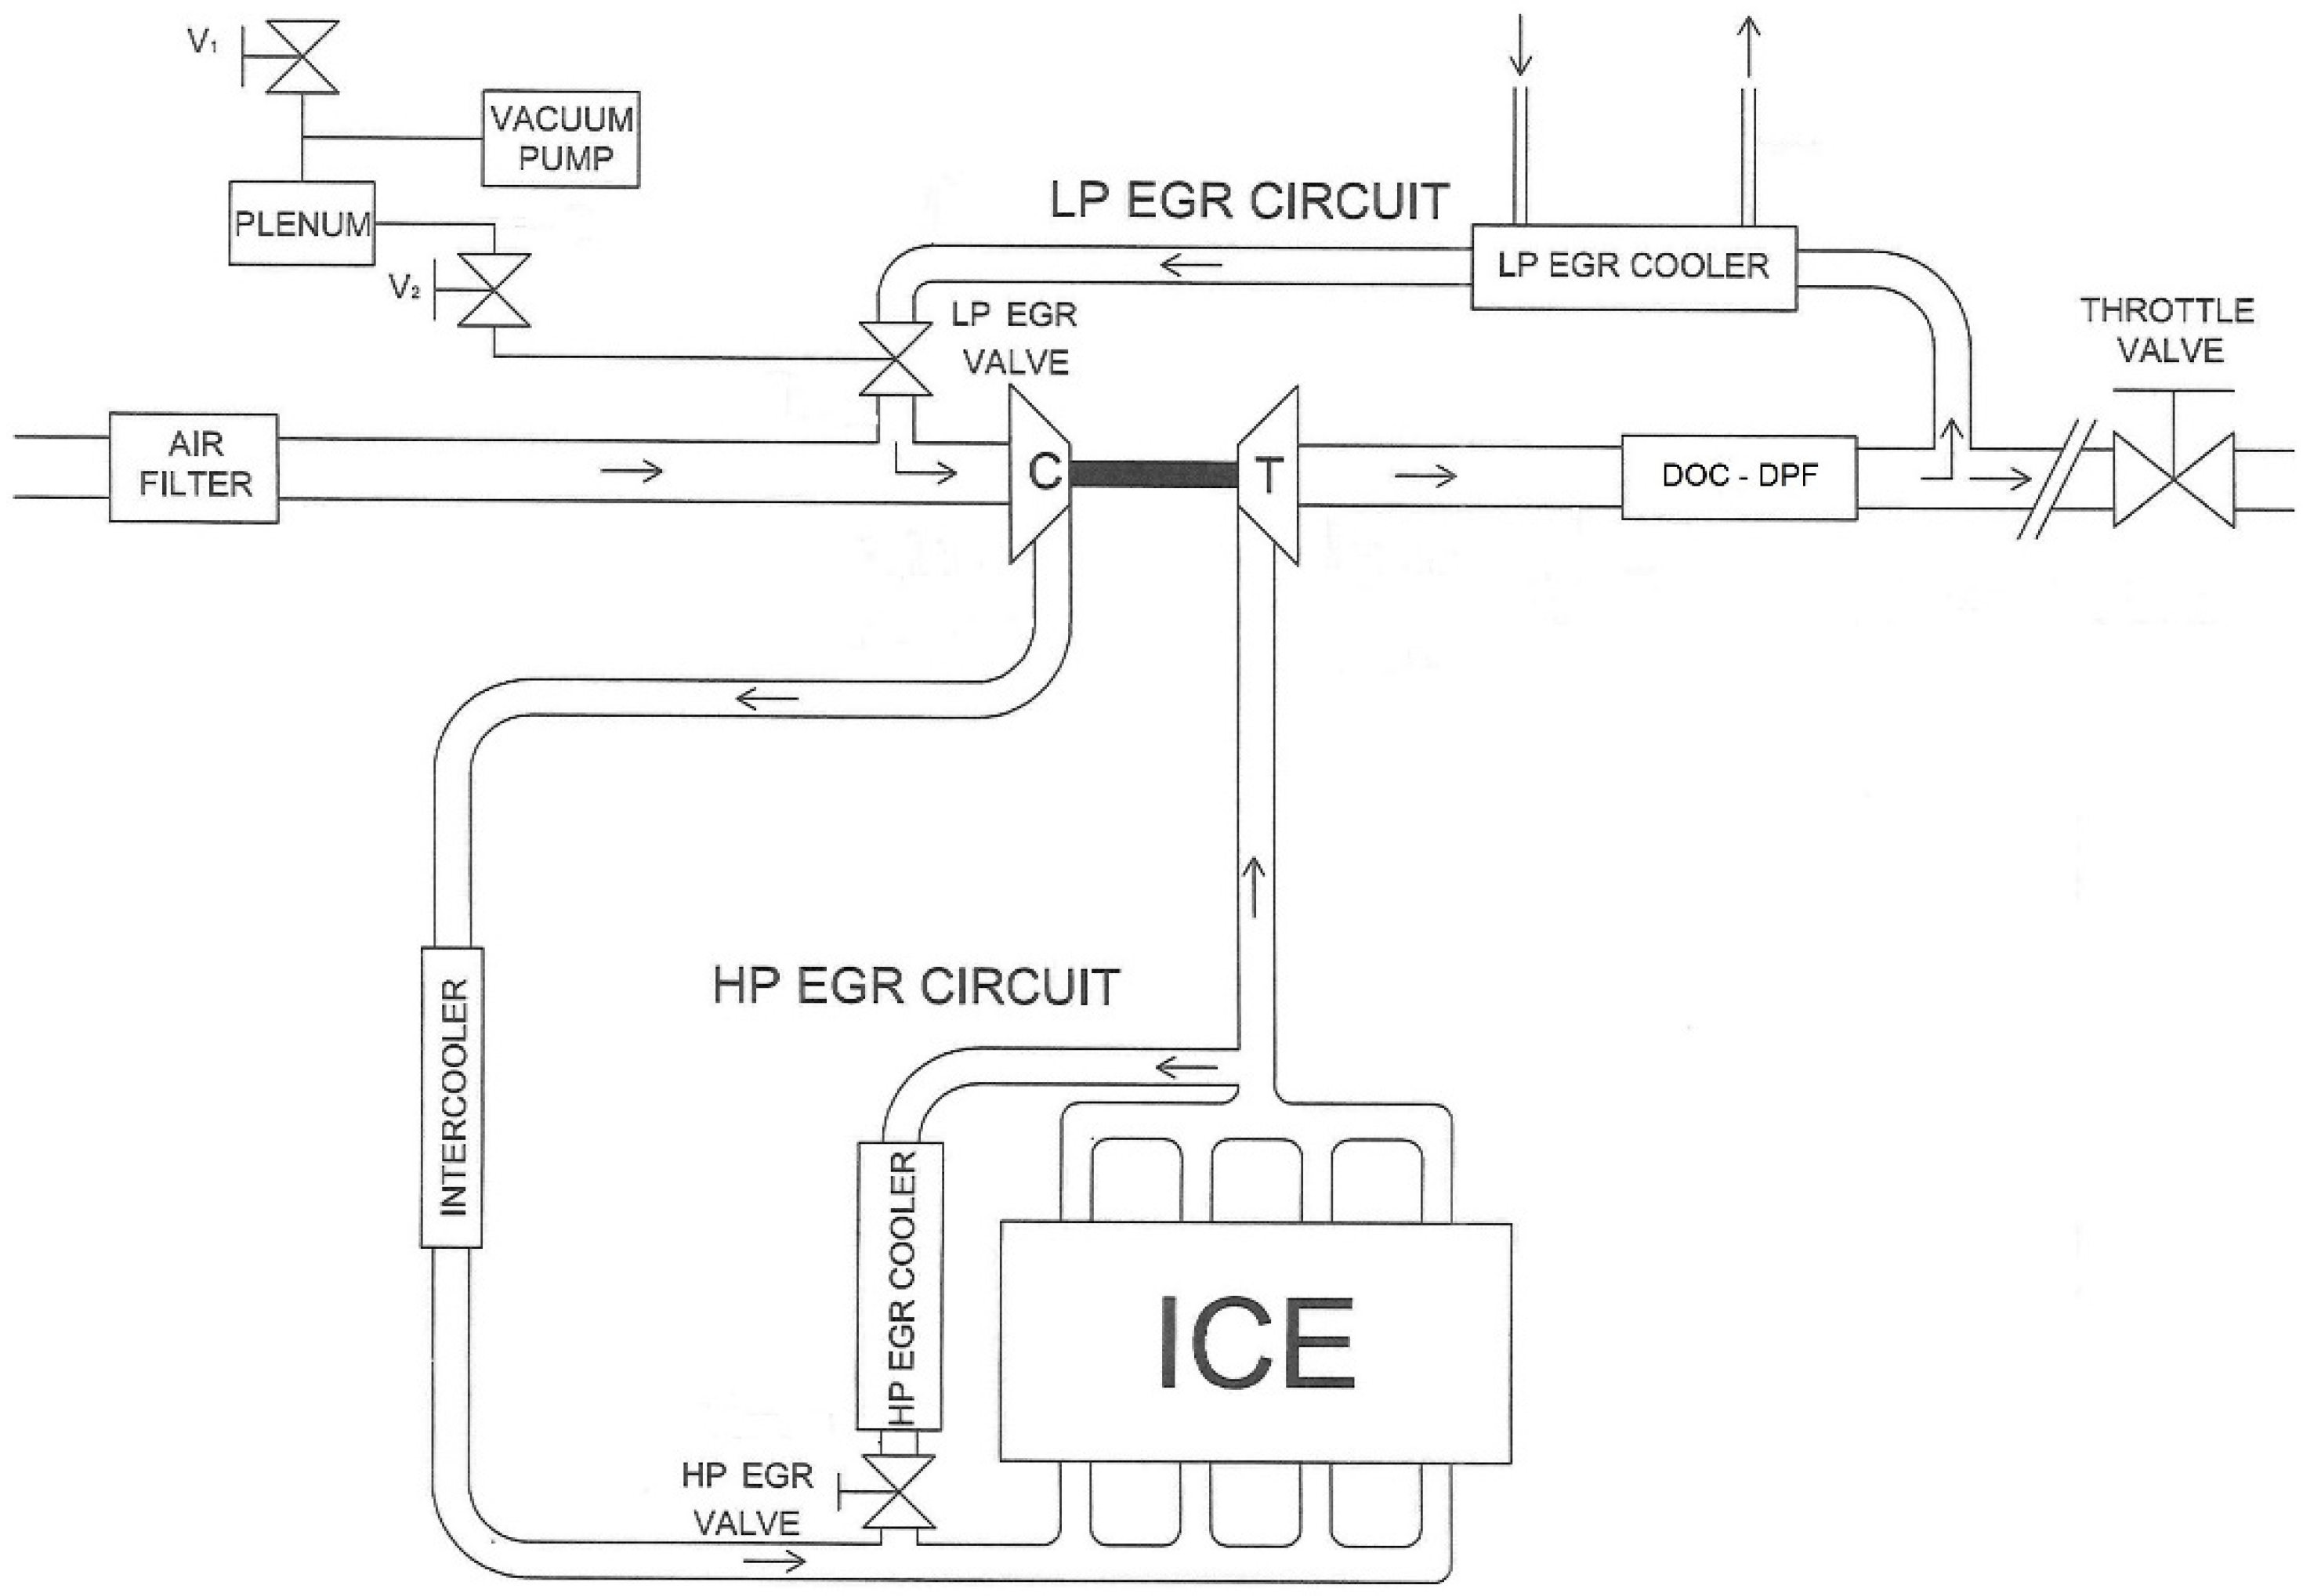
An automotive turbocharged Euro 5 Direct Injection diesel engine (FCA, Turin, Italy) fitted on a steady state eddy current dynamometer test bench was used for the experimental campaigns. Engine main technical characteristics are listed in Table 1, while Figure 1 shows a scheme of the engine [17].
Engine quantities were measured through proper instrumentation, such as exhaust gas analyzers for concentrations of carbon dioxide (Non Dispersive InfraRed analyzers, accuracy ± 1% of selected range) and nitrogen oxide (Chemiluminescent analyzer, accuracy ± 0.5% of selected range), a variable sampling smoke meter (accuracy ± 0.1 FSN) and a fuel consumption measuring equipment for the direct acquisition of fuel mass flow rate (accuracy ranging between 0.2% and 0.81%, depending on measured value). Air mass flow rate and engine rotational speed were derived from on-board engine sensors.
Pressure and temperature were acquired in selected sections of intake and exhaust circuits using strain gauge transducers, platinum resistance thermometers and K-type thermocouples. A proper control of coolant, lubricant and intake charge temperatures was applied through thermostatic circuits and managing water flow rate to obtain a suitable intercooler efficiency level.
Turbocharger rotational speed was measured using an eddy current probe fitted close to the compressor rotor.
The displacement S of the turbine nozzle ring push rod was measured with a linear potentiometer. Comparing S with its maximum and minimum value (SMAX and SMIN), the variable nozzle turbine opening degree AVNT was calculated according to Equation (1):
AVNT = [(SMAX − S)/(SMAX − SMIN] × 100 [%].
AVNT ranges 0–100%, corresponding to minimum and maximum turbine swallowing area.
EGR rate (fEGR) was expressed as the ratio between recirculated gas and total engine mass flow rate (Equation (2)). The second term was given by the sum of air (Ma), fuel (Mf) and EGR (MEGR) mass flow rates.
fEGR = [MEGR/(MEGR + Ma + Mf)] × 100 [%].
Measuring ambient, intake and exhaust carbon dioxide concentrations through NDIR analyzers, Equation (3) can be applied to calculate EGR rate [12,18]:
fEGR = [(XCO2 i − XCO2 a)/(XCO2 e − XCO2 a)] × 100 [%].
Estimated levels of MEGR corresponded to the total mass of recirculated gases when high and low pressure loops were simultaneously activated or to the mass flowing in the circuit when only one of them was operated. In the first case, the contribution from each loop was estimated through a simplified energy balance between the intake air and the recirculated gases from both circuits, taking into account measured temperature levels, neglecting heat losses and changes of constant pressure specific heat with temperature.
An automatic data acquisition system made low frequency measurements in steady-state conditions. In-house developed codes in Labview® and Excel® environment sampled and processed data, calculating statistical parameters of observed quantities (average, standard deviation, variation coefficient) and the main engine parameters. Further details on experimental layout, low pressure EGR circuit design, instrument characteristics and uncertainties are presented in [16,17].
2.2. Engine Management System and Control Variables
An open electronic control unit (ECU) including an EPROM emulator module was connected to an ETAS® MAC2F interface and then to a dedicated PC, from which the INCA® software V7.0.0 allowed managing the ETK module. Real time visualization of engine operating parameters, selection of maps stored in the ECU and change of control variables according to the experimental program were therefore performed.
Open and closed loop strategies were available for turbocharger turbine control, according to the engine operating condition. The first option was applied by the ECU at low levels of engine speed and load, setting duty-cycle values of an electro-pneumatic valve (DCVNT), thus obtaining fixed values of AVNT. As the driving pressure was below the atmospheric one, the maximum duty-cycle (DCVNT = 100%) corresponded to the fully closed position (AVNT = 0). At higher levels of engine speed and load, ECU switched to the closed loop control scheme, by comparing an intake pressure set point with the measured value, then changing DCVNT to reduce, if necessary, the calculated difference.
On the other hand, HP EGR system was managed through a closed loop scheme. In this case, the relative air–fuel ratio (AFR) set point was compared to the actual value, derived by the measurement of the air mass flow rate, while fuel mass flow rate was calculated by the ECU according to the requested engine load. The duty-cycle of the electric HP EGR valve (DCEGR) was modulated to reduce the resulting difference, thus managing its opening degree and HP EGR mass flow rate.
The prototype low pressure EGR circuit was controlled through a vacuum signal modulating the pneumatic valve opening degree. LP EGR mass flow rate depended also on the setting of a throttle valve (TV) fitted at the exhaust end [16], allowing to reproduce requested pressure levels along this circuit (due to the absence of diesel particulate filter) and to increase low pressure EGR contribution.
2.3. Measurement of In-Cylinder Pressure Diagrams and Calculation of Rate of Heat Release
In-cylinder pressure diagrams were measured through a dedicated system, sampling different signals at high frequency rates, ranging from 90 to 150 kHz for the tested conditions, according to the engine rotational speed. Therefore, a time sampling period corresponding to a 0.1 crank angle rotation was applied. An uncooled piezoelectric transducer was fitted in the glow plug seat of a cylinder for pressure gauging, while crank angle was acquired by means of a photoelectric incremental encoder. Fuel pressure upstream of the injector and injector energizing current of the same cylinder were also measured, through a piezo-resistive transducer and a current sensor, respectively. Pressure signals were properly amplified, while a high frequency device, sampling up to 50 cycles in each tested operating condition, completed the measuring chain. Post-processing was performed using dedicated virtual instruments developed in LabVIEW® environment, applying different steps. These allowed the evaluation of absolute pressure levels and filtering of pressure signals using a numerical procedure based on moving means centered on three values, to eliminate the noise due to pressure waves propagating in the measurement duct between the sensor and the combustion chamber. The calculation of average in-cylinder pressure diagram and of maximum pressure with the relevant angle position and standard deviations completed this processing phase.
A second step was dedicated to the calculation of experimental rate of heat release (ΔQ/Δθ). A Fortran code developed by the author was used, processing measured pressure data for each condition, namely, for fixed levels of engine speed, brake mean effective pressure (bmep), overall EGR rate and VNT opening degree. ΔQ is the amount of heat released during a crankshaft rotation Δθ, computed applying the first thermodynamics law to the cylinder gas, assuming complete combustion and neglecting the variation of mass due to fuel injection [2,3]. Intake charge composition and changes in the concentration and temperature of components inside the cylinder during combustion were considered for the evaluation of specific heats and their ratio, derived from the thermodynamic property functions of different gases reported in [19].
The evaluation of injected fuel mass flow rate in each calculation step was based on experimental data of injected quantities, estimating the actual values of pilot, pre and main injections start and their duration. To this aim, proper delays were added at the start and end of the current signal, whose values were derived from [20].
Heat release was calculated considering the equation:
with the three terms respectively related to in-cylinder pressure multiplied for the corresponding variation of instantaneous cylinder volume (derived from measured crank angle and engine geometry characteristics), pressure gradient and heat transfer to the coolant, estimated using the Hohenberg correlation [21].
(ΔQ/Δθ) = [k/(k − 1)] × p × (ΔV/Δθ) + [1/(k − 1)] × (Δp/Δθ) + (ΔQcoolant/Δθ),
2.4. Evaluation of Combustion Parameters and Charge Dilution Index
To enlarge the information obtained from in-cylinder pressure diagrams and heat release curves, different combustion parameters were evaluated, together with a non-dimensional index related to EGR rate. Their availability allowed a further step of the investigation, based on the research of simple relationships between these quantities and the main engine parameters, which may be useful for the analysis of the experimental results and for modeling purpose.
The activation of EGR has different consequences on engine behavior, among which the dilution effect is the most influencing one [22], leading to the reduction of oxygen concentration at the engine intake (XO2 i). In diesel conventional combustion mode, the EGR rate increase may affect negatively CO, HC and, most of all, soot emissions, therefore its maximum level depends on engine load, with higher values at low bmep. Oxygen content in the exhaust/recirculated gases (XO2 e) is also dependent on engine load. These parameters appear in the Charge Dilution Index (CDI), defined in [18] according to Equation (5), aiming at normalizing the effect of load on EGR and comparing EGR rate in different engine working conditions.
CDI = EGR level/Load level = [(XO2 a − XO2 i)/(XO2 i − XO2 e)].
In this investigation, intake and exhaust oxygen concentrations and CDI values were calculated according to the measured levels of air and EGR mass flow rates and to the estimation of in-cylinder relative air–fuel ratio, applying the procedure presented in [18,23]. A validation of estimated CDI values was discussed in [17], where a good correlation with EGR rate was presented, in line with similar relationship [18].
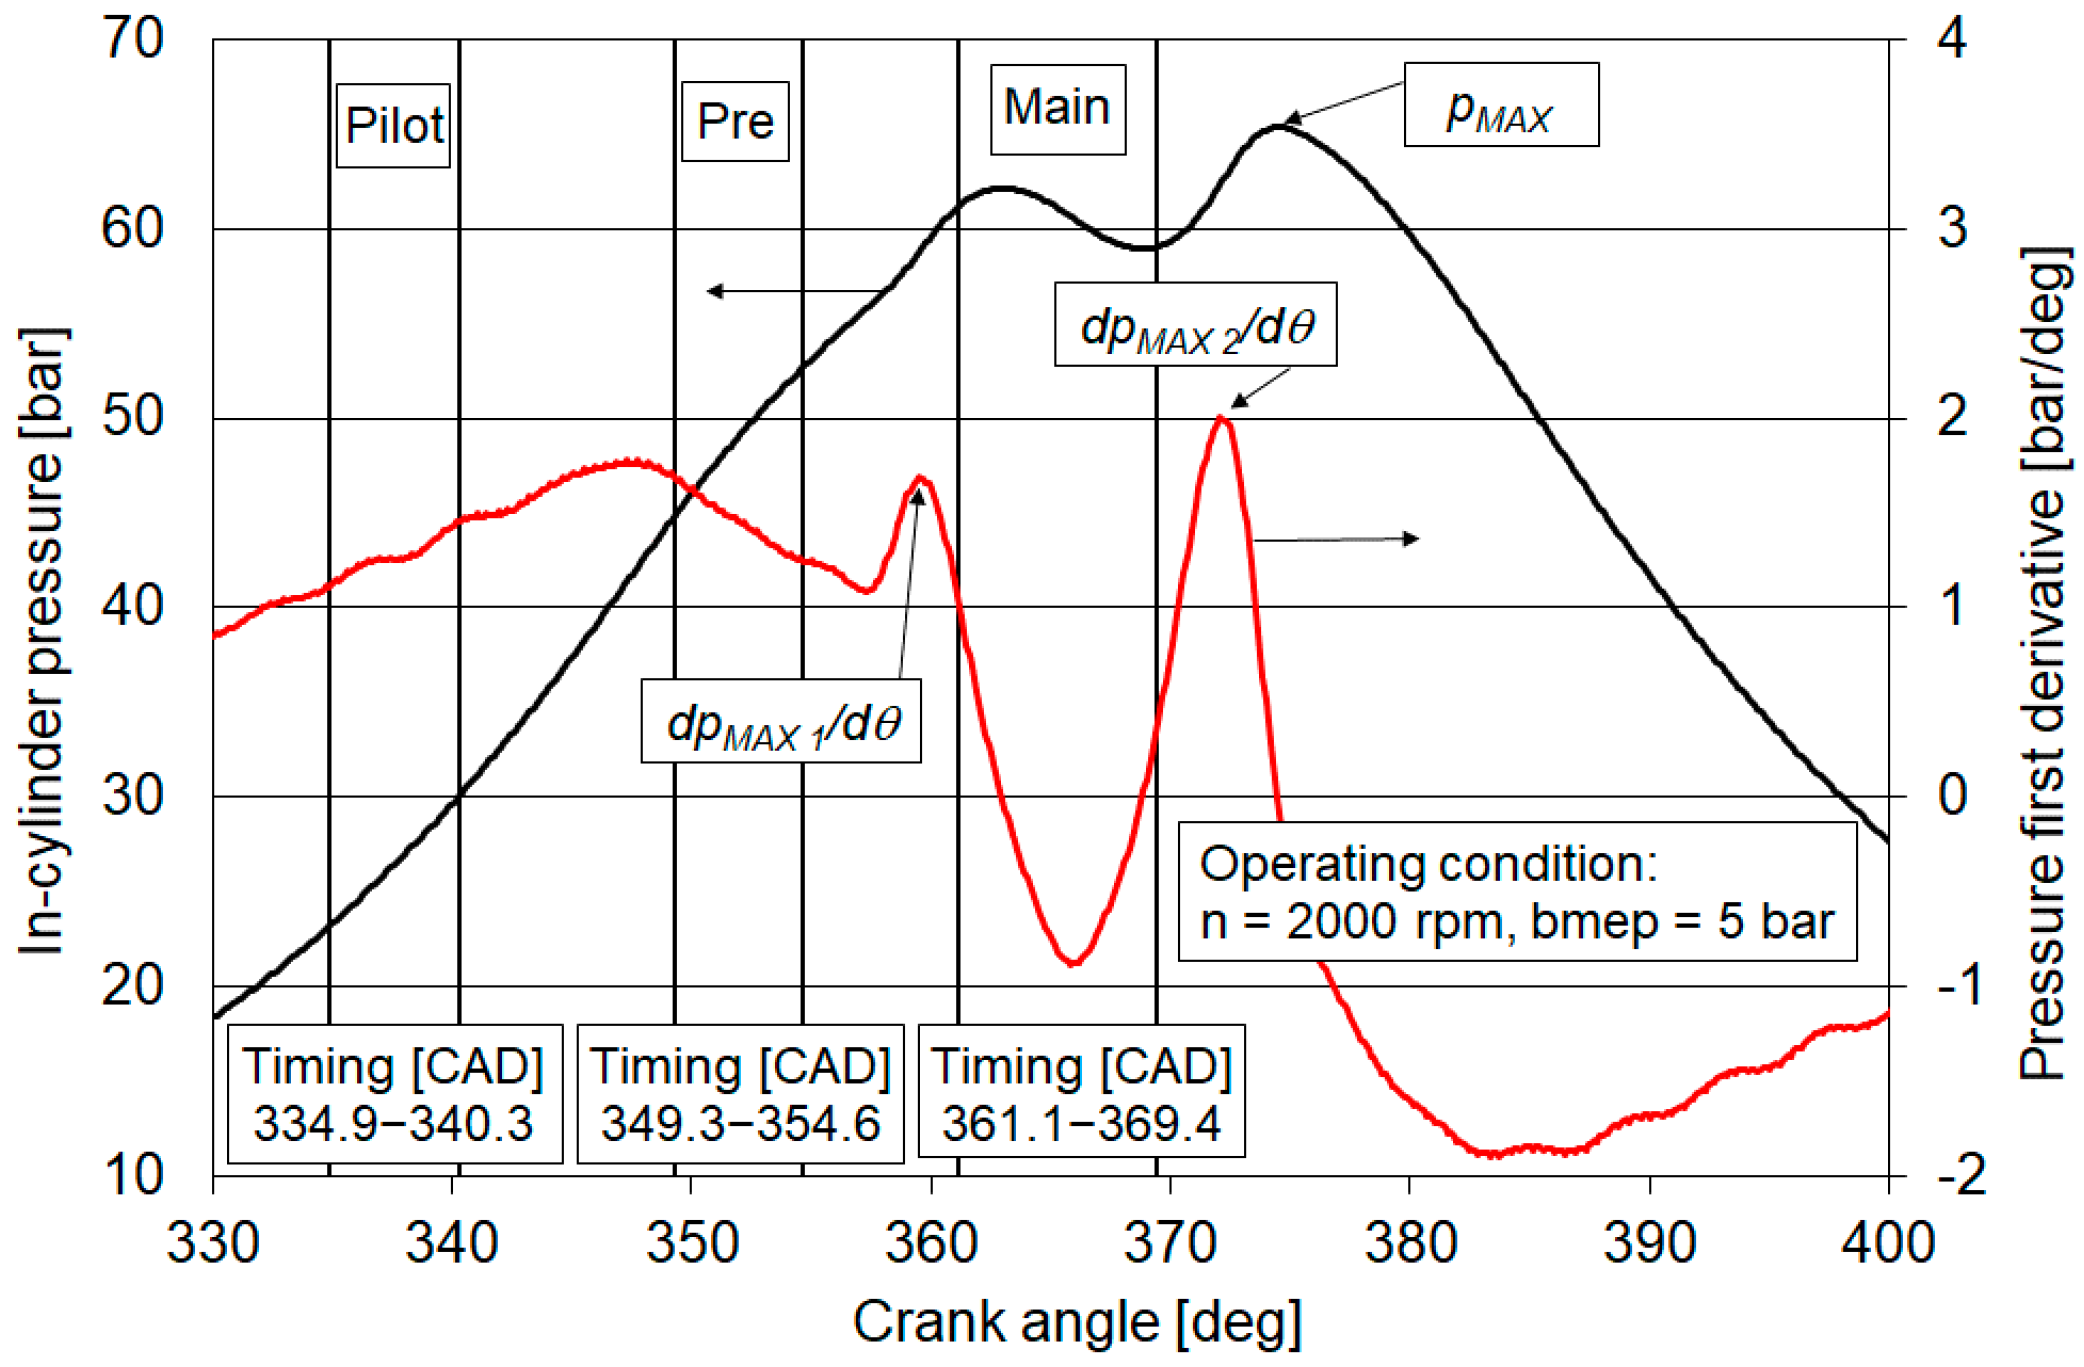
The availability of in-cylinder pressure sampled at high frequency and properly filtered, allowed the evaluation of the first derivative of in-cylinder pressure. As shown in Figure 1, it is therefore possible to identify two maximum levels of this signal, corresponding to the combustion of the pilot and pre injections (dpMAX 1/dθ) and of the main injection (dpMAX 2/dθ), respectively. Taking into account a further maximum value (dpMAX/dθ), obtained by the pressure derivative of the compression-expansion signal in the unfired engine at the same intake conditions, a combustion noise indicator In can be evaluated, according to the definition presented in [24] (Equation (6)):
where n is the engine speed of the tested condition and nidle is the engine speed in the idling mode.
In = n/nidle × [(dpMAX 1/dθ + dpMAX 2/dθ)/dpMAX/dθ],
Figure 2 presents actual timing of the three injections and the corresponding pressure trace. Two maximum values are apparent, the first related to the compression stroke and to the combustion of pilot and pre injections, and the second to the main combustion. This behavior, observed in automotive diesel engines since Euro 2/Euro 3 phases, is due to the shift of main injection timing towards or after the top dead center, aiming at NOX reduction and is common to all the tested conditions. Injection timings were kept constant at their standard levels in each operating point, as well as pilot and pre injected quantities and rail pressure (Table 2 and Table 3). It is also apparent that combustion TDC corresponds to a crank angle equal to 360 degrees, as the zero crank angle was fixed at the beginning of the intake stroke.
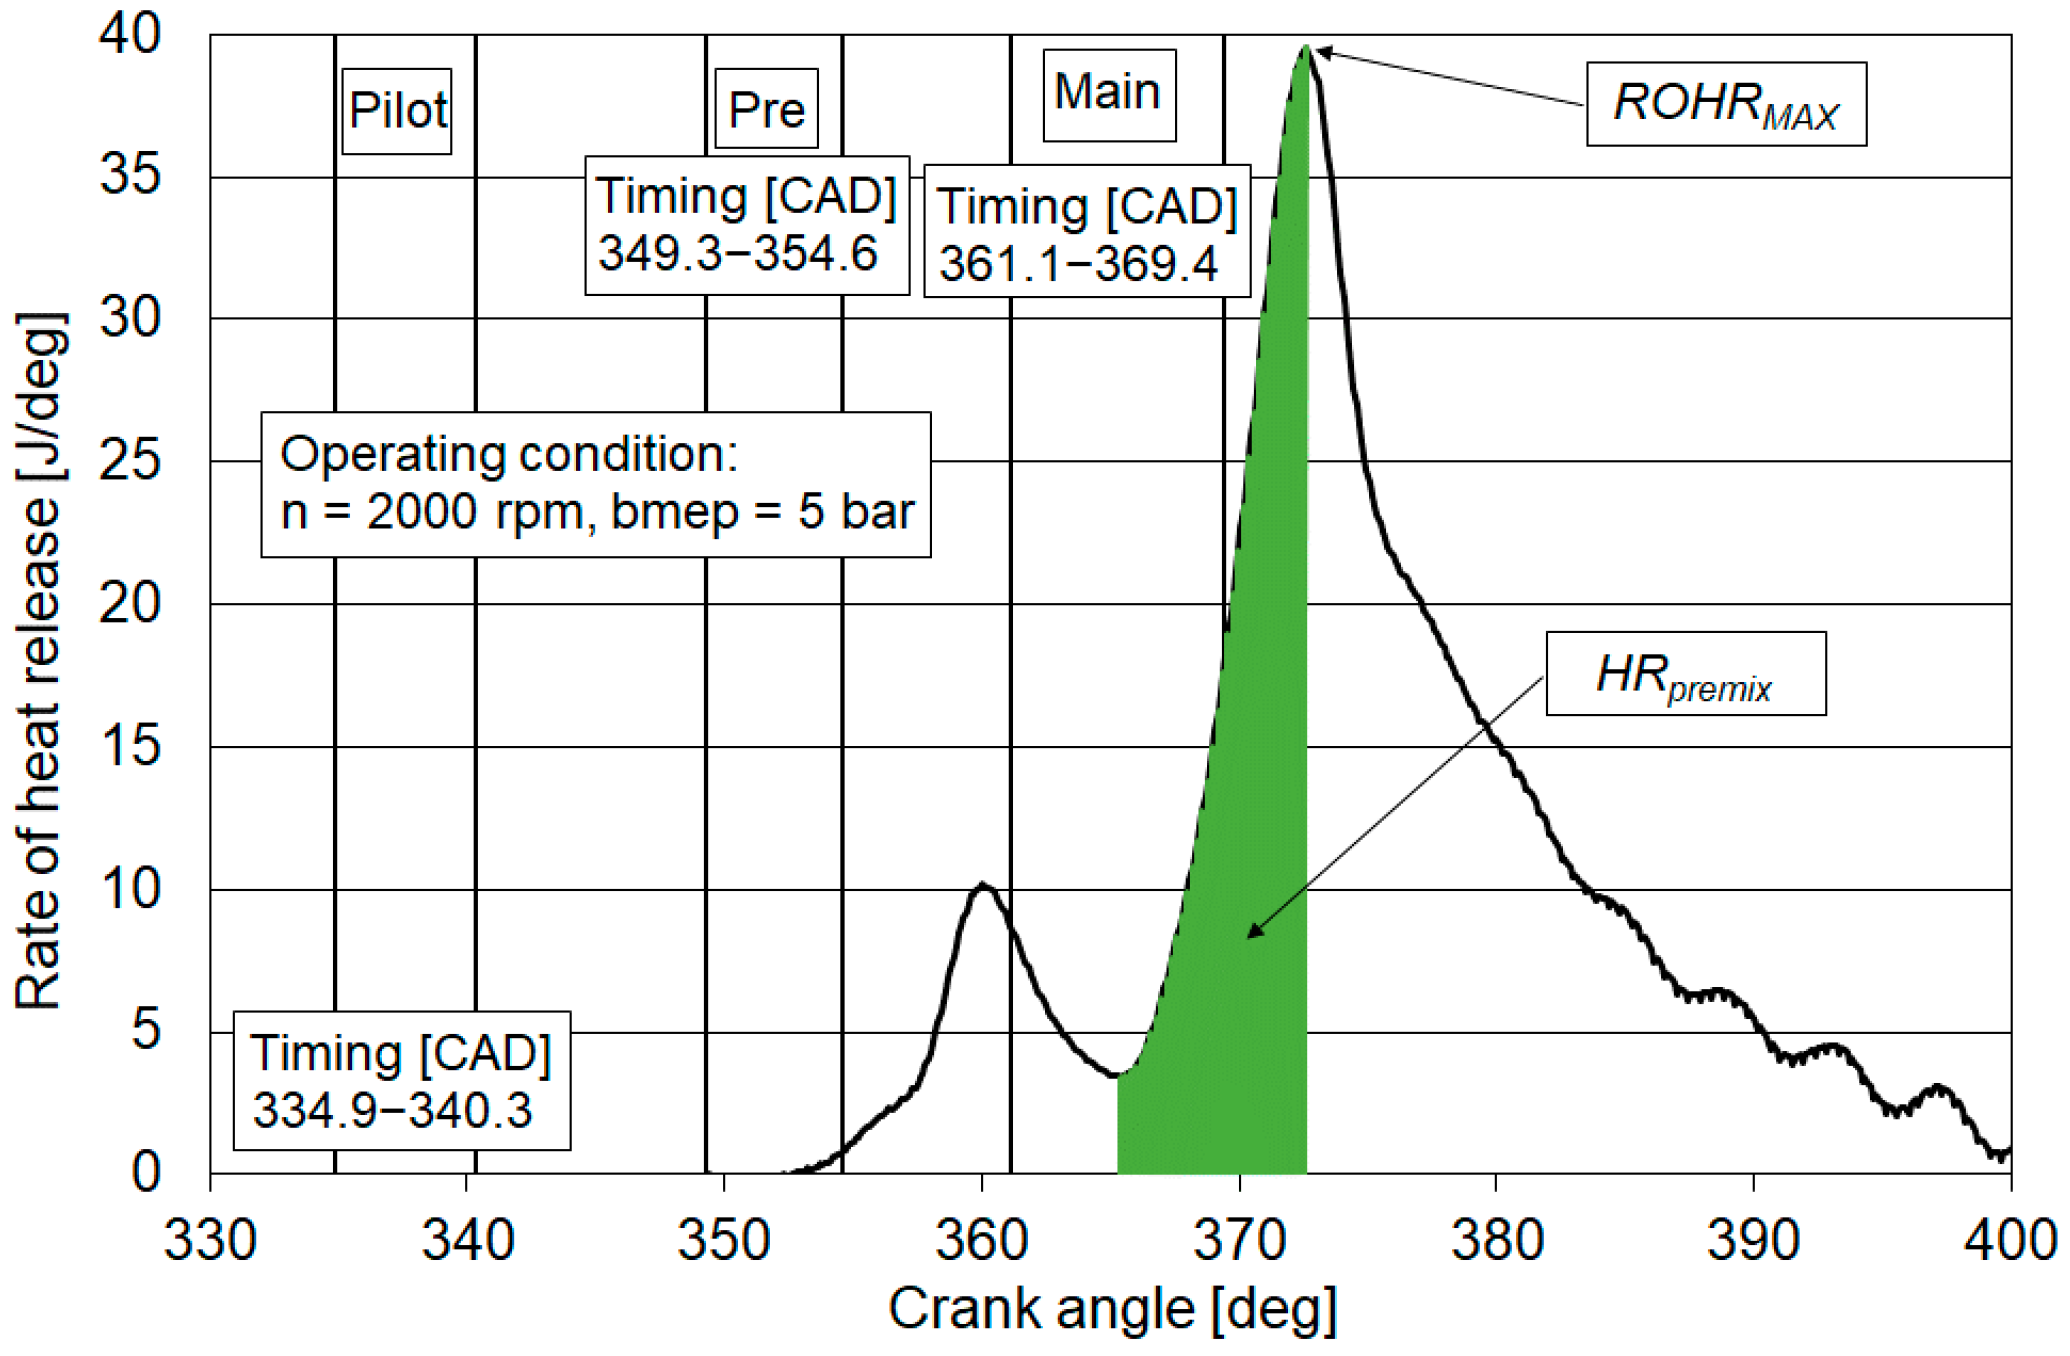
Two further parameters were obtained from the curves of rate of heat release, i.e., the maximum value of heat flux (ROHRMAX) and the heat released during the premixed phase of the main combustion (HRpremix), shown in Figure 3. HRpremix was computed according to Badami et al. [25], by calculating the heat released from the start of the main combustion up to the crank angle corresponding to ROHRMAX. The first value was conventionally positioned at the lowest level of heat release following the combustion of pilot and pre injections.
Finally, the identification of crank angles corresponding to the release of 10%, 50% and 90% of the total heat allowed to calculate two further parameters. The first (θ50) may be considered the center of combustion and is useful for its control [26], and the second (θ90 − θ10) represents an index of combustion duration, neglecting the initial and final phases, which may be affected by major uncertainties in the estimation of actual burning start and end angles.
2.5. Investigation Program
Three part load engine operating conditions were selected to define a large experimental database to explore the relationship between combustion parameters and engine operating, energy and environmental quantities. Low and medium levels of engine bmep and rotational speed n (respectively, 2, 5 and 8 bar; and 1500, 2000 and 2500 rpm) were tested, referring to operations frequently occurring in type approval and real world driving modes. In fact, if masses and gearbox ratios of cars belonging to the B and C-segment equipped with the tested engine are considered, points 1500 × 2 and 2000 × 5 are related to the average operations for speed levels between 30 and 90 km/h in the New European Driving Cycle, while point 2500 × 8 represents the extra-urban acceleration from 100 to 120 km/h.
For each working condition, different sets of experimental modes were investigated. As a first step, the standard high pressure EGR circuit was activated, applying a typical trade-off from zero up to a maximum EGR rate limited by a smoke emission of 3 Filter Smoke Number. Table 2 and Table 3 present control values for relative air–fuel ratio and the corresponding levels of the HP EGR valve duty-cycle, EGR rate and CDI. Engine temperature is also shown.
From the comparison of the two tables, the different turbine control schemes are also apparent, as at point No. 1 and No. 2 VNT opening degree is kept constant, resulting in variations of intake pressure pi. On the other hand, intake pressure is constant at point No. 3, requiring more closed settings of variable nozzle to achieve the target level when increasing EGR rate.
Following this step, a more complex program was developed, referring to the simultaneous activation of high and low pressure EGR loops and the integrated control of variable nozzle turbine. Different combinations of control variables (relative air–fuel ratio, throttle valve position in the exhaust circuit, LP EGR valve opening degree, VNT opening degree/intake pressure) were applied in the three operating conditions, as shown in Table 4 [17]. The last two variables were alternatively used, the first if the open control scheme was followed for the VNT management (in 1500 × 2 and 2000 × 5 working points), and the second for the closed loop strategy in 2500 × 8 condition. The number of experimental sets was, respectively, equal to 8 (1500 × 2), 5 (2000 × 5) and 6 (2500 × 8). Each of them was generally based on a number of points ranging between 4 and 6.
Referring to the management of the throttle valve at the exhaust end, setting 1 was fixed to reproduce pressure level at the turbine exit if a regenerated Diesel Particulate Filter (DPF) was available. Positions 2 and 3 corresponded to more closed settings, aiming at the increase of mass flow rate from the LP EGR circuit, while TV was more opened in setting 0.
Table 5 lists the variation ranges of control variables and engine operating parameters for the three operating conditions. For points No. 1 and No. 2, three levels of VNT opening degree were applied, according to the open loop control scheme. On the other hand, in point No. 3, three intake pressure values were considered and AVNT was managed by the ECU in the reported interval to achieve the selected targets.
3. Results and Discussion
In this section, the most significant outcomes of the experimental database processing, including average engine quantities, in-cylinder pressure diagrams, heat release curves and combustion parameters, are presented and discussed. The aim was to verify expected relationships in order to validate observed data and to predict further correlations, which may be helpful in modeling engines and the relevant sub-systems, also with a view to develop design of experiment procedures and control strategies. Taking into account these goals, only linear correlations were tested to limit computational effort and to simplify the function inversion, if required for modeling or control purposes. Of course, internal combustion engines are far from being “linear” systems, but if the number of involved parameters and their range is reduced, a local simplification can be attained. The same approach was discussed in [27] and adopted in [28] for control purposes. On the other hand, many variables were considered in this step. Therefore, the selection of correlations type was restricted to limit processing time and to allow an overall comparison between observed links.
Discussion starts from an overview on the influence of EGR systems and VNT control on pressure diagrams and heat release curves. Then, the analysis is referred to four groups, the first one being related to the influence of Charge Dilution Index on different quantities. The second group considers the effects of heat released in premixed phase of the main combustion. Different relationships involving pressure derivative and combustion noise indicator are then assessed. Finally, the influence of the center of combustion position is discussed.
Figures present trends referred to the sets measured in the first phase (HP EGR trade-off) and in the second phase (HP and LP EGR + VNT control) of the experimental program. As a large number of curves investigated in the second step was available [16,17], the best set was chosen according to the highest determination coefficient. In any case, a threshold of 0.7 for R2 was fixed for this selection, with a few exceptions.
3.1. Trends of Pressure Diagrams and Heat Release Curves
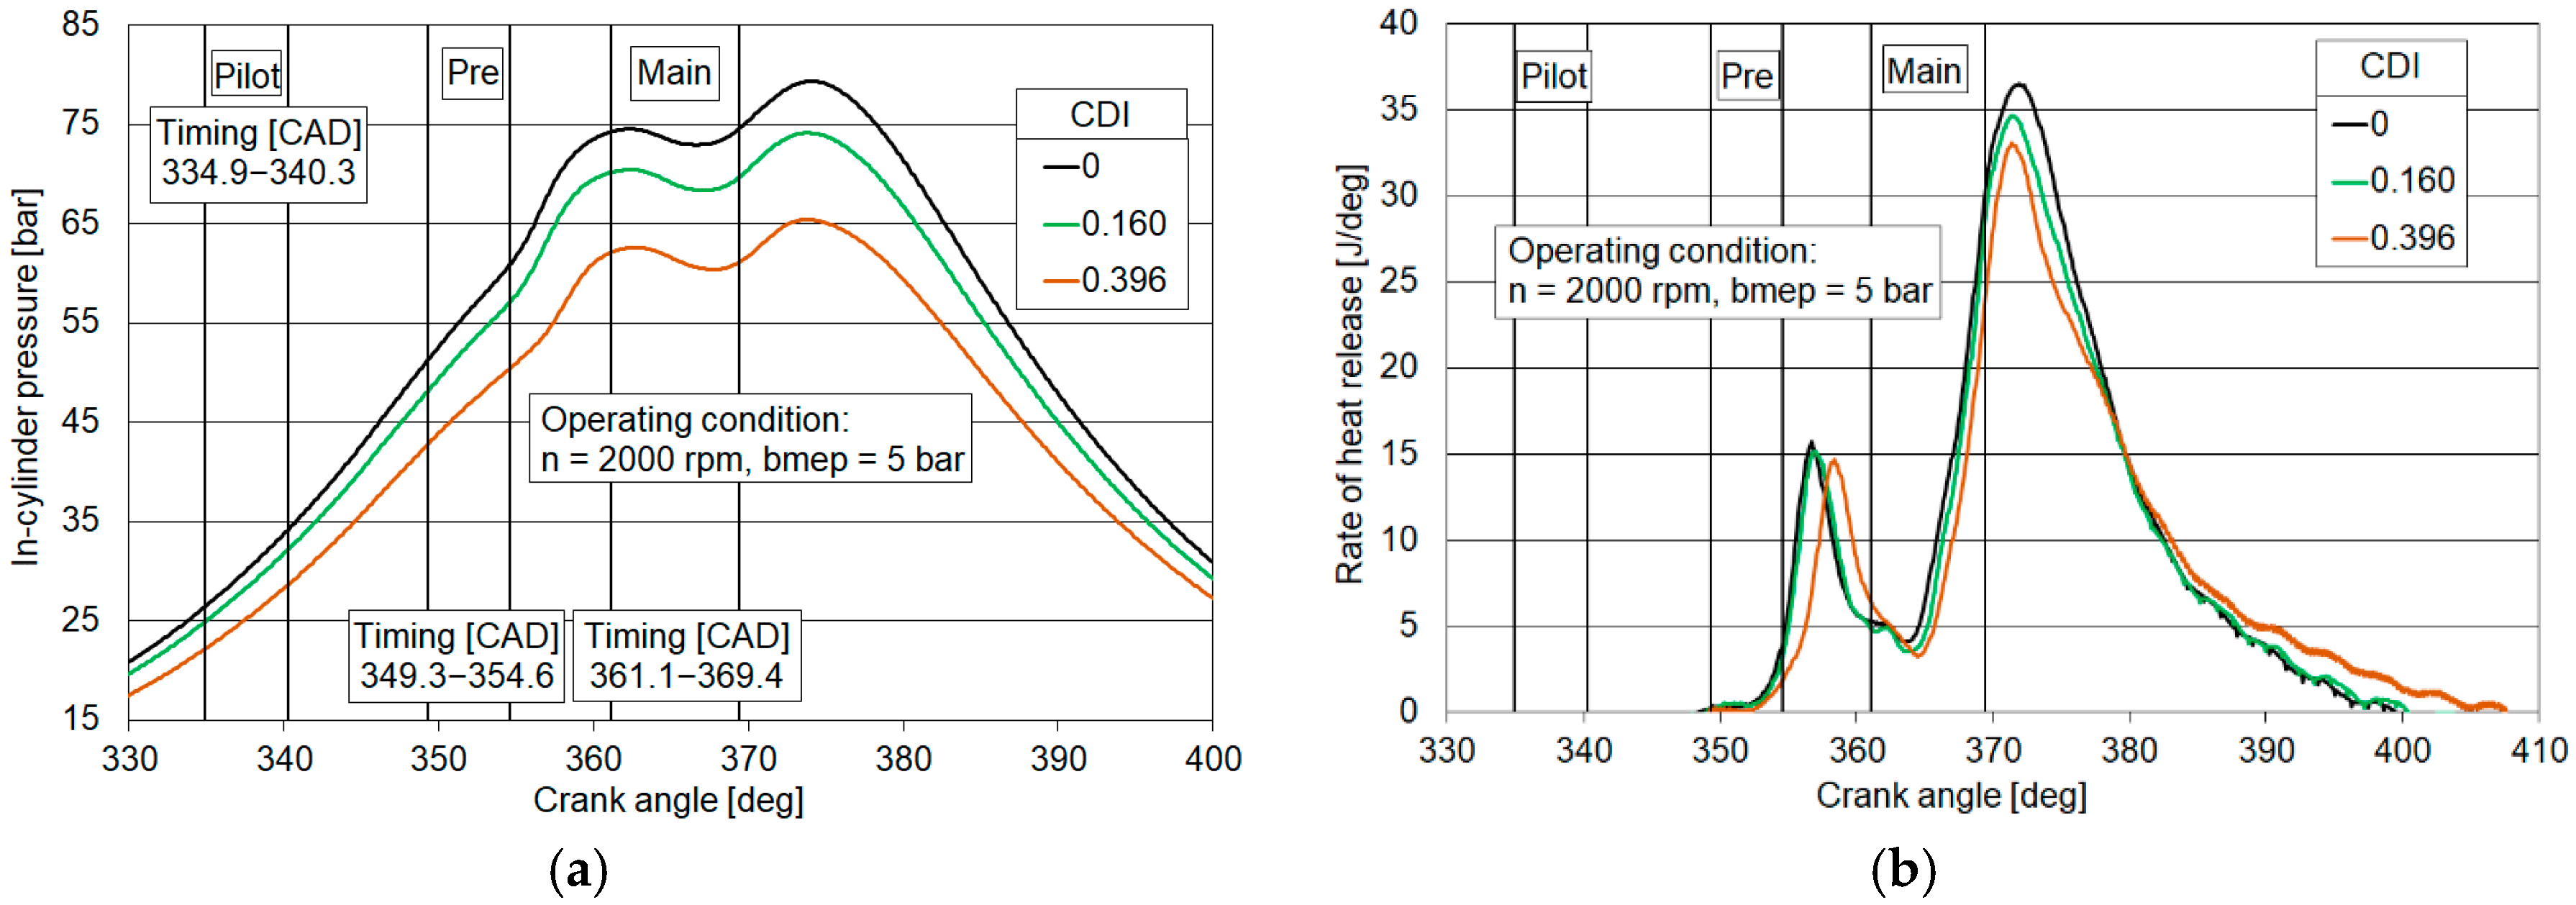
Figure 4 presents the behavior of pressure diagrams and heat release when controlling EGR rate from the HP circuit in operating condition No. 2, for three selected modes listed in Table 2. Due to the reduction of intake pressure and mass flow rate, in-cylinder pressure was reduced through the whole compression stroke and during the combustion, with a lower maximum level. Due to the decrease of oxygen availability, an extended ignition delay was apparent from heat release curves when increasing the EGR rate, referring both to the combustion of pilot and pre injected quantities and of main injection event. The influence of intake oxygen concentration on ignition delay was quantified in [29], adding a proper term (XO2 i −1.2) to the typical correlation including pressure and temperature. It is interesting to outline the significant variations of XO2 i (estimated around 17.8% for CDI = 0.396) and intake mass flow rate (=92.2 kg/h in this condition, against a level of 106.5 kg/h without EGR, i.e., −13.4%).
On the other hand, intake quantities had counteracting effects on ignition delay, as reduced levels of pressure and increased values of temperature were observed (Table 2).
Further effects were related to a reduction in maximum level of heat release ROHRMAX and to a longer combustion process, especially for the highest CDI value. Anyway, only a qualitative evaluation was possible, while values of HRpremix, θ50 and θ90 − θ10 had to be evaluated for a more detailed analysis.
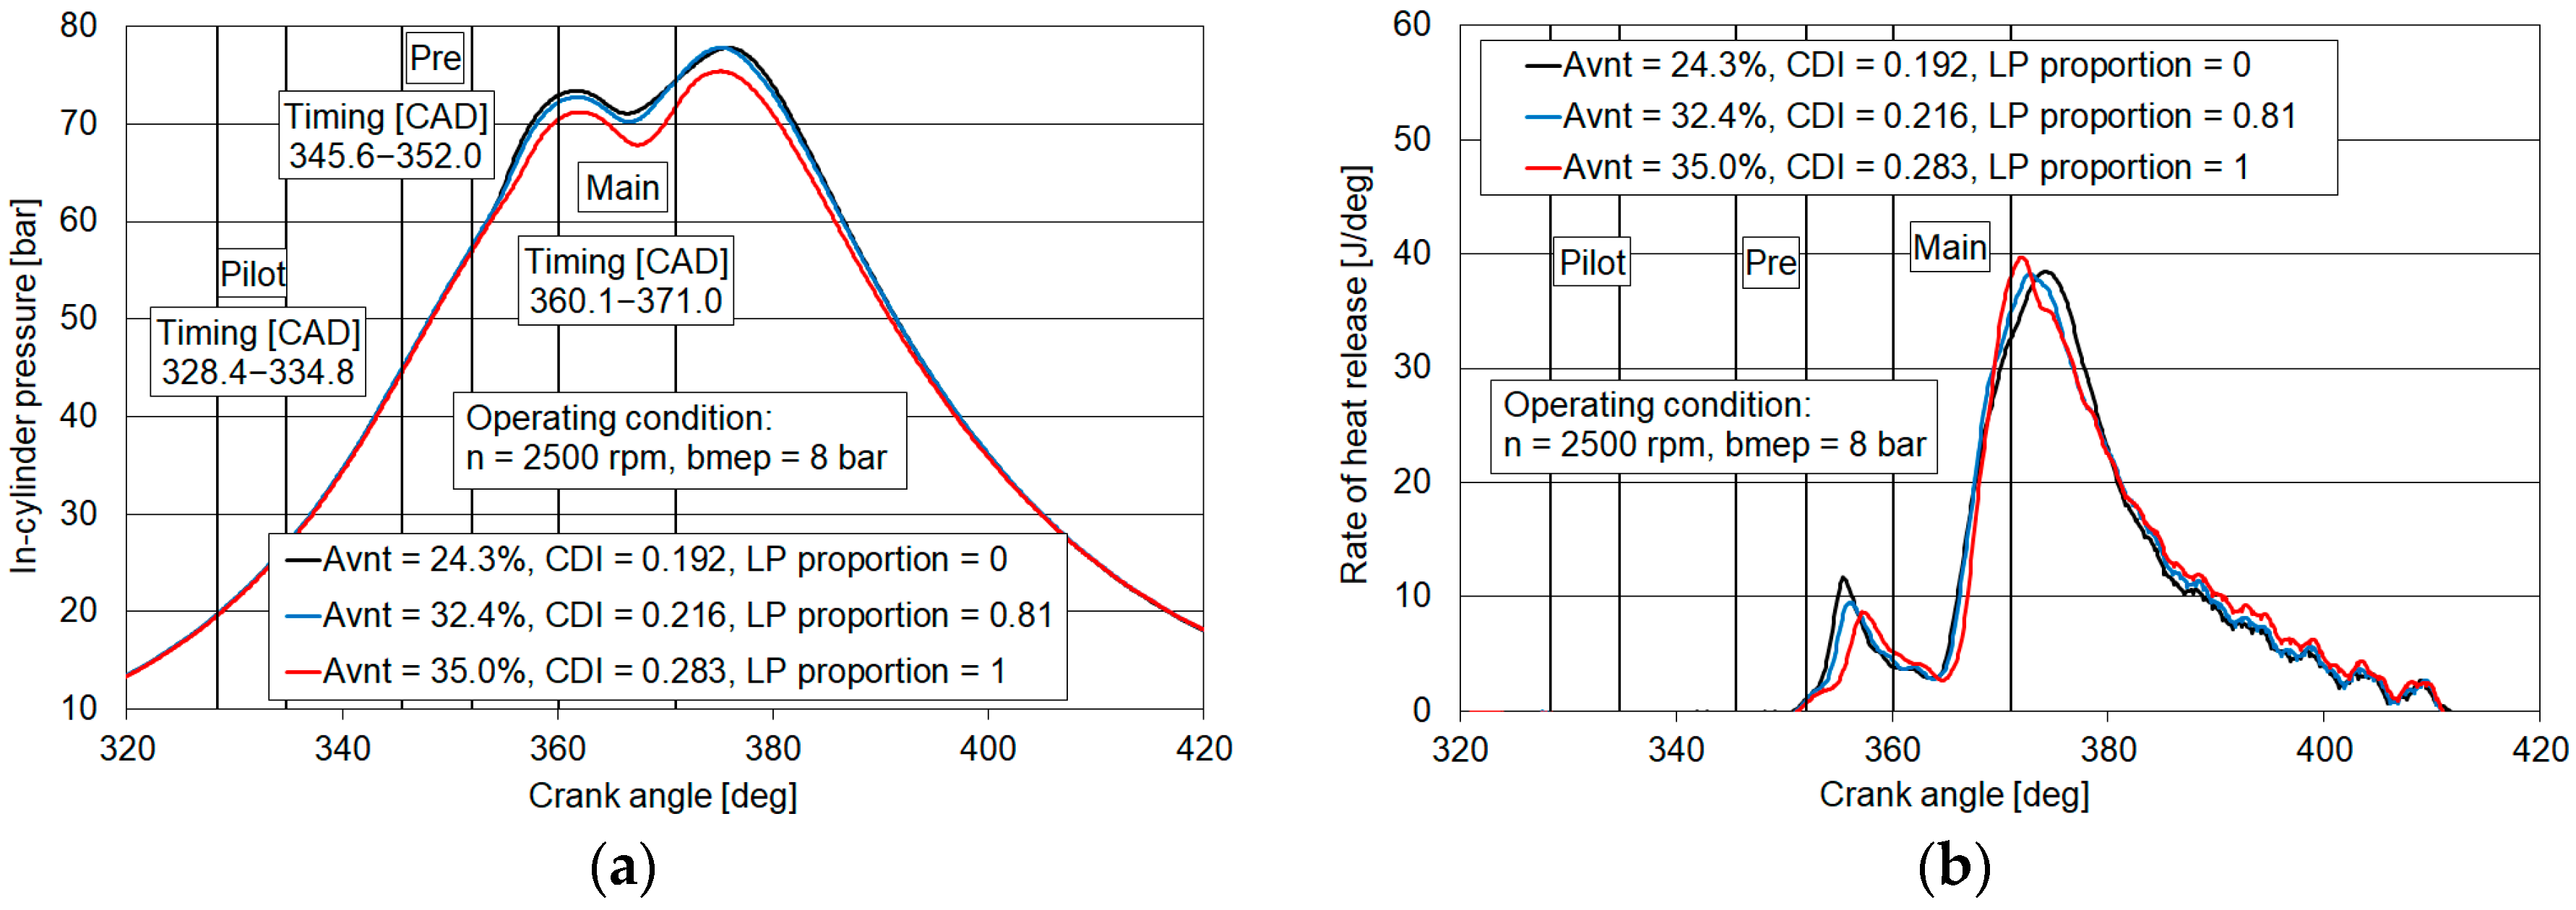
An example of in-cylinder pressure and heat release behavior when controlling dual EGR loop and VNT is presented in Figure 5 referring to operating condition No. 3. The three modes were characterized by increasing levels of VNT opening, and CDI and LP contribution to overall EGR rate. Consequently, intake mass flow rate presented only a slight reduction (−3.5%) when LP contribution was equal to 1, compared to the baseline mode with only HP EGR, despite the increase of AVNT and EGR rate. Furthermore, intake pressure was kept constant by the closed loop control of the turbine. Therefore, pressure curves were quite close in the three modes, with a 3.1% reduction of pMAX in the third case.
On the other hand, heat release curves showed the same influence on ignition delay previously outlined. In this case, the decrease in intake temperature when switching from HP to LP EGR played a major role, as also discussed in [13,14], while absolute variation of intake oxygen concentration between the first and the third mode was around 1%, suggesting a minor influence. The main combustion outlined a different development, with slightly higher level of ROHRMAX, which may be related to the better mixing between air and recirculated gases occurring in the longer low pressure circuit [30]. Again, further analysis has to be supported by the calculation of the whole set of combustion parameters.
3.2. Influence of Charge Dilution Index
According to its definition (Equation (5)), this parameter represents a non-dimensional EGR rate, through normalization with the engine load.
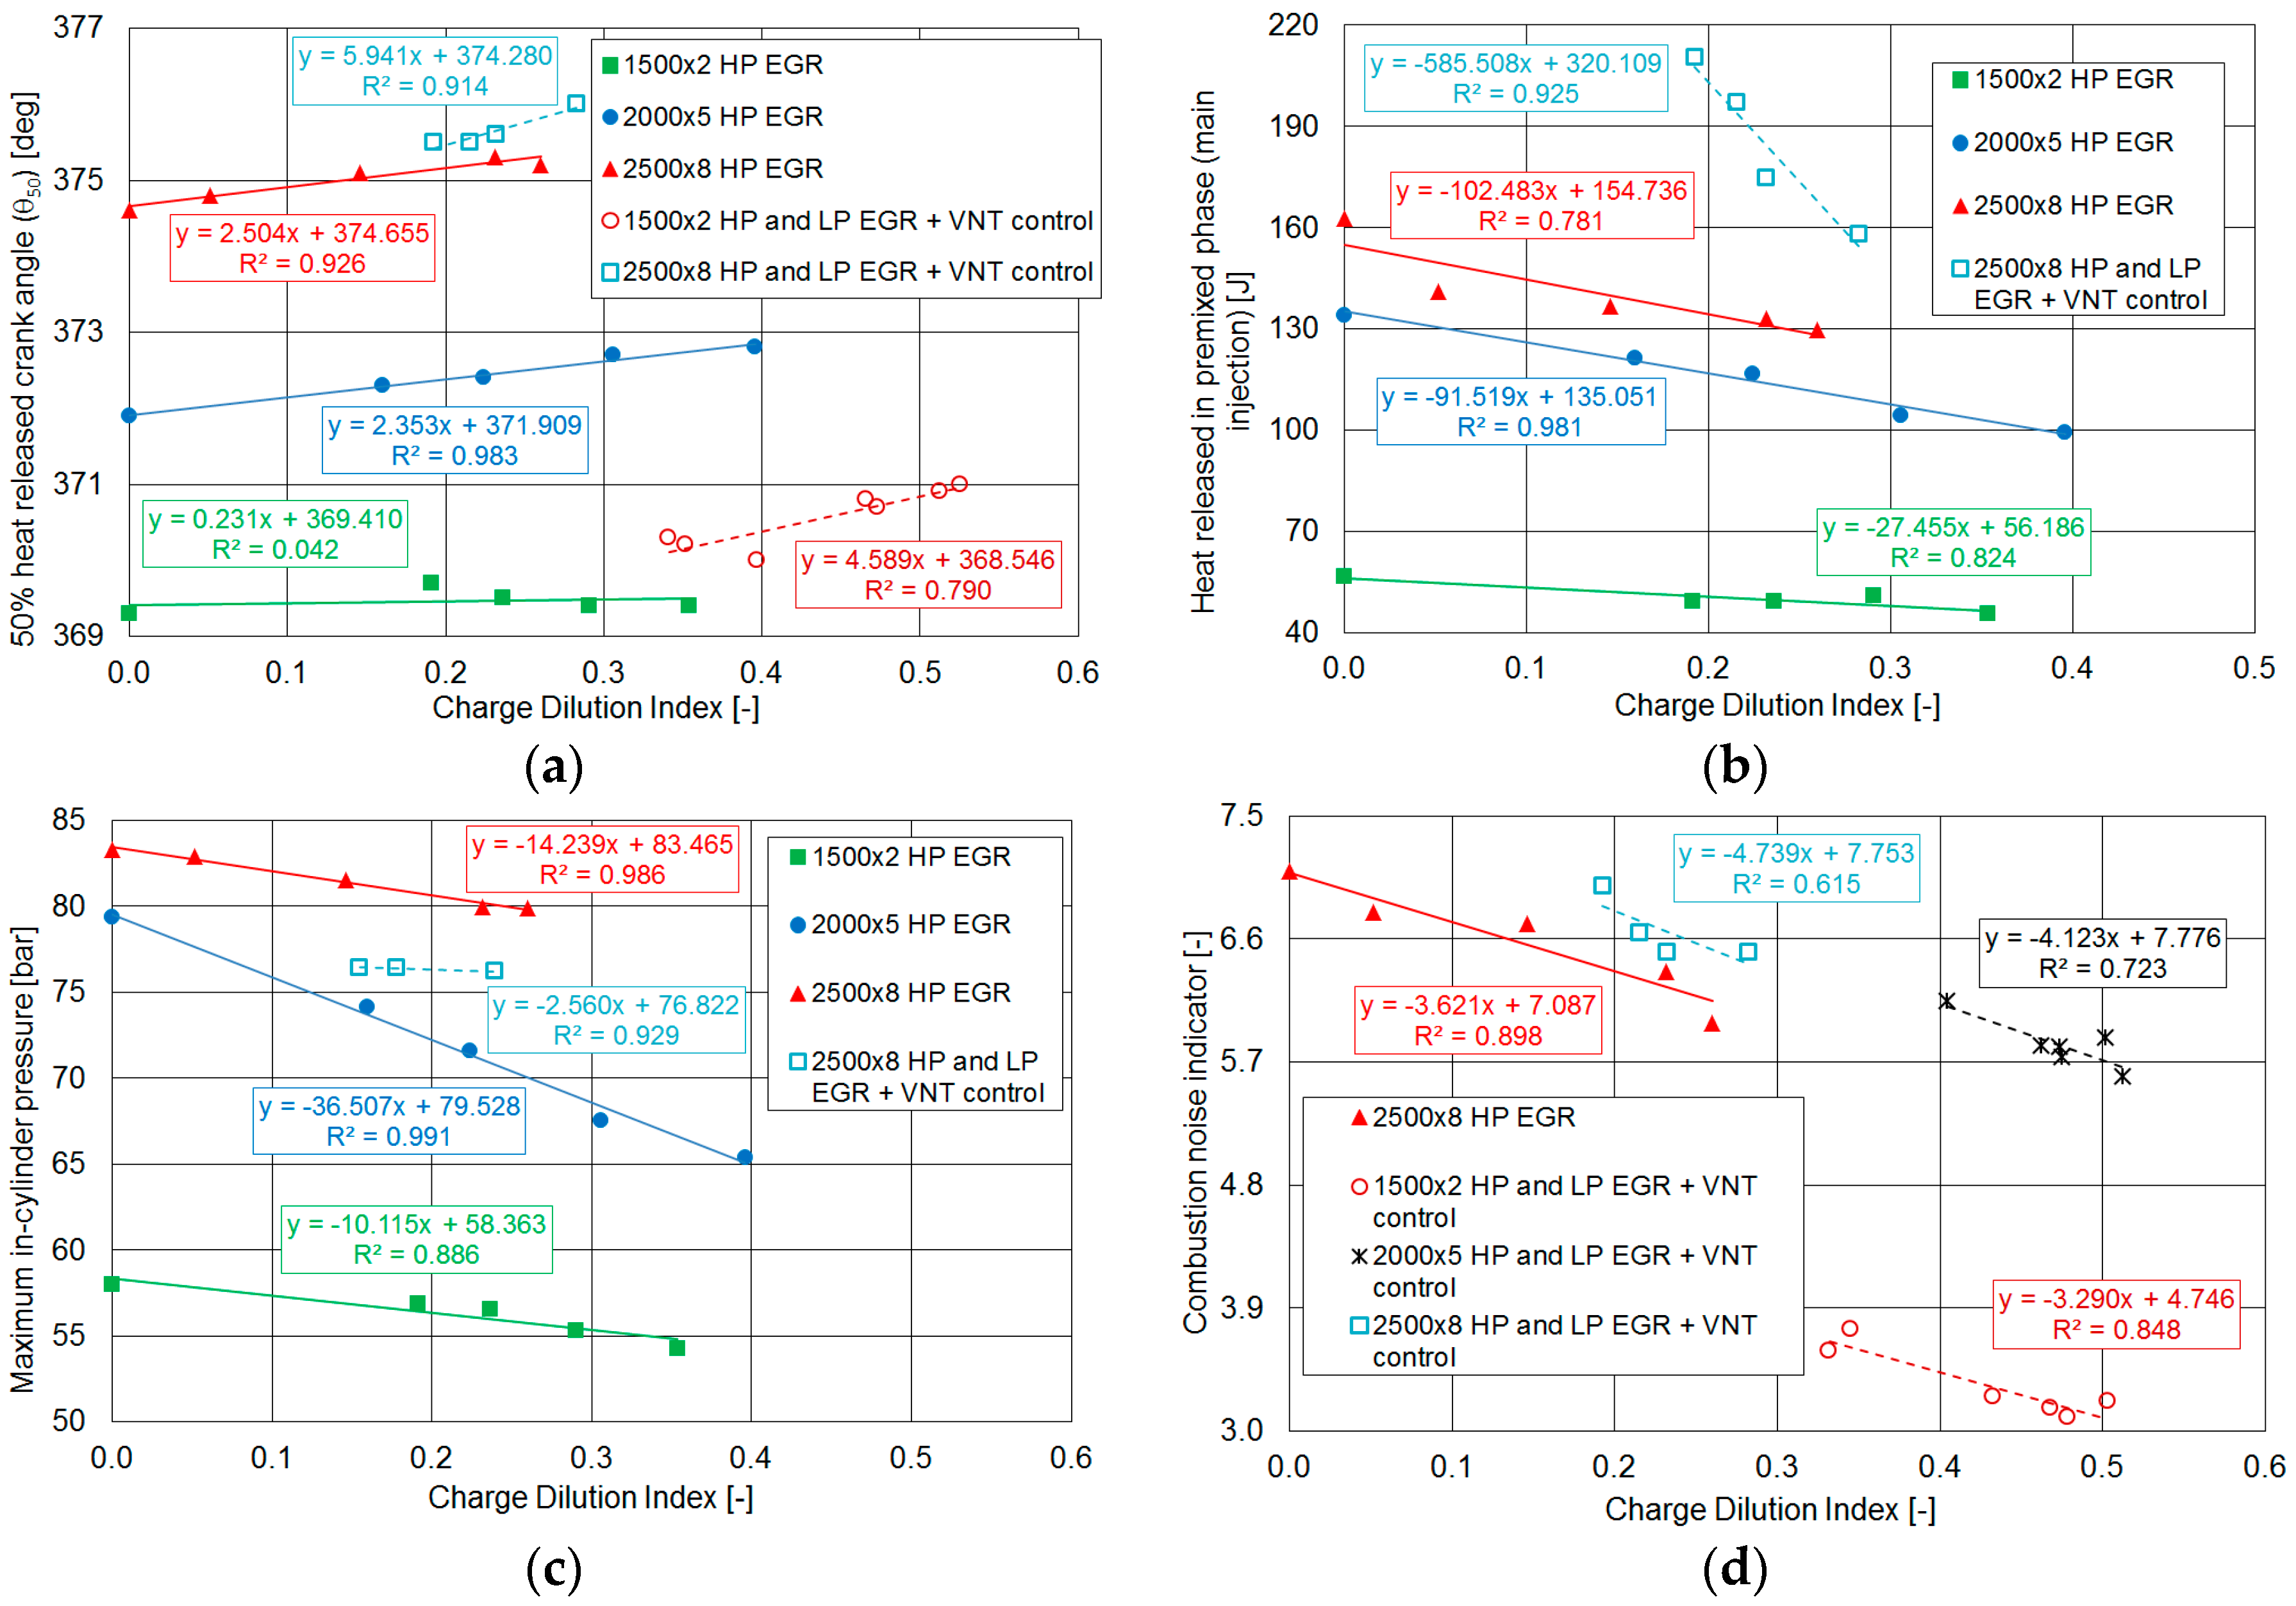
Figure 6a shows the link between CDI and the 50% heat released crank angle. The shift of θ50 along the expansion stroke was related to the extended duration of the combustion process caused by EGR increase. A limited effect was apparent in operating point 1500 × 2, when only the high pressure circuit was activated. This is probably due to minor variations in intake pressure and mass flow rate and, consequently, in pressure diagrams of the different tested modes. A clear influence was outlined in all other conditions.
Figure 6b presents the influence of CDI on heat released in premixed phase of the main combustion. As outlined in the previous section, the increase of EGR rate led to slower combustion process due to the dilution effect, also reducing heat released in the premixed phase, despite of the extended ignition delay. This was compensated in the following diffusive burning phase [2], which may also lead to higher soot oxidation, as discussed in [31]. From this graph, it can be seen that it was more difficult to find valid correlation when applying integrated control of variable nozzle turbine, high and low pressure EGR circuits. This is due to the counteracting influence of these sub-systems on intake pressure and mass flow rate. On one side, HP EGR and VNT control resulted in a reduction of these parameters, while LP EGR activation and increase led to their rise. The prevailing effect depended on engine operating condition and applied mode [16,17]. A simpler behavior was observed in point 2500 × 8, where VNT closed loop control was applied, thus resulting in a major contribution from LP EGR circuit and in a univocal effect of turbine opening degree [16,17].
Similar considerations can be applied to the link between CDI and maximum in-cylinder pressure, presented in Figure 6c. A clear reduction was observed in HP EGR trade-off, due to the decrease of intake quantities. When switching to the more complex control strategies involving three sub-systems, correlations were hardly found. This outcome is in line with the analysis of Figure 3a and Figure 4a.
A different behavior is shown by the relationship between CDI and combustion noise indicator, depicted in Figure 6d, as better fitting was shown by sets obtained in the second phase of the investigation. A reduction in combustion noise was apparent when increasing EGR rate, due to the influence of recirculated gases on the combustion development. Taking into account that a similar EGR influence on combustion noise was presented in different investigations [32,33,34], this result proves that In can be used as an indicator to analyze noise issues.
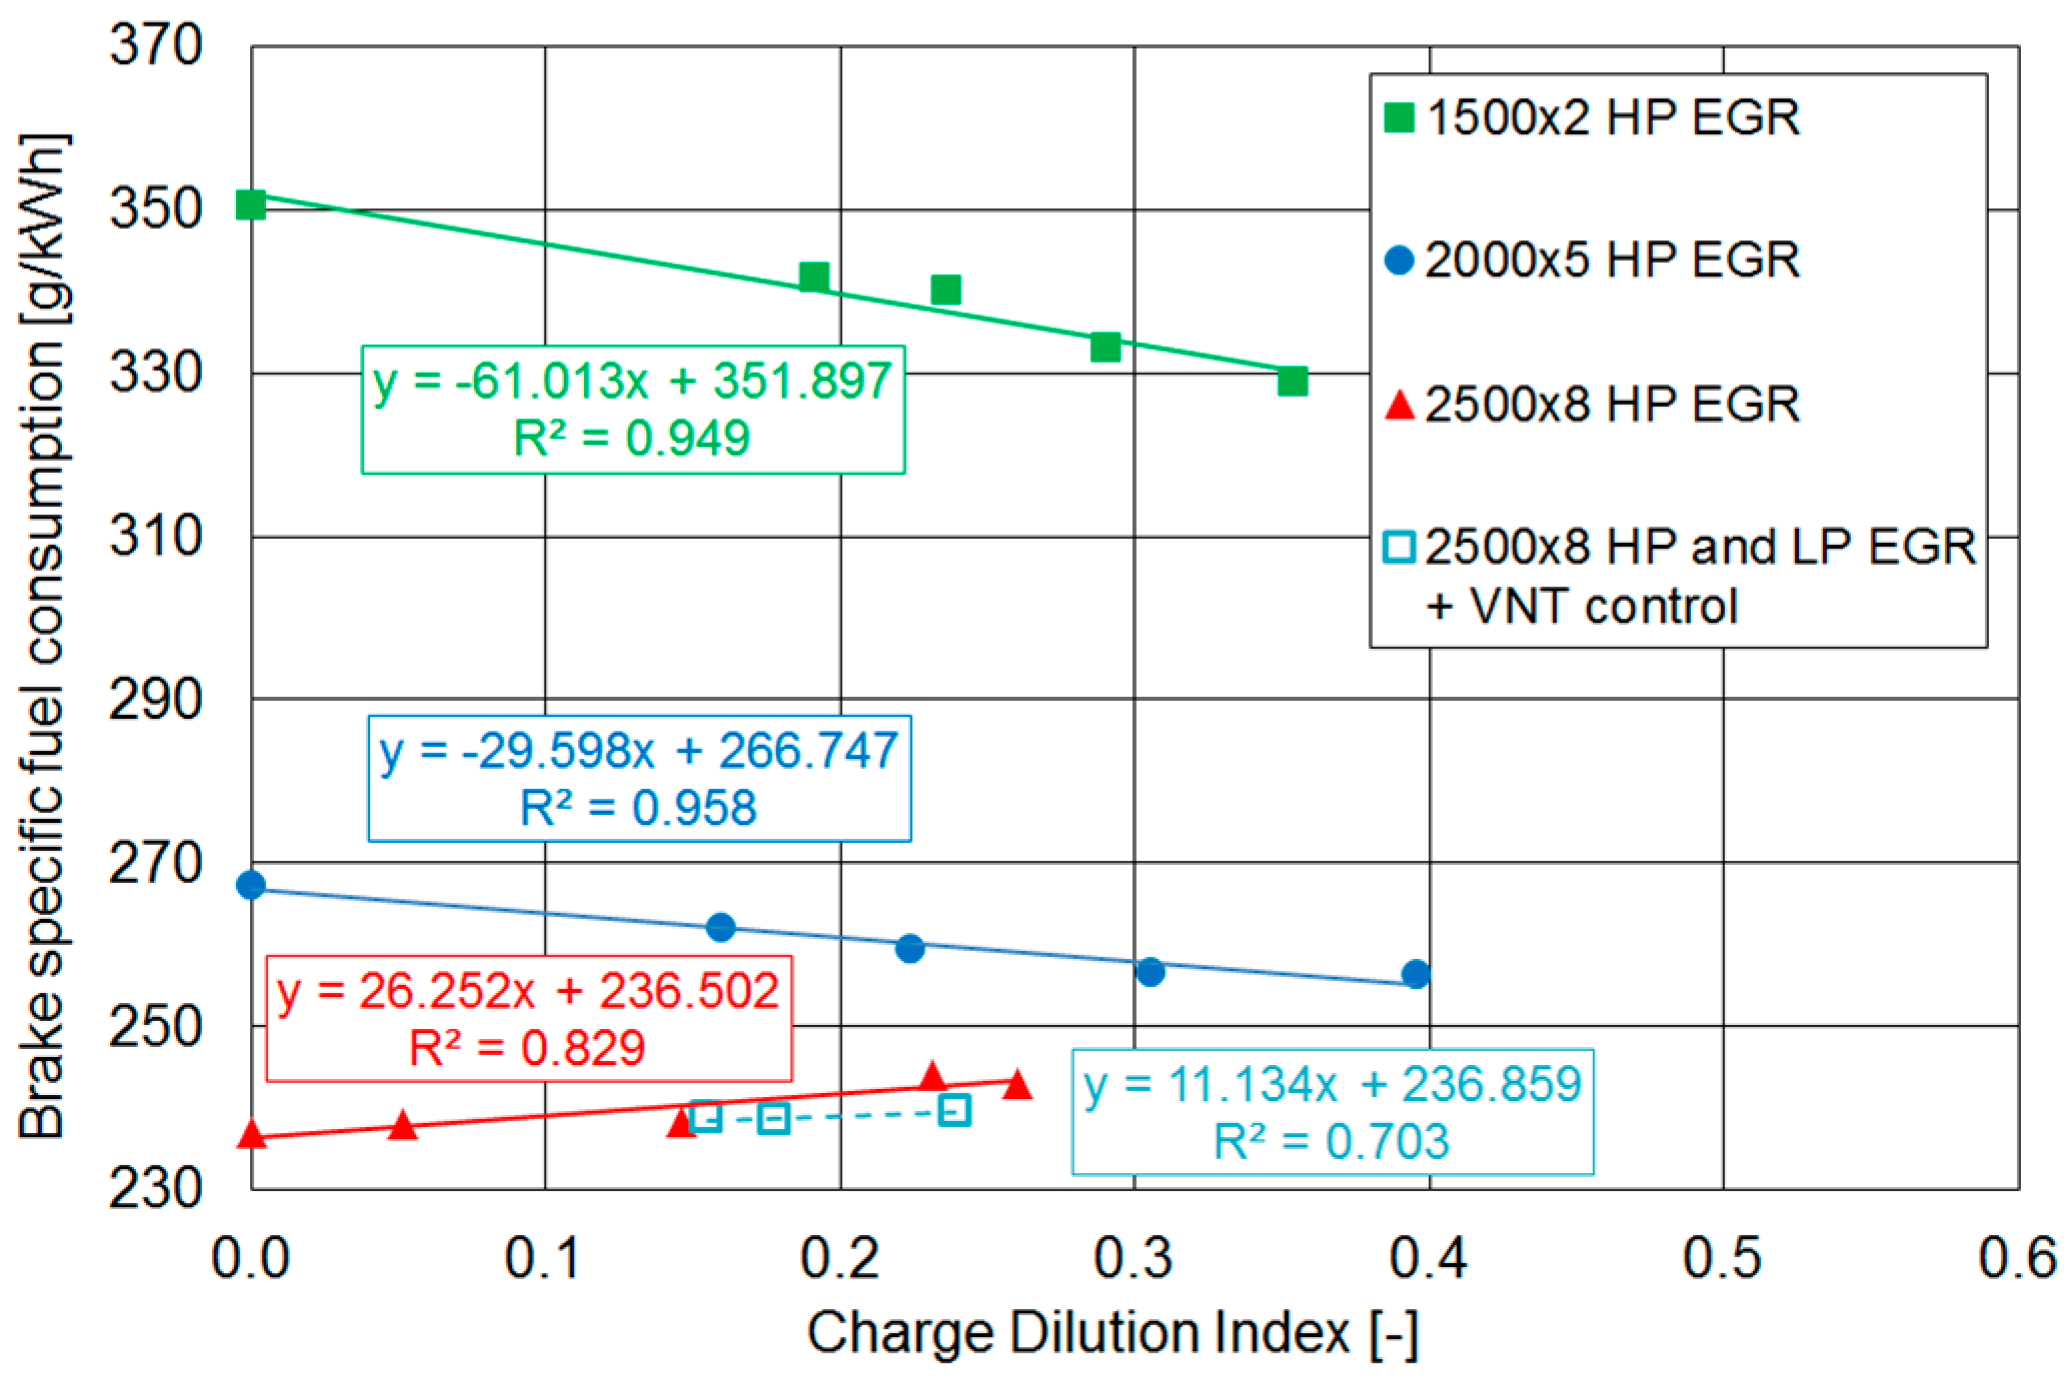
Figure 7 and Figure 8 present the influence of CDI on fuel consumption and emissions. As far as brake specific fuel consumption (bsfc) is concerned, differences are apparent in Figure 7 when VNT open or closed loop control scheme was applied.
In the first case (operating conditions 1500 × 2 and 2000 × 5), the increase of CDI resulted in a reduction of engine pressure gradient and pumping losses, leading to better bsfc. For VNT closed loop control, minor changes in these parameters were observed. Therefore, the shift of the combustion center along the expansion stroke and the longer duration of combustion may justify the increase of fuel consumption. Anyway, at point No. 3 observed variations were around 2.5% when controlling HP EGR circuit and well below the measurement uncertainty (0.3% against 1.5% [16]) in the second type of tests (HP + LP + VNT control).
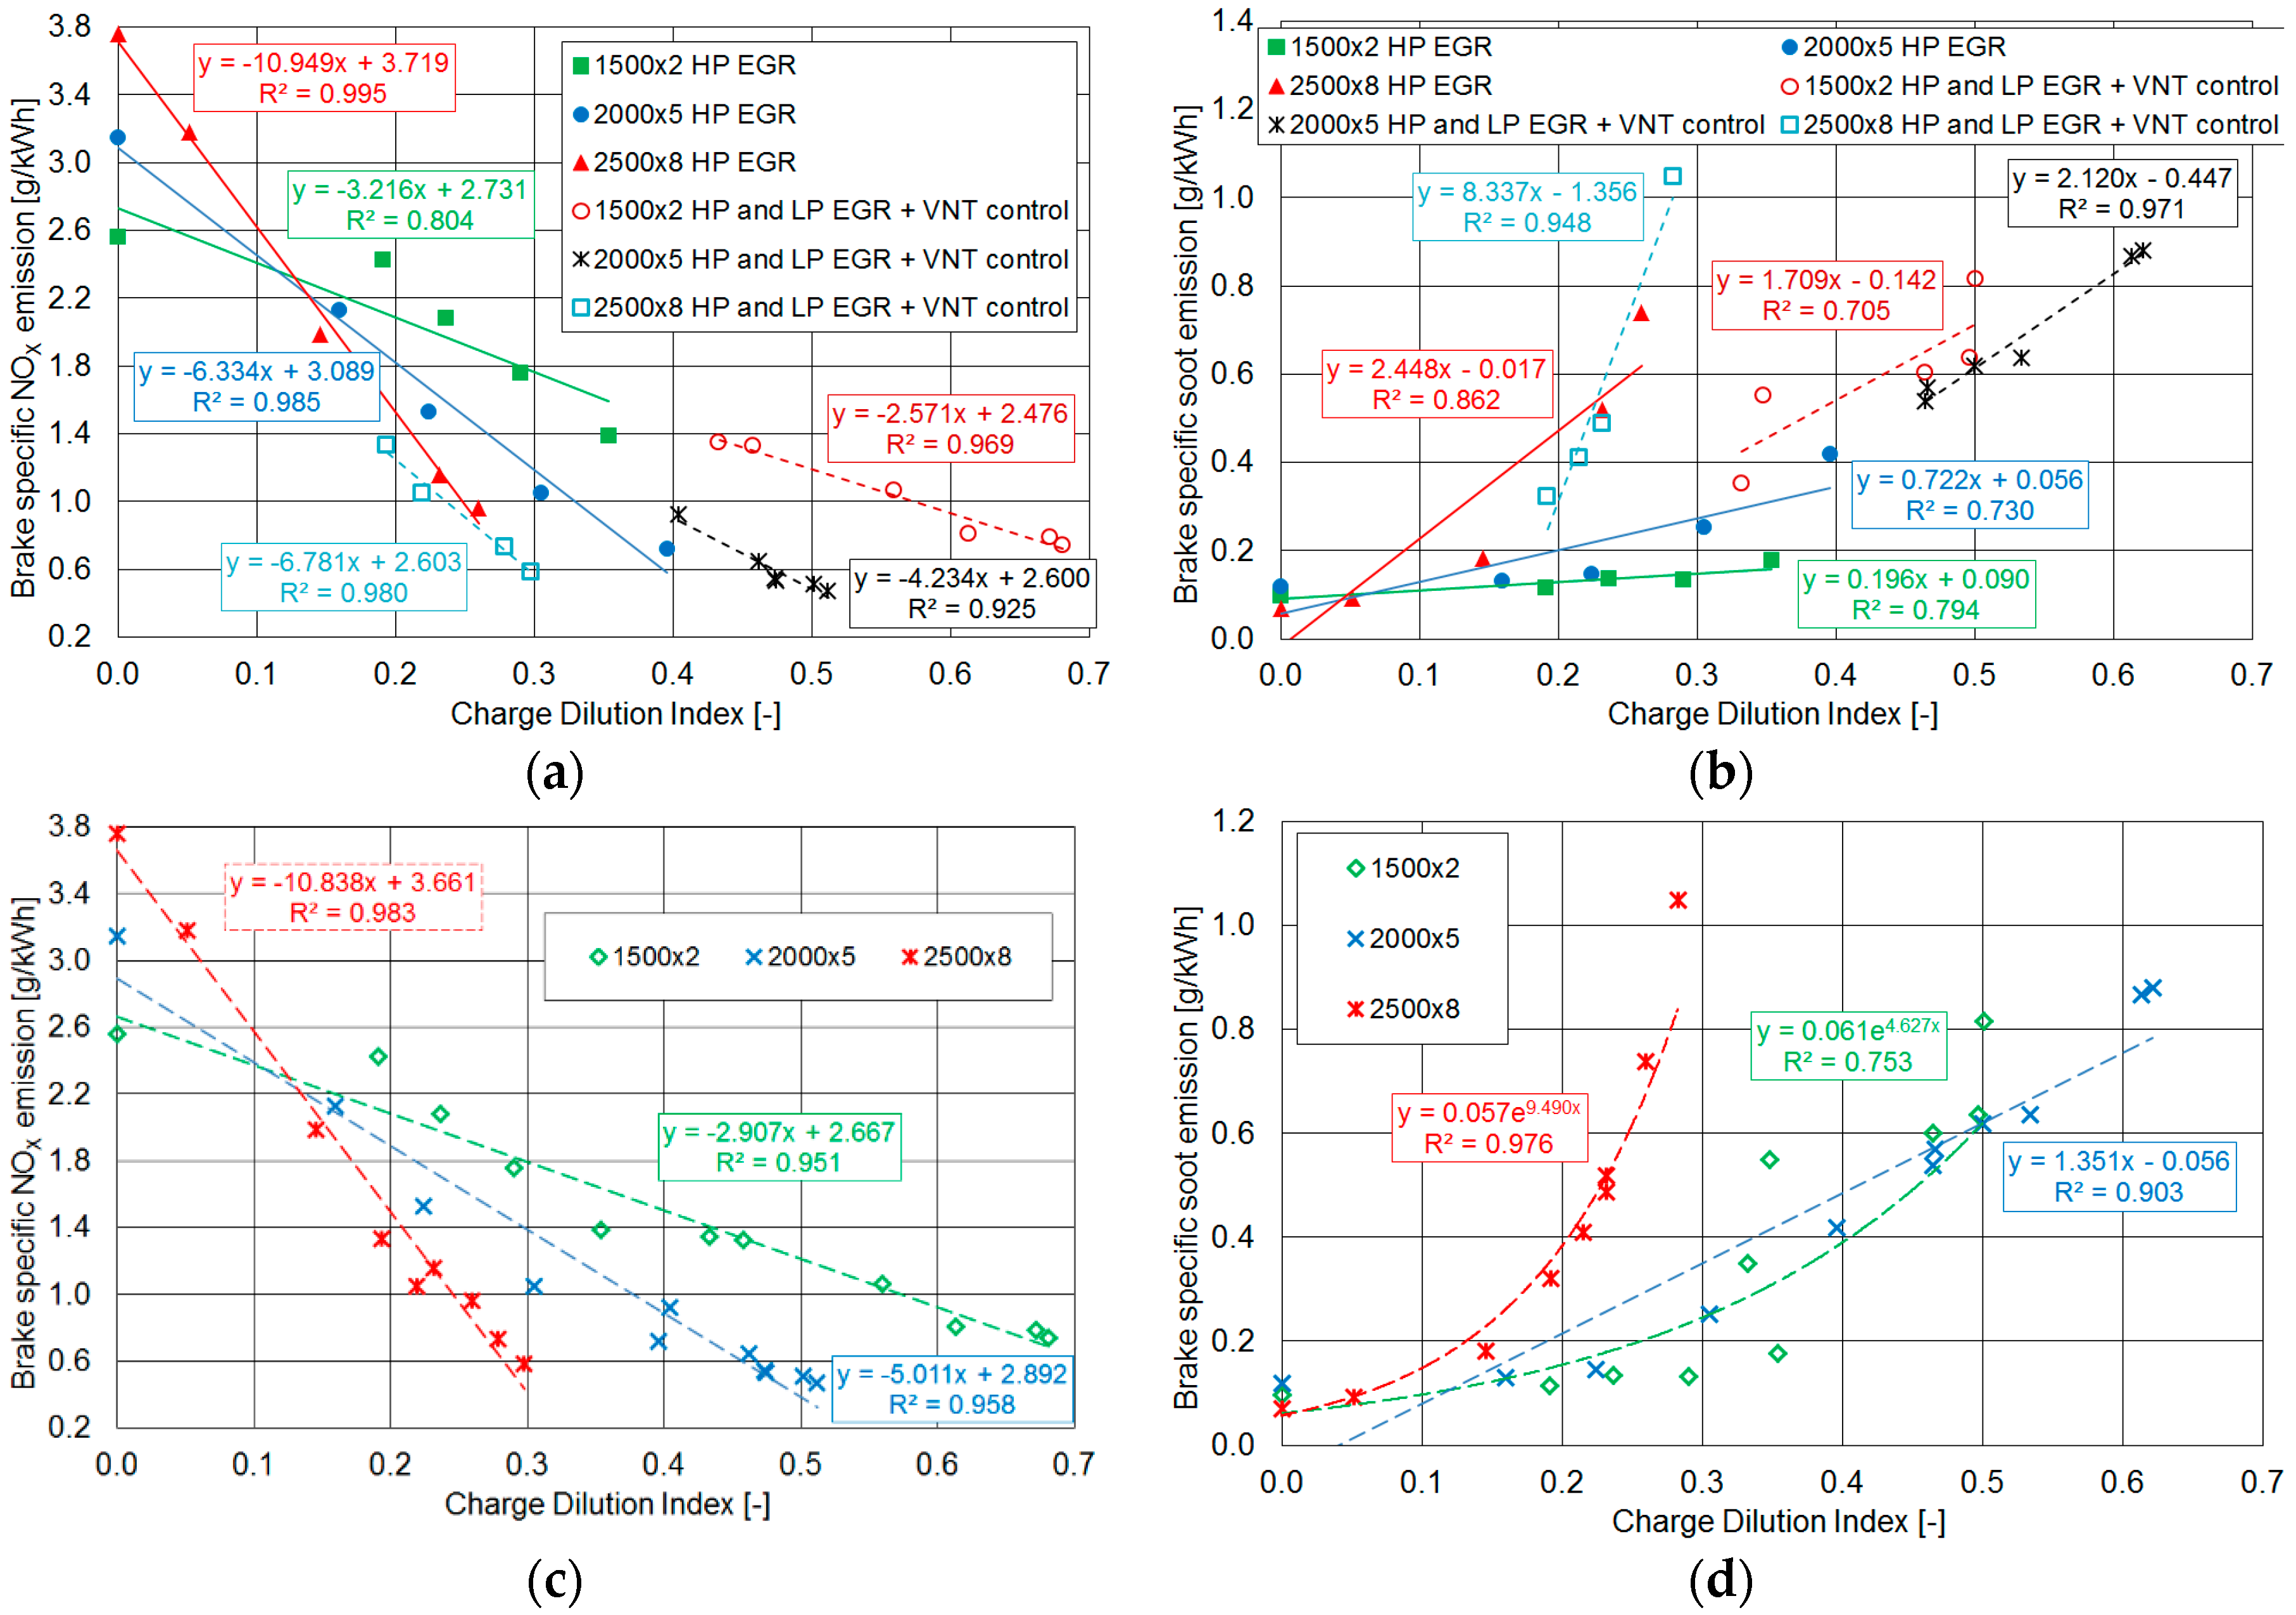
Figure 8 presents the link between Charge Dilution Index and brake specific emissions of NOX and soot (bsNOX, bsS). Expected trends are apparent in both cases, but it is worth noticing the high levels of determination coefficient and the relationship between the experimental sets measured in the same operating condition in the two phases.
In the case of NOX, the linear correlation was verified in an extended CDI range, as shown in Figure 8c, presenting the same points of Figure 8a, grouped and fitted according to the three operating conditions. As reported in Table 5, maximum levels of the index observed during the experimental campaign were, respectively, equal to 0.968 (1500 × 2), 0.622 (2000 × 5) and 0.327 (2500 × 8). Taking into account the upper values of CDI shown in Figure 8c, correlations for bsNOX are valid for an interval around 70%, 82% and 91% of the whole range tested for the three points.
On the other hand, an exponential function was applied to bsS to increase determination coefficient (otherwise ranging around 0.6 for the linear approach, with the exception of point 2000 × 5), as presented in Figure 8d, which shows the same points of Figure 8b. The greater slope for the highest CDI levels (obtained in the three operating conditions when adding LP EGR contribution) suggests an increasing influence of EGR rate. Referring to the CDI interval, ranges of validity are 52%, 100% and 87% of the maximum levels. Taking also into account results for bsNOX, these intervals look satisfactory for conditions 2000 × 5 and 2500 × 8, while some improvements are required for the first point, as the larger extension of CDI values, in absolute terms, may require the definition of different correlations.
3.3. Links with Heat Released in the Premixed Phase of Main Combustion
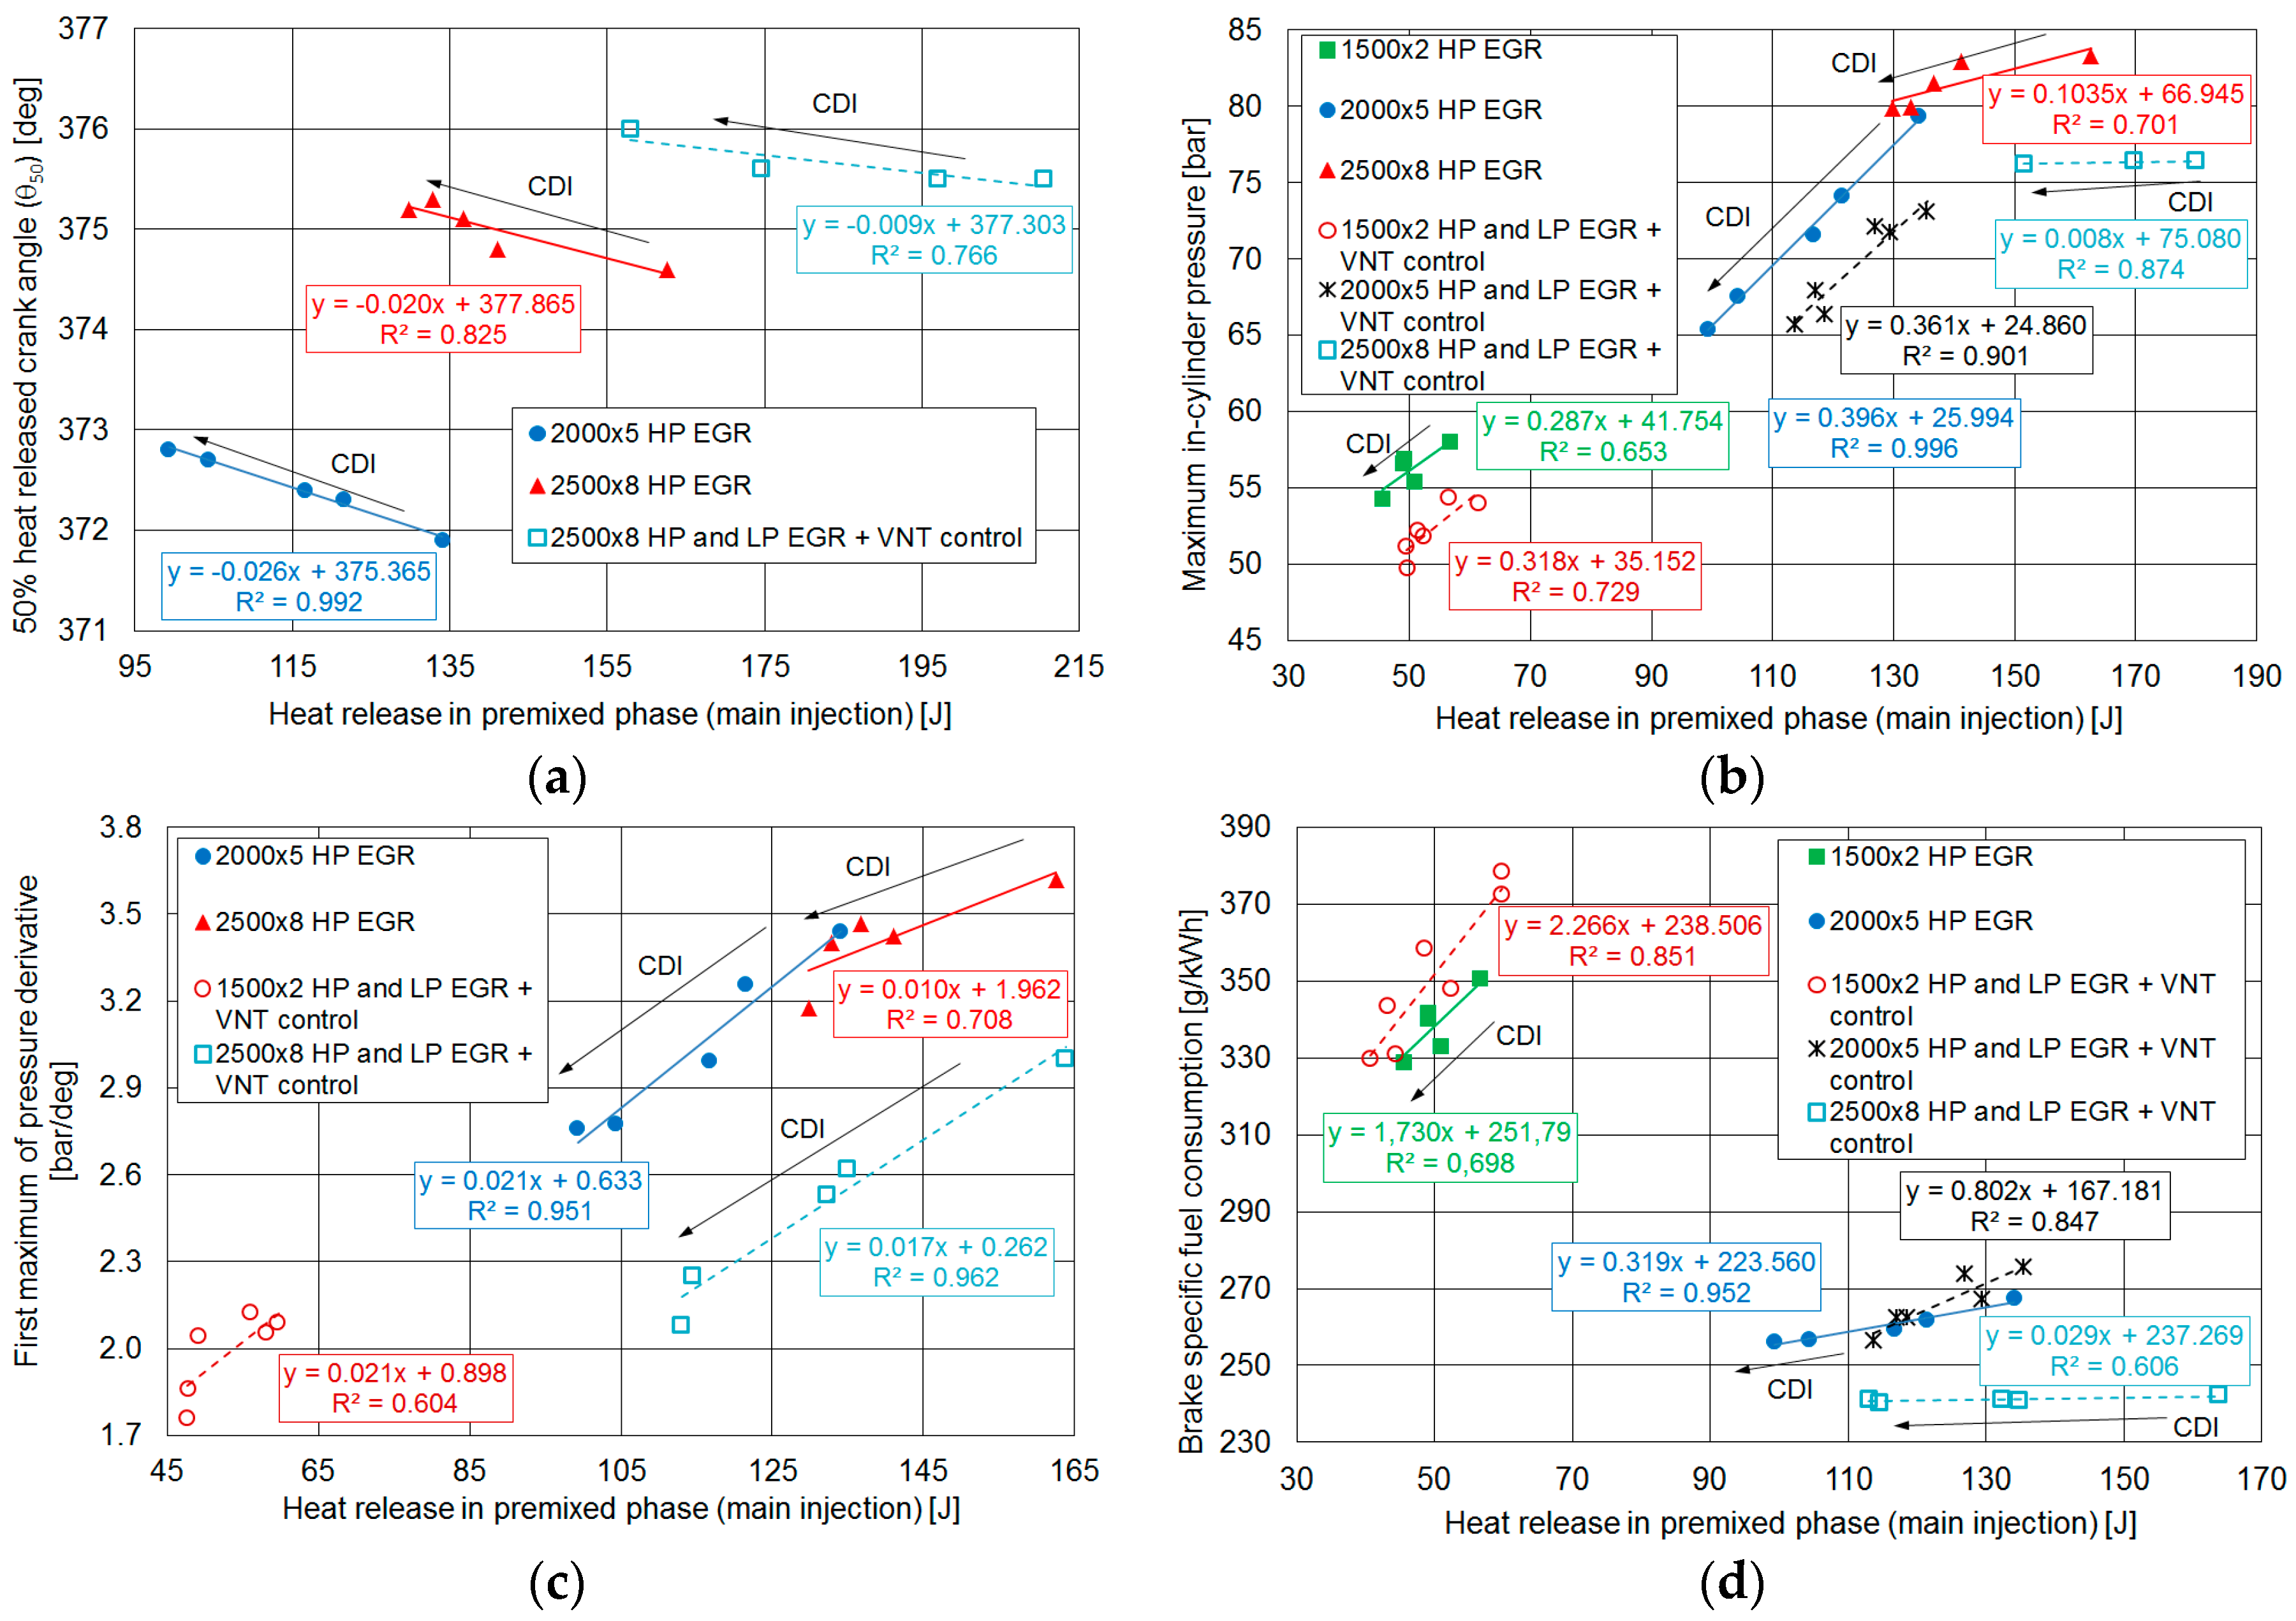
Even if the adoption of multiple injection strategies leads to a change in heat release curve, making more difficult to apply the conventional classification of diesel combustion in premixed and diffusive burning [2], the procedure presented in Section 2.4 allowed the estimation of HRpremix (Figure 2). Processing of this parameter outlines interesting links with other quantities, presented in Figure 9 and Figure 10.
For each line, increasing levels of CDI are also shown, if a monotone trend was identified. This was not possible in 1500 × 2 and 2000 × 5 experimental points, for sets with EGR from both the circuits and VNT control. In fact, the increase of LP loop contribution led to higher overall EGR rate, followed by its reduction when opening the nozzle turbine [17].
Focusing on the results, Figure 9a shows the correlation between HRpremix and 50% heat released crank angle. θ50 was closer to TDC if an enhanced premixed phase was obtained, which occurred for zero or lower EGR rate. A direct correlation between HRpremix and maximum in-cylinder pressure is always apparent in Figure 9b. This was expected for reducing levels of EGR rate/CDI [31], but it was confirmed in all the tested modes. On the other hand, an inverse correlation between heat released in premixed phase and the first maximum of pressure derivative is observed in Figure 9c, which may be justified by the changes in combustion process due to EGR activation.
The increase of brake specific fuel consumption at higher HRpremix levels, shown in Figure 9d, may seem unexpected, taking into account its influence on combustion center presented in Figure 9a. Anyway, as previously discussed, engine pressure gradient and pumping losses proved to have a major effect on fuel consumption, prevailing on a better development of combustion process [16,17].
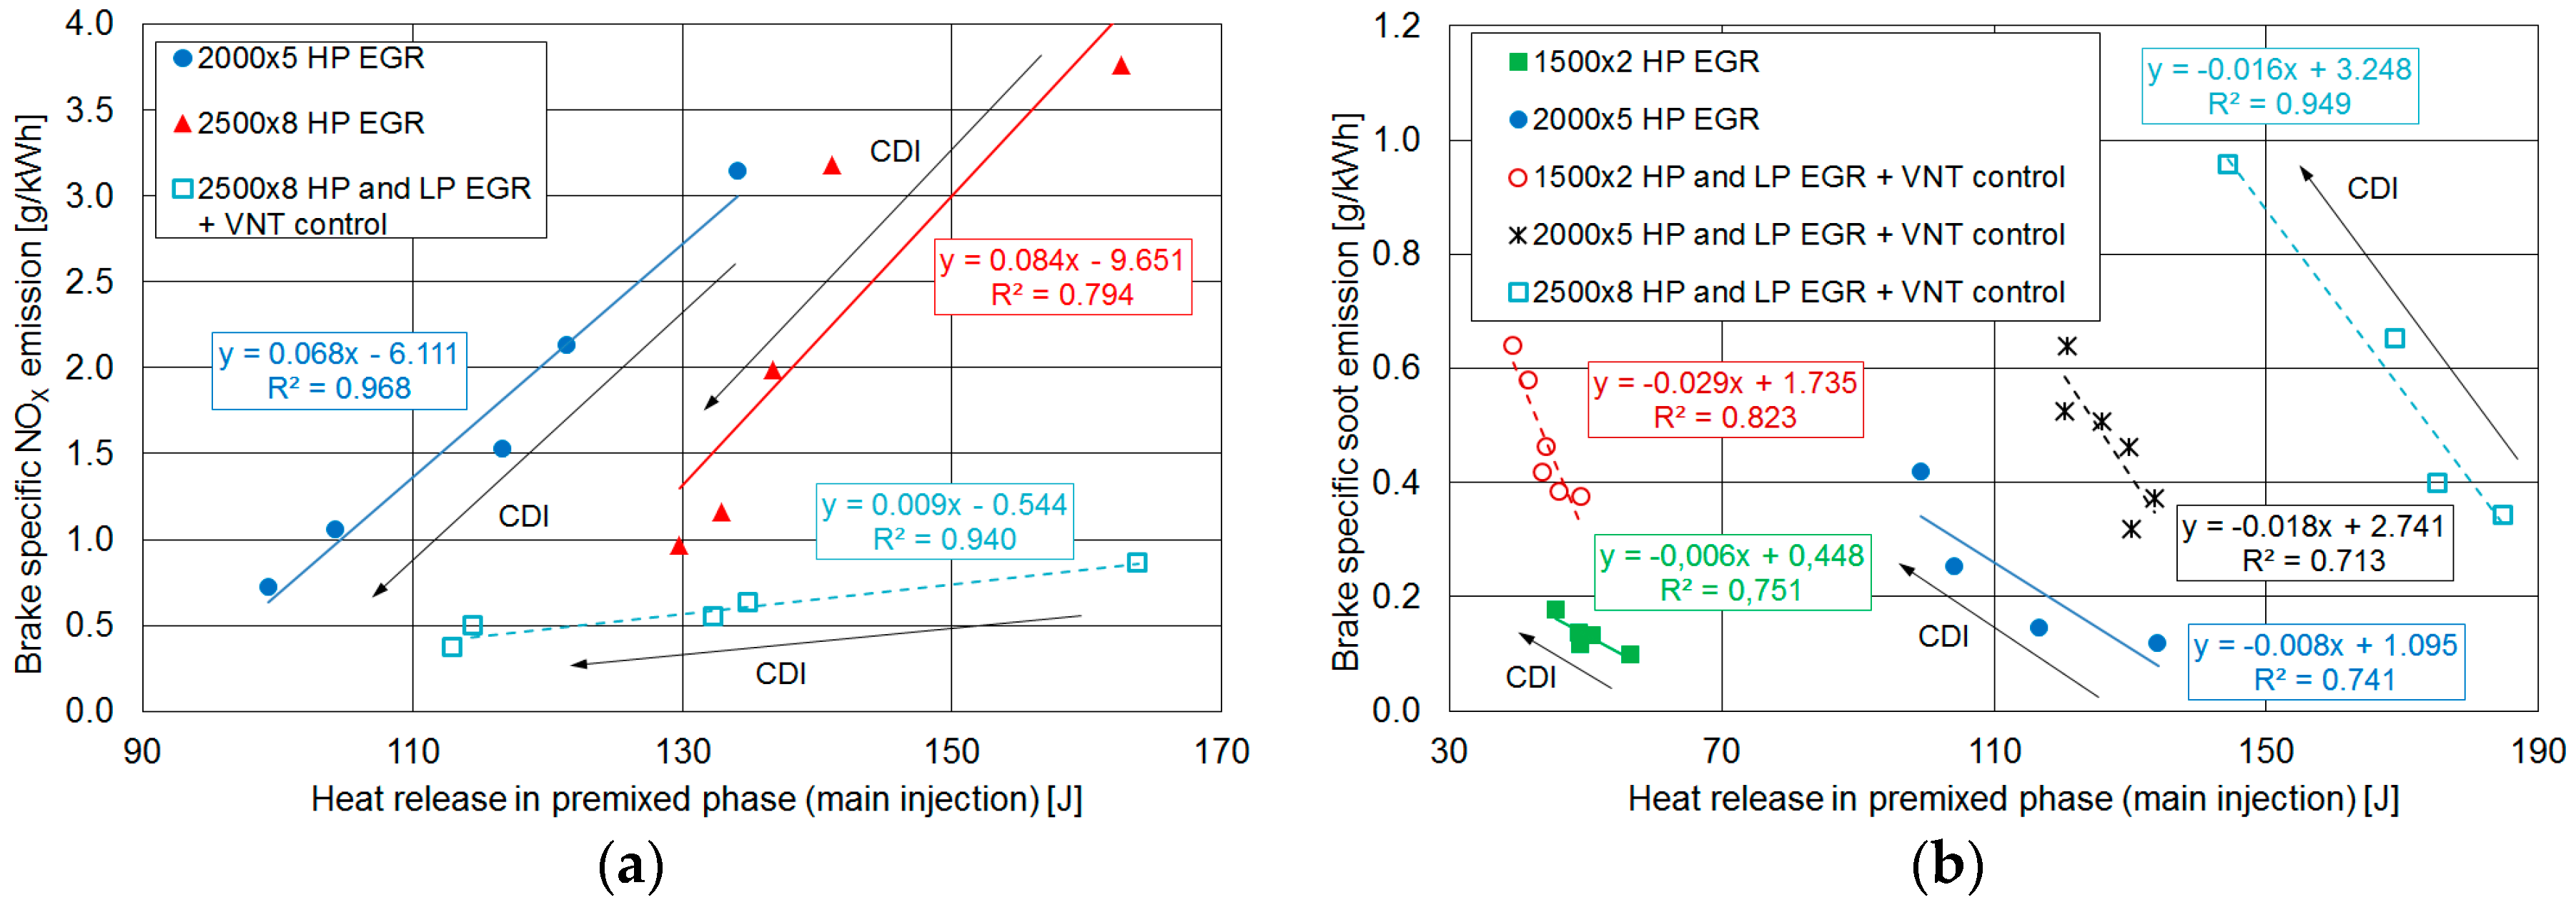
Referring to brake specific NOX emissions (Figure 10a), observed increase for higher values of HRpremix were related to CDI variations, but also to the corresponding shift of θ50 towards TDC (Figure 9a) and rise of maximum pressure (Figure 9b).
An inverse relationship between heat released in premixed phase and brake specific soot emissions is presented in Figure 10b. A lower soot emission is related to an enhanced premixed phase [35], which was observed also when CDI trend was not uniquely defined. The same behavior was shown in [17], referring to all tested modes in operating condition 2500 × 8. Notwithstanding the retarded timing of the main injection, the calculation procedure of HRpremix was therefore validated, as the expected link with bsS was confirmed.
3.4. Correlations for Combustion Noise Indicator and Maximum of Pressure Derivative
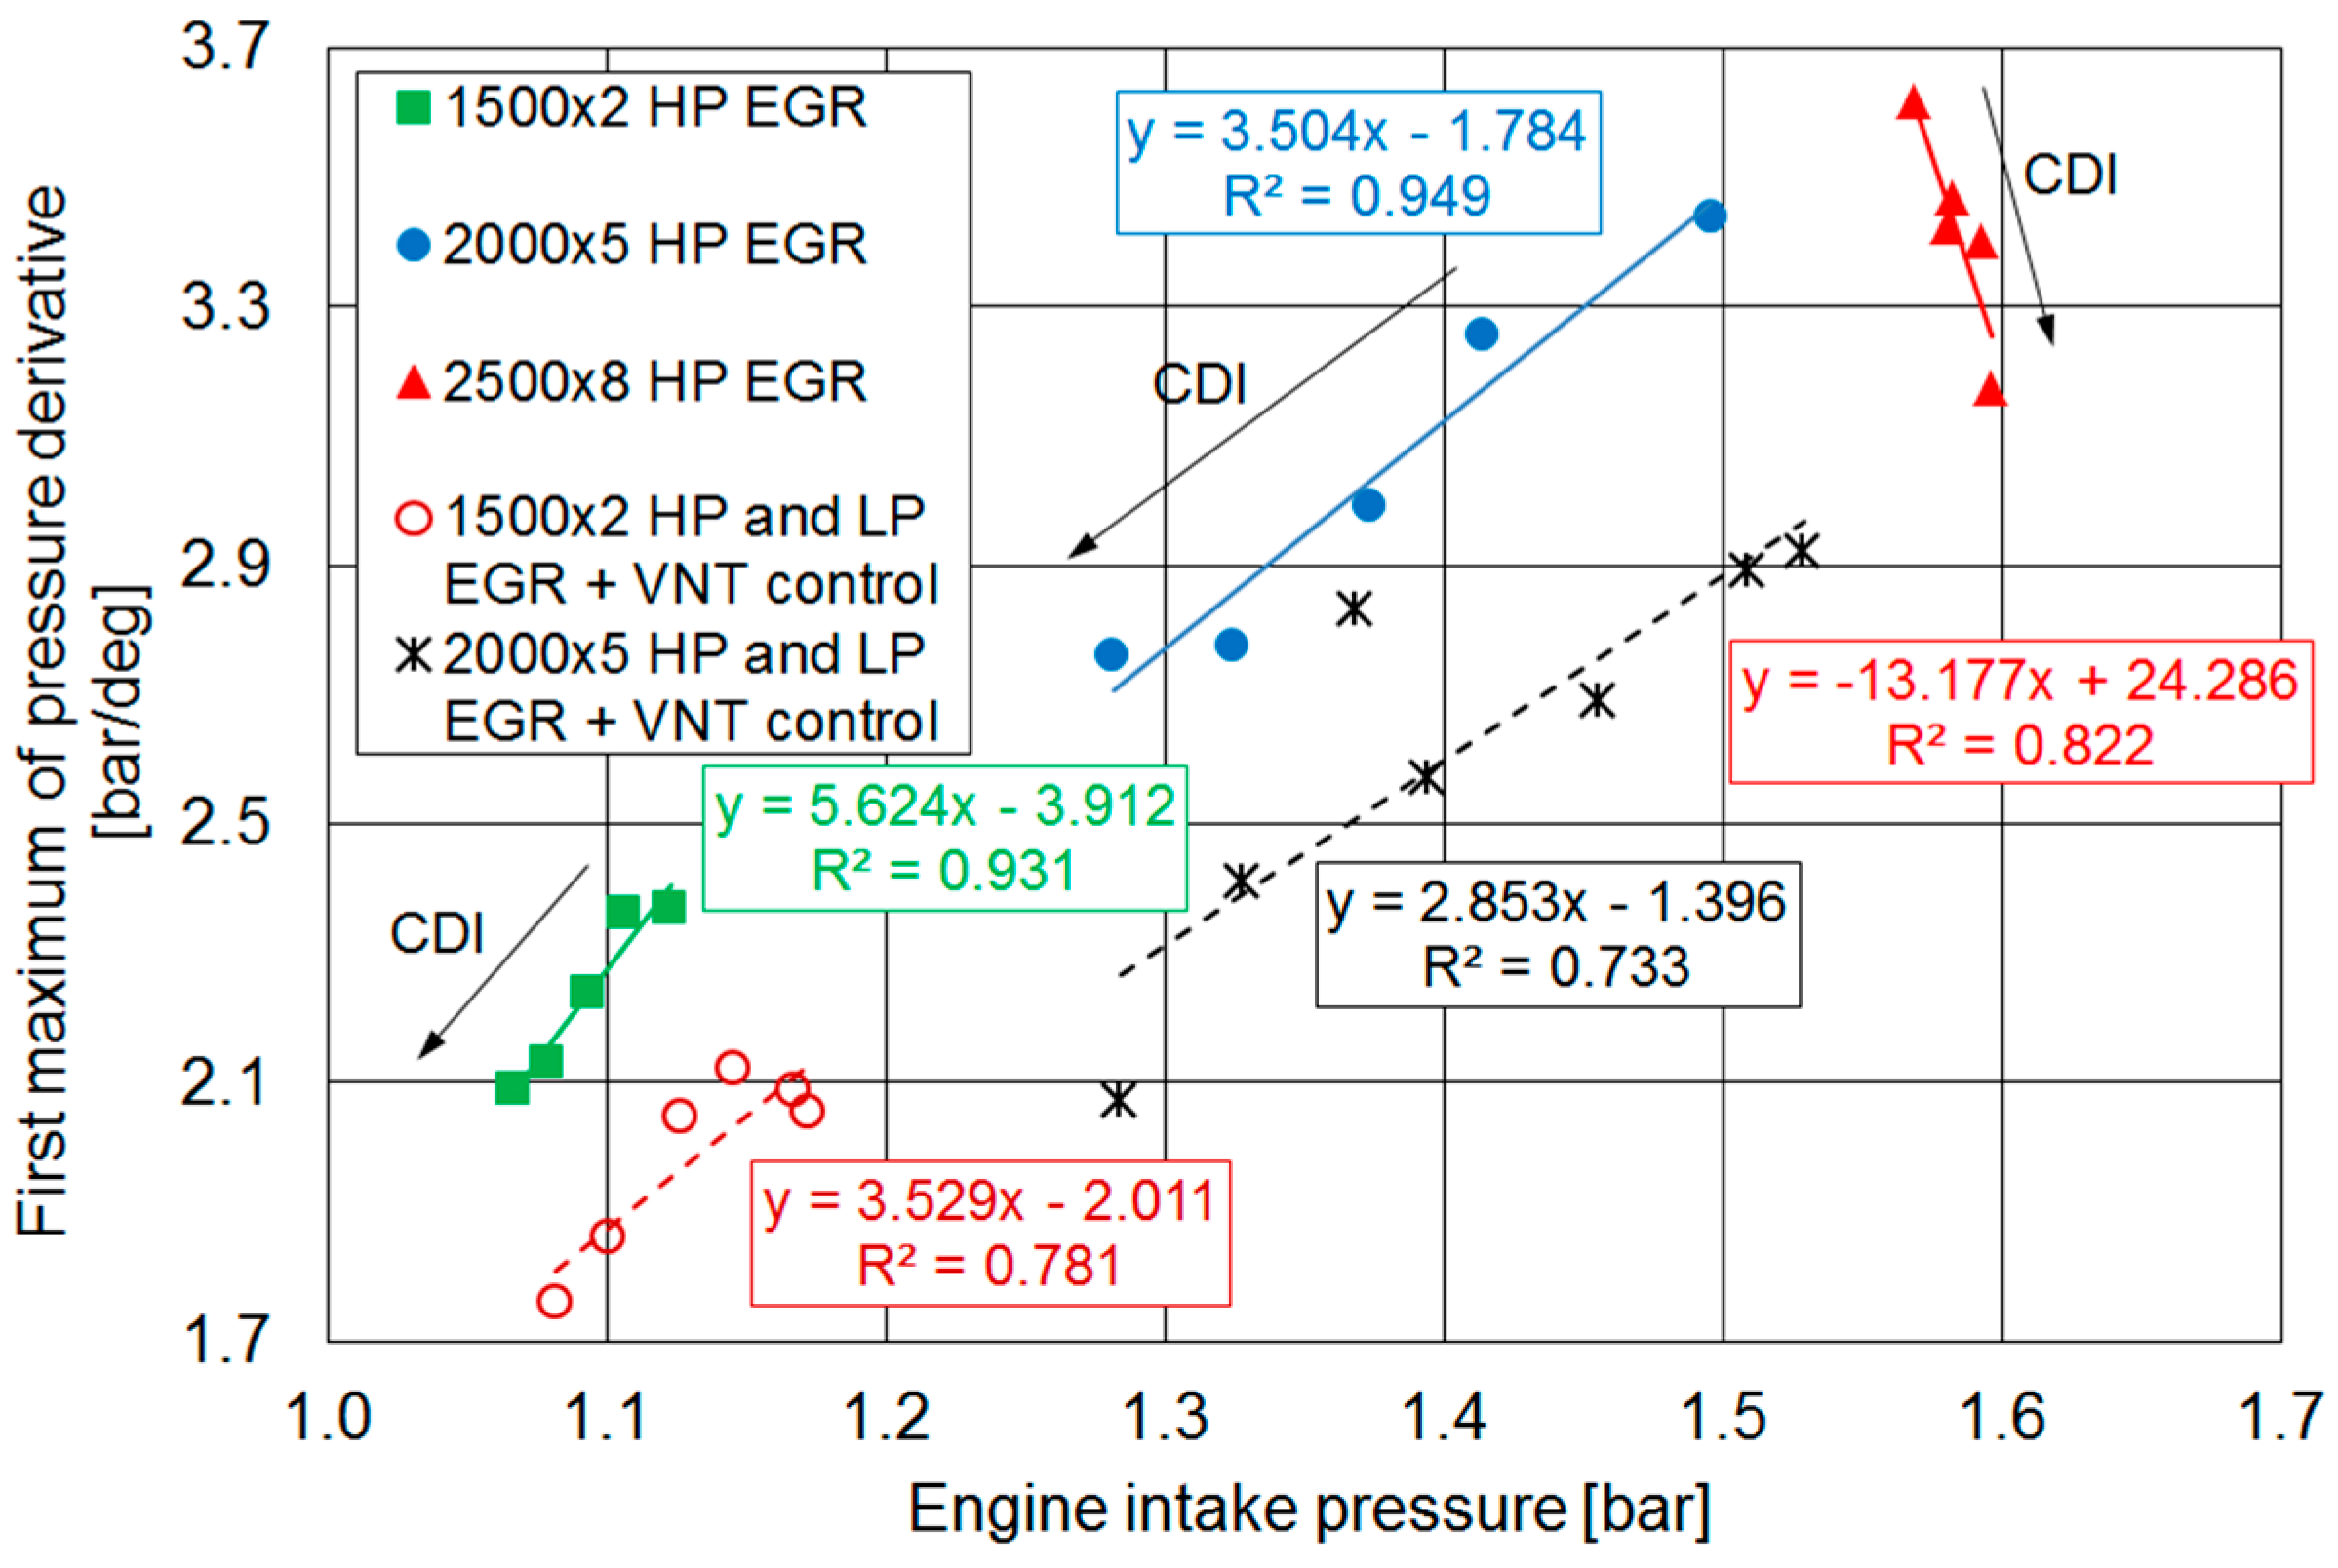
Figure 11 is related to the link between engine intake pressure pi and the first maximum of pressure derivative, showing a direct correlation between these parameters in conditions 1500 × 2 and 2000 × 5. The influence of CDI prevailed in the third point, leading to a reduction of dpMAX 1/dθ despite the slight increase of pi. In fact, closed loop VNT control increased AVNT when the HP EGR circuit was activated, in order to counteract EGR effect on intake pressure (Table 3).
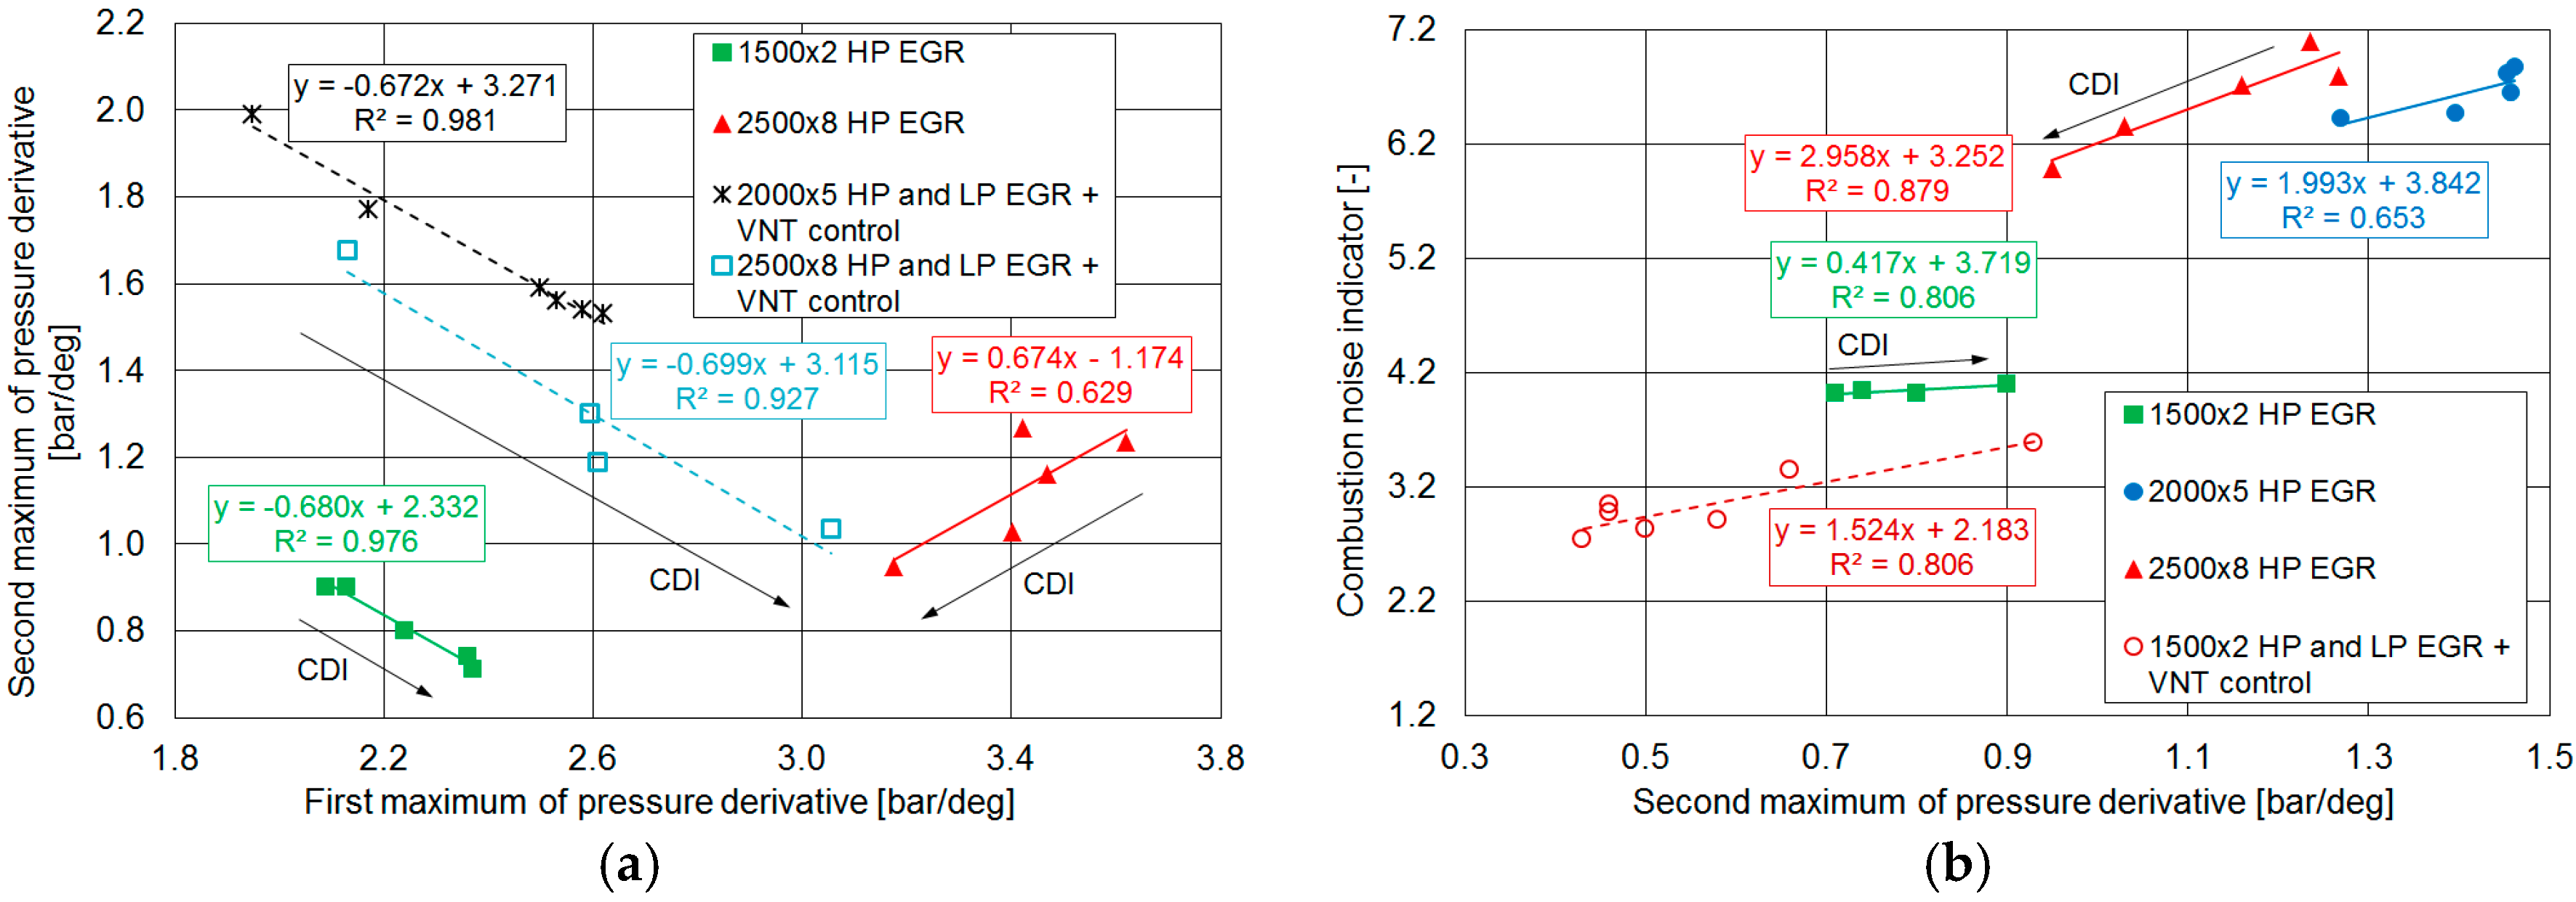
An opposite relationship for closed loop control is also apparent in Figure 12a, where the link between the first and the second maximum of pressure derivative is shown. As the injected quantities in pilot and pre injections were kept constant, variations of dpMAX 1/dθ were mainly related to the changes in ignition delay caused by EGR and VNT control.
Figure 12b presents the influence of the second maximum of pressure derivative on combustion noise indicator. In this case, the direct correlation confirmed that the main combustion was mainly responsible for the combustion noise.
3.5. Influence of 50% Heat Released Crank Angle
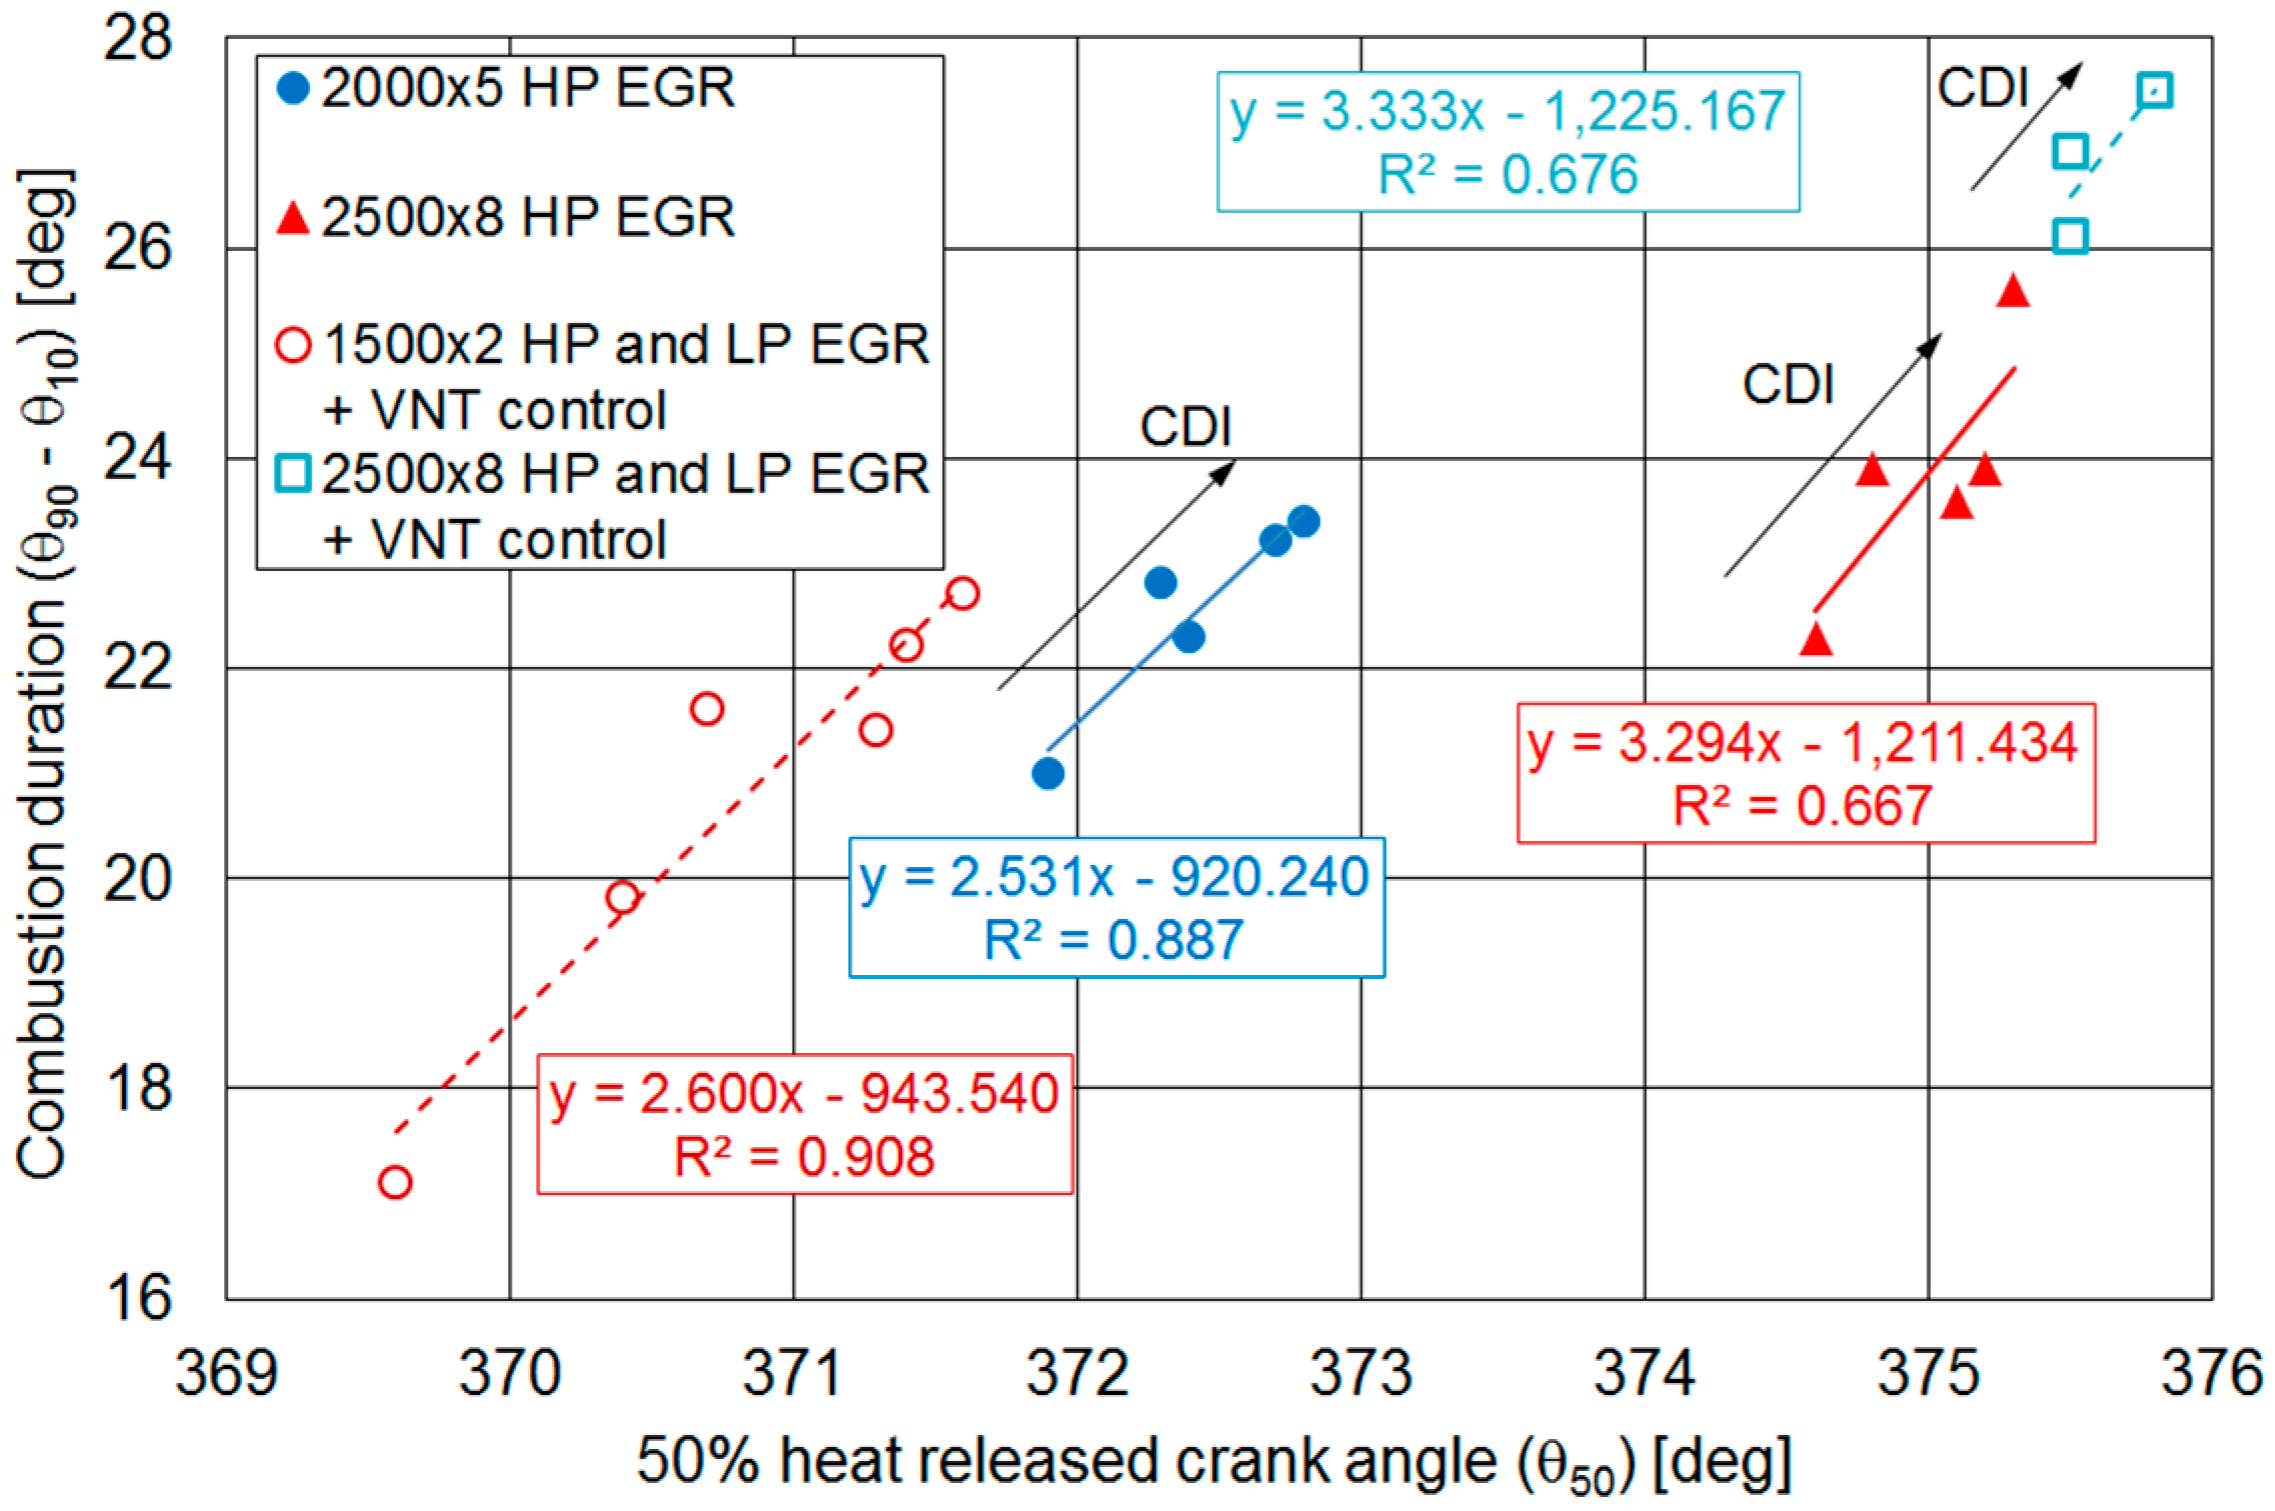
Figure 13 shows the relationship between 50% heat released crank angle and the combustion duration. A direct link was apparent, as the combustion becomes longer when θ50 moved far from TDC. This may be due to EGR increase, as outlined by CDI variations, but it was also verified in a set with a different CDI behavior, with a high determination coefficient.
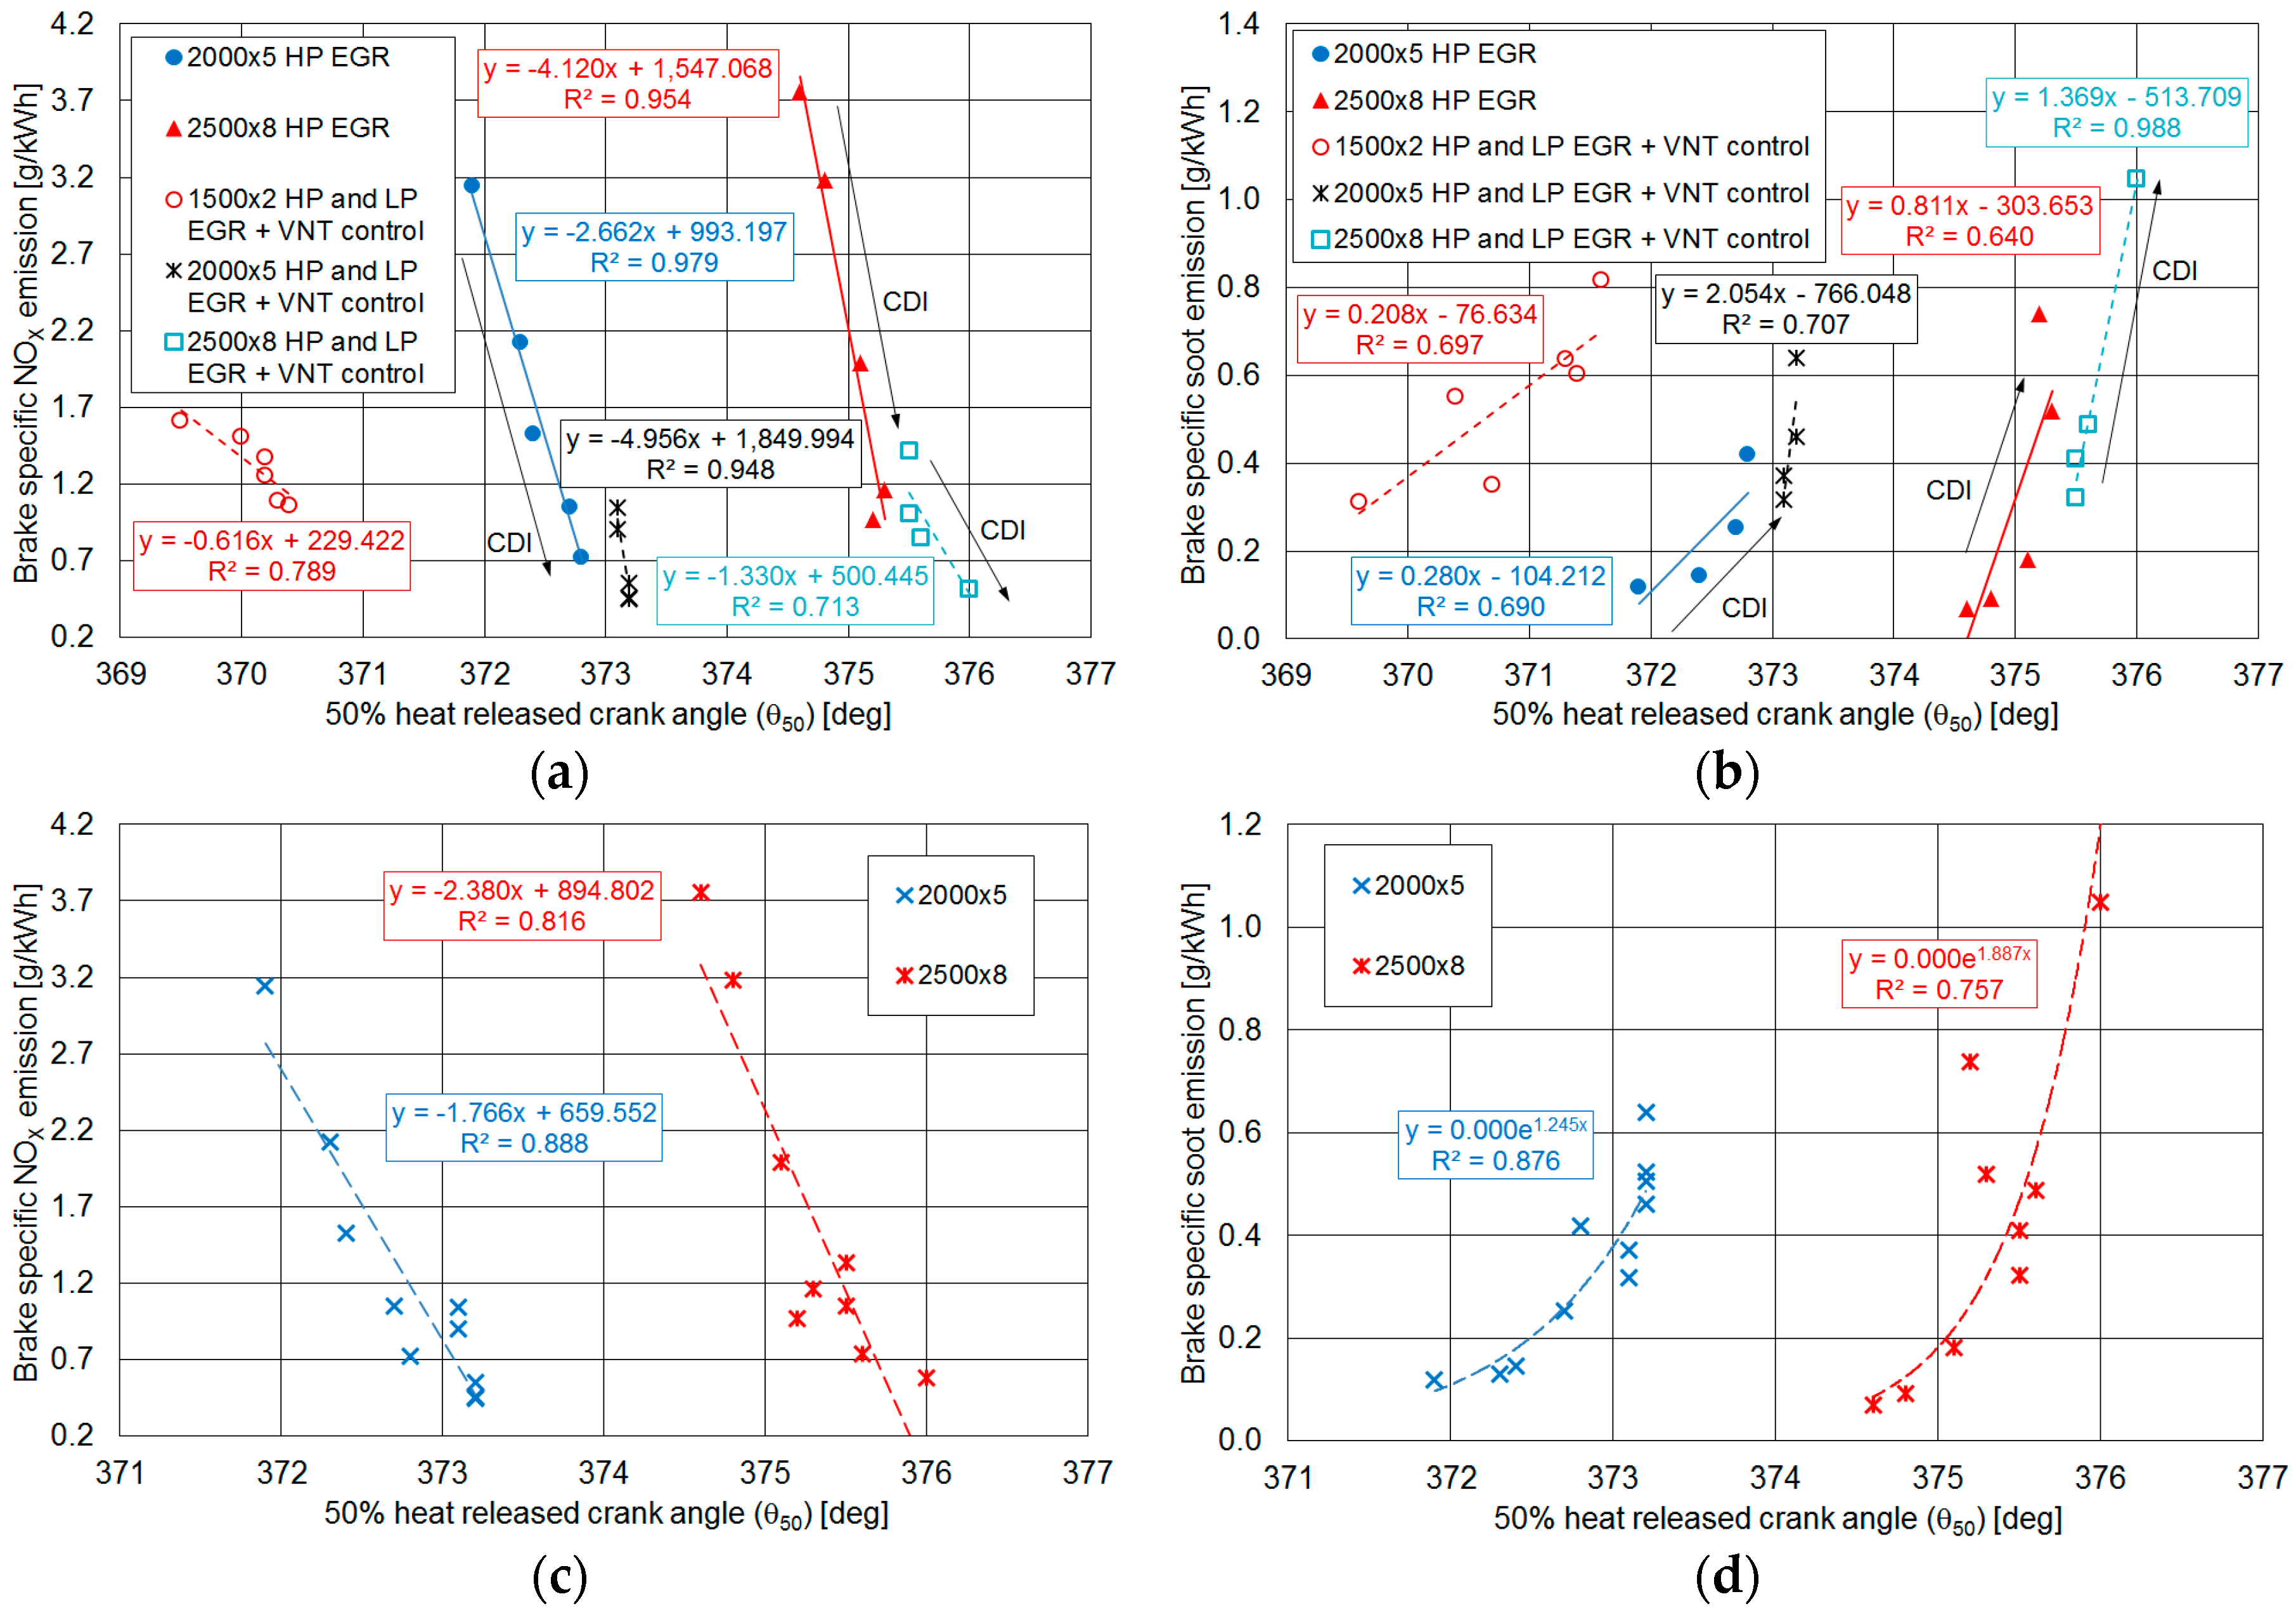
As depicted in Figure 14, this combustion parameter proved to be also related to NOX and soot emissions with an opposite relationship, as expected.
This outcome confirms the influence of combustion center on emissions, which could be derived in an indirect way through the analysis of Figure 9a and Figure 10a for bsNOX and Figure 9a and Figure 10b for bsS. As discussed for the relationship between emissions and CDI, a link could be also found between the two different sets referring to the same experimental point as shown in Figure 14c,d, even if moving from the linear approach in the case of soot.
4. Conclusions
Notwithstanding the availability of advanced investigation tools, a relatively simple and well-known technique, such as the measurement of indicated pressure diagrams in internal combustion engines, still offers the chance to enlarge knowledge and analysis of combustion process. From a general point of view, this is the main conclusion of this study, which started from an overview of literature to define a wide set of combustion parameters derived from curves of in-cylinder pressure, its first derivative and heat release. It was therefore possible to evaluate these variables referring to a wide experimental database measured on a downsized diesel engine. Two different types of tests (HP EGR trade-off and integrated control of dual loop EGR and turbocharging systems) in three part load operating conditions were considered. Then, processing of these quantities with operating, energy and environmental parameters allowed deepening engine behavior when applying management strategies to its subsystems.
Therefore, the main outcomes can be summarized as follow.
- The analysis of pressure diagrams and heat release curves confirmed the influence of EGR rate control on ignition delay, peak pressure and combustion duration. Anyway, significant differences in the behavior of these parameters were observed in the two types of test, due to the effects of low pressure EGR (lower intake temperature and better mixing of air and recirculated gases) and of VNT management.
- A large number of linear relationships was found for both test types, linking engine quantities. Heat released in premixed phase and 50% heat released crank angle (i.e., the center of combustion) generally allowed to define correlations with the highest levels of determination coefficient.
- To justify observed behavior, a prevailing influence of Charge Dilution Index (representing a non-dimensional EGR rate) was generally apparent. On the other hand, links were confirmed even in operating modes where CDI showed a complex trend due to the counteracting influence of control variables (VNT, HP and LP EGR in 1500 × 2 and 2000 × 5 experimental conditions) or, more in general, despite of conflicting effects related to EGR increase and VNT control.
- Combustion noise indicator was proven to be suitable for analyzing the influence of control variables on noise issues, as its relationship with CDI was in line with the effects of EGR rate outlined in other investigations referring to this aspect.
- The expected link between heat released in the premixed phase of the main combustion and soot emissions was verified, allowing to validate the calculation procedure of HRpremix. Therefore, this parameter can be evaluated also in the case of multiple injection strategies and retarded timing of main injection after top dead center, leading to significant variations of heat release curve if compared to the conventional description based on the two well separate premixed and diffusive phases.
- For NOX and soot emissions, a more general relationship was found with CDI and 50% heat released crank angle, linking measured levels in the two types of test at constant engine operating condition. In these cases, exponential functions gave better results for soot emissions.
- The suitability for modeling and control applications was proven, as direct or inverse links were generally confirmed in each testing conditions. A few exceptions were related to the influence of VNT management scheme. For maximum levels of pressure derivative and combustion noise indicator, in fact, tendencies were modified when considering turbine open or closed loop control.
The experimental campaigns and their results confirmed the importance of the design of test program, from the identification of the involved systems, through the selection of operating conditions, range of control variables and methods for their management up to the extended approach to process measured quantities. Taking into account that similar outcomes were obtained on different engines (in particular referring to the influence of HP and LP EGR circuits on pressure diagrams and heat release) and that expected links were confirmed, observed relationships appear to be of general application. Anyway, when distinct approaches are applied for subsystems control, a careful comparison should be performed to verify potential differences.
As a further step, fuel injection system control will be added to enlarge the analysis as well as verify the soundness of the applied methodology when managing all the main sub-systems influencing engine behavior.
Funding
This research received no external funding.
Conflicts of Interest
The author declares no conflict of interest.
Abbreviations
The following abbreviations are used in this manuscript:
| Notations | |
| bmep | brake mean effective pressure |
| bsfc | brake specific fuel consumption |
| bsNOX | brake specific nitrogen oxides emission |
| bsS | brake specific soot emission |
| f | mass flow fraction |
| k | ratio of specific heats |
| n | rotational speed |
| p | pressure |
| t | temperature [°C] |
| A | opening degree |
| AFR | air–fuel ratio |
| BDC | bottom dead center |
| CAD | crank angle degree |
| CDI | Charge Dilution Index |
| CO | carbon monoxide |
| DC | duty-cycle |
| DI | direct injection |
| DPF | Diesel Particulate Filter |
| ECU | electronic control unit |
| EGR | exhaust gas recirculation |
| HC | unburnt hydrocarbons |
| HP | high pressure |
| HR | heat release |
| I | combustion indicator |
| LP | low pressure |
| M | mass flow rate |
| PCCI | premixed charge compression ignition |
| Q | injected quantity, heat |
| ROHR | rate of heat release |
| S | soot, nozzle ring push rod displacement |
| SOI | start of injection |
| TDC | top dead center |
| TV | throttle valve |
| VNT | variable nozzle turbine |
| X | volumetric concentration |
| θ | crank angle |
| Δ | variation |
| Subscripts | |
| a | air, ambient |
| e | exhaust |
| f | fuel |
| i | intake |
| idle | referred to idling mode |
| main | referred to main injection |
| n | noise |
| pilot | referred to pilot injection |
| pre | referred to pre injection |
| rail | referred to fuel common rail |
| CO2 | carbon dioxide |
| EGR | exhaust gas recirculation |
| MAX | maximum |
| MIN | minimum |
| O2 | oxygen |
| VNT | variable nozzle turbine |
References
- Rassweiler, G.; Withrow, L. Motion Pictures of Engine Flames Correlated with Pressure Cards. SAE Int. 1938. [Google Scholar] [CrossRef]
- Hsu, B.D. Practical Diesel-Engine Combustion Analysis; SAE International: Warrendale, PA, USA, 2002; ISBN 0-7680-0914-6. [Google Scholar]
- Heywood, J.B. Internal Combustion Engine Fundamentals; Mc Graw-Hill: New York, NY, USA, 1988; ISBN 0-07-028637-X. [Google Scholar]
- Ozturk, E. Performance, emissions, combustion and injection characteristics of a diesel engine fuelled with canola oil–hazelnut soapstock biodiesel mixture. Fuel Process. Technol. 2015, 129, 183–191. [Google Scholar] [CrossRef]
- Ge, J.C.; Yoon, S.K.; Kim, M.S.; Choi, N.J. Application of Canola Oil Biodiesel/Diesel Blends in a Common Rail Diesel Engine. Appl. Sci. 2017, 7, 34. [Google Scholar] [CrossRef]
- D’Ambrosio, S.; Ferrari, A. Effects of exhaust gas recirculation in diesel engines featuring late PCCI type combustion strategies. Energy Convers. Manag. 2015, 105, 1269–1280. [Google Scholar] [CrossRef]
- Kim, J.; Bae, C. Emission reduction through internal and low-pressure loop exhaust gas recirculation configuration with negative valve overlap and late intake valve closing strategy in a compression ignition engine. Int. J. Engine Res. 2017, 18, 973–990. [Google Scholar] [CrossRef]
- Shen, Z.; Cui, W.; Ju, X.; Liu, Z.; Wu, S.; Yang, J. Numerical Investigation on Effects of Assigned EGR Stratification on a Heavy Duty Diesel Engine with Two-Stage Fuel Injection. Energies 2018, 11, 515. [Google Scholar] [CrossRef]
- Zhang, Z.; Li, L. Investigation of In-Cylinder Steam Injection in a Turbocharged Diesel Engine for Waste Heat Recovery and NOx Emission Control. Energies 2018, 11, 936. [Google Scholar] [CrossRef]
- D’Ambrosio, S.; Ferrari, A.; Galleani, L. In-cylinder pressure-based direct techniques and time frequency analysis for combustion diagnostics in IC engines. Energy Convers. Manag. 2015, 99, 299–312. [Google Scholar] [CrossRef]
- Millo, F.; Ferrero Giacominetto, P.; Gianoglio Bernardi, M. Analysis of different exhaust gas recirculation architectures for passenger car Diesel engines. Appl. Energy 2012, 98, 79–91. [Google Scholar] [CrossRef]
- Park, Y.; Bae, C. Experimental study on the effects of high/low pressure EGR proportion in a passenger car diesel engine. Appl. Energy 2014, 133, 308–316. [Google Scholar] [CrossRef]
- Mao, B.; Yao, M.; Zheng, Z.; Li, Y.; Liu, H.; Yan, B. Effects of Dual Loop EGR on Performance and Emissions of a Diesel Engine. SAE Int. 2015. [Google Scholar] [CrossRef]
- Rakopoulos, C.D.; Giakoumis, E.G. Second-law analyses applied to internal combustion engines operation. Prog. Energy Combust. Sci. 2006, 32, 2–47. [Google Scholar] [CrossRef]
- Ma, F.; Zhao, C.; Zhang, F.; Zhang, Z.; Xie, Z.; Wang, H. An experimental investigation on the combustion and heat release characteristics of an opposed-piston folded-cranktrain diesel engine. Energies 2015, 8, 47–6365. [Google Scholar] [CrossRef]
- Zamboni, G.; Moggia, S.; Capobianco, M. Hybrid EGR and turbocharging systems control for low NOX and fuel consumption in an automotive diesel engine. Appl. Energy 2016, 165, 839–848. [Google Scholar] [CrossRef]
- Zamboni, G.; Moggia, S.; Capobianco, M. Effects of a dual-loop EGR system and VNT control on the operating parameters of an automotive diesel engine. Energies 2017, 10, 47. [Google Scholar] [CrossRef]
- Asad, U.; Tjong, J.; Zheng, M. Exhaust gas recirculation—Zero dimensional modelling and characterization for transient diesel combustion control. Energy Convers. Manag. 2014, 86, 309–324. [Google Scholar] [CrossRef]
- Benson, R.S.; Whitehouse, N.D. Internal Combustion Engines; Pergamon Press: London, UK, 1979; ISBN 978-0080227177. [Google Scholar]
- Badami, M.; Mallamo, F.; Millo, F.; Rossi, E.E. Influence of multiple injection strategies on emissions, combustion noise and bsfc of a DI Common Rail Diesel engine. SAE Int. 2002. [Google Scholar] [CrossRef]
- Hohenberg, J.F. Advanced approaches for heat transfer calculations. SAE Int. 1979. [Google Scholar] [CrossRef]
- Thangaraja, J.; Kannan, C. Effect of exhaust gas recirculation on advanced diesel combustion and alternate fuels—A review. Appl. Energy 2016, 180, 169–184. [Google Scholar] [CrossRef]
- Asad, U.; Zheng, M. Exhaust gas recirculation for advanced diesel combustion cycles. Appl. Energy 2014, 123, 242–252. [Google Scholar] [CrossRef]
- Torregrosa, A.J.; Broatch, A.; Martin, J.; Monelletta, L. Combustion noise level assessment in direct injection Diesel engines by means of in-cylinder pressure components. Meas. Sci. Technol. 2007, 18, 2131–2142. [Google Scholar] [CrossRef]
- Badami, M.; Mallamo, F.; Millo, F.; Rossi, E.E. Experimental investigation on the effect of multiple injection strategies on emissions, noise and brake specific fuel consumption of an automotive direct injection common-rail diesel engine. Int. J. Engine Res. 2003, 4, 299–314. [Google Scholar] [CrossRef]
- Asad, U.; Zheng, M. Real-time heat release analysis for model-based control of diesel combustion. SAE Int. 2008. [Google Scholar] [CrossRef]
- Liu, J.; Zhu, G.; Fu, J.; Xu, Z.; Yao, J.; Zhan, Z. Quantitative study on in-cylinder combustion and heat release characteristic parameters of gasoline engine based on single variable sweeping tests. Appl. Therm. Eng. 2017, 117, 487–500. [Google Scholar] [CrossRef]
- Chung, J.; Oh, S.; Min, K.; Sunwoo, M. Real-time combustion parameter estimation algorithm for light-duty diesel engines using in-cylinder pressure measurement. Appl. Therm. Eng. 2013, 60, 33–43. [Google Scholar] [CrossRef]
- Kook, S.; Bae, C.; Miles, P.C.; Choi, D.; Pickett, L.M. The Influence of Charge Dilution and Injection Timing on Low-Temperature Diesel Combustion and Emissions. SAE Int. 2005. [Google Scholar] [CrossRef]
- Luján, J.M.; Climent, H.; Pla, B.; Rivas-Perea, M.E.; François, N.Y.; Borges-Alejo, J.; Soukeur, Z. Exhaust gas recirculation dispersion analysis using in-cylinder pressure measurements in automotive diesel engines. Appl. Therm. Eng. 2015, 89, 459–468. [Google Scholar] [CrossRef] [Green Version]
- Zamboni, G.; Capobianco, M. Influence of high and low pressure EGR and VGT control on in-cylinder pressure diagrams and rate of heat release in an automotive turbocharged diesel engine. Appl. Therm. Eng. 2013, 51, 586–596. [Google Scholar] [CrossRef]
- Selim, M.Y.E. Effect of exhaust gas recirculation on some combustion characteristics of dual fuel engine. Energy Convers. Manag. 2003, 44, 707–721. [Google Scholar] [CrossRef]
- Bunce, M.; Snyder, D.; Adi, G.; Hall, C.; Koehler, J.; Davila, B.; Kumar, S.; Garimella, P.; Stanton, D.; Shaver, G. Optimization of soy-biodiesel combustion in a modern diesel engine. Fuel 2011, 90, 2560–2570. [Google Scholar] [CrossRef]
- Torregrosa, A.J.; Broatch, A.; Plá, B.; Mónico, L.F. Impact of Fischer-Tropsch and biodiesel fuels on trade-offs between pollutant emissions and combustion noise in diesel engines. Biomass Bioenergy 2013, 52, 22–33. [Google Scholar] [CrossRef]
- Eastwood, P. Particulate Emissions from Vehicles; John Wiley & Sons Ltd: Chichester, UK, 2008; ISBN 978-0-470-72455-2. [Google Scholar]
Figure 1.
Scheme of tested engine [16].
Figure 1.
Scheme of tested engine [16].

Figure 2.
Example of in-cylinder pressure diagram, curve of pressure first derivative and related parameters.
Figure 2.
Example of in-cylinder pressure diagram, curve of pressure first derivative and related parameters.

Figure 3.
Example of rate of heat release curve and related combustion parameters.

Figure 4.
Influence of Exhaust Gas Recirculation (EGR) rate on pressure diagrams (a) and heat release; (b) (High Pressure, HP, loop activation).
Figure 4.
Influence of Exhaust Gas Recirculation (EGR) rate on pressure diagrams (a) and heat release; (b) (High Pressure, HP, loop activation).

Figure 5.
Influence of EGR and Variable Nozzle Turbine (VNT) control on pressure diagrams (a) and heat release; (b) (HP and Low Pressure, LP, loops activation).
Figure 5.
Influence of EGR and Variable Nozzle Turbine (VNT) control on pressure diagrams (a) and heat release; (b) (HP and Low Pressure, LP, loops activation).

Figure 6.
Link between Charge Dilution Index and θ50 (a), HRpremix (b), pMAX (c) In (d) in different test sets.
Figure 6.
Link between Charge Dilution Index and θ50 (a), HRpremix (b), pMAX (c) In (d) in different test sets.

Figure 7.
Link between Charge Dilution Index and brake specific fuel consumption (bsfc) in different test sets.
Figure 7.
Link between Charge Dilution Index and brake specific fuel consumption (bsfc) in different test sets.

Figure 8.
Link between Charge Dilution Index and emissions (NOX (a) and (c), soot (b) and (d)) in different test sets.
Figure 8.
Link between Charge Dilution Index and emissions (NOX (a) and (c), soot (b) and (d)) in different test sets.

Figure 9.
Link between heat released in premixed phase and θ50 (a), pMAX (b), dpMAX 1/dθ (c) and bsfc (d) in different test sets.
Figure 9.
Link between heat released in premixed phase and θ50 (a), pMAX (b), dpMAX 1/dθ (c) and bsfc (d) in different test sets.

Figure 10.
Link between heat released in premixed phase and brake specific emissions (NOX (a) and soot (b)) in different test sets.
Figure 10.
Link between heat released in premixed phase and brake specific emissions (NOX (a) and soot (b)) in different test sets.

Figure 11.
Link between engine intake pressure and first maximum of pressure derivative in different test sets.
Figure 11.
Link between engine intake pressure and first maximum of pressure derivative in different test sets.

Figure 12.
Link between first and second maximum of pressure derivative (a) and second maximum of pressure derivative and combustion noise indicator; (b) in different test sets.
Figure 12.
Link between first and second maximum of pressure derivative (a) and second maximum of pressure derivative and combustion noise indicator; (b) in different test sets.

Figure 13.
Link between 50% heat released crank angle and combustion duration in different test sets.
Figure 13.
Link between 50% heat released crank angle and combustion duration in different test sets.

Figure 14.
Link between 50% heat released crank angle and brake specific emissions (NOX (a) and (c), soot (b) and (d)) in different test sets.
Figure 14.
Link between 50% heat released crank angle and brake specific emissions (NOX (a) and (c), soot (b) and (d)) in different test sets.


Table 1.
Characteristics of tested engine.
| Engine Type | Four-Stroke, Diesel |
|---|---|
| Cylinders | 4 in-line |
| Bore [mm] × stroke [mm] | 69.9 × 82 |
| Total displacement [cm3] | 1248 |
| Compression ratio | 16.8:1 |
| Valves for cylinder | 4 |
| Intake Valve Opening | 12 CAD BTDC |
| Intake Valve Closure | 12 CAD ABDC |
| Exhaust Valve Opening | 24 CAD BBDC |
| Exhaust Valve Closure | 12 CAD ATDC |
| Maximum Power [kW] | 70 @ 4000 rpm |
| Maximum Torque [Nm] | 200 @ 1500–3000 rpm |
| Fuel injection system | Direct injection, Multijet II common rail with solenoid injectors, maximum pressure 1650 bar |
| Turbocharging system | Single stage, variable nozzle turbine, intercooler |
| Hybrid EGR system | Standard HP circuit, cooled + prototype LP loop, cooled |
Table 2.
Schedule of experimental activities (High Pressure (HP) Exhaust Gas Recirculation (EGR) trade-off, operating conditions No. 1 and No. 2).
Table 2.
Schedule of experimental activities (High Pressure (HP) Exhaust Gas Recirculation (EGR) trade-off, operating conditions No. 1 and No. 2).
| Operating Condition ID = n × bmep [rpm × bar] | Relative Air–Fuel Ratio | DCEGR [%] | fEGR [%] | CDI [-] | tengine [°C] | pi [bar] | ti [°C] |
|---|---|---|---|---|---|---|---|
| No. 1 = 1500 × 2 | 3.3 | 0 | 0 | 0 | 87.0 | 1.134 | 27.9 |
| 3.2 | 9.0 | 15.8 | 0.191 | 87.0 | 1.118 | 31.5 | |
| 3.0 | 9.8 | 18.8 | 0.236 | 87.0 | 1.105 | 34.2 | |
| 2.9 1 | 10.8 | 22.1 | 0.291 | 87.0 | 1.092 | 37.5 | |
| 2.7 | 11.9 | 25.7 | 0.354 | 87.0 | 1.079 | 41.1 | |
| SOIpilot = 20.1 CAD BTDC, SOIpre = 8.0 CAD BTDC, SOImain = 1.3 CAD ATDC Qpilot = Qpre = 1 mm3/stroke, prail = 370 bar, AVNT = 1.4% | |||||||
| No. 2 = 2000 × 5 | 2.5 | 0 | 0 | 0 | 87.5 | 1.513 | 25.2 |
| 2.2 | 10.5 | 13.4 | 0.160 | 88.0 | 1.433 | 31.4 | |
| 2.0 | 12.0 | 17.8 | 0.224 | 88.5 | 1.390 | 36.6 | |
| 1.8 1 | 13.7 | 22.8 | 0.306 | 88.5 | 1.341 | 43.6 | |
| 1.6 | 15.4 | 27.6 | 0.396 | 89.0 | 1.299 | 51.6 | |
| SOIpilot = 25.1 CAD BTDC, SOIpre = 10.7 CAD BTDC, SOImain = 1.1 CAD ATDC Qpilot = Qpre = 1 mm3/stroke, prail = 588 bar, AVNT = 7.6% | |||||||
1 Standard value.
Table 3.
Schedule of experimental activities (HP EGR trade-off, operating condition No. 3).
| Operating Condition ID = n × bmep [rpm × bar] | Relative Air–Fuel Ratio | DCEGR [%] | fEGR [%] | CDI [-] | tengine [°C] | ti [°C] | AVNT [%] |
|---|---|---|---|---|---|---|---|
| No. 3 = 2500 × 8 | 2.1 | 0 | 0.0 | 0 | 91.5 | 27.2 | 29.2 |
| 2.0 | 8.7 | 4.7 | 0.051 | 91.0 | 31.3 | 26.9 | |
| 1.8 | 12.0 | 12.3 | 0.146 | 92.5 | 39.0 | 23.7 | |
| 1.6 1 | 14.9 | 18.1 | 0.231 | 94.0 | 50.3 | 18.8 | |
| 1.5 | 16.6 | 19.9 | 0.260 | 94.7 | 55.2 | 17.1 | |
| SOIpilot = 31.6 CAD BTDC, SOIpre = 14.4 CAD BTDC, SOImain = 0.1 CAD ATDC Qpilot = Qpre = 1 mm3/stroke, prail = 812 bar, pi = 1.52 bar | |||||||
1 Standard value.
Table 4.
Schedule of experimental activities (HP EGR + Low Pressure (LP) EGR + Variable Nozzle Turbine (VNT) control) [17].
Table 4.
Schedule of experimental activities (HP EGR + Low Pressure (LP) EGR + Variable Nozzle Turbine (VNT) control) [17].
| Operating Condition ID = n × bmep [rpm × bar] | Control Variables (Fixed in Each Test Set) | Control Variables (LP EGR and VNT Control) | Test Sets |
|---|---|---|---|
| No. 1 = 1500 × 2 | Relative air–fuel ratio Exhaust throttle valve position | LP EGR valve opening VNT opening degree | Rel.AFR = 3.01 − TV pos. 1 Rel.AFR = 2.90 1 − TV pos. 1 1/2/3 Rel.AFR = 2.77 − TV pos. 1/2 Rel.AFR = 2.62 − TV pos. 1/2 |
| No. 2 = 2000 × 5 | Rel.AFR = 1.94 − TV pos. 1 Rel.AFR = 1.801 − TV pos. 1 1/2/3 Rel.AFR = 1.67 − TV pos. 1/2 | ||
| No. 3 = 2500 × 8 | Relative air–fuel ratio Exhaust throttle valve positionIntake pressure | LP EGR valve opening | Rel.AFR = 1.60 − Intake pressure = 1.48 bar − TV pos. 1 Rel.AFR = 1.60 1 − Intake pressure = 1.521/1.57 bar − TV pos. 0/1 1 Rel.AFR = 1.47 − Intake pressure = 1.52 bar − TV pos. 1 |
1 Standard/reference values.
Table 5.
Range of selected parameters in tests with simultaneous activation of EGR circuits and VNT control.
Table 5.
Range of selected parameters in tests with simultaneous activation of EGR circuits and VNT control.
| Operating Condition | DCEGR [%] | fEGR [%] | CDI [-] | tengine [°C] | ti [°C] | pi [bar] | AVNT [%] |
|---|---|---|---|---|---|---|---|
| 1500 × 2 | 5.5 ÷ 14.7 | 19.2 ÷ 48.5 | 0.244 ÷ 0.968 | 85.5 ÷ 86.5 | 23.3 ÷ 49.0 | 1.065 ÷ 1.223 | 1.4 9.5 16.5 |
| 2000 × 5 | 6.0 ÷ 13.2 | 21.6 ÷ 37.4 | 0.286 ÷ 0.622 | 87.0 ÷ 88.5 | 32.9 ÷ 55.6 | 1.261 ÷ 1.529 | 7.6 14.0 17.0 |
| 2500 × 8 | 6.3 ÷ 19.6 | 12.9 ÷ 23.7 | 0.155 ÷ 0.327 | 91.5 ÷ 95.0 | 39.4 ÷ 64.7 | 1.480 1.520 1.570 | 22.2 ÷ 38.7 |
© 2018 by the author. Licensee MDPI, Basel, Switzerland. This article is an open access article distributed under the terms and conditions of the Creative Commons Attribution (CC BY) license (http://creativecommons.org/licenses/by/4.0/).
Share and Cite
MDPI and ACS Style
Zamboni, G. A Study on Combustion Parameters in an Automotive Turbocharged Diesel Engine. Energies 2018, 11, 2531. https://doi.org/10.3390/en11102531
AMA Style
Zamboni G. A Study on Combustion Parameters in an Automotive Turbocharged Diesel Engine. Energies. 2018; 11(10):2531. https://doi.org/10.3390/en11102531
Chicago/Turabian StyleZamboni, Giorgio. 2018. "A Study on Combustion Parameters in an Automotive Turbocharged Diesel Engine" Energies 11, no. 10: 2531. https://doi.org/10.3390/en11102531
Note that from the first issue of 2016, this journal uses article numbers instead of page numbers. See further details here.