Article

Continuous and Discontinuous Streamer Leader Propagation Phenomena under Slow Front Impulse Voltages in a 10-meter Rod-Plane Air Gap

State Key Laboratory of Advanced Electromagnetic Engineering and Technology, School of Electrical and Electronics Engineering, Huazhong University of Science and Technology 1037 Luoyu Road, Wuhan 430074, China
*
Author to whom correspondence should be addressed.
Energies 2018, 11(10), 2636; https://doi.org/10.3390/en11102636
Submission received: 12 September 2018 / Revised: 29 September 2018 / Accepted: 29 September 2018 / Published: 2 October 2018

Abstract

:
Investigation of positive streamer-leader propagation under slow front impulse voltages can play an important role in the quantitative research of positive upward lightning. In this work, we performed a large-scale investigation into leader development in a 10-m rod–plane gap under a long front positive impulse. To describe the leader propagation under slow front impulse voltages, we recorded the leader propagation with a high-speed charge coupled device (CCD) camera. It is important to figure out this phenomenon to deepen our understanding of leader discharge. The observation results showed that the leader mechanism is a very complex physical phenomenon; it could be categorized into two types of leader process, namely, continuous and the discontinuous leader streamer-leader propagation. Furthermore, we studied the continuous leader development parameters, including two-dimensional (2-D) leader length, injected charge, and final jump stage, as well as leader velocity for rod–plane configuration. We observed that the discontinuous leader makes an important contribution to the appearance of channel re-illuminations of the positive leader. To clarify the above doubts under long front cases, we carried out extensive experiments in this study. The comparative study shows better results in terms of standard switch impulse and long front positive impulse. Finally, the results are presented with a view toward improving our understanding of propagation mechanisms related to restrike phenomena, which are rarely reported.

1. Introduction

The investigation of the long air gap discharge mechanism is essential for the optimization design of the external insulation of power systems and lightning protection [1,2,3]. Furthermore, it can also provide fundamental knowledge to improve the lightning protection performance of grounded structures. About 50% of breakdown voltage of long air gaps is closely related to the waveform of impulse voltages, which trends to a U-shaped curve. The Ultra High Voltage (UHV) transmission system has many advantages in bulk power transmission over remote distances, such as lower line losses, lower footprint and lower cost. Thus, the statistical value of the front time for switching overvoltage waveform is in the range of 0.5~2 milliseconds (ms), and much greater than that of the standard switching impulse proposed by the International Electrotechnical Commission (IEC) standards. The computation and field record waveform showed that the front time in switching the overvoltage waveform was greater than 1000 microsecond (µs); on the other hand, wave front time is associated with the transmission distance [4,5,6]. Furthermore, the effect of a long front time in switching impulse insulation deserves consideration.
Recently, several researchers have focused on the characteristics of upward lightning because it frequently originates from windmills and might cause severe damage to wind turbine blades [7]. These studies showed that the majority of the upward lightning flashes are positive polarity. In fact, it contains a number of positive leader branches, and re-illumination phenomenon. The time scale of the ambient electric field-triggered upward lightning is in the range of up to several milliseconds. In comparison with traditional laboratory positive long sparks, both self-triggered and other-triggered upward lightning flashes are driven by a relatively slow-changing ambient field.
In previous reports, researchers carried out several experiments to obtain the breakdown voltage of long air gaps under different configurations and impulse waveforms to fulfill the demands of external insulation design of power transmission systems [7,8]. Some studies have focused on positive polarity S.I tower window models having different breakdown voltages and sizes [9]. The purpose of these tests was to evaluate the double exponential switching impulses of different front times, and the time to the crest of the wave. In those studies, the flashover tests were performed by using three kinds of positive polarity (S.I): exponential, damped oscillatory and linearly rising impulses. They demonstrated that the time to crest related to the minimum 50% flashover voltage for exponential impulse is shortest, and is longer for damped oscillatory and linearly rising impulses [10]. According to the literature, the long air gap discharge provided positive polarity in a three-meter rod–plane configuration, which was confirmed using double exponential switching impulses of different front times. The results showed that the most important part of the front switching impulse seems to be upper 15% [11]. However, no experimental evidence has been reported for any theory, and it seems that the real phenomena are more complex, with the extant literature consisting of two points: (1) the range of rise time only up to 1200 µs, (2) the discharge process under slowly rising front voltage is rarely reported in early studies. Herein, the first aim is to better understand the characteristics of the physical processes and then to obtain key parameters for establishing a simulation model to predict the breakdown voltage. The second aspect is related to long air gap discharge as described by the Les Renardieres Group in 1970s. “Note that Les Renardieres Group referred to positive leader steps in long air gap restrikes, this indicates that rapid increase in the positive leader channel length due to injected charge, and corona streamer burst takes place at the leader tip, whereas voltage drop in the leader channel decreases caused by dramatic increase of channel conductivity” [12,13]. In the recent observations of positive leaders in a 16.7-m rod–plane configuration, Domens used the impulses with the waveform of 300/9000 µs and 750/10,000 µs that results different kinds of leader propagation, that are (continuous, oscillatory, and restrike phenomena) [14]. Later, in [15], a 17 mΩ shunt was used to measure the leader current of a 16.7-m air rod–plane gap under positive and negative voltage with a bandwidth of 1 MHz and measurements ranging from 3 A to 18 kA to obtain the average discharge current and charge density. The literature in long air gap discharge provides an overview to the characteristics of long air gap discharge current subjected to switching impulse is discussed in [16].
Likewise, the following content should focus on the basic discharge process, typical parameters under standard waveform, critical time to crest, and models for long air simulation. Many studies have been dedicated to the role of long gap discharge including streamer initiation and leader initiation and propagation. Recently, a more appropriate measurement technique using a charge-coupled device CCD camera was developed, providing a new approach for researchers to study the long air gap discharges [17]. An overview of laboratory studies in a rod–plane configuration, results have shown that the critical streamer length is equal to about 3 m, which conflicts with the result proposed in [12]. Several techniques have been proposed in the literature by the Les Renardieres Group using image converter cameras (ICC), which provide extensive information, with lengths between 1 and 10 m under S.I voltages [12,13]. As a result, typical leader velocity is 1.25 cm/µs to 2 cm/µs, charge in leader channel per unit length is 20 µC/m to 60 µC/m, and discharge current is 0.5 A to 1 A, and depends on applied impulse shape, and electrode configuration [12,13]. However, due to the limited spatial resolution, the Les Renardieres Group’s result does not consider restrike under low rise time voltage. Therefore, the streamer to leader data under low rise time voltage is lacking and it cannot support the theoretical results.
This paper presents the experimental results of investigating a 10-m rod–plane gap configuration under positive switching and long front impulse along with theoretical analysis. The experimental setup is discussed in Section 2 and the typical continuous discharge process and the parameters obtained from the experiments are presented in Section 3.
Furthermore, the difference between the continuous and discontinuous cases of the leaders of each long front impulse is illustrated in the results. We evaluated the phenomenon for leader parameters such as restrike charge and velocity during the unstable leader propagation stage, and finally we conclude the paper in Section 5.

2. Experimental Observation

The experimental setup for the rod–plane configuration is illustrated in Figure 1. Experiments are conducted at the outdoor impulse test yard of the ultra-high voltage AC test base in China.
The experimental apparatus consists of an upper electrode that is a hemisphere with a diameter of 2 cm. The length of upper rod body used is 10 m. The plane electrode is a 20 m × 20 m iron plate placed on 50 m × 50 m iron mesh. Furthermore, the vertical distance between the upper rod and the ground is 10 m.
In Figure 1, the metal rod electrode is suspended by means of insulators. An impulse voltage is provided to the electrode by an impulse voltage generator, having a rate voltage of 7.5 MV. The 50% breakdown voltage of a rod–plane configuration subjected to negative S.I with varying time to crest values of voltage waveform can be described as a U-shaped curve.
The peak values of the applied impulse under switching and long front impulse voltage were 1827.29 kV, 1927.28 kV, and 1679.63 kV. A capacitance divider measures the impulse voltage, with ±0.5% accuracy. In the experimental study, temperature and relative humidity were varied in the ranges from 17~22 °C and 75~85%, respectively.
The current measurement device (CMD) recorded the discharge current of the upper rod electrode. The (CMD) is embedded in the body of the upper rod connected to the observation chamber via optical fiber, and fixed with insulation ropes. High-speed camera (photron fastcam) SAX is employed in the framing mode to record the leader propagation image.
The capture parameters of the high-speed CCD camera (Photron FASTCAM SAX) were set to a frame rate of 200 kiloframes per second (kfps), 256 × 48-pixel resolution, and (1/200 ms) shutter speed for the proposed study. The capture scope of the high-speed camera is illustrated in Figure 1. All these experiments were performed in the evening to ensure a good quality of recorded images.

3. Observation Results

3.1. Typical Discharge Phenomenon

Typical observation results of the streamer-leader propagation under switching and long front impulse voltage (1000 µs & 2500 µs) in the 10-m rod–plane gap configuration is illustrated in Figure 2. Based on the positive and negative leaders, the fundamental process is a streamer-leader transition, as addressed in [12,13].
The discharge is initiated with the first corona inception. Although the first corona contains several branches of streamers, having a common root called a stem. During the development stage, ionization takes place at the head of the streamer. The first corona incepts at t = 8.52 µs, leading to corona growth. The experimental results show that the net positive charge is injected rapidly into the gap. This may cause a dark period that is initiated after the first corona. In conclusion, it must last until the inception of the leader-streamer system. Furthermore, there is no current recorded during the dark periods, as illustrated in Figure 2. A leader channel segment would have started if the stem (any of streamers) is thermalized. In other words, if the electrostatic requirements are sufficient for the newly formed leader, this may continue propagating into the gap. In previous studies, when the temperature fell below 2000 K, the discontinuous leader took place in the transition region. The thermalized stage could not be maintained. The streamer leader system consists of a leader channel along with the front streamers. In Figure 2, Figure 3 and Figure 4, the front streamers are produced in the leader front, which feeds the leader through electrons, to sustain the leader development stage. The front streamers’ tip reaches the plate (electrode), initiating the stage of the final jump. In conclusion, the air gap breaks down, providing direct evidence for the physical discharge phenomenon under the standard switching impulse. The waveforms of the applied voltage and the conductive discharge current with rise times of 250 μs, 1000 μs and 2500 µs are depicted in Figure 2, Figure 3 and Figure 4.

3.2. The Continuous and Discontinuous Streamer-Leader Inception

In long air gaps, the unstable stages increase in number, arising before the inception of the leader streamer system under long front impulse. The dark period takes place if and only if the applied voltage variation rate is small [18]. Furthermore, as the voltage increases at a very large rate of variation, there is an absence of the dark period as the discharge process advances through the streamer-leader phases into the gap. In conclusion, the dark period’s characteristics are dependent on the applied voltage, variation rate and the geometric field pattern near the rod. Apart from this, the first corona charge is not enough to support transition (stem leader). This experimental fact shows that discontinuous leaders take place, and last for a longer time during the unstable stage. Although the results show that, although the rate of increase of the applied voltage is insufficient to balance the incremental electric field along the channel, it decreases with time, as illustrated in Figure 3 and Figure 4. Furthermore, some discharge images show that long periods of discontinuous leaders result in maximum decay current approaching zero, leading to a slower process of stem–leader transition is illustrated in Figure 5. Larger voltages are required in order to start continuous leader discharge again, and to achieve the breakdown process. The second corona does not take place directly, but after a relatively long dark period [18]. In conclusion, there is no ionizing activity observed until continuous leader inception is taken into account, as illustrated in Section 3.1. For a detailed description of streamer-leader propagation under positive switch and long front impulse, the reader is referred to Section 4. In this regard, the critical first corona charge (Qcrit) is sufficient to support leader inception when the standard and positive long front impulse are 0.23 µC, 0.07 µC and 0.08 µC.

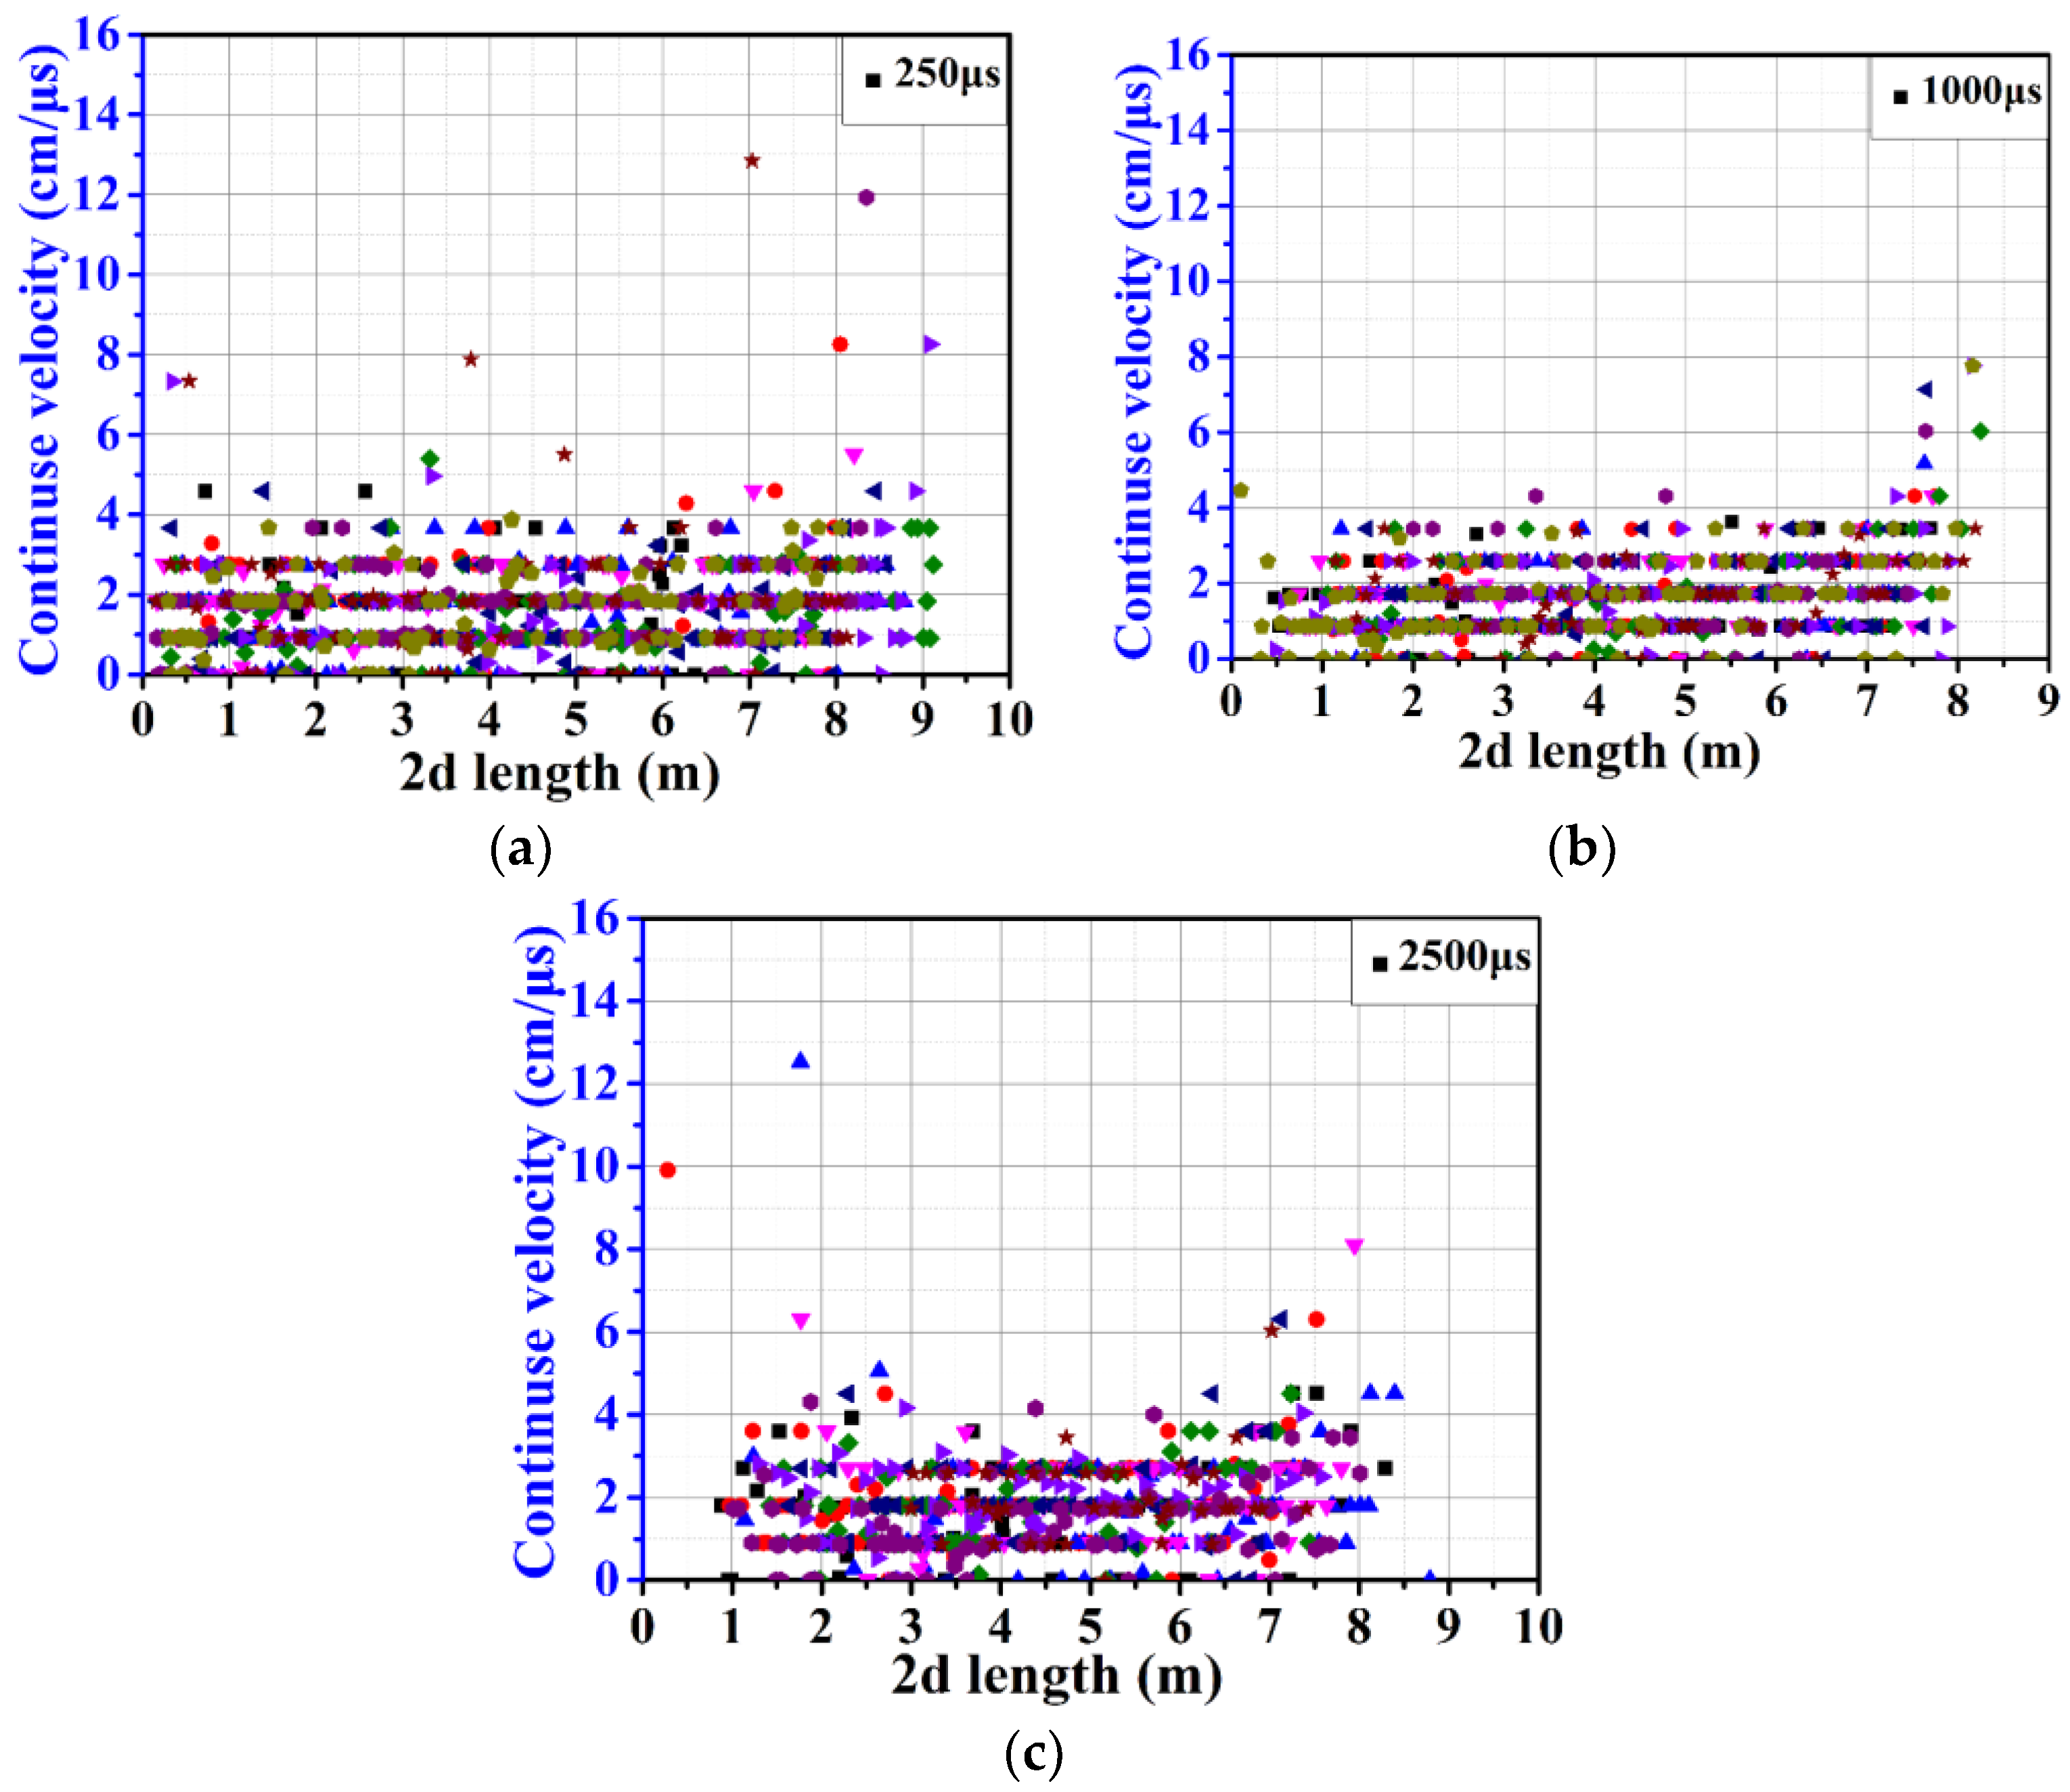
3.3. Continuous Leader Velocity and Charge Density

The propagation velocities of 29 discharges calculated under standard and long front impulses are illustrated in Figure 6. For one frame, the leader velocity (VL) is defined by the following equation:
V = (l2l1)/(t2t1)
where ∆l = displacement between two nearby frames of luminous spots in the leader tip, and ∆t = exposure time, i.e., each frame (5 µs). The leader velocity functions as axial leader length. The leader velocity corresponds to two leader stages, i.e., the stable and final jump stages, as illustrated in Figure 6. Several experiments were carried out in a 10-m rod–plane gap under standard and long front positive impulse voltage to describe the characteristics of the positive streamer leader propagation processes. In the experimental studies, many discharge images are marked with a different color, as illustrated in Figure 6 and Figure 7. Furthermore, these distinct colors represent each experimental shot during analysis, with a view toward improving our understanding under standard and long front positive impulse voltage.
Based upon the above analysis, stable and final jump stages under standard and long front impulse condition are 0–3 cm/µs, and greater than 4 cm/µs, respectively. Moreover, the experimental results show that the average continuous leader velocity in the 10-m rod–plane gap configuration is 1.5 cm/µs to 1.7 cm/µs, which supports the results described by the Les Renardières Group [12]. For all cases, the average axial leader velocities before the final jump are illustrated in Figure 6. Furthermore, an increase in the applied voltage and electric field leads to a higher leader velocity in the gap. In conclusion, the leader channel luminosity and the propagation velocity increase significantly during the period of the final jump.
The continuous leader velocity obtained through injecting charge into the transition region is determined by the streamer zone (in front of the leader tip). The injected charge quantity is directly proportional to the leader length, as shown in Figure 7. The horizontal coordinate denotes the 2D leader length, showing the continuous leader propagation of the aforementioned cases, while the vertical coordinate shows the total injected charge. The 2D leader length increases gradually as the injected charge increases. Figure 7 shows a positive correlation between the 2D leader length and the injected charge. Based on these results, the average injected charges under switching and long front impulse are 235.1 µC, 141.1 µC and 138.7 µC. Thus, the 2D leader length and charge inserted in the case of 250 µs are greater, leading to the rapid increase of the net injected charge rate in the region of the leader streamer, as illustrated in Figure 7a.
In the 2500 µs case, the proposed method has a lower 2D leader length and injected charge, and leads to the slow increase in the net injected charge rate, as illustrated in Figure 7c. Occasionally, a particular situation can be achieved, in which the injected charge activity is small enough that the requirements for stable propagation are not fulfilled. As a result, the current decreases to zero.
Conversely, the unique behaviors observed in the 1000 µs case suggest the characteristics of both of the aforementioned cases. This is proved by the experimental data shown in Figure 7b.
First, the current waveform of all cases is integrated to obtain the charge quantity. The influx of charge is considered using the equation below to derive the change of linear charge density of the leader channel under switching and long front impulse voltage.
Q = t 1 t 2 i ( t ) d t
where i = measured discharge current and t1, t2 = onset and discharge terminal time.

3.4. Streamer and Final Jump Length

In Figure 2 and Figure 3, a typical streak of restrike images of positive leader propagation in a rod–plane configuration is presented. Here, the leader tip and the streamer zone are depicted. The corona region ahead of the leader tip is called the streamer zone. In [19], Gallimberti proposed the mechanism related to streamer to leader transition and showed that air in the streamer (stem) is heated because of the injected electrons formed in the streamer zone. Furthermore, injected electrons depend on the streamer zone length, as well as the electric field (ambient). The discharge propagation sustained by the streamer-leader transition remains until the first streamer of the leader corona reaches the plane. The final jump length is considered to be the maximum streamer length during the continuous leader propagation phase. These experimental results show that the average streamer length is 0.518 m, and 0.878 m under a long front impulse (1000 µs and 2500 µs). This implies that the greater average streamer length is achieved, and the proposed method has higher 2D leader length of 2500 µs, compared to 1000 µs, as illustrated in Figure 8. Furthermore, the average final jump length is 2.27 m under switching impulse conditions, while the average final jump length of long front impulse is 1.81 m and 1.75 m. However, the average final jump length under standard impulse is greater than that under long front impulse voltage. The reason is that the streamer zone length is larger, so the injected electrons are higher in number during the final jump stage as compared to other cases.

4. Discussion

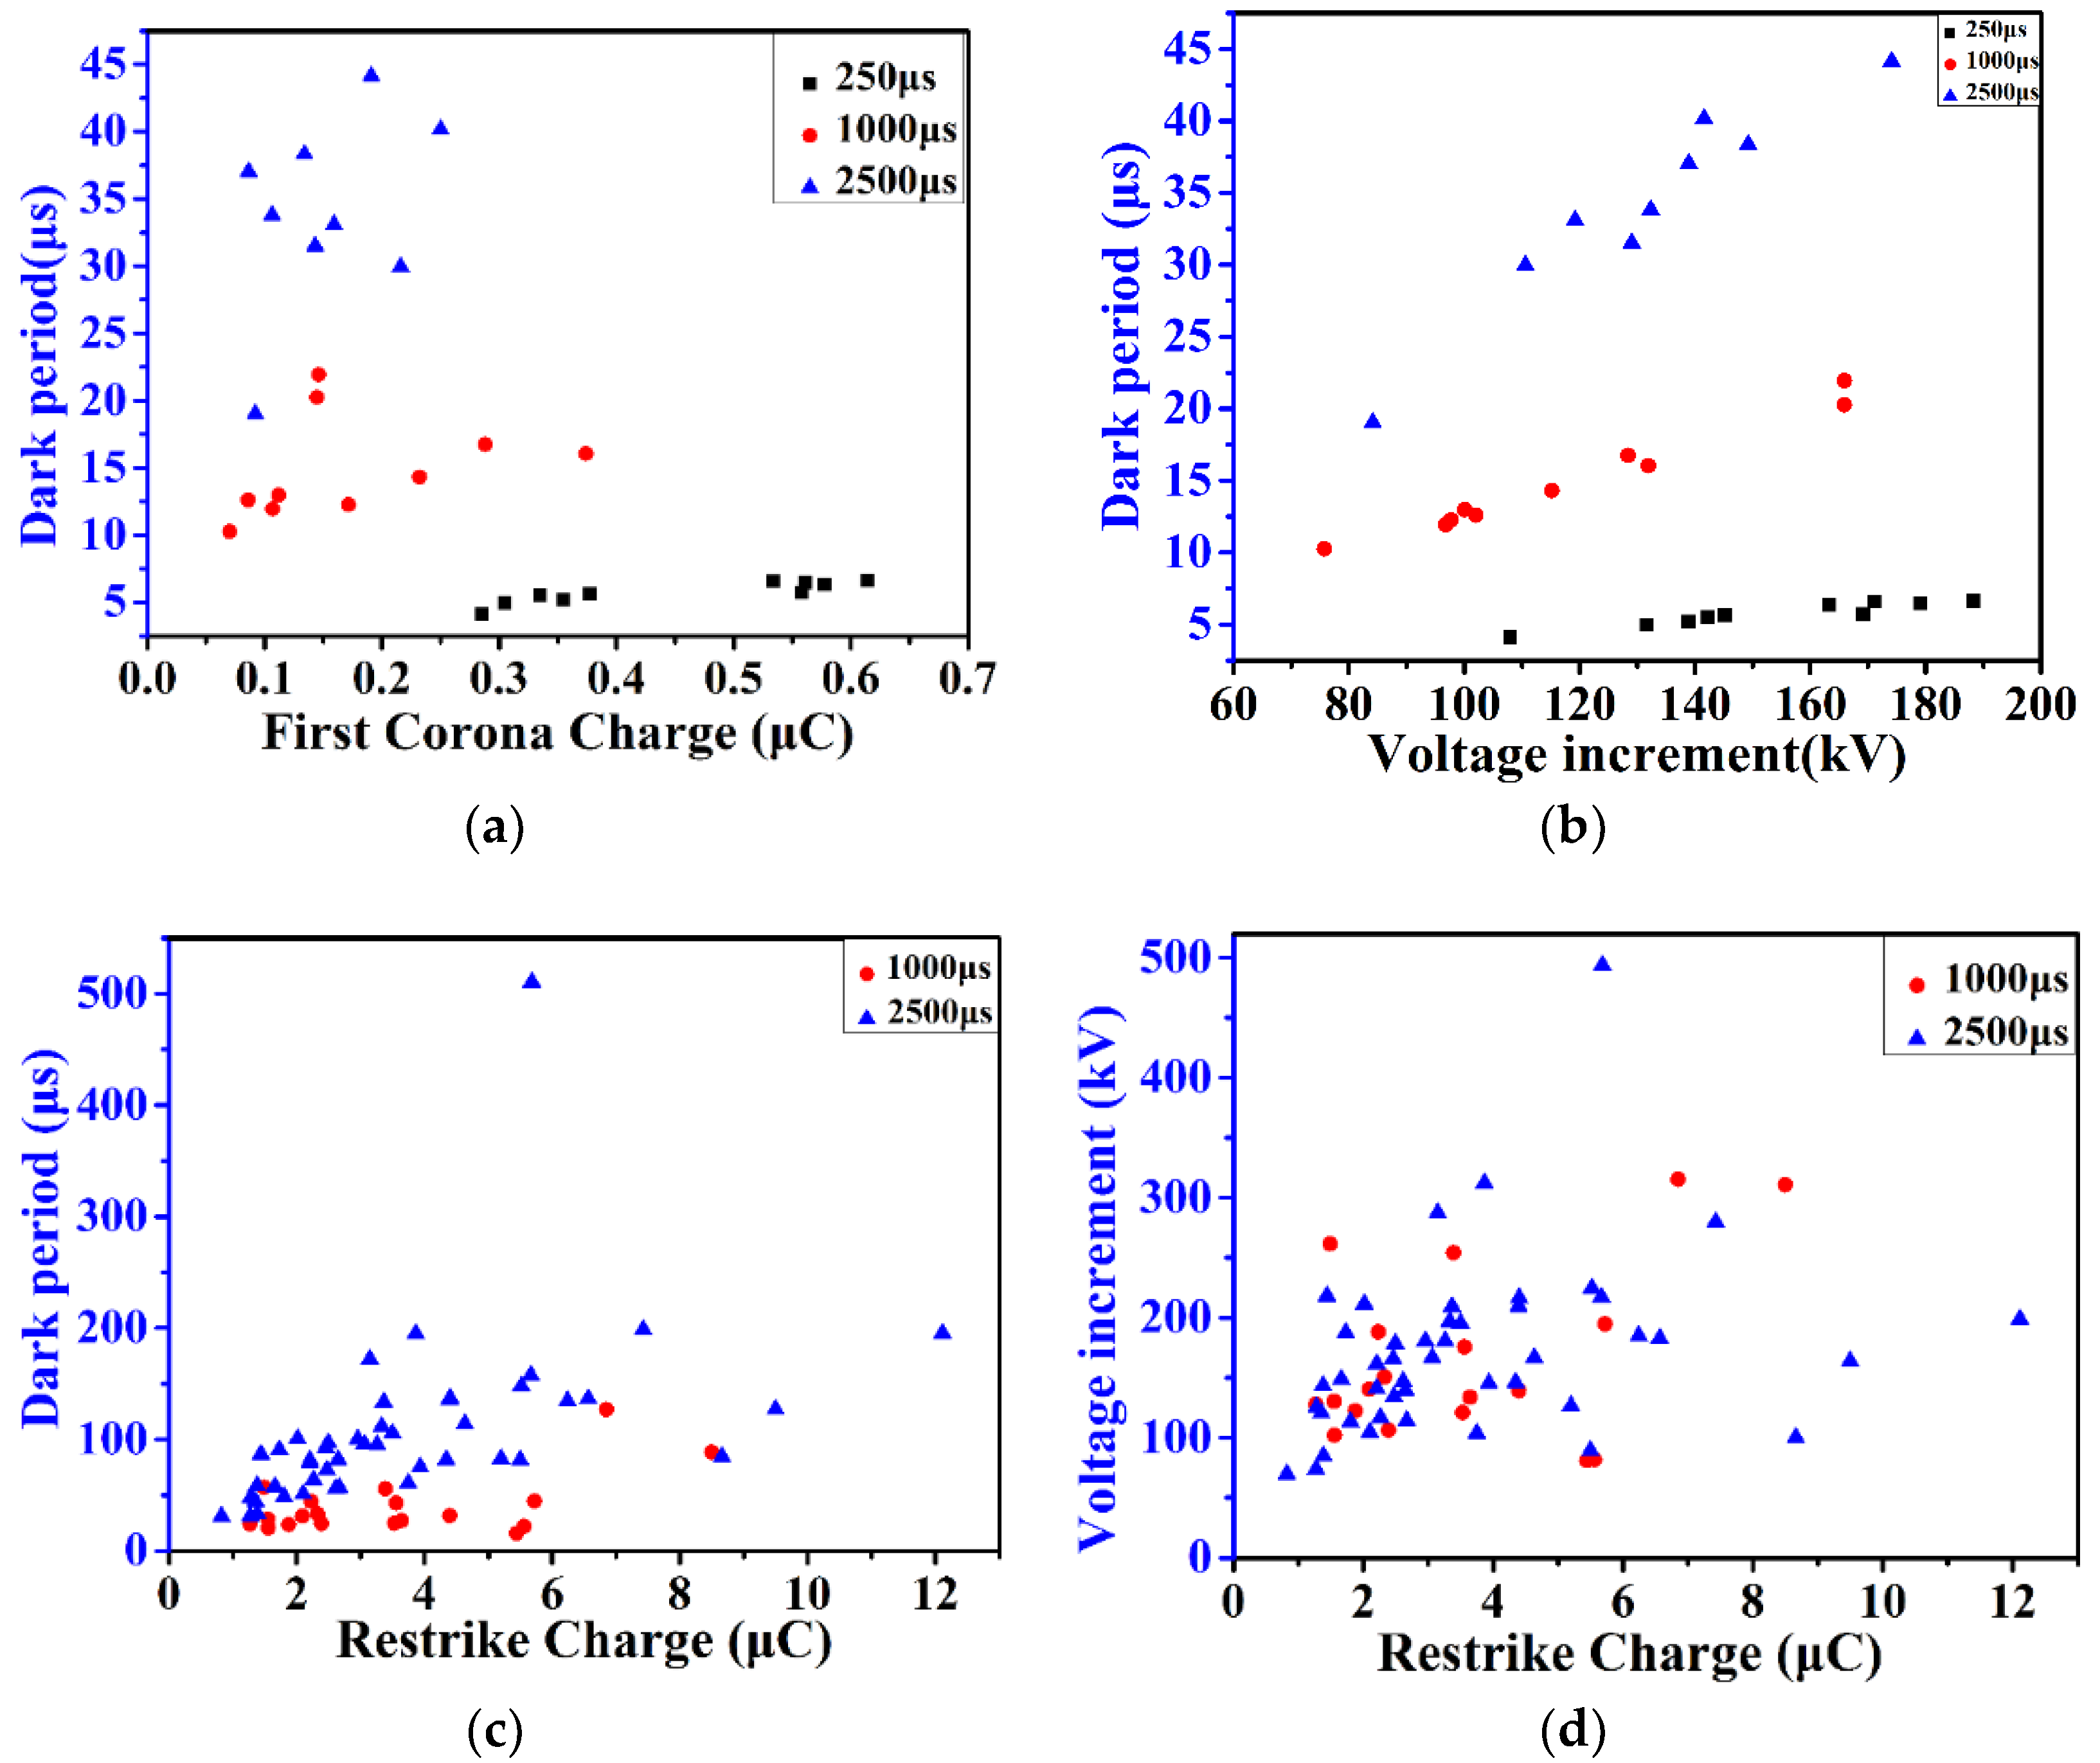
4.1. Relationship between Dark Period and Corona Charge

The relationship between the first corona charge (Q) and the dark period (Td) with a rise time of 250 μs, 1000 μs and 2500 µs is presented in Figure 5a,b. The literature related to long air gap discharge suggests that humidity influences the streamer to leader transition by decreasing the duration of the dark period. The physical parameter corona charge is suitable to define the stem-leader transition, which occurs due to transfer of energy (electrons, neutral molecules) in the stem [18,19]. The streamer leader during the inception stage depends on the stem leader transition, and the inception of streamers front across the gap. The moving anode region represents the streamer front, and the removal of electrons from the gas through photoionization, as well as the space charge produce the choking effect of the electrical field around the leader tip. The propagation of the leader tip in the gap maintains the (electric field) in the corona active front. On the other hand, it supports the ionization phenomena required for streamer propagation. However, the positive ions decrease the electric field near the rod tip. Moreover, this delays the streamer inception in front of the stem. Gallimberti proposed [19] the duration of the dark period and applied voltage growth, and the increase in the rate of injected charge by the first corona (choking effect) shows an important influence of the absolute humidity.
Due to choking effect of space charges, the front streamers commonly cannot incept directly after the transition of stem leader. In conclusion, as the voltage rises, the incremental electric field neutralizes the shielding effect of positive space charges. If this occurs, the electric field near the initial leader tip fulfills the conditions (streamer inception). Thus, the leader streamer propagation begins.

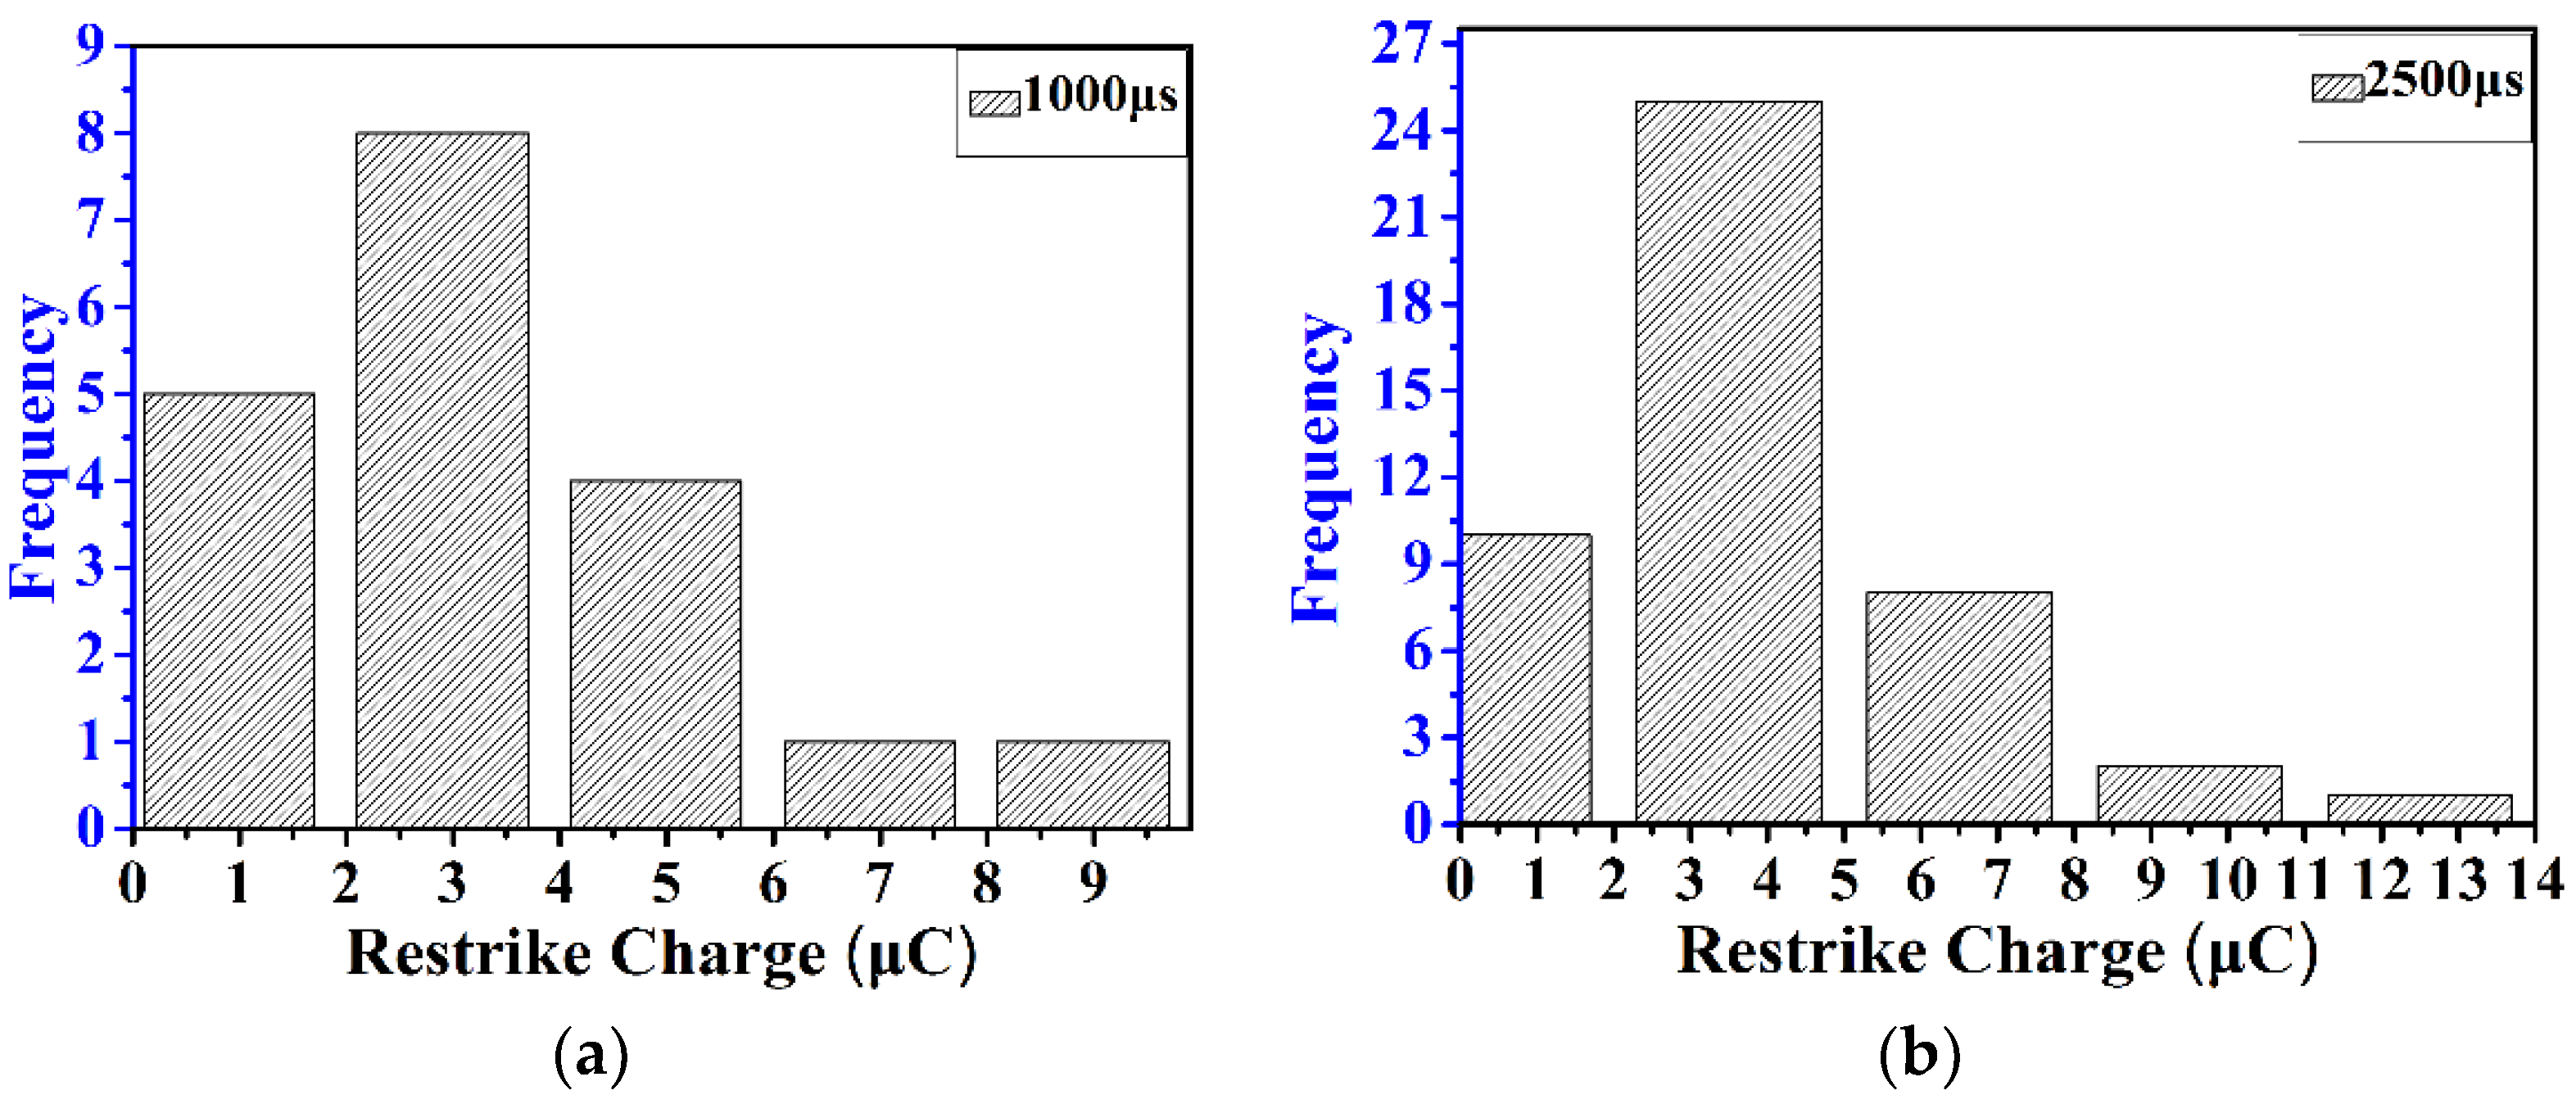
4.2. Relationship between Dark Period and Restrike Charge
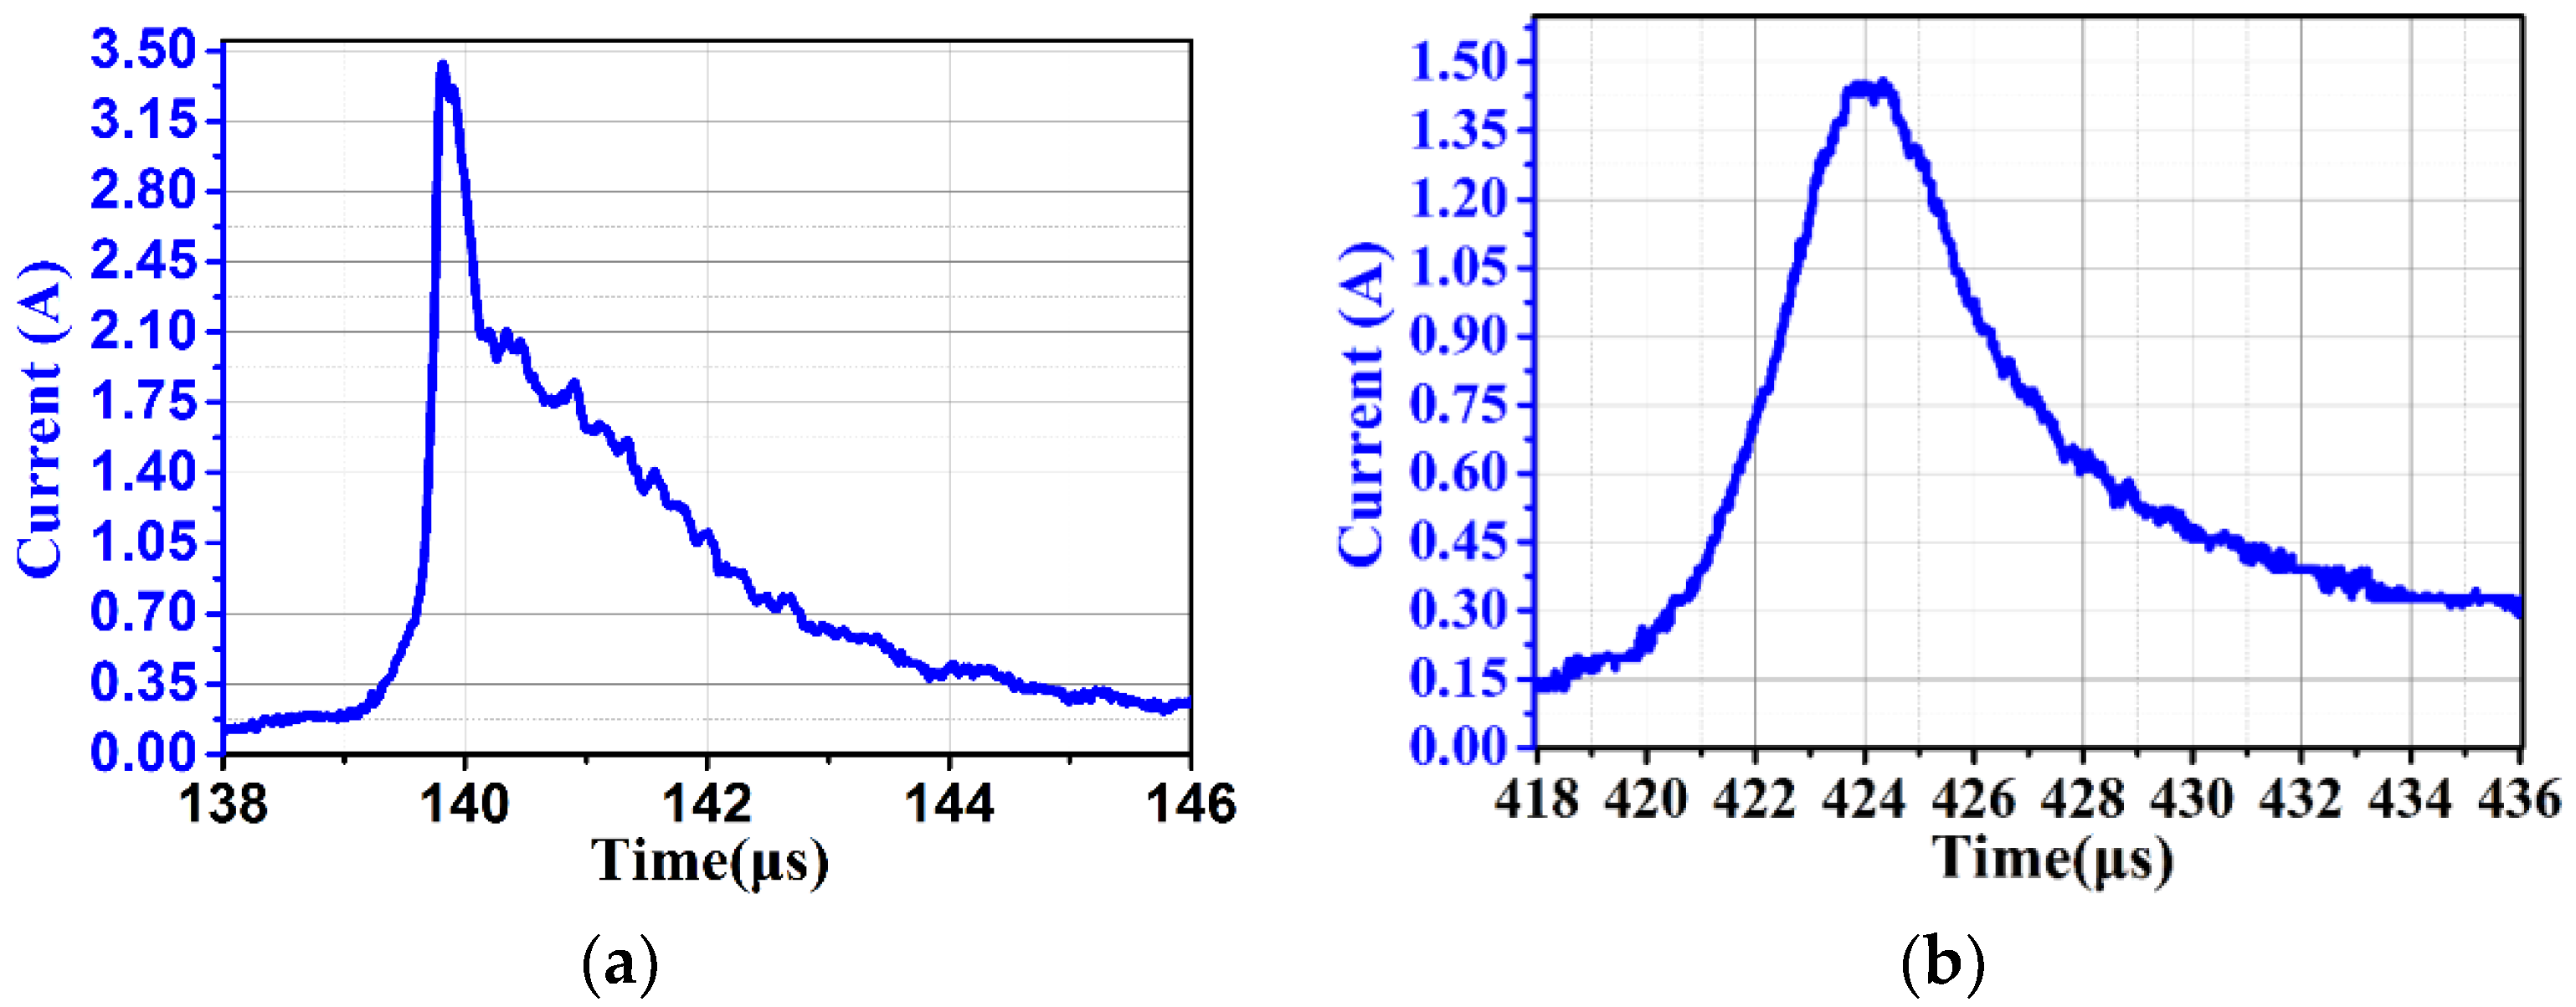
Comparing the features of 1000 µs and 2500 µs cases, it was observed in Section 3.1, which shows the current decays to zero because positive space charge caused by (first corona) impulse drops the electric field of the electrode tip. In general, the luminosity of continuous leader channel is lower except at its tip. For the cases of long front impulse, the calculation and discharge results indicate that a corona charge of less than 1 µC flows through the stem, which can support the stem to leader transition, this longer transition time is needed to break down.
As noted earlier, the branches of the leader, restrikes, and discontinuous leaders were observed clearly during the development of leader-streamer propagation. Then, however, an explanation based on different numbers of restrike behavior at t = 114.34 µs in the unstable stages, and at t = 216.2 µs, 306.2 µs, 371.2 µs, 431.2 µs, and 606.2 µs under 1000 µs and 2500 µs cases. This unique observation suggests that the lower and upper limit of the restrike charges is in the range of 1.28 µC to 8.5 µC, and 0.825µC to 12.11µC under both cases, as illustrated in Figure 5c,d. Therefore, as the uncertainty of air discharge, restrike charge under 1000 µs showed, restrikes are just very rare, but the amplitude of current during a restrike was estimated to be 1.20 A, as compared to the 2500 µs case of such a scenario.

4.3. Leader Current

The net positive charge during the time interval is associated with a current flowing into the leader tip as given in the equation below:
i ( L ) = ( Q 2 Q 1 ) / ( t 2 t 1 )
An increasing order of restrikes under long front impulse in a 10-m gap was observed in this study (2 to 5 restrikes). The Les Renardieres Group showed that the net ionization rate in the streamer zone of the positive leader decreases due to humidity increases. Subsequently, the attachment coefficient increases greatly with the increase of water vapor density. In conclusion, the photoionization processes are inhibited, which may lead to the frequency of restrikes increasing [12,13]. The current pulses related to re-illuminations were resolved in time. However, two types of restrike currents were found with shorter and longer rise times under a long front impulse. The bell-shaped pulse in Figure 9b corresponds to a corona occurring at the leader tip, whereas the pulse with the steep rise and shorter duration observed under the long front impulse occurred after the leader elongation had stopped. Further measurement is performed in order to resolve the rise and wave tail time along the leader channel during a re-illumination.
In Figure 9a, the amplitude of the current during a restrike was likely to be 3.46 A. The rising time of the current pulse is 3.10 µs, while the voltage is 963.4 kV at t1 = 139.33 µs and t2 = 139.81 µs. From these results, it is confirmed that the initial current of the impulse is not equal to zero. In conclusion, there are ionization activities in the streamer zone. Furthermore, the generated electrons are not completely absorbed by means of the neutral molecules. The leader tip potential increases significantly due to the voltage increment, which leads to relatively weak ionization in the streamer tip. This is similar to the condition of continuous leader propagation.
On the other hand, Figure 9b shows that the amplitude of the current during a restrike was likely to be 1.46 A. The rising time of the current pulse is 1.32 µs, while the voltage is 1730.02 kV at t1 = 418.10 µs and t2 = 424.32 µs. These results show that almost all of the charges associated with this type of restrike are found near the leader tip, and are also related to the leader elongation. Thus, the increase in current would be balanced by an increase in the channel conductivity.
The velocity probability distributions of 19 and 46 restrikes under 1000 µs and 2500 µs cases, respectively, are illustrated in Figure 10. These restrike are divided into five time intervals. In 1000 µs, the time interval lies in the range from 0.01 µs to a maximum value 0.02 µs, while for the 2500 µs case, the time interval lies in the range of 0.0105 µs to 0.014 µs, as illustrated in Figure 10. This implies that greater restrike velocity is achieved and the proposed method has a higher probability distribution for 2500 µs, as compared to 1000 µs.
In 1000 µs, the corresponding impulse charge transfer of the first restrike was usually 3.53 μC, and increased with the restrike order. As discussed in Section 3, the difference between the two propagation conditions (continuous uniform growth and stepwise advancement) under experimental conditions are observed if the humidity changes. Furthermore, restrike phenomena do not exist for lower values of about 10 g/m3. If the humidity exceeds the reference value, the total average leader velocity is greatly increased because of the step elongations, which causes a sharp increase in mean leader speed; also, the continuous velocity in between restrikes slightly increases [18]. The injected charge probability distribution of 19 and 46 restrikes under 1000 µs and 2500 µs are presented in Figure 11. As noted in the above section, the time interval of restrike charge is divided into five parts. However, experimental results indicate that the time interval lies in the range of 2.9 µs to a maximum value of 3.9 µs at 1000 µs, whereas the time interval lies in the range of 3.5 µC to 5 µC under the 2500 µs case. Therefore, our observations presented here allow the reader to compare the restrike charge that has higher probability distribution of 2500 µs, as compared to 1000 µs, as illustrated in Figure 11.

5. Conclusions

In this research work, the experimental results on leader development in a 10-m rod–plane configuration have been shown under positive impulse with a rise time of 250 μs, 1000 μs and 2500 µs. Three discharge types have been found (discontinuous leader, restrike, and continuous). The streamer to leader propagation process was completed with a CCD camera, which provides clear physical morphology and positive leader propagation.
  • The findings of this study have assisted in understanding the higher time resolution images; continuous leader development and its parameter setting were examined with respect to 2D leader length, injected charge, final jump phase and leader velocity for rod–plane configuration. The results indicate that the average continuous leader velocity of the 10-m rod–plane configuration is (1.5 cm/µs to 1.7 cm/µs), which is in agreement with the observation outcomes described by the Les Renardières Group.
  • In the 1000 µs case, continuous injected charge under positive long front impulse voltage was observed that shows some similar characteristics to other cases. Furthermore, the proposed method has higher average injected charge of 250 µs compared to the aforementioned cases. By looking at the results, the average final jump length is 2.27 m under switching impulse conditions, while the average final jump length of the long front impulse is 1.81 m and 1.75 m. Finally, the experimental results for the average streamer length is 0.518, and 0.878 under long front impulse condition.
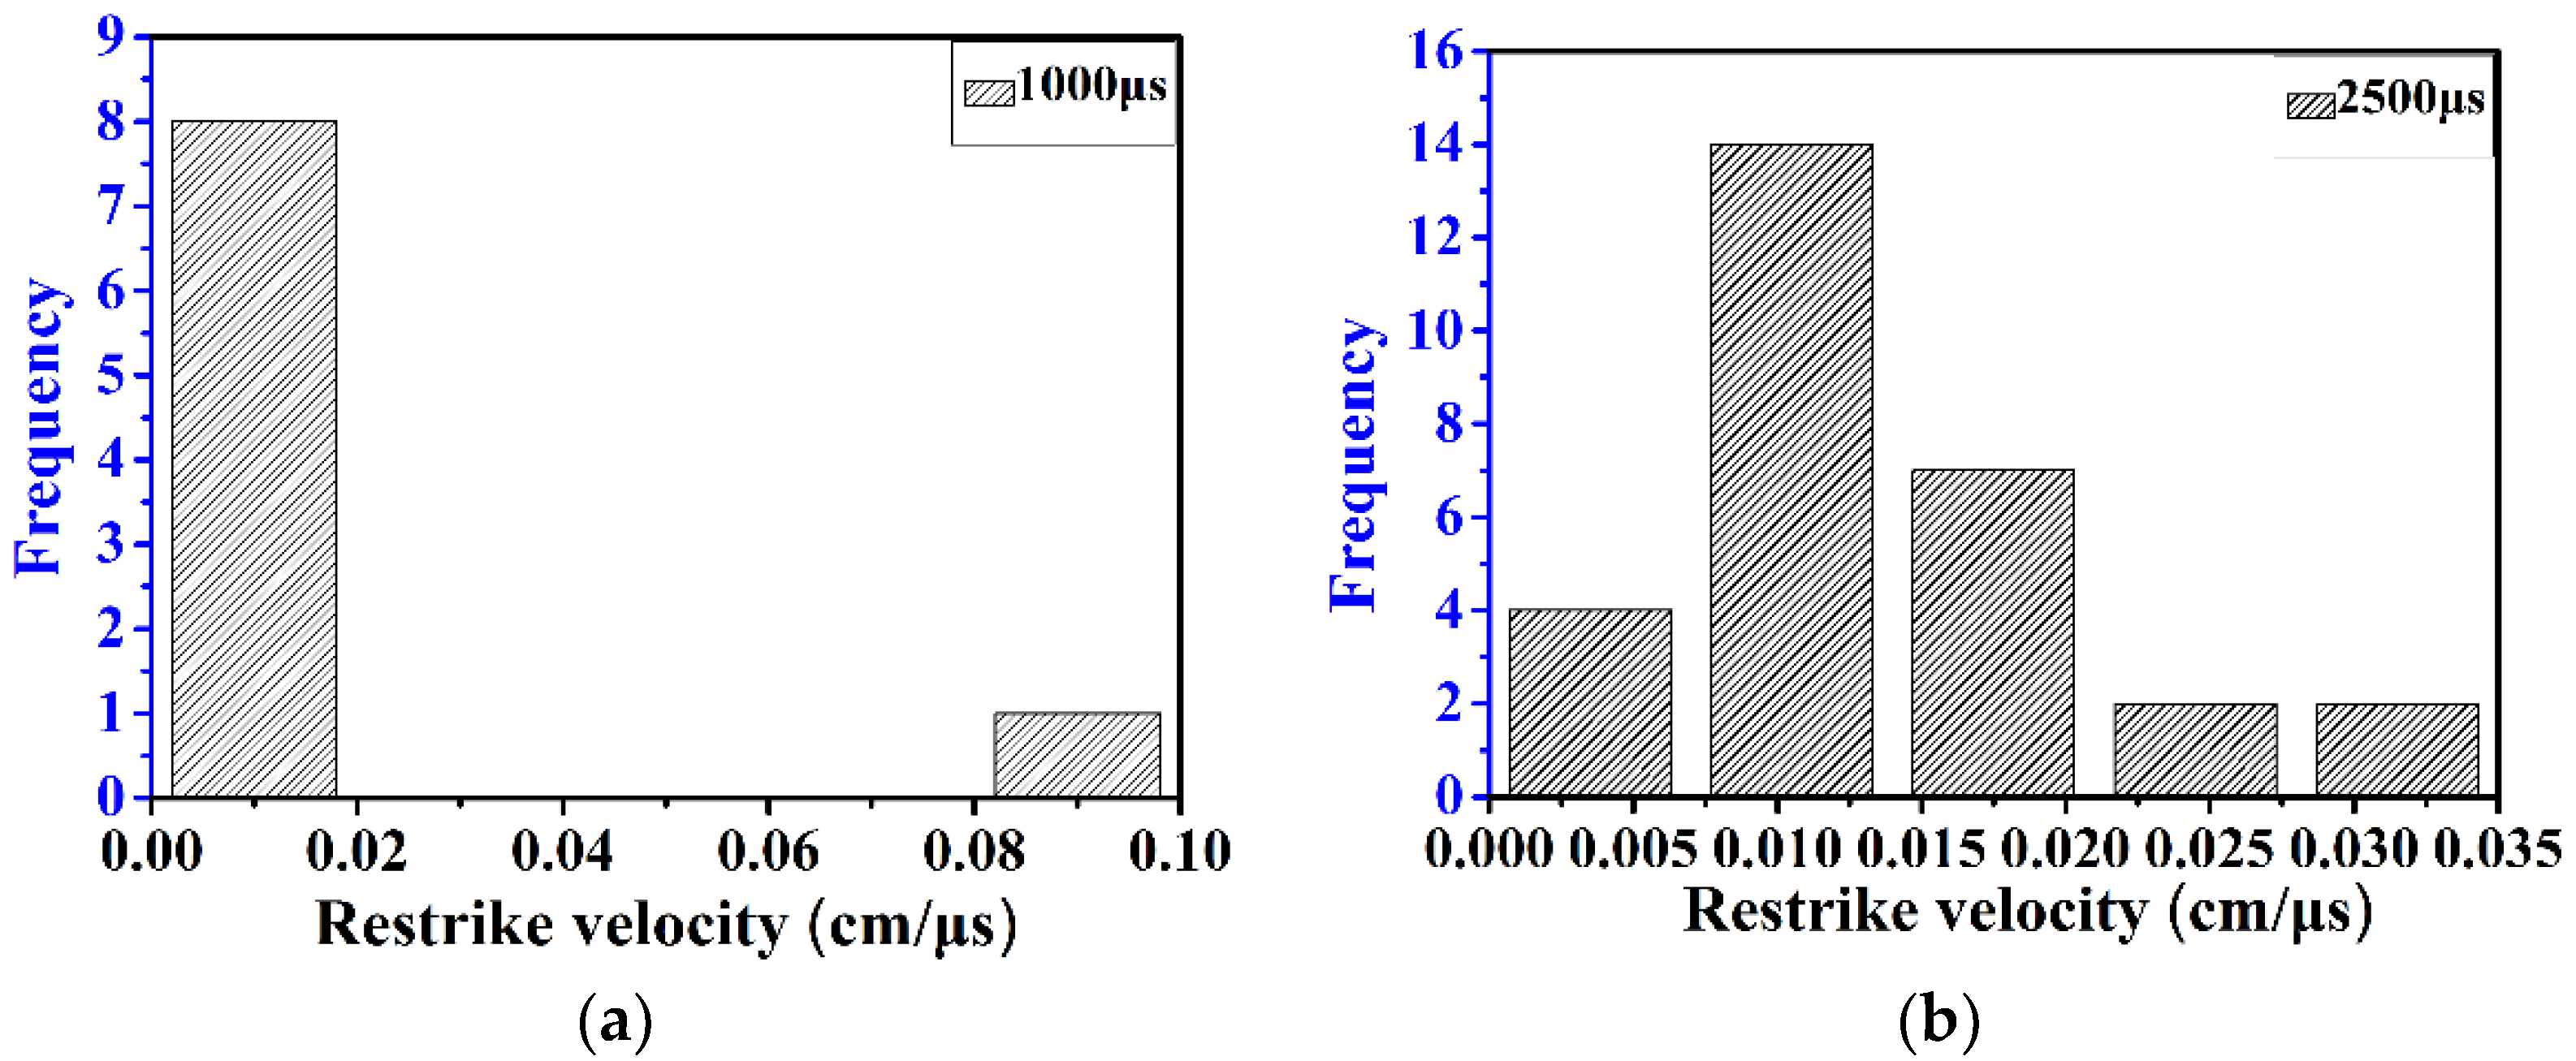
  • The observation results show some important characteristics related to its unstable stage, namely, discontinuous streamer-leader propagation processes. A typical two-restrike pulse of current waveforms in a 10-m rod–plane gap under long front impulse are reported in this paper. These results show that the triggering of the restrike after a zero current period is due to the field recovery near the rod tip in the restrike type. Furthermore, an overview of the appearance of channel re-illumination and its parameter settings has been examined with respect to velocity and charge. Finally, the experimental results show that a greater restrike velocity is achieved, and charge has a higher probability distribution of 2500 µs compared to 1000 µs.

Author Contributions

All authors contributed to this research work. W.A.S., H.H., J.H. developed the research framework, analyzed the results and prepared the manuscript. Y.Y. improved the theoretical aspects of this paper. All authors revised and approved the manuscript.

Funding

This research received no external funding.

Acknowledgments

The authors have gratefully acknowledged the State Grid Corporation of China for the supply and guidance on the UHV DC test base, State Key Laboratory of Advanced Electromagnetic Engineering and Technology, Huazhong University of Science & Technology for providing necessary facilities. The authors would like to give special thanks Xiao Pei to provide experimental help and statements that greatly improved the manuscript preparation.

Conflicts of Interest

The authors declare no conflict of interest.

References

  1. Kumar, U.; Bokka, P.K.; Padhi, J. A macroscopic inception criterion for the upward leaders of natural lightning. IEEE Trans. Power Deliv. 2005, 20, 904–911. [Google Scholar] [CrossRef]
  2. Becerra, M.; Cooray, V. Time dependent evaluation of the lightning upward connecting leader inception. J. Phys. D Appl. Phys. 2006, 39, 4695–4702. [Google Scholar] [CrossRef] [Green Version]
  3. Aleksandrov, N.L.; Bazelyan, E.M.; Carpenter, R.B.; Drabkin, M.M.; Raizer, Y.P. The effect of coronae on leader initiation and development under thunderstorm conditions and in long air gaps. J. Phys. D Appl. Phys. 2001, 34, 3256–3266. [Google Scholar] [CrossRef]
  4. Gu, D.; Zhou, P.; Dai, M.; Xiu, M.; He, H. Comparison and analysis on over-voltage and insulation coordination of UHV AC transmission system between China and Japan. In Proceedings of the IEEE PES General Meeting, Providence, RI, USA, 25–29 July 2010; pp. 1–7. [Google Scholar]
  5. Lloyd, K.J.; Zaffanella, L.E. Switching Impulse Tests at Project UHV Using Longwave Fronts. IEEE Trans. Power Appar. Syst. 1981, 100, 510–517. [Google Scholar] [CrossRef]
  6. Carrara, G.; Dellera, L.; Sartorio, G. Switching Surges with Very Long Fronts (above 1500 us): Effect of Front Shape on Discharge Voltage. IEEE Trans. Power Appar. Syst. 1970, 89, 453–456. [Google Scholar] [CrossRef]
  7. Cortina, R.; Garbagnati, E.; Pigini, A.; Sartorio, G.; Thione, L. Switching impulse strength of phase-to-earth UHV external insulation—Research at the 1000kVproject. IEEE Trans. Power Appar. Syst. 1985, 104, 3161–3168. [Google Scholar] [CrossRef]
  8. Kim, J.B.; Shim, E.B.; Shim, J.W. Switching overvoltage analysis and air clearance design on the KEPCO 765 kV double circuit transmission system. IEEE Trans. Power Deliv. 2000, 15, 381–386. [Google Scholar]
  9. Menemenlis, C.; Harbec, G. Switching impulse breakdown of EHV transmission towers. IEEE Trans. Power Appar. Syst. 1974, 255–263. [Google Scholar] [CrossRef]
  10. Harada, T.; Aihara, Y.; Aoshima, Y. Influence of switching impulse wave shape on flashover voltages of air gaps. IEEE Trans. Power Appar. Syst. 1973, 3, 1085–1093. [Google Scholar] [CrossRef]
  11. Menemenlis, C.; Isaksson, K. The front shape of switching impulses and its effect on breakdown parameters. IEEE Trans. Power Appar. Syst. 1974, 93, 1380–1389. [Google Scholar] [CrossRef]
  12. Les Renardieres Group. Positive discharges in long air gaps at Les Renardieres. Electra 1972, 23, 53–157. [Google Scholar]
  13. Les Renardieres Group. Positive discharges in long air gaps at Les Renardieres. Electra 1977, 53, 31–153. [Google Scholar]
  14. Domens, P.; Gibert, A.; Dupuy, J.; Hutzler, B. Propagation of the positive streamer-leader system in a 16.7 m rod-plane gap. J. Phys. D Appl. Phys. 1991, 24, 1748–1757. [Google Scholar] [CrossRef]
  15. Ortega, P.; Domens, P.; Gibert, A.; Hutzler, B.; Riquel, G. Performance of a 16.7 m air rod-plane gap under a negative switching impulse. J. Phys. D Appl. Phys. 1994, 27, 2379. [Google Scholar] [CrossRef]
  16. Yue, Y.; He, H.; Chen, W.; He, J. Characteristics of Long Air Gap Discharge Current Subjected to Switching Impulse. J. Power Energy 2015, 1, 49–58. [Google Scholar]
  17. Da Silva, C.L.; Pasko, V.P. Dynamics of streamer-to-leader transition at reduced air densities and its implications for propagation of lightning leaders and gigantic jets. J. Geophys. Res. Atmos. 2013, 118, 13561–13590. [Google Scholar] [CrossRef]
  18. Bondiou, A.; Gallimberti, I. Theoretical modelling of the development of the positive spark in long gaps. J. Phys. D Appl. Phys. 1994, 27, 1252–1266. [Google Scholar] [CrossRef]
  19. Gallimberti, I. The mechanism of the long spark formation. J. Phys. Colloq. 1979, 40, 193–250. [Google Scholar] [CrossRef]
Figure 1. Schematic diagram of the experimental configuration.
Energies 11 02636 g001
Figure 2. (a) Discharge photographs of the 10-m rod–plane configuration (b) The inset in the voltage and current diagram is the (partially enlarged) first corona current under switching impulse.
Energies 11 02636 g002
Figure 3. (a) Discharge photographs in the 10-m rod–plane configuration under long front impulse. (b) For 1000 µs, the inset in the voltage and current is the (partially enlarged) first corona current under a long front impulse voltage.
Energies 11 02636 g003
Figure 4. (a) Framing photographs of the (positive discharge) in the 10-m rod–plane configuration under long front impulse. (b) For 2500 µs, the inset in the voltage and current is the (partially enlarged) first corona current under a long front impulse voltage.
Energies 11 02636 g004
Figure 5. Comparative analysis of voltage increment under switching and long front impulse voltage verses dark period: (a,b) first dark periods, (c,d) multiple dark periods.
Energies 11 02636 g005
Figure 6. Continuous leader velocity of 10-m rod–plane gap under switching and long front impulse versus axial length. (a) For 250 µs (b) For 1000 µs (c) For 2500 µs.
Energies 11 02636 g006
Figure 7. Injected charge vs. leader length in a 10-m rod–plane configuration under switching and long front impulse. (a) For 250 µs (b) For 1000 µs (c) For 2500 µs.
Energies 11 02636 g007
Figure 8. Streamer length as a function of leader length under long front impulse.
Energies 11 02636 g008
Figure 9. Typical restrike pulses of current waveforms in a 10-m rod–plane gap under long front impulse. (a) Steep rise with short duration, (b) bell-shaped pulse.
Energies 11 02636 g009
Figure 10. Probability distribution of restrike velocity in a 10-m rod–plane gap under long front impulse. (a) For 1000 µs (b) For 2500 µs.
Energies 11 02636 g010
Figure 11. Probability distribution of the injected charge in a 10-m rod–plane configuration under long front impulse. (a) For 1000 µs (b) For 2500 µs.
Energies 11 02636 g011

