1. Introduction
During the development and testing of a small-size solar plant based on the concentration of sunlight on photovoltaic cells, some modules did not achieve the expected performance. It was considered appropriate and useful to investigate the cause of the malfunction of these modules.
The basic module consisted of a string of 18 photovoltaic cells connected in series and protected in groups of three photocells using a bypass diode. The CPV (Concentration PhotoVoltaic) modules, aligned in a row, were placed in the focus of a linear parabolic concentrator. The purpose was twofold: mainly to produce electricity, but also to obtain heat by using the photocell cooling fluid that comes out of the system at 90 °C. This temperature had been chosen in order to maintain an optimal photovoltaic conversion efficiency.
During the experimentation of the photovoltaic components exposed to the sun, the output power of the modules did not reach the expected level. The output power was previously estimated, based on the appropriate measurements with a solar simulator on the photocells. Therefore, the researchers tried to understand the reason, after excluding other causes of error as misalignments between photocells and parabolic collector. In short, the issues were to know how many and which photocells worked inside the modules, and furthermore, in the event that some cells did not work, if any of them were recoverable.
After some attempts, conducted looking from outside the modules, it was decided that the least invasive method was an electroluminescence (EL) test. In the EL test, the photovoltaic cell is considered a diode polarized directly; the working condition of the cell is highlighted by its illumination.
The electroluminescence method is widely used in the photovoltaic field. It can be used to control the physical characteristics of the junction [
1,
2,
3,
4]. It can be applied to detect manufacturing defects or any component degradation [
5,
6,
7,
8,
9]. The use of digital cameras makes this methodology very practical [
10] and easy to use.
In practice, the operator examines the number of cells that light up in a module: the illuminated photocells indicate how many cells, and which cells, work. It is a very pragmatic method to verify the behavior and integrity of each photocell mounted inside an installed module. The number of functioning cells indicates the performance level of each photovoltaic module. A practical advantage of the EL test is that it would allow the operator to obtain certain indications without disassembling the CPV module.
A visual examination of the low-performance modules mounted on the small-size solar plant showed traces of moisture inside the modules above the photovoltaic cells. The probable causes could be internal condensation, due to the temperature variation between day and night, or to the infiltration of water, caused by an imperfect sealing of the modules. The negative influence of humidity has long been known [
11] and is under investigation in the plant under examination.
An inspection of a purely qualitative nature was carried out using EL tests on all the photovoltaic modules of the small-sized CPV solar plant. These photovoltaic components consisted of 48 modules that had already been installed on the solar plant before the EL test.
The initial step of the inspection was to examine the 48 modules with a first series of electroluminescence tests in order to highlight the photocells that did not work inside each module.
Once the inoperative cells were identified, a practical experiment was attempted to understand if the internal humidity was a cause of the malfunction, and then if the photocell operation could be restored. The experimental method used was a dehumidification treatment in a climatic chamber, applied only on a set of selected modules. Therefore, some modules that did not work during the first EL tests were subjected to treatment in the climatic chamber and again tested to check for any differences from the previous EL test.
2. Electroluminescence Test
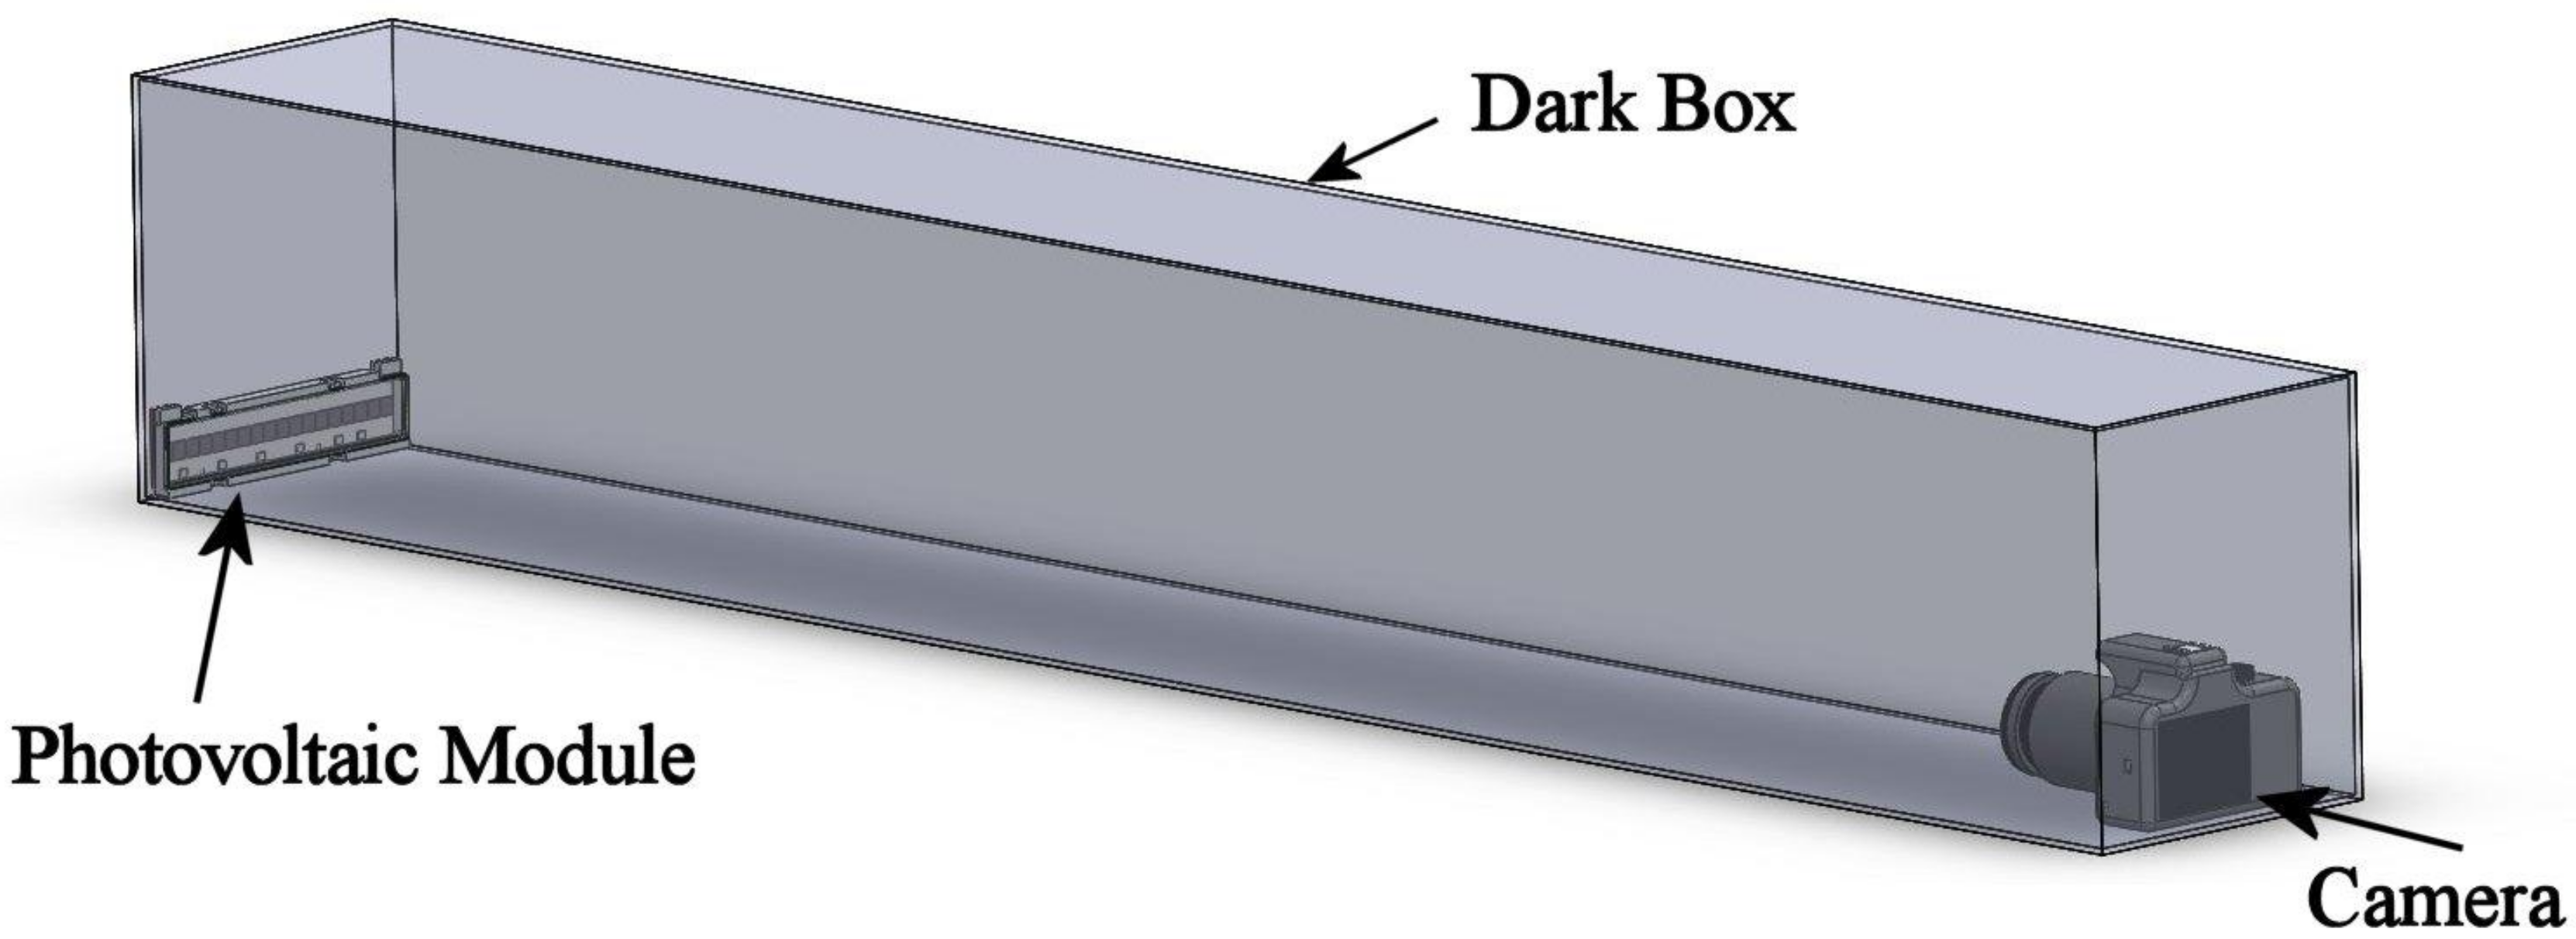
To perform tests based on the electroluminescence technique, a black box was constructed specifically for this purpose. The requirement of a dark environment arises from the fact that the light emission of the photovoltaic cells under test takes place in the visible spectrum but with a low intensity. Therefore, a dark environment is needed to properly observe and evaluate the test results. The test bench is presented in
Figure 1: it consisted of a black plastic box (length 1650 mm, width 220 mm, and height 260 mm) with a camera at one end and the photovoltaic module at the opposite end. Both sides of the box had accesses to place the module under test and the camera.
The camera used was a Canon EOS Rebel T2, with shooting time of 1/5 s; diaphragm f/2.8; 1600ISO sensitivity; focal length of 70 mm; and USB interface. The camera was connected to the PC in “live view” mode and the photo was acquired using a remote shutter controlled by the PC.
For the electroluminescence test, the modules were supplied by a Direct Current Power Supply, adjustable in voltage and current, which was interfaced to a voltmeter and an amperometer. The main features of the power supply were:
- -
Model: HP E3612A
- -
Input: 230 V AC
- -
Output: 0–60 V, 0–0.5 A
- -
Measurement accuracy: ± 0.5% at 25 °C
- -
Output characteristics
V01 = 120 V, V02 = 60 V
I01 = 0.25 A, I02 = 0.5 A
The DC power supply can be used by setting voltage and current values separately. The features of the HP E3612A power supply are represented visually in
Figure 2, in a voltage–current diagram. As shown in
Figure 2, the choice of the maximum voltage value (V02 = 60 V) defines the maximum current intensity that can be supplied (I02 = 0.5 A) and consequently the maximum power supplied, represented by the area subtended by the graph (red zone in
Figure 2). With the values chosen for the EL test, the maximum power that can be provided by the HP E3612A power supply (by Hewlett-Packard Company, Englewood, CO 80112 - USA) is 30 Watts.
The circuit diagram of the test circuit is shown in
Figure 3; it is important to remember that if powered from the outside, the single photocells behave like diodes, allowing the passage of the current only along one direction.
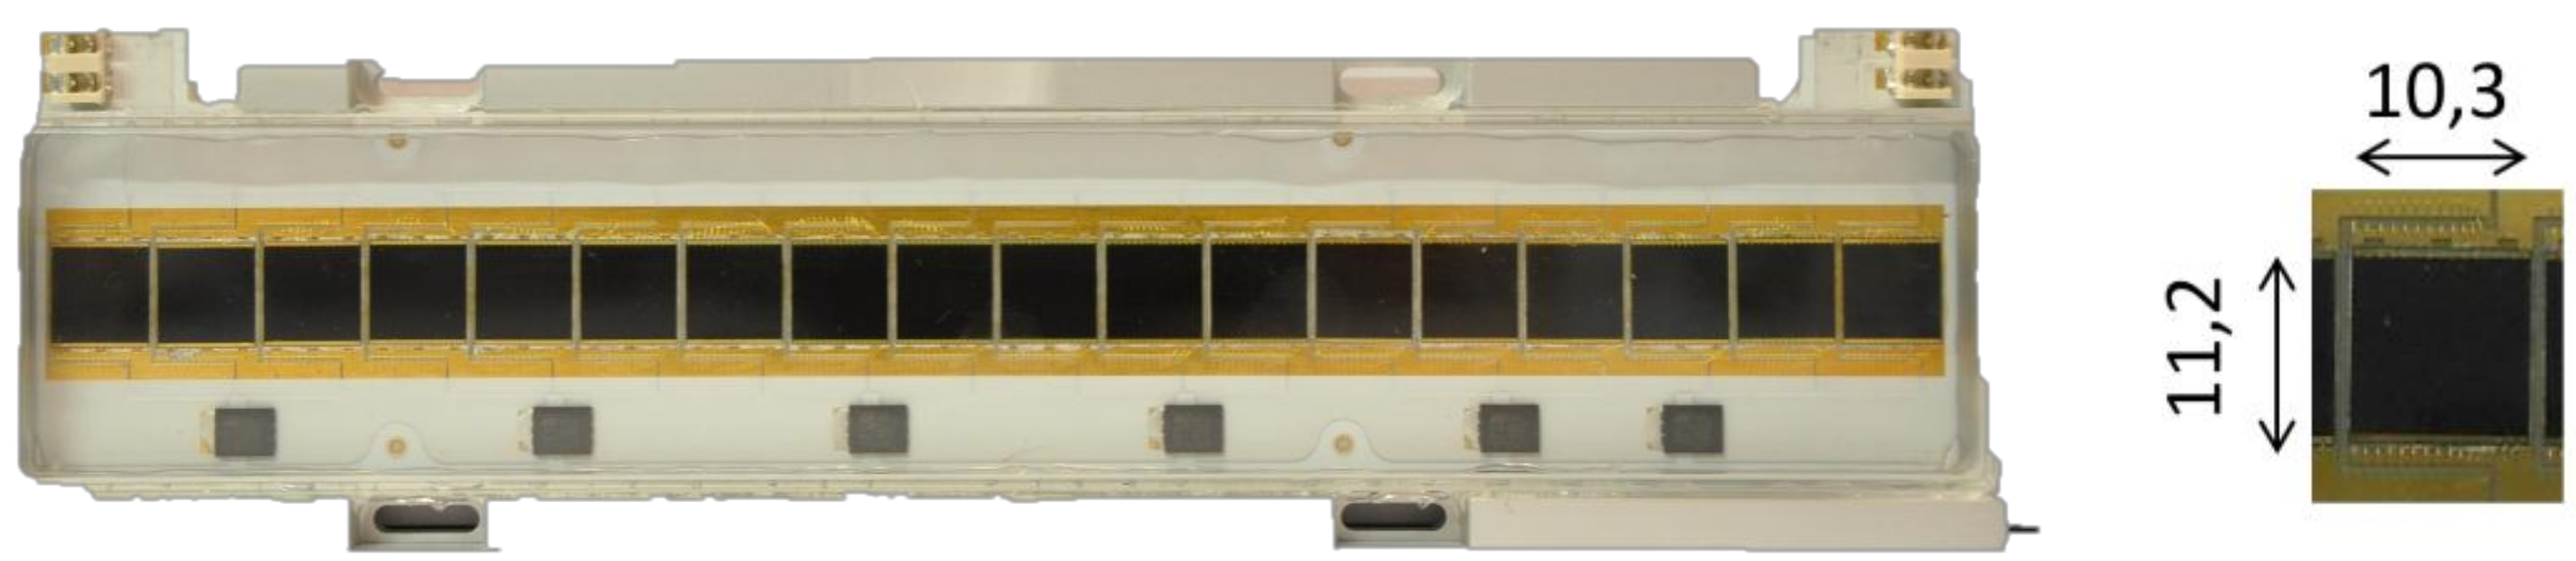
Photovoltaic cells cannot be individually tested because they are grouped into preassembled modules of 18 cells each.
Figure 4 reports a representative image of a module (length 204 mm, width 53 mm, and height 14 mm), in which each photocell measures 10.3 mm × 11.2 mm × 1 mm. The electrical contacts used to connect the module are visible at the upper ends.
Six bypass diodes were integrated into each module: the diodes are visible in
Figure 4 at the bottom of the module. Each bypass diode served three photocells and was located under the cells. These diodes had the task of electrically bypassing an inoperative cell during regular use, thus closing the circuit without affecting the operation of the entire module. Regular utilization of the photocells can be considered their use in solar concentration plants for the energy production.
In is important to note that there was only one bypass diode for every three photocells in the actual assembly within the CPV system. This means that if the cell that did not work within the group was only one, the bypass diode was activated and completely isolated the whole group formed by the three cells, so the number of inoperative cells would be three instead of one. During the electroluminescence test, since the current flowed in the opposite direction compared to normal operation, the bypass diodes allowed the passage of the current to all the photocells.
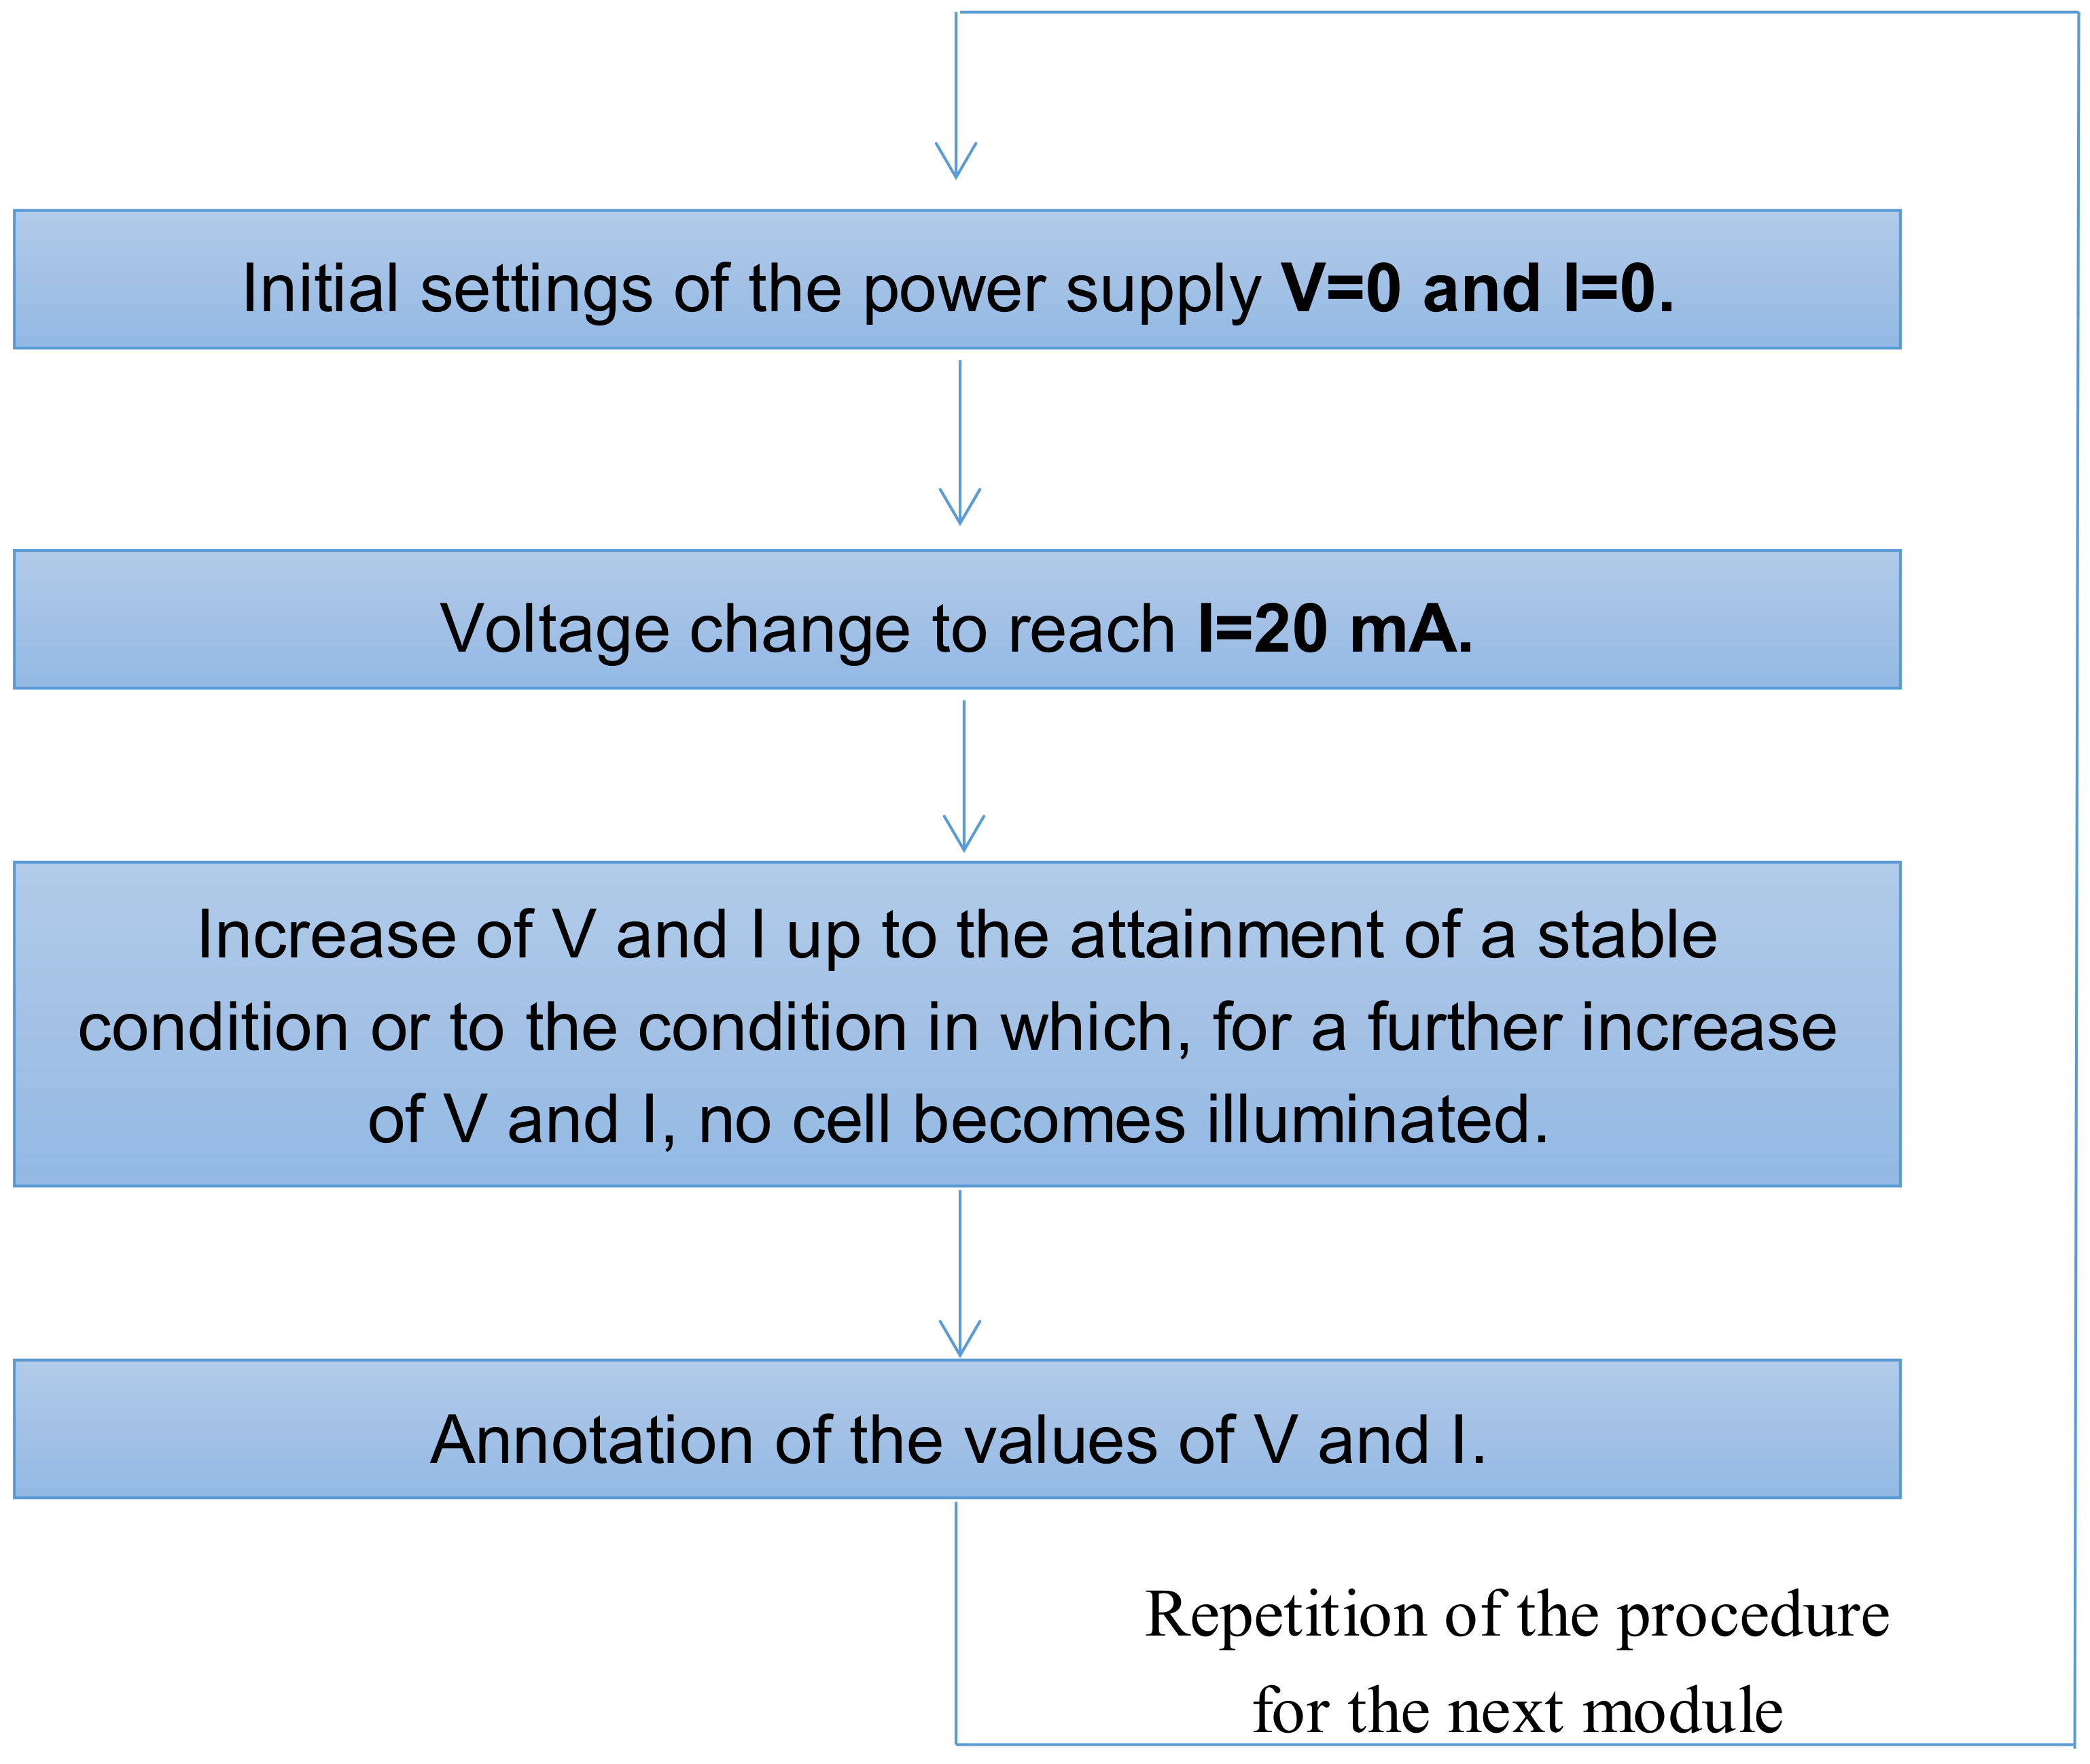
The choice of voltage and current values used to supply the cells was not always constant but varied from module to module. However, the methodology followed, shown in the diagram of
Figure 5, was always the same.
Power Procedure
The diagram reported in
Figure 5 represents the power supply procedure.
3. Dehumidification of the Modules
Before undergoing the first electroluminescence test, the photovoltaic modules were used outdoors, mounted on a concentration solar plant. The use of these modules on the field had led to the formation of water droplets inside them. In particular, prolonged exposure to atmospheric agents had caused significant infiltration of water and/or condensation inside the components. In fact, some of the modules examined had visible traces of water condensation and there was a suspicion that internal humidity could contribute to lowering the performance of the component.
It was tried to reduce the internal moisture with a dehumidification treatment that consisted of heating the modules inside a climatic chamber while reducing the pressure.
To verify the effect of the drying treatment, the modules were examined after treatment in the climatic chamber, using a second series of EL tests.
The first series of EL tests, performed on the 48 modules of the small-size CPV system, showed that some of them did not work.
The purpose of the dehumidification treatment was to remove the moisture inside the modules, so the second series of EL tests should evaluate if this could lead to a recovery of the functionality of the modules treated.
3.1. Tools Used
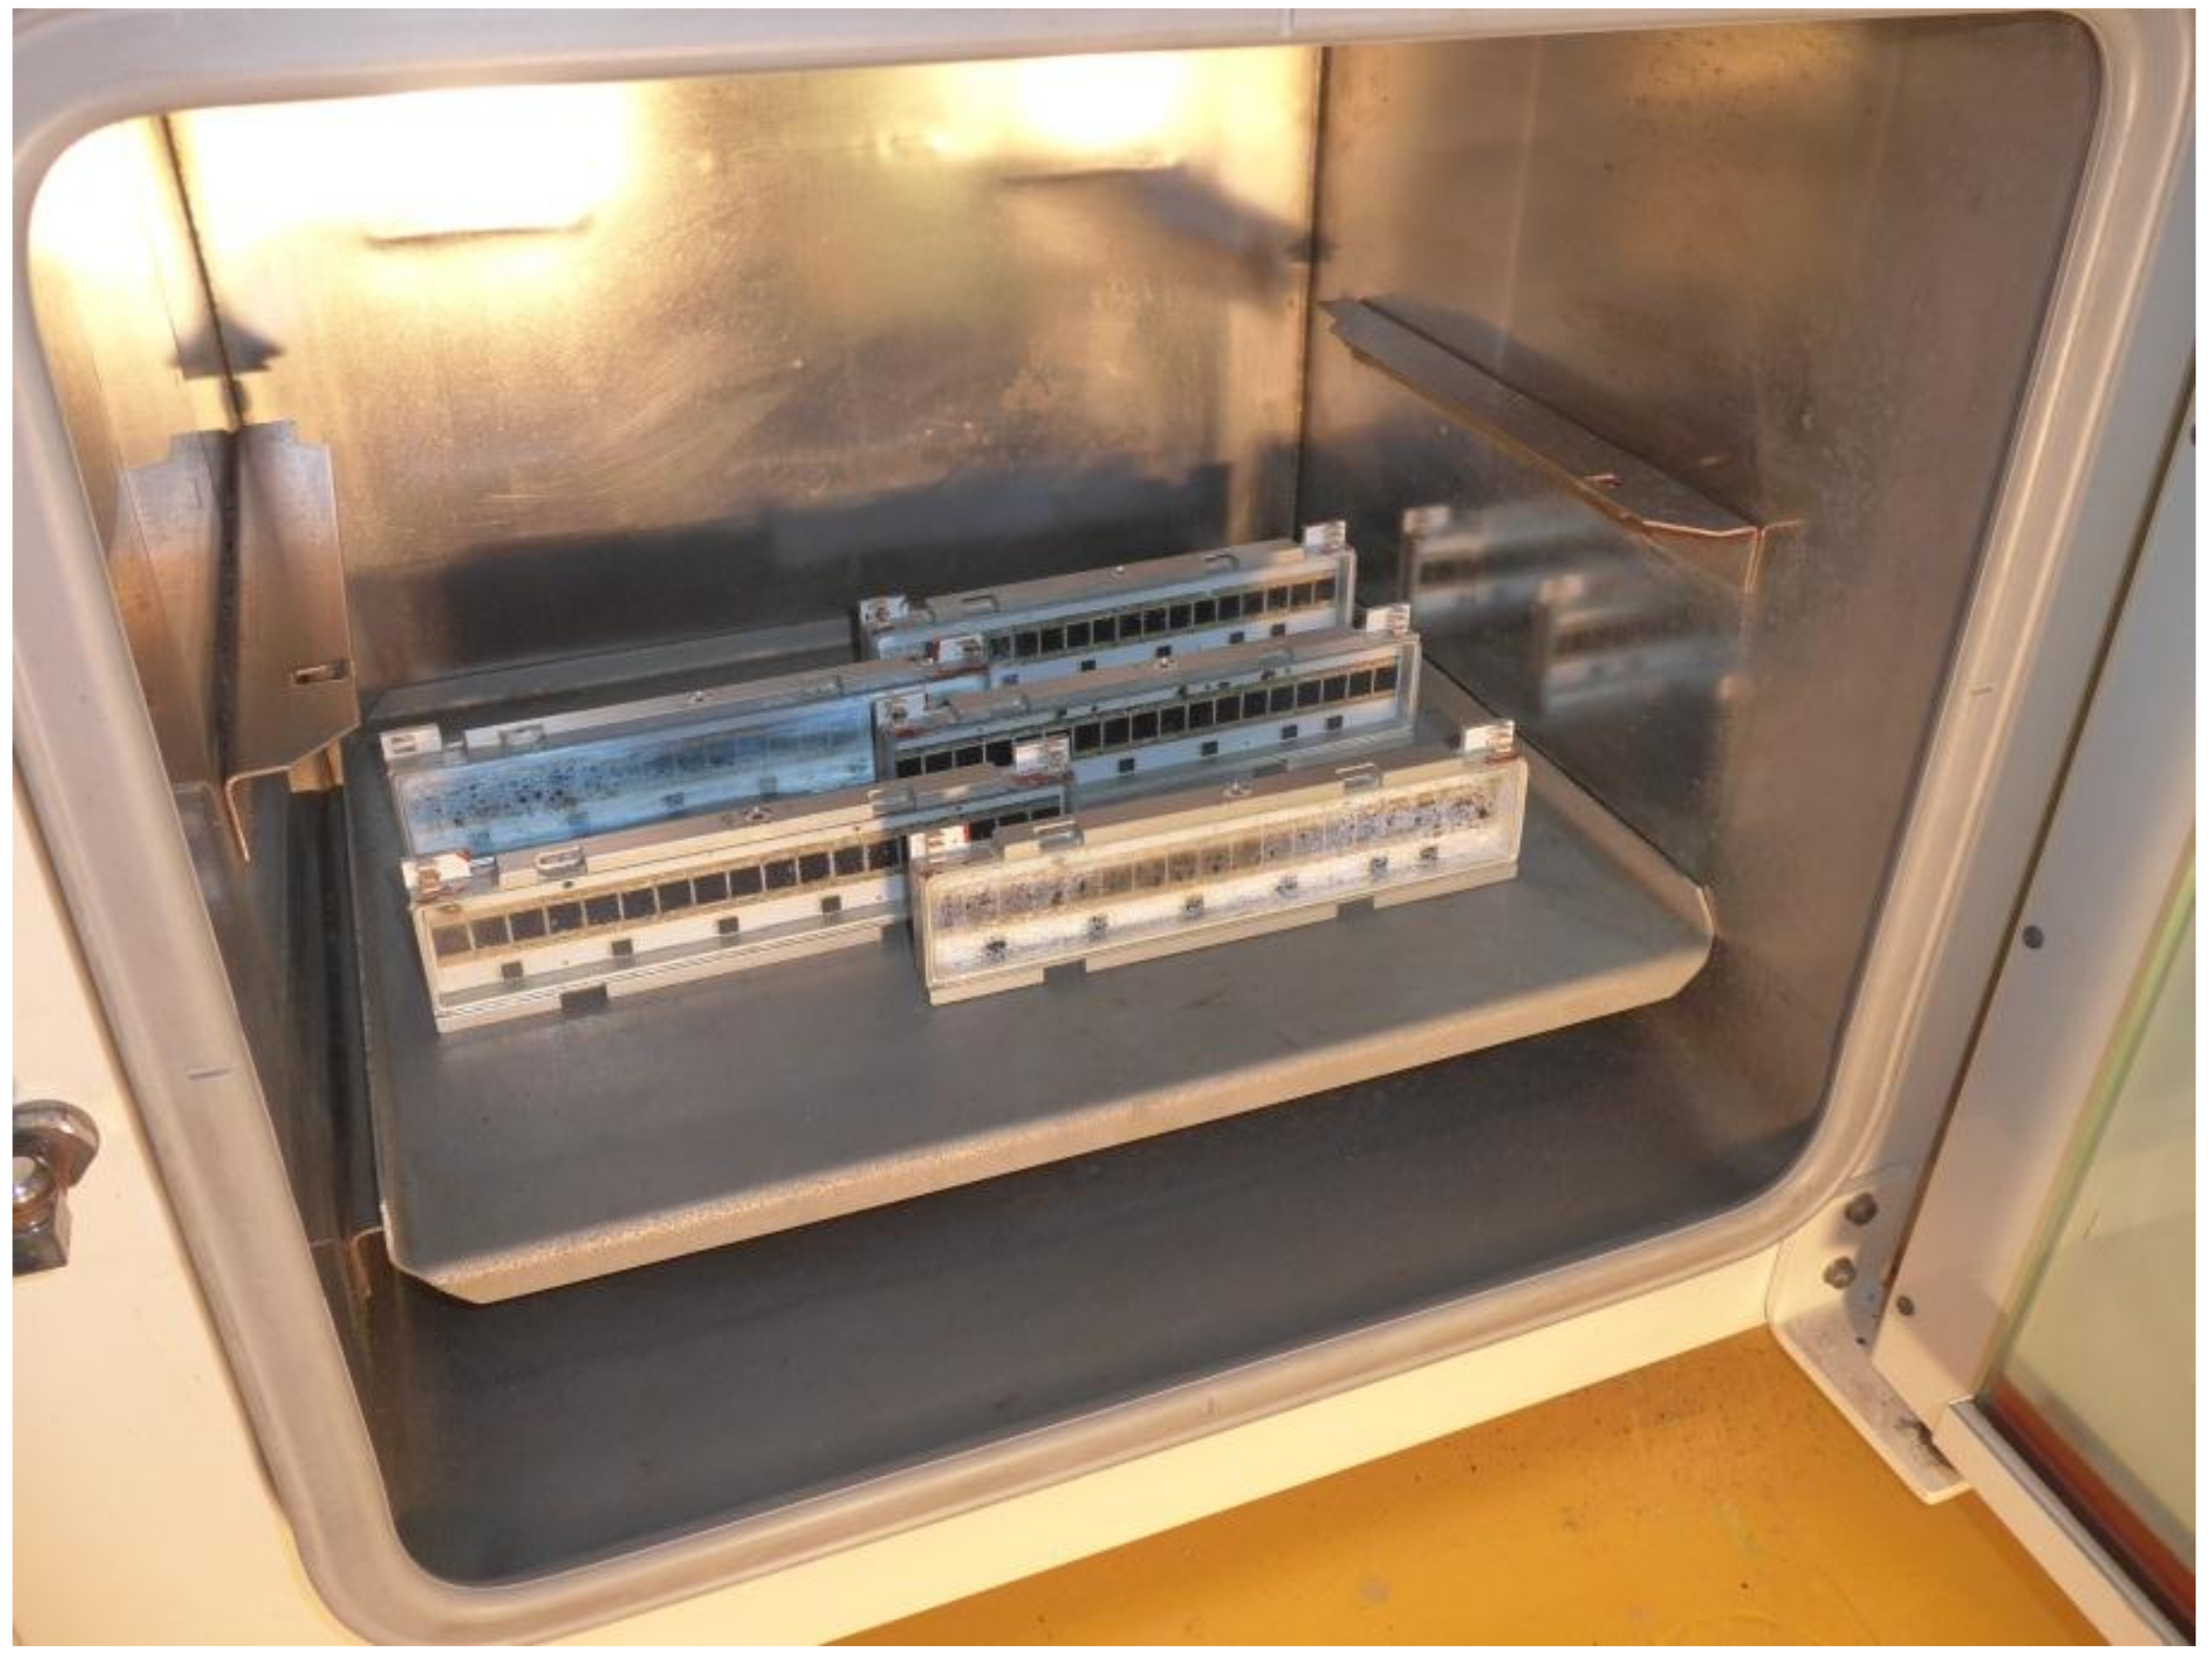
A climatic chamber was used to remove moisture inside the modules. In the interior of this device, in
Figure 6, the pressure and temperature could be controlled. In particular, it allowed water to be brought to the steam state at temperatures below 100 °C. Referring to the temperature–pressure diagram of water, this condition corresponded to a point in the yellow zone in
Figure 7.
In fact, in the climatic chamber, it was possible to reach an absolute pressure of 1 ± 0.1 mmHg and a temperature of 200 ± 1 °C. However, it was decided not to exceed 50 °C to avoid thermal stresses of the modules and to prevent damage. With these values, it can be seen from the graph that the condition fell widely in the steam area. Pressure regulation was provided by a rotary vacuum pump in an oil bath, which operated continuously.
Figure 6 and
Figure 8 present two photos of the climatic chamber used to dry the modules, and some of them are visible inside.
For comparison, the modules were photographed both before and after the dehumidification treatment carried out inside the climatic chamber. Moreover, some of them were also examined with an optical microscope, with variable magnification (5×–60×), to detect some details considered interesting.
3.2. Description of the Dehumidification Treatment
The first action on the photovoltaic components was to remove the protective caps from the modules, thus freeing access holes and allowing moisture to escape.
Before applying the dehumidification treatment on the various modules, a single module was specifically tested to verify its resistance in a depressed environment and at room temperature.
In fact, any air bubbles present in the cell substrates could explode due to the pressure difference and damage the components. This dehumidification treatment was carried out in a suitable climatic chamber starting from atmospheric pressure and T = 20 °C and then reducing the pressure. The pump isolation valve was opened following the steps in the procedure listed below.
After having checked the resistance under pressure, the modules were dehumidified by bringing the temperature inside the climatic chamber to 50 °C. Once the temperature was reached, all the modules were placed on the inside shelf, with the module opening hole facing up, in groups of five as shown in
Figure 8.
The procedure for the treatment of dehumidification in the climatic chamber consisted of the following steps:
1. Arrangement of the module in the chamber, closing the door, and waiting for 10 min without depression;
2. Opening the pump isolation valve and reaching a pressure of 800 mbar;
3. Closing the pump isolation valve and waiting for 5 min;
4. Opening the valve and reaching a pressure of 600 mbar;
5. Closing the valve and waiting for 5 min;
6. Opening the valve and reaching a pressure of 400 mbar;
7. Closing the valve and waiting for 5 min;
8. Opening the valve and reaching a pressure of 200 mbar;
9. Closing the pump isolation valve and waiting for 5 min;
10. Opening the valve and reaching the minimum pressure allowed by the pump;
11. Waiting 10 min with open valve and with active suction pump;
12. Closure of the valve;
13. Gradual depressurization lasting 5 min (0–1000 mbar);
14. Gradual decrease in temperature up to 30 °C and opening of the chamber;
15. Closure of the hole on the modules by adhesive tape.
The total duration of the dehumidification treatment was 55 min. Step 1 is illustrated in
Figure 8, where the presence of moisture inside the PV modules is visible as droplets on the covering glass of the first module on the right. Observing the modules during the treatment, it was seen that the water droplets disappeared almost completely during step 11.
To illustrate the consequences of the drying treatment,
Figure 9 and
Figure 10 present the photos of the same module before and after dehumidification. Two examples are given: module 202mg51–1 in
Figure 9 and module 203mg71–2 in
Figure 10.
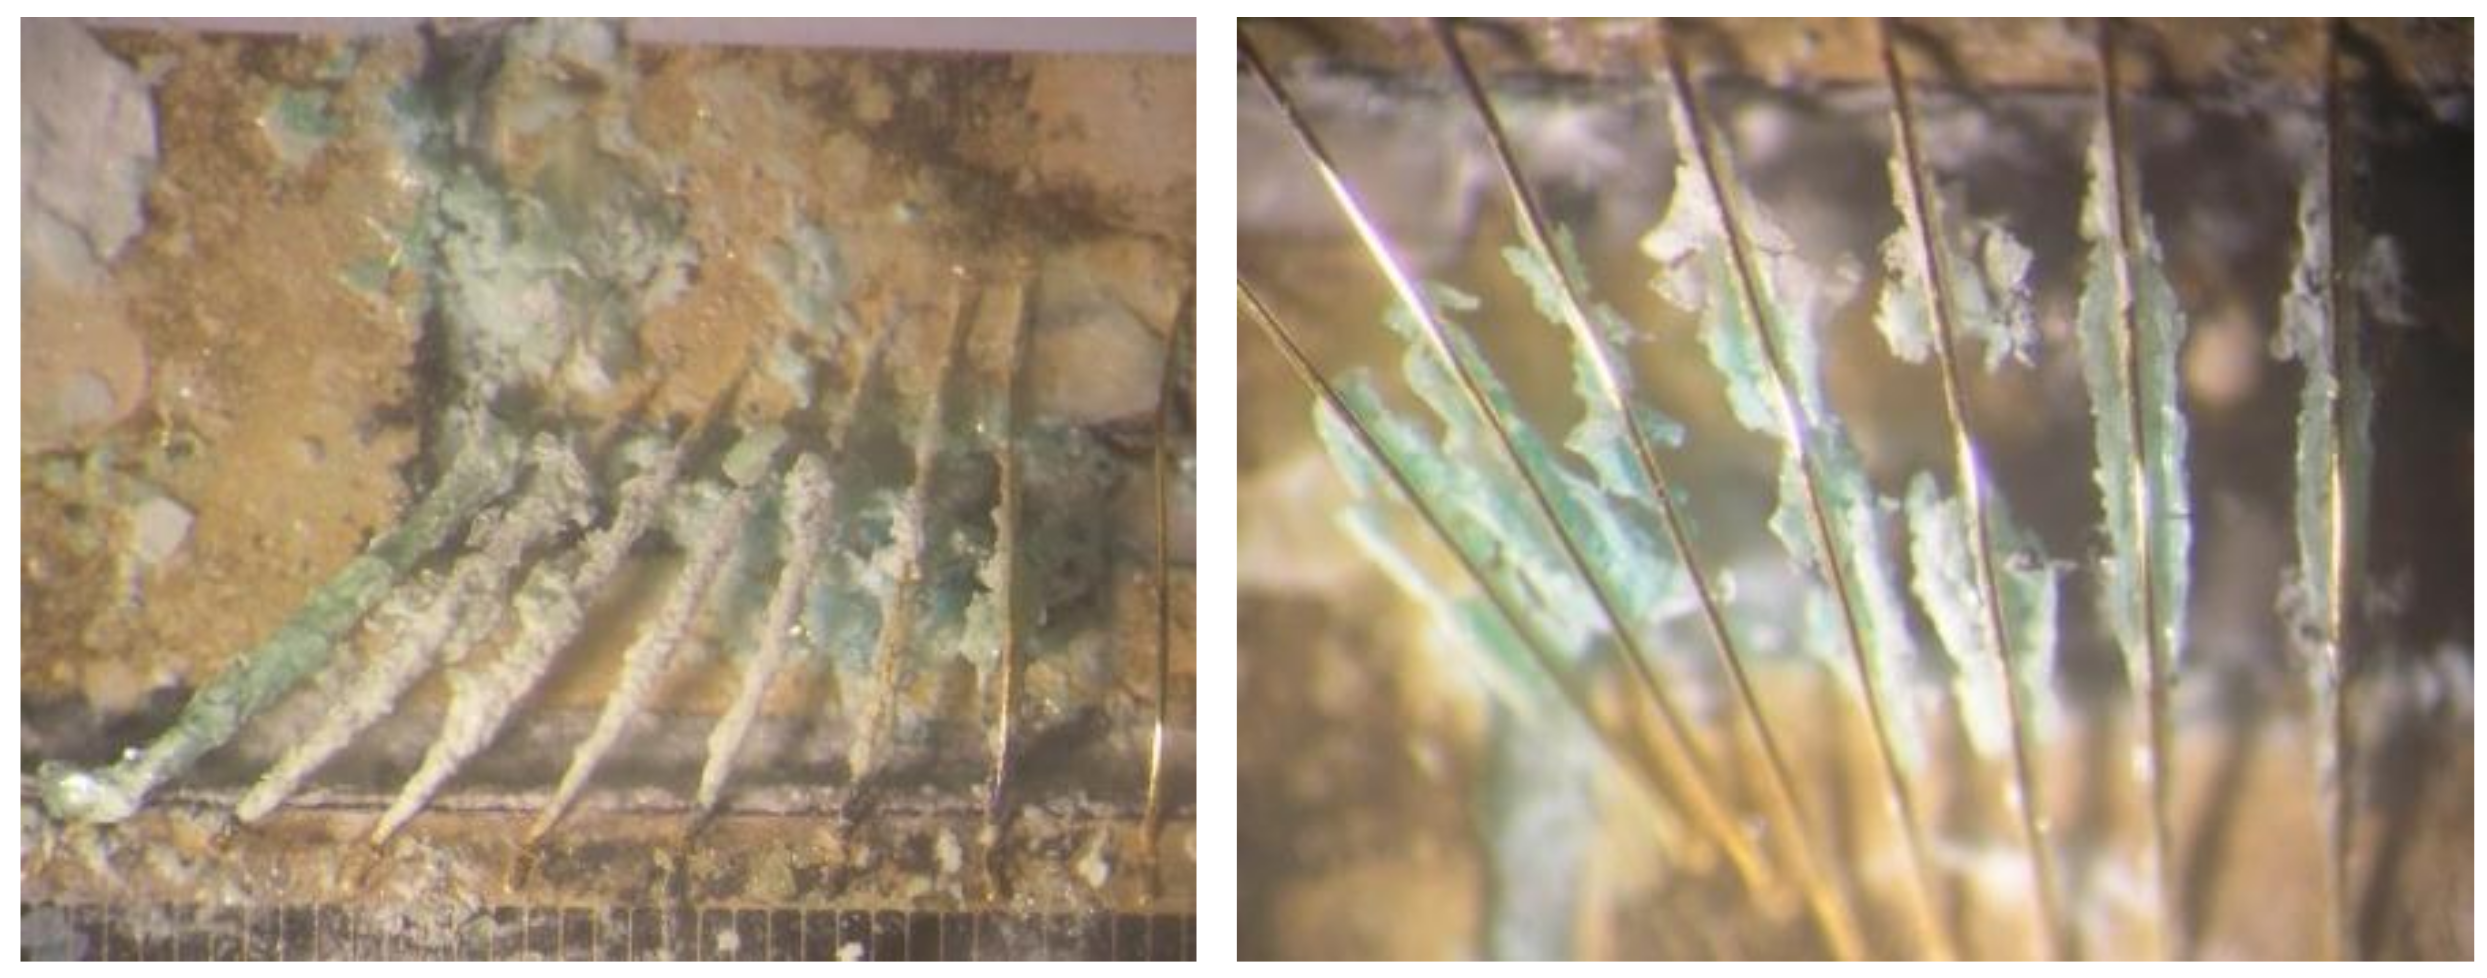
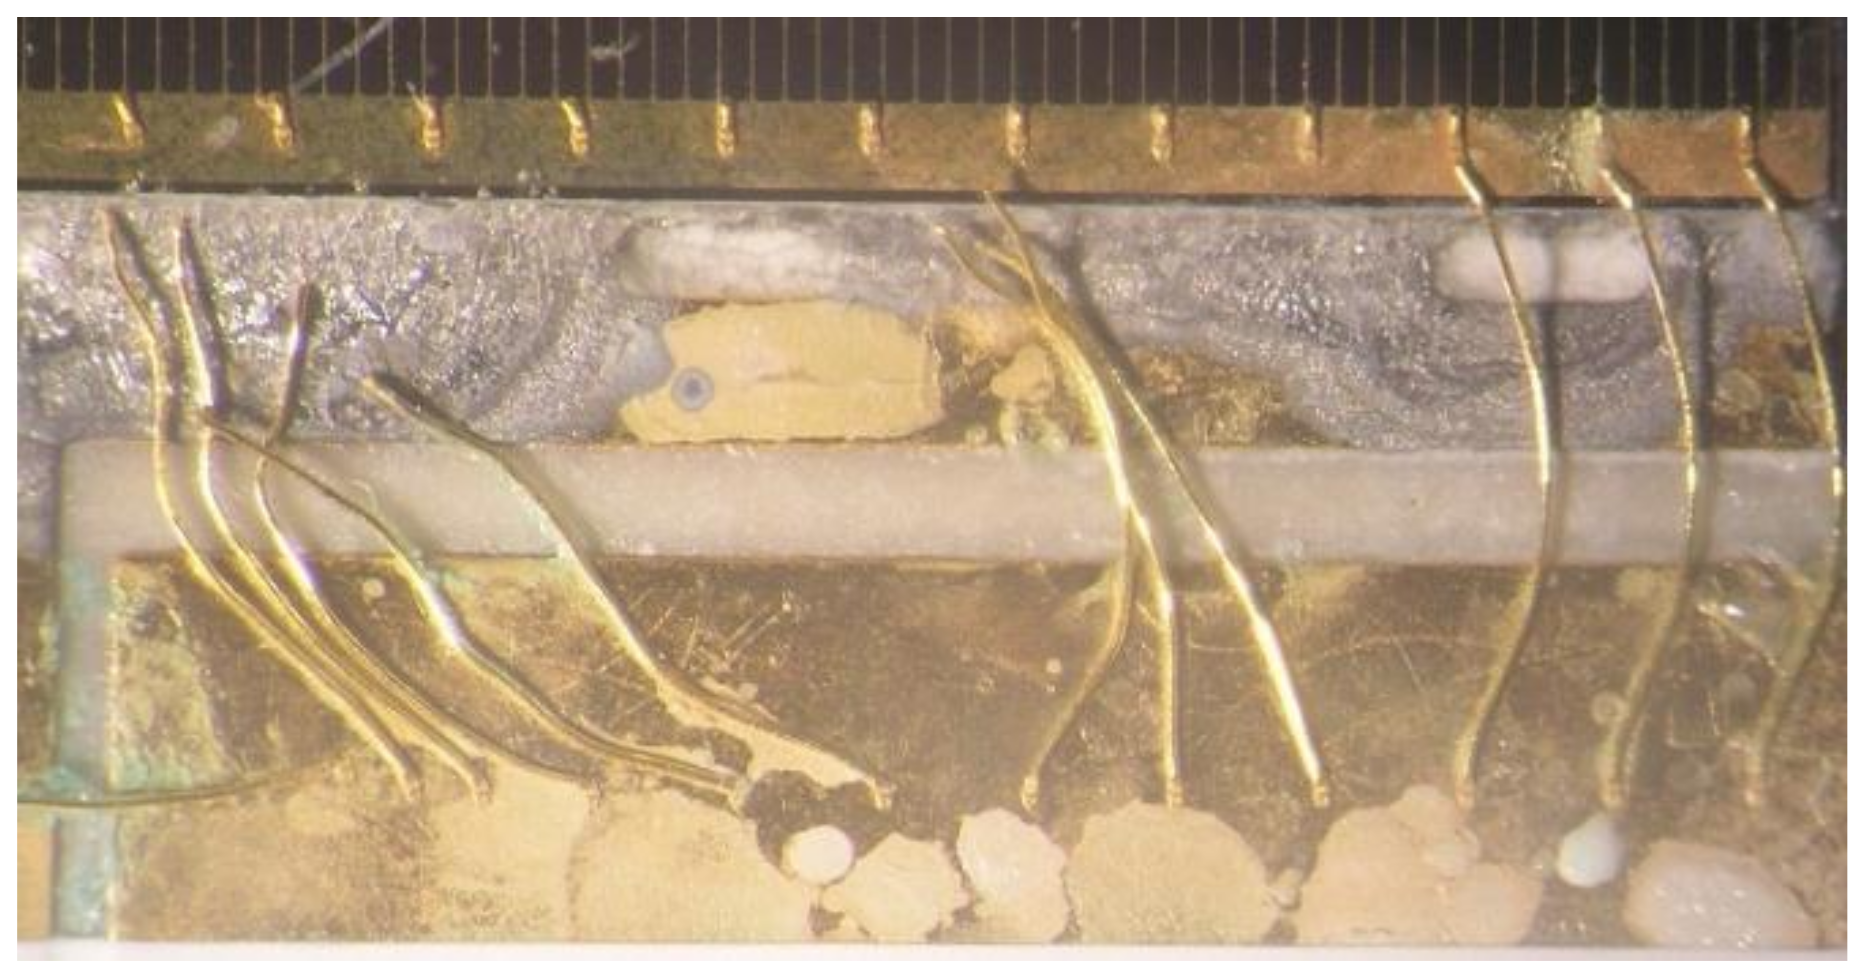
The effect of the dehumidification treatment is visible to the naked eye: the comparison of each pair of photos evidences how the droplets disappeared, while the other characteristics seemed unaltered. For example, considering the white spots on them, they always had the same dimensions and had not undergone alterations. Different details of the modules are examined in
Section 4, with some sample photos of various defects and some notes on their visual observation.
In practice, dehumidifying the PV modules allows the elimination of possible short circuits due to the presence of water droplets.
4. Visual Analysis of the Individual Modules
The electroluminescence test guided the selection, among the 48 modules of the chosen solar plant, of the modules to be treated in the climatic chamber. In addition to the EL test, a visual inspection was performed on the selected CPV modules. This visual analysis of the selected modules was repeated after the dehumidification treatment. It showed traces of moisture and other imperfections that are listed in
Table 1 for the set of modules specified by the labels in the first column. The set of treated modules consisted of ten modules that did not work properly during the first series of EL tests and, in fact, they visually presented evidence of moisture deposition.
5. Results of the Electroluminescence Tests
A qualitative analysis was performed on 48 CPV modules of a small-size solar plant because some of them provided performances below the expected level. In order to identify the malfunctioning cells, the modules were examined by electroluminescence (EL) tests.
In practice, the EL test qualitatively determines the integrity of the photocells submitted to the test. A drawback of this test is that it is not able to indicate the real reasons for the malfunction of the photovoltaic cells. Further investigations and actions are needed to clarify this aspect.
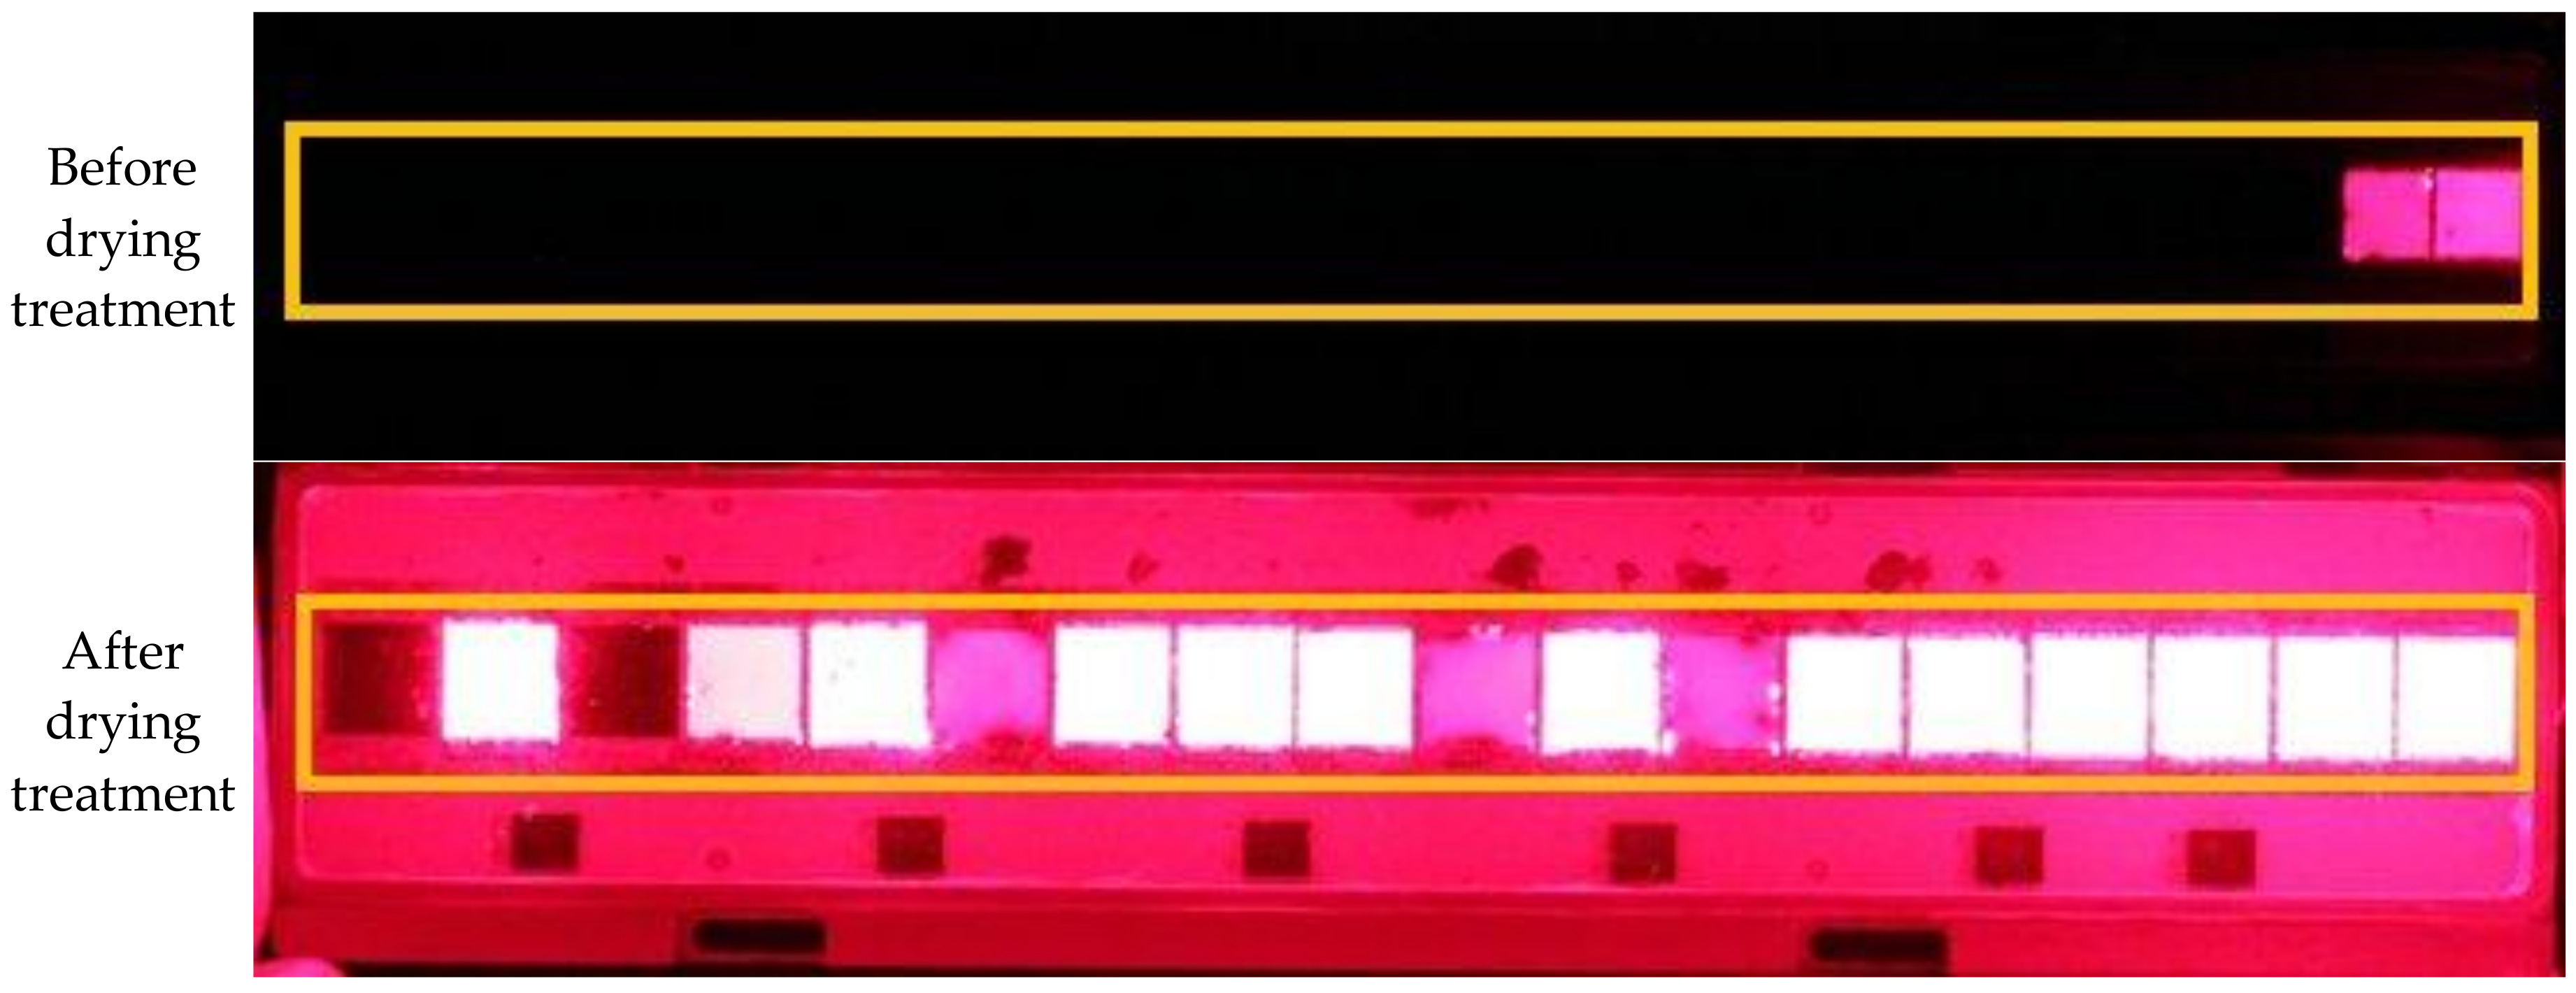
Two real photos of the electroluminescence test applied on the 203g11-2 module are presented in
Figure 14. The photo above is the image of the untreated module under EL test, while the photo below is the EL test image of the same module after application of dehumidification treatment. A yellow rectangle encloses the 18 photocells in both photos of
Figure 14 to identify the cells positions, especially in the photo above where most of the cells are dark. The comparison of the two images shows that cells 1 to 16 are dark before being treated, while most of the cells appear illuminated after the drying treatment.
5.1. Results for All Modules before Dehumidification Treatment
The results of the electroluminescence tests performed before dehumidification in the climatic chamber are summarized in
Table 2 and
Table 3.
Table 2 considers the individual photocells, indicating the number of cells and the percentage of them, with respect to the total number of cells.
Table 3 takes into account the actual conditions of the photocells, which are mounted in groups of three cells with a bypass diode. Thus,
Table 3 indicates that there are 531 working cells (177 working three-cell groups) and 333 inoperative cells (111 inoperative three-cell groups).
The electroluminescence test indicates the number of active cells that work properly within the photovoltaic module. The number of active cells is different if the bypass diode is present. The EL test performed before dehumidification indicates that 68.6% of the cells worked, while taking into account the bypass diode, this value becomes 61.5%.
Overall, considering the 48 modules examined, there were 16 fully functional components and 12 completely deactivated modules.
5.2. Results for All Modules after Dehumidification Treatment
The drying treatment was applied on a set of ten modules chosen among those inoperative: in particular, eight of these modules were completely deactivated, while two components still had some working cells.
The diagrams in
Figure 15 and
Figure 16 show visually which cells were working within the ten modules. The label of each module is reported in the first column of the diagrams. Columns 1–18 specify the cell situation using grey for a working cell and black for an inoperative cell. The active modules are indicated with the label highlighted in green, while the fully deactivated ones are in red. A module that has at least one group of three active cells is considered to work.
It is important to remember that the cells were mounted with a protection diode every three photocells: the groups of three cells connected together are recognizable because their number in row 1 is alternatively written in bold blue or italic.
Figure 15 presents the condition of the cells before the dehumidification treatment, whereas
Figure 16 reports the situation of the same cells after having dried the ten modules.
Comparing the functionality of the cells shown in
Figure 15 and
Figure 16, it is possible to notice that the behavior of the ten modules after dehumidification changed from 1 working module to 6 working modules.
With regard to the ten modules examined,
Table 4 and
Table 5 summarize the results for the individual cells and the groups of three photocells, mounted with a bypass diode for protection. The form of data presentation is identical to that in
Table 1 and
Table 2: the percentage of cells is reported in brackets and is calculated on the total number of cells.
Finally,
Table 6 and
Table 7 present the number and percentage of cells operating considering the total quantity of photocells contained in the 48 PV modules. These global results were obtained by combining the EL test results executed before and after the dehumidification treatment in the climatic chamber.
Once again, the presentation form is the same used for the data in
Table 1 and
Table 2. Considering each cell separately,
Table 6 indicates that the dehumidification of only a part of the modules permitted an increase in the working cells from 68.6% to 77.7%. The data in
Table 7 are more realistic, as they refer to the actual conditions of the modules mounted in a solar concentration plant. The average number of active photocells changed from 61.5% before dehumidification to 66.3% after it. These figures refer to the actual installation, which included the insertion of a bypass diode every three photocells.
A positive result of the dehumidification treatment was a partial recovery of those modules that, due to the presence of moisture inside them, would have been unusable since they had no active cells before being dehumidified. This suggests that special care is needed to ensure good encapsulation of the modules.
This indicates that the humidity inside the solar CPV modules is a serious problem that could influence the behavior of the photocells and consequently the performance of the whole system.
6. Conclusions
In a CPV solar plant under experimentation and development, some of the modules showed reduced performance compared to the estimated values. Probably it was a consequence of their exposure to atmospheric agents and to the diurnal/night temperature excursion for several weeks of practical experimentation. To visually identify the malfunctioning cells inside the CPV modules, the 48 modules of the small-size solar plant were analyzed in the laboratory by electroluminescence tests. The EL test can be used to quickly check the integrity and operational status of the CPV cells, with immediate feedback on which cells work or not.
A first series of EL tests confirmed that the percentage of working cells was 68.6%, considering each single cell separately, but the actual value was 61.5%, taking into account that the cells were mounted with a bypass diode every three cells. Each module contained 18 photovoltaic cells, so it mounted 6 bypass diodes to protect the cells.
In order to reduce the visible humidity inside the modules, a set of these components was subjected to a dehumidification treatment in a climatic chamber. A second series of EL tests performed after the drying treatment showed that the percentage of functioning cells had increased to 77.7%, as single cells, and to 66.3%, considering the bypass diodes.
It seems that the dehumidification treatment can remove moisture from the modules. The effect of the treatment is visible to the naked eye: the water droplets disappeared, as it can be seen by comparing the photos in
Figure 9 and
Figure 10.
The humidity inside the component itself helps to reduce the performance of the concentration photovoltaic modules. However, the most important result is that the dehumidification treatment could recover a deactivated photocell if it is damaged by humidity. In fact, several deactivated photocells were working again after being treated in the climatic chamber. The second series of EL tests, repeated on the dehumidified modules, verified the performance improvement and the partial recovery of the photocells. The second series of tests quantified that the dehumidification of the module increased the percentage of active cells from 61.5% to 66.3% (considering the actual conditions of the cells, mounted with bypass diodes).
It is therefore clear from the damage caused by the infiltration of moisture inside the modules that it is advisable, during the construction phase, to pay close attention to the waterproofing of the components.
It could also be useful to examine further features and details within the CPV modules before and after the drying treatment. These specific analyses could highlight other consequences of treatment: positive or negative effects on other aspects and perhaps the recovery of different defects.
On the other hand, if it were possible to rethink the distribution of bypass diodes, maybe the number of active modules could be further increased.

 ,
, 


