1. Introduction
In Brazil, the electricity sector remains treated as a natural monopoly, which is regulated by the government through its own regulatory agency, the National Electric Energy Agency (ANEEL) to in order to prevent possible abuses of market power.
In order to stimulate the search for efficiency [
1,
2], ANEEL currently uses the price-cap model, which provides periodic price corrections based on several factors, like the service quality and to the productivity of the energy distributor.
The efficiency in the price-cap regulation model is calculated by the
X-factor, which is related to increases in productivity. This leads to changes in the price that distributors can charge the consumer. As it affects the profitability of the regulated entities, it is important to calculate the
X factor to be grounded in a consistent explanation in order to convince the society and industry that the calculated value is fair to everyone. Inconsistencies can serve as a basis for discussions and may generate points for modifying the calculation method used [
3].
The model used by ANEEL allows an objective evaluation of the efficiencies of each company, since there is a comparison with the others, and considers the influence of the environment where the distributors operate, including factors that can affect the efficiencies of the same. However, there are some points in ANEEL’s analysis that need attention.
First, in the DEA model used, it is considered that operational expenditure (OPEX) are a process input, while network extension, number of consumers and consumption are outputs from the process. However, the network extension variable is peculiar: depending on the analysis, it can behave as much as input, since it is used to generate consumption and to serve the consumers, as well as output, because in order to maintain the operational cost demand.
Another point is the fact of using multiple regression as a way of correcting the efficiencies found. It can be argued that when multiple regression is used, it is believed that only environmental factors influence the efficiency of the distributor, so that the intrinsic factors related to the operation and management of the distributors themselves would not be essential for efficiency, which runs counter to the very purpose of the price-cap model.
The evaluation of efficiency in electric energy distributors in Brazil is addressed in several articles. The difference between them is mainly in the combination of the techniques used. The common goal is always to improve the results with the reality of the country.
In this work, some of the most relevant articles are highlighted. The article [
4] deals with an evaluation of the electric power distributors using Kohonen self-organizing maps (SOM) and DEA. The article [
5] studies the use of undesirable outputs in DEA with application in the electric power sector. The article [
6] studies the application of a DEA network model with shared inputs to analyze the efficiency of Brazilian energy distributors. Article [
7] used game theory applied to the DEA and later used mode clustering to evaluate the Brazilian energy distributors in the year. In addition, [
8] finally reviews the main applications of DEA in the energy field.
This work aims to propose an alternative way to that currently used by ANEEL to evaluate the efficiency of energy distributors. In the first phase of the proposal, it is intended to modify the DEA model, failing to use a non-decreasing composite model by an input and three outputs, and using a non-decreasing DEA network model, taking the network as an intermediate variable, maintaining the OPEX as input and the consumption and number of consumers as outputs. Such an approach would avoid questioning the use of the network as input or output of the process.
In the second phase, as some environmental variables have correlations between them, a factor analysis is done to avoid multicollinearity. After that, a multiple regression is performed with the environmental factors to verify which affect in the efficiency.
In the third phase, the Kohonen maps are used to group the distributors based on the results of phase 2. Efficiency for each group found is calculated with a non-decreasing additive DEA model. In addition, in the final phase, these results are normalized.
2. Materials and Methods
2.1. Price-Cap Model
The price-cap model is a regulation model that intends to support the search for efficiency, while also stopping monopoly-associated practices, in special overpricing. As stated in a previous reference [
3], the price-cap model assumes that the price charged must pay the total costs and contain a margin that generates an attractive internal rate of return to the investor. This is done by setting an initial price and correcting this price in prefixed time periods, by analyzing some factors. The general formula of the price-cap model is given by Equation (1):
where
Pt is the price in period t;
Pt−1 is the price in period of
t − 1; π is the inflation of the period;
X is the factor related to the productivity of the company;
Q is the factor related to the quality of services provided.
The X factor is related to advances in methods used by the company to increase its productivity, which would lead to decreases in prices due to the competitive market. Since there is basically no competition in the regulated sector, there is the need to adjust prices by adding this variable in the model. The Q factor is related to the quality of the service in a way that better service allows higher prices to be charged.
2.2. DEA BCC Model and Non-Decreasing Returns to Scale
A concept of DEA was given by a previous reference [
9] as follows: “DEA evaluates the relative efficiencies of a homogeneous set of decision making units (DMUs) having multiple inputs and outputs.”
This means that DEA is an approach used to evaluate efficiency by comparing Decision Making Units (DMUs) in a way that each DMU tries to maximize its own efficiency, but with the restriction that no DMU can be more than 100% efficient. A DMU is an individual unit that performs a process that is similar in its entries (inputs) and exits (outputs) to other DMUs. In this work, an example of a DMU is an energy distributor in the year of 2012.
One of the benefits of using DEA is that “it provides a non-parametric estimate of the efficiency of each DMU compared to the best practice frontier constructed by the best-performing DMUs” [
10].
Furthermore, one study [
11] states that “DEA showed great promise to be a good evaluative tool for future analysis on energy efficiency” as a conclusion. One of the reasons for this great promise is the facility of multiple inputs and multiple outputs of the DEA model.
The BCC (Banker, Charnes and Cooper) model [
12] is a DEA model that uses variable returns to scale (VRS). This means that a linear proportion between the inputs and outputs is not constant. The BCC model considers a DMU to be efficient if it uses the smallest input produces the maximum value of an output. If the returns to scale were constant, this would not necessarily be true. This DMU is considered efficient in constant returns to scale (CRS) only if a relation output/input is maximized. The CRS model is also called the CCR model, which is the first DEA model to be introduced [
13].
The BCC model is described in Equations (2)–(6):
where
u are the weights associated with the outputs
y are the outputs;
j is the index of the output;
v are the weights associated with the inputs;
x are the inputs;
i is the indicator index of the input;
s is the number of outputs;
r is the number of inputs;
is the efficiency of DMU_0
k is the DMU identifier; and
is a variable indicating the type of return scale.
With a modification in the restriction of
, it is possible to adapt non-decreasing returns of scale. This is done by restricting
values to be only positive values, so Equations (5) and (6) will transform into Equation (7):
Using Equation (7) in the model implies that some of the DMUs will be evaluated using variable returns to scale (specifically those that have a smaller input variable) while others will be evaluated using constant returns to scale.
Since the objective of the price-cap model is to adjust distributor incomes in order to reflect the increase in efficiency given by the proper usage of resources, it is only natural that the input of the model represents the costs associated with the service. In that sense, operational expenses (OPEX) are used as an input in this present work. The outputs should represent the amount of service being delivered, related to the OPEX. Therefore, the extension of the network, that represents the extension of land covered by the distributor, consumption, that is a direct output of the process, and one of the major sources of company’s variable costs, and quantity of consumers, that represents the final clients of the process, could be used as outputs of the process. However, there is discussion about the nature of the extension of the network, since it is not one of the final outputs of the process, but it is a means of achieving the other two outputs. Even more, it is shown in Technical Note nº 101/2011-SRE/ANEEL that the non-decreasing returns to scale hypothesis cannot be rejected. Therefore, distributors that use less OPEX should have greater benefits under the efficiency evaluation.
The sources of the variables are the Public Audience 23/2014 from ANEEL, for the network extension, the number of consumers, and for OPEX. For consumption, data was obtained from the Associação Brasileira de Distribuidores de Energia Elétrica (in English, Brazilian Association of Electric Energy Distributors, known by its Portuguese acronym ABRADEE).
2.3. Network DEA Models
A problem identified in the classic DEA models is the fact that there is no clarification about what happens within the process. A previous study [
14] proposed the first DEA network model to solve this question.
These models divide the process into two parts: the first with the objective of transforming the inputs into intermediate variables, which will be used in the process, and the second one with the objective of transforming these intermediate variables into outputs of the process. As stated by a previous study [
15], “the division of the production process makes it easier to identify the sources of inefficiency in the process as a whole”.
One network DEA model of high importance for this work is the additive Network DEA model, which was first proposed by reference [
16]. The major relevance of this model to the present work is the fact that it incorporates variable returns to scale and the characteristics of the Network DEA models, which makes it possible to incorporate the network model in the non-decreasing returns to scale model used by ANEEL. To calculate the overall efficiency of the DMU, this model uses a weighted sum of the stages’ efficiency. This model is shown in Equations (8)–(13):
In this model, the objective function in Equation (8) is generated by the weighted sum of the stages. There is a new variable of
z, which represents the intermediate variable, and a new weight of w, which is associated to this variable. Equation (10) ensures that the second stage efficiency is less or equal to 1, while Equation 11 ensures this condition for the first stage. As discussed previously, for this model, the OPEX is used as input, while the consumers and consumption are used as outputs. Since the extension of network can be understood as an output for the OPEX and as an input for consumption and number of consumers, it is used as an intermediate variable. For the DEA model proposed in this work, Equations (15)–(17) are added to the additive model, while Equation (6) becomes Equation (14) to ensure non-decreasing returns to scale:
Equations (15)–(17) are restrictions to the weights and are added because they are also used by the current model used by ANEEL [
17].
2.4. Neural Networks and Kohonen Self-Organizing Maps (SOMs)
Neural networks can be understood as a mathematical way of trying to simulate the physical functioning of the brain. To do so, they are composed of computational units called neurons, which are responsible for acting on the received data.
Kohonen self-organizing maps (SOMs) are neural networks whose main purpose is to find similarities in a group of elements. In this model, the input data is distributed to all neurons, but only one neuron is assigned to each element. SOMs have been used in several applications, such as the modeling of hippocampal dynamics [
18]. A SOM’s algorithm is made by the iterative steps [
19]:
Initialization;
Competition;
Cooperation;
Synaptic Adaptation.
The competition process finds the nearest neuron. After this, the cooperation process finds the neighborhood of the winning neuron. The synaptic adaptation adjusts the weights of the winning neuron, based on the neighborhood function and the number of iterations, to make the neuron closer to the input element [
20].
By the end of the iterative process, each element is related to a single neuron in a way that similar elements tend to be in the same neuron. In this way, each neuron is attached to a cluster of elements.
In the scope of this work, the SOM is used to group energy distributors by environmental similarity. Since Brazil has a large territorial extension, the environment changes greatly within the country. As so, there are significant differences in the way each company can use its resources, or have its efficiency affected by the environment. Therefore, it could be unfair to compare all the distributors without accounting for these effects. In that sense, one way of keeping the isonomy of treatment between distributors is to group them based on their environmental area of activity similarities. By doing so, it is possible to obtain a cluster efficiency and to adjust the previously found efficiency by seeing how close the distributor is to the other distributors in the cluster. The data for environmental variables were extracted from Public Audience 23/2014 from ANEEL.
2.5. Multiple Regression
According to reference [
21], the “main application [of multiple regression], after finding the mathematical relationship, is to produce values for the dependent variable when the independent variables are present.”
As in the simple regression analysis, the objective of this analysis is to verify if there is a correlation between the dependent variable and the independent variables in such a way that a change in a value in the independent variables may cause a proportional change in the dependent variable. If such correlation exists, the objective is to find a linear expression that defines the dependent variable in terms of the independent ones.
In this work, this technique is used to verify which environmental variables actually influence the efficiency of a DMU. The general form of the multiple regression is given by Equation (18):
where
Y is the independent variable;
is the bias of the equation, which is the value that the dependent variable would assume if there were no errors in the analysis and all the independent variables were assumed to have the null value;
i is the indicator index of the independent variable;
k is the number of independent variables;
is the change in the dependent variable relative to the independent variable
;
is the independent variable
i; and e is the associated error, which is also called the residue.
We used the minimum squares method to discover the values of . It is also possible to get the t value associated with the , which can be used for statistical purposes in order to verify if the independent variable is in fact correlated with the dependent variable.
According to a previous reference [
22], “residuals in a regression are obtained from the difference between the observed value of the response variable and that forecast by the regression model”. Therefore, in order to obtain adequate results from a regression and possibly to use it to forecast the results of new elements, it is important that the residues are as small as possible.
2.6. Factorial Analysis
According to the concept given by a previous study [
23], factorial analysis aims to explain the correlations between a large set of variables in terms of a set of few unobservable random variables, which are called factors.
One of the advantages of factor analysis and the main reason for using this technique in this work is its ability to reduce the number of variables and eliminate multicollinearity, which is able to maintain the explanatory power of these variables to an adequate extent.
The technique of factor analysis consists of finding the values of the coefficients such that they reproduce the variables from the factors with the highest degree of confidence, according to Equation (19):
where
Y is the input variable;
F is the factor;
i is the indicator in the variable in the input element;
j is the factor indicator;
U is the specific factor associated; and
a is the factor load.
In this work, analysis of the principal components was conducted, which involves a model that aims to find factors that have little errors or unique variance, but explains most of the variance of the original variables.
The Varimax rotation was also used, which is an approach that aims to make factor loads close to 0 or 1 in order to facilitate interpretation.
3. Methodology
In this work, the data from the year of 2012 and previous years were used. However, the focus was to find the efficiency of the distributors in 2012. Previous data was used for historical analysis and to enhance DEA’s results. Distributors that did not have data for a certain year were excluded from the analysis in the given year. For the year of 2012, the distributors analyzed were distributed by states in the following way:
Bahia: Coelba;
Ceará: Coelce;
Distrito Federal: Ceb;
Espírito Santo: Escelsa;
Goiás: Celg;
Maranhão: Cemar;
Mato Grosso: Cemat;
Mato Grosso Do Sul: Enersul;
Minas Gerais: Dme-Poços De Caldas; Cemig;
Pará: Celpa;
Paraíba: Ene. Paraíba;
Paraná: Copel;
Pernambuco: Celpe;
Rio De Janeiro: Ampla; Light;
Rio Grande Do Norte: Cosern;
Rio Grande Do Sul: Aes Sul; Rge; Santa Maria; Ceee
Santa Catarina: Celesc;
São Paulo: Bandeirante; Bragantina; Elektro; Eletropaulo; Cpfl Paulista; Piratininga; Nacional;
Sergipe: Sulgipe; Ene. Sergipe;
Tocantins: Celtins.
In order to understand the model proposed, a diagram is presented in
Figure 1. The first stage is to calculate the non-decreasing returns to scale DEA model with the restrictions presented in
Section 2.3, using the OPEX as input and the extension of the distribution network, the number of consumers and the consumed amount of electricity as outputs. This model is called the Retorno Contábil Médio (RCM, or in English, Average Accounting Return) model, which is the model used in the 2-phase analysis by ANEEL. The second phase of ANEEL’s analysis is a multiple regression using the environmental variables as independent variables and the efficiencies as the dependent variable.
The RCM model was used for every distributor with data from 2012 and previous years in order to avoid false correlations between environmental variables and efficiency. It is important to note that due to practical issues, the effects of inflation were not considered in this step, which may cause some variations in the final result if such consideration is made in the future.
The second stage of
Figure 1 was needed because the environmental variables presented had multicollinearity, which could negatively impact the analysis. The factor analysis reduced the number of variables to a number of factors that would still represent the environment properly, but would not affect the regression.
The third stage of
Figure 1 involves a regression analysis with the previously found factors as the independent variables and the RCM efficiency as the dependent variable. This allows us to discover which factors actually influenced the efficiency of the distributors. Following this, these factors were used as the inputs for the SOM in stage 4.
The fourth stage of the model involves the execution of SOM with the factors that influence efficiency in order to cluster the distributors by environment. This was conducted only with the distributors in 2012 in order to avoid clustering one distributor with itself in previous years. Since the objective is to find the efficiencies in 2012, it is more logical to use only the distributors in this year.
The fifth stage calculates the non-decreasing additive model, with the restrictions presented in
Section 2.3. Here, since the final result will be normalized by clustering using only data from 2012, all the DMUs were used with one DMU being the data of one distributor in a given year. The OPEX was used as the input, the extension of the distribution network was used as an intermediate variable, while the consumed amount and number of consumers were used as outputs. In order to understand the model proposed in this stage, a diagram is presented in
Figure 2.
The assumption of non-decreasing returns to scale is based on Technical Note nº 101/2011–SRE/ANEEL, that performs the Banker test [
23] in several configurations of inputs and outputs. The results show that, for the configuration used in this work, the non-decreasing returns to scale hypothesis cannot be rejected. Finally, the sixth stage normalizes the efficiency from stage 5 within the clusters of stage 4. The data used was obtained from the ANEEL’s public audience no. 023/2014 and data from ABRADEE.
4. Results
For the sake of space and relevancy, 411 DMUs were considered in stages 1–3 of
Figure 1, with some specific data from these analyzes having been omitted. These include data from inputs and outputs used in the DEA model as well as environmental variables and the efficiency found in the DEA model. However, this data is used primarily for statistical purposes in stage 3, with no other purpose in this article.
In stage 2 of the analysis, two variables were excluded for the purpose of fixing the Kaiser-Meyer-Olkin (KMO) test value. These factors were area and low vegetation. Subsequently, four factors were found in the analysis. The participation of each environmental variable in each factor is shown in
Figure 3.
From
Figure 3, it is possible to observe that:
Factor 1 is composed primarily of the following variables: consumer density, network density and paving;
Factor 2 is composed primarily of complexity, violence and subnormal;
Factor 3 is composed primarily of vegetation, vegetation and declivity;
Factor 4 is composed primarily of precipitation, discharges and high vegetation.
In stage 3, R² was found to be 0.356. This means that there is some correlation between the factors and the RCM efficiency, but this relationship is not enough for the factors to solely explain the efficiency of the distributors. The significance levels of factors really influencing the efficiency must be further analyzed, which is provided in
Table 1.
From the analysis of
Table 1, it can be seen that all factors are significant. Therefore, all four factors should be included for the creation of SOM in stage 4. In order to find the number of clusters needed, the technique of observing the U matrix and the weighted maps was used. This strategy is explained in further detail in reference [
24]. For the purposes of this work, a larger than required map is created and the distances between the neurons are plotted with a color scale. The brighter, connected regions are usually linked to the same cluster. This technique displays a natural number of clusters formed by the network. It is mostly a visual technique, but provides a good estimate of the number of clusters that should be used.
The U matrix (unified distances matrix) for this work is shown in
Figure 4 and the weight distances are plotted in
Figure 5. Both were generated with help of MATLAB
® (version R2017b).
From the U-matrix in
Figure 4, it is not possible to obtain enough data. However, the input weights in
Figure 5 provides some clues. It is possible to observe a cluster in superior left part of the map, while there are two others in the lower left and right extremes of the map. Further, there is a clearer area in the top central area that can be interpreted as another cluster.
Maps ranging from 3 to 6 clusters were created. The maps with six clusters presented a cluster without any elements, so it was discarded. The map with three clusters did not represent well the ecological and economical diversity of the area in analysis. Both the four clusters and the five clusters maps could explain reasonably well the similarities of the environments. In synthesis, some distributors that belong in clusters 1 and 4 when used the four clusters map created a new cluster in the 5 clusters map. In this work, the four clusters map was used for the analysis, since it provides a greater number of distributors by clusters, therefore improving efficiency comparability in DEA.
In such way, a map with a size of 2 rows × 2 columns was used for clustering, with the results shown in
Table 2. For better visualization, these results are shown graphically in
Figure 6.
In
Figure 6, there are areas of blank spaces. This is caused by the absence of data relative to the electric distributor that is located in these areas. Furthermore, some states are divided in color. This is due to there being more than one distributor serving these states, with these distributors being allocated in different clusters. However, it is possible to see that there is at least some consistency to the clustering. The final results and comparison with the ANEEL results are given in
Table 2.
From
Table 2, it is possible to say that there is no direct relationship between the model results and the ANEEL model. Some distributors gain efficiency, while others lose it. In fact, the correlation between the models is 24%, with a
R² of only 0.06. Such divergence is due to the great changes made, especially in relation to the network DEA model.
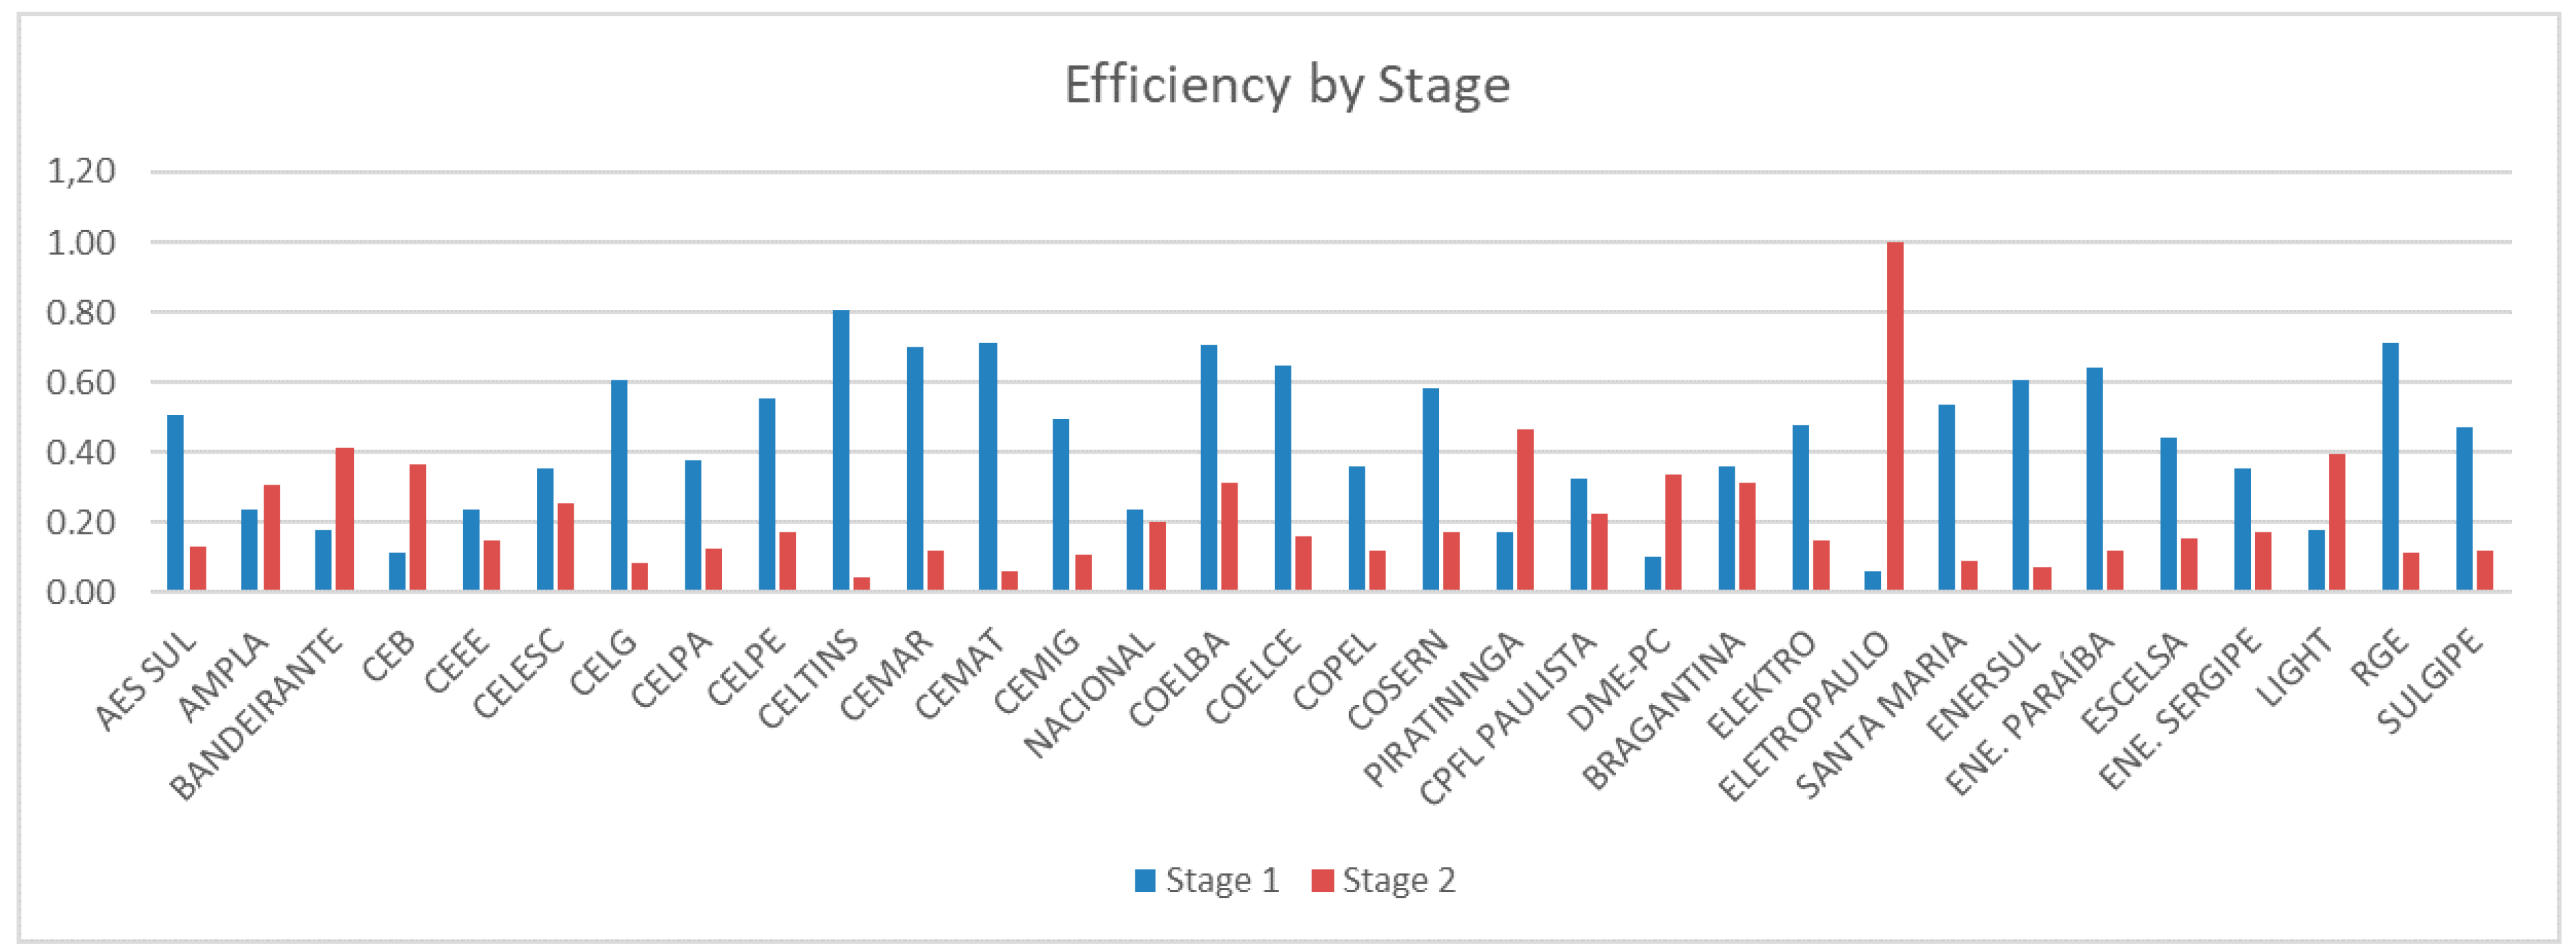
Figure 7 presents efficiencies of each stage. Generally, distributors are more efficient in Stage 1. It is observed in
Figure 7 that, seven distributors, such as Energy Company of Brasília (CEB) and Eletropaulo for example, are more efficient in Stage 2.
5. Conclusions
A different model was proposed for the evaluation of the efficiency of the different Brazilian energy distributors, which aims to reduce the margin of potential doubts by using the environmental variables in the regression and extending the distribution network in the DEA model.
It must be considered that the distributors were divided into clusters for the calculation of the X factor. Therefore, it becomes possible to perform the comparison within each cluster in the final calculation of the X factor. Despite this division, there was comparison between the distributors, so that some proportionality can be achieved in the corrections of the defined energy tariffs that should be charged, which is a positive point of the presented model.
The proposed model presented differences compared to the model currently used by ANEEL, with some distributors having high efficiency, while others had their efficiency reduced. This indicates the need for adjustments to the data used. Although the proposed model presents results with high sensitivity to variable specifications.
It is reasonable to assume that there may be distortions due to the limitations presented in this paper, such as the lack of use of shared inputs or the absence of correction of inflationary effects.
This work can be used in countries of great territorial extension that deals with at least some influence of private sector in energy distribution, or any other regulated service. It allows objective evaluation of efficiency, which is relevant when the discussion involves economical rights, such as the present case. Moreover, the resulting efficiency accounts for environmental aspects, but is not defined by them.

 ,
, 


