Automatic Processing of User-Generated Content for the Description of Energy-Consuming Activities at Individual and Group Level


Faculty of Electrical Engineering, Mathematics and Computer Science, Delft University of Technology, 2628 XE Delft, The Netherlands
*
Author to whom correspondence should be addressed.
Energies 2019, 12(1), 15; https://doi.org/10.3390/en12010015
Submission received: 31 October 2018
/
Revised: 17 December 2018
/
Accepted: 18 December 2018
/
Published: 21 December 2018
(This article belongs to the Special Issue Open Data and Energy Analytics)
Abstract
:Understanding and improving the energy consumption behavior of individuals is considered a powerful approach to improve energy conservation and stimulate energy efficiency. To motivate people to change their energy consumption behavior, we need to have a thorough understanding of which energy-consuming activities they perform and how these are performed. Traditional sources of information about energy consumption, such as smart sensor devices and surveys, can be costly to set up, may lack contextual information, have infrequent updates, or are not publicly accessible. In this paper, we propose to use social media as a complementary source of information for understanding energy-consuming activities. A huge amount of social media posts are generated by hundreds of millions of people every day, they are publicly available, and provide real-time data often tagged to space and time. We design an ontology to get a better understanding of the energy-consuming activities domain and develop a text and image processing pipeline to extract from social media the description of energy-consuming activities. We run a case study on Istanbul and Amsterdam. We highlight the strength and weakness of our approach, showing that social media data has the potential to be a complementary source of information for describing energy-consuming activities.
1. Introduction
Europe’s 2030 Energy Strategy targets a 40% cut in greenhouse gas emissions compared to 1990 levels, at least a 27% share of renewable energy consumption and at least 27% energy savings compared with the business-as-usual scenario (https://ec.europa.eu/energy/en/topics/energy-strategy-and-energy-union/2030-energy-strategy). To meet this target, energy policies and programs should be formed and individuals should be motivated to change their energy consumption behavior [1], both in terms of energy conservation and energy efficiency. Energy efficiency involves using less energy to provide the same service; for instance, replacing a single-pane window in the house with an energy-efficient one. On the other hand, energy conservation involves saving energy by reducing or omitting an activity; for instance, turning a light off or reducing the time one watches television.
Multiple studies have examined how energy efficiency and conservation could be motivated among policy makers and citizens. In [2] the author explains how comparative feedback on energy usage with others can generate feelings of competition, social comparison, or social pressure, which appears to be more effective in motivating energy conservation than temporal self-comparisons. The author of [3] endorses this in his Social Electricity case study, which “allows people to compare their energy footprint with other online peers or with the consumption at their neighborhood, village or town, to perceive if their own consumption is low, average or high”. Multiple energy saving applications [4] have been developed, using visualized consumption feedback and gamified social interactions to motivate people to adopt energy-efficient lifestyles.
Before we can motivate individuals to change their energy consumption behavior, we need a thorough understanding of why and how they consume energy. To do so, insights into the individual’s activities behind the energy consumption should be gathered at a high-granular level.
Multiple data sources are used to provide insights into energy-consuming activities (i.e., an activity that have a direct or indirect impact on energy consumption). Smart meters and smart plugs give insights into domestic energy consumption by providing aggregated energy consumption data. Techniques have been developed to isolate the signal of each appliance by looking at the total power consumed, the different current waveform and the voltage signature [5,6,7]. Surveys and interviews are used to break down the energy consumption into different end-uses through several questions (e.g., how much time you watch TV at home? How often do you use public transportation?) [8,9,10]. While being the most reliable source of quantitative data and qualitative information, the aforementioned sources come with drawbacks: surveys are costly to perform, they do not scale and are done infrequently; while smart sensors and smart plugs are costly, the data obtained lack of contextual information and is often not accessible. Moreover, smart sensor devices neglect indirect energy usage [11] (i.e., related to the production, transportation, and disposal of a variety of consumer goods and services [12]) and the disaggregation process is far from perfect [5].
On the other hand, hundreds of millions of people frequently use social media to share, communicate, connect, and interact. Although being noisy and biased (i.e., used by a subset of the population), they are publicly available and provide real-time and semantically rich data.
For these reasons, social media has proven to be a good source for human activity recognition [13,14,15], including, but not limited to, travel behavior [16,17,18], mode of transportation [16] and nutrition patterns [19,20,21].
This work puts the following intuition at test: since social media posts relate to different aspects of daily activities, they may either directly refer to energy-consuming activities, or contain relevant information about energy-consuming activities in their semantic signature. Therefore, by processing the content of social media posts, we aim at extracting information about the energy-consuming activity it refers to.
Hence, we aim to answer the following research question:
- RQ
- How can we automatically process user-generated content to describe energy-consuming activities at individual and group level?
We focus on four categories of energy-consuming activities: dwelling, mobility, food consumption, and leisure. Based on the literature [22,23,24], they cover a considerable spectrum of the activities impacting on the energy footprint of an individual’s lifestyle.
Dwelling refers to the consumption of energy due to the usage of home appliances (e.g., washing machine, gaming console), mobility includes the energy required for moving from one place to another, food consumption refers to the use of resources associated with the preparation and processing of food and leisure indicate the energy required for performing recreational activities (e.g., watching TV, playing video-games, partying). Activities related to industry—e.g., the individual being at work—are not taken into account.
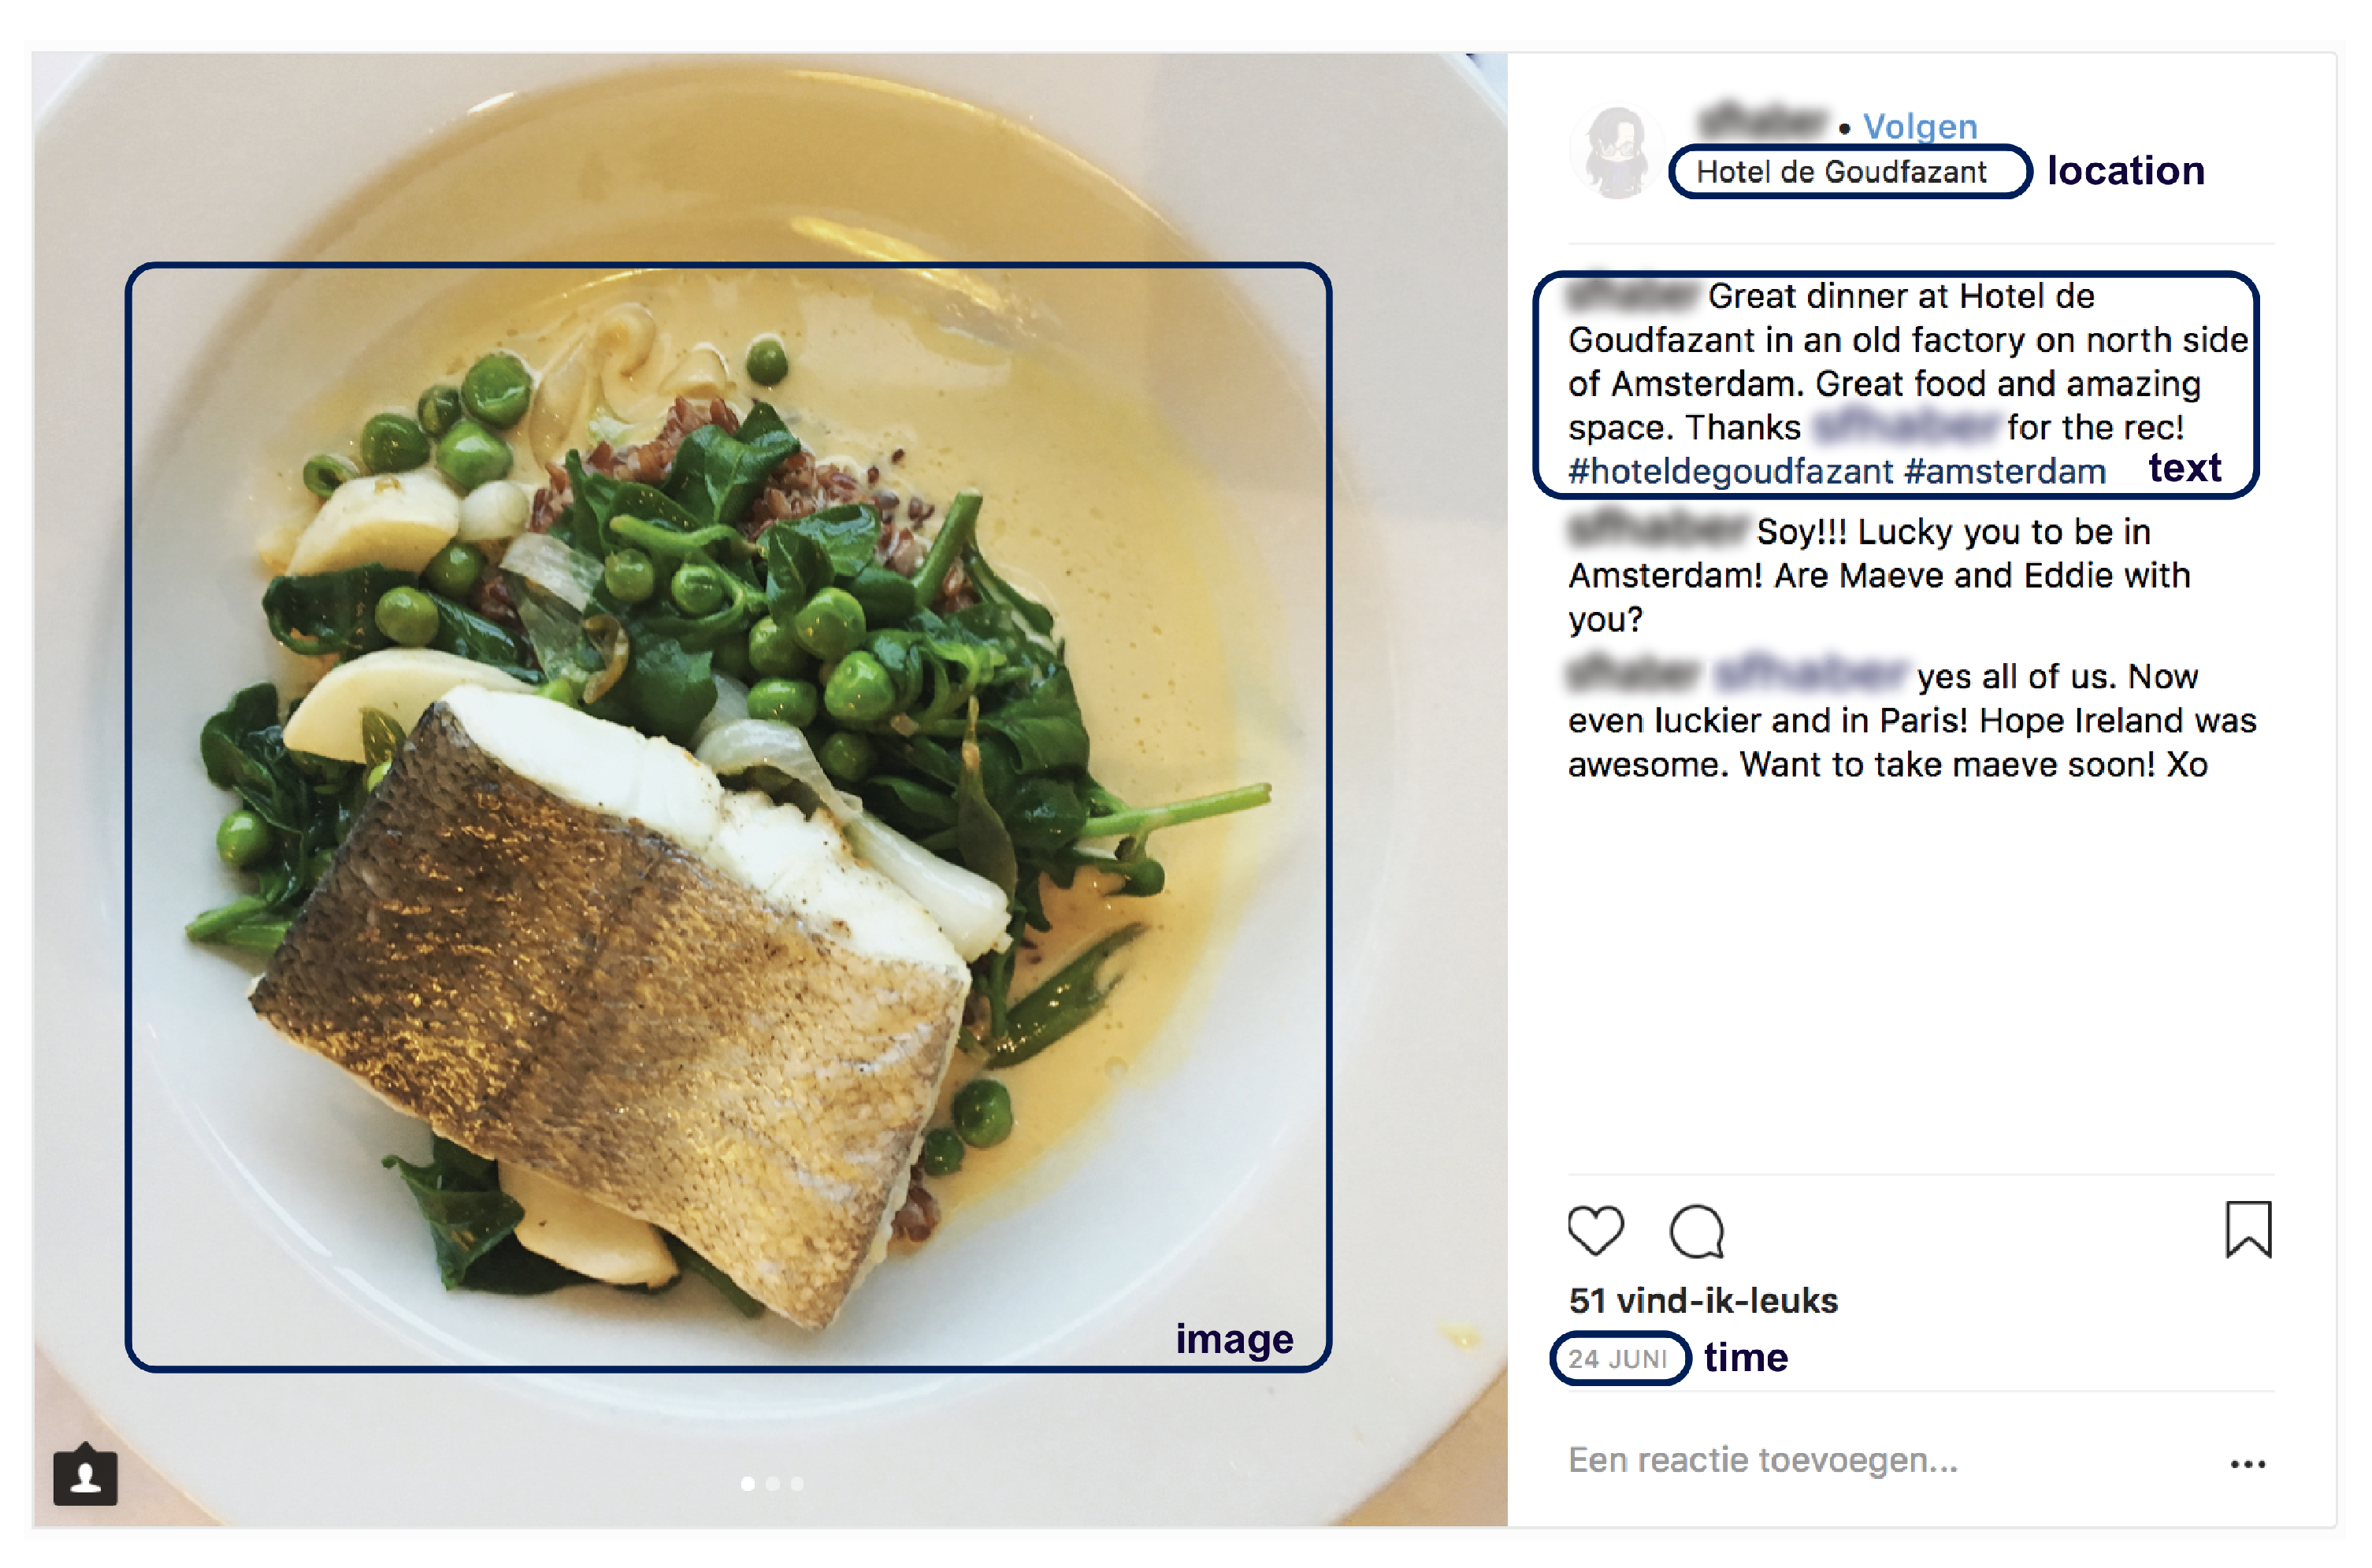
Figure 1 illustrates the intuition behind this work, the message (Great dinner at Hotel de Goudfazart […]) suggests that the picture is taken by the user during dinner. In addition, in the image we can indeed identify some kind of cooked fish and vegetables. Furthermore, the hash tags and the location where the user has checked in indicate that the dinner took place in the Hotel de Goudfazant. By looking at the place properties, we discover that the restaurant is located in Amsterdam, the Netherlands. Moreover, we can suppose that the person travelled to the restaurant using either a car or by public transportation. To conclude, this post discloses information about food (i.e., the dinner was cooked), leisure (i.e., the activity takes place in) and mobility (i.e., the individual had to travel to get at the venue) energy-consuming activities.
Contribution: The objective of this work is to automatically extract information about energy-consuming activities from social media posts. To do so, we (1) create an ontology of the domain to identify relevant and important concepts and how these are interrelated. It provides terms for describing our knowledge about the energy consumption domain in a structured manner and it facilitates to draw the link between the social media post and the activity performed in the physical world. Then (2), we design a data processing pipeline that extract the characteristics of energy-consuming activities from the social media data. This pipeline includes multiple components: (i) the data collection (and pre-processing) from the social media data sources; (ii) different steps of data enrichment; (iii) a dictionary and rule-based classification model that outputs to which categories of energy-consuming activities social media posts are classified; and (iv) a linked data publisher that use the information gathered by the previous modules to create instances of the ontology and output them using the JSON-LD format (https://json-ld.org/).
The pipeline is evaluated through a case study performed on the social media activity in the cities of Amsterdam and Istanbul.
2. Materials and Methods
2.1. The Social Smart Meter Ontology
In this section, we present the Social Smart Meter ontology (SSMO). We create this ontology with two objectives in mind: (i) understand the domain of energy-consuming activities and (ii) identify relevant and important concepts and how these are interrelated, by providing terms for describing and representing our knowledge about this domain in a structured manner [25].
In addition, the ontology allows for an unambiguous conceptual description of the targeted domain and can be also used to enable better interaction among different fields of studies concerned with energy consumption.
Since social media data refer to individual’s daily activities [15], we include social media concepts in the definition as well, by linking them to the relevant concepts of energy-consuming activities. Adding meaning to a user’s social media data help us understand to what extent these data sources reflect the individual’s energy-consuming activities.
The design of the ontology has been performed according to the Methontology guidelines [26]. We follow the methodological guidelines for specifying ontology requirements presented in [27] to compose a set of functional requirements for the SSMO ontology, which are presented in Table A1 in Appendix A.
2.1.1. The Ontology Definition
As depicted in Figure 2, an Individual consumes energy by performing an Activity at a certain Location, at a certain time, and for a certain period of time. That activity can be of multiple types: Dwelling, Mobility, Food Consumption, and/or Leisure.
A Location can either be a Path or Place. A Place can be a geographical location (e.g., a town or country) or a venue (e.g., a restaurant or airport) and is characterized by its corresponding coordinates and a category. A Path is composed of multiple (at least two) places, among which the origin and destination.
In case of a domestic activity, generally, one or more Appliances are used. Among appliances, Brown Goods (small household electrical entertainment appliances) and White Goods (major household appliances) are distinguished [28].
In food consumption-related activities (having breakfast or lunch, dining, cooking, etc.), the Food product itself and its Ingredients, the Tableware used for consumption, the food Source, and the (cooking) Process are relevant entities. Among processes, cooking and Modification are distinguished. Modification involves a technique used to modify raw food into food that is ready for cooking.
In leisure, several subcategories can be distinguished, among which: culture, event, gastronomy, playful, relaxation, social interaction, etc. In general, leisure activities require the use of one or more Artifacts, for instance, an appliance.
An activity that involves mobility is characterized by the transportation along a path. People travel by a certain Mode of transport, for which the type indicates whether the mode of transport is public or private.
For our ontology it is also important to include social media data. Therefore, based on the existing ontologies and studies [29,30], we created a conceptual data model, depicted in Figure 3, including the following elements:
- A User has a social media user account, including a user Profile, containing information such as name, gender, age, etc.
- A User can create one or more social media Posts, which can be placed at a timeline or newsfeed to share those with other social media users.
- A Post contains one or more Items, which can be of type image, video, link, etc.
- Within a Post, a User can Mention a concept, such as another User or a Location. This mention provides a link to this concerning concept. Often, more information about the location is available, such as the corresponding coordinates or the location category.
Then the two parts are linked by the following relations: a User is an Individual and Post may reflect an Activity.
2.1.2. Implementation of the Ontology
To prevent a proliferation of ontologies covering the same entities and relationships, it is important to determine which existing ontologies can be integrated and extended to develop ours. For this reason, we looked at existing ontologies about energy consumption, travel, food, and social media.
The Suggested Upper Merged Ontology (SUMO) [31] has been designed as a foundation ontology and is the largest formal public ontology today, used for research and applications in search, linguistics, and reasoning (in computer information processing systems). Since it covers most of the concepts of our conceptual data model of energy-consuming activities, it is used as the foundation to be extended for our SSMO ontology.
The Semantic Tools for Carbon Reduction (SEMANCO) Energy Model [32] focuses on terms and attributes describing energy consumption and CO emission indicators for regions, cities, neighborhoods, and buildings, along with climate and socioeconomic factors affecting energy consumption. We include it to model the energy consumption part of our ontology.
The EnergyUse (EU) platform [33] is built upon the PowerOnt [28] ontology that provides information of energy consumption for numerous household appliances and extends the DogOnt [34] ontology, which aims to model intelligent domotic environments. We integrate this ontology to cover the concepts related to appliances.
The Food Ontology (FO) [35] encompasses information about recipes, their ingredients, along with suitable diets, menus, seasons, courses, and occasions. Also, entities about food chain (i.e., methods and techniques used to process the food) are promising for the integration in the SSMO ontology. FO does not cover the tableware entities; yet, this is not problematic since the SUMO ontology covers them. Finally, the Travel Ontology (TO) by Stevens [36], covers most of the relevant entities within the mobility concept, except for the actual mobility activity itself.
In Table 1 for each ontology is indicated to what extent the entities within the high-level concepts (energy activity, location, dwelling, food consumption, leisure, and mobility) are covered. A “+” indicates the entity occurs in the ontology, a “” indicates the entity is covered to some extent, and a “−” indicates the ontology does not include the entity.
Regarding the social media activity, we reuse the Friend of a Friend (FOAF) [30] and the Semantically-Interlinked Online Communities (SIOC) [29] ontologies. In general, both cover the concepts of user account, post, and item; but the mention entity only recurs in the SIOC ontology, whereas the location entity can only be found in the FOAF ontology.
To a great extent, the SSMO ontology can be built upon existing ontologies, as can be deduced from the overview in Table 1; many classes can be reused. Table 2 summarizes the classes that are reused from existing ontologies.
On the other hand, the existing ontologies serve other purposes than identifying and describing energy-consuming activities, so even though some concepts are already covered (e.g., the mobility activity by the SUMO:Motion class), the exact semantic of the class is slightly different. For these cases, we create new entities for those classes and we draw the equivalence relationship between them (e.g., our ssmo:MobilityActivity class and the SUMO:Motion class). Table 3 summarizes the entities created in this way.
In addition, not all entities from the conceptual data models can be covered by existing ontologies. The new entities that had to be created for the SSMO are listed in Table 4.
The ontology was then implemented using the Web Ontology Language (OWL) [37] with Protégé (https://protege.stanford.edu), Stanford University’s free, open-source ontology editor.
Finally, the ontology is available on the companion website (http://social-glass.tudelft.nl/social-smart-meter/#ontology).
2.2. Data Processing Pipeline
The data processing pipeline, shown in Figure 4 is composed of four modules: Data Collection, Data Enrichment, Classifier and Linked Data Publisher.
During the first stage, the data is collecting through the APIs of the selected data sources. Both data (image, and text data) and metadata (user, time, and place data) are collected.
In the second stage, different enrichment steps are performed. First, for each social media post, computer vision and natural language processing techniques are applied to respectively the image and text. For the images, we use both object and scene recognition models to extract information regarding the items present in the picture and the context where the photo was taken, while for the text we apply state-of-the-art processing methods and word disambiguation techniques. We enrich the information about the place by looking for its category on external data sources such as Foursquare and Google Places.
Using the enriched data, the social media post is classified to one or more of the energy-consuming activity categories using a hybrid rule and dictionary-based approach.
Finally, the publisher module combines the output of the other modules and publish the information about the energy-consuming activity as linked data (http://linkeddata.org/) conforming to the Social Smart Meter ontology.
2.2.1. Data Collection and Pre-Processing
The pipeline collect data from Twitter and Instagram. Those sources were chosen because these are widely used, and provide public APIs to retrieve the data (text, images, places, time, user) we are interested in.
Since a social media post is very noisy, contains slang, hashtags or mentions, we apply text pre-processing techniques (stopword removal, removal of hashtags and other special characters, stemming,) before the tokenization (word segmentation of the message). This results in a set of tokens that might refer to an energy-consuming activity. To perform this task, we use the Python-based Natural Language Toolkit (NLTK (https://www.nltk.org/)) module.
2.2.2. Data Enrichment
In this section, we describe the enrichment steps performed by our pipeline. Each step aims at extracting additional data from the text, image, and place of the social media post.
Text Enrichment
To overcome the ambiguity of words we use the Lesk algorithm [38] for word sense disambiguation. Assuming that words in a particular text section (i.e., a message in our case) are likely to share a common topic, it compares the definitions of each term in the section to determine the more likely sense of the word. In particular, we use the Adapted Lesk algorithm [39], implemented in the NLTK library, that incorporates WordNet (https://wordnet.princeton.edu/)’s lexical database. For each term in the social media post, this phase output its WordNet sense and the list of synonyms.
Image Enrichment
In this phase, state-of-the-art image processing techniques are applied to provide annotations on objects and scenes that are recognized in the images.
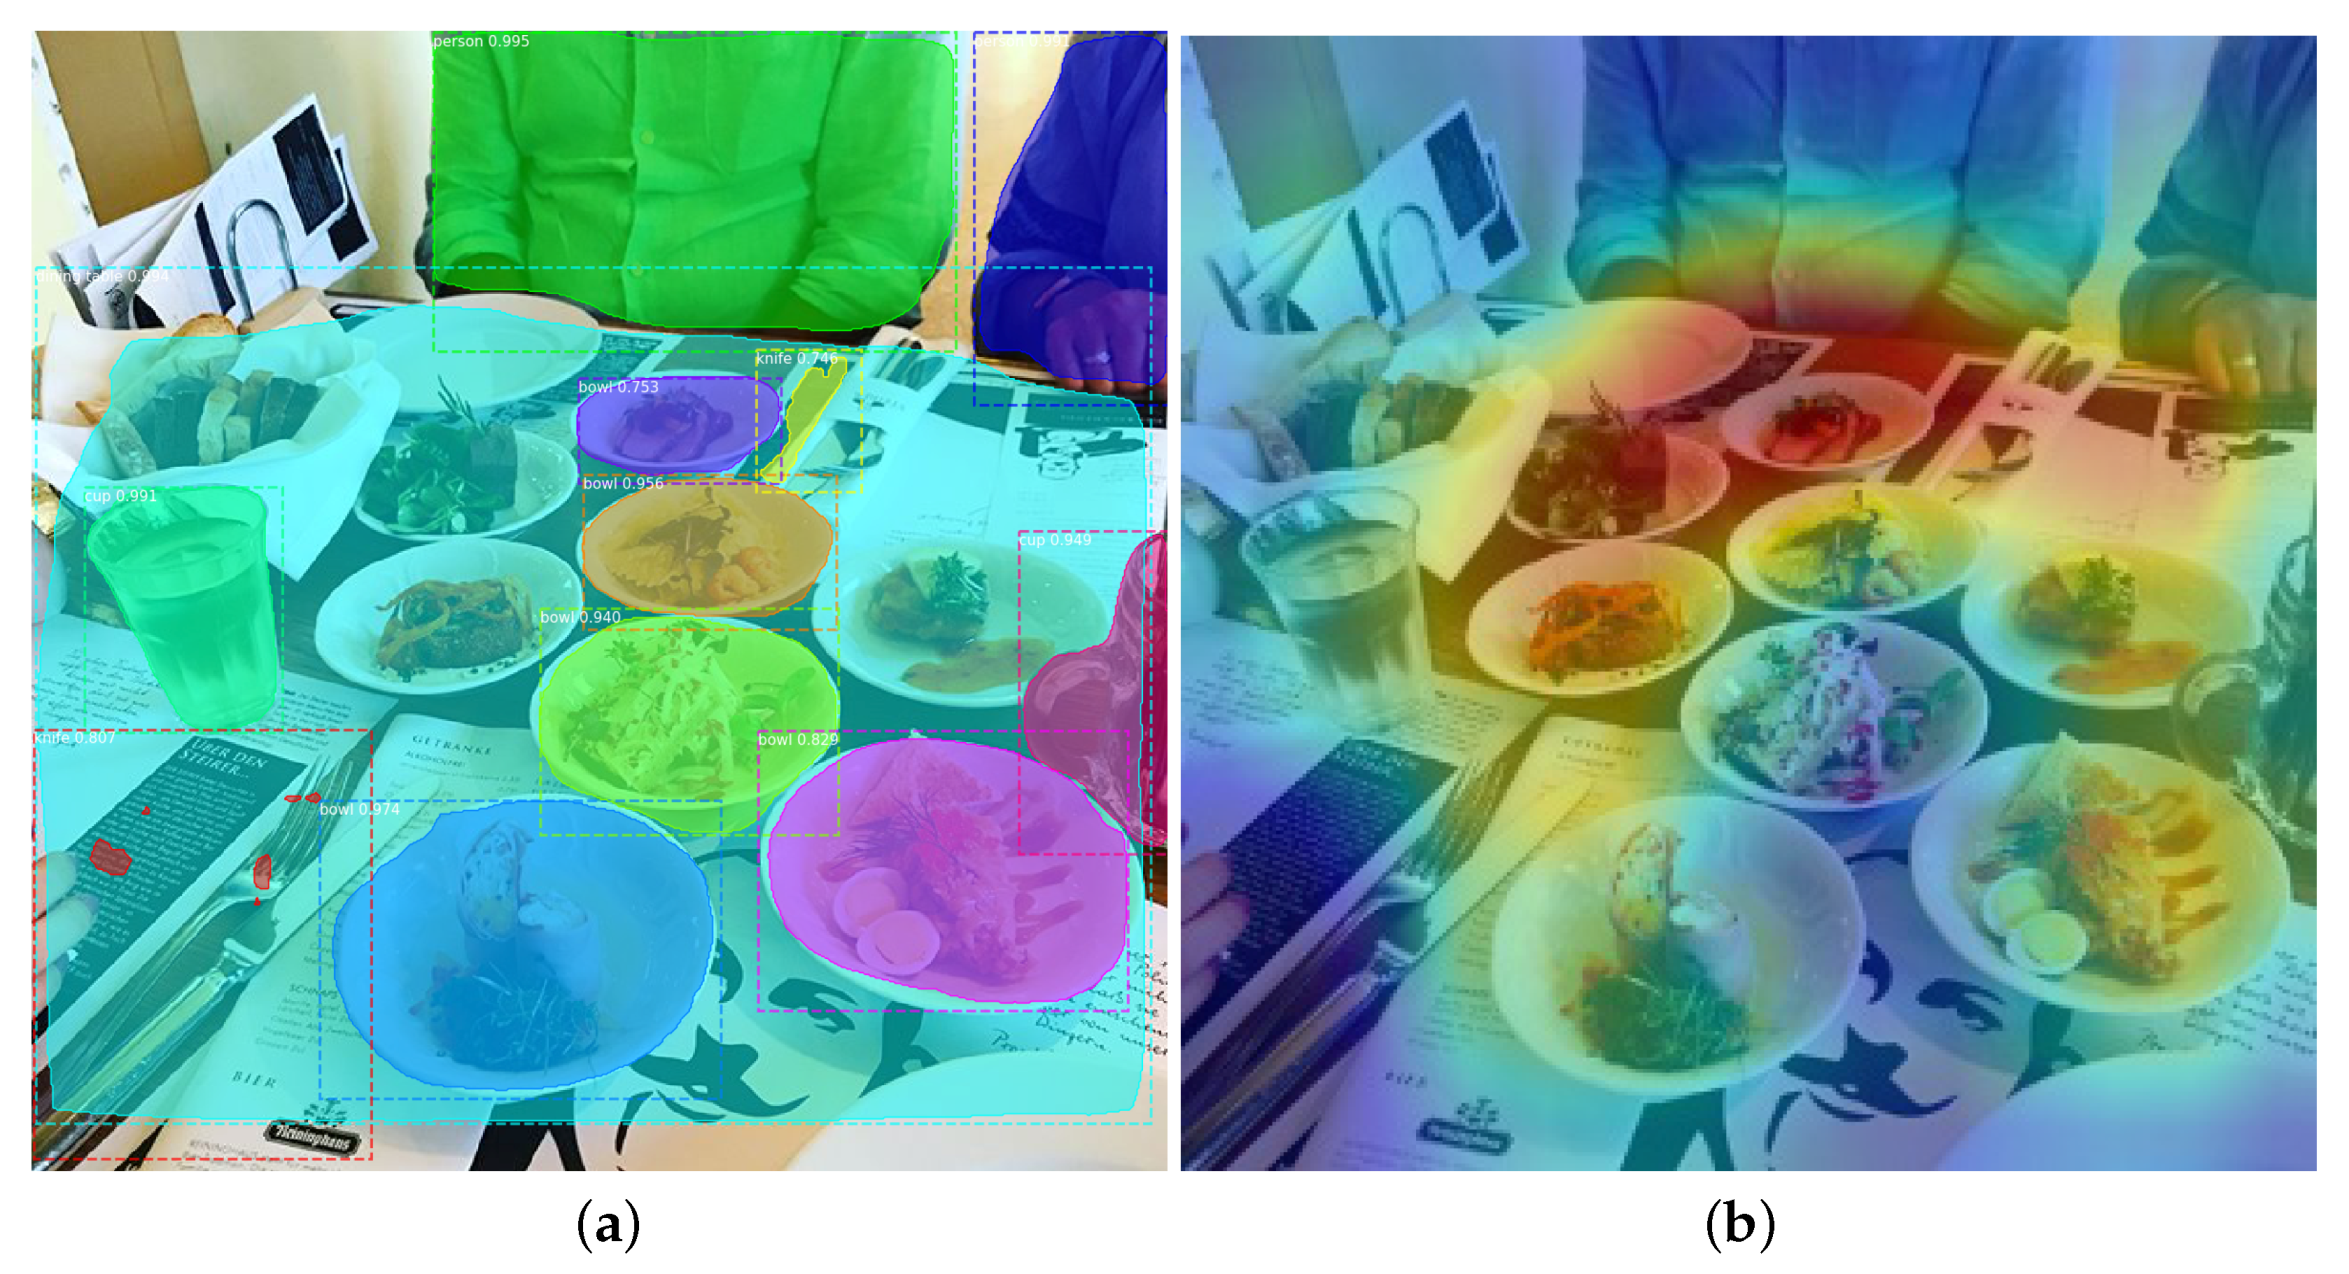
We include both object and scene recognition models, because they provide complementary information. For instance, the objects recognized in the example in Figure 5a (e.g., various tableware), may indicate food consumption activity. The scene recognition in Figure 5b on the other hand, recognize a cafeteria scenario, suggesting a leisure activity.
For the image object recognition, we use a state-of-the-art pre-trained model based on the regional convolutional neural network Mask R-CNN [40] trained on the Microsoft Common Objects in Context (MS COCO) dataset using the mask_rcnn_coco.h5 weights (https://github.com/matterport/Mask_RCNN/releases).
For the scene recognition, we incorporated the neural network model based on the ResNet50 backbone (https://github.com/CSAILVision/places365), which is pre-trained on the Places (http://places2.csail.mit.edu/index.html) data set.
Place Enrichment
In this phase, we extract the category of the place where the post was published, because it could be an indicator for the category of the energy-consuming activity. We compute the distance from the previous post created by the user to infer how far he has traveled to understand if the post refers also to an energy-consuming activity related to mobility.
For the first case, we look to retrieve more information by matching the location of the social media post with the venues in Google Places and Foursquare. Numerous studies have investigated place matching; [41] found that the mean great circle distance between two matched Points of Interest (POIs) was equal to 62.8 m and in [42] a buffer area with a radius of 25 m (per POI) was used to reduce geocoding errors. Based on these values, we use a radius of 50 m. If a match is found, the corresponding place details are requested to collect one or more place categories.
Moreover, once we have an overview of all the places a user has checked in, we infer the user’s home location by using spatial clustering. Then, we estimate the distances between the home and other location check-ins. To estimate the home, we use the density-based spatial clustering of applications with noise (DBSCAN, [43]). It separates high-density clusters from low-density ones and marks outlier points lying alone in low-density areas (whose nearest neighbors are too far away). We assume that the location of a user’s home will be a relatively small-sized, high-density area, whereas at other places fewer check-ins take place, resulting in areas of low density.
2.2.3. Classification
We apply a hybrid dictionary and rule-based classification approach to determine whether a social media post refers to one or more energy-consuming activities.
We used a custom rule/dictionary-based approach instead of a state-of-the-art classifier for mainly two reasons: first, traditional classification approaches need a large set of manually annotated data for the training; to the best of our knowledge, such dataset does not exist, and its creation is beyond the scope of this work. In addition, second, while lacking generalization, a rule-based approach performs better in a narrow domain.
We define a dictionary as a set of terms related to a specific energy-consuming activity type—e.g., ingredients or cooking utensils are associated with the food consumption category. Thus, each category of energy-consuming activities has a distinct dictionary. The basic idea is to compare the terms extracted from the message (text tokens), image (annotations), and place (categories) to the terms in the dictionary. For now, a distinct dictionary for each of these types of data is constructed. Undoubtedly, this comes with some hassle but it also rules out ambiguity to some extent—e.g., the text token “tram” might infer a mobility activity whereas the image annotation “tram” could also point at some tram in the background which might not be related to the user’s activity.
For the text dictionaries, we reuse the ones created in [44], where the authors use a hybrid dictionary-similarity distant supervision with the purpose of classifying Twitter content to energy consumption-related content. We further expand the dictionaries by adding the corresponding synonym.
The image dictionary is composed by the predefined list of classes of the pre-trained models. The classes are manually classified to none, one or more of the different categories of energy-consuming activities. For instance, “television” relates to both dwelling and leisure and is part of both dictionaries, whereas “person” does not indicate any energy-consuming activity and is thereby not included in any dictionary.
Alike the image annotations, the sets of place categories are also predefined. As all place categories that could possibly be assigned to a place are known, these can be categorized in the same manner as the image annotation classes, by manually linking the place category to the energy-consuming category. (e.g., a “restaurant” place category is part of both food consumption and leisure dictionaries.)
The dictionaries are available on the companion website (http://social-glass.tudelft.nl/social-smart-meter/#dictionary).
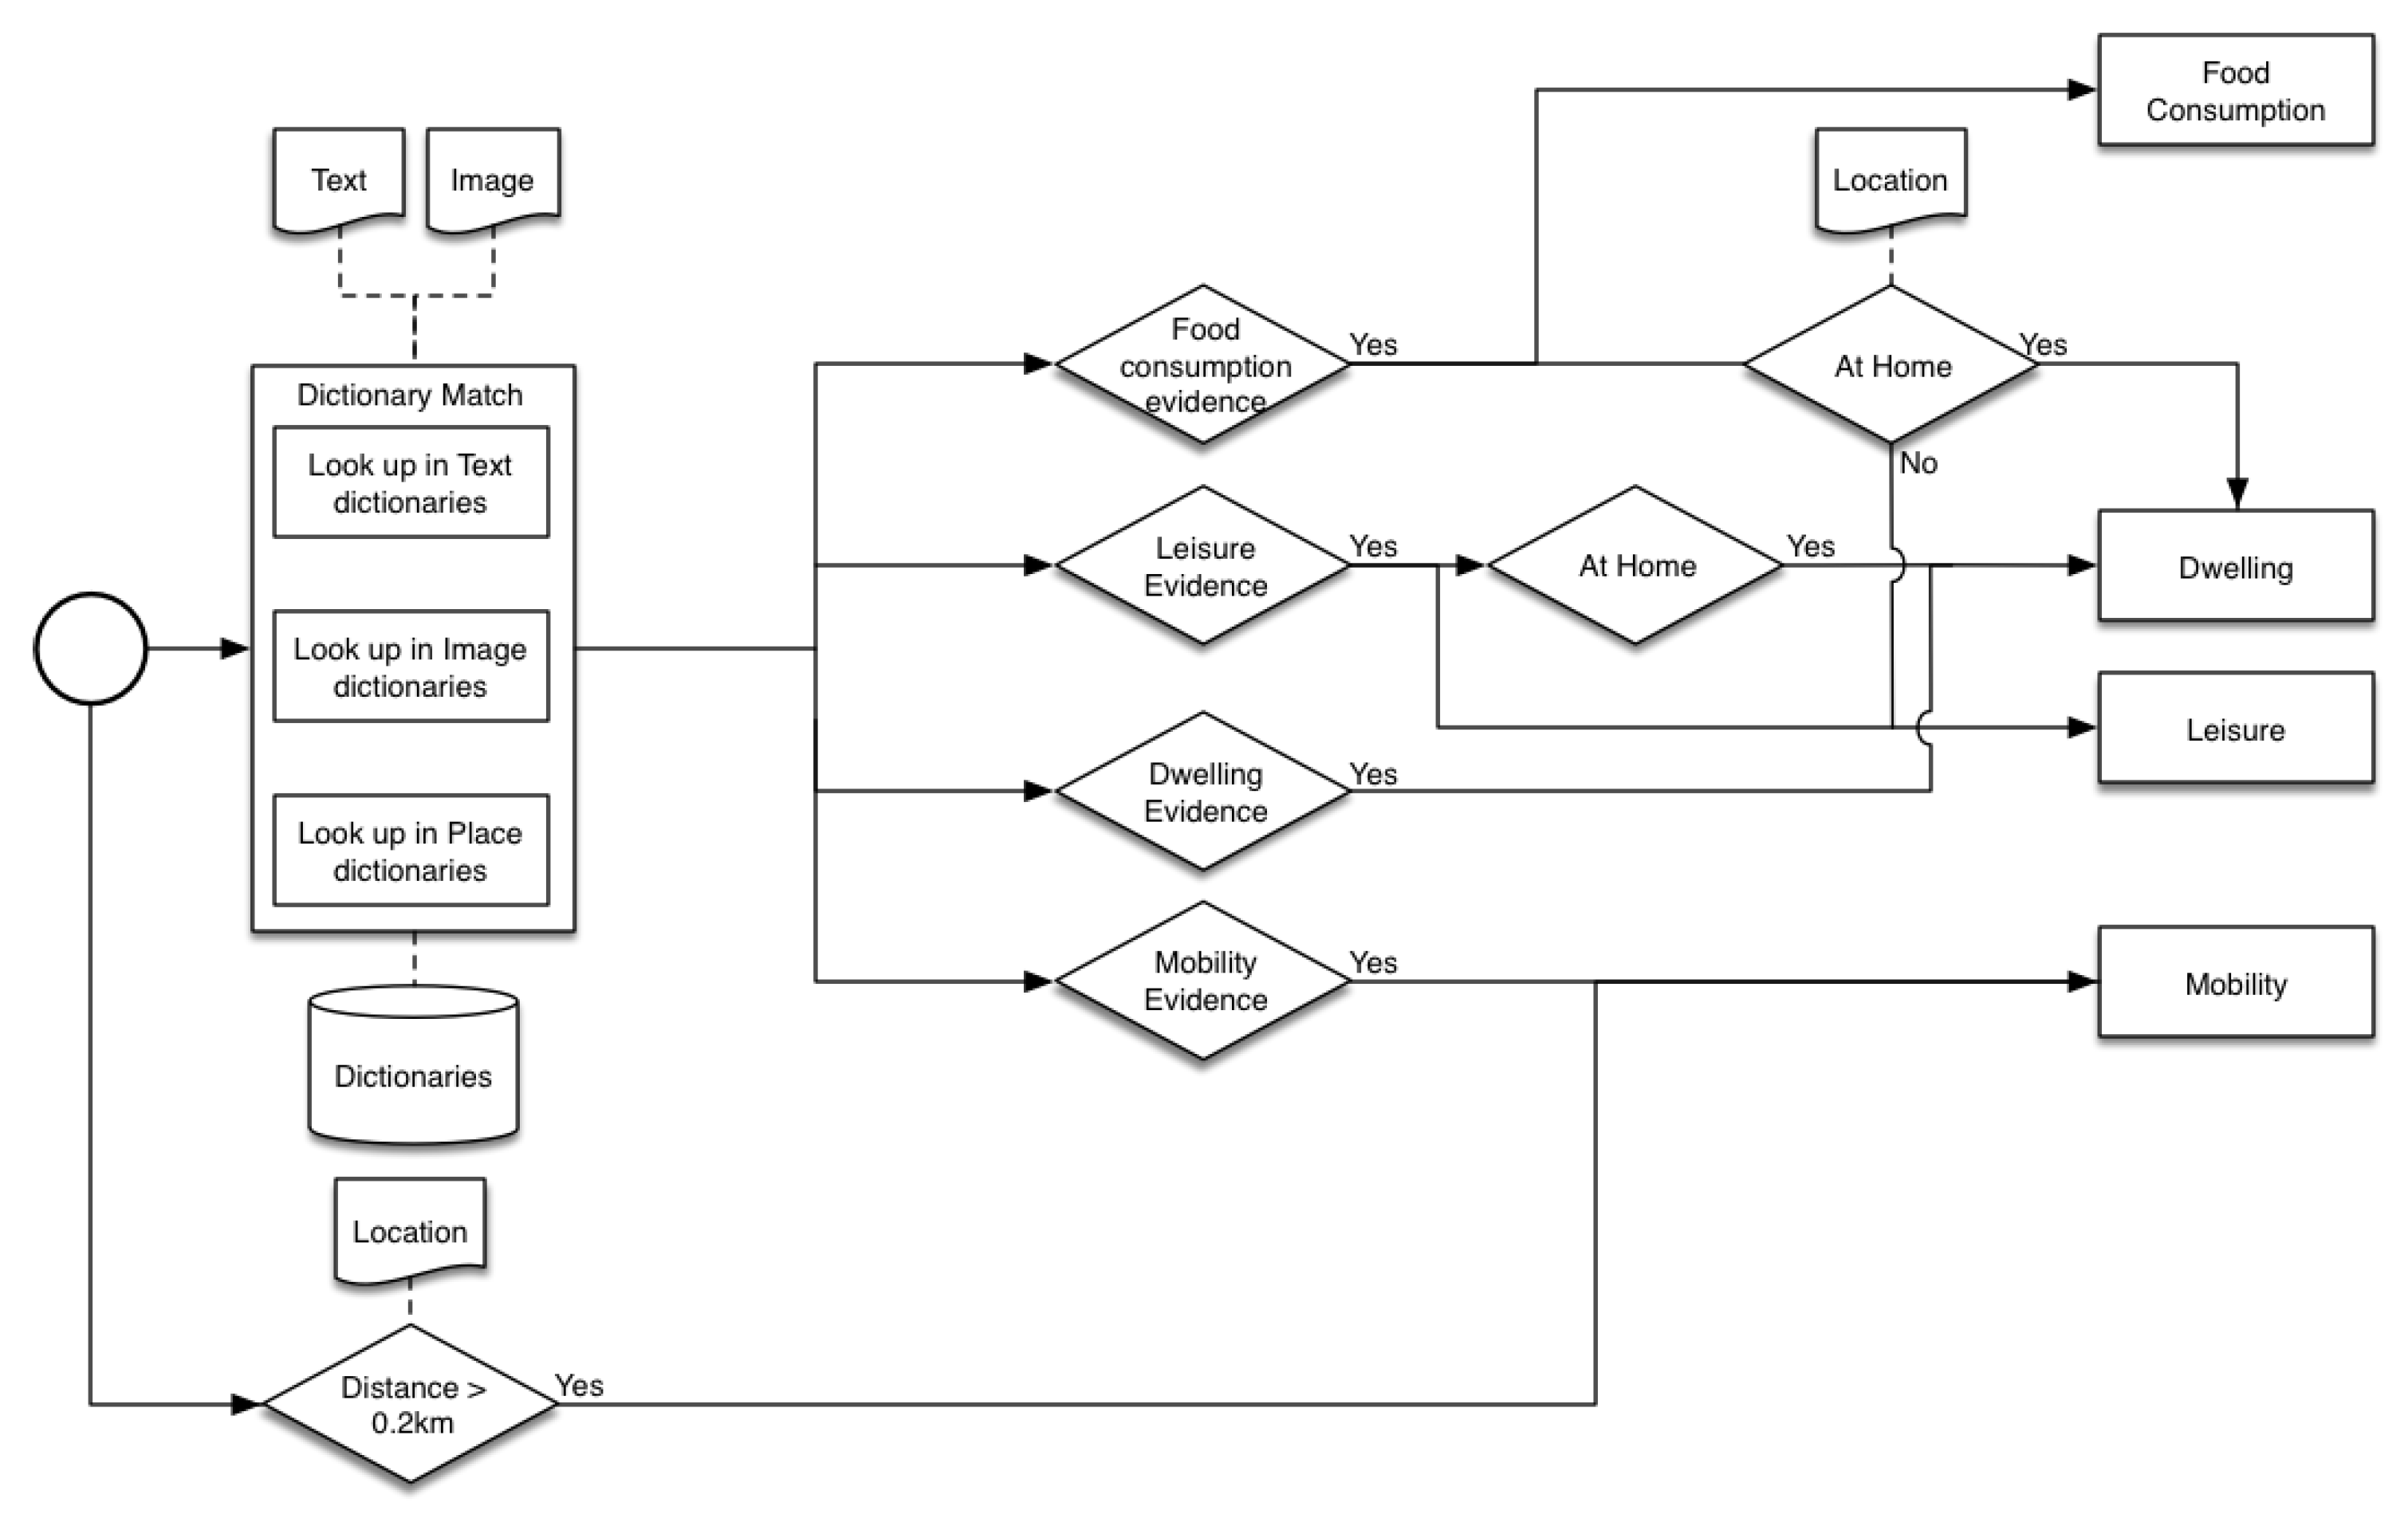
Then, the post is classified according to the rules illustrated in Figure 6. For each term, we identify if it is evidence (i.e., it appears in one of the dictionaries) for one or more energy-consuming activities. In case a leisure or food consumption activity is performed at home, we can classify it to dwelling as well. Furthermore, if a food consumption activity is performed at some place other than home, we classify it as a leisure activity.
Then, we look at the user’s distance to his or her previous post. If it exceeds the threshold of 0.2 km (This value was found after several test iterations of our pipeline. It seems to provide the best trade-off between precision and recall in our context), we consider it to be a mobility activity. Along with that, we analyze whether a vehicle was required to bridge this distance. If so, the mode of transport can be inferred—e.g., if the distance traveled in a day is more than 5000 km, it is very likely the individual traveled by aircraft to cover that distance.
Given the noisy nature of social media posts we tried to model the confidence of our classifier based on three parameters: (i) the ratio of relevant tokens, distinguished on type of data (text, image, place), (ii) for each term a score indicating its relevance to the category of energy-consuming activities, and (iii) a weighted factor that represents to what extent the type of data is informative for this category of energy-consuming activities. For instance, it is hard to recognize a mobility activity from an image, since individuals do not often post images of objects such as a transportation means while traveling. A check-in which is based on a mobility-related place such as an airport or train station would be far more indicative in that situation. On the contrary, if individuals perform a food consumption activity, they are more likely to post images in which food objects can be recognized.
Taking all the above into account, the calculation of our classification confidence is formulated as follow:
where is the number of relevant terms, w is the weighted factor, x is the type of energy-consuming activity, y is the type of data (text, image, or place), and is the vector of the scores () of all relevant terms.
The relevance score of the terms (scores) are determined separately for each type of data. For a text token, the relevance is computed as the similarity between the term vectors and the word vectors included in the dictionaries obtained using Word2Vec [45] (a model used for learning vector representations of words, called “word embeddings”), whereas for an image annotation this is equal to the annotation score assigned by the object or scene recognition model.
For a place category, this score is binary (either 0 or 1), depending on whether the place category occurs in the dictionary.
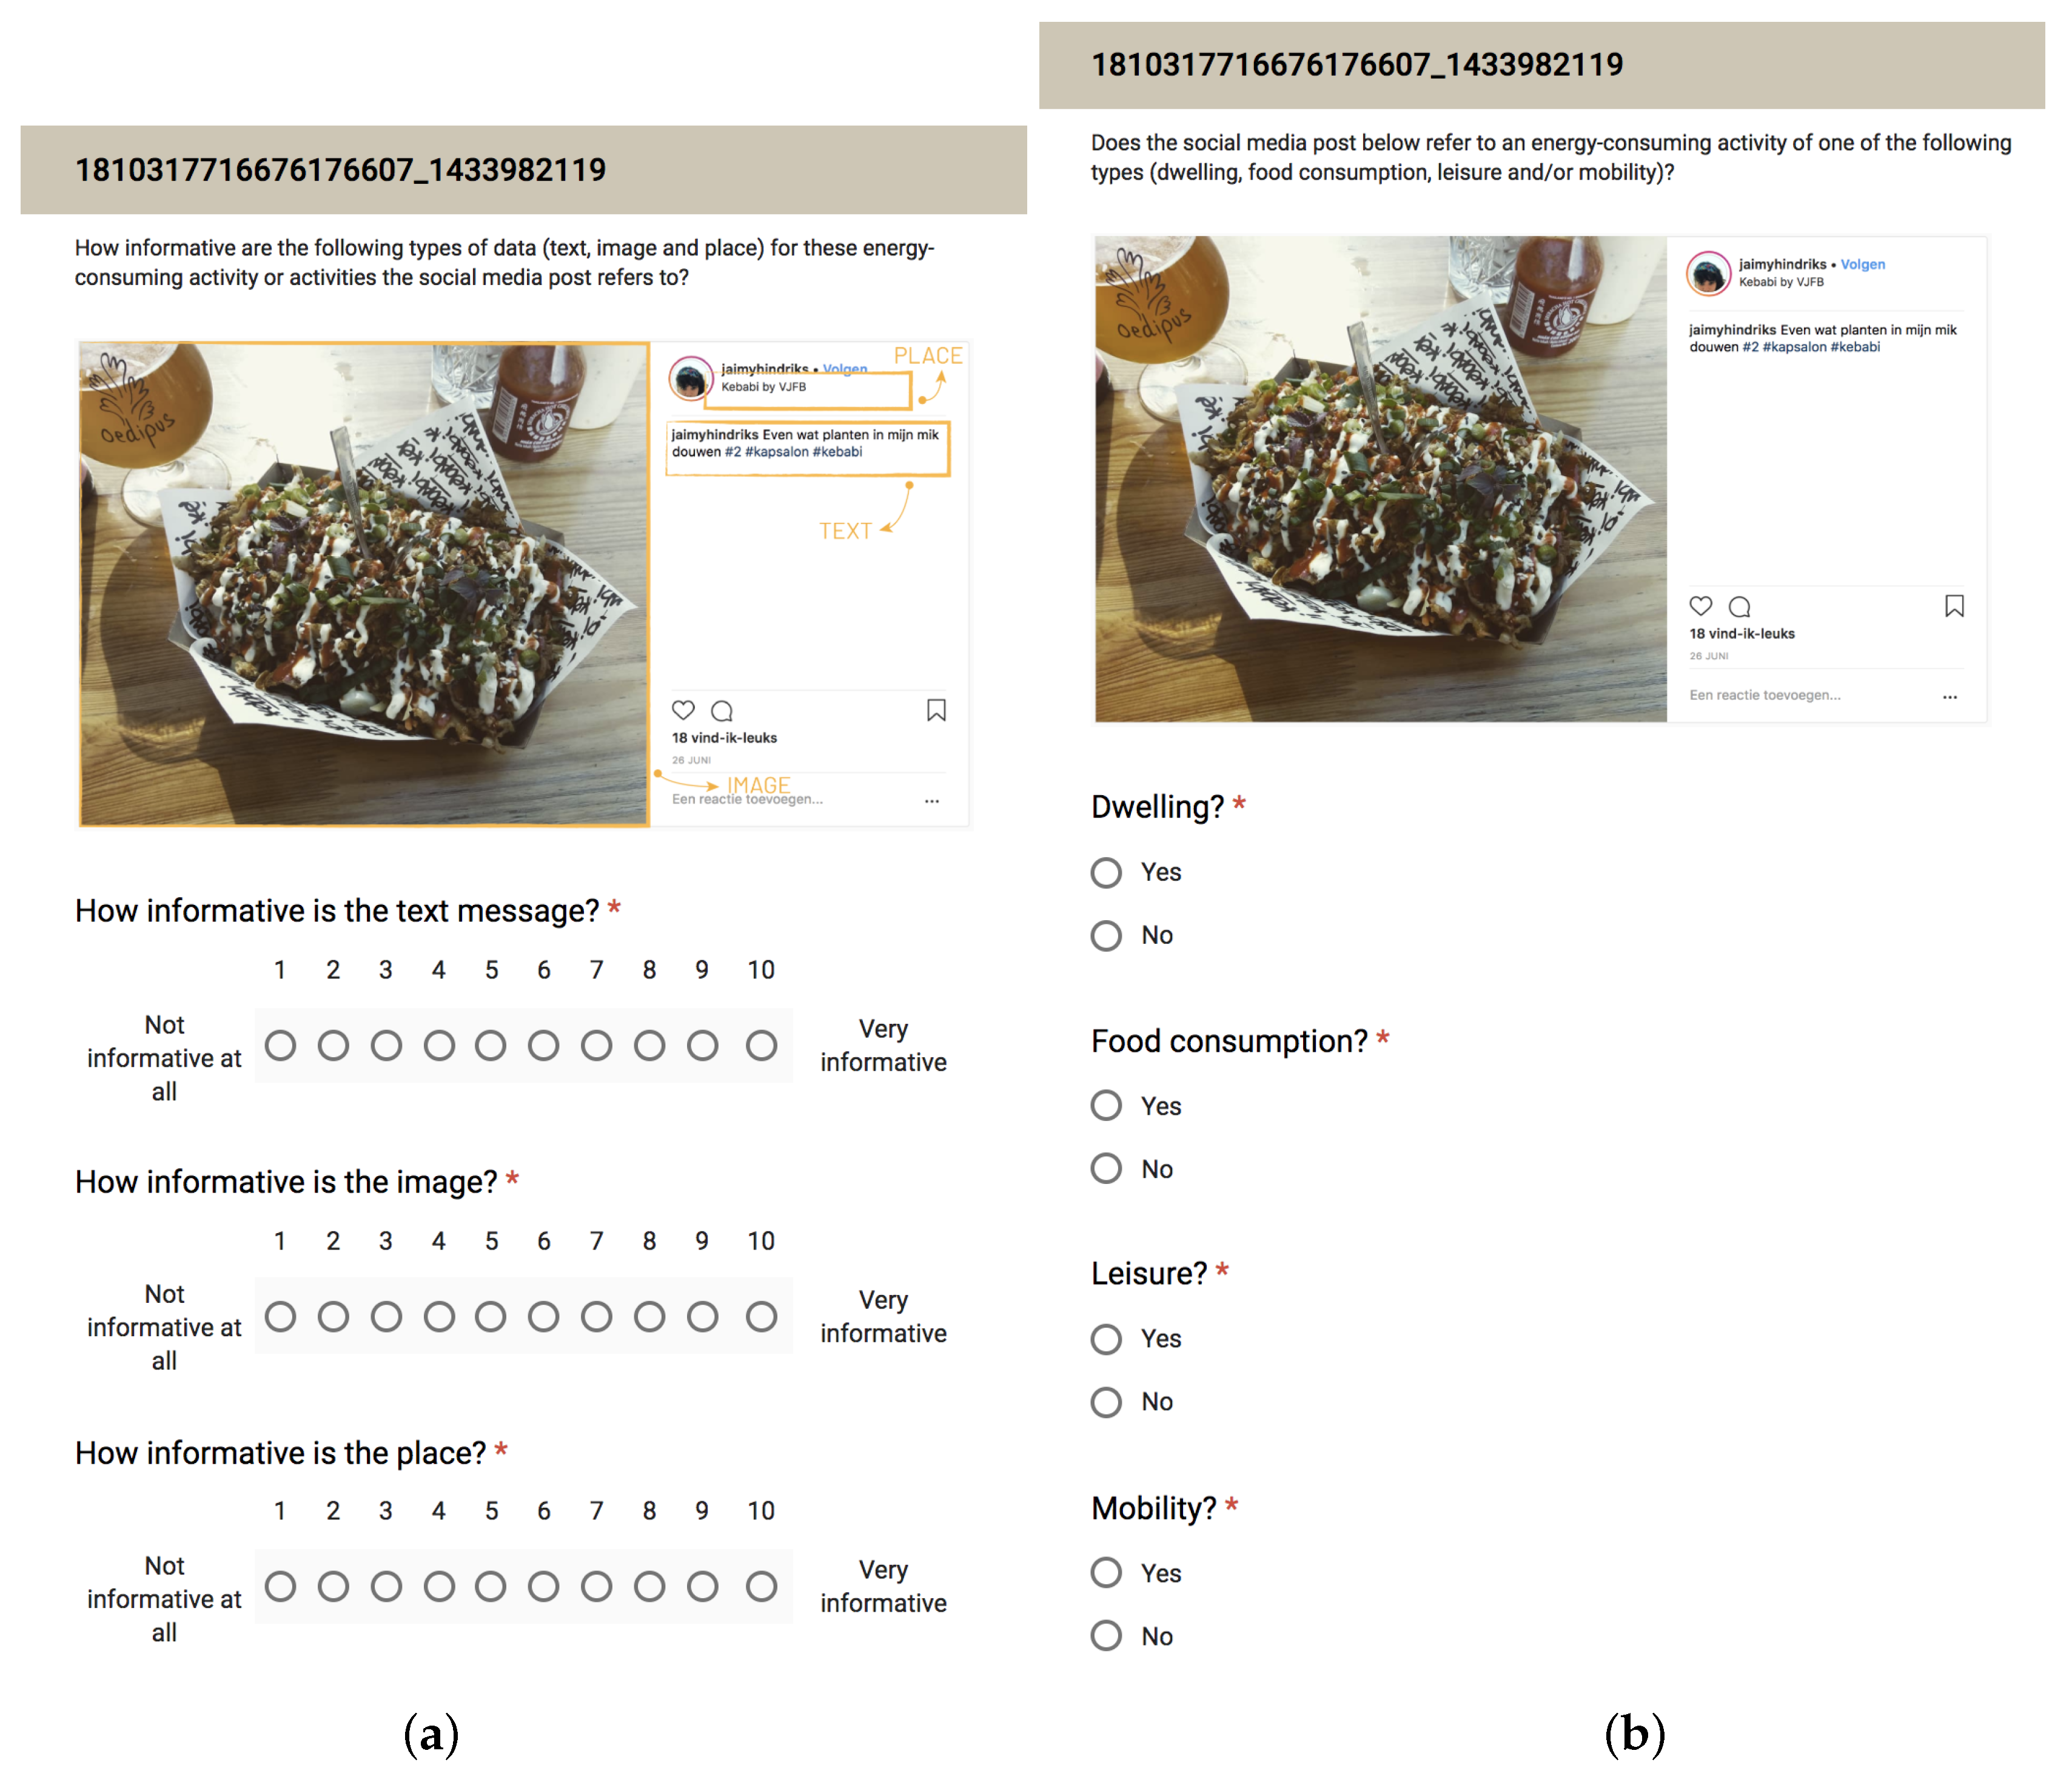
To avoid possible bias due to our personal opinion, we decide to use an online survey to tune the weights (). We showed social media posts and asked the participants to rank the data type according to their informativeness on a scale from 0 to 10 (Not informative at all to Very Informative). Figure A1a in Appendix B shows an example of question that was asked.
The users’ average rankings are displayed in Table 5 and were adopted as data type weights in the classification module in the data processing pipeline for our case study. The weight values do not deviate a lot from each other. Yet, we observe that the users find images most and places least informative to describe dwelling activities. The same applies to food consumption activities.
Finally, the classifier confidence for a category x is the average of the contribution of each y data type. In future work, we will examine whether other strategies (such as taking the maximum of minimum instead of the average) provide in better results.
Hereafter, an initial threshold of 0.5 is applied to determine to which categories of energy-consuming activities the social media post is classified. This threshold value is then tuned to optimize the framework’s performance.
2.2.4. Linked Data Publishing
In this final step, the label obtained by the classifier and the data extracted from the enrichment module are combined to create instances of the SSMO Ontology from the social media posts.
To do so we use Triplewave [46], an open-source, reusable and generic tool for publishing linked data streams on the web using the JSON-LD format.
Listing 1 shows an example of instance of SSMO ontology created by our pipeline. This instance was created by processing the social media post shown as example in Figure 1. Our pipeline determined that the post refers to three kind of activities (e.g., ssmo:leisure activities, ssmo:food activity and ssmo:mobility activity), they all take place in the venue (e.g., ssmo:location) of Hotel de Godfazan, and it involve the consumption of cooked fish.
            Listing 1: Example of JSON-LD created with Triplewave.
            {
              "@context":{
                "ssmo":"http://www.semanticweb.org/roosdekok/ontologies/2018/1/ssm",
                "sioc":"http://rdfs.org/sioc/ns#",
                "sem":"http://semanco02.hs-albsig.de/repository/ontology-releases/eu/
                       semanco/ontology/SEMANCO/HEAD/SEMANCO-HEAD.owl",
                "eu":"http://socsem.open.ac.uk/ontologies/eu#",
                "to":"http://www.co-ode.org/roberts/travel.owl",
                "foaf":"http://xmlns.com/foaf/0.1/"
              },
              "@id":"http://smm/i1",
              "ssmo:individual":{
                "@id":"http://instagram.com/userId",
                "ssmo:nickname":"username"
              },
              "sioc:post":{
                "@id":"http://instagram.com/postId",
                "dcterms:created":"2018-06-24",
                "sioc:content":"Great dinner at Hotel de Goudfazant in a old factory
                     on north side of Amsterdam…",
                "sioc:hasCreator":"http://instagram.com/userId"
              },
              "ssmo:location":{
                "ssmo:categoryOfPlace":"Restaurant",
                "ssmo:address":"Aambeeldstraat 10, 1021 KB Amsterdam",
                "ssmo:name":"Hotel de Godfazan",
                "@id":"https://www.google.nl/maps/place/Hotel+De+Goudfazant/"
              },
              "ssmo:leisure activity":{
                "@id":"http://ssm/lo1",
                "ssmo:isOfferedAt":"https://www.google.nl/maps/place/Hotel+De+
                     Goudfazant/",
                "ssmo:reflectedBy":"http://instagram.com/postId",
                "ssmo:time":"2018-06-24"
              },
              "fo:food":{
                "ssmo:isConsumedIn":"http://ssm/fo1",
                "fo:ingridents":"fish"
            },
              "ssmo:food activity":{
                "@id":"http://ssm/fo1",
                "ssmo:isOfferedAt":"https://www.google.nl/maps/place/Hotel+De+
               Goudfazant/",
                "ssmo:reflectedBy":"http://instagram.com/postId",
                "ssmo:time":"2018-06-24"
              },
               "ssmo:mobility activity":{
                "@id":"http://ssm/mo1",
                "ssmo:isOfferedAt":"https://www.google.nl/maps/place/Hotel+De+
                 Goudfazant/",
                "ssmo:reflectedBy":"http://instagram.com/postId",
                "ssmo:time":"2018-06-24"
              }
            }
By publishing the data as linked data we allow interoperability with other services by sharing a common understanding of the energy-consuming activities domain. In this way, others can define custom queries in a standard language (e.g., the SPARQL Protocol and RDF Query Language (https://www.w3.org/TR/rdf-sparql-query/)) and perform ad-hoc aggregations to satisfy their own research needs.
3. Evaluation
Since the behavior regarding creating social media posts might differ between cities with a different culture, for our evaluation we conducted a study on the cities of Amsterdam and Istanbul.
3.1. Dataset Collection
We collected data from 22 June until 27 June, and 27 July until 28 July 2018. At first, only social media posts created in Amsterdam were collected to provide the first round of insights and tuning of our pipeline. Hereafter, social media posts created in Istanbul were collected as well to compare the results between the two cities. An overview of the numbers of collected social media posts is provided in Table 6.
We observe that, in general, more social media posts are created in Istanbul than in Amsterdam. Given that Istanbul’s population is more than 15 times as large as Amsterdam’s population, this is expected. In both cities, Instagram yielded more posts than Twitter.
3.2. Performance Analysis
The performance of the framework was evaluated using the standard metrics of precision, recall, accuracy, and F1-score. Precision is the ratio between the posts classified correctly in one of the categories and all the classified posts, recall is the ratio between posts classified correctly in one of the categories and all the set of relevant posts. Accuracy is the fraction of posts correctly classified, taking into the account also the true negatives (i.e., the posts correctly not classified in any category). Finally, the F1-score is the harmonic average of the precision and recall.
The groundtruth was created through an online survey. We asked the participants to assess whether a social media post relates to an energy-consuming activity. We use a random sample of 100 social media posts and balanced the representation of each energy-consuming activity category. We collected 9 responses for each post and the final categories were decided with a majority vote.
Figure A1b in Appendix B shows an example of question asked in the survey.
Table 7, Table 8 and Table 9 summarize the evaluation metric values for each category of energy-consuming activities individually, as well as for the total. The evaluation metrics are calculated for different classification thresholds (from 0.3 to 0.7), to find the best-performing one. The framework’s overall accuracy varies from 0.69 to 0.78. The accuracy for the classification of leisure activities is relatively low compared to the other categories due to many false negatives—i.e., social media posts that are not classified to leisure while, based on ground truth, they should be. Furthermore, the precision for dwelling activities is rather low whereas the accuracy is relatively high due to many true negatives—i.e., social media posts that (based on ground truth) do not refer to dwelling activities and are indeed not classified to this category by our classification model.
In Figure 7 the evaluation metric scores are plotted for the different threshold values. As expected, the recall scores decrease while increasing the threshold—i.e., decreasingly relevant social media posts have sufficient high confidence scores to exceed the threshold. As for the precision, we observe that the scores are fluctuating for different threshold values. Increasing the threshold results in less true positives, as well as less false positives. However, the numbers of true and false positives do not decrease proportionally. Also, there are very few social media posts with a high confidence score for dwelling. For a threshold greater than 0.4, the precision is zero for dwelling because no post was classified as such.
Based on Figure 7 a threshold of either 0.30 or 0.35 appears to result in the best performance. For a threshold of 0.30, a precision of 0.59 is obtained whereas a threshold of 0.35 results in a precision of 0.73. Furthermore, these thresholds (0.30 and 0.35) respectively result in recall scores of 0.63 and 0.47 and in F1-scores of 0.60 and 0.54. Based on the F1-score, a threshold of 0.30 seems to be better performing. Yet, it is dependent on the context whether it is more important to have a higher precision or recall score—i.e., whether it is more important to classify as many social media posts as possible correctly or to discover as many as possible that are referring to energy-consuming activities. In case the quantity of energy (in terms of kWh consumption or CO2 emission) during an activity is analyzed, a higher precision is considered more beneficial. However, when a qualitative overview of all energy-consuming activities performed by an individual is required, it is more advantageous to have a higher recall score. For our case study, a threshold of 0.35 was selected.
3.3. Use Case
In this section, we give a deeper look to the posts that were classified in any of the four energy-consuming activities.
We collected the posts regardless of the language. In the analysis, for Amsterdam we consider the terms in English and Dutch, while for Istanbul we consider the terms in English and Turkish. Notice that the terms in different languages are needed only for the textual part of the social media posts, and not for the image labels and place categories.
For the text processing we used three pre-trained embeddings: for the English language we use the model trained on the Google News corpus (https://github.com/mmihaltz/word2vec-GoogleNews-vectors), for Dutch we use a model trained on the combined dataset of Wikipedia (https://dumps. wikimedia.org/nlwiki/20150703), Sonar500 (http://hdl.handle.net/2066/151880) and Roularta corpus (a set of articles form the publishing consortium http://www.roularta.be/en) [47], while for the Turkish language we use a model trained on the Turkish Wikipedia dataset (https://github.com/akoksal/Turkish-Word2Vec).
Table 10 shows the percentage of each category of energy-consuming activities for both cities. In general, we observe that few social media posts are classified to dwelling. Our rule-based classification approach demands evidence for the user being at home before it classifies a post to dwelling. It is very difficult to derive this evidence from the social media post because rarely people check-in at their own home.
For both Amsterdam and Istanbul, the leisure category has the largest share (approximately 40%) compared to the other categories. The mobility category has the second largest share (approximately 30%). The category of food consumption has a rather small share (approximately 20%). However, nearly all social media posts that are classified to food consumption are also classified to leisure based on the rule-based approach—a food consumption activity that is performed at some other place than home is also considered a leisure activity. This explains why the share of the leisure category is more than twice as large as the share of the food consumption category.
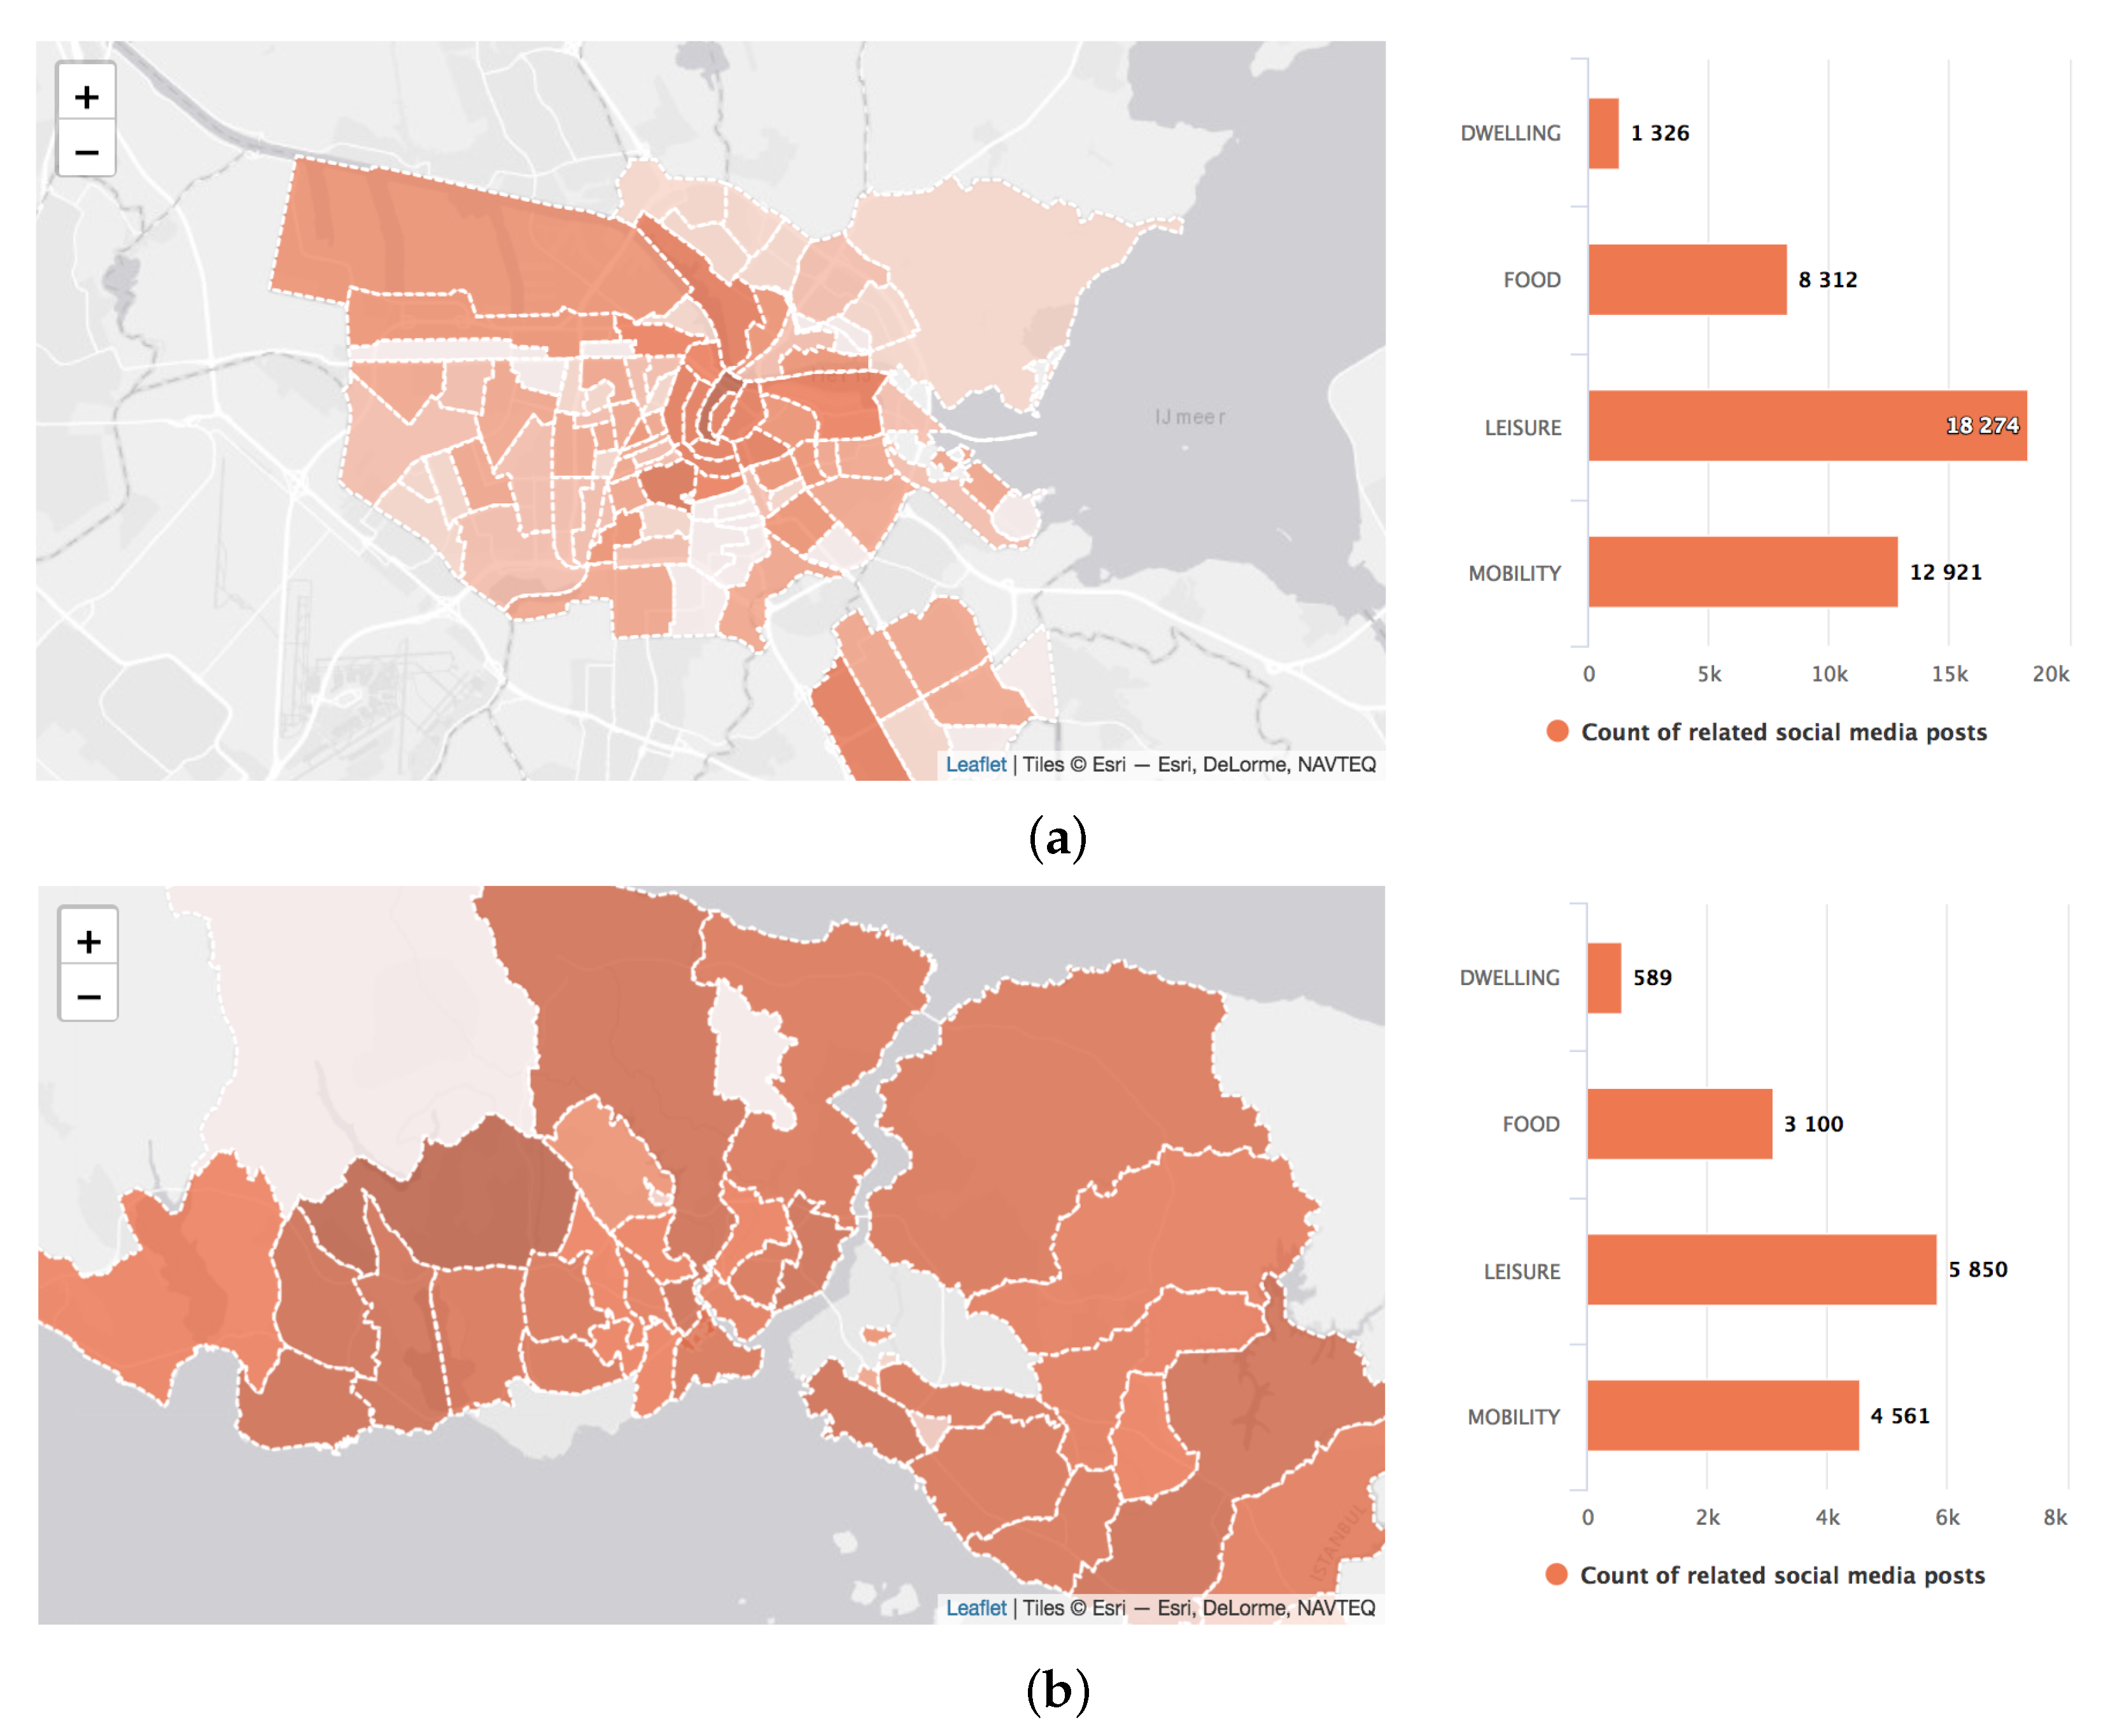
The distribution of social media posts classified to energy-consuming activities cities differs between them. For Amsterdam (Figure 8a), most social media posts are created around the city center—the neighborhood with the highest density (Burgwallen-Nieuwe Zijde) also include the city center. For Istanbul (Figure 8b), multiple neighborhoods share a high amount of energy-consuming activities; Başakşehir and Beşiktaş on the European part of the city and Kadıköy on the Asian part.
3.3.1. Dwelling
For both cities, few social media posts are classified to dwelling. For Amsterdam (Figure 9a), the posts in this category were mainly created in the city center while in Istanbul (Figure 9b), the posts are more evenly distributed with a higher concentration in the European part of the city (especially in the Başakşehir district).
As shown in Figure 10, the text terms that are most informative for a dwelling activity in Amsterdam are “House”, “TV”, and “gaming”. In images, “tv”, “laptop”, and “keyboard” are the most frequently recognized objects that indicate a dwelling activity for both cities. These seem to indicate either recreational or work activities.
There are no place terms related to this type of activity because houses do not have a category in the sources used in the data enrichment phase.
3.3.2. Food Consumption
As shown in Figure 9c, the city of Amsterdam shows the highest concentration of food energy-consuming activities in the city center. On the other hand, Istanbul, as shown in Figure 9d, shows peaks in the Beşiktaş district and in the northern neighborhoods.
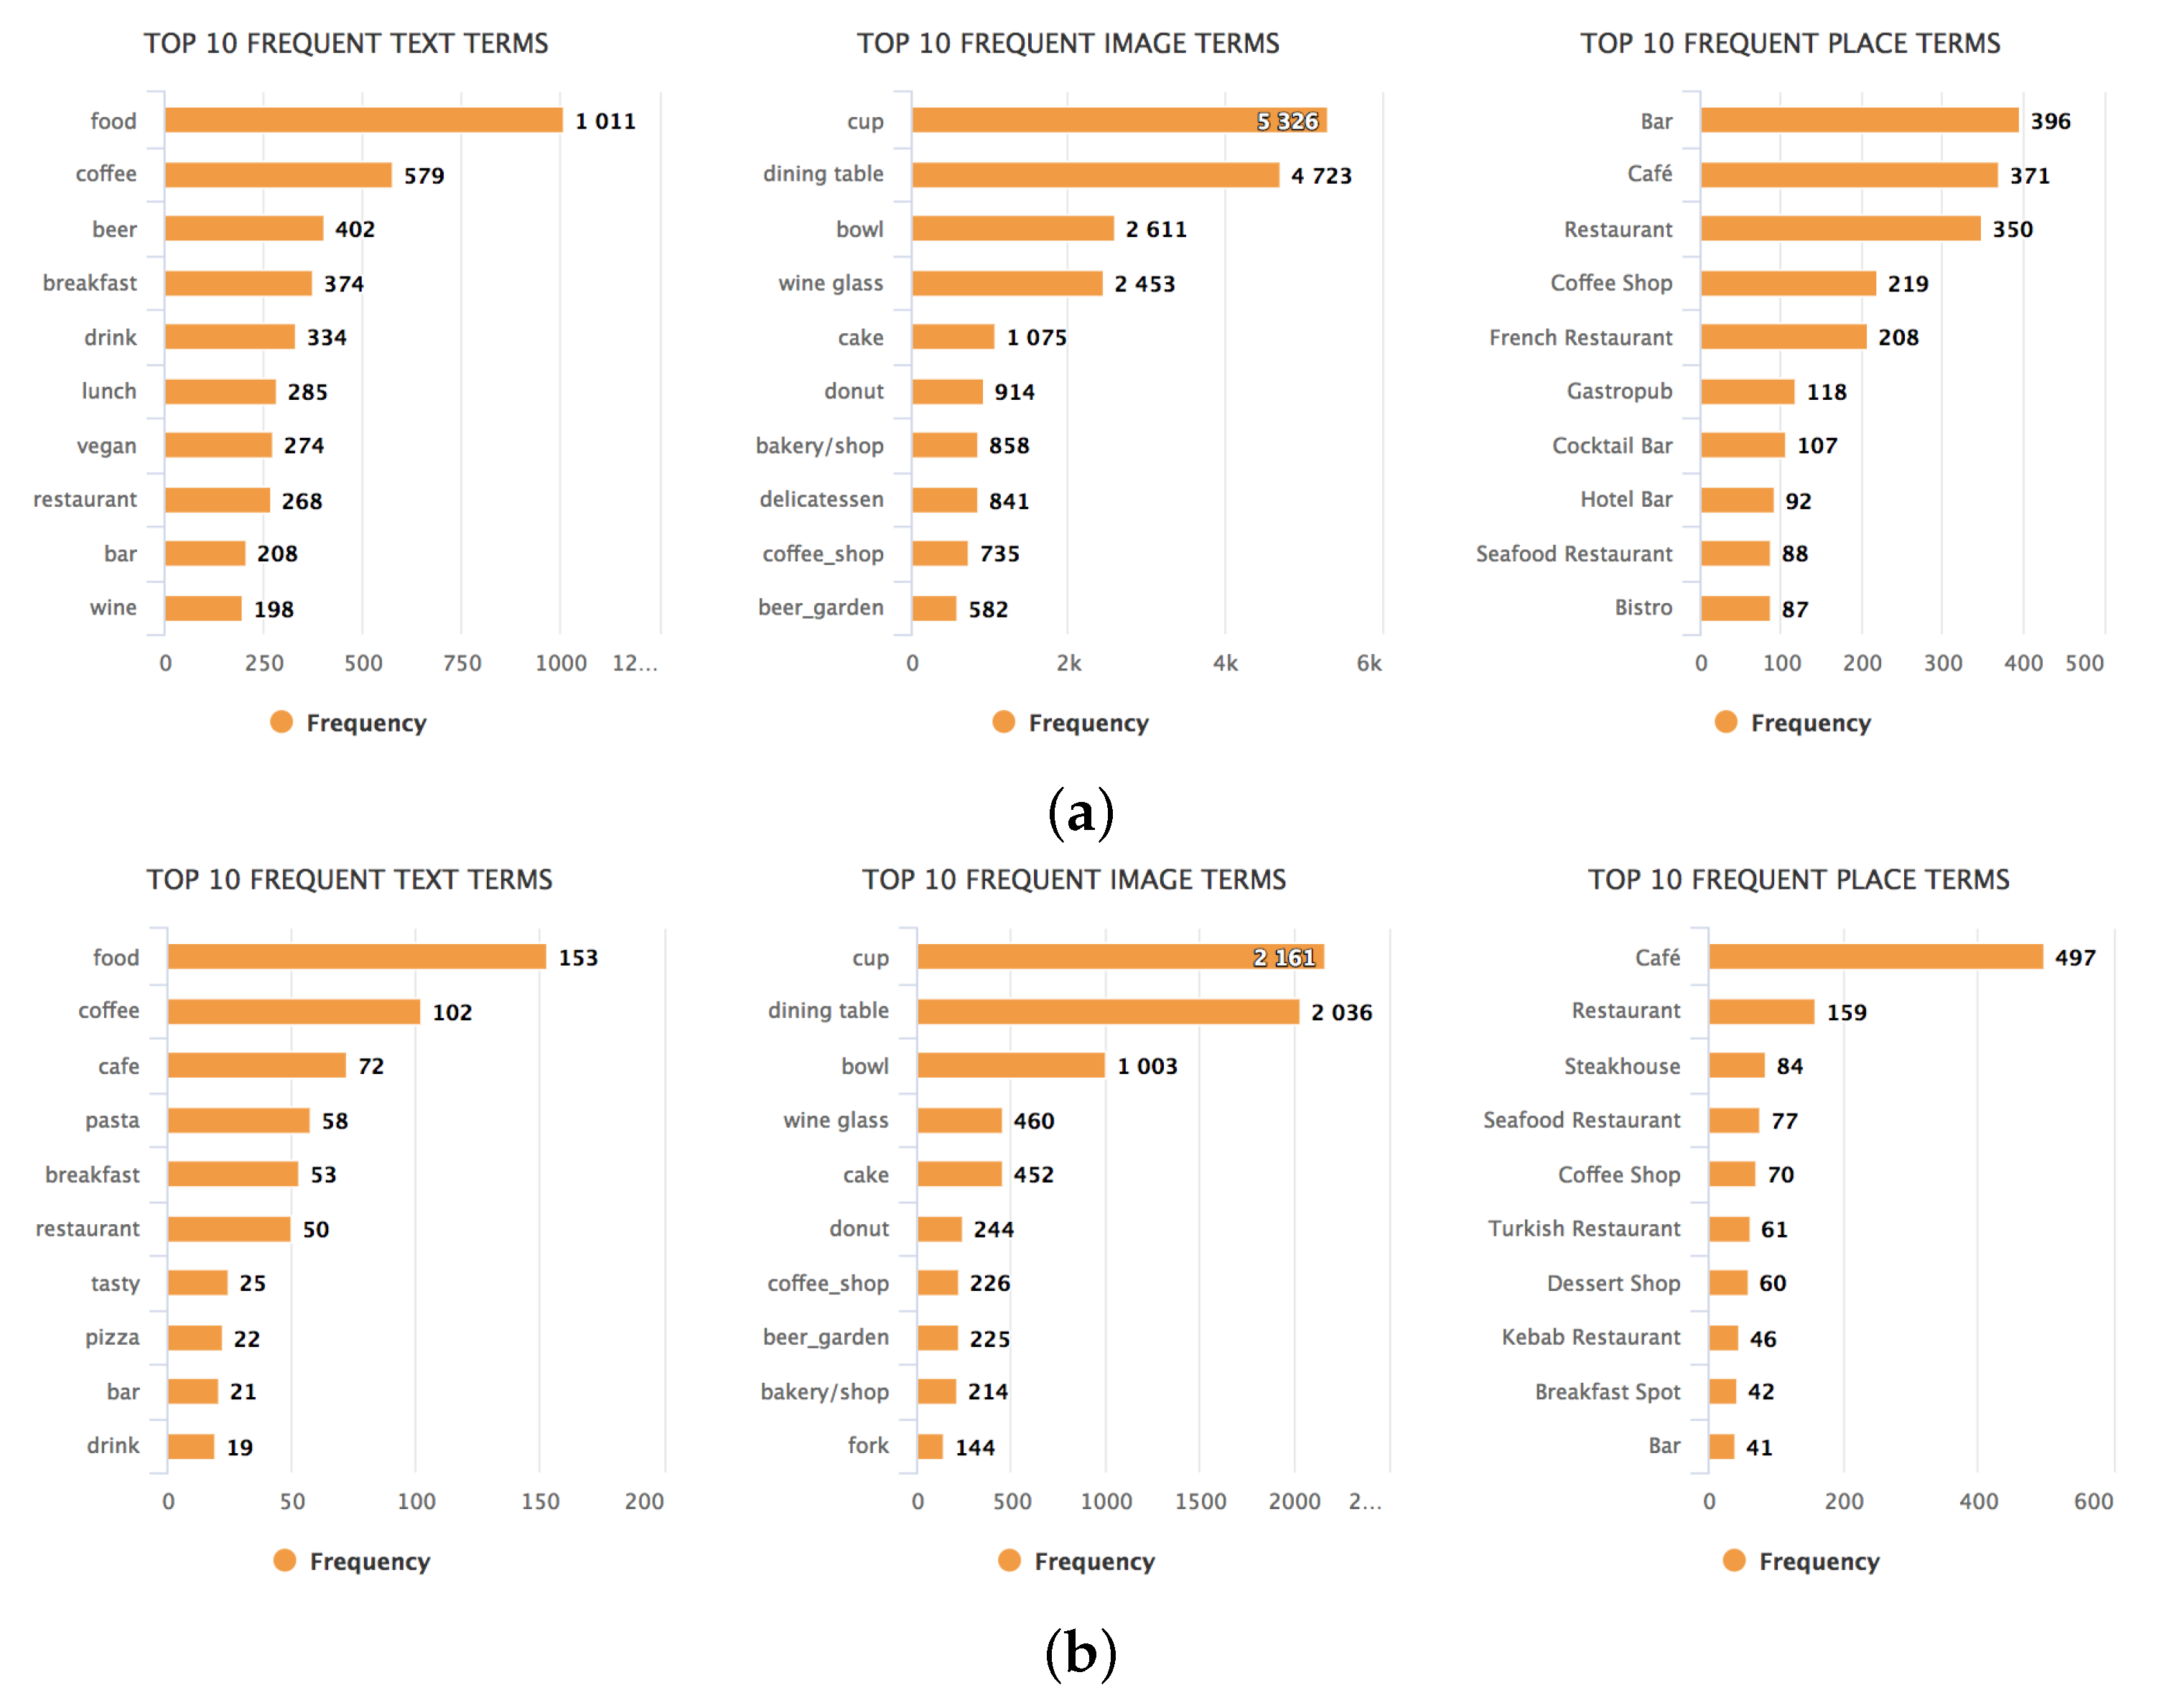
Based on the top frequent terms in Figure 11a,b, images seem to be most informative to identify food consumption activities. Furthermore, “food” and “coffee” were the top frequent text terms indicating a food consumption activity in both cities. Besides that, individuals appear to create food consumption-related post most often while checking in at a “Bar” (Amsterdam), “Cafe” (both cities) or “Restaurant” (both cities).
3.3.3. Leisure
In Figure 9e the distribution of social media posts in Amsterdam classified to leisure activities seems to be more distributed over the different neighborhoods. When zooming in on a few neighborhoods (Burgwallen-Nieuwe Zijde, Museumkwartier, and Amstel III/Bullewijk) some interesting observations are made.
In general, the city center (Burgwallen-Nieuwe Zijde) is characterized by many tourists, who are partying, visiting the flower markets, going to museums, or enjoying the canals, among other things. This is reflected in the top frequent text terms: “night”, “holiday”, “party” (text), “Flower Shop”, “Art Museum”, and “Hotel” (place) are some terms that comply with these activities.
Museumkwartier is the neighborhood where many of Amsterdam’s most famous museums are situated. In fact, we find that the top occurring terms are related to these museums: “museum” (text), “art_gallery” and “museum/indoor” (image), and “Art Museum” (place).
Amstel III/Bullewijk is known for Amsterdam’s soccer stadium and the major concert halls. As expected, the top occurring terms are: “concert” and “music” (text), “arena/performance” and “stage/indoor” (image), and “Concert Hall” and “Soccer Stadium” (place).
The distribution of the leisure-related social media posts over Istanbul’s neighborhoods (Figure 9f) is rather similar to the food consumption-related one: most dense in the center and west of it (the Başakşehir district, where also the stadium of the homonymous soccer team is present). Interestingly, as shown in Figure 12, it seems that in Istanbul the majority of leisure activities take place in shopping malls.
3.3.4. Mobility
Since Amsterdam’s train station is situated in the city center, it makes sense that this neighborhood is most dense regarding the count of social media posts classified to mobility (Figure 9g). This is also due to the canal trips in the city center that individuals (mainly tourists) tend to post about.
In Figure 9h two of the western neighborhoods (Başakşehir and Eyüp) are the densest regarding mobility activities. Multiple highways run through these neighborhoods (and particularly Eyüp connects the Black Sea to the Golden Horn) as well as a large highway junction. If we look at the terms (Figure 13), we can notice that in Istanbul are present more term related to transportation by car (e.g., Gas Station, Car Wash, parking_lot, car, etc.).
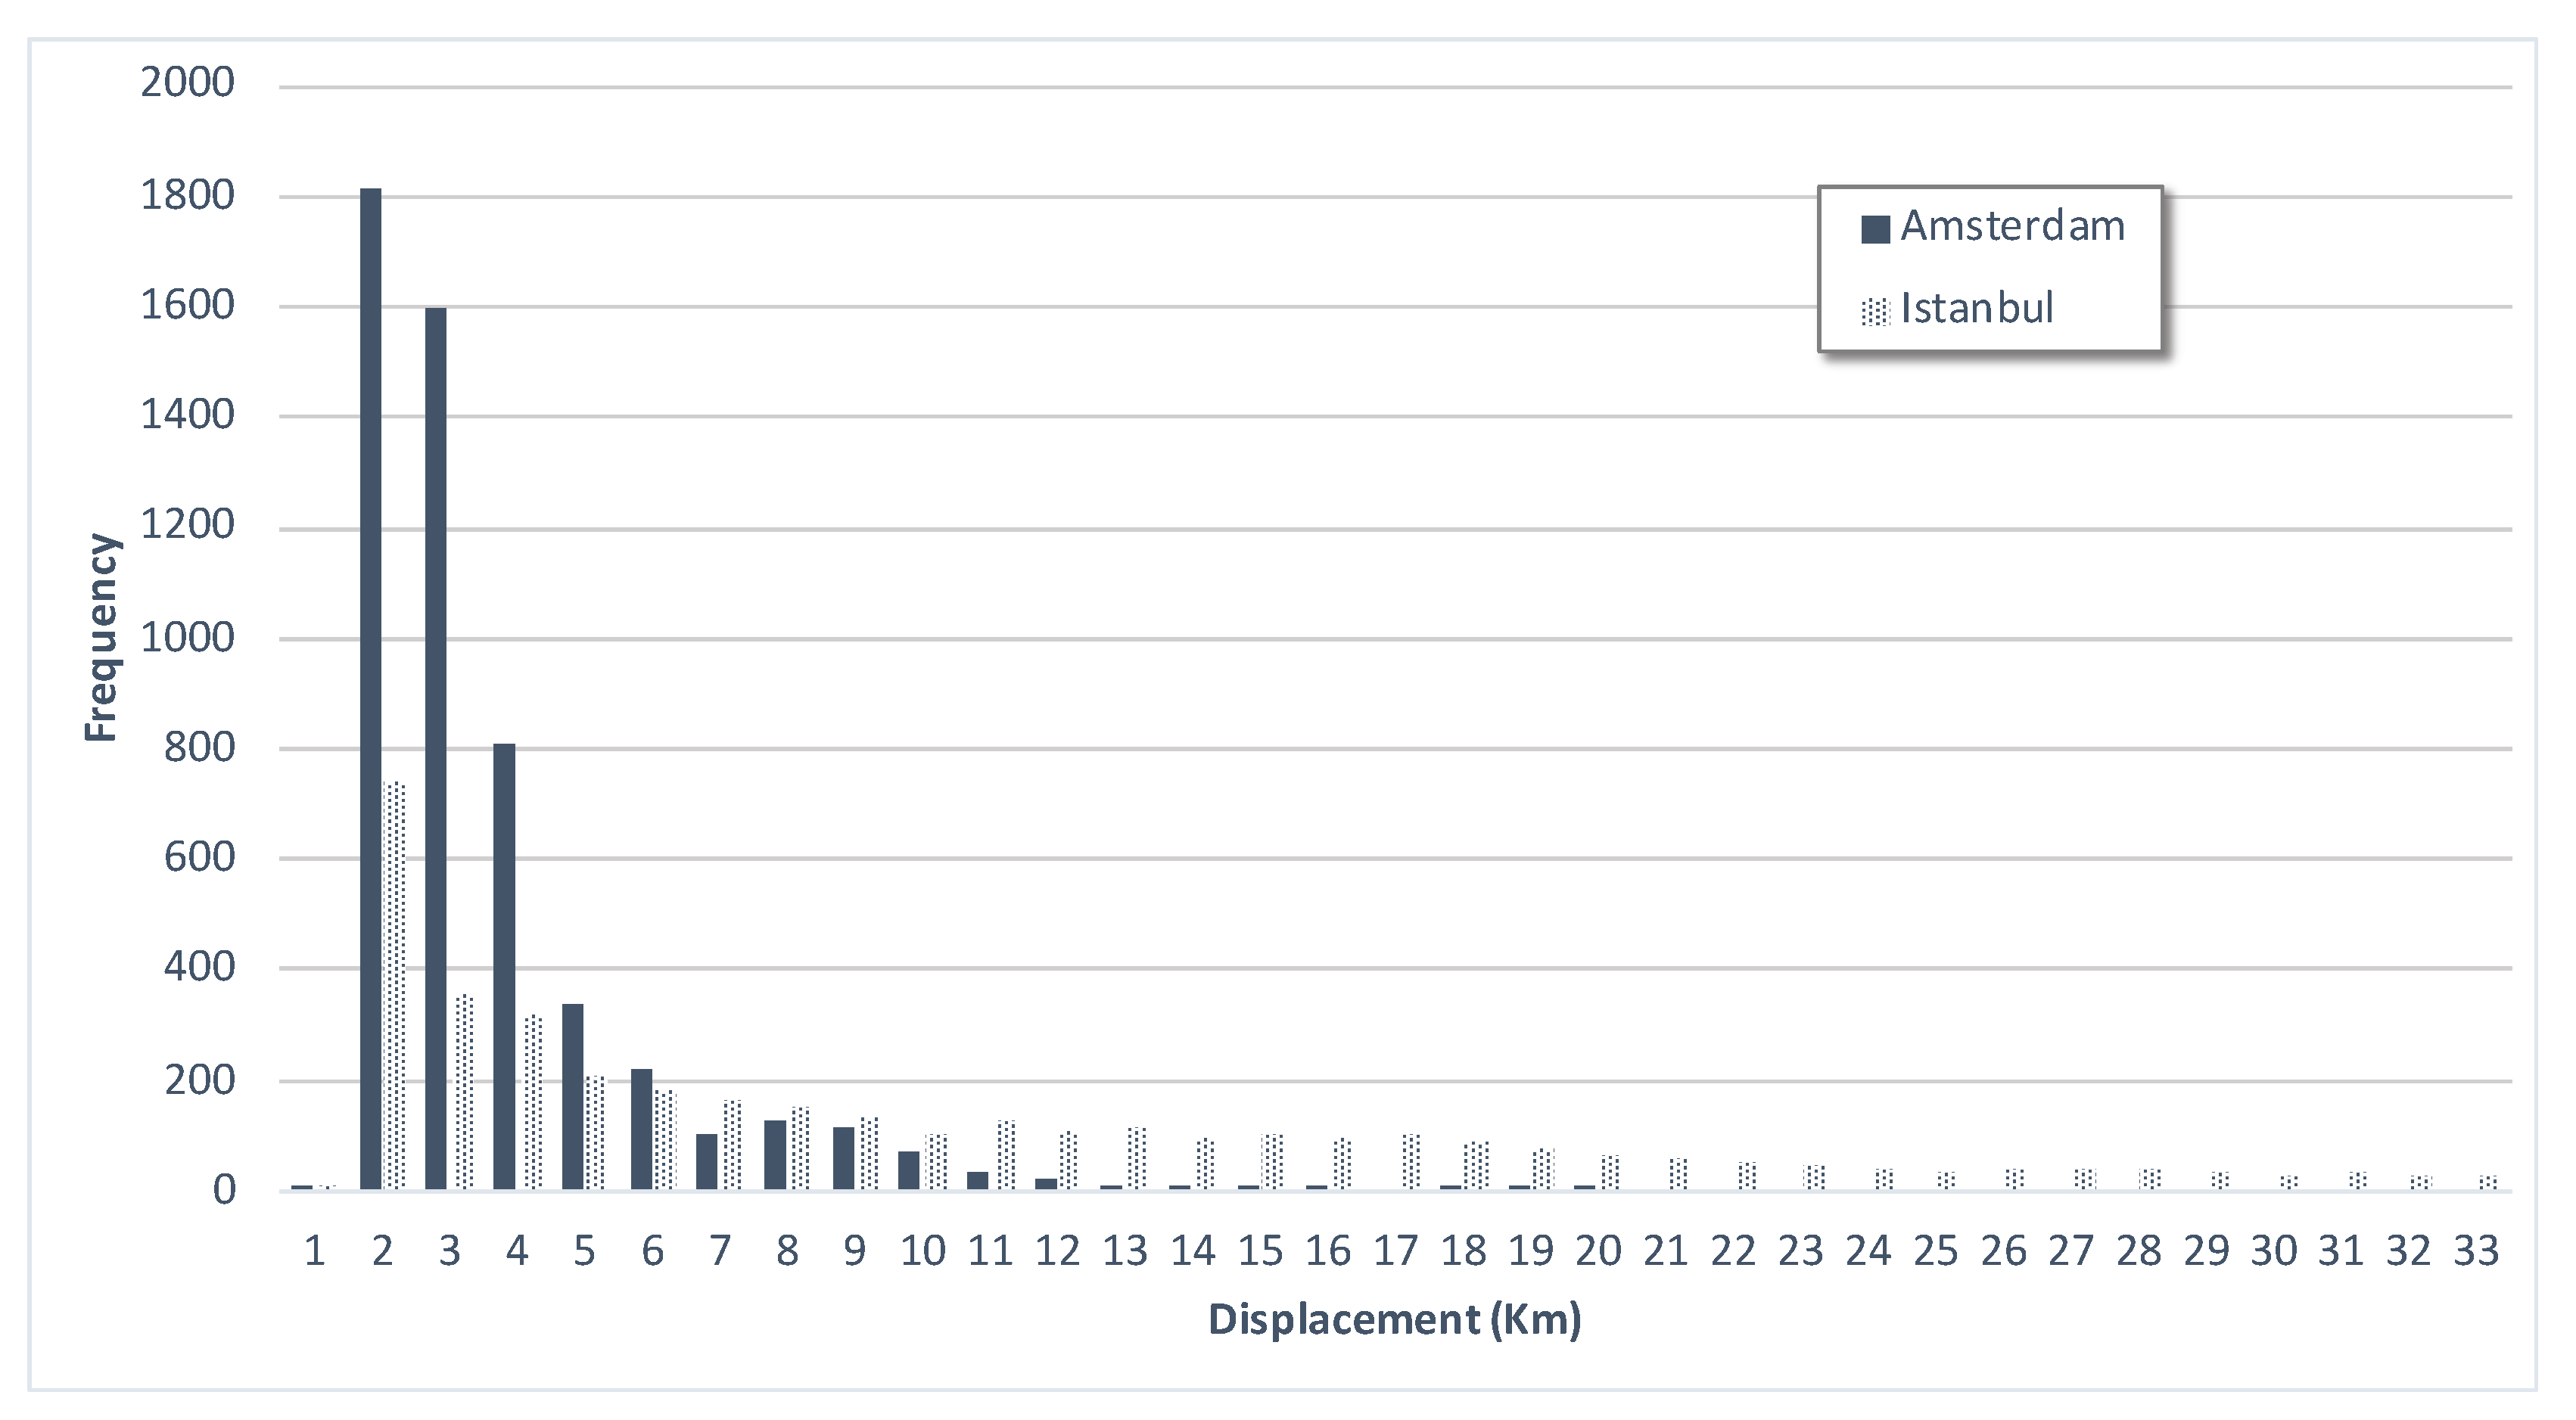
If we compare the frequencies of displacements of both cities (Figure 14) we can observe that while in Amsterdam people tend to travel for short distances (between 1 and 5 km), in Istanbul the chart shows a long tail distribution. Since Istanbul is significantly larger in size than Amsterdam, this is in line with our expectations.
3.3.5. Discussion
In both cities, few social media posts referring to dwelling activities were captured by the framework. This may be because social media users do not consider their regular domestic activities interesting enough to be shared with other social media users.
More posts related to food consumption were captured, but, by looking at the most occurring terms, they seem to occur out of home.
Then, as expected by the typical usage of social media, we detected many posts related to leisure energy-consuming activities. Moreover, they seem to reflect the types of venue present in a particular district, for instance, in the Museumkwartier neighborhood in Amsterdam, we identified many social media posts referring to museums and art.
Finally, people do not create explicit social media content about their mobility activities. When they are traveling, they are more likely to create content about the activities they performed before. However, we can use the distance between posts to detect if a transportation activity occurred.
Even if the two cities present the same ratio of energy-consuming activities, they show a different geographical distribution; while in Amsterdam the activities are localized near the city center and in Amstel III/Bullewijk (where the soccer stadium and the major concert halls are present), in Istanbul the activities are distributed in different neighborhoods, mainly Başakşehir, Beşiktaş, and Kadıköy. Probably, this is due to the different features of the two cities: Amsterdam has a well-defined center, where the main venues are localized; while in Istanbul, also given the different size, have them scattered in various parts of the city.
By looking at the most occurring terms, we notice a small difference between the characterization of the energy-consuming activities in the two cities. In the food category, we can see place categories more related to the Turkish cuisine (e.g., Turkish restaurant and kebab restaurant), and many leisure activities in Istanbul seems to take place in shopping malls. Finally, for the mobility category, in Istanbul, we notice a higher occurrence of terms related to transportation by car.
Summarizing, our pipeline can detect more activities that fall in the broad category of indirect energy-consuming activities, that are, as mentioned in Section 1, activities related to the production, transportation, and disposal of a variety of consumer goods and services [12]. As expected from the typical usage of social media, people post on social media when they are partying, having a fancy dinner out; more rarely they share their domestic activities. Nevertheless, this should not be seen as a flaw of our approach, but it should suggest that indeed social media can be used as a complementary source of information regarding energy-consuming activities. In fact, domestic activities are already partially captured by traditional data sources, while the indirect ones are either neglected [11] or the methods used for collecting them have low temporal resolution and are costly (e.g., surveys).
Moreover, our coverage of activity types can be improved by including additional data sources, for instance, the Steam (https://steamcommunity.com/) community for games or the Spotify (https://www.spotify.com/nl/) music stream provider, are more likely to be used for sharing data on dwelling activities, such as gaming or playing music.
3.3.6. Limitations
We acknowledge our approach is not free from limitations. Social media are inherently biased: they are used by only a set of the population (e.g., youths, tourists, etc.) and for purposes different from sharing energy-consuming activities. Moreover, the information shared on social media it is often ambiguous and noisy (e.g., a picture of a tram does not mean that the user is traveling). The issue of ambiguity and noise is partially mitigated by our rule-based approach, which shows promising performance. However, the goal of this work is to investigate to what extent social media can be used as a complementary source of information for energy-consuming activities. A study of demographic representation is left to future work. Language can be an issue when applying our method in areas where English is not the native language. However, this is addressed with multi-language dictionaries and by the use of embeddings trained on the main language spoken in the considered area (e.g., Dutch for Amsterdam). In addition, this issue only concerns the analysis of the text of the social media post, and not the image or the location.
4. Conclusions
In this paper, we proposed a framework to automatically identify and describe energy-consuming activities from social media posts. This framework is composed by an ontology that provides a better understanding of the domain of energy-consuming activities and a data processing pipeline that classify social media posts to the different categories.
Future works will focus on the improvement of the enrichment module of the framework. For instance, entity extraction can be employed to understand whether a word refers to a place (instead of only taking the place check-in into account) to increase the number of geolocated posts processed by the pipeline.
Moreover, our rule-based approach could be used to generate large training sets for a classifier in a distant-supervision fashion.
As mentioned in the previous section, other data sources will be investigated to increase the coverage of types of energy-consuming activity, with a focus on dwelling.
A further validation will be performed by looking at correspondence with more traditional sources (e.g., surveys, smart meter data etc.).
We will also investigate methods to link the information extracted from the social media post to concrete values of energy consumption (in terms of e.g., kWh or CO2 emissions).
Author Contributions
R.d.K. carried out the design of the framework, the evaluation, and the writing. A.M. helped with the design and contributed to the writing of the article. A.B. supervised all the steps of this work and revised the text.
Funding
This work is partially funded by the JPI Urban Europe Project CODALoop (Project no. 646453).
Acknowledgments
This work is supported the Amsterdam Institute for Advanced Metropolitan Solutions (AMS Institute) and it was carried out on the Dutch national e-infrastructure with the support of SURF Cooperative.
Conflicts of Interest
The authors declare no conflict of interest
Appendix A. Ontology Requirements

Table A1.
Competency Questions that form the set of functional requirements for the SSMO ontology.
| # | Competency Question (CQ) |
|---|---|
| 1 | Does the individual perform an energy-consuming activity? |
| 2 | If so, what type (or category) of energy-consuming activity is performed by the individual? |
| 3 | At what place is the activity performed by the individual?
|
| 4 | At what time is the activity performed by the individual? |
| 5 | What is the duration of the activity? |
| 6 | Does the individual use an object to perform this activity?
|
| 7 | In case a mobility activity is performed, what kind of mode of transport is used?
|
| 8 | In case a leisure activity is performed, what kind of artifact(s) is (are) used?
|
| 9 | In case a dwelling activity is performed, what kind of appliance(s) is (are) used?
|
| 10 | In case of a food consumption activity, what kind of food is consumed?
|
| 11 | How many energy-consuming activities are performed at a certain (aggregation of) place(s) during a certain time span? |
Appendix B. User Online Survey
Figure A1.
Example of question for tuning the weights (a) and creating the groundtruth (b).

References
- Fraternali, P.; Herrera, S.; Novak, J.; Melenhorst, M.; Tzovaras, D.; Krinidis, S.; Rizzoli, A.E.; Rottondi, C.; Cellina, F. enCOMPASS—An integrative approach to behavioural change for energy saving. In Proceedings of the Global Internet of Things Summit (GIoTS), Geneva, Switzerland, 6–9 June 2017; pp. 1–6. [Google Scholar]
- Fischer, C. Feedback on household electricity consumption: A tool for saving energy? Energy Effic. 2008, 1, 79–104. [Google Scholar] [CrossRef]
- Kamilaris, A.; Pitsillides, A.; Fidas, C. Social Electricity: A case study on users perceptions in using green ICT social applications. Int. J. Environ. Sustain. Dev. 2016, 15, 67–88. [Google Scholar] [CrossRef]
- Albertarelli, S.; Fraternali, P.; Herrera, S.; Melenhorst, M.; Novak, J.; Pasini, C.; Andrea-Emilio, A.E.; Rottondi, C. A Survey on the Design of Gamified Systems for Energy and Water Sustainability. Games 2018, 9, 38. [Google Scholar] [CrossRef]
- Froehlich, J.; Larson, E.; Gupta, S.; Cohn, G.; Reynolds, M.; Patel, S. Disaggregated end-use energy sensing for the smart grid. IEEE Pervasive Comput. 2011, 10, 28–39. [Google Scholar] [CrossRef]
- Parsa, A.; Najafabadi, T.A.; Salmasi, F.R. Implementation of smart optimal and automatic control of electrical home appliances (IoT). In Proceedings of the Smart Grid Conference (SGC), Tehran, Iran, 20–21 December 2017; pp. 1–6. [Google Scholar]
- Weiss, M.; Helfenstein, A.; Mattern, F.; Staake, T. Leveraging smart meter data to recognize home appliances. In Proceedings of the 2012 IEEE International Conference on Pervasive Computing and Communications (PerCom), Lugano, Switzerland, 19–23 March 2012; pp. 190–197. [Google Scholar]
- Bleys, B.; Defloor, B.; Van Ootegem, L.; Verhofstadt, E. The Environmental Impact of Individual Behavior: Self-Assessment Versus the Ecological Footprint. Environ. Behav. 2017, 50, 187–212. [Google Scholar] [CrossRef]
- Torriti, J. Understanding the timing of energy demand through time use data: Time of the day dependence of social practices. Energy Res. Soc. Sci. 2017, 25, 37–47. [Google Scholar] [CrossRef]
- Vassileva, I.; Wallin, F.; Dahlquist, E. Understanding energy consumption behavior for future demand response strategy development. Energy 2012, 46, 94–100. [Google Scholar] [CrossRef]
- Burger, P.; Bezençon, V.; Bornemann, B.; Brosch, T.; Carabias-Hütter, V.; Farsi, M.; Hille, S.L.; Moser, C.; Ramseier, C.; Samuel, R.; et al. Advances in understanding energy consumption behavior and the governance of its change–outline of an integrated framework. Front. Energy Res. 2015, 3, 29. [Google Scholar] [CrossRef]
- Abrahamse, W.; Steg, L.; Vlek, C.; Rothengatter, T. The effect of tailored information, goal setting, and tailored feedback on household energy use, energy-related behaviors, and behavioral antecedents. J. Environ. Psychol. 2007, 27, 265–276. [Google Scholar] [CrossRef]
- Beber, M.A.; Ferrero, C.A.; Fileto, R.; Bogorny, V. Individual and Group Activity Recognition in Moving Object Trajectories. J. Inf. Data Manag. 2017, 8, 50. [Google Scholar]
- Zhu, Z.; Blanke, U.; Tröster, G. Recognizing composite daily activities from crowd-labelled social media data. Pervasive Mob. Comput. 2016, 26, 103–120. [Google Scholar] [CrossRef]
- Bodnar, T.; Dering, M.L.; Tucker, C.; Hopkinson, K.M. Using large-scale social media networks as a scalable sensing system for modeling real-time energy use patterns. IEEE Trans. Syst. Man Cybern. Syst. 2017, 47, 2627–2640. [Google Scholar] [CrossRef]
- Rashidi, T.H.; Abbasi, A.; Maghrebi, M.; Hasan, S.; Waller, T.S. Exploring the capacity of social media data for modelling travel behaviour: Opportunities and challenges. Transp. Res. Part C Emerg. Technol. 2017, 75, 197–211. [Google Scholar] [CrossRef]
- Zhang, Z.; He, Q.; Zhu, S. Potentials of using social media to infer the longitudinal travel behavior: A sequential model-based clustering method. Transp. Res. Part C Emerg. Technol. 2017, 85, 396–414. [Google Scholar] [CrossRef]
- Psyllidis, A.; Bozzon, A.; Bocconi, S.; Bolivar, C.T. A Platform for Urban Analytics and Semantic Data Integration in City Planning. In Proceedings of the 16th International International Conference on Computer-Aided Architectural Design Futures, Sao Paulo, Brazil, 8–10 July 2015; pp. 21–36. [Google Scholar]
- Abbar, S.; Mejova, Y.; Weber, I. You tweet what you eat: Studying food consumption through twitter. In Proceedings of the 33rd Annual ACM Conference on Human Factors in Computing Systems, Seoul, Korea, 18–23 April 2015; pp. 3197–3206. [Google Scholar]
- Akbari Fard, M.; Hadadi, H.; Tavakoli Targhi, A. Fruits and vegetables calorie counter using convolutional neural networks. In Proceedings of the 6th International Conference on Digital Health Conference, Montréal, QC, Canada, 11–13 April 2016; pp. 121–122. [Google Scholar]
- Fried, D.; Surdeanu, M.; Kobourov, S.; Hingle, M.; Bell, D. Analyzing the language of food on social media. In Proceedings of the 2014 IEEE International Conference on Big Data (Big Data), Washington, DC, USA, 27–30 October 2014; pp. 778–783. [Google Scholar]
- Backhaus, J.; Breukers, S.; Paukovic, M.; Mourik, R.; Mont, O. Sustainable Lifestyles. Today’s Facts and Tomorrow’s Trends. D1. 1 Sustainable Lifestyles Baseline Report; ECN Policy Studies, Energy research Centre of the Netherlands ECN: Amsterdam, The Netherlands, 2012. [Google Scholar]
- Guinée, J.; Heijungs, R.; De Koning, A.; Van, L.; Geerken, T.; Van Holderbeke, M.; Vito, B.J.; Eder, P.; Delgado, L. Environmental Impact of Products (EIPRO) Analysis of the Life Cycle Environmental Impacts Related to the Final Consumption of the EU25. Available online: http://hdl.handle.net/1887/11434 (accessed on 20 December 2018).
- Mont, O. Concept Paper for the Task Force on Sustainable Lifestyles. In Proceedings of the Expert Meeting on Sustainable Consumption and Production (Technical Report), Stockholm, Sweden, 26–29 June 2007; pp. 1–14. [Google Scholar]
- Chandrasekaran, B.; Josephson, J.R.; Benjamins, V.R. What are ontologies, and why do we need them? IEEE Intell. Syst. Appl. 1999, 14, 20–26. [Google Scholar] [CrossRef]
- Fernández-López, M.; Gómez-Pérez, A.; Juristo, N. Methontology: From ontological art towards ontological engineering. In Proceedings of the Ontological Engineering AAAI-97 Spring Symposium Series, Stanford, CA, USA, 24–26 March 1997. [Google Scholar]
- Suárez-Figueroa, M.C.; Gómez-Pérez, A.; Villazón-Terrazas, B. How to write and use the ontology requirements specification document. In OTM Confederated International Conferences “On the Move to Meaningful Internet Systems”; Springer: Berlin/Heidelberg, Germany, 2009; pp. 966–982. [Google Scholar]
- Bonino, D.; Corno, F.; De Russis, L. Poweront: An ontology-based approach for power consumption estimation in smart homes. In Internet of Things. User-Centric IoT; Springer: Cham, Switzerland, 2015; pp. 3–8. [Google Scholar]
- Breslin, J.G.; Harth, A.; Bojars, U.; Decker, S. Towards semantically interlinked online communities. In European Semantic Web Conference; Springer: Berlin/Heidelberg, Germany, 2005; pp. 500–514. [Google Scholar]
- Golbeck, J.; Rothstein, M. Linking Social Networks on the Web with FOAF: A Semantic Web Case Study; AAAI: Menlo Park, CA, USA, 2008; Volume 8, pp. 1138–1143. [Google Scholar]
- Niles, I.; Pease, A. Towards a standard upper ontology. In Proceedings of the International Conference on Formal Ontology in Information Systems-Volume 2001, Ogunquit, ME, USA, 17–19 October 2001; pp. 2–9. [Google Scholar]
- Madrazo, L.; Sicilia, A.; Gamboa, G. SEMANCO: Semantic tools for carbon reduction in urban planning. In Proceedings of the 9th European Conference on Product and Process Modelling, Reykjavik, Iceland, 23 July 2012. [Google Scholar]
- Burel, G.; Piccolo, L.S.; Alani, H. Energyuse-a collective semantic platform for monitoring and discussing energy consumption. In International Semantic Web Conference; Springer: Cham, Switzerland, 2016; pp. 257–272. [Google Scholar]
- Bonino, D.; Corno, F. Dogont-ontology modeling for intelligent domotic environments. In International Semantic Web Conference; Springer: Berlin/Heidelberg, Germany, 2008; pp. 790–803. [Google Scholar]
- BBC Food Ontology. Available online: https://www.bbc.co.uk/ontologies/fo (accessed on 23 October 2018).
- Travel Ontology. Available online: http://www.cs.man.ac.uk/~stevensr/ontology/c23.owl (accessed on 23 October 2018).
- Bechhofer, S. OWL: Web ontology language. In Encyclopedia of Database Systems; Springer: New York, NY, USA, 2009; pp. 2008–2009. [Google Scholar]
- Lesk, M. Automatic sense disambiguation using machine readable dictionaries: How to tell a pine cone from an ice cream cone. In Proceedings of the 5th Annual International Conference on Systems Documentation, Toronto, ON, Canada, 8–11 June 1986; pp. 24–26. [Google Scholar]
- Banerjee, S.; Pedersen, T. An adapted Lesk algorithm for word sense disambiguation using WordNet. In International Conference on Intelligent Text Processing and Computational Linguistics; Springer: Berlin/Heidelberg, Germany, 2002; pp. 136–145. [Google Scholar]
- He, K.; Gkioxari, G.; Dollár, P.; Girshick, R. Mask r-cnn. In Proceedings of the 2017 IEEE International Conference on Computer Vision (ICCV), Venice, Italy, 22–29 October 2017; pp. 2980–2988. [Google Scholar]
- McKenzie, G.; Janowicz, K.; Adams, B. A weighted multi-attribute method for matching user-generated points of interest. Cartogr. Geogr. Inf. Sci. 2014, 41, 125–137. [Google Scholar] [CrossRef]
- Jiang, S.; Alves, A.; Rodrigues, F.; Ferreira, J., Jr.; Pereira, F.C. Mining point-of-interest data from social networks for urban land use classification and disaggregation. Comput. Environ. Urban Syst. 2015, 53, 36–46. [Google Scholar] [CrossRef]
- Ester, M.; Kriegel, H.P.; Sander, J.; Xu, X. A density-based algorithm for discovering clusters in large spatial databases with noise. Kdd 1996, 96, 226–231. [Google Scholar]
- Mauri, A.; Psyllidis, A.; Bozzon, A. Social Smart Meter: Identifying Energy Consumption Behavior in User-Generated Content. In Proceedings of the Companion of the The Web Conference 2018 on The Web Conference 2018. International World Wide Web Conferences Steering Committee, Lyon, France, 23–27 April 2018; pp. 195–198. [Google Scholar]
- Mikolov, T.; Sutskever, I.; Chen, K.; Corrado, G.S.; Dean, J. Distributed representations of words and phrases and their compositionality. In Advances in Neural Information Processing Systems; MIT Press Ltd.: Cambridge, MA, USA, 2013; pp. 3111–3119. [Google Scholar]
- Mauri, A.; Calbimonte, J.P.; Dell’Aglio, D.; Balduini, M.; Brambilla, M.; Della Valle, E.; Aberer, K. TripleWave: Spreading RDF Streams on the Web. In The Semantic Web—ISWC 2016; Groth, P., Simperl, E., Gray, A., Sabou, M., Krötzsch, M., Lecue, F., Flöck, F., Gil, Y., Eds.; Springer International Publishing: Cham, Switzerland, 2016; pp. 140–149. [Google Scholar]
- Tulkens, S.; Emmery, C.; Daelemans, W. Evaluating Unsupervised Dutch Word Embeddings as a Linguistic Resource. In Proceedings of the Tenth International Conference on Language Resources and Evaluation (LREC 2016); Chair, N.C.C., Choukri, K., Declerck, T., Grobelnik, M., Maegaard, B., Mariani, J., Moreno, A., Odijk, J., Piperidis, S., Eds.; European Language Resources Association (ELRA): Paris, France, 2016. [Google Scholar]
Figure 1.
Example of social media post on Instagram.

Figure 2.
Conceptual data model of energy-consuming activities.

Figure 3.
Conceptualization of social media activity.

Figure 4.
Overview of the data processing pipeline.

Figure 5.
Differences in computer vision techniques applied to the same images; (a) uses an object recognition method that person, dining table, cup (2x), knife (2x), bowl (5x), while (b) uses a scene recognition one extracting dining hall, cafeteria, and delicatessen annotations.
Figure 5.
Differences in computer vision techniques applied to the same images; (a) uses an object recognition method that person, dining table, cup (2x), knife (2x), bowl (5x), while (b) uses a scene recognition one extracting dining hall, cafeteria, and delicatessen annotations.

Figure 6.
Illustration of the rule-based approach.

Figure 7.
Evaluation metrics.

Figure 8.
Overall distribution of energy-consuming activities of Amsterdam (a) and Istanbul (b).

Figure 9.
Map visualizing the distribution of social media posts; (a,b) refer to dwelling, (c,d) refer to food consumption, (e,f) refer to leisure and (g,h) refer to mobility.
Figure 9.
Map visualizing the distribution of social media posts; (a,b) refer to dwelling, (c,d) refer to food consumption, (e,f) refer to leisure and (g,h) refer to mobility.

Figure 10.
Bar charts visualizing the most occurring terms in social media posts classified to dwelling activities in Amsterdam (a) and Istanbul (b). For readability purposes, in the figures we show only English terms.
Figure 10.
Bar charts visualizing the most occurring terms in social media posts classified to dwelling activities in Amsterdam (a) and Istanbul (b). For readability purposes, in the figures we show only English terms.

Figure 11.
Bar charts visualizing the most occurring terms in social media posts classified to food consumption activities in Amsterdam (a) and Istanbul (b). For readability purposes, in the figures we show only English terms.
Figure 11.
Bar charts visualizing the most occurring terms in social media posts classified to food consumption activities in Amsterdam (a) and Istanbul (b). For readability purposes, in the figures we show only English terms.

Figure 12.
Bar charts visualizing the most occurring terms in social media posts classified to leisure activities in Amsterdam (a) and Istanbul (b). For readability purposes, in the figures we show only English terms.
Figure 12.
Bar charts visualizing the most occurring terms in social media posts classified to leisure activities in Amsterdam (a) and Istanbul (b). For readability purposes, in the figures we show only English terms.


Figure 13.
Bar charts visualizing the most occurring term in social media posts classified to mobility activities in Amsterdam (a) and Istanbul (b). For readability purposes, in the figures we show only English terms.
Figure 13.
Bar charts visualizing the most occurring term in social media posts classified to mobility activities in Amsterdam (a) and Istanbul (b). For readability purposes, in the figures we show only English terms.

Figure 14.
Bar chart visualizing the frequency of displacements (average distance between posts in kilometers) in Amsterdam and Istanbul.
Figure 14.
Bar chart visualizing the frequency of displacements (average distance between posts in kilometers) in Amsterdam and Istanbul.

Table 1.
Overview of the current state-of-the-art related ontologies with a focus on the previously distinguished domains of energy-consuming activities (+: included; : covered to some extent; −: not included).
Table 1.
Overview of the current state-of-the-art related ontologies with a focus on the previously distinguished domains of energy-consuming activities (+: included; : covered to some extent; −: not included).
| SUMO [31] | SEMANCO [32] | EU [33] | FO [35] | TO [36] | |
|---|---|---|---|---|---|
| Energy activity | |||||
| - Energy units | + | + | + | − | − |
| - Consumption | + | + | − | − | |
| - Individual | + | + | + | + | − |
| Location | |||||
| - Location | + | + | + | − | + |
| - Path | + | − | − | − | + |
| Dwelling | |||||
| - Activity | + | + | − | − | − |
| - Appliance | + | + | + | − | − |
| Food consumption | |||||
| - Activity | − | − | + | − | |
| - Food | + | − | − | + | − |
| - Food chain | − | − | − | + | − |
| - Tableware | + | − | − | − | − |
| Leisure | |||||
| - Activity | + | + | − | − | + |
| - Artifact | + | − | − | − | |
| Mobility | |||||
| - Activity | + | + | − | − | − |
| - Mode of transport | + | − | − | − | + |
Table 2.
Overview of the entities in the SSMO ontology reused from existing ontologies.
| Ontology | Prefixed Class Name | |
|---|---|---|
| Energy activity | ||
| - Energy | SEMANCO | SEMANCO:Energy_Quantity_And_Emission |
| - Individual | SUMO; SEMANCO | SUMO:Human; SEMANCO:Household_Member |
| Location | ||
| - Place | SUMO | geo:SpatialThing |
| - Path | TO; SUMO | upper.owl#Pattern; SUMO:TransitRoute |
| Dwelling | ||
| - Activity | SUMO | SUMO:Cooking |
| - Appliance | EU | DogOnt:Appliances |
| Food consumption | ||
| - Activity | SUMO | SUMO:Cooking |
| - Food | FO | fo/Food |
| - Ingredient | FO | fo/Ingredient |
| - Modification | FO | fo/Technique |
| Leisure | ||
| - Artifact | SUMO | SUMO:Artifact |
| Mobility | ||
| - Activity | SUMO | SUMO:Motion |
| - Mode of transport | TO | travel.owl#ModeOfTransport |
| - Vehicle | SUMO; TO | SUMO:Vehicle; travel.owl#VehicleTransport |
| Social Media | ||
| - User account | FOAF | foaf:OnlineAccount |
| - Post | FOAF; SIOC | foaf:Document; ns1:Post |
| - Mention | SIOC | sioc:link |
| - Location | FOAF | foaf:based_near |
Table 3.
Overview of the new entities equivalent to reused entities in the SSMO ontology.
| Ontology | Prefixed Class Name | |
|---|---|---|
| Energy activity | ||
| - Energy | SEMANCO | ssmo:Energy ≡ SEMANCO:Energy_Quantity_And_Emission |
| - Individual | SUMO | ssmo:Individual ≡ SUMO:Human |
| Location | ||
| - Place | SUMO | ssmo:Place ≡ geo:SpatialThing |
| - Path | TO | ssmo:Path ≡ upper.owl#Pattern |
| Food consumption | ||
| - Modification | FO | ssmo:Modification ≡ fo/Technique |
| Mobility | ||
| - Mobility | SUMO | ssmo:MobilityActivity ≡ SUMO:Motion |
Table 4.
Overview of the new entities in the SSMO ontology.
| Ontology | Prefixed Class Name | |
|---|---|---|
| Location | ||
| - Location | SSMO | ssmo:Location |
| Dwelling | ||
| - Activity | SSMO | ssmo:DwellingActivity |
| Food consumption | ||
| - Activity | SSMO | ssmo:FoodConsumption |
| - Process | SSMO | ssmo:Process |
| - Tableware | SSMO | ssmo:Tableware |
| Leisure | ||
| - Activity | SSMO | ssmo:LeisureActivity |
| - Artifact | SSMO | ssmo:Artifact |
Table 5.
The weighted factors obtained by asking the user opinions.
| Data Type | Text | Image | Place | |
|---|---|---|---|---|
| Category | ||||
| Dwelling | 0.35 | 0.40 | 0.25 | |
| Food consumption | 0.33 | 0.37 | 0.30 | |
| Leisure | 0.35 | 0.32 | 0.33 | |
| Mobility | 0.37 | 0.33 | 0.30 | |
Table 6.
Number of collected social media posts per day.
| Date | Amsterdam | Istanbul | ||
|---|---|---|---|---|
| 22/06/2018 | 16,099 | 3602 | - | - |
| 23/06/2018 | 15,794 | 3220 | - | - |
| 24/06/2018 | 16,365 | 2594 | - | - |
| 25/06/2018 | 15,426 | 3024 | - | - |
| 26/06/2018 | 14,985 | 3685 | 19,887 | 4476 |
| 27/06/2018 | 16,966 | 1929 | 28,346 | 8931 |
| 27/07/2018 | 17,854 | 1684 | 22,127 | 4818 |
| 28/07/2018 | 17,779 | 3656 | 21,082 | 11,522 |
| Total | 131,268 | 23,394 | 91,442 | 29,747 |
Table 7.
Accuracy of the pipeline at different levels of threshold.
| Metric | Accuracy | ||||||
|---|---|---|---|---|---|---|---|
| Category | |||||||
| Threshold | 0.30 | 0.35 | 0.40 | 0.50 | 0.60 | 0.70 | |
| Dwelling | 0.85 | 0.87 | 0.89 | 0.90 | 0.90 | 0.91 | |
| Food consumption | 0.82 | 0.84 | 0.86 | 0.85 | 0.78 | 0.73 | |
| Leisure | 0.60 | 0.57 | 0.56 | 0.54 | 0.48 | 0.37 | |
| Mobility | 0.81 | 0.82 | 0.82 | 0.82 | 0.80 | 0.74 | |
| Total | 0.77 | 0.78 | 0.78 | 0.78 | 0.74 | 0.69 | |
Table 8.
Precision and recall values for each energy-consuming activities at varying values of threshold. The values of the precision and recall for the Dwelling category for threshold greater than 0.4 are 0 because no posts were classified in that category.
Table 8.
Precision and recall values for each energy-consuming activities at varying values of threshold. The values of the precision and recall for the Dwelling category for threshold greater than 0.4 are 0 because no posts were classified in that category.
| Precision | Recall | |||||||||||
|---|---|---|---|---|---|---|---|---|---|---|---|---|
| Threshold | 0.30 | 0.35 | 0.40 | 0.50 | 0.60 | 0.70 | 0.30 | 0.35 | 0.40 | 0.50 | 0.60 | 0.70 |
| Dwelling | 0.23 | 0.27 | 0.20 | 0.00 | 0.00 | 0.00 | 0.38 | 0.38 | 0.13 | 0.00 | 0.00 | 0.00 |
| Food | 0.68 | 0.79 | 0.95 | 0.95 | 0.92 | 1.00 | 0.81 | 0.69 | 0.59 | 0.56 | 0.34 | 0.16 |
| Leisure | 0.80 | 0.88 | 0.89 | 0.87 | 0.89 | 1.00 | 0.61 | 0.49 | 0.46 | 0.45 | 0.34 | 0.15 |
| Mobility | 0.63 | 1.00 | 1.00 | 1.00 | 1.00 | 1.00 | 0.74 | 0.33 | 0.33 | 0.33 | 0.26 | 0.04 |
| Overall | 0.59 | 0.73 | 0.76 | 0.70 | 0.70 | 0.75 | 0.63 | 0.47 | 0.38 | 0.34 | 0.24 | 0.09 |
Table 9.
The F1-score value for each energy-consuming activity category at varying level of threshold. The values for the Dwelling category for threshold greater than 0.4 are undefined because no posts were classified in that category.
Table 9.
The F1-score value for each energy-consuming activity category at varying level of threshold. The values for the Dwelling category for threshold greater than 0.4 are undefined because no posts were classified in that category.
| Metric | F1-Score | ||||||
|---|---|---|---|---|---|---|---|
| Category | |||||||
| Threshold | 0.30 | 0.35 | 0.40 | 0.50 | 0.60 | 0.70 | |
| Dwelling | 0.29 | 0.32 | 0.15 | - | - | - | |
| Food consumption | 0.74 | 0.73 | 0.73 | 0.70 | 0.50 | 0.27 | |
| Leisure | 0.69 | 0.63 | 0.61 | 0.33 | 0.49 | 0.26 | |
| Mobility | 0.68 | 0.50 | 0.50 | 0.50 | 0.41 | 0.07 | |
| Overall | 0.60 | 0.54 | 0.50 | 0.60 | 0.47 | 0.20 | |
Table 10.
Percentage of classified social media posts per category of energy-consuming activity.
| Category | Amsterdam | Istanbul |
|---|---|---|
| Dwelling | 3.25% (1326) | 4.18% (589) |
| Food consumption | 20.36% (8312) | 21.99% (3100) |
| Leisure | 44.75% (18,274) | 41.49% (5850) |
| Mobility | 31.64% (12,921) | 32.35% (4561) |
| Total | 100% (40,833) | 100% (14,100) |
© 2018 by the authors. Licensee MDPI, Basel, Switzerland. This article is an open access article distributed under the terms and conditions of the Creative Commons Attribution (CC BY) license (http://creativecommons.org/licenses/by/4.0/).
Share and Cite
MDPI and ACS Style
De Kok, R.; Mauri, A.; Bozzon, A. Automatic Processing of User-Generated Content for the Description of Energy-Consuming Activities at Individual and Group Level. Energies 2019, 12, 15. https://doi.org/10.3390/en12010015
AMA Style
De Kok R, Mauri A, Bozzon A. Automatic Processing of User-Generated Content for the Description of Energy-Consuming Activities at Individual and Group Level. Energies. 2019; 12(1):15. https://doi.org/10.3390/en12010015
Chicago/Turabian StyleDe Kok, Roos, Andrea Mauri, and Alessandro Bozzon. 2019. "Automatic Processing of User-Generated Content for the Description of Energy-Consuming Activities at Individual and Group Level" Energies 12, no. 1: 15. https://doi.org/10.3390/en12010015
Note that from the first issue of 2016, this journal uses article numbers instead of page numbers. See further details here.