Article

Development of a New Bi-Arc Dynamic Numerical Model for Modeling AC Flashover Processes of EHV Ice-Covered Insulators

Modelling and Diagnostic of Electrical Power Network Equipment Laboratory (MODELE), University of Quebec, Chicoutimi, QC G7H 2B1, Canada
*
Author to whom correspondence should be addressed.
Energies 2018, 11(10), 2792; https://doi.org/10.3390/en11102792
Submission received: 28 September 2018 / Revised: 14 October 2018 / Accepted: 15 October 2018 / Published: 17 October 2018
(This article belongs to the Section F: Electrical Engineering)

Abstract

:
This paper presents the development of a new bi-arc dynamic numerical model for predicting AC critical flashover voltage (FOV) of ice-covered extra-high voltage (EHV) insulators. The proposed model is based on a generic calculation algorithm coupled with commercial finite element method software designed to solve the Obenaus/Rizk model. The proposed model allows one to implement the Nottingham and Mayr approaches and compare the results obtained as a function of the arcing distance, the freezing water conductivity, and the initial arc length. The validation of the model demonstrated high accuracy in predicting the FOV of ice-covered post-type insulators and its capability to simulate the interaction of the two partial arcs during the flashover process. In particular, the results showed that the Nottingham approach is sensibly more accurate than the Mayr one, especially in simulating the dynamic behavior of the partial arcs during the flashover process. Based on the encouraging results obtained, a multi-arc calculation algorithm was proposed using the bi-arc dynamic numerical model as a basis. The basic idea, which consists in dividing the multi-arc model in several bi-arc modules, was not implemented and validated but will serve as a promising concept for future work.

1. Introduction

Flashover of line and post insulators due to atmospheric ice accretion still constitutes a cause of failure of overhead electrical power transmission systems in cold climate regions. From several reports from several utilities, the flashover phenomenon of high voltage (HV) insulators can occur during ice accretion, or after, under warming conditions [1,2,3,4,5,6,7,8]. Several studies performed on this topic demonstrate that the flashover process is an extremely complex phenomenon, which depends on the interaction between the partial arcs established along the air gaps, the condition of the ice surface, the environmental conditions, and the arcing distance of the insulator [1,2,3,4,5,6,7,8,9,10,11].
In the last several decades, the advancement of knowledge flashover process on ab ice-surface has led to the development of several single arc mathematical models, both static [12,13,14] and dynamic [15,16,17,18], dedicated to predicting flashover voltage (FOV) of short ice-covered insulators. These mathematical models were based on the Obenaus/Rizk approach developed for polluted insulators. This approach is an equivalent electrical circuit where a single arc is in series with a residual electrical resistance [19,20]. In the case of polluted insulators, the residual resistance is calculated from the Wilkins analytical expression, which takes into account the arc root in contact with the ice surface [21]. However, the Wilkins formulation, initially developed for single arc model, limits the applicability of the static and dynamic predictive models to insulators having an arcing distance lower than 1 m [12,13,14,15,16,17,18].
To avoid such a limitation, some authors have proposed an improvement of the original Wilkins formulation in order to determine the residual resistance when several partial arcs and, consequently, several arc roots are in contact with the ice surface [14,18]. This improved formulation has been implemented in a mathematical static multi-arc model and successfully applied to full-scale extra-high voltage (EHV) post insulators [14]. More recently, this new formulation has been implemented in a dynamic mathematical multi-arc model using the same approach and is described in more detail in the next section [18]. Both multi-arc models can predict the critical flashover voltage, but the dynamic model can also predict leakage current and arc velocity during the flashover process. However, the use of Wilkins formulation requires a well-defined uniform ice layer that can only be obtained under severe icing conditions [14]. Under these specific conditions, the insulator is totally bridged by the ice deposit that can then be modelled as a half cylinder [12,13,14,15,16,17,18]. Consequently, the calculation of the residual resistance using the analytical formulation remains the main limitation of the current static and dynamic mathematical models used to predict the FOV of ice-covered insulators. However, such residual resistance formulation is more difficult to use in the case of non-uniform conductive layers with complex geometries.
To deal with such geometry-related problems, new numerical predictive models using E-field calculation tools have been proposed in recent years by the authors [22,23,24]. The initial numerical model proposed was based on the Obenaus/Rizk single arc model, which was solved using the finite element method (FEM) to compute the E-field distribution between the arc root and the ground electrode, the leakage current as well as the residual resistance of the ice surface for a defined applied voltage. The accuracy of this new predictive model was significantly improved for FOV results obtained with single arc mathematical models without previously associated geometrical limitations thanks to FEM. These results lead to the development of a numerical static bi-arc model extending the numerical single arc model to longer insulators of arcing distance up to 2.02 m [22]. The accuracy of the results obtained with this bi-arc model also showed improvement compared to mathematical models. However, these static numerical models do not take into account the implementation of the arc velocity displacement and do not provide information about the temporal evolution of the arc at the ice surface as well as the leakage current. Such limitations of the numerical static models were solved by the recent development of a generic numerical single arc model in which the Bondiou–Gallimberti arc velocity criterion was implemented to handle the dynamic behavior of the single arc [23,24]. This model was validated with both experimental results obtained from ice-covered and polluted insulators with an improvement in the accuracy of FOV compared to mathematical and numerical static models.
Based on the promising results obtained with the numerical dynamic single arc model developed in recent work, the authors decided to extend this model to the original numerical static bi-arc model presented in detail in [22]. For that, two different approaches proposed by Nottingham [25] and Mayr [26] to simulate the partial arc were implemented in the bi-arc numerical dynamic model. The results were then compared and validated in terms of FOV, leakage current, and evolving partial arc velocities.
The proposed bi-arc dynamic numerical models proposed in this paper represent a great improvement over actual mathematical multi-arc models, which are confined to simple geometries without providing accurate and convivial numerical tools for outdoor insulator dimensioning.

2. A Background of Ice-Covered Insulator Mathematical Flashover Models

2.1. The Obenaus/Rizk Single Arc Flashover Model

The first mathematical model of flashover was proposed by Obenaus and dedicated to polluted insulators [19]. This simple model, illustrated in Figure 1, is the basis of most of the flashover models developed in the last four decades for both the polluted and ice-covered insulators.
For Obenaus, flashover can be modelled as a single arc of length x in series with a conductive layer of length Lx, where L is the total arcing distance of the insulator. The conductive layer of residual resistance R(x) is used to model the humidified polluted layer at the surface of the insulator or the water film formed on the insulator ice surface during the melting period. The corresponding circuit equation for the Obenaus model can then be expressed as follows [19]:
V m = x · E a r c + I m R ( x ) + V e
where Vm is the applied voltage (V); x is the local arc length (m); Im is the leakage current (A); R(x) is the residual resistance of ice layer (Ω); Ve is the electrode voltage drop. The latter can be neglected under AC, where Earc is the electric field along the arc, as initially proposed by Nottingham and expressed as follows [25]:
E a r c = A · I m n
with A and n being the arc constants.
Equations (1) and (2) describe the flashover process for DC applied voltage. For AC, however, Rizk observed that the arc extinguishes and re-ignites twice in each cycle [15]. The arc re-ignition occurs when the AC applied voltage Vm reaches a specific value, the arc re-ignition condition, which can be expressed as follows [20]:
V m = k x I m b
where k and b are the arc re-ignition constants, and Vm and Im are respectively the peak value of the AC applied voltage (V) and the corresponding peak value of current (A).
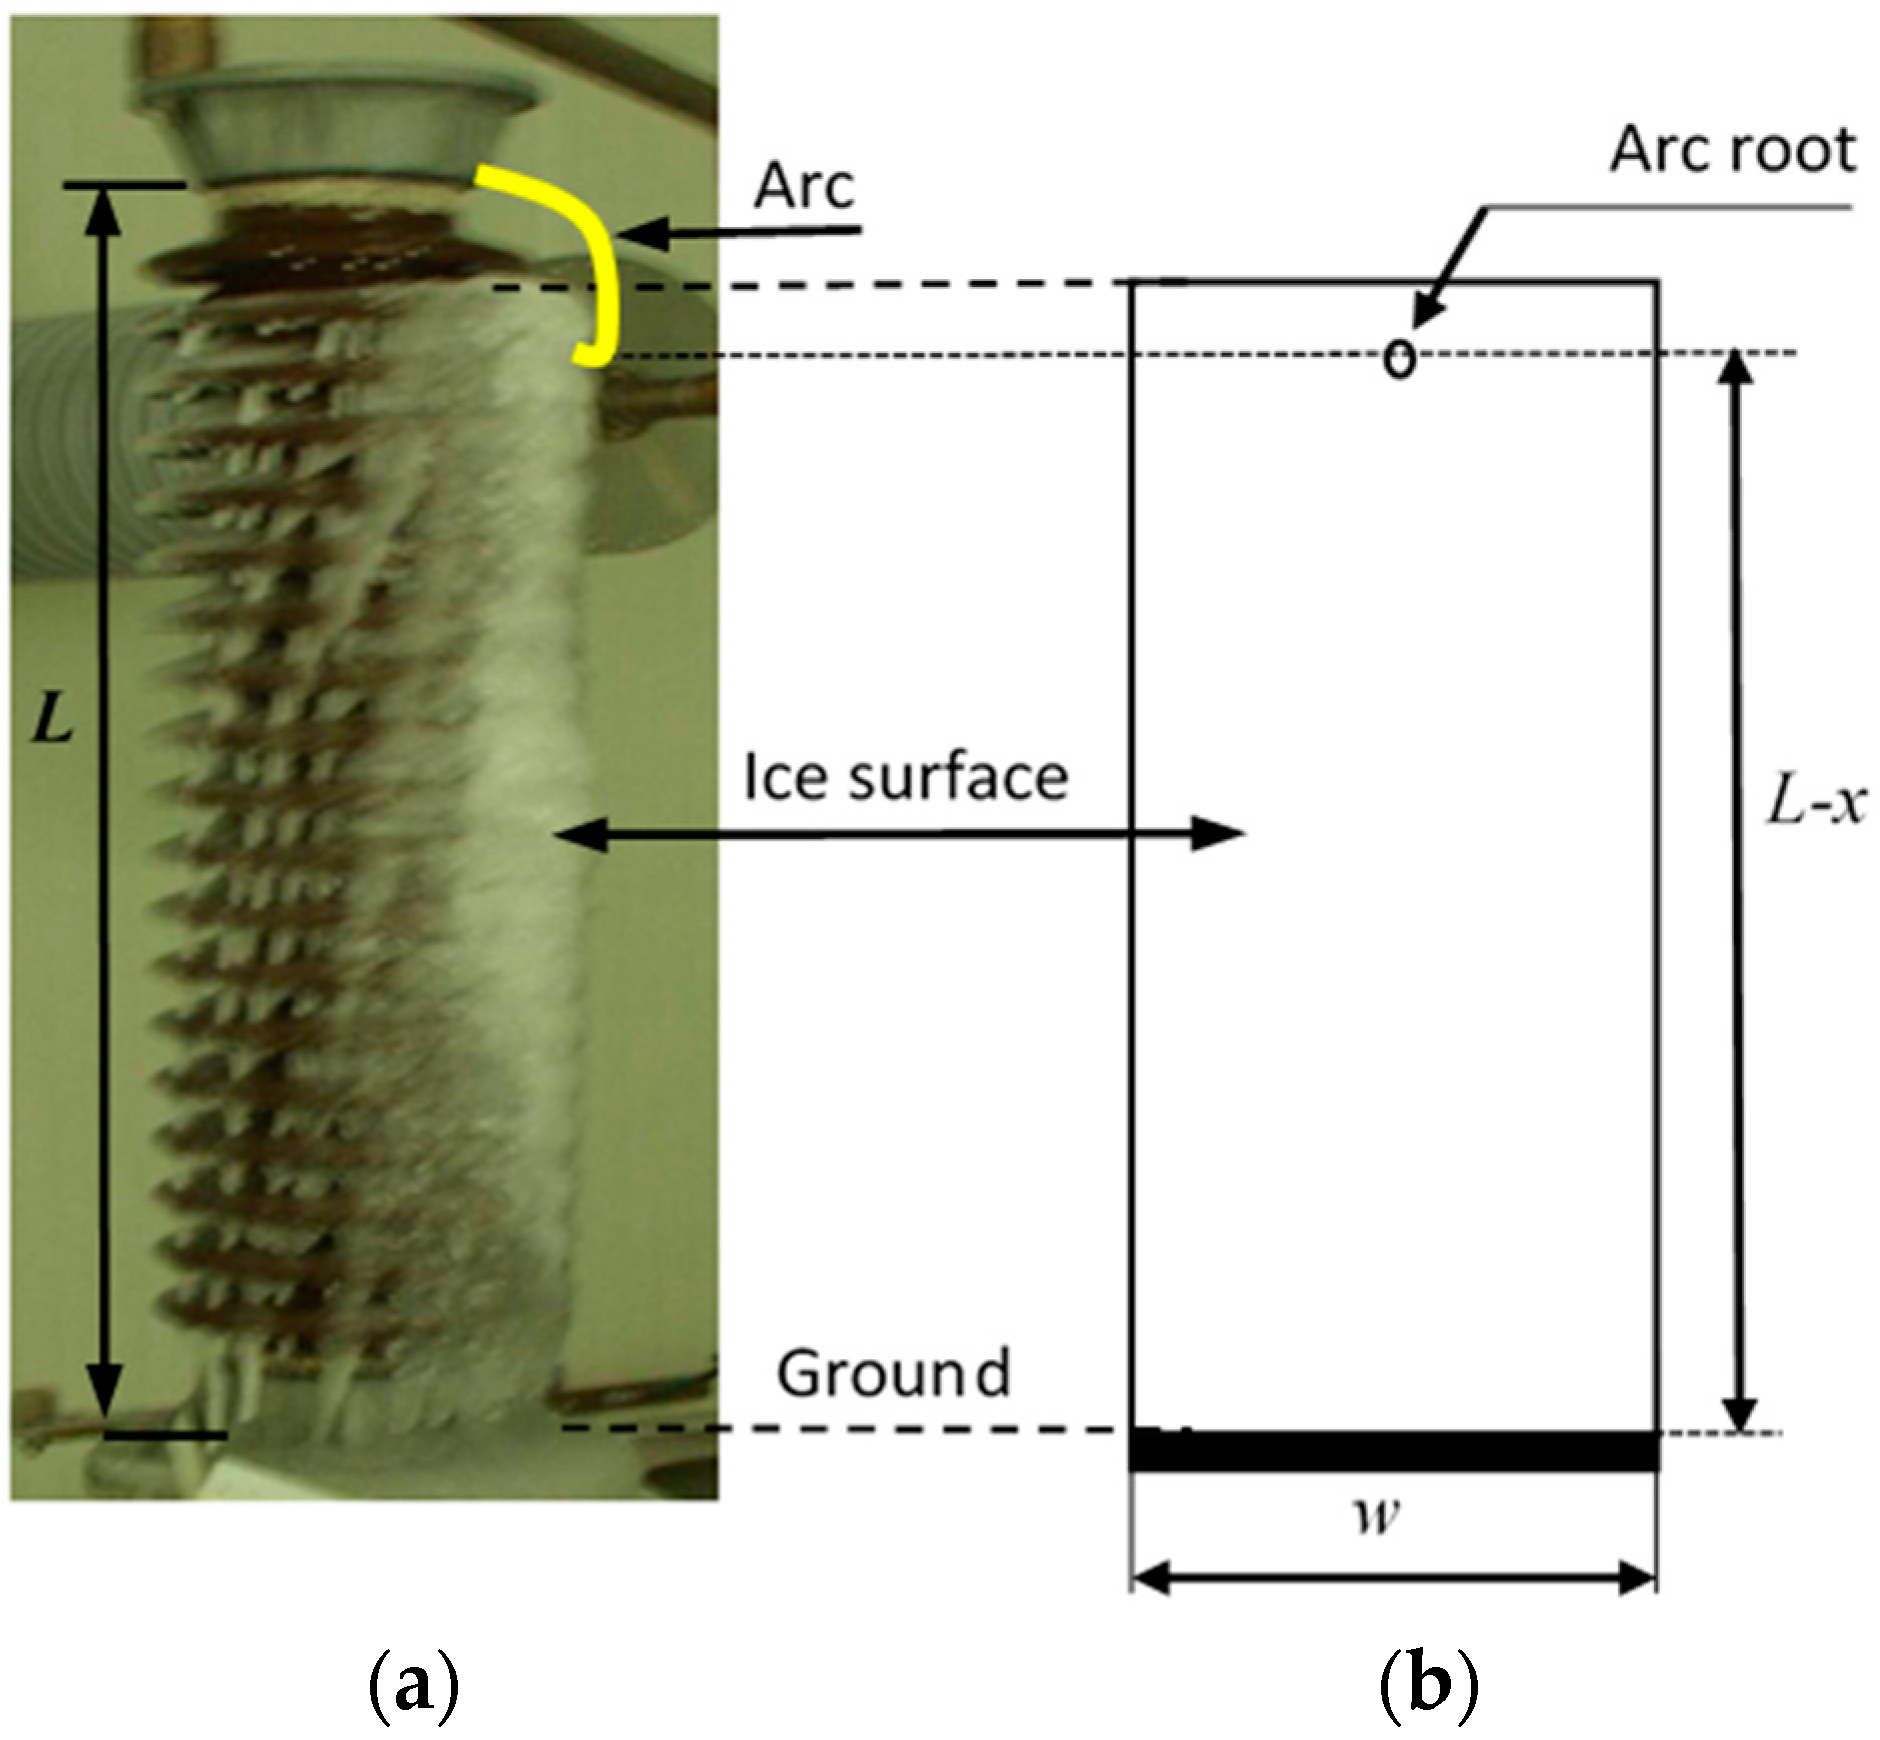
In order to solve Equation (1), the residual resistance R(x) must be determined. For mathematical flashover models, two approaches have been principally used: the open or AR model proposed by Rumeli and the mathematical formulation proposed by Wilkins. Rumeli proposed that the surface geometry of a real insulator is equivalent to a surface in 2D, called the AR or open model, whose length is equal to the leakage path of the given real insulator, as explained in detail in [27]. The advantage of this model is to provide a simple representation of the complex geometry of the uniformly polluted layer covering the insulator. However, the calculation of the pollution resistance of this open model requires that the density current distribution is uniform. In this context, the presence of the arc root at the surface of the conductive layer cannot be taken into account, resulting in a significant discrepancy in the calculation of R(x), as demonstrated in a previous study [27]. On the other hand, Wilkins proposed a new formulation, which takes into account the effect of the density current line constriction at the arc root position. Wilkins considered the arc root to be circular so that the arc is cylindrical [21]. In this way, using the theory of conjugate functions, the calculation of the polluted surface resistance is reduced to a two-dimensional (2D) Laplacian field problem. Taking into account the presence of the arc root influences the residual resistance R(x) value as demonstrated in [27]. However, the problem with the Wilkins formulation is that it can only be applied to rectangular pollution layer geometries and is not representative of real polluted insulator shapes. In fact, this formulation has been principally applied in the modeling of ice-covered insulators that present a rectangular conductive layer in the case of a uniform ice layer [12,13,14,15,16,17,18], as illustrated by Figure 2. In most ice-covered insulator flashover models, the simplified Wilkins formulation given by Equation (4) is used with the assumption that wL, where w is the width of the ice layer, and L the total arcing distance of the insulator:
R ( x ) = 1 2 π γ e [ π ( L x ) w + ln ( w 2 π r ) ]
where x is the arc length, γe is the surface conductivity of the conductive layer, and r is the arc root radius.
In previous studies, the arc-root radius r and the surface conductivity γe were established to be [12]:
r = I m B · π
γ e = α · σ + β
where Im is the leakage current, B a constant dependent on the nature of the applied voltage and conductive layer, σ is the conductivity of the freezing water, and α and β are constants depending on the applied voltage polarity [12,13,14].
Based on the Obenaus/Rizk single arc model, several mathematical models, static or dynamic, were developed, predicting with a good accuracy the FOV of ice-covered insulators [12,13,15]. However, this single arc model could only be applied to ice-covered insulators with arcing distance lower than 1 m. As reported in several experimental studies on short suspended insulator strings or small porcelain post insulators, the flashover process of small ice-covered insulators seems to be attributed to the propagation of only one electrical arc on the ice surface [4,5]. For longer insulators like those used on EHV electrical networks, several electrical partial arcs on the ice can be involved in the flashover process [11,14,18]. In that situation, a single arc flashover model cannot be used anymore and some modifications need to be done, as presented in the next sections.

2.2. The Principle of the Static Mathematical Multi-Arcs Model

When the arcing distance of an insulator is greater than 1 m, as in the case of EHV insulators, the dynamic ice accretion process combined with the presence of a high electric field leads to the formation of several air gaps (ice-free sections of the insulator). These air gaps combined with the presence of a water film generated by the melting of the ice surface lead to a non-uniform distribution of the electric field along the insulator [9,10]. Under melting conditions, the increase of the electric field along the air gaps can initiate partial arcs along each air gap, as illustrated in Figure 3. Depending on the applied voltage amplitude and the ice surface condition, these partial arcs will start propagating along the ice-covered insulator, and will join together to form a complete flashover [9,10]. The presence of several partial arcs will give rise to several arc roots on the ice surface. This specific condition generates a non-uniform current distribution along the melted ice surface, which directly affects the calculation of the residual resistance of the ice layer.
In order to be able to model this multi-arc flashover process in the case of ice-covered EHV insulators, some authors have proposed extending the single-arc static model, proposed by Obenaus/Rizk, to multi-arcs (Figure 4a) by dividing the ice layer covering the EHV insulator in several parts in order to create several single arc models in series (Figure 4b) [14,18]. Moreover, in the case of a partial arc having two roots in contact with the ice surface (Arc 2 on Figure 4a), it must be divided into two partial arcs of equal length (Arc’2 and Arc’’2 on Figure 4b) in order to create two single arc models. Hence, using this strategy, an ice-covered insulator (Figure 4a) with three partial arcs can be modelled using four single arc models in series (Figure 4b), which are governed by Equations (1) to (3).
This arc splitting modelling requires modifying the expression of the residual resistance R(x) given by Equation (4) for the one arc root in contact with the ice surface. In a general way, if there are N arcs, N′ of them with one-root and N″ of them with two roots in contact with the ice (N = N′ + N″), then the total residual resistance R(x) of the multi-arc model can be expressed as follows [14]:
R ( x ) = 1 2 π γ e [ ( ( L x ) w ) + ( N + 2 N ) l n ( w 2 π r ) ]
where L is the total arcing distance of the insulator, and x is the sum of all arc lengths.
Despite the relatively good accuracy obtained with this static multi-arc model, as demonstrated in [14], it does not allow the behavior of partial arcs at the ice surface to be modeled or the arc velocity and leakage current evolution during the flashover process to be computed. For that purpose, a new dynamic multi-arcs model has been proposed recently, as presented in the next section.

2.3. The Principle of Dynamic Mathematical Multi-Arcs Models

The dynamic mathematical multi-arc model proposed by [18] uses exactly the same approach as the static multi-arc model does, and is shown in Figure 4. In fact, the authors use a single arc dynamic mathematical model, presented in detail in [10], to solve the multi-arc problem by splitting of several single arc models, as illustrated in Figure 4b. The residual resistance R(x) is calculated using the same analytical formulation as used for the multi-arc static model, given by Equation (7).
The main goal here is to propose a new arc velocity criterion. The proposed arc velocity criterion is an experimental criterion based on high-speed measurements of the propagation of the upper and lower partial arcs during the flashover process. From the results obtained, the authors have determined that the average arc velocity v(x) can be expressed as follows [18]:
v ( m / s ) = 1634.1 x 4.9
where x(m) is the length of the partial arc.
The proposed multi-arc dynamic model allows for predictions of the FOV of EHV ice-covered insulators with good accuracy (Figure 3), with an arcing distance up to 4.17 m. However, this model presents two main limitations. The first limitation comes from the experimental arc velocity criterion given by Equation (8), which does not permit any simulation of the velocity of each partial arc on the ice surface. Indeed, each partial arc propagates differently depending on its initial length and position along the insulator. Generally, the upper partial arc located at the top of the insulator in contact with the HV electrode is faster than the lower partial arc in contact with the ground electrode [14,18]. The second limitation of this model, which is the same as that of the static multi-arcs model, is inherent to the residual resistance R(x) calculation given by Equation (7). Since this equation can only be applied to rectangular geometries as those obtained for uniform ice layers, and it cannot cover non-uniform ice layers as those obtained in the case of insulators equipped with alternated sheds or booster sheds [4,5].

3. Numerical Implementation of the Bi-Arc Flashover Model

3.1. The Single Arc Dynamic Numerical Model

Despite the fact that both static and dynamic mathematical models applied to multi-arcs flashover modeling provide satisfactory results in terms of FOV, they present limitations, as mentioned previously. To extend the applicability of predictive models in terms of geometry and dynamic parameter computation, the authors have developed in recent years a new dynamic single arc model to predict the FOV of both polluted and ice-covered insulators. This model, presented in detail in [23,24], uses the finite element method (FEM) commercial software Comsol Multiphysics to compute the leakage current Im and the residual resistance R(x) related to the Obenaus/Rizk model described by Equations (1)–(3). The numerical approach based on FEM allows for the development of a versatile model, which is independent of the geometry of the problem and, consequently, can be applied to different conductive layer geometries as those of polluted insulators using the AR model or ice-covered insulators [24]. The FEM is coupled with a generic calculation algorithm implemented in Matlab (2017), which allows for the determination of the evolution of the leakage current Im and the arc velocity v(t) during the flashover process as well as the average E-field Eavg in the conductive layer. In order to implement dynamic calculations, the algorithm uses the arc propagation criterion proposed by Hampton [28] given by Equation (9) as well as the arc velocity criterion proposed by Gallimberti [29] given by Equation (10). These equations are expressed as:
E a r c < E a v g
where Eavg is average E-field inside the pollution layer, and Earc is the electric field along the arc given by Equation (2), and as:
v ( t ) = I m Q i ( t )
where Qi(t) is the required charge to induce the arc propagation, which can be expressed as follows [29]:
Q i ( t ) = C i V a p
where Ci is the capacitance between the arc root and the ground, and Vap the potential at the arc root.
In Equation (11), the capacitance Ci can be calculated using a spherical approximation [29] as follows:
C i = 4 π ε 0 r · s h ( α ) i [ s h ( θ ) ] 1
with
θ = cos h 1 ( L x r )
where L is the insulator arcing distance, x the arc length, and r the arc root radius given by Equation (5).
As mentioned previously, this single arc dynamic numerical model has been successfully applied to both polluted and ice-covered insulators presenting short arcing distance. As for longer insulators, where two and more partial arcs are involved in the flashover process, the authors decided to improve their single arc numerical model in order to take into account the presence of several partial arcs at the surface of the ice-covered insulator.

3.2. The Principle of the Bi-Arc Dynamic Numerical Model

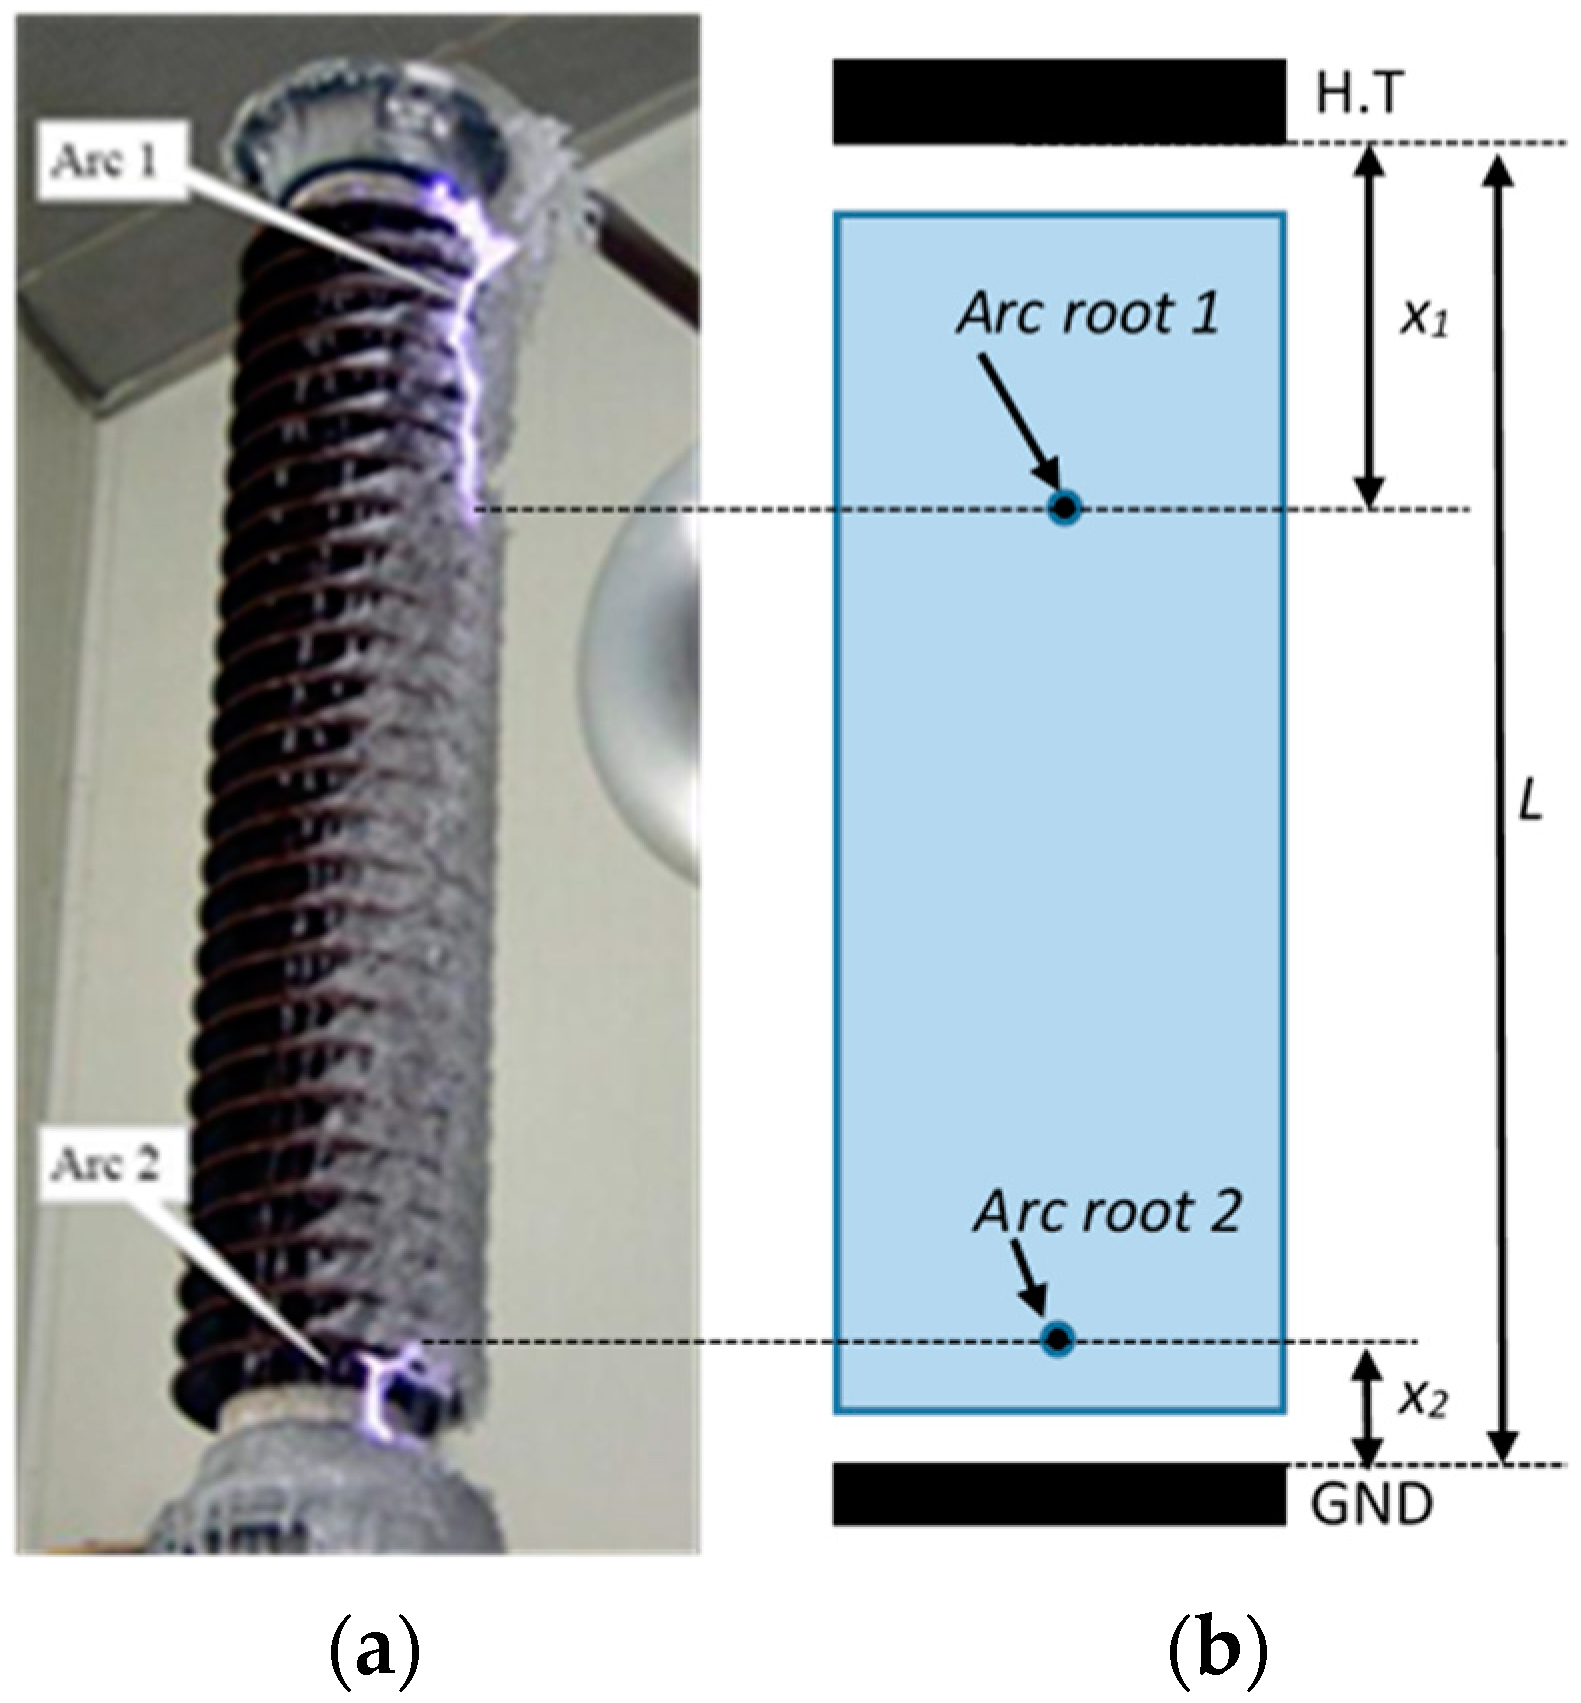
Figure 5 illustrates the modelling principle used in the case of two partial arcs in contact with the ice surface. As observed in Figure 5, during experimental tests, each partial arc is initiated at the HV and ground electrode, respectively; consequently, each of them featuring an arc root in contact with the ice surface. Due to the presence of the two arc roots on the ice surface, the distribution of the current density is modified as well as the residual resistance R(x) between the two arc roots [22]. However, this modification can be easily handled using FEM, where the influence of each arc root is taken into account without having to divide the ice layer into two parts, as done for the two mathematical multi-arc models.
The proposed bi-arc dynamic numerical model is based on the static bi-arc numerical model developed by the authors dedicated to ice-covered insulators and presented in detail in [22]. To this static model, the authors have applied the dynamic conditions used in their numerical single arc model described previously to enable it to compute the evolution of the leakage current and the velocity of each partial arc during the flashover process. Hence, both the Hampton and Gallimberti criteria described by Equations (9) and (10) were used, respectively. In the FEM model, two arc roots in contact with the ice surface was considered as an equipotential surface of radius r given by Equation (5). The voltage boundary condition applied to each arc root was calculated as follows:
V a p p 1 = V m x 1 · A · I m n
V a p p 2 = x 2 · A · I m n
where Vm is the peak value of the AC applied voltage; x1 and x2 are the length of the Partial Arcs 1 and 2, respectively (Figure 5); Im is the leakage current; R(x) is the residual resistance of the ice layer; A and n are the AC arc constants.
Finally, as proposed in [14], the condition of arc re-ignition given by Equation (3) must be modified in order to take into account the presence of the two arcs one of which propagates downwards (Arc 1) and the other upwards (Arc 2). This is done by the following equation:
V m = 1 I m b ( k 1 · x 1 + k 2 · x 2 )
where x1 and x2 are the length of Partial Arcs 1 and 2, respectively, and k1, k2, and b are AC parameters given by [12].
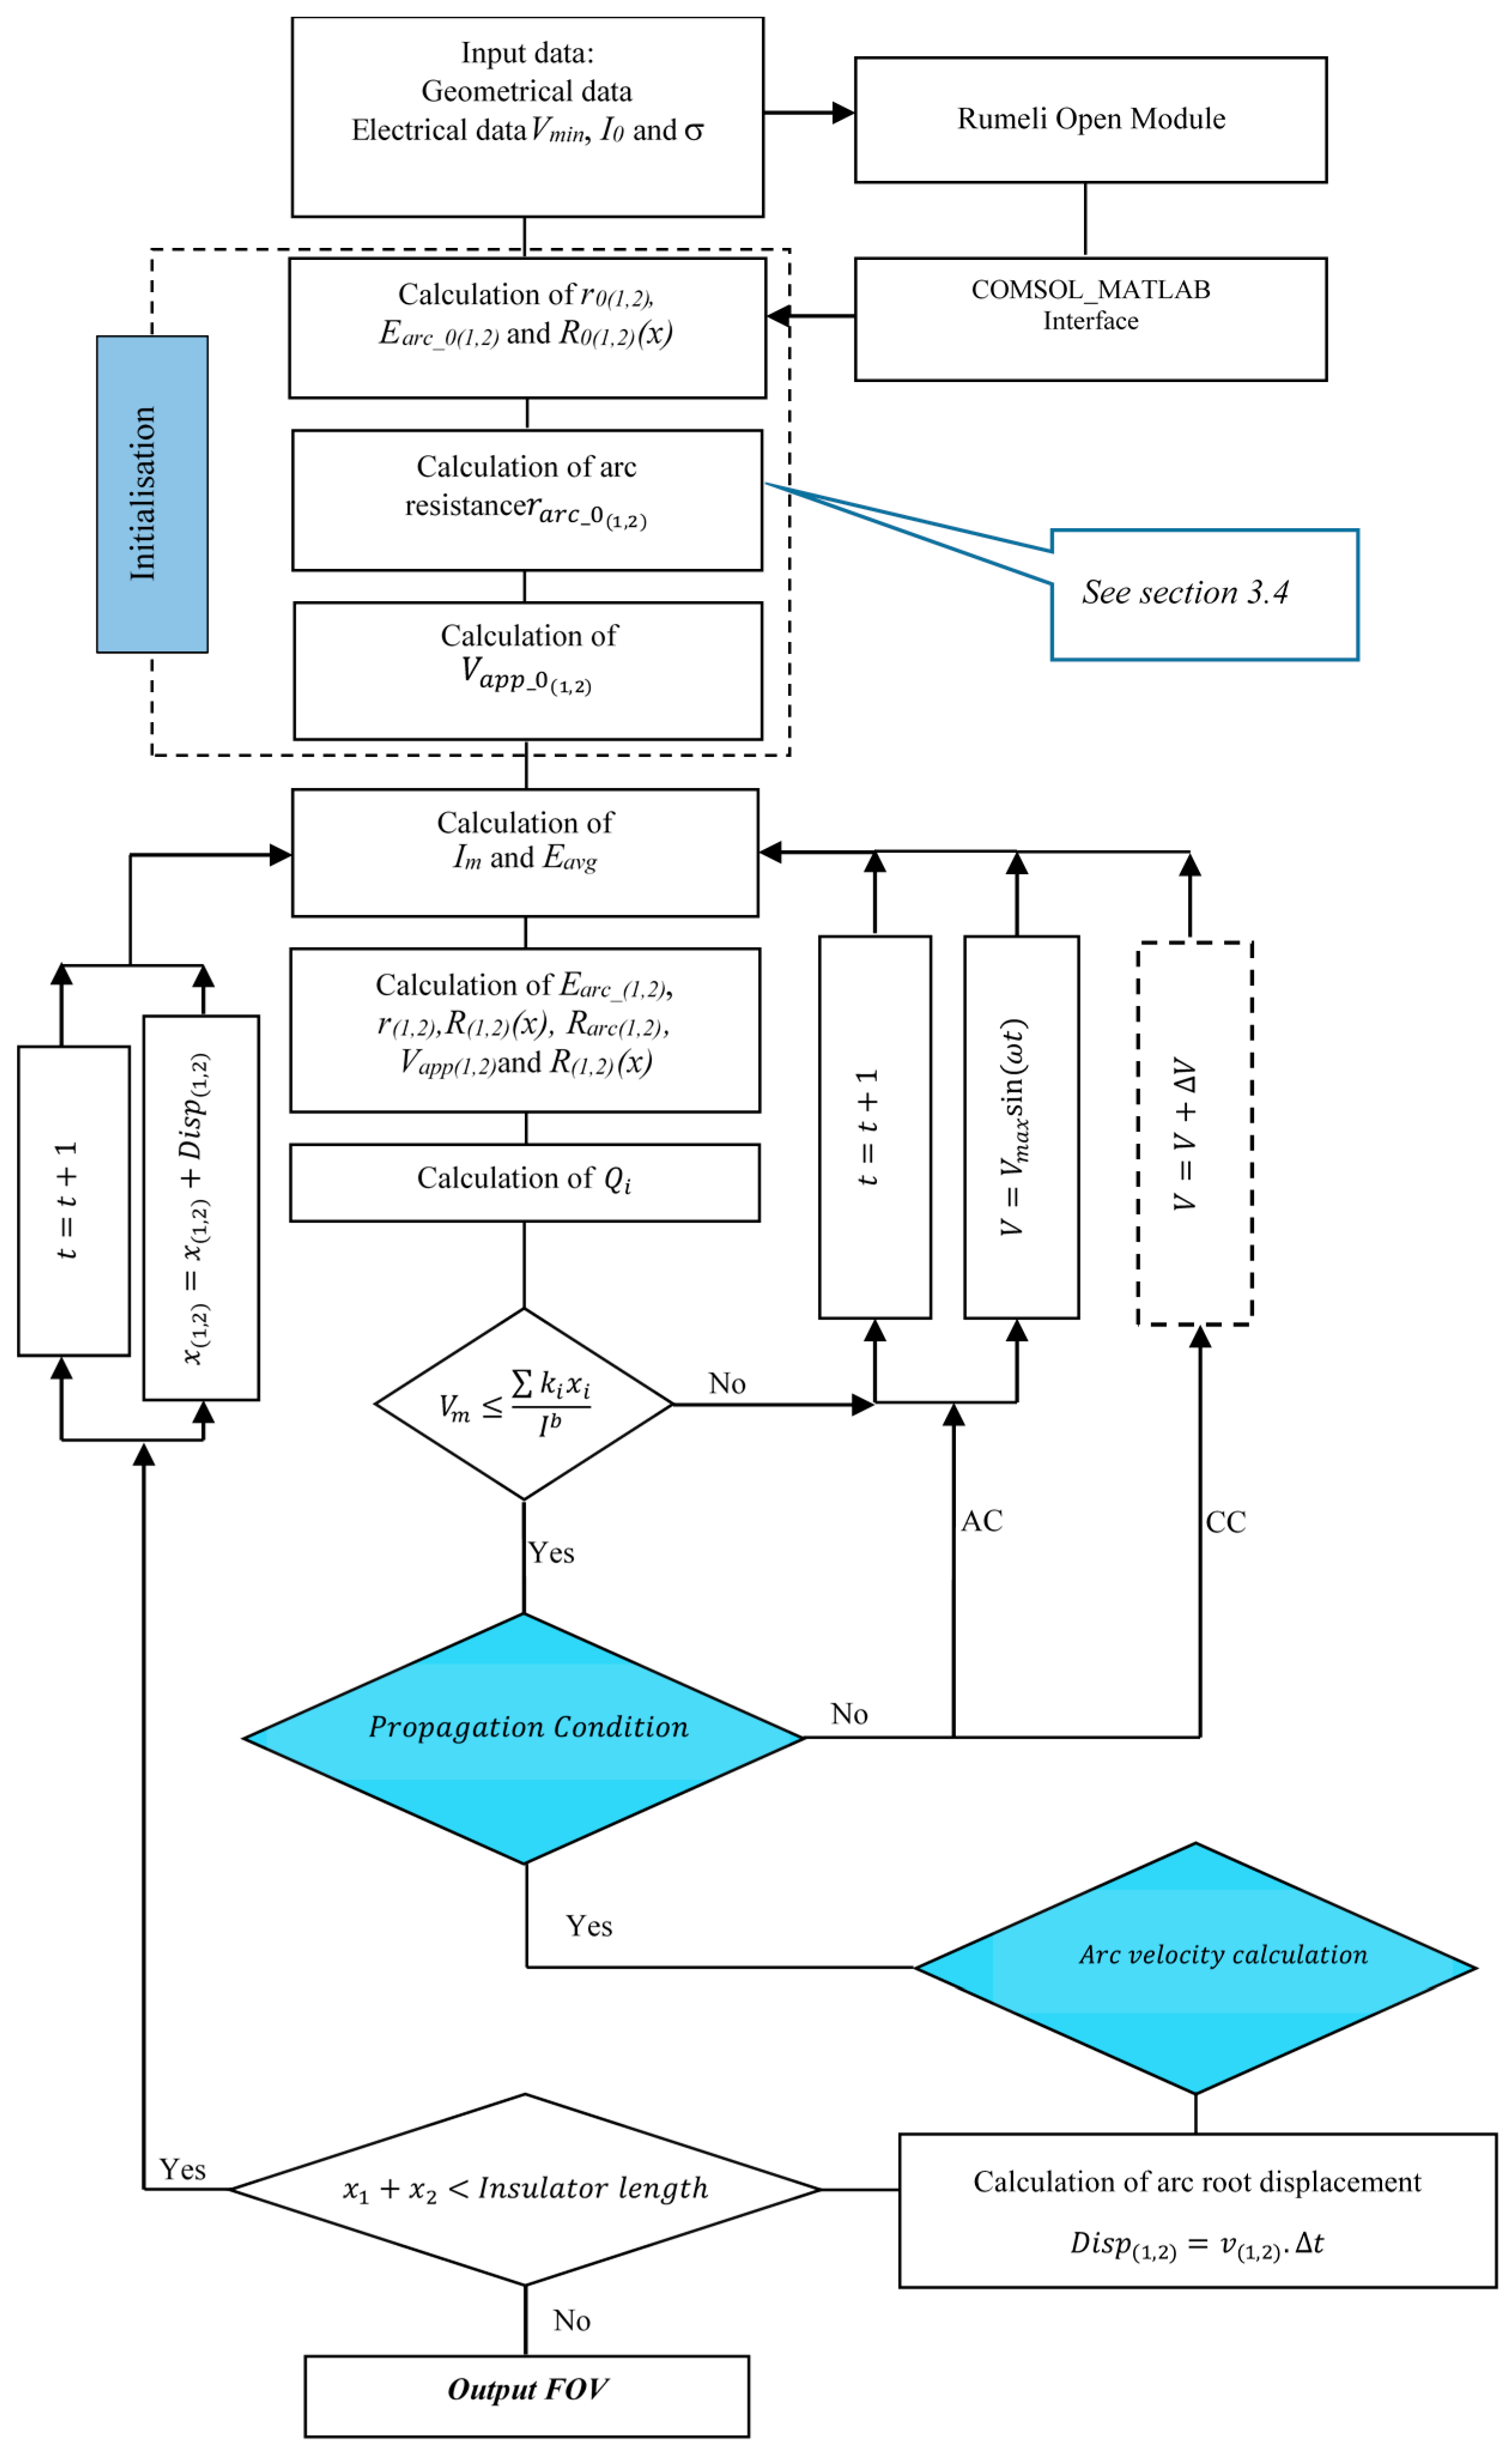
Figure 6 shows the calculation algorithm of the dynamic numerical bi-arc models. This algorithm is based on the calculation algorithm developed for the dynamic numerical single arc presented in detail in [23] with the addition of the new conditions expressed by Equations (14)–(16). The problem is solved in 2D using the electric current module and the stationary solver of Comsol Multiphysics, where only the conductive surface of the ice layer, given by Equation (6), is discretized in finite elements. The FEM is used to calculate the average electric field Eavg, the residual resistance R(x), and the peak value of the leakage current Im determined by integrating the current density along a moving line located at equal distance of the arc roots. The FEM calculation are performed at each time step of the dynamic calculation algorithm, which used the numerical FEM results to verify the re-ignition condition given by Equation (16) followed by the arc propagation condition given by Equation (9). For each case, if the condition is not satisfied, the peak value of the applied source voltage Vm is increased by 1 kV, and the process is repeated until condition verification. Once the two conditions are verified, the velocity of each partial arc using Equation (10) is determined and used to increment the arc root position of these latter. The process is repeated until the sum of the length of the two partial arcs equals the arcing distance of the insulator. The simulation parameters used by the calculation algorithm are summarized in Table 1.

3.3. The Validation of the Bi-Arc Dynamic Numerical Model

3.3.1. The Effect of Arcing Distance and Freezing Water Conductivity

The model was validated using the experimental results extracted from literature [14,22]. For that purpose, post-type insulators as the one in Figure 5a, with arcing distances of 1.39 and 2.02 m, were used. The corresponding FEM model is presented in Figure 5b. The experimental FOV of the post insulator was determined under wet-grown ice conditions during the melting period, the most likely conditions for flashover [4,5]. The tests were conducted for two freezing water conductivities, 30 and 80 µs/cm and two ice thicknesses, 1.5 and 2 cm. The two air gaps were created artificially in order to control their length, fixed at 5 cm, which is the length used in the simulations.
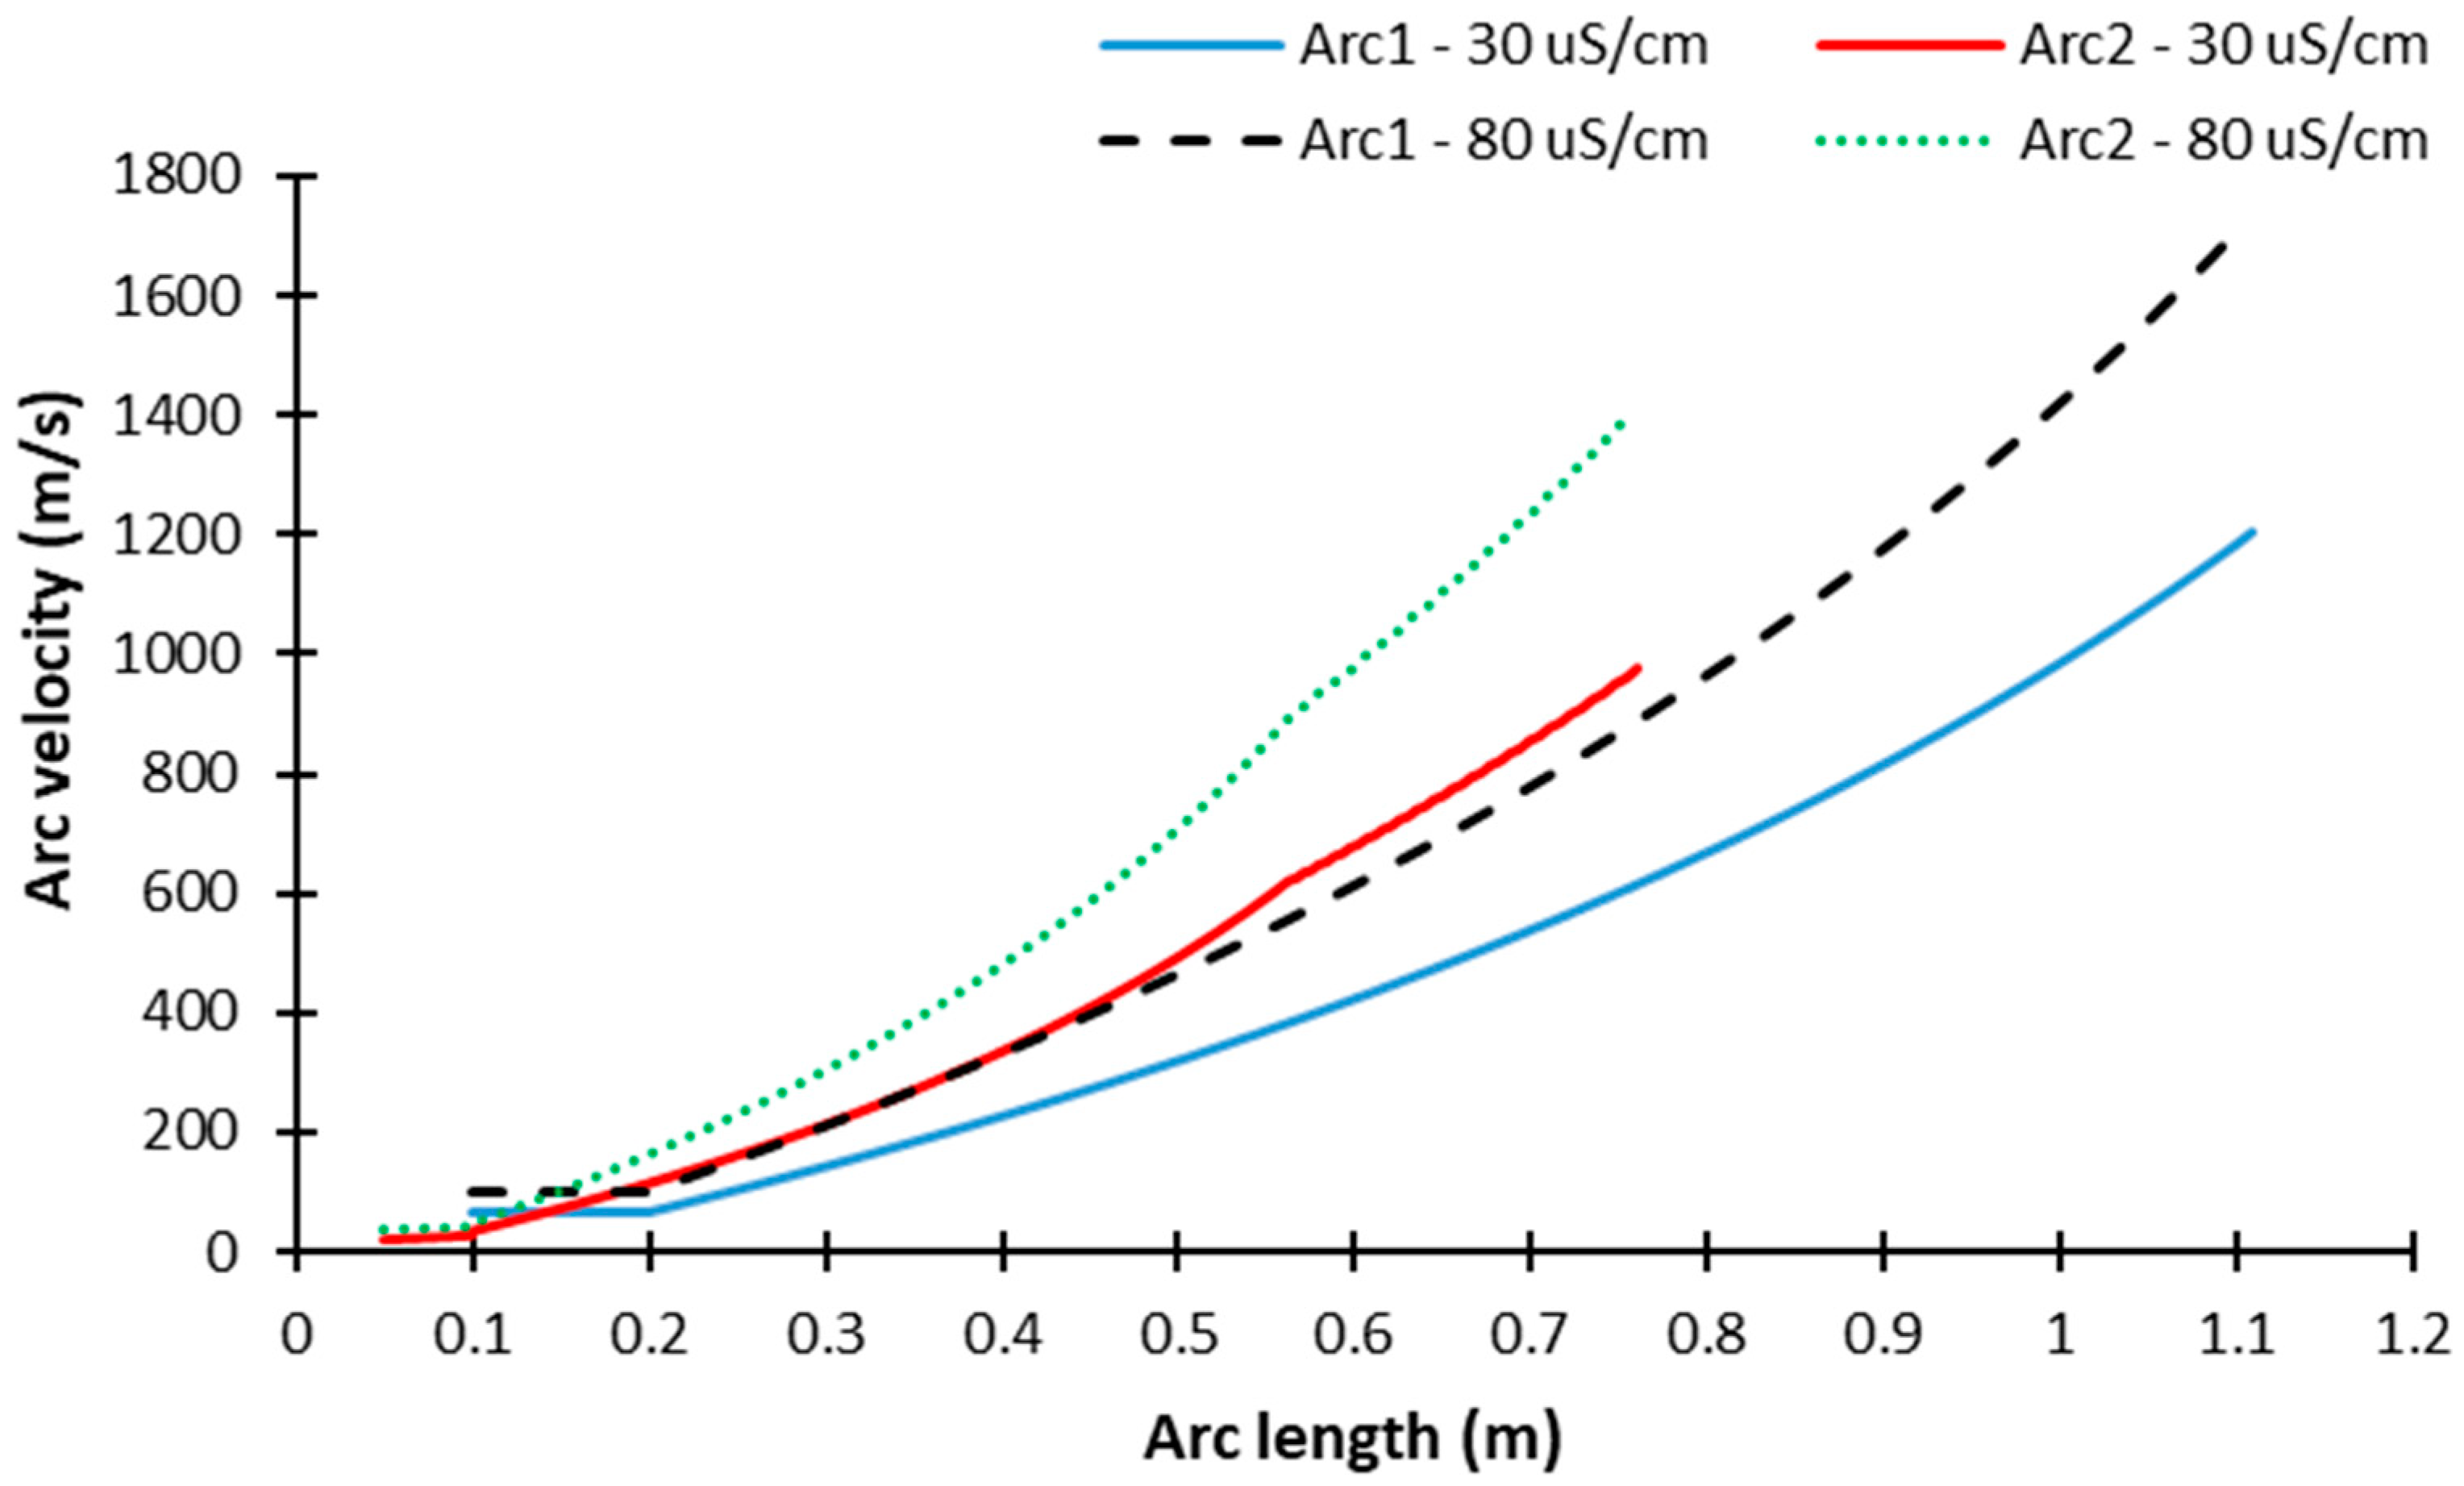
Table 2 presents the comparison between the experimental results and those calculated with the proposed bi-arc numerical model, showing that the dynamic numerical model provides accurate results with an average discrepancy of 1.4%. Moreover, the implementation of the arc velocity criterion allows for computation of the evolution of the velocity of each partial arc during the flashover process presented in Figure 7 and Figure 8 and the leakage current presented on Figure 9. The results were obtained for an arcing distance of 139 and 202 cm for an ice thickness of 1.5 cm and for freezing water conductivities of 30 and 80 µs/cm, respectively.
As observed in Figure 7 and Figure 8, only the velocity of one partial arc is represented. Indeed, Partial Arc 1 propagates downward and Partial Arc 2 propagates upward at the same velocity. Consequently, the flashover occurs when the two partial arcs meet each other at the middle of the ice layer or when they reach the same arc length equal to 64.5 cm for an arcing distance of 139 cm and equal to 96 cm for an arcing distance of 202 cm (Figure 8). The identical behavior of the two partial arcs can be attributed to the fact that the simulations were conducted for an identical initial arc length (x01 = x02 = 5 cm) for each partial arc. In this way, the problem becomes symmetric in terms of the arc velocity criterion given by Equation (10), as the two partial arcs are in series (with the same leakage current Im) and each arc root has the same capacity Ci calculated by Equation (12), between the arc root and the middle of the ice layer. Additionally, the velocity of each partial arc for the same arcing distance increases as freezing water conductivity increases. In the same way, the velocity of each partial arc, for the same freezing water conductivity, increases as arcing distance increases. From Figure 7, it can be observed that the time to flashover decreases as freezing water conductivity increases, for each arcing distance.
The first observation of Figure 9 shows that the evolution and order of magnitude of the values obtained for the leakage current are consistent with the experimental observations made in laboratory [12,13,14,15,16,17,18]. The results show that the leakage current increases with an increase in freezing water conductivity as well as with an increase in arcing distance. It can also be observed that the time to flashover decreases significantly as freezing water conductivity increases.

3.3.2. The Effect of the Initial Partial Arc Length

In order to verify the effect of the initial arc length, it was decided to perform another simulation, with the same arcing distances and parameters, but with the initial length x1 of Partial Arc 1 equal to twice the length x2 of Partial Arc 2 (x01 = 2x02). The arc velocity evolution of each partial arc as a function of time and the arc length for an arcing distance of 202 cm and freezing water conductivities of 30 and 80 µs/cm are presented in Figure 10 and Figure 11, respectively. The results obtained clearly demonstrate that the initial arc length has a significant influence on its velocity. Indeed, it is interesting to note that the velocity of Arc 1 is significantly greater than that of Partial Arc 2, with a final value twice the velocity of Arc 2 for the arcing distance of 139 cm, the latter being similar to the velocity obtained with the same initial arc length (x01 = x02). For the arcing distance of 202 cm, the ratio between the velocities of Partial Arcs 1 and 2 decreases to a value of 1.3. With a higher velocity, Partial Arc 1 propagates on a longer distance at the ice surface than Partial Arc 2. In the case of Figure 10, Partial Arc 1 meets with Partial Arc 2 at a length x1 of 80 and 111 cm for the arcing distance of 139 and 202 cm, respectively (Figure 11).
Table 3 presents a comparison between the FOV results obtained with the bi-arc dynamic numerical model for the two partial arc initial length conditions. As can be observed, the effect of initial arc length is not significant on the FOV results. However, the absolute discrepancy seems to increase with an increase of arcing distance and freezing water conductivity as well.

3.4. Implementation of the Mayr Approach in the Bi-Arc Dynamic Numerical Model

As shown in the last section, the proposed numerical dynamic model improves the accuracy of the initial numerical static bi-arc model and computes the evolution of the leakage current and the arc velocity during the flashover process. However, as explained in Section 3.2, the proposed calculation algorithm is applicable only in the case where the two partial arcs are in contact with the HV and ground electrodes. In this particular situation, the voltage condition applied to each arc root can be easily determined using Equations (14) and (15). In the case of one partial arc having its two arc roots in contact with the ice layer, as illustrated by Arc 2 in Figure 4a, these equations are no longer valid. The two arc roots must be considered as two floating potentials of unknown values, which are required to deeply modify the calculation algorithm of Figure 6. In order to solve this problem, it was decided to implement a new modeling of the arc in the numerical dynamic bi-arc model using the arc resistance formulation proposed by Mayr, as presented in detail in the next section.

3.4.1. Arc Resistance Formulation by Mayr

Mayr has proposed an analytical formulation in order to define the arc resistance Rarc, which can be defined only by the arc voltage and current. He has also described the arc resistance as time-dependent by introducing the arc time constant τ. According to Mayr, the arc resistance Rarc can be expressed as follows [26]:
d d t [ l n 1 R a r c ] = 1 τ ( V a r c · I m P 0 1 )
where τ = 100 µs is the arc time constant [26] and P0 the cooling power dissipated in the arc, expressed numerically as
P 0 = V a r c · I m = E a r c · x · I m
where Im is the leakage current (A), x is the arc length, and Earc is the electric field along the arc given by Equation (2).
The development of Equation (17) for its implementation in the calculation algorithm leads to the following expression:
d R a r c = [ ( R a r c τ ) · ( 1 R a r c · I m E a r c ) ] · d t .
In order to be consistent with the implementation of the arc resistance formulation given by Equation (19) in the algorithm, the authors decided to introduce a new expression of the electric field Earc along the partial arc, which is generally expressed by the Nottingham expression given by Equation (2). The new expression of Earc is as follows:
E a r c = I m · R a r c x
where Im is le leakage current, Rarc is the arc resistance given by Equation (19), and x is the partial arc length.

3.4.2. Validation of the Implementation of the Mayr Arc Resistance Formulation

The implementation of Equations (19) and (20) in the dynamic bi-arc algorithm of Figure 6 was validated using the same simulation parameters and ice-covered insulator geometries as used in Section 3.3. The results obtained were then compared with those of the Nottingham approach in terms of FOV, arc velocity, and leakage current evolutions. Table 4 presents the FOV predictive results obtained with the two approaches for an ice thickness of 1.5 cm, which are compared to the experimental results. The results showed that the Mayr approach is less accurate than Nottingham with an average discrepancy of 2.43% and 0.86%, respectively. However, the difference between the two approaches is not significant. The absolute accuracy seems to decrease significantly as arcing distance and freezing water conductivity are increased, but less so for the latter.
Figure 12 and Figure 13 compare the evolution of partial arc velocity as a function of time and arc length, respectively, for an arcing distance of 202 cm and initial condition x01 = x02. Only the velocity of one partial arc is presented, as they are the same due to the symmetry of the problem, as explained previously. Figure 14 shows the evolution of leakage current Im as a function of arc length for an arcing distance of 202 cm and initial condition x01 = x02.
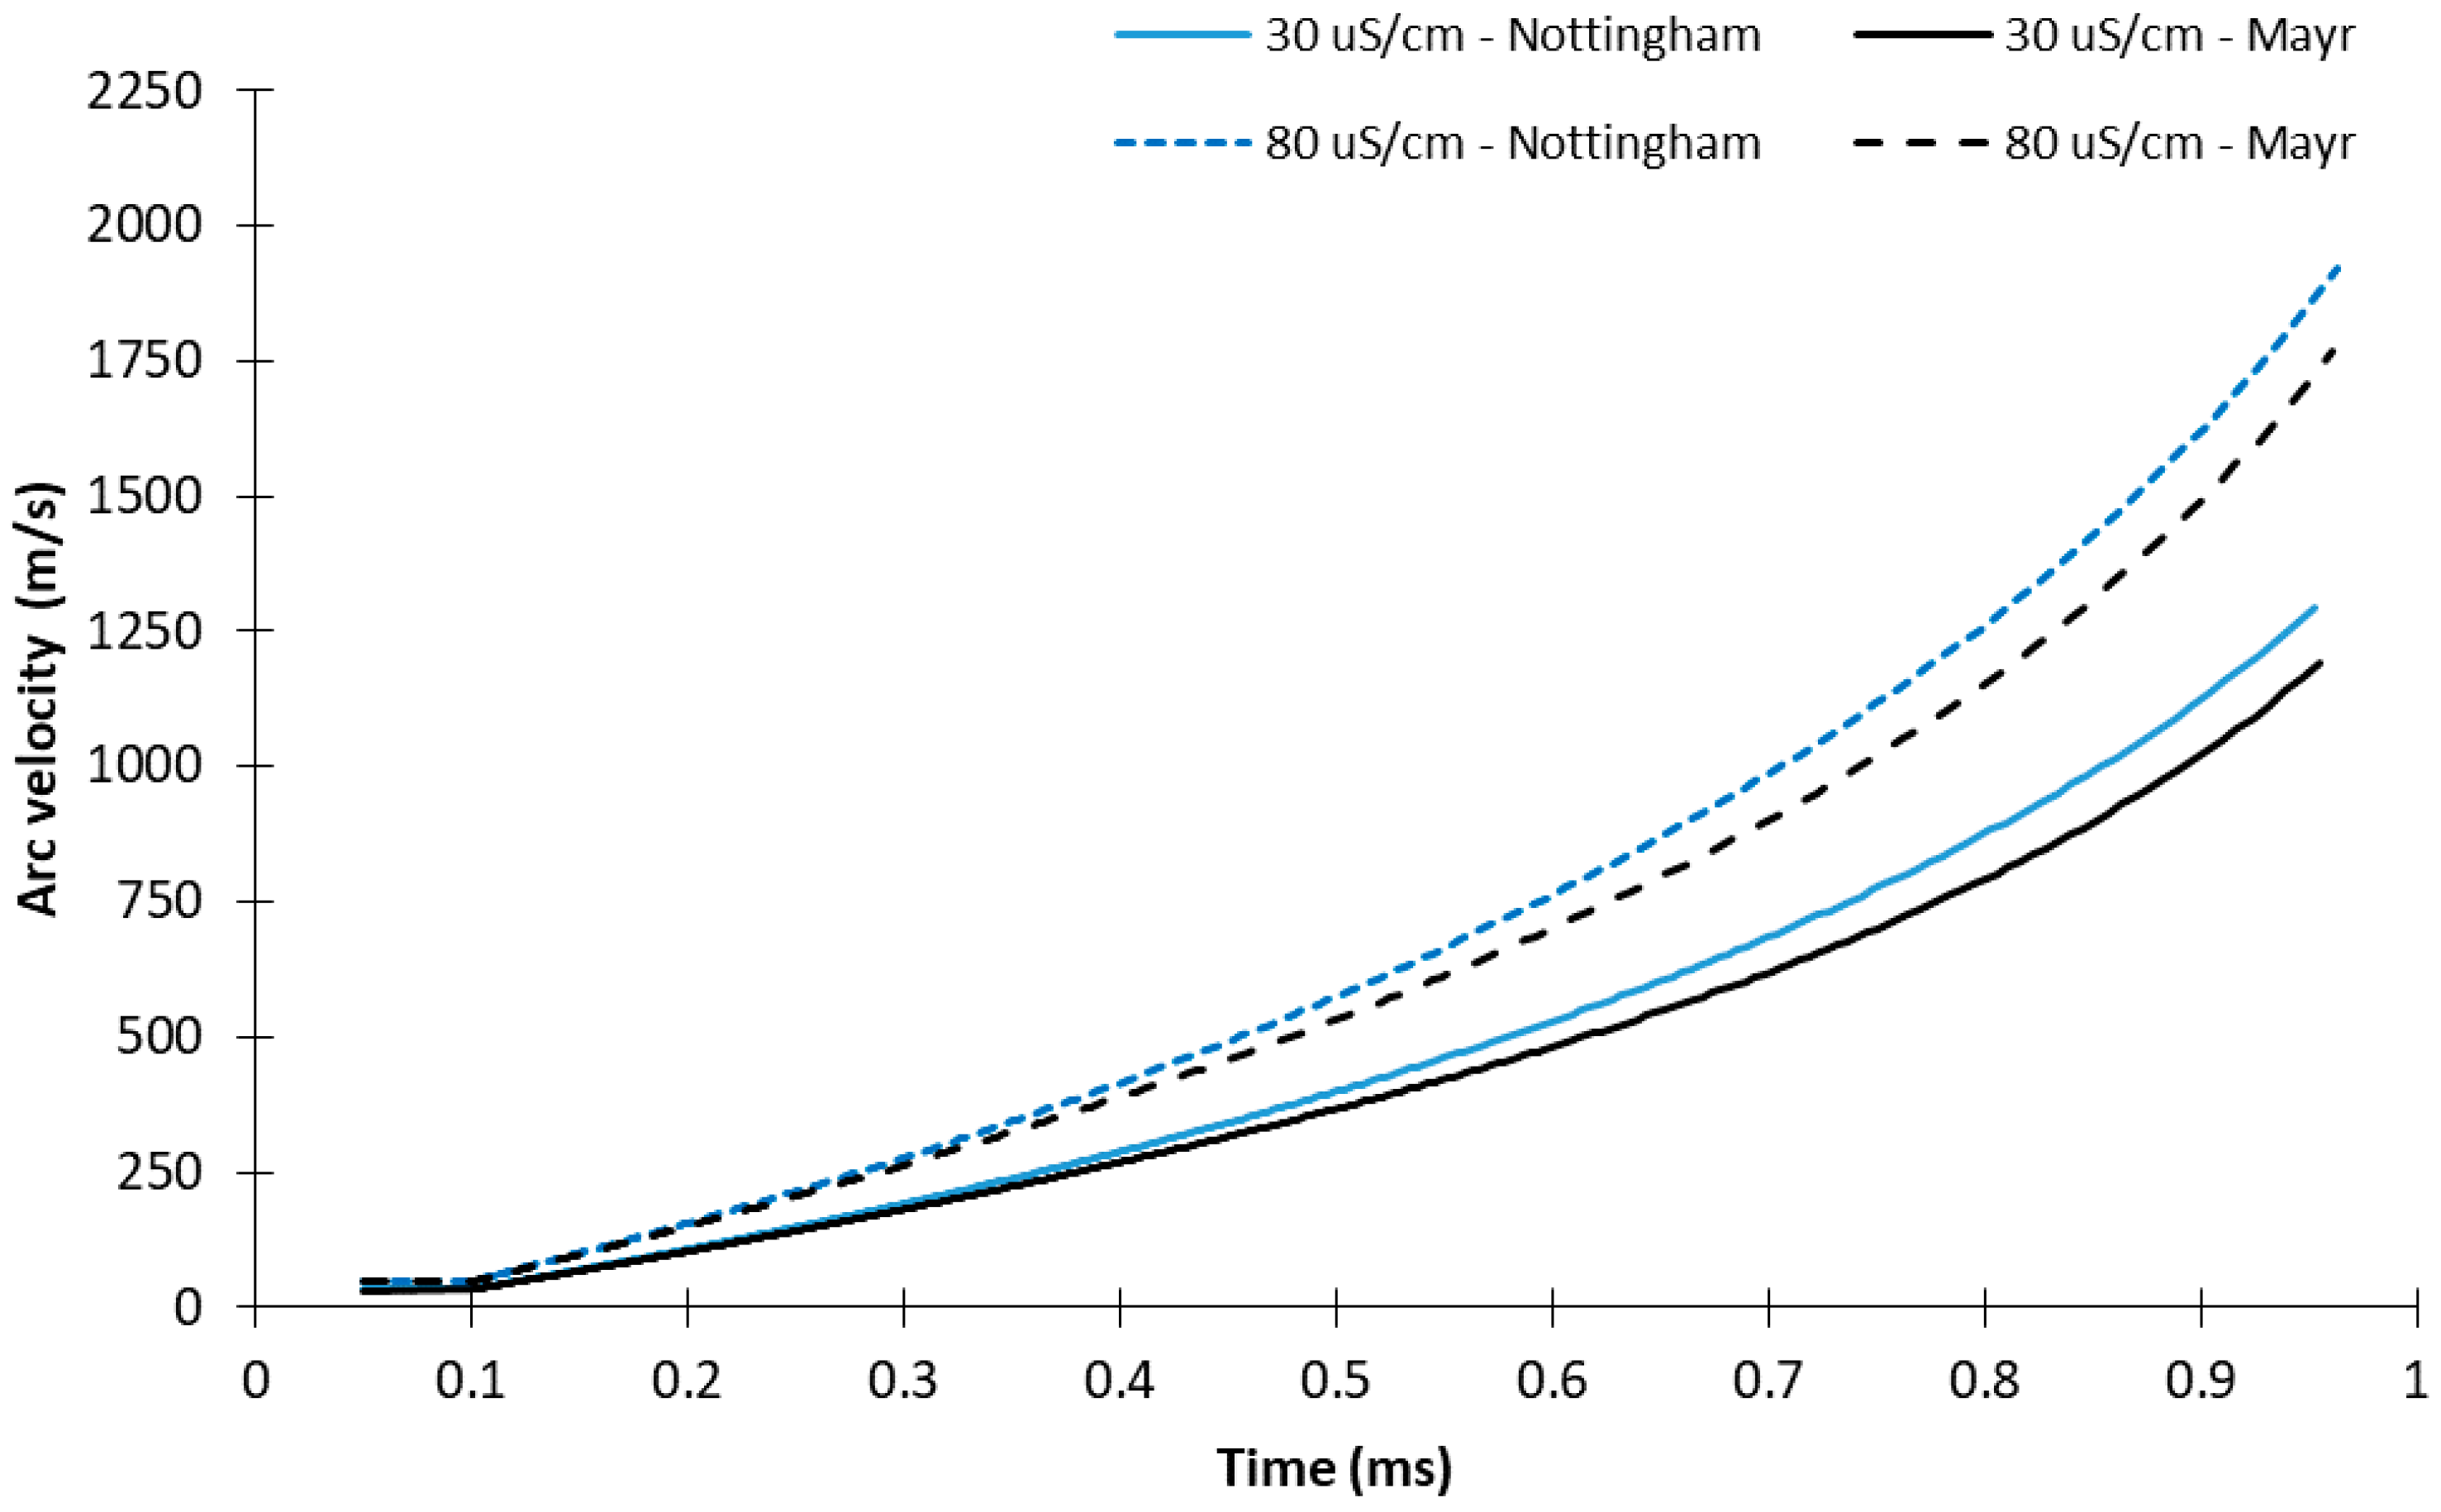
From Figure 12, it can be observed that the evolution of the velocities obtained with Mayr is different from those obtained with Nottingham, with a longer time to flashover for Mayr. In Figure 13, however, the evolutions of the arc velocity as a function of the arc length are closed, as the dynamic aspect is not represented in this figure, with a final value slightly greater for Nottingham. The same observation goes for the evolution of leakage current in Figure 14 but with a difference in the final value of Im, which is higher for Mayr than it is for Nottingham.
Finally, the authors decided to compare the effect of the initial arc length between the Mayr and Nottingham approaches. FOV results are listed in Table 5 for an ice thickness of 1.5 cm, an arcing distance of 202 cm, and a freezing water conductivity of 80 µs/cm. With an average discrepancy of 2.37%, compared to the 1.53% obtained with Nottingham, it can be concluded that the Mayr approach, in the same manner that Nottingham, takes into account the effect of the initial partial arc length.
Figure 15 and Figure 16 present the evolution of the velocity of each partial arc as a function of time and arc length, respectively. The simulations were performed for the same simulation conditions used for an arcing distance of 202 cm and for a freezing water conductivity of 80 µs/cm. As observed previously, the dynamic behavior of the partial arc differs from Mayr and Nottingham with a greater time to flashover with the Mayr approach. However, the arc velocity values obtained with Mayr are in good agreement with those obtained with Nottingham, which is confirmed by the results of Figure 16.

4. Discussion

4.1. Validation of the Bi-Arc Dynamic Numerical Model Results

The obtained results have demonstrated the predicting ability of the proposed bi-arc dynamic numerical model with an average discrepancy of 1.4% for the FOV values (Table 2). In that case, the initial length of the two air gaps were the same and equal to 5 cm in order to respect the experimental conditions used in the literature to determine the FOV of ice-covered post-type insulators. This result can also be compared to that obtained with the authors’ previous bi-arc static numerical model [22] with which an average discrepancy of 4.2% was obtained for the same experimental conditions. This clearly demonstrates that the implementation of the Galimberti arc velocity criterion improves the accuracy of the FOV predictive results. Moreover, this implementation also allows one to compute the velocity of each partial arc during the flashover process, as shown in Figure 7 and Figure 8. Due to the symmetrical configuration of the problem when the two partial arcs present the same initial length, the two partial arcs propagate with the same velocity. This velocity is influenced by the freezing water conductivity and increases with it. This behavior is normal because at higher conductivities, as shown in Figure 9, the leakage current increases affecting directly the Gallimberti criterion, which is current dependent through Equation (10). Additionally, with the increase of arcing distance, the velocity also increases due to the fact that the partial arc has more time to accelerate before flashover occurrence.
When the initial arc length is different, the symmetry of the problem is lost and the partial arcs propagate at different velocities, as shown in Figure 10 and Figure 11. The partial arc with longer initial length is faster with a ratio that is principally influenced by the arcing distance and not by the freezing water conductivity. The effect of the initial arc length can be explained by the capacity Ci of each partial arc calculated by Equation (12). Partial arc capacity is directly dependent on the partial arc length x, thus affecting the determination of the Gallimberti criterion. Although the initial arc lengths affect the partial arc velocities, they do not influence the FOV as illustrated by the predictive results of Table 3 where an average discrepancy of 0.78% is obtained.
As a partial conclusion, it can be observed that the arc velocity criterion proposed by Gallimberti allows one to obtain accurate results in terms of FOV as well as arc velocity determination. In particular, this criterion can take into account the effect of freezing water conductivity, arcing distance, and initial partial arc length during the flashover process. The results obtained using this criterion are in agreement with the experimental observations and results regarding the parameters influenced the dynamic behavior of the partial arcs propagating on the ice surface. However, the lack of experimental measurements of arc velocities makes the arc velocity simulations difficult to validate.
The only available experimental result is the experimental arc velocity criterion given by Equation (8), which expresses the arc velocity a function of its length. This experimental criterion was determined on the average velocity of several partial arcs propagating at the ice surface for arcing distance up to 4.17 m, as reported in [18]. However, in the reported study, the experimental conditions, such as the freezing water conductivity and the initial arc length, were not specified. For example, applying Equation (8) with an arc length of 96 cm yielded a velocity of 1338 m/s. This value can be compared to the final arc velocity value (corresponding to an arc length of 96 cm) of Figure 8 for an arcing distance of 202 cm, which was found to be equal to 1291 m/s for a freezing water conductivity of 30 µs/cm and 1854 m/s for 80 µs/cm. For an arcing distance of 139 cm, the final arc length was 64.5 cm with a velocity of 1042 m/s for 30 µs/cm and 1446 m/s for 80 µs/cm. The velocity value obtained with Equation (8) yielded 191 m/s, which is largely lower than the simulation results. From these results, it seems that the only arc velocity value matching the experimental criterion was obtained for a freezing water conductivity of 30 µs/cm for an arc length close to 1 m. This also indicates that the proposed experimental criterion can only be applied to the specific cases investigated in the study.

4.2. Comparison of Nottingham and Mayr Approaches

The determination of the electric field Earc along the partial arc is important in the determination of the arc propagation based on the Hampton criterion given by Equation (9) and used in the authors’ algorithm calculation. In most of the models for predicting the FOV of polluted and ice-covered insulators, the Nottingham expression given by Equation (2) was used to determine Earc. As demonstrated by the results obtained in the present paper, this approach is accurate and easy to implement as long as the arc constants A and n (Table 1) are correctly determined experimentally. On the other hand, although the Mayr approach expressed by Equation (19) is more difficult to implement in an algorithm, it can facilitate the determination of the flashover parameters by considering the partial arc as an electrical resistance. It can also be used to determine Earc using Equation (20) in order to validate the Hampton criterion.
The comparison of the two approaches performed in this paper demonstrates that the Mayr approach can predict FOV with a relatively good accuracy. However, the results obtained are sensibly less accurate than those obtained by Nottingham with an average discrepancy of 2.4% compared to the 1.2% obtained with the latter. In Figure 12, Figure 13, Figure 14, Figure 15 and Figure 16, it can be observed that Mayr seems to underestimate the final value of the arc velocity by around 7% but overestimates the final value of the leakage current by around 30%. The most significant difference between the two approaches lies in the simulation of the dynamic behavior of the partial arcs in terms of time to flashover, which is longer in the case of Mayr, as can be observed in Figure 12 and Figure 15. This difference can be attributed to the expression of the arc resistance which remains an approximation of the arc behavior, and which was initially developed for polluted insulators [26]. Moreover, the increase in time to flashover obtained with Mayr can be explained by the implementation of the expression of Earc by Equation (20), which is dependent on the arc resistance calculation. However, despite the difference obtained, the results obtained with the Mayr approach can be considered accurate, taking into account the effect of freezing water conductivity in the same manner as the Nottingham approach.

4.3. The Proposition to Extend the Bi-Arc Dynamic Numerical Model to Multi-Arc Flashover Modeling

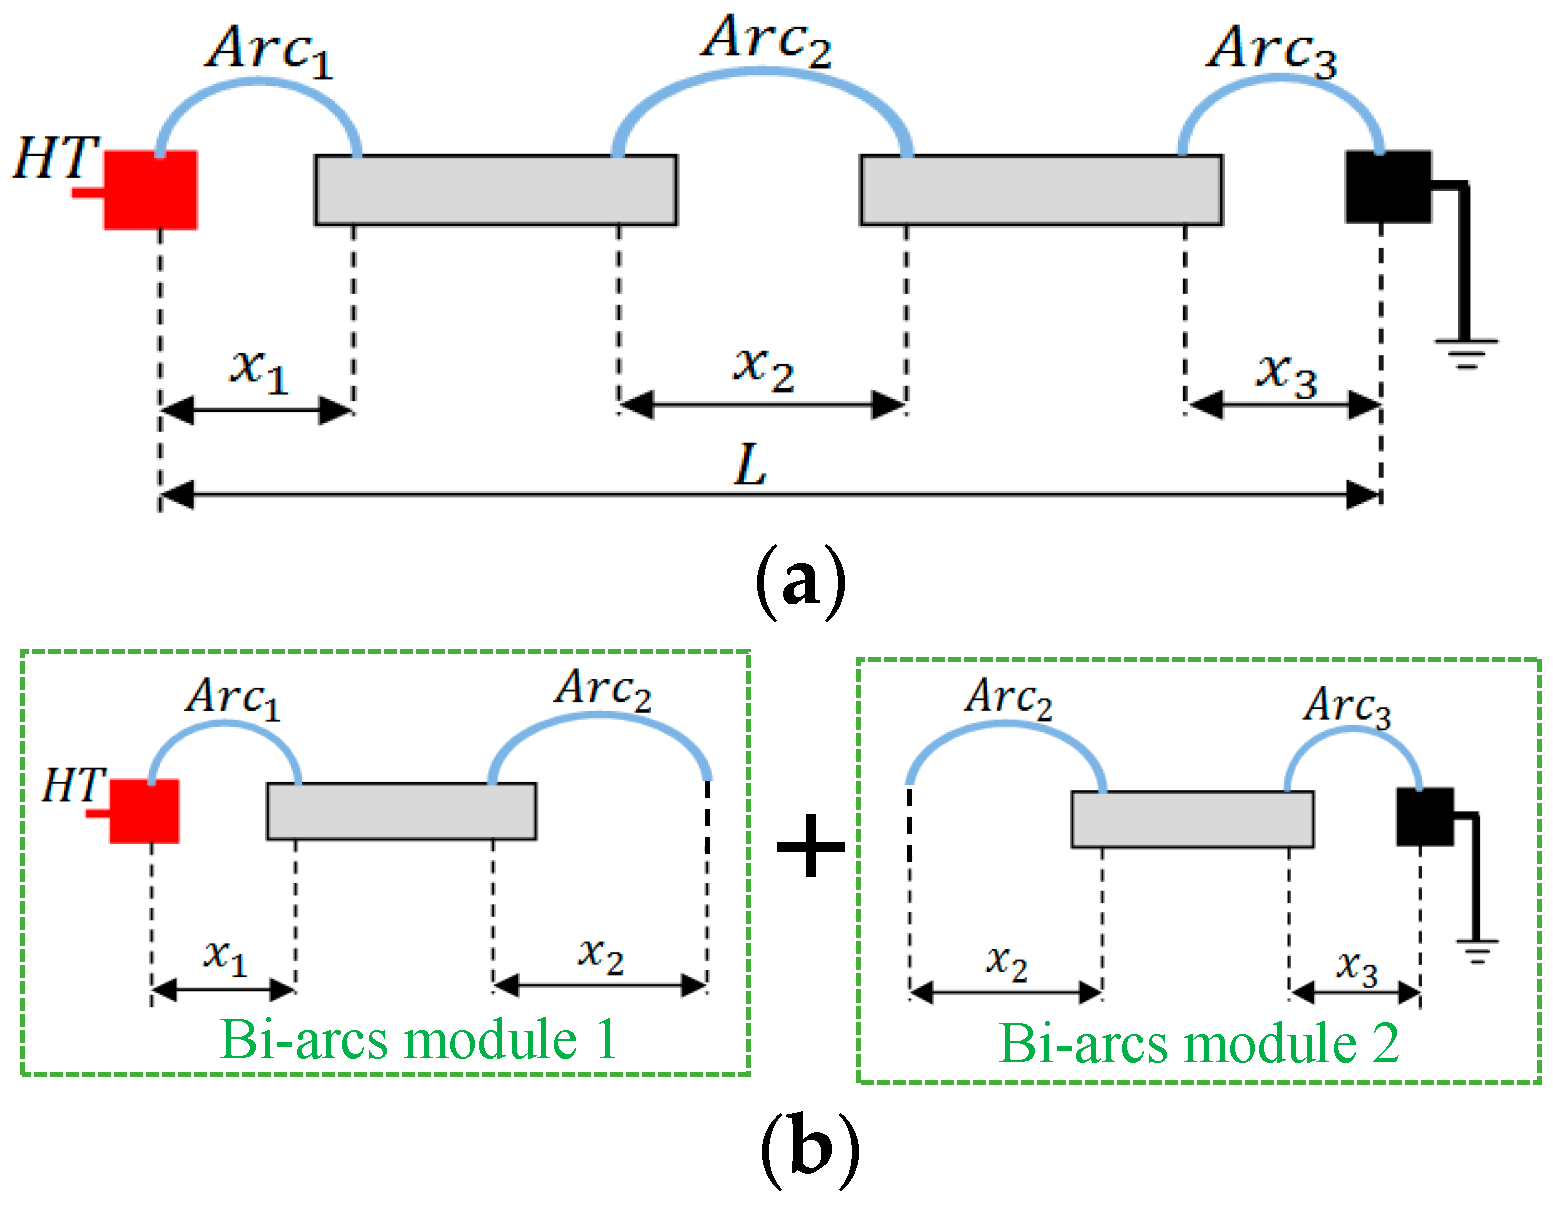
In this section, the possibility to extend the bi-arc dynamic numerical model to a multi-arc flashover process is discussed. As illustrated in Figure 3, the flashover of EHV post-type ice-covered insulators with an arcing distance of up to 4.17 m can be the result of the propagation of three to several partial arcs. In general, when the arcing distance becomes greater than 2.02 m, at least one of the arcs has its two arc roots in contact with the ice layer, as illustrated by Arc2 in Figure 17a. This arc configuration is problematic, as its two arc roots become two equipotential surfaces with floating potentials, adding two unknown values in the electrical circuit. However, this specific constraint can be solved by using the Mayr approach, as given by Equation (19), to model Partial Arc 2 as an electrical resistance.
By using the Mayr approach for Partial Arc 2, the multi-arc model can be divided into several bi-arc modules as illustrated in Figure 17b. The bi-arc calculation algorithm with the implementation of an arc resistance calculation can then be applied to each module. Each bi-arcs module is in series and interconnected through the partial arc with its two arc roots in contact with the ice layer (Arc 2 in Figure 17). Hence, the modules are interdependent; consequently, they have an influence on each other. Figure 18 proposes a calculation algorithm that can be used to develop a new multi-arc dynamic numerical model involving three partial arcs at the ice surface, as shown in Figure 17a. In this example, each bi-arc module calculates the different parameters associated to their respective ice layer section (arc propagation, arc velocity, arc and residual resistances, and Eavg) and exchanges these data to compute the leakage current Im as a function of applied voltage Vm. Once this is done, the algorithm verifies if one of the sections of the ice layer is short-circuited by the two partial arcs (partial flashover obtained). In the negative, the process is repeated until a partial flashover occurs. When this happens, the multi-arc algorithm applies the bi-arc module to the remaining ice section with the two remaining partial arcs. In a general way, when N partial arcs are present at the ice surface with N−2 partial arcs having their two arc roots in contact with the ice layer, N−1 bi-arc modules are required to simulate this problem using the same principle of calculation described previously. In this way, the proposed calculation algorithm of Figure 18 has no limit in terms of the number of partial arcs.
It is important to mention that, as illustrated in Figure 17b, each bi-arc module takes into account the entire length of the partial arc (Arc 2 in the example of Figure 17) in the validation of the arc propagation and arc velocity criteria given by Equations (9) and (10). The length of Partial Arc 2 is important because, as demonstrated by the results of Figure 10 and Figure 11, it has a significant influence on its velocity, in particular. This approach differs from that used in the multi-arc dynamic mathematical model and illustrated in Figure 4 where Partial Arc 2 is divided into two partial arcs of equal length. However, this mathematical model makes use of an experimental arc velocity criterion given by Equation (8), which only allows one to determine the average velocity of the partial arc and not the velocity of each partial arc, as reported in [18]. Moreover, this mathematical model uses the modified Wilkins formulation given by Equation (7), which can only be applied to rectangular geometries, hence limiting considerably its applicability to more complex problems such as polluted insulators.

5. Conclusions

This paper proposes a new bi-arc dynamic numerical model based on the use of commercial finite element software coupled with a generic calculation algorithm. This new model can simulate the final stage of the flashover process of ice-covered insulators resulting from the propagation of two partial arcs at the ice surface. The accuracy of the results obtained, with an average discrepancy of 1.4% for the prediction of FOV, conclusively shows that the implementation of the Hampton and Gallimberti criteria in a modular calculation algorithm can obtain a reliable predictive model. Moreover, thanks to the use of the finite element method, it is now possible to avoid the problem of analytical formulation for the residual resistance calculation, consequently allowing the application of this new bi-arc model to more complex geometries. The second advantage of the proposed model lies in its capacity to simulate the dynamic behavior of each partial arc during the flashover process by determining their respective velocity. This represents a huge improvement in regard to actual bi- and multi-arc dynamic models limited to using an experiment arc velocity criterion. With the new model, it becomes possible to study numerically different flashover scenarios involving two partial arcs in order to optimize the geometry of insulators dedicated to cold regions.
The modularity of the proposed bi-arc model allows for implementation of the formulation of the Mayr approach used to calculate the equivalent electrical resistance of the partial arcs. The results obtained conclusively show that the Mayr approach is sensibly less accurate than the approach proposed by Nottingham, while staying acceptable with an average discrepancy of 3.2% compared to Nottingham for predicting the FOV. The most significant difference lies in the simulation of the arc velocity and leakage current as a function of time that differs from Nottingham in terms of time to flashover and leakage current final value. The implementation of a new approach to calculate the electric field along the arc using the Mayr arc resistance seems to be the main cause. However, this does not seem to affect the FOV results or the final values of the partial arc velocity. As for Nottingham, the Mayr approach allows one to take into account the effect of the freezing water conductivity, the arcing distance, and the initial arc length. Using the calculation of the arc resistance can be helpful to simplify the determination of the parameters of the equivalent electrical circuit of the flashover process when a partial arc has its two arc roots in contact with the ice surface.
Hence, by coupling the implementation of the Nottingham and Mayr approaches, the proposed bi-arc dynamic numerical model can then be used to simulate the flashover process of longer ice-covered EHV post-type insulators involving several partial arcs. The simplicity of the proposed multi-arc dynamic calculation algorithm is based on the use of several bi-arc modules in series where the partial arcs in contact with the HV and ground electrodes are modelled by the Nottingham approach and the partial arc with its two arcs roots in contact with the ice surface by the Mayr approach. The implementation and validation of this multi-arc algorithm will be the subject of future work to propose a new generic multi-arc dynamic numerical model. Such model will be useful for insulator dimensioning under polluted or atmospheric icing conditions presenting complex geometries.

Author Contributions

The results presented in this paper were obtained in the framework of a Ph.D. thesis by M.J., who developed the bi-arcs dynamic numerical model based on previous work by C.V. This Ph.D. study was supervised by C.V., the main supervisor, and I.F., the co-supervisor. All authors contributed to the writing of this paper as well as the analysis of the results.

Funding

This research received no external funding.

Acknowledgments

The authors would like to thank the Natural Science and Engineering Research Council of Canada (NSERC) whose financial support made this research possible.

Conflicts of Interest

The authors declare no conflicts of interest.

References

  1. Khalifa, M.M.; Morris, R.M. Performance of line insulators under rime ice. IEEE Trans. Power Appar. Syst. 1967, PAS-86, 692–698. [Google Scholar] [CrossRef]
  2. Meier, A.; Niggli, W.M. The influence of snow and ice deposits on supertension transmission line insulator strings with special reference to high altitude operation. IEEE Conf. Publ. 1968, 44, 386–395. [Google Scholar]
  3. Kawai, M. AC flashover tests at project UHV on ice- coated insulators. IEEE Trans. Power Appar. Syst. 1970, PAS-89, 1800–1804. [Google Scholar] [CrossRef]
  4. Farzaneh, M.; Chisholm, W.A. 50 Years of Icing Performance of Outdoor Insulators. IEEE Electr. Insul. Mag. 2014, 30, 14–24. [Google Scholar] [CrossRef]
  5. Farzaneh, M.; Chisholm, W.A. Insulators for Icing and Polluted Environments; IEEE Press Series on Power Engineering; John Wiley: Hoboken, NJ, USA, 2009; ISBN 9780470496251. [Google Scholar]
  6. Fikke, S.M. Possible Effects of Contaminated Ice on Insulator Strength. In Proceedings of the 5th International Workshop on Atmospheric Icing of Structures (IWAIS), Tokyo, Japan, 29 October–1 November 1990; pp. 1–4. [Google Scholar]
  7. Makkonen, H.; Komuro, H.; Takasu, K. Withstand voltage characteristics of insulator string covered with snow and ice. IEEE Trans. Power Deliv. 1991, 6, 1243–1250. [Google Scholar]
  8. Farzaneh, M.; Kiernicki, J. Flashover problems caused by ice build-up on insulators. IEEE Electr. Insul. Mag. 1995, 11, 5–17. [Google Scholar] [CrossRef]
  9. Volat, C.; Farzaneh, M. 3-D Modeling of Potential and Electric Field Distributions along an EHV Ceramic Post Insulator Covered with Ice—Part I: Simulations During a Melting Period. IEEE Trans. Power Deliv. 2005, 20, 2006–2013. [Google Scholar] [CrossRef]
  10. Volat, C.; Farzaneh, M. 3-D Modeling of Potential and Electric Field Distributions along an EHV Ceramic Post Insulator Covered with Ice—Part II: Influence of Air Gaps and Partial Arcs. IEEE Trans. Power Deliv. 2005, 20, 2014–2021. [Google Scholar] [CrossRef]
  11. Farokhi, S.; Nekahi, A.; Farzaneh, M. Mechanisms and Processes of Arc Propagation over an Ice-Covered Surface. IEEE Trans. Dielectr. Electr. Insul. 2014, 21, 2634–2641. [Google Scholar] [CrossRef]
  12. Farzaneh, M.; Zhang, J.; Chen, X. Modeling of the AC Arc Discharge on Ice Surfaces. IEEE Trans. Power Deliv. 1997, 12, 325–338. [Google Scholar] [CrossRef]
  13. Farzaneh, M.; Zhang, J. Modeling of DC arc discharge on ice surfaces. IEE Proc. Gener. Transm. Distrib. 2000, 147, 81–86. [Google Scholar] [CrossRef]
  14. Farzaneh, M.; Zhang, J. A Multi-Arc Model for Predicting AC Critical Flashover Voltage of Ice-Covered Insulators. IEEE Trans. Dielectr. Electr. Insul. 2007, 14, 1401–1409. [Google Scholar] [CrossRef]
  15. Farzaneh, M.; Fofana, I.; Tavakoli, C.; Chen, X. Dynamic modeling of dc arc discharge on ice surfaces. IEEE Trans. Dielectr. Electr. Insul. 2003, 10, 463–474. [Google Scholar] [CrossRef]
  16. Tavakoli, C.; Farzaneh, M.; Fofana, I.; Beroual, A. Dynamics and Modeling of AC Arc on Ice Surfaces. IEEE Trans. Dielectr. Electr. Insul. 2006, 13, 1278–1285. [Google Scholar] [CrossRef]
  17. Taheri, S.; Farzaneh, M.; Fofana, I. Improved Dynamic Model of DC Arc Discharge on Ice-covered Post Insulator Surfaces. IEEE Trans. Dielectr. Electr. Insul. 2014, 21, 729–739. [Google Scholar] [CrossRef]
  18. Taheri, S.; Farzaneh, M.; Fofana, I. Dynamic Modeling of AC Multiple Arcs of EHV Post Station Insulators Covered with Ice. IEEE Trans. Dielectr. Electr. Insul. 2015, 22, 2214–2223. [Google Scholar] [CrossRef]
  19. Obenaus, F. Fremdschichtüberschlag und KriechwegLange. Dtsch. Elektrotech. 1958, 4, 135–136. [Google Scholar]
  20. Rizk, F.A.M. Mathematical Models for Pollution Flashover. Electra 1981, 103, 71–78. [Google Scholar]
  21. Wilkins, R. Flashover Voltage of High-voltage Insulators with Uniform Surface-pollution Films. Proc. Inst. Electr. Eng. 1969, 116, 457–465. [Google Scholar] [CrossRef]
  22. Volat, C.; Farzaneh, M.; Mhaguen, N. Improved FEM models of one-and two- arcs to predict AC critical flashover voltage of ice covered insulators. IEEE Trans. Dielectr. Electr. Insul. 2011, 18, 393–400. [Google Scholar] [CrossRef]
  23. Jabbari, M.; Volat, C.; Farzaneh, M. A New Single-arc AC Dynamic FEM Model of Arc Propagation on Ice Surfaces. In Proceedings of the IEEE Electrical Insulation Conference (EIC), Ottawa, ON, Canada, 3–7 June 2013. [Google Scholar]
  24. Jabbari, M.; Volat, C.; Fofana, I. Application of a New Dynamic Numerical Model to Predict Polluted Insulator Flashover Voltage. In Proceedings of the IEEE Electrical Insulation Conference (EIC), Philadephia, PA, USA, 8–11 June 2014. [Google Scholar]
  25. Nottingham, W.B. A new equation for the static characteristic of the normal electric arc. J. Am. Inst. Electr. Eng. 1923, 42, 12–19. [Google Scholar] [CrossRef]
  26. Mayr, O. BeitragzurTheorie der Statischen und der Dynamischen Lichtbogens. Arch. Elektrotech. 1943, 37, 588–608. [Google Scholar] [CrossRef]
  27. Bessedik, S.A.; Hadi, H.; Volat, C.; Jabbari, M. Refinement of Residual Resistance Calculation Dedicated to Polluted Insulator Flashover Models. IEEE Trans. Dielectr. Electr. Insul. 2014, 21, 1207–1215. [Google Scholar] [CrossRef]
  28. Hampton, B.F. Flashover mechanism of polluted insulation. Inst. Electr. Eng. IEE 1964, 111, 985–990. [Google Scholar] [CrossRef]
  29. Bondiou-Clergerie, A.; Gallimberti, I. Theoretical modelling of the development of the positive spark in long gaps. J. Phys. D Appl. Phys. 1994, 27, 1252–1266. [Google Scholar] [CrossRef]
Figure 1. Single arc modeling of flashover proposed by Obenaus.
Energies 11 02792 g001
Figure 2. Example of ice accumulation shape obtained for (a) a porcelain post insulator with an arcing distance L of 103 cm and (b) the corresponding rectangular model geometry used in the flashover model.
Energies 11 02792 g002
Figure 3. Example of ice accumulation shape obtained for an extra-high voltage (EHV) porcelain post insulator under wet grown ice conditions: (a) with the presence of two partial arcs for an arcing distance of 1.36 m; (b) with the presence of three partial arcs for an arcing distance of 2.7 m [14,18].
Energies 11 02792 g003
Figure 4. Illustration of the principle use for modelling multi-arc flashover process of ice-covered EHV insulator: (a) initial model with three partial arcs; (b) equivalent model composed of four single arcs.
Energies 11 02792 g004
Figure 5. Modelling of the bi-arc flashover process of the ice-covered EHV insulator.
Energies 11 02792 g005
Figure 6. Calculation algorithm of the bi-arc dynamic numerical model.
Energies 11 02792 g006
Figure 7. Evolution of partial arc velocity as a function of time for equal initial arc length (x01 = x02) obtained for arcing distances of 139 and 202 cm with freezing water conductivities of 30 and 80 µs/cm.
Energies 11 02792 g007
Figure 8. Evolution of partial arc velocity as a function of arc length for an equal initial arc length (x01 = x02) obtained for arcing distances of 139 and 202 cm with freezing water conductivities of 30 and 80 µs/cm.
Energies 11 02792 g008
Figure 9. Evolution of the leakage current Im as a function of time for an equal initial arc length (x01 = x02) obtained for arcing distances of 139 and 202 cm with freezing water conductivities of 30 and 80 µs/cm.
Energies 11 02792 g009
Figure 10. Evolution of partial arc velocities as a function of arc length for two different initial arc lengths (x01 = 2x02) obtained for an arcing distance of 139 cm with a freezing water conductivity of 80 µs/cm.
Energies 11 02792 g010
Figure 11. Evolution of the partial arc velocities as a function of arc length for two different initial arc lengths (x01 = 2x02) obtained for an arcing distance of 202 cm with a freezing water conductivity of 80 µs/cm.
Energies 11 02792 g011
Figure 12. Evolution of partial arc velocities as a function of time between the Nottingham and Mayr approaches for an arcing distance of 202 cm and the same initial arc length (x01 = x02).
Energies 11 02792 g012
Figure 13. Evolution of partial arc velocities as a function of the arc length between the Nottingham and Mayr approaches for an arcing distance of 202 cm and the same initial arc length (x01 = x02).
Energies 11 02792 g013
Figure 14. Evolution of leakage current Im as a function of arc length obtained with the Nottingham and Mayr approaches for an arcing distance of 202 cm and the same initial arc length (x01 = x02).
Energies 11 02792 g014
Figure 15. Evolution of the each arc velocity as a function of time with the Nottingham and Mayr approaches for an arcing distance of 202 cm, a freezing water conductivity of 80 µs/cm, and an initial arc length x01 = 2x02.
Energies 11 02792 g015
Figure 16. Evolution of the each arc velocity as a function of arc length with the Nottingham and Mayr approaches for an arcing distance of 202 cm, a freezing water conductivity of 80 µs/cm, and an initial arc length x01 = 2x02.
Energies 11 02792 g016
Figure 17. Examples of decomposition of a multi-arc problem with several bi-arc modules: (a) multi-arc models of arcing distance L with three partial arcs and (b) decomposition of the model in two bi-arc modules.
Energies 11 02792 g017
Figure 18. Principle of the calculation algorithm developed for the numerical dynamic multi-arc models in the case of three partial arcs present at the ice surface.
Energies 11 02792 g018
Table 1. Simulation parameters obtained under AC applied voltage used for the bi-arc dynamic numerical model [3,4,5].
ParametersValue
A204.7
n0.561
Ve0
B0.875
α0.0675
β2.45
K11118
K21300
b0.528
Table 2. Flashover voltage (FOV) obtained with the new numerical dynamic bi-arc model for a freezing water conductivity of 80 µs/cm.
Ice Thickness (cm)σ (µs/cm)Experimental FOV (kVrms)Numerical Dynamic FOV (kVrms)Absolute Discrepancy (%)
Arcing distance of 139 cm
1.530130130.40.31
1.580120117.12.17
280120124.03.3
Arcing distance of 202 cm
1.530190189.00.53
1.580161160.30.43
280150147.51.67
Table 3. Effect of initial arc length on the FOV predictive results for freezing water conductivity of 80 µs/cm.
Ice Thickness (cm)σ (µs/cm)FOV for x01 = x02 (kVrms)FOV for x01 = 2x02 (kVrms)Absolute Discrepancy (%)
Arcing distance of 139 cm
1.530130.4130.70.23
1.580117.1117.50.34
Arcing distance of 202 cm
1.530189.0187.20.95
1.580160.3157.71.61
Table 4. FOV predictive results obtained with the Nottingham and Mayr approaches for an ice thickness of 1.5 cm and the same initial arc length (x01 = x02).
σ (µs/cm)Experimental FOV (kVrms)FOV with Nottingham (kVrms)FOV with Mayr (kVrms)Absolute Discrepancy
(%)(%)
Arcing distance of 139 cm
30130130.4136.40.314.92
80120117.1125.02.174.17
Arcing distance of 202 cm
30190189.0191.00.530.53
80161160.3160.80.430.12
Table 5. FOV predictive results obtained with the Nottingham and Mayr approaches for an ice thickness of 1.5 cm and for different initial arc lengths (x01 = 2x02).
σ (µs/cm)Experimental FOV (kVrms)FOV with Nottingham (kVrms)FOV with Mayr (kVrms)Absolute Discrepancy
(%)(%)
Arcing distance of 139 cm
30130130.7132.30.531.77
80120117.5122.82.082.33
Arcing distance of 202 cm
30190187.2182.71.473.84
80161157.7163.52.051.55