Experimental Study on the Performance of a Household Dual-Source Heat Pump Water Heater


1
School of Energy and Environmental Engineering, Hebei University of Technology, Tianjin 300401, China
2
Department of Comprehensive Management, CNOOC Energy Conservation & Environmental Protection Service Co., Ltd., Tianjin 300452, China
*
Authors to whom correspondence should be addressed.
Energies 2018, 11(10), 2811; https://doi.org/10.3390/en11102811
Submission received: 29 September 2018
/
Revised: 15 October 2018
/
Accepted: 17 October 2018
/
Published: 18 October 2018
Abstract
:A household dual source heat pump water heater is proposed to utilize the energy of wastewater and air heat in a bathroom. The heat pump system integrates a wastewater source heat pump (WSHP), air source heat pump (ASHP), and a preheater. This aims at energy saving through recovering the heat of wastewater and ventilation air during the bathing process. The experiment was conducted to verify the feasibility of a dual heat source heat pump water heater system in a bath unit. It is found that the system can achieve an average coefficient of performance (COP) of 4.80 and 4.38 with and without preheater, respectively. At a bath water temperature of 40 °C, a flow rate of 6 L/min, and a room temperature of 26.5 °C, the COP of system can reach 6.08, which shows a significantly promising method for energy saving in-house.
1. Introduction
Energy is essential for the development of societies and economies of the world. Nowadays, worldwide energy consumption is rapidly increasing [1]. Most of all, in cold areas, the energy consumption of supplying heat and hot water for building accounts for 23.0% and 23.4% of the total building energy consumption, respectively [2]. Thus, recycling excess heat from the process of supplying heat can significantly augment economic and environmental benefits. Based on this situation, many studies on waste heat recovery have been put forward over the past decade [3]. Heat pump (HP) technology for renewable energy has been used in developed countries for many years. HP has become more popular, due to its relative high energy efficiency and environmental friendliness [4]. HPs are usually comprised of a water-source heat pump (WSHP), a ground-source heat pump (GSHP) [5,6], an air-source heat pump (ASHP) [7], a dual-source heat pump (DSHP), etc. [8].
ASHP is commonly used in temperate climate zones of Europe and Asia. The COP of ASHP is very low, and it is not widely used in cold weather; thus, Wang et al. [9] developed a novel frost-free ASHP system, which integrated with dehumidification and thermal energy storage. It greatly improves the average COP of the system at low temperature. Arkadiusz et al. [10] built a system for domestic hot water (DHW) production based on an air-source heat pump with an integrated tank, and obtained a system efficiency of 2.43. Two experimental cases with two-working-circuit and three-working-circuit outdoor coils were conducted based on frost accumulation. The result shows that defrosting efficiency was improved by about 6.08%, from 42.26% to 48.34% [11]. An ASHP system with two-stage variable capacity was reported. It was noticed that for the cooling mode, the COP varied from 4.7–5.7 [12]. Su et al. [13] modeled the internal parameter distribution and variation of the heat recovery condenser. Approximately 70% of the area of the heat recovery condenser was in the two-phase region, and there was less than 50% heat exchange, but more than 80% pressure loss. Shen et al. [14] put forward an air source heat pump running under two modes for drying. With the ambient temperature increasing, the difference of electric power between the two modes increased, and the difference the supplied air temperature decreased. A R744–R717 cascade refrigerating system was operated at −50 °C (evaporation) and 40 °C (condensation) [15]. Moreover, in Denmark, a combined PV–ASHP system is utilized to meet heating and electricity requirements of a housing project. In addition, the system can charge the soil storage medium in summer months, when excess electric power was generated [16]. Li et al. [17] presented a numerical model to predict the performance of a typical ASHP system in the capital of Tibet in China. The theoretical analysis indicates that the low relative humidity can improve the performance of the ASHP system, while the occurrence of frost is hard to find on an air-side heat exchanger. The study results of finned tube heat exchangers (FTHXs) demonstrated that the frost accumulated on an FTHX could be divided into two parts. One accumulated on the edge of the windward fins, and the other on the surfaces of the fins and tubes [18]. Studies of heat pump water heater showed that the overall COP was maximized at higher ambient temperatures and at lower hot water temperatures [19]. The used methods can improve the COP of ASHP, but can increase complexity and instability, and the cost and maintenance of the system operation.
Besides the usage of the air source, the heat pump can also adopt a water source [20]. Wastewater heat recovery plays an important role in energy saving and environmental protection [21]. WSHP is used in large public places, such as schools, barracks, and swimming pools, to recover wastewater heat [22,23]. A multifunctional heat pump system was designed to be practical and to provide significant energy savings in building heating and hot water supply [24]. The study of a water source heat pump system showed that tap water flowrate has a negligible influence on the maximum heating capacity, while the higher water-source temperature can greatly increase the heating capacity [25]. Evan et al. [26] presented a hybrid heat pump water heater (HPWH) using renewable energy and an instantaneous shower power supply control. The water heater has the potential to save 23.4% of energy and 19 L water per day. Energy level theory was employed to improve the WSHP system by using the relationship among the building, the circulating water, and the unit [27]. Zhao et al. [20] put forward a water-source heat pump water heat system. In the system, the COP reaches a maximum of 3.25 at a water temperature of 40 °C, and the power consumption was 2.7 kW.
Heat energy cannot be fully recovered by individual air-source or water-source heat pumps. A dual source heat pump system, coupled with ASHP and GSHP combined with a solar collector, was carried out [28]. A new type of PV/T-air dual source heat pump water heater was proposed, which adopted the connection method of a PV/T evaporator and an air source heat pump in parallel, to ensure the efficient operation of the heat pump water heater in different environments [29]. Investigation shows that the temperature of bathing wastewater is high, with a large amount of waste heat loss. Thus, the potential of waste heat recovery in residential water bath is enormous [30].
To the best of our knowledge, few studies on household dual-source heat pumps have been performed. Our previous article simulated the impact of wastewater temperature and flow rate on the performance of a household dual source (air-water) heat pump water heater, based on Aspen Plus [31]. Simulation results showed that under the conditions of 25 °C air temperature, 70% relative humidity, 35 °C wastewater temperature, 0.07 kg/s tap water flow, 15 °C tap water temperature, 48.74 °C condensing temperature, and 14.96 °C evaporation temperature, the COP of the system reached 9.784. In this paper, for comparison, a household dual source heat pump water heater system was designed and built for a bathroom unit. The experimental research was carried out to analyze the influences of the preheater, the bath water temperature, the flow rate, the air temperature, and the air source evaporator on the performance of system.
2. Experimental Setup
2.1. System Design
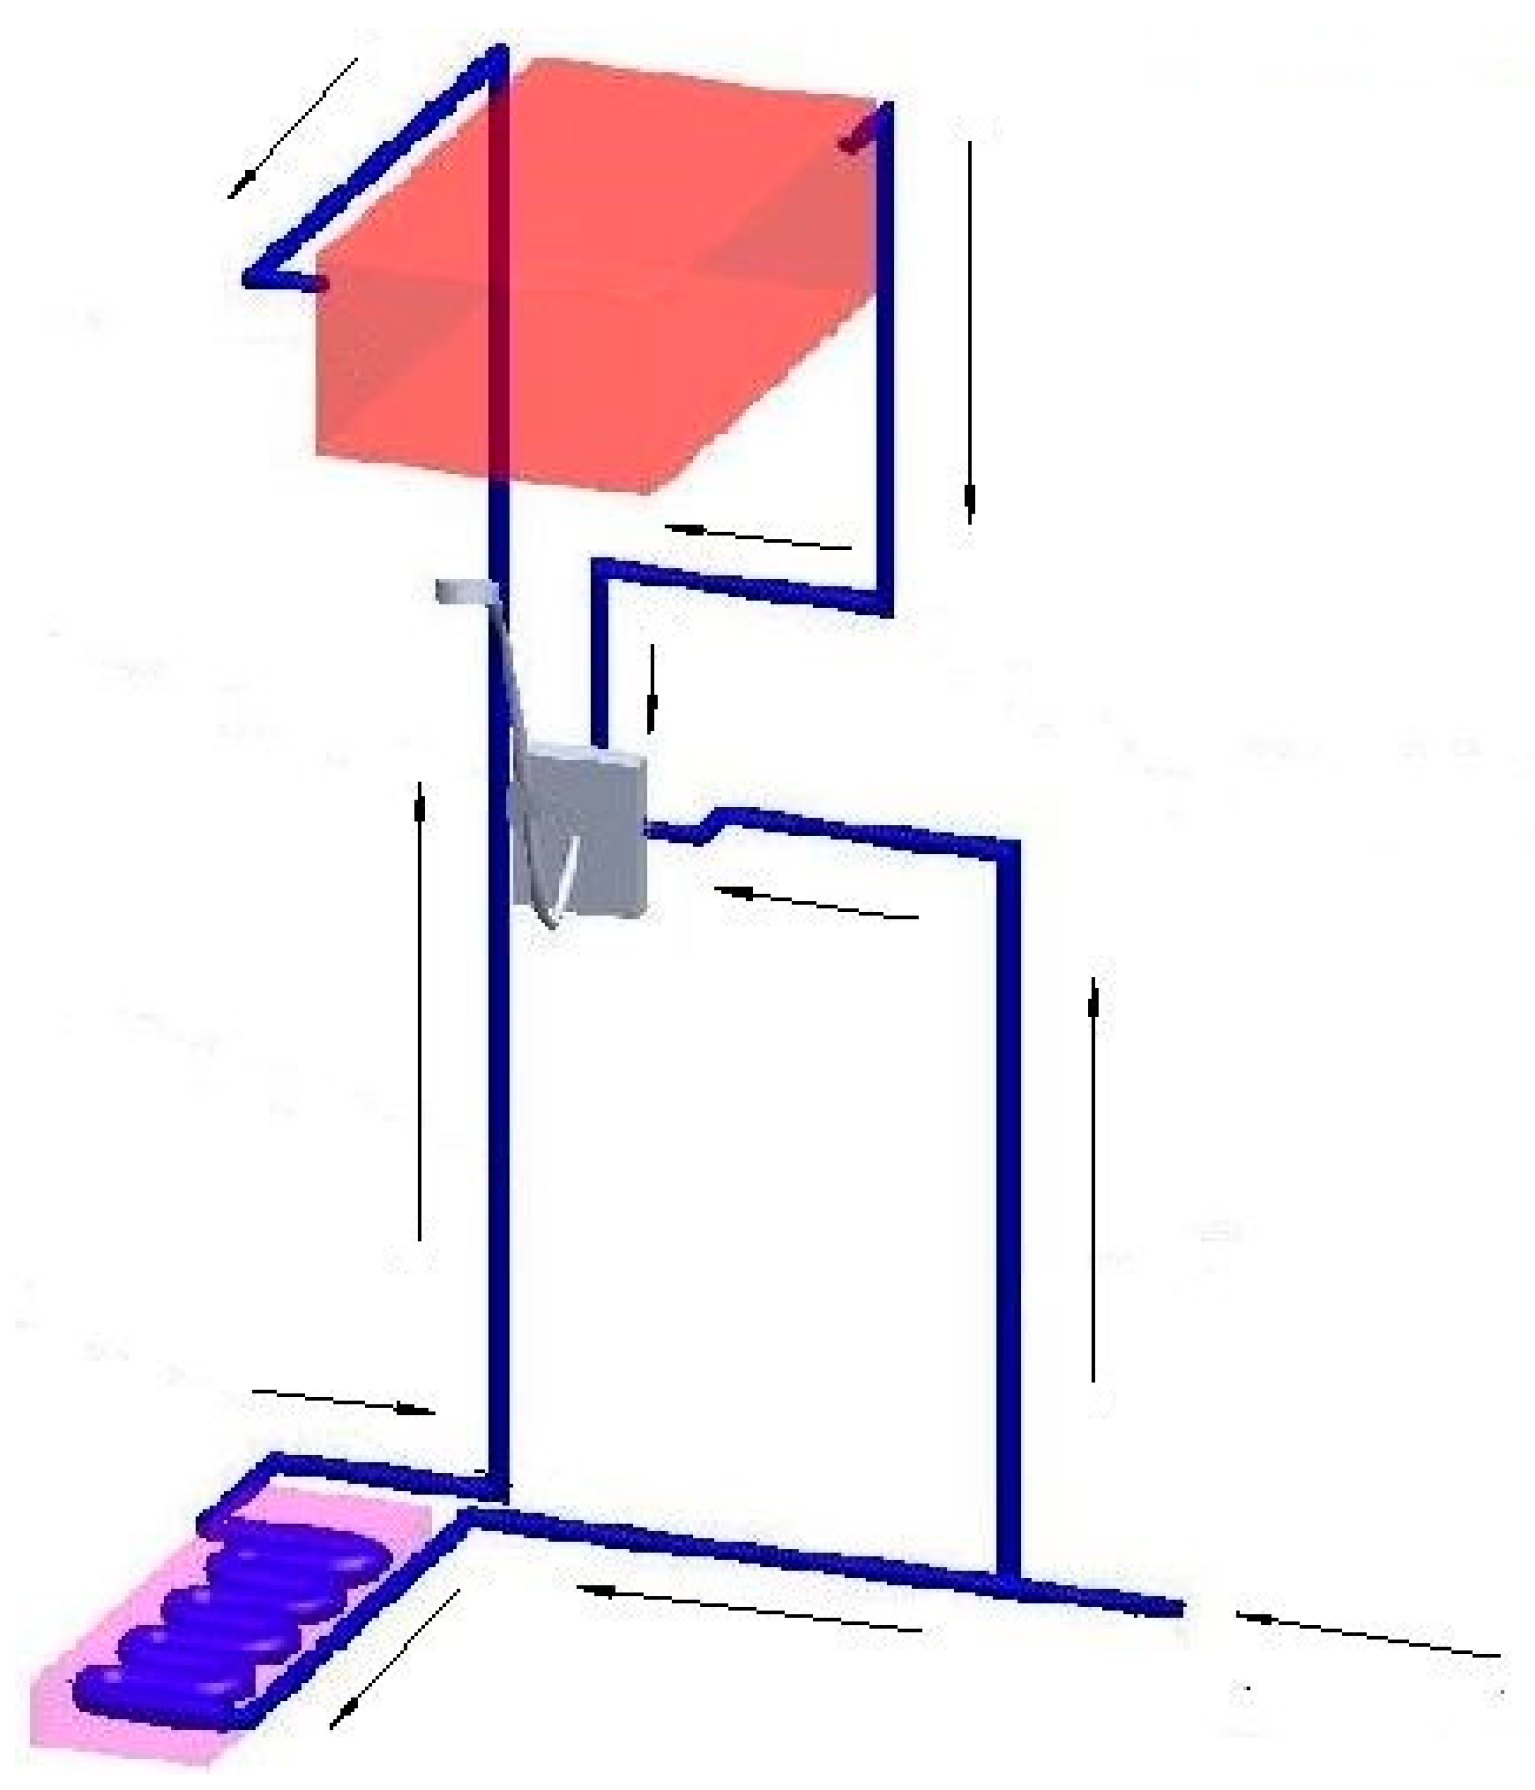
As shown in Figure 1, the evaporator and preheater of the wastewater source were located at the bottom of the unit to recover the heat of the bathing wastewater. The position of the compressor was placed in a corner. A Water mixer with a control panel was installed in the middle. The condenser and air source evaporator were positioned on the top for heating the bath water, and recovering the heat from air ventilation.
In Figure 2, the refrigerant passes through the compressor and becomes a superheated steam. After the refrigerant is cooled to a saturated or supercooled state in the condenser, it enters the thermodynamic expansion valve to become a gas-liquid phase flow. Finally, the refrigerant absorbs heat in the air source evaporator and the wastewater source evaporator to become a low-pressure superheated steam, and then flows to the compressor. Thus, the circulation of the working fluid is completed.
As shown in Figure 3, tap water has two routes. One enters the water mixer, and the other passes through the preheater, and the condenser to the mixer. The waste heat from air ventilation is recovered by the air source evaporator, and wastewater is departed from the wastewater outlet after passing through the preheater and the wastewater evaporator.
2.2. System Construction
Base on the system design, the components of system such as the immersed coil preheater, condenser, air source evaporator, wastewater source evaporator, compressor, and expansion valve were arranged in an integrated framework, as shown in Figure 4. In addition, taking the temperature range of household water heater into account, R134a was chosen as the refrigerant.
2.3. Experimental Cases
In the experiment, a cooling device was arranged at the mixer outlet to simulate the temperature drop of the bathing process. The cooling device dropped the water temperature by 5 °C, and then allowed the water to enter the bathroom floor drain. The experimental data, including the power consumption, bath water flow rate, and the temperatures of bath water, wastewater, and air, are recorded after 30 min under the stable conditions presented in Table 1.
Case 1: The bath water flow rate is 5 L/min and its temperature varies from 35 to 42 °C. Air temperature is 22.9 °C, and the wastewater temperature is 30–37 °C, dropped by 5 °C. The performance of system is observed with and without a preheater.
Case 2: The bath water temperature is 40 °C, wastewater temperature 35 °C, and air temperature 22.9 °C. The bath water flow rate varies in the range of 4–6 L/min. The performance of system is observed with and without preheater.
Case 3: The preheater is opened, keeping a bath water flow rate at 5 L/min at the air temperatures of 19.4 °C, 22.9 °C, and 26.5 °C. The bath water temperature is allowed to vary from 35 to 42 °C, thus the wastewater temperature range is 30–37 °C. The influence of bath water and air temperature on the performance of system is obtained.
Case 4: The preheater is opened, keeping the bath water temperature at 40 °C at the air temperatures of 19.4 °C, 22.9 °C, and 26.5 °C. The bath water flow rate is allowed to vary from 4 to 6 L/min. The influence of bath water and air temperature on the performance of system is observed.
Case 5: The preheater is opened with 5 L/min bath water flow rate and at an air temperature of 22.9 °C. The bath water temperature is allowed to change from 35 to 42 °C; hence, wastewater temperature is dropped by 5 °C to reach 30–37 °C. The performance of system is observed with and without an air source evaporator.
Case 6: The preheater is opened at a bath water temperature of 40 °C, wastewater temperature of 35 °C, and air temperature of 22.9 °C. The bath water flow rate range is 4–6 L/min. The performance of system is observed with and without an air source evaporator.
3. Results and Discussion
3.1. Performance Indicators
The COP of the system was calculated with Equations (1) and (2):
where Qtotal is the system total heat capacity (kW); Qcond and Qpreheater denote the heat transfer of the condenser and preheater (kW), respectively; C represents the specific heat of water (kJ/(kg·°C)); ρ stands for the density of water (kg/m3); V is the volume flow of water (m3/s); Δt represents the temperature difference between the condenser water and the tap water (°C); W is the measured power consumption (kW).
3.2. Influence of the Preheater on the System
In terms of Case 1, as shown in Figure 5, with the increase of bath water temperature and power consumptions with and without a preheater rise, power consumption with the preheater is lower than that without the preheater. The results show that the average power consumption is 1.49 kW without preheater, while it is 1.35 kW with preheater, reduced by 9.4%.
The COP of the system increased with the increasing bath water temperature, as shown in Figure 6. The power consumption with the preheater was lower than that without the preheater. The COP of the system with the preheater was higher than that without the preheater. The results illustrate that the average COP without the preheater was 4.21, while it was 4.61 with a preheater, and increased by 9.5%.
As for Case 2, as shown in Figure 7, the power consumption increased gradually with the increasing bath water flow rate. However, the power consumption with preheater was clearly lower than that without the preheater. The results exhibit that the average power consumption without the preheater was 1.49 kW, while it was 1.35 kW with the preheater, with a reduction of 9.4%.
The COP of the system was enhanced directly by the increasing bath water flow rate, as shown in Figure 8. The COP of the system with a preheater was higher than that without a preheater. The average COP of the system without a preheater was 4.54, while it was 4.99 with a preheater, with an increase of 9.9%.
3.3. Influence of Bath Water and Air Temperatures on the System
In Case 3, as shown in Figure 9, the total heat capacity of the system increased as the bath water temperature rose. The total heat capacity was calculated at three different air temperatures, 19.4 °C, 22.9 °C, and 26.5 °C. The increasing air temperature slightly enhanced the total heat capacity in the bath process. The average total heat capacity of the system was about 6.25 kW.
In Figure 10, the power consumption increased with the rise of bath water temperature at a constant air temperature, while it decreased with the rise of the air temperature at a constant bath water temperature. The reason is presented below. With the constant bath water temperature and the increase of air temperature, the condensation pressure was almost constant, and the evaporation temperature and pressure were increased; thus compressor pressure ratio was reduced, volumetric efficiency was enhanced, and enthalpy difference was declined, resulting in a lower power consumption. With the constant air temperature and the increase of the bath water temperature, the condensation temperature and pressure were increased, wastewater temperature increased as well, resulting in an increase of evaporation temperature and pressure. However, the difference of power consumption from the increase of condensation pressure was bigger than that from the decrease of evaporation pressure, leading to an increase of power consumption. The results show that the average power consumptions are 1.38 kW, 1.35 kW, and 1.33 kW, with air temperatures of 19.4 °C, 22.9 °C, and 26.5 °C, respectively.
As shown in Figure 11, the COP of system increased with the rise of the bath water temperature at a constant air temperature, but it increased slightly with the rise of air temperature at a constant bath water temperature. The air temperature has little effect on the total heat capacity. With the increase of the system power consumption, the increase of total heat capacity was more than the rise of power consumption, which lead to a higher COP of the system. The results reveal that at the air temperatures of 19.4 °C, 22.9 °C, and 26.5 °C, the average COPs of the system were 4.53, 4.61, and 4.70, respectively. It can be seen that air temperature had little influence on the COP of system, but that bath water temperature had a greater influence on the COP of system. At an air temperature of 22.9 °C, the maximum and minimum COPs of the system were 5.44 and 3.75, respectively.
3.4. Influence of the Bath Water Flow and Air Temperature on the System
In Case 4, as shown in Figure 12, with an increase of bath water flow rate, total heat capacity increases. It was found that with the increase of air temperature, the total heat capacity of the system was slightly higher. The results illustrate that the average total heat capacity of system was 6.75 kW.
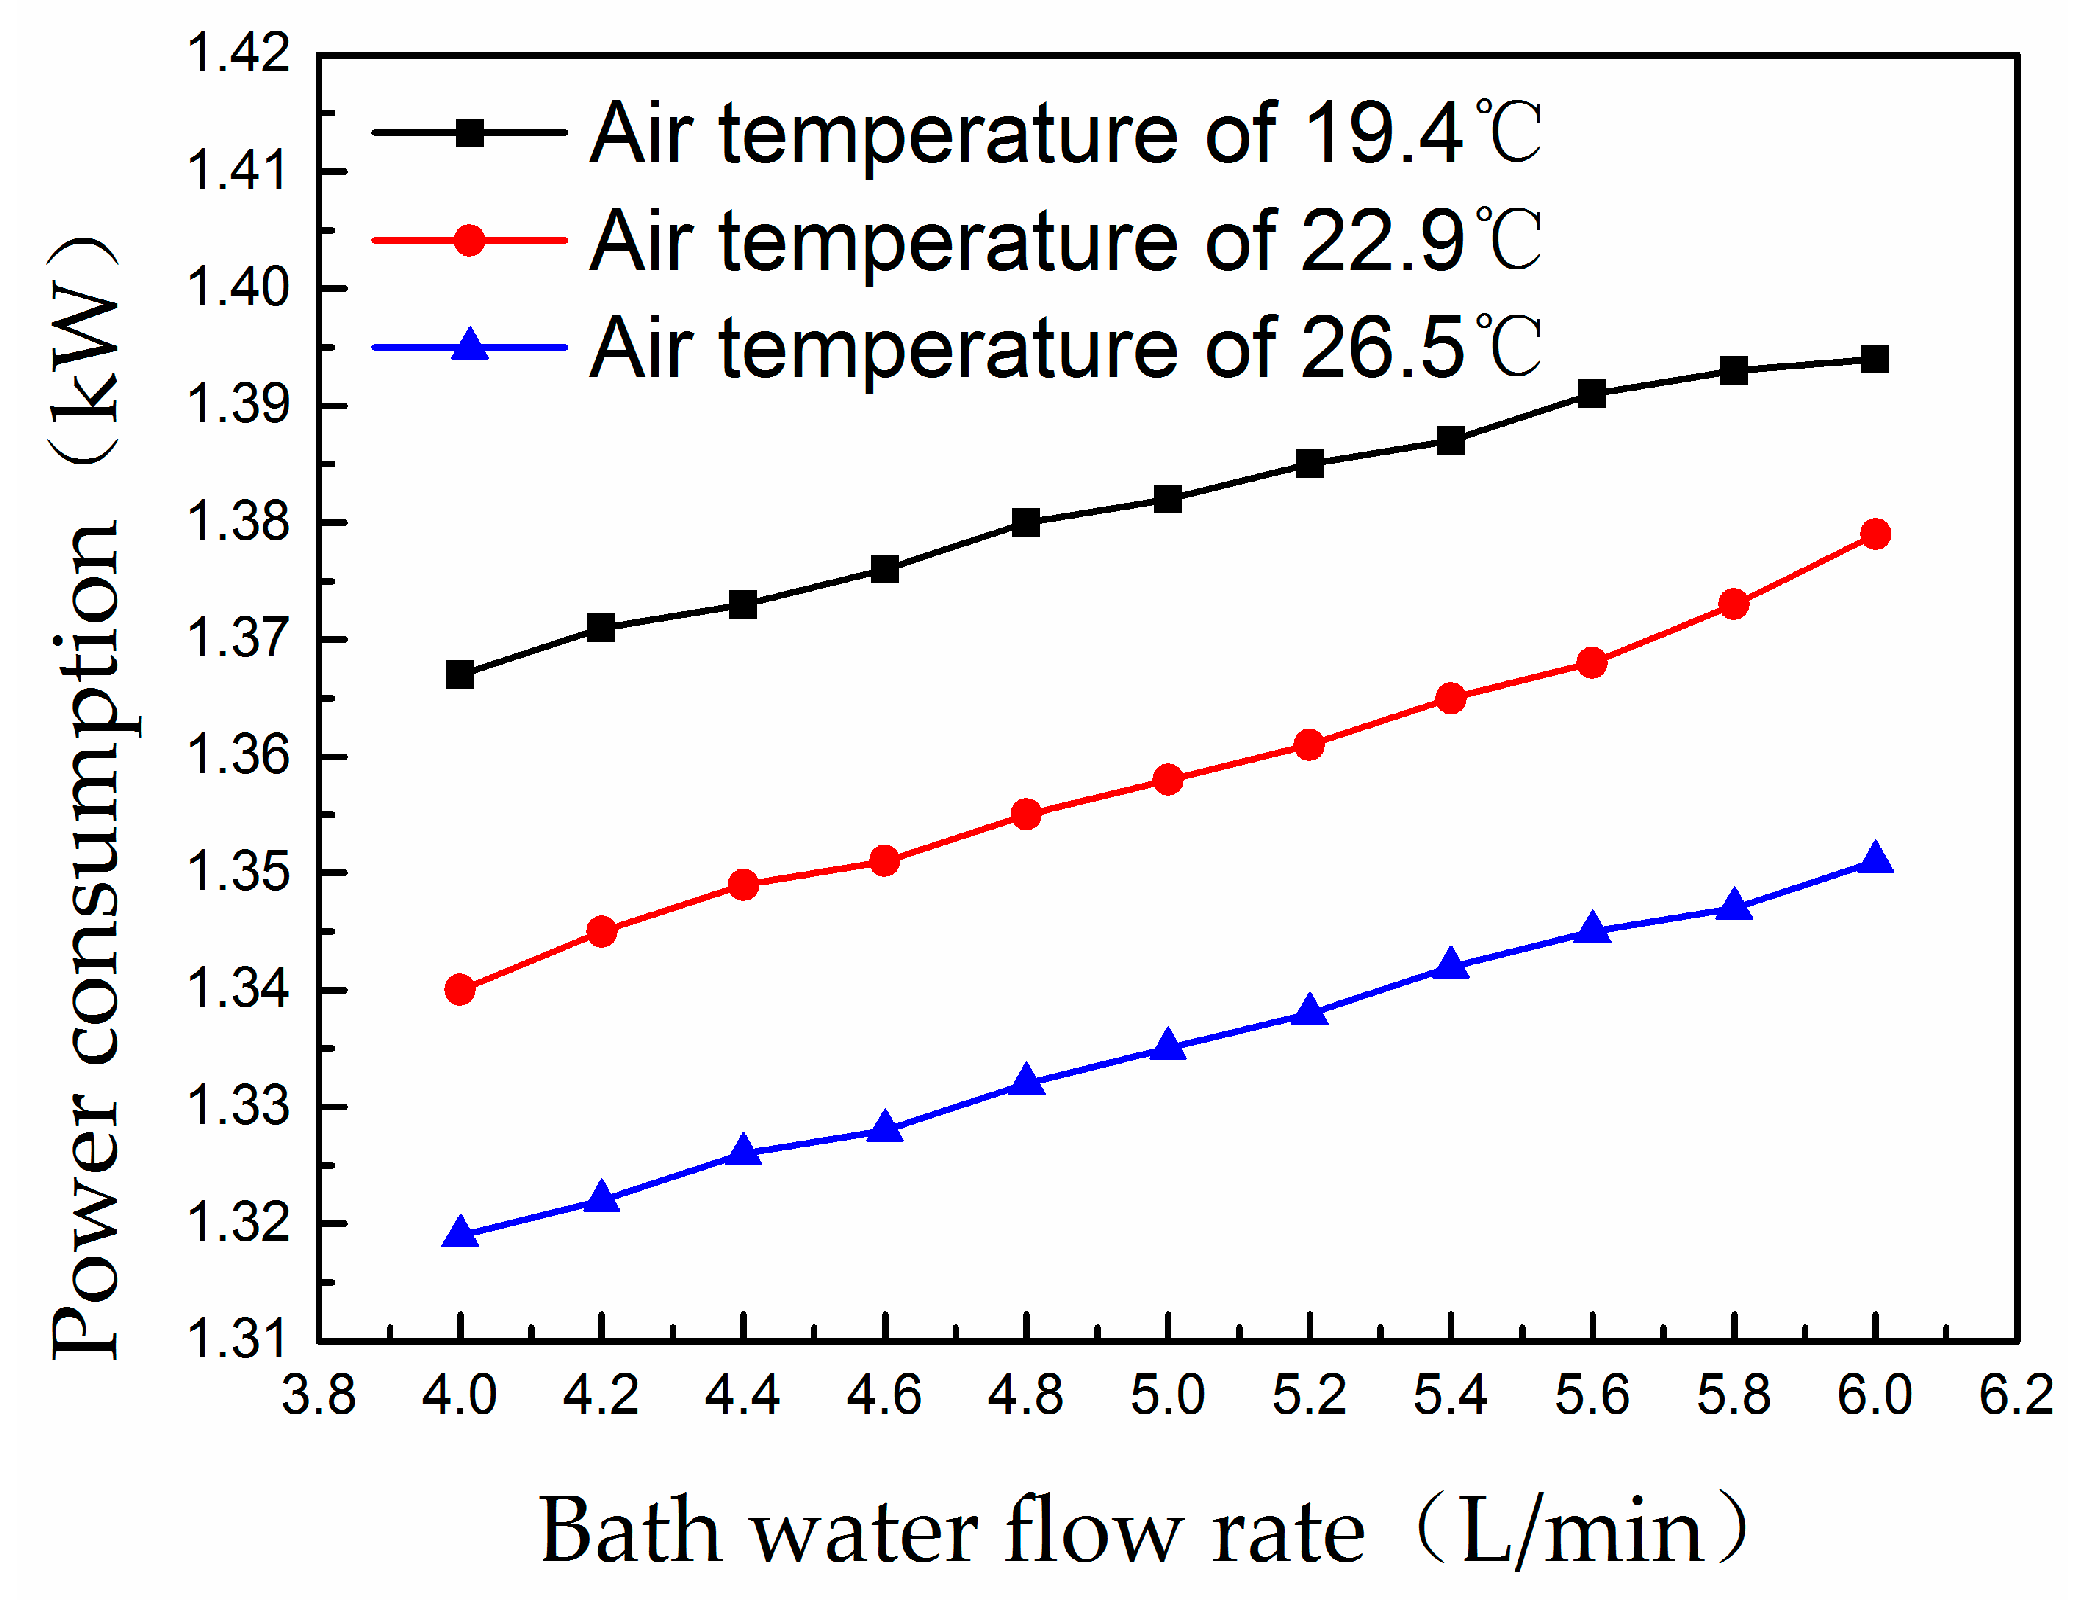
Figure 13 shows the power consumption increases with the rise of bath water flow rate at a constant air temperature, but decreases with the rise of air temperature at a constant bath water flow rate. The results exhibit that the average power consumptions were 1.38 kW, 1.35 kW, and 1.33 kW at air temperatures of 19.4 °C, 22.9 °C, and 26.5 °C, respectively. In the range of working conditions, the influence of air temperature was lower than that of the bath water flow rate.
The COP of the system increased with the rise of bath water flow rate at a constant air temperature, but it increased slightly with the rise of air temperature at a constant bath water flow rate, as shown in Figure 14. The results revealed that the average COP of system was 4.98 at an air temperature of 22.9 °C, but at an air temperature of 19.4 °C and 26.5 °C, the average COPs were 4.90 and 5.07, respectively. The results show that air temperature had little effect on the COP of the system. At an air temperature of 22.9 °C, the maximum and minimum COPs were 5.96 and 4.01, respectively. Therefore, bath water flow rate had a great influence on the COP of the system.
3.5. Influence of an Air Source Evaporator on the System
In terms of Case 5, as shown in Figure 15, total heat capacity increased, with the bath water temperature rising at an air temperature of 22.9 °C. The total heat capacity with an air source evaporator was slightly higher than that without an air source evaporator. The results illustrated that the average total heat capacity without an air source evaporator was 6.15 kW, while it was 6.25 kW with an air source evaporator, increased by 1.6%.
As shown in Figure 16, the power consumption increased with the rise of the bath water temperature. Power consumption with an air source evaporator was lower than that without an air source evaporator at a constant bath water temperature. The results exhibited that the average power consumption without an air source evaporator was 1.43 kW, while it lead to a 5.6% reduction (1.35 kW) with an air source evaporator.
In Figure 17, the COP of the system increased with the rise of the bath water temperature at an air temperature of 22.9 °C. The COP of the system with an air source evaporator was higher than that without an air source evaporator, as the bath water temperature was unchanged. The results reveal that the average COP of the system without an air source evaporator was 4.29, while it reached 4.53 with an air source evaporator, which was increased by 5.6%.
In terms of Case 6, as shown in Figure 18, the total heat capacity increased directly with the rise of the bath water flow rate. The total heat capacity with an air source evaporator was slightly higher than that without an air source evaporator. According to the results, the average total heat capacity of the system without an air source evaporator was 6.67 kW, while increased by 1.5% (6.77 kW) with an air source evaporator.
In Figure 19, at the air temperature of 22.9 °C, the power consumption increased gradually with the rise of the bath water flow rate. The power consumption with an air source evaporator was lower than that without an air source evaporator when the bath water flow rate was fixed. The results show that the power consumption without an air source evaporator was 1.44 kW, while with an air source evaporator it became 1.35 kW, with a 6.7% reduction.
Figure 20 shows that the COP of the system increased with the rise of bath water flow rate at an air temperature of 22.9 °C. The COP of the system with an air source evaporator was higher than that without an air source evaporator at a constant bath water flow rate. According to the results, the average COP of the system without an air source evaporator was 4.63, while with the air source evaporator, with an increase of 7.5%, reached 4.98.
3.6. Summary of Results
The aforementioned conditions, the average power consumption, and the COP of the system are summarized in Table 2. The maximum COP of the system was 6.08, which was achieved at a bath water temperature of 40 °C, a flow rate of 6 L/min, and a room temperature of 26.5 °C. The average power consumption with a preheater or an air source evaporator was lower than that without them. The average COP of the system with a preheater or air source evaporator was higher than that without them. The average COP of the system reached 4.79 without a preheater and an air source evaporator. With an air source evaporator but without the preheater, the average COP of the system was 4.38, declined by 8.6%; with the preheater but without an air source evaporator, the average COP of system is 4.46, reduced by 6.9%. The average power consumption was lower, and the average COP of the system was higher at a higher air temperature. The preheater, the air source evaporator, and the higher air temperature could contribute to the improvement of the COP of the system.
3.7. Comparison Between Experimental and Simulated Results
Taking the conditions in Case 5 as an example, with the air source evaporator ON, the total heat capacity, power consumption, and the COP of system with different bath water temperatures are compared with the simulated data presented in our previous work [31].
In Figure 21, Figure 22 and Figure 23, the trend of the experimental curves was consistent with that of the simulations. The total heat capacity, power consumption, and the COP of the system with different bath water temperatures rose with the increasing bath water temperature. However, due to the heat loss of the system, the simulated data of the total heat capacity and COP were higher than that of the experiment, and the simulated power consumption was lower than that of the experiment. The maximum deviations of the total heat capacity, the power consumption, and the COP of the system were less than 8%.
3.8. Economic Analysis
According to the Code for Design for Building Water and Drainage (China), the bath water consumption for a person per bath is 100 L. Supposing that each person has a bath per day, 300 L bath water is needed per day for a family with three people. For a traditional electric water heater, 300 L bath water heated from 20 °C to 40 °C consumes 7.00 kWh of power. In comparison, the efficient household dual source heat pump water heater proposed in this paper had a maximum system COP of 6.08 (Case 4), and the calculated power consumption was 1.15 kWh. Taking Tianjin city in China as an example, the permanent resident population and the number of families were about 15.57 million and 5.19 million, respectively, in 2018, and the electricity price was $0.07/kWh. The power consumptions for the traditional and household dual-source heat pump water heaters were $0.49 and $0.08 per family per day, respectively. The power saving and cost saving were 5.85 kWh and $0.41 per family per day for baths, and 2135.25 kWh and $149.65 per family per year, respectively. For further comparison, the power savings and cost savings would be 11.08 billion kWh and $776.68 billion per year for Tianjin city. This means that the proposed household dual source heat pump water heater has great potential for energy savings.
4. Conclusions
In order to fully recover the energy of wastewater and ventilation air in the process of a bath, a dual-source heat pump water heater was proposed and designed. The effects of the preheater, bath water temperature, flow rate, air temperature, and air source evaporator on the performance of the system were achieved experimentally. With the increase of the bath water temperature or the flow rate, the total heat capacity, power consumption, and the COP of the system increases. Higher air temperature, a preheater, and the inclusion of an air source evaporator are beneficial to lowering power consumption and increasing the COP of the system. The trend is in accordance with our previous simulation work [31]. Some conclusions can be summarized as follows:
- (1)
- The average COP of the system reaches 4.79 without a preheater and air source evaporator. With an air source evaporator but without the preheater, the average COP of the system is 4.38, 8.6% lower; with a preheater but without an air source evaporator, the average COP of the system is 4.46, a reduction of 6.9%.
- (2)
- With a bath water temperature range of 35–42 °C and a bath flow rate of 5 L/min, the average COPs of the system are 4.53, 4.61, and 4.70 at the air temperatures of 19.4 °C, 22.9 °C, and 26.5 °C, respectively.
- (3)
- At a bath water flow rate range of 4–6 L/min and a bath water temperature of 40 °C, the average COPs of the system are 4.90, 4.98, and 5.07 at air temperatures of 19.4 °C, 22.9 °C, and 26.5 °C, respectively.
- (4)
- At a bath water temperature of 40 °C, a flow rate of 6 L/min, and an air temperature of 26.5 °C, the COP of the system can reach 6.08.
- (5)
- Compared with a traditional water heater, the household dual-source heat pump water heater can achieve significant energy savings.
Author Contributions
X.G. conceived the research. Y.F., S.L., and X.G. carried out the experiment and calculation. S.L., Y.F., X.G., Q.Z., and Y.L. participated in the analysis of the data and writing of the initial manuscript. X.G., Q.Z., S.L., and S.I. revised the manuscript and adjusted the data presentation. All authors have read and approved the manuscript.
Funding
This research received no external funding.
Conflicts of Interest
The authors declare no conflict of interest.
References
- Tian, E.; He, Y.L.; Tao, W.Q. Research on a new type waste heat recovery gravity heat pipe exchanger. Appl. Energy 2017, 188, 586–594. [Google Scholar] [CrossRef]
- Nam, Y.; Ooka, R.; Shiba, Y. Development of dual-source hybrid heat pump system using groundwater and air. Energy Build. 2010, 42, 909–916. [Google Scholar] [CrossRef]
- Jouhara, H.; Almahmoud, S.; Chauhan, A.; Delpech, B.; Bianchi, G.; Tassou, S.A.; Llera, R.; Lago, F.; Arribas, J.J. Experimental and theoretical investigation of a flat heat pipe heat exchanger for waste heat recovery in the steel industry. Energy 2017, 141, 1928–1939. [Google Scholar] [CrossRef]
- Hepbasli, A.; Kalinci, Y. A review of heat pump water heating systems. Energy Rev. 2009, 13, 1211–1229. [Google Scholar] [CrossRef]
- Liu, Z.; Xu, W.; Zhai, X. Feasibility and performance study of the hybrid ground-source heat pump system for one office building in Chinese heating dominated areas. Renew. Energy 2017, 101, 1131–1140. [Google Scholar] [CrossRef]
- Ikeda, S.; Choi, W.; Ooka, R. Optimization method for multiple heat source operation including ground source heat pump considering dynamic variation in ground temperature. Appl. Energy 2017, 193, 466–478. [Google Scholar] [CrossRef]
- Zhang, D.; Li, J.; Nan, J.; Wang, L. Thermal performance prediction and analysis on the economized vapor injection air-source heat pump in cold climate region of China. Sustain. Energy Technol. Assess. 2016, 18, 127–133. [Google Scholar] [CrossRef]
- Cai, J.; Ji, J.; Wang, Y.; Huang, W. Operation characteristics of a novel dual source multi-functional heat pump system under various working modes. Appl. Energy 2017, 194, 236–246. [Google Scholar]
- Wang, Z.H.; Wang, F.H.; Wang, X. Dynamic character investigation and optimization of a novel air-source heat pump system. Appl. Therm. Eng. 2017, 111, 122–133. [Google Scholar] [CrossRef]
- Gużda, A.; Szmolke, N. The efficiency of the heat pump water heater, during DHW tapping cycle. In Proceedings of the E3S Web of Conferences, Polanica-Zdrój, Poland, 13–15 September 2017. [Google Scholar]
- Song, M.; Xu, X.; Mao, N.; Deng, S.; Xu, Y. Energy transfer procession in an air source heat pump unit during defrosting. Appl. Energy 2017, 204, 679–689. [Google Scholar] [CrossRef]
- Safa, A.A.; Fung, A.S.; Kumar, R. Performance of two-stage variable capacity air source heat pump: Field performance results and TRNSYS simulation. Energy Build. 2015, 94, 80–90. [Google Scholar] [CrossRef]
- Su, H.; Gong, G.; Zhang, Y. Inversion Method for Optimizing the Condensing Heat Recovery System of an Air-Source Heat Pump. J. Energy Eng. 2017, 143, 04016069. [Google Scholar] [CrossRef]
- Shen, J.; Guo, T.; Tian, Y.; Xing, Z. Design and experimental study of an air source heat pump for drying with dual modes of single stage and cascade cycle. Appl. Therm. Eng. 2018, 129, 280–289. [Google Scholar] [CrossRef]
- Getu, H.M.; Bansal, P.K. Thermodynamic analysis of an R744–R717 cascade refrigeration system. Int. J. Refrig. 2008, 31, 45–54. [Google Scholar] [CrossRef]
- Jradi, M.; Veje, C.; Jørgensen, B.N. Performance analysis of a soil-based thermal energy storage system using solar-driven air-source heat pump for Danish buildings sector. Appl. Therm. Eng. 2017, 114, 360–373. [Google Scholar] [CrossRef]
- Li, Y.; Li, W.Y.; Liu, Z.S.; Lu, J.; Zeng, L.Y.; Yang, L.L.; Xie, L. Theoretical and numerical study on performance of the air-source heat pump system in Tibet. Renew. Energy 2017, 114, 489–501. [Google Scholar] [CrossRef]
- Zhang, L.; Jiang, Y.; Dong, J.; Yao, Y.; Deng, S. An experimental study of frost distribution and growth on finned tube heat exchangers used in air source heat pump units. Appl. Therm. Eng. 2018, 132, 38–51. [Google Scholar] [CrossRef]
- Fernandez, N.; Hwang, Y.; Radermacher, R. Comparison of CO2 heat pump water heater performance with baseline cycle and two high COP cycles. Int. J. Refrig. 2010, 33, 635–644. [Google Scholar] [CrossRef]
- Zhao, Z.C.; Zhang, Y.R.; Mi, H.J.; Zhou, Y.M.; Zhang, Y. Experimental Research of a Water-Source Heat Pump Water Heater System. Energies 2018, 11, 1205. [Google Scholar] [CrossRef]
- Chao, S.; Jiang, Y.; Yang, Y. A field study of a wastewater source heat pump (WWSHP) for domestic hot water heating. Build. Serv. Eng. Res. Technol. 2013, 34, 433–448. [Google Scholar] [CrossRef]
- Liu, L.B.; Fu, L.; Jiang, Y. Application of an exhaust heat recovery system for domestic hot water. Energy 2010, 35, 1476–1481. [Google Scholar] [CrossRef]
- Schibuola, L.; Scarpa, M. Experimental analysis of the performances of a surface water source heat pump. Energy Build. 2016, 113, 182–188. [Google Scholar] [CrossRef]
- Liu, X.Y.; Lau, S.K.; Li, H.R.; Shen, H. Optimization and analysis of a multi-functional heat pump system with air source and gray water source in cooling mode. Energy Build. 2014, 69, 1–13. [Google Scholar] [CrossRef]
- Liu, X.F.; Liu, C.H.; Zhang, Z.; Chen, L.; Hou, Y. Experimental Study on the Performance of Water Source Trans-Critical CO2 Heat Pump Water Heater. Energies 2017, 10, 810. [Google Scholar] [CrossRef]
- Wanjiru, E.M.; Sichilalu, S.M.; Xia, X.H. Optimal control of heat pump water heater-instantaneous shower using integrated renewable-grid energy systems. Appl. Energy 2017, 201, 332–342. [Google Scholar] [CrossRef]
- Dong, Y.Q. Theory of energy level and its application in water-loop heat pump system. Appl. Therm. Eng. 2017, 119, 269–274. [Google Scholar]
- Lazzarin, R.M. Dual source heat pump systems: Operation and performance. Energy Build. 2012, 52, 77–85. [Google Scholar] [CrossRef]
- Cai, J.Y.; Ji, J.; Wang, Y.Y.; Zhou, F.; Yu, B. A novel PV/T-air dual source heat pump water heater system: Dynamic simulation and performance characterization. Energy Convers. Manag. 2017, 148, 635–645. [Google Scholar] [CrossRef]
- Wong, L.T.; Mui, K.W.; Guan, Y. Shower water heat recovery in high-rise residential buildings of Hong Kong. Appl. Energy 2010, 87, 703–709. [Google Scholar] [CrossRef]
- Gou, X.; Fu, Y.; Shah, I.A.; Li, Y.M.; Xu, G.Y.; Yang, Y.; Wang, E.Y.; Liu, L.S.; Wu, J.X. Research on a Household Dual Heat Source Heat Pump Water Heater with Preheater Based on ASPEN PLUS. Energies 2016, 9, 1026. [Google Scholar] [CrossRef]
Figure 1.
Schematic diagram of the bathroom unit: 1—Wastewater outlet; 2—Tap water inlet; 3—Compressor; 4—Water mixer; 5—Condenser; 6—Air source evaporator; 7—Expansion valve; 8—Wastewater source evaporator; 9—Preheater [31].
Figure 1.
Schematic diagram of the bathroom unit: 1—Wastewater outlet; 2—Tap water inlet; 3—Compressor; 4—Water mixer; 5—Condenser; 6—Air source evaporator; 7—Expansion valve; 8—Wastewater source evaporator; 9—Preheater [31].
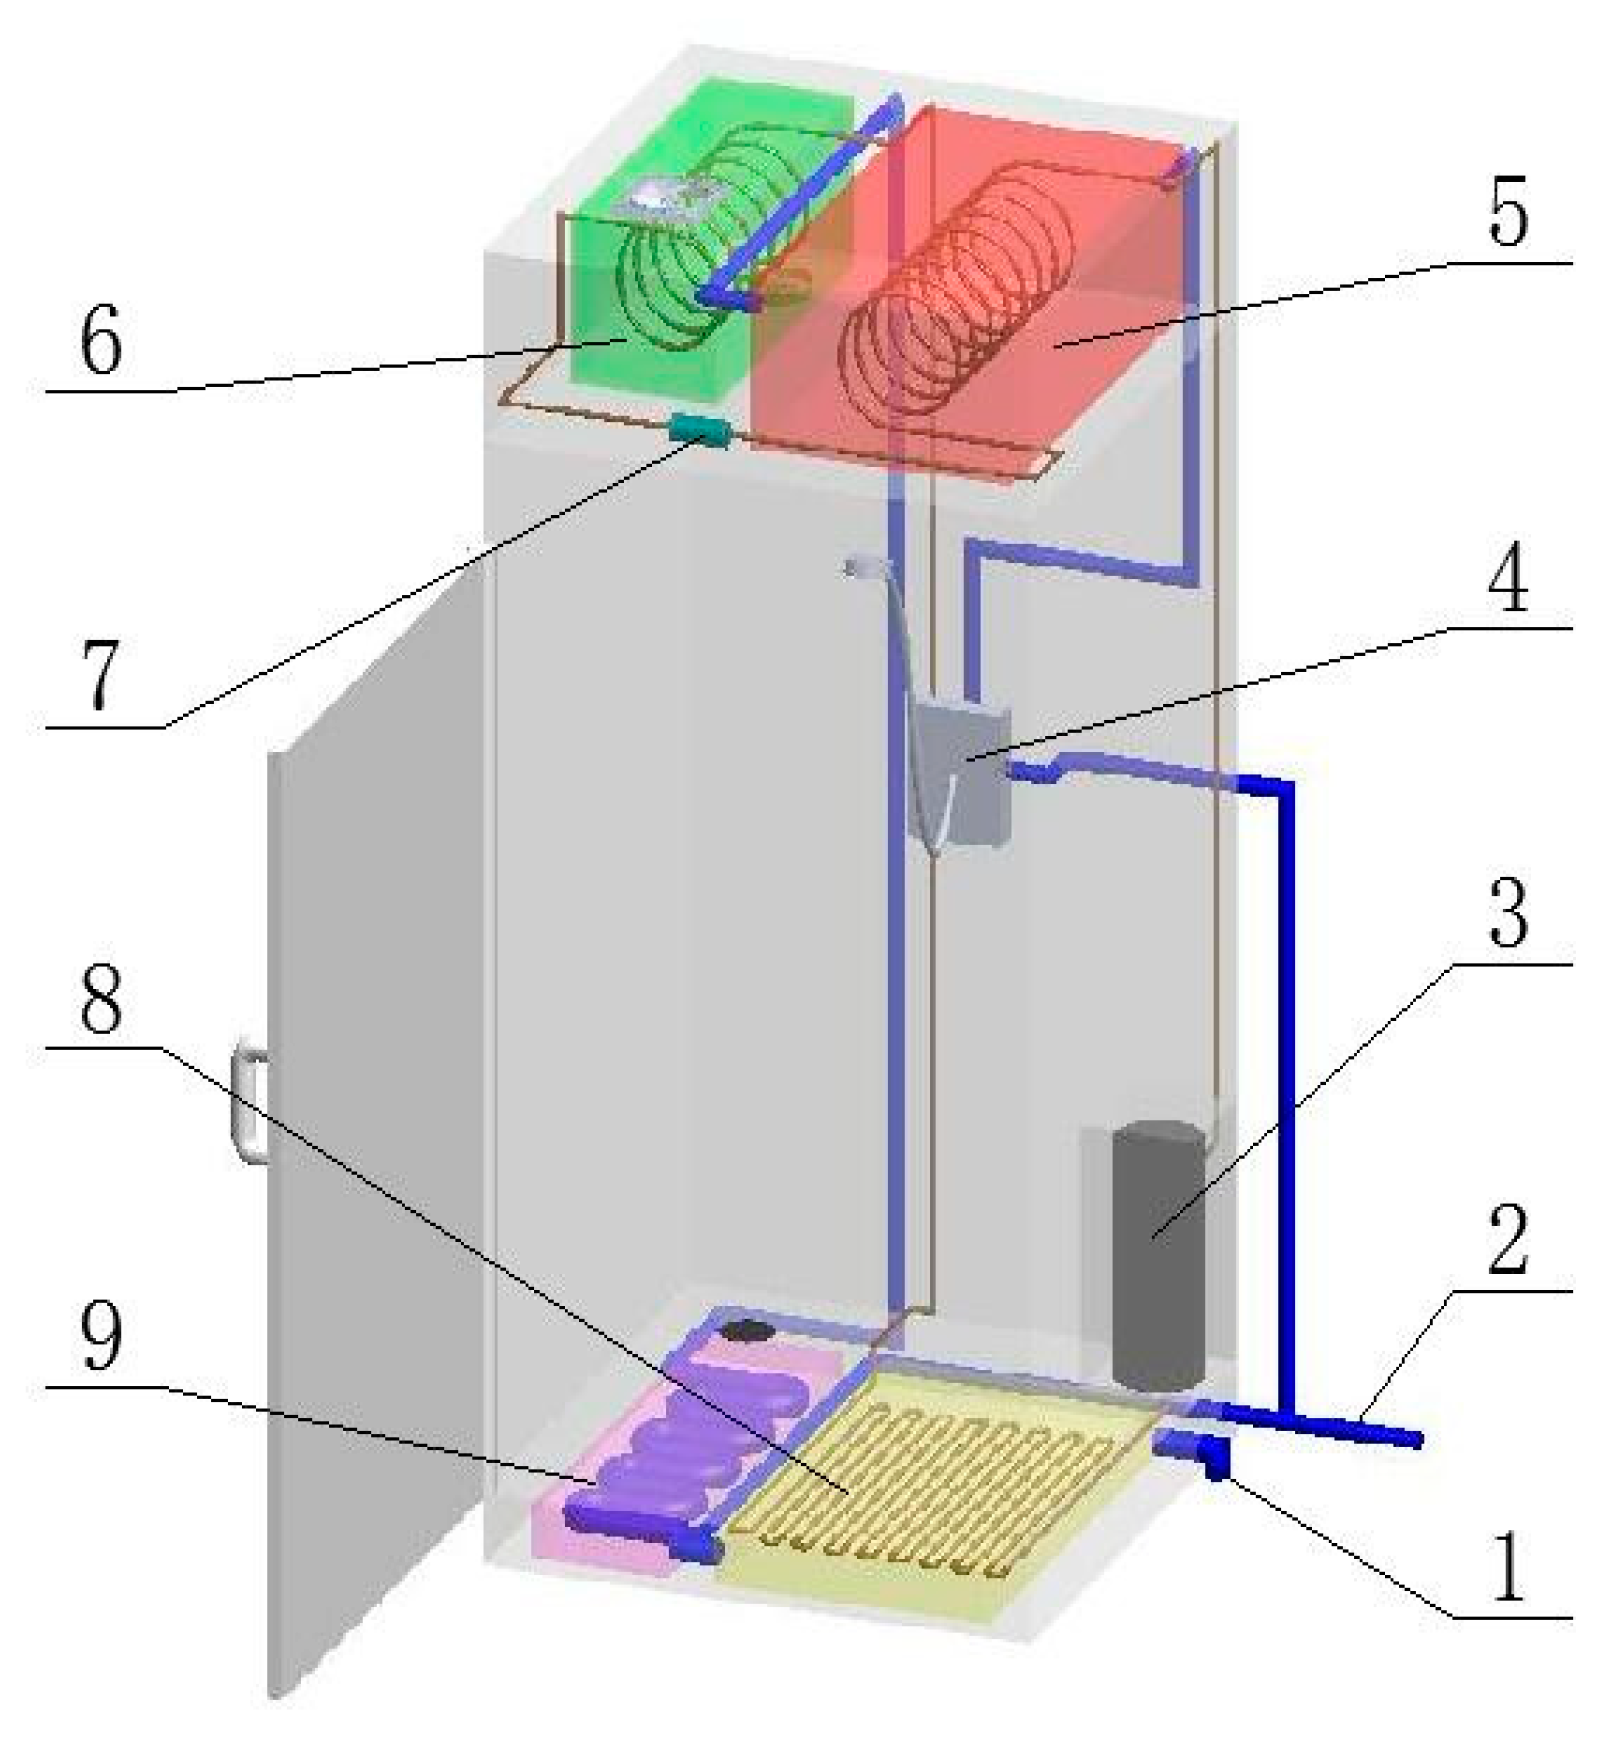
Figure 2.
Schematic diagram of the refrigerant flow.

Figure 3.
Schematic diagram of the water flow.

Figure 4.
Photo of the bathroom unit: 1—Wastewater outlet; 2—Tap water inlet; 3—Compressor; 4—Water mixer; 5—Condenser; 6—Air source evaporator; 7—Expansion valve; 8—Wastewater source evaporator; 9—Preheater.
Figure 4.
Photo of the bathroom unit: 1—Wastewater outlet; 2—Tap water inlet; 3—Compressor; 4—Water mixer; 5—Condenser; 6—Air source evaporator; 7—Expansion valve; 8—Wastewater source evaporator; 9—Preheater.

Figure 5.
Influence of bath water temperature on power consumption with and without the preheater.

Figure 6.
Influence of bath water temperature on the coefficient of performance (COP) of the system with and without a preheater.
Figure 6.
Influence of bath water temperature on the coefficient of performance (COP) of the system with and without a preheater.

Figure 7.
Influence of the bath water flow rate on the power consumption with and without a preheater.
Figure 7.
Influence of the bath water flow rate on the power consumption with and without a preheater.

Figure 8.
Influence of the bath water flow rate on the COP of the system with and without a preheater.
Figure 8.
Influence of the bath water flow rate on the COP of the system with and without a preheater.

Figure 9.
Influence of bath water temperature on the total heat capacity at different air temperatures.
Figure 9.
Influence of bath water temperature on the total heat capacity at different air temperatures.
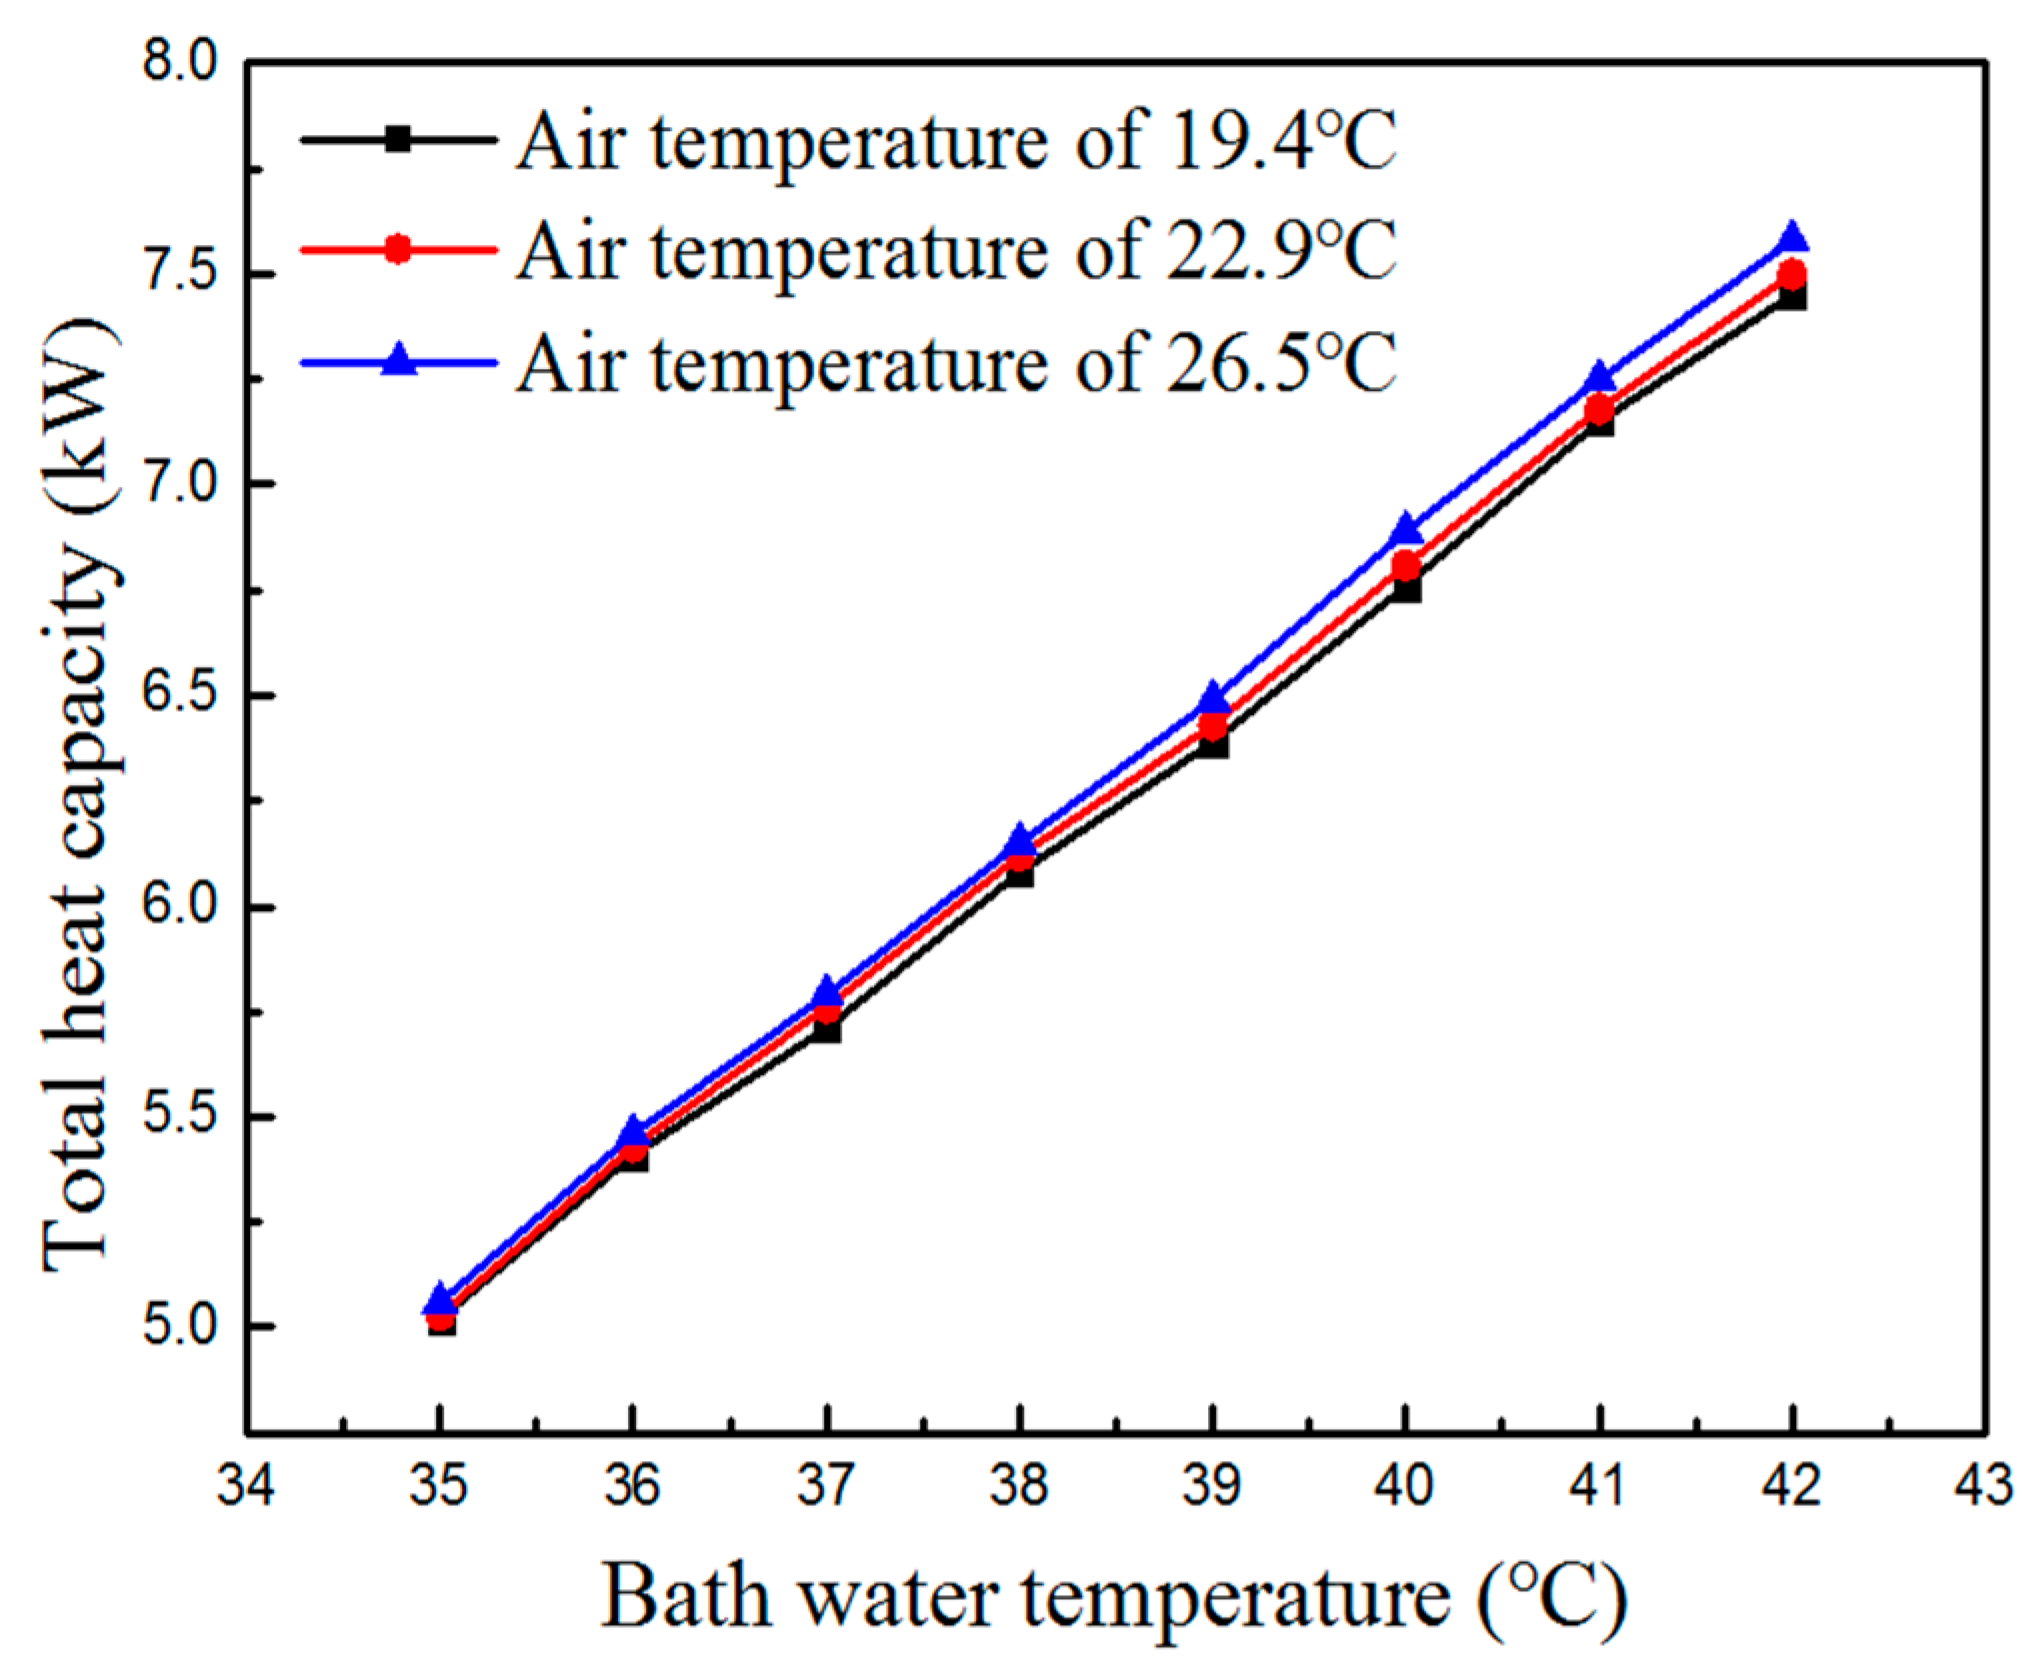
Figure 10.
Influence of bath water temperature on the power consumption at different air temperatures.
Figure 10.
Influence of bath water temperature on the power consumption at different air temperatures.

Figure 11.
Influence of bath water temperature on the COP of the system at different air temperatures.
Figure 11.
Influence of bath water temperature on the COP of the system at different air temperatures.
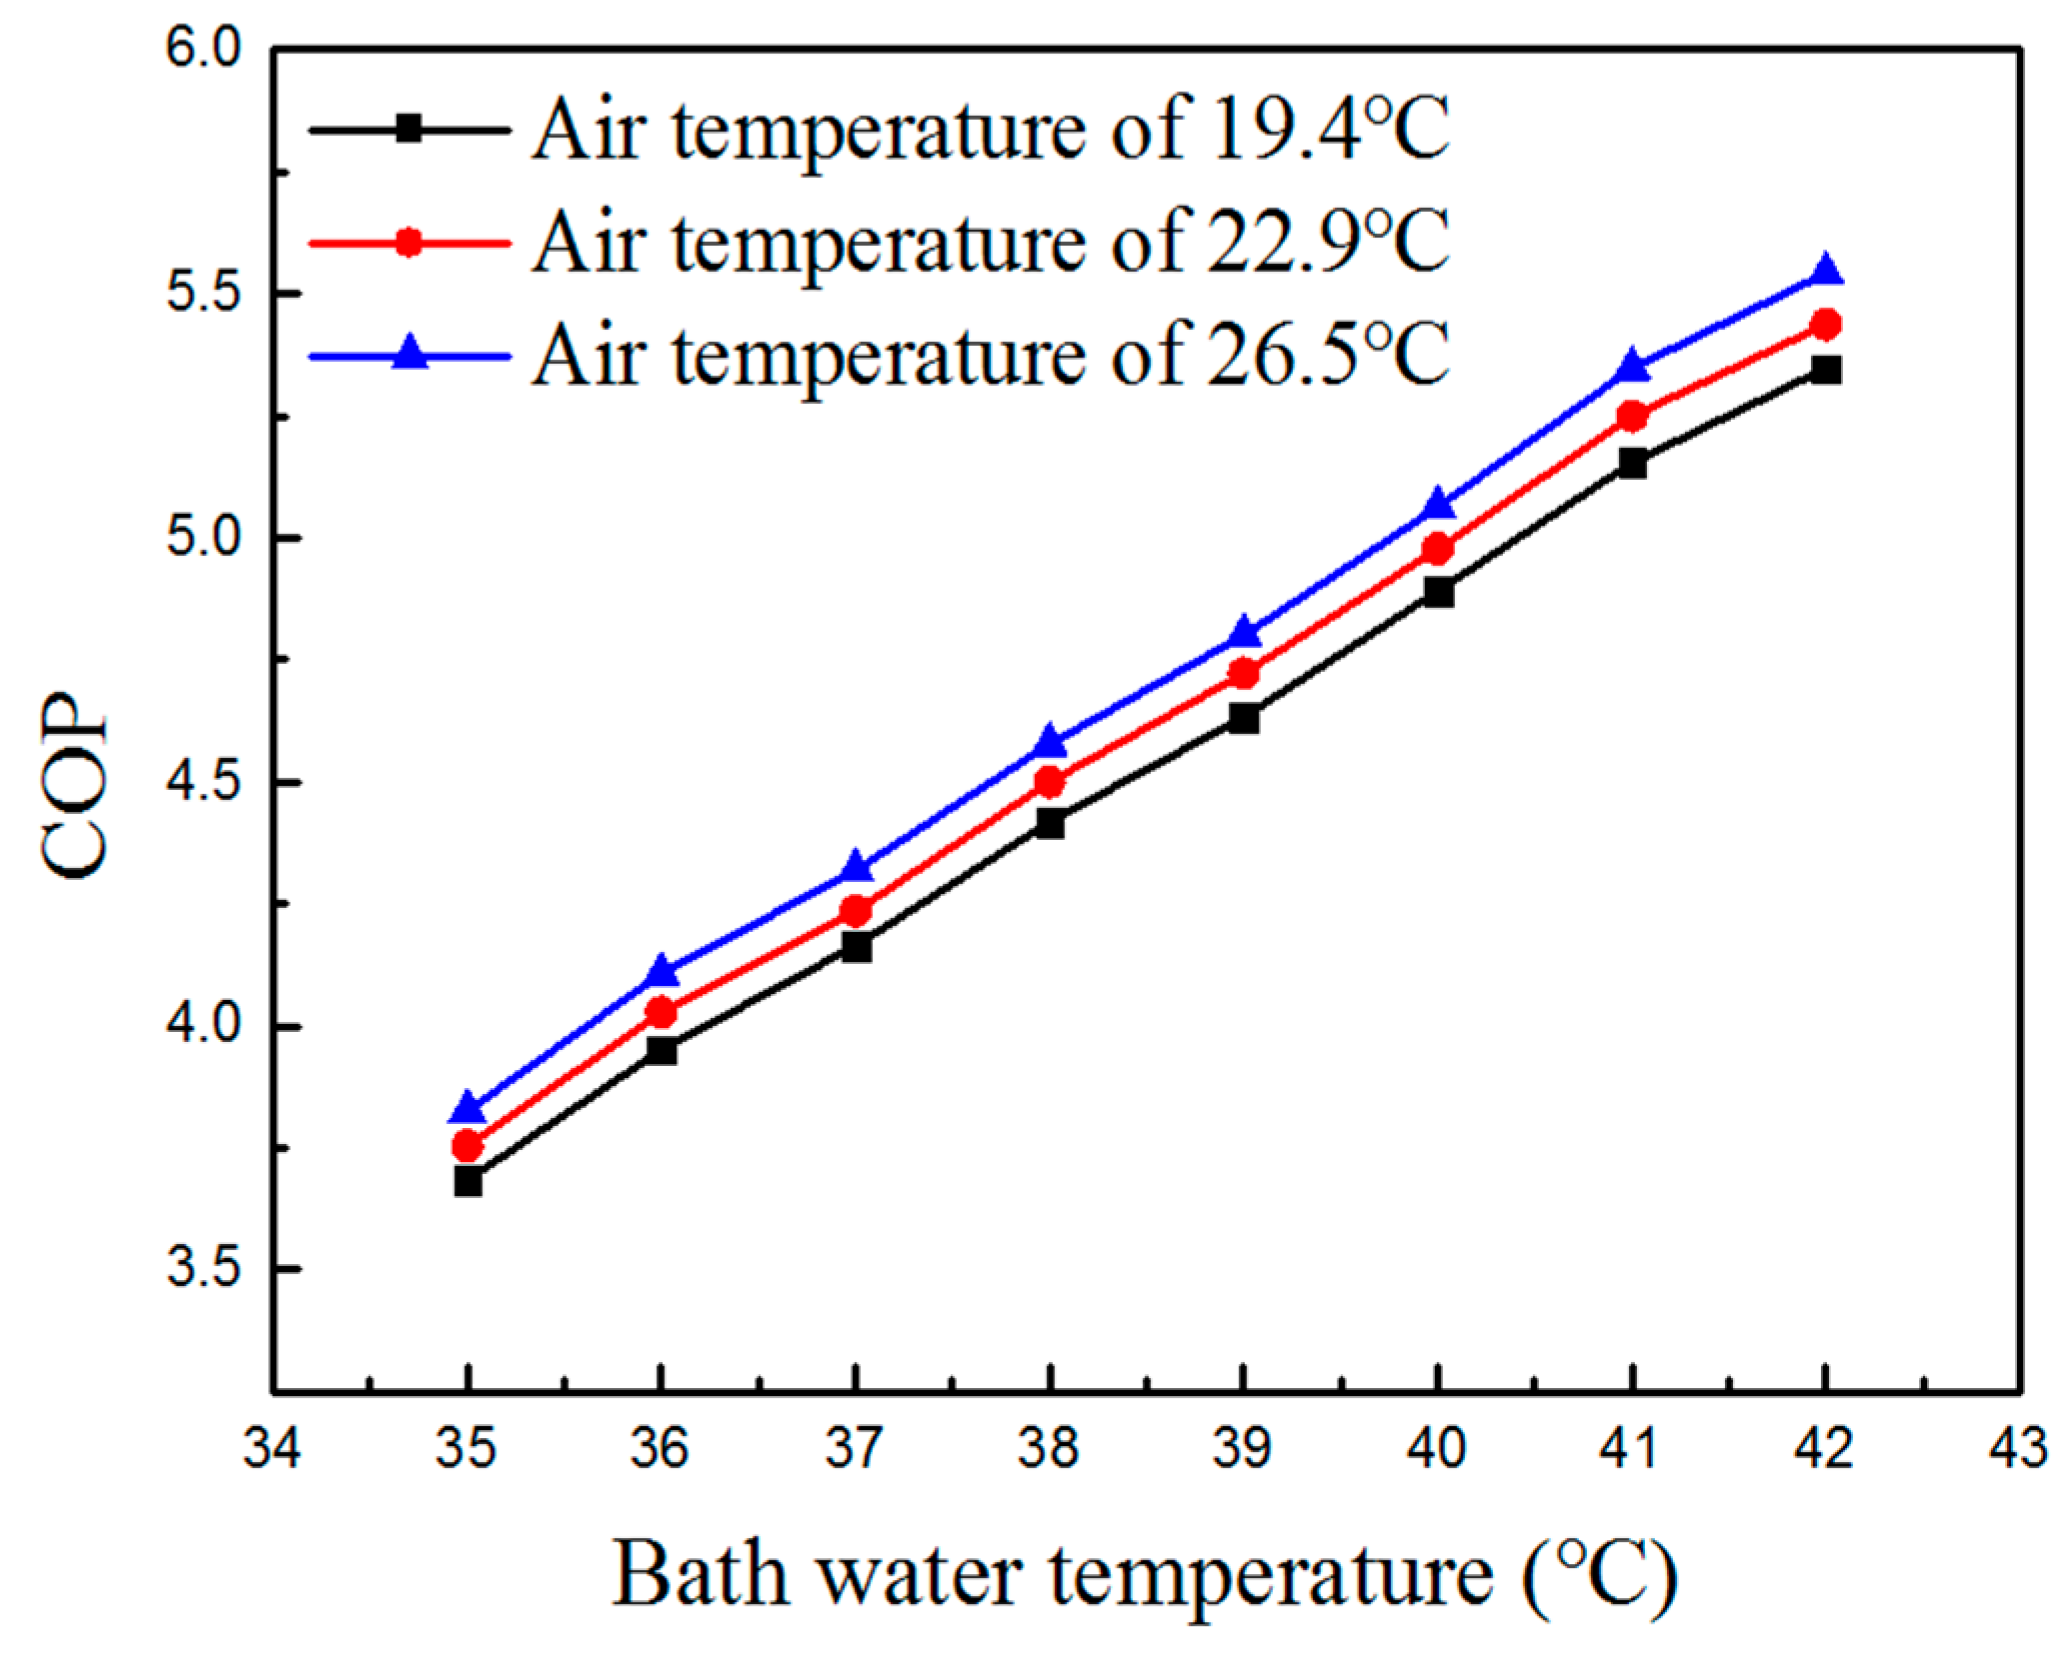
Figure 12.
Influence of bath water flow rate on total heat capacity at different air temperatures.
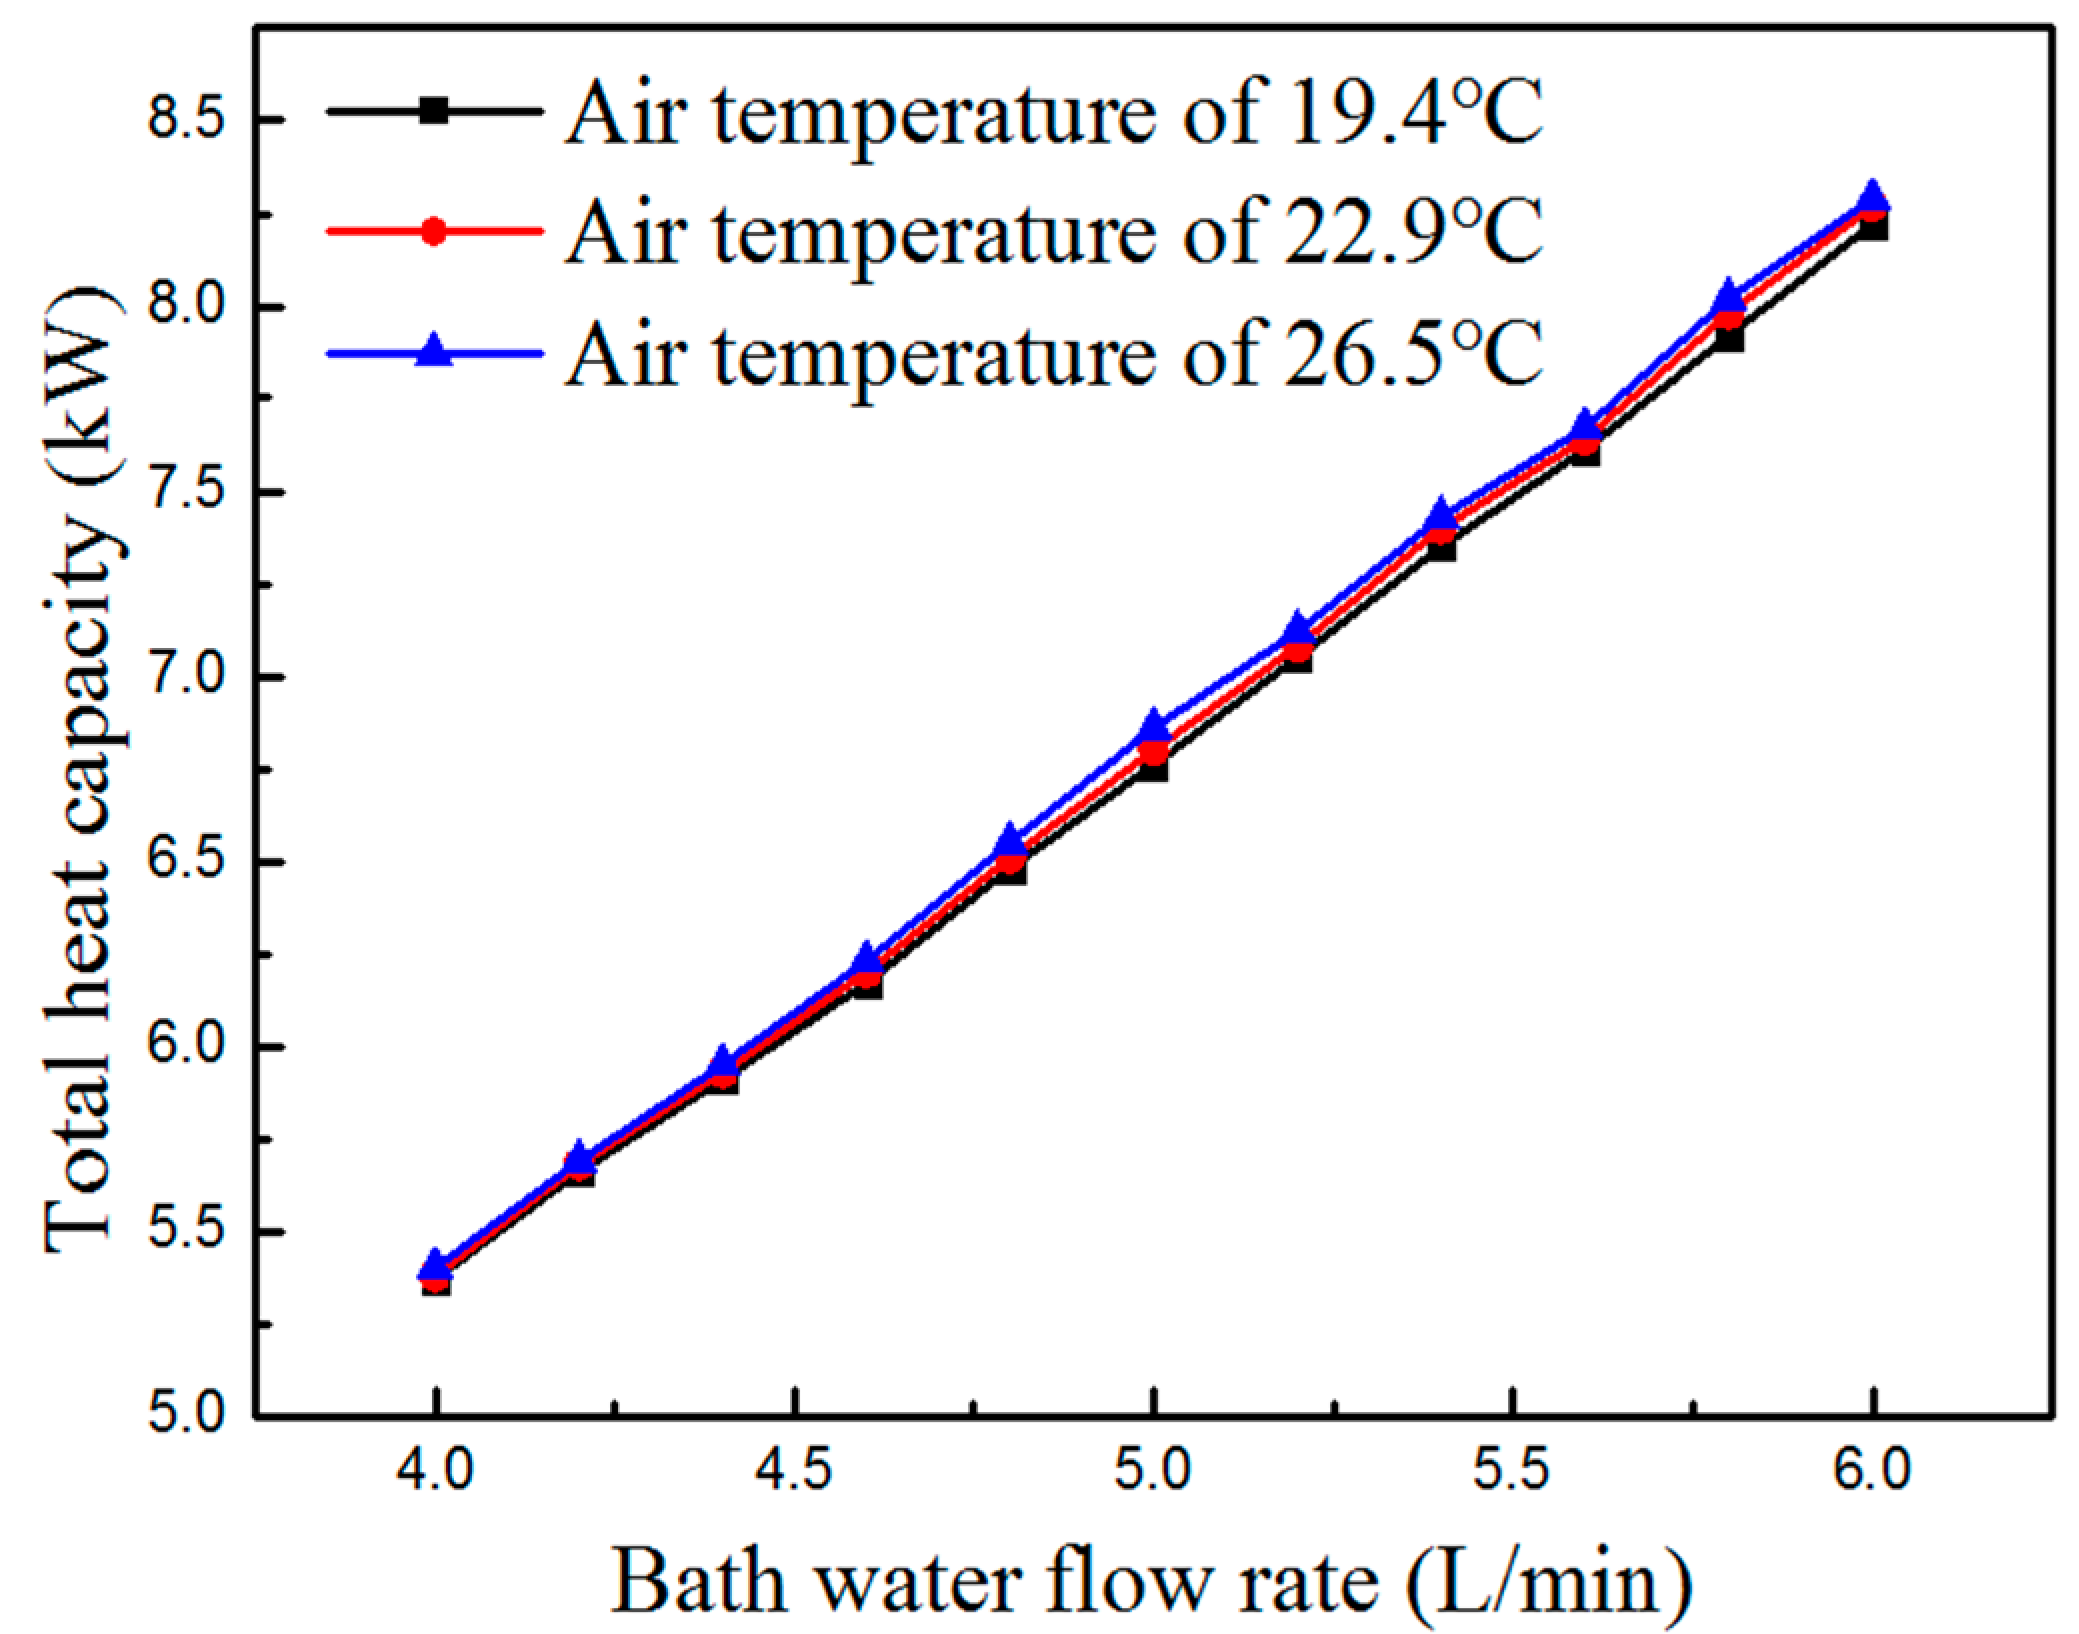
Figure 13.
Influence of the bath water flow rate on the power consumption at different air temperatures.
Figure 13.
Influence of the bath water flow rate on the power consumption at different air temperatures.

Figure 14.
Influence of bath water flow rate on the COP of the system at different air temperatures.
Figure 14.
Influence of bath water flow rate on the COP of the system at different air temperatures.

Figure 15.
Influence of bath water temperature on the total heat capacity, with and without an air source evaporator.
Figure 15.
Influence of bath water temperature on the total heat capacity, with and without an air source evaporator.

Figure 16.
Influence of bath water temperature on power consumption with and without an air source evaporator.
Figure 16.
Influence of bath water temperature on power consumption with and without an air source evaporator.
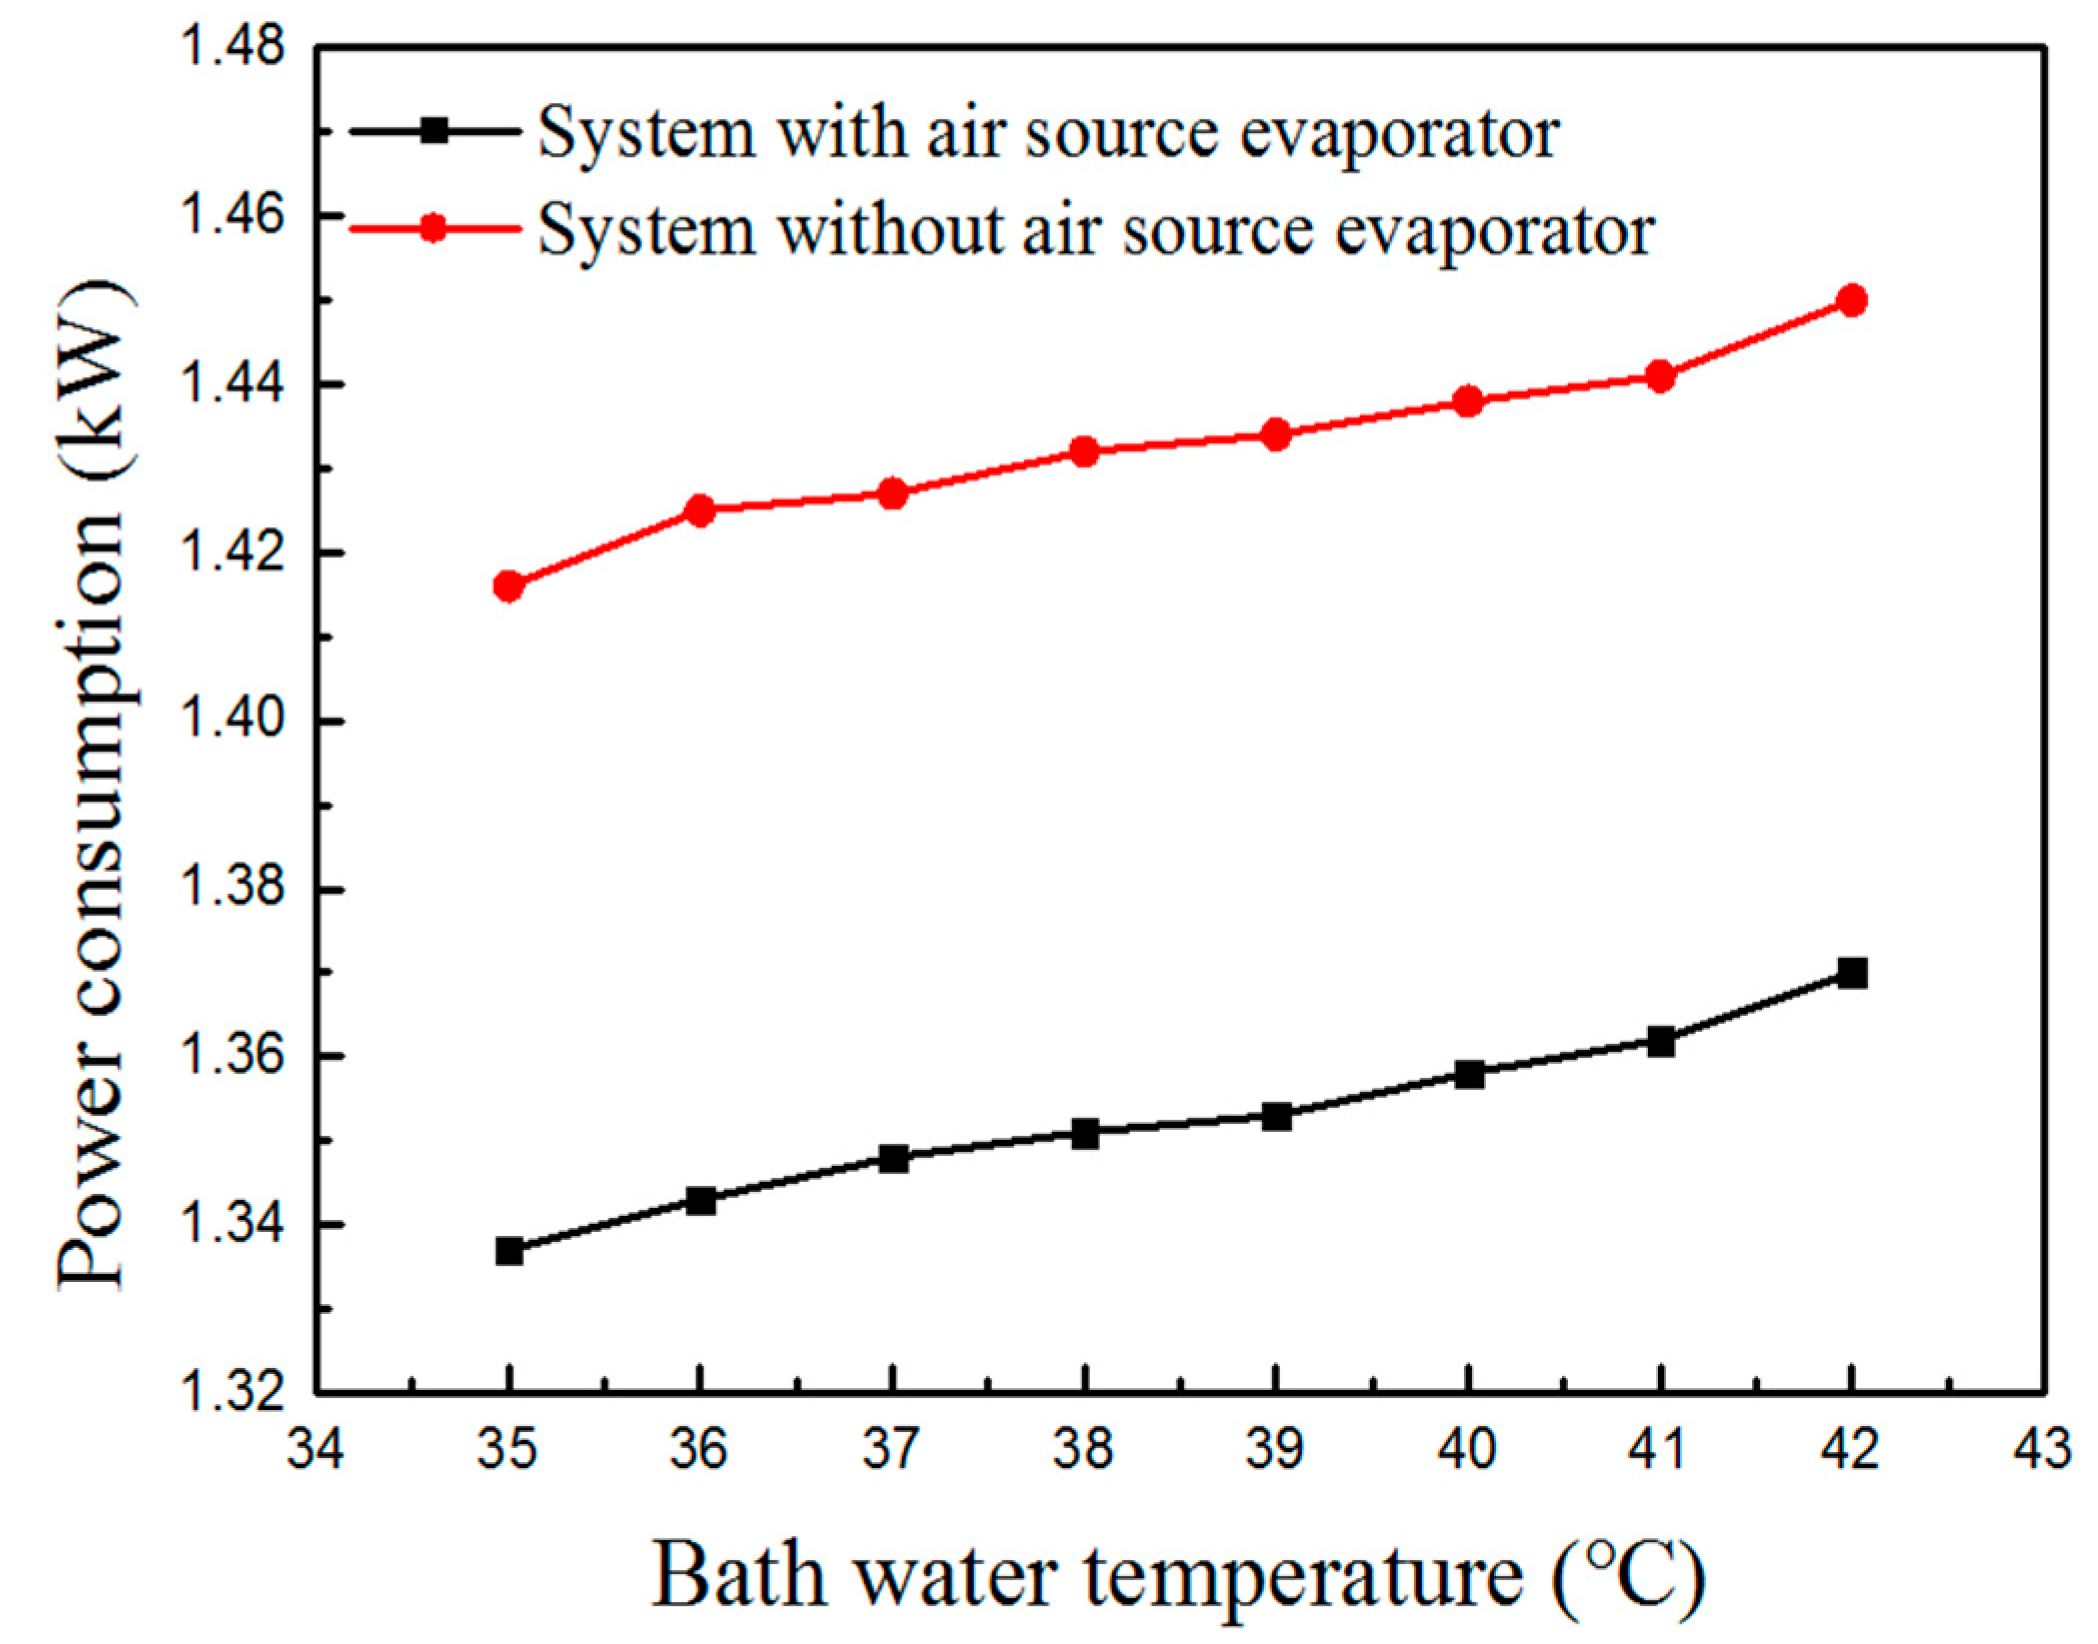
Figure 17.
Influence of bath water temperature on the COP of a system with and without an air source evaporator.
Figure 17.
Influence of bath water temperature on the COP of a system with and without an air source evaporator.
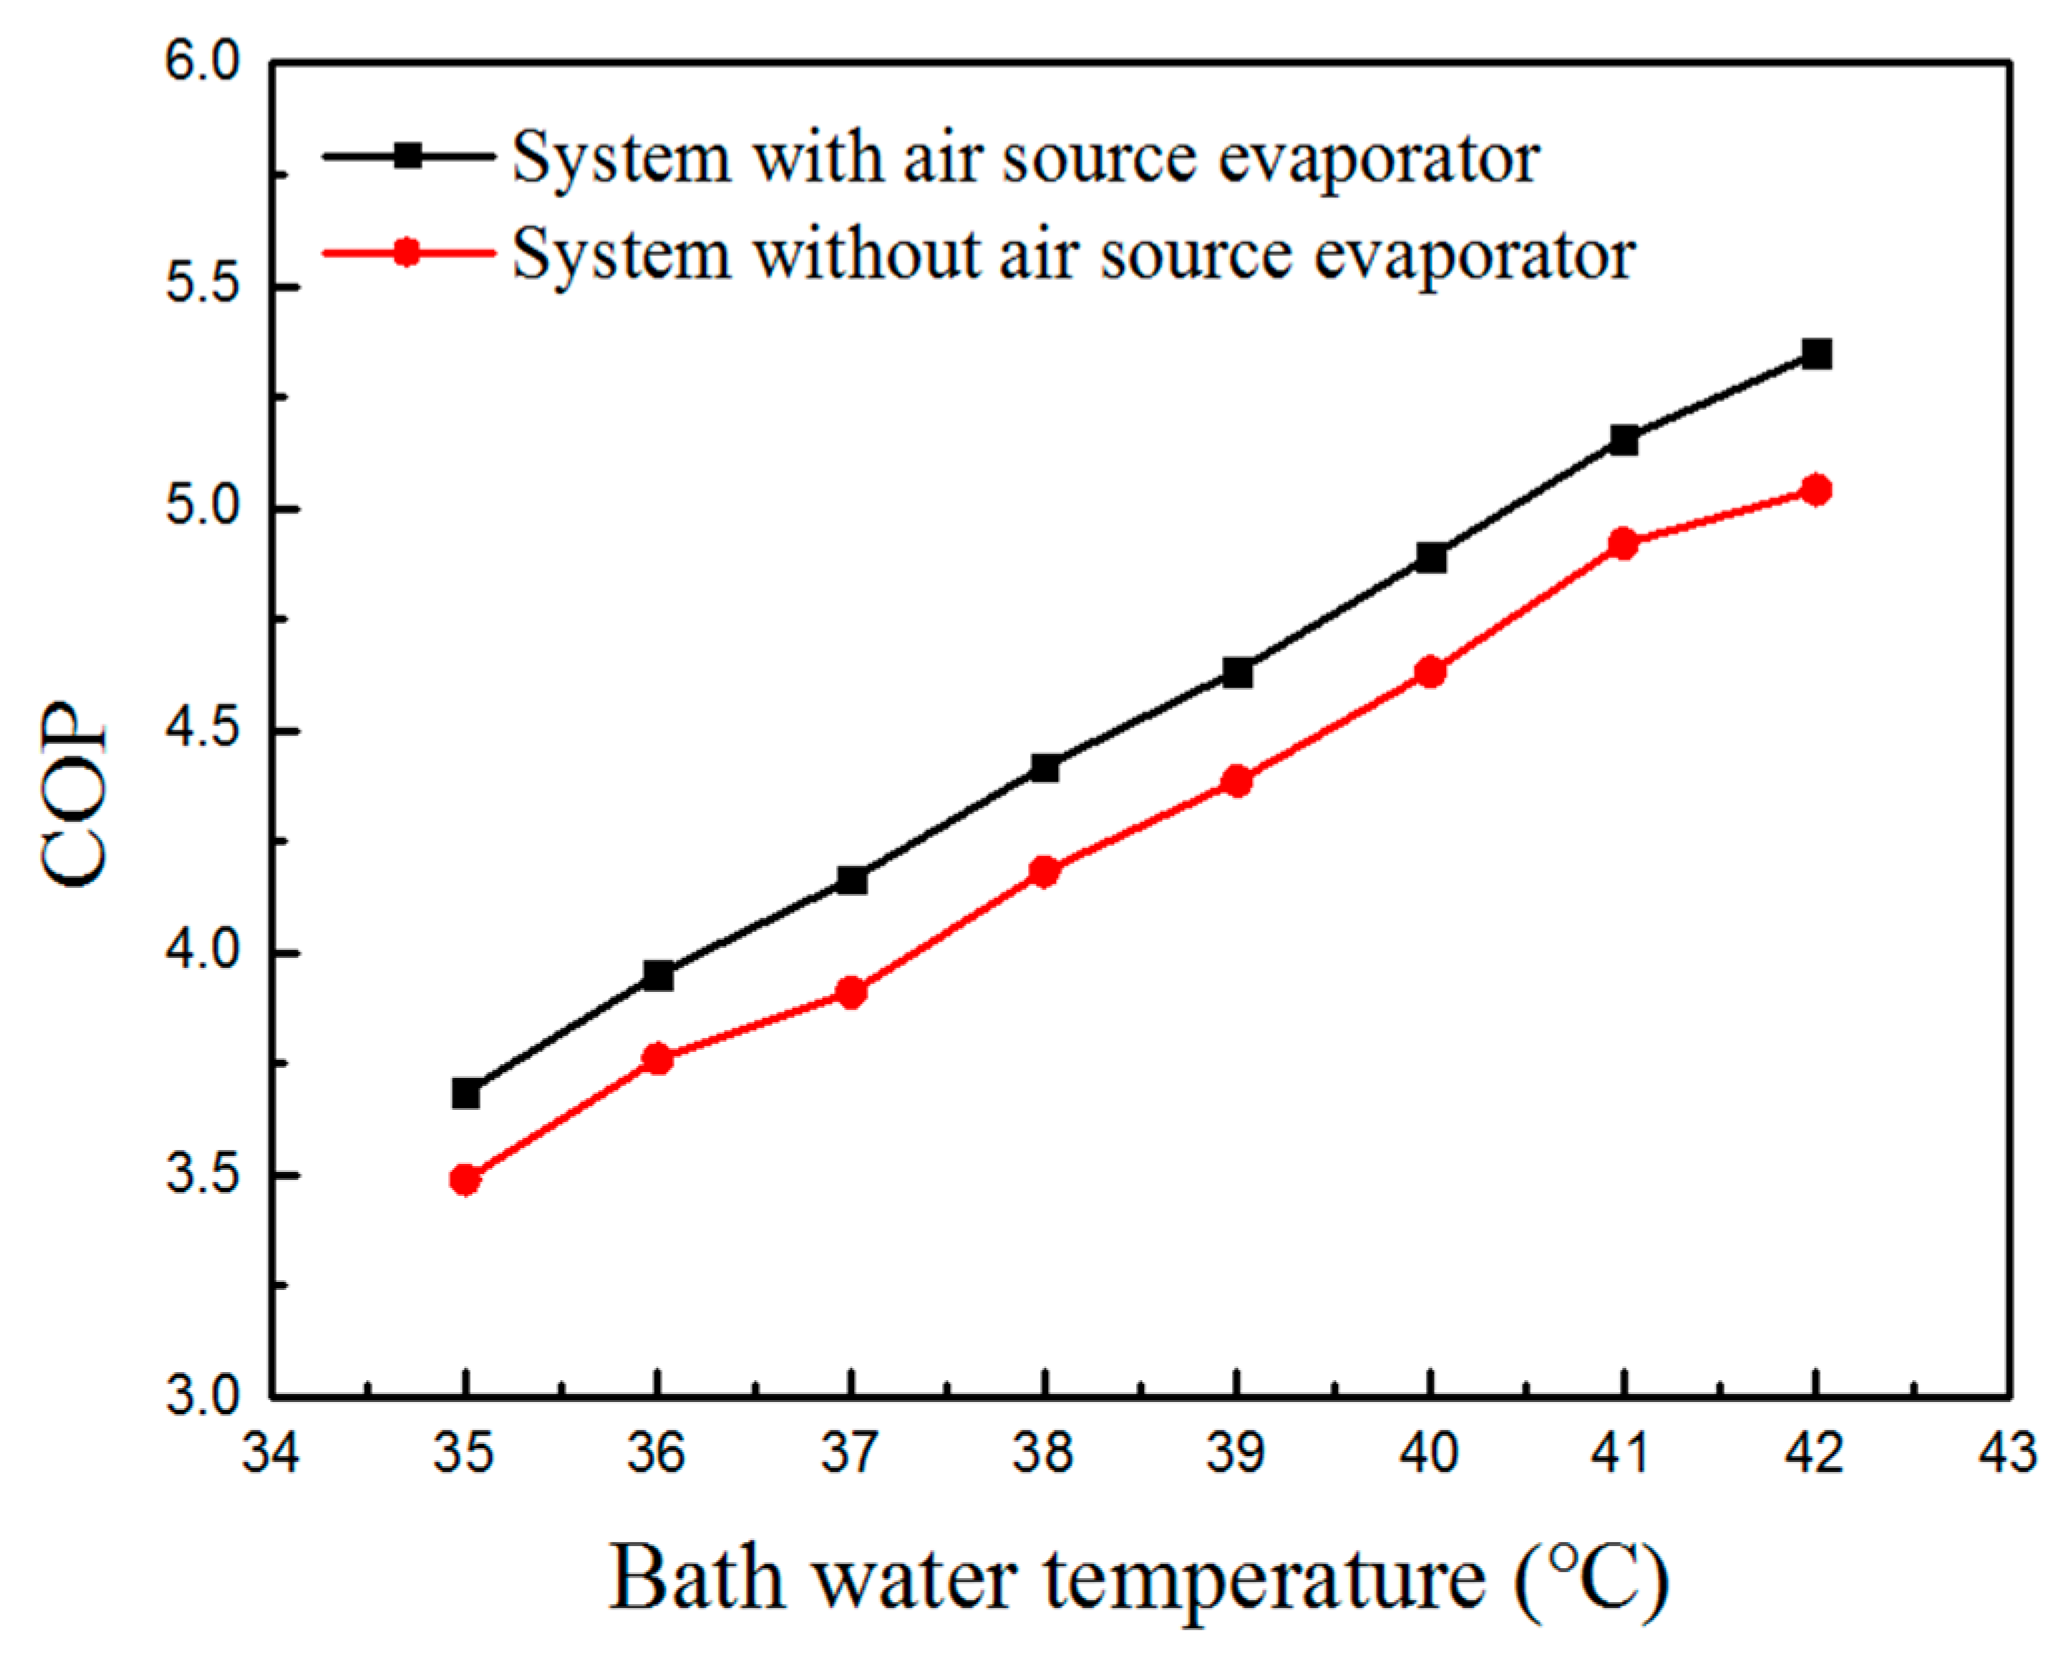
Figure 18.
Influence of the bath water flow rate on the total heat capacity with and without an air source evaporator.
Figure 18.
Influence of the bath water flow rate on the total heat capacity with and without an air source evaporator.
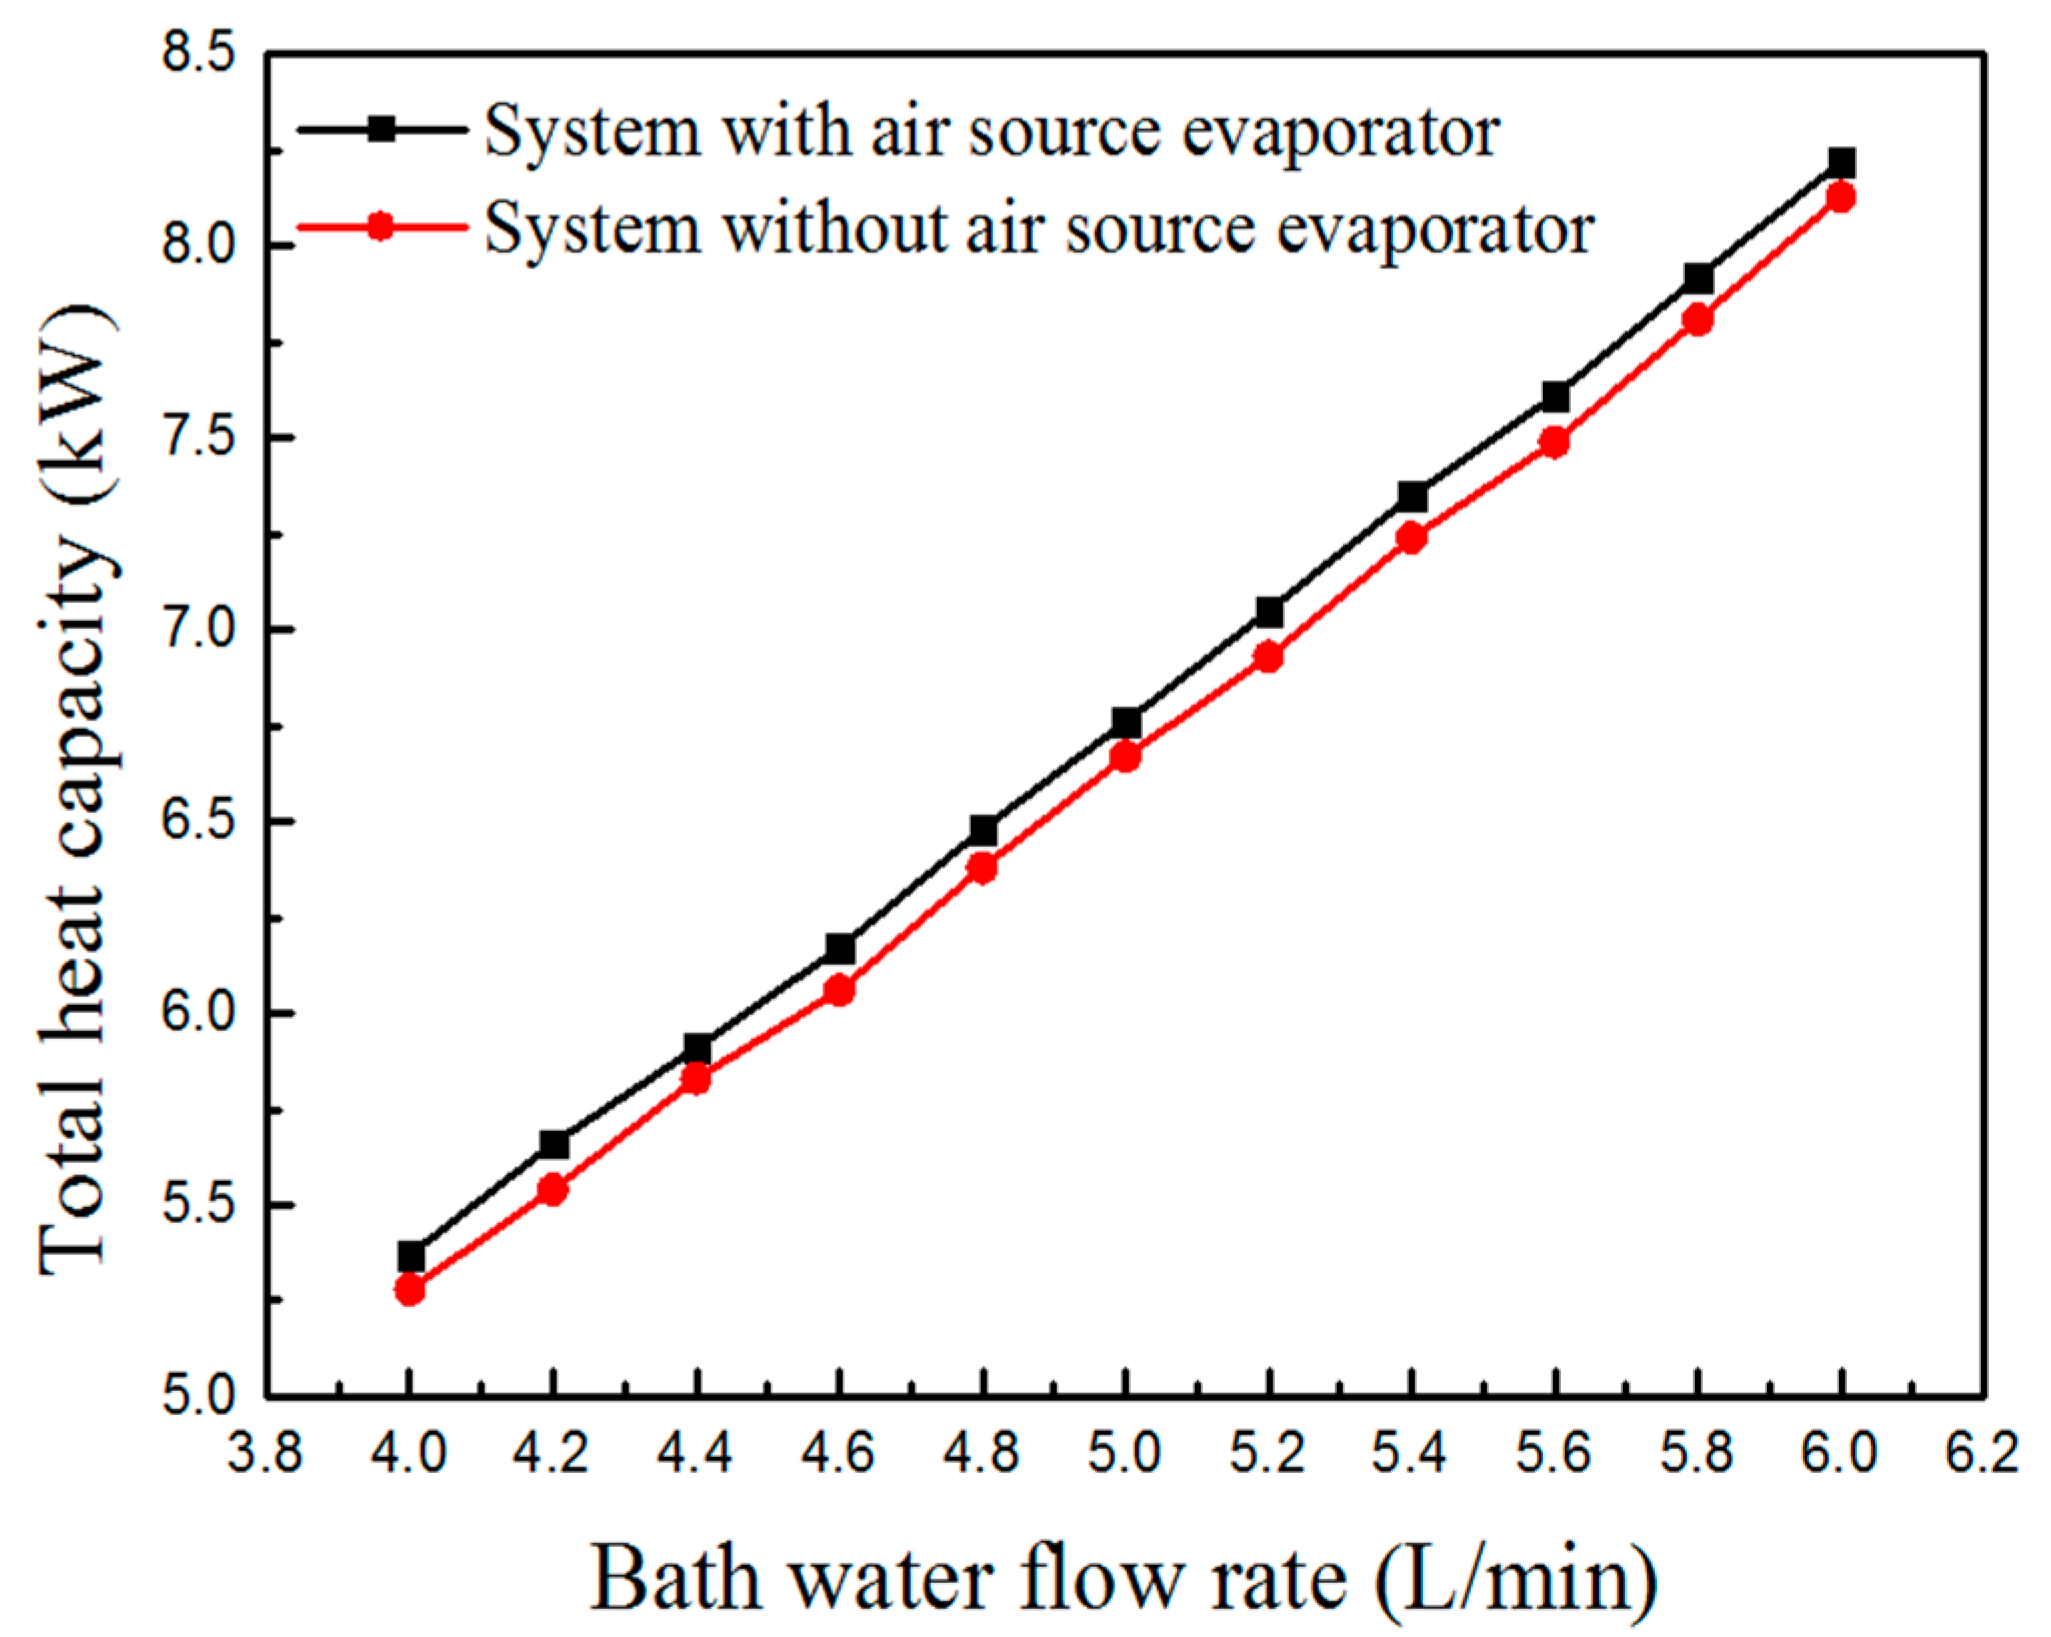
Figure 19.
Influence of the bath water flow rate on the power consumption with and without an air source evaporator.
Figure 19.
Influence of the bath water flow rate on the power consumption with and without an air source evaporator.
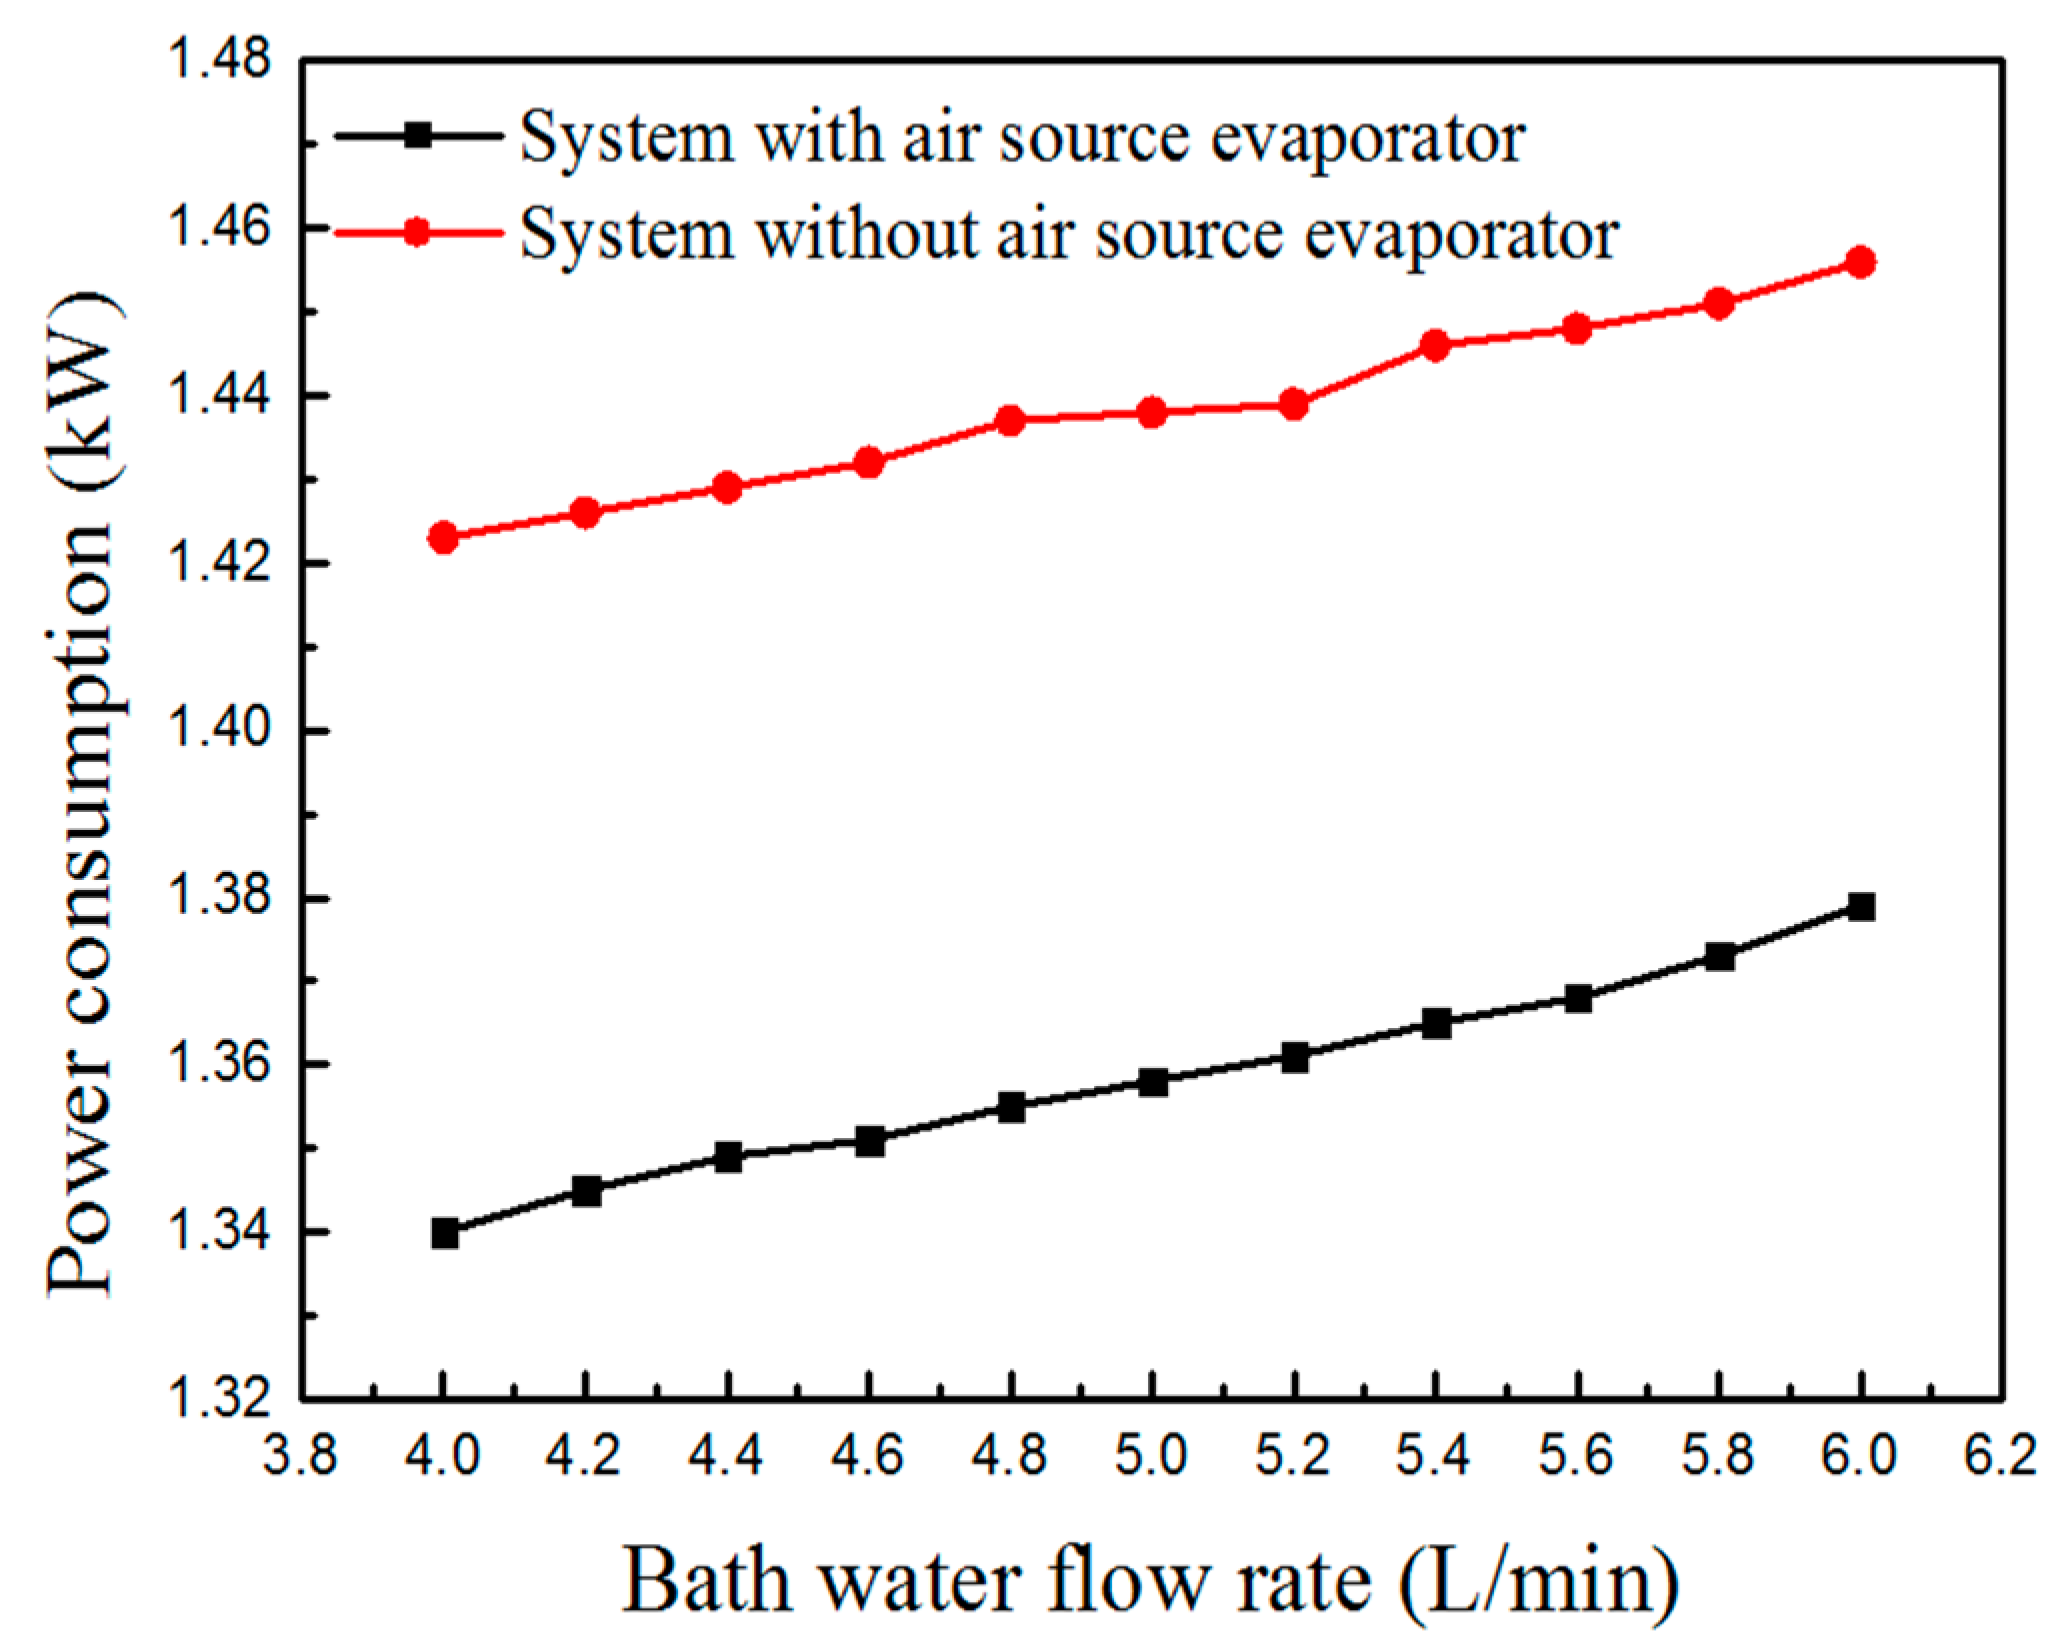
Figure 20.
Influence of the bath water flow rate on the COP of the system with and without an air source evaporator.
Figure 20.
Influence of the bath water flow rate on the COP of the system with and without an air source evaporator.

Figure 21.
The comparison of the experimental and simulated total heat capacities.

Figure 22.
The comparison of the experimental and simulated power consumptions.

Figure 23.
The comparison of the experimental and simulated COPs of the system.


Table 1.
Experimental conditions.
| Case Number | Bath Water Temperature (°C) | Bath Water Flow Rate (L/min) | Air Temperature (°C) | Preheater | Air Source Evaporator |
|---|---|---|---|---|---|
| 1 | 35–42 | 5 | 22.9 | on/off | on |
| 2 | 40 | 4–6 | 22.9 | on/off | on |
| 3 | 35–42 | 5 | 19.4, 22.9, 26.5 | on | on |
| 4 | 40 | 4–6 | 19.4, 22.9, 26.5 | on | on |
| 5 | 35–42 | 5 | 22.9 | on | on/off |
| 6 | 40 | 4–6 | 22.9 | on | on/off |
Table 2.
Results summary.
| Case Number | Conditions | Average Power Consumption (Range) (kW) | Average COP of System (Range) | |
|---|---|---|---|---|
| 1 | Bath water temperature 35–42 °C | Preheater on | 1.35 (1.34–1.37) | 4.61 (3.75–5.44) |
| Preheater off | 1.49 (1.47–1.50) | 4.21 (3.41–4.98) | ||
| 2 | Bath water flow rate 4–6 L/min | Preheater on | 1.35(1.34–1.38) | 4.99 (4.01–6.02) |
| Preheater off | 1.49 (1.47–1.50) | 4.54 (3.58–5.50) | ||
| 3 | Bath water temperature 35–42 °C | Air temperature of 19.4 °C | 1.38 (1.36–1.39) | 4.53 (3.69–5.35) |
| Air temperature of 22.9 °C | 1.35 (1.34–1.37) | 4.61 (3.75–5.44) | ||
| Air temperature of 26.5 °C | 1.33 (1.31–1.34) | 4.70 (3.82–5.54) | ||
| 4 | Bath water flow rate 4–6 L/min | Air temperature of 19.4 °C | 1.38 (1.37–1.39) | 4.90 (3.82–5.72) |
| Air temperature of 22.9 °C | 1.35 (1.34–1.38) | 4.98 (4.01–5.96) | ||
| Air temperature of 26.5 °C | 1.33 (1.32–1.35) | 5.07 (4.07–6.08) | ||
| 5 | Bath water temperature 35–42 °C | Air source evaporator on | 1.35 (1.34–1.37) | 4.53 (3.68–5.35) |
| Air source evaporator off | 1.43 (1.42–1.45) | 4.29 (3.48–5.00) | ||
| 6 | Bath water flow rate 4–6 L/min | Air source evaporator on | 1.35 (1.34–1.38) | 4.98 (4.01–5.96) |
| Air source evaporator off | 1.44 (1.42–1.46) | 4.63 (3.71–5.58) | ||
© 2018 by the authors. Licensee MDPI, Basel, Switzerland. This article is an open access article distributed under the terms and conditions of the Creative Commons Attribution (CC BY) license (http://creativecommons.org/licenses/by/4.0/).
Share and Cite
MDPI and ACS Style
Gou, X.; Liu, S.; Fu, Y.; Zhang, Q.; Iram, S.; Liu, Y. Experimental Study on the Performance of a Household Dual-Source Heat Pump Water Heater. Energies 2018, 11, 2811. https://doi.org/10.3390/en11102811
AMA Style
Gou X, Liu S, Fu Y, Zhang Q, Iram S, Liu Y. Experimental Study on the Performance of a Household Dual-Source Heat Pump Water Heater. Energies. 2018; 11(10):2811. https://doi.org/10.3390/en11102811
Chicago/Turabian StyleGou, Xiang, Shian Liu, Yang Fu, Qiyan Zhang, Saima Iram, and Yingfan Liu. 2018. "Experimental Study on the Performance of a Household Dual-Source Heat Pump Water Heater" Energies 11, no. 10: 2811. https://doi.org/10.3390/en11102811
Note that from the first issue of 2016, this journal uses article numbers instead of page numbers. See further details here.