1. Introduction
Alternative fuels are convenient substitutes for conventional fuels in the automotive industry which can reduce emission-based air pollution and dependency on the use of conventional fuels. Owing to the stringent emission regulations introduced by the European Union (EU), the use of biodiesels, an alternative fuel, has become quite popular over the last decade [
1,
2]. Similarly, the 2009/28/EC directive further encouraged the use of biodiesels by allowing the addition of up to 10% in volume of alternative fuels to conventional diesels. Biodiesels have considerable benefits compared to their conventional counterparts as they are renewable energy sources, biodegradable, and non-toxic [
3]. Moreover, their higher cetane number results in a reduction in the ignition delay duration (IDD) compared to conventional diesels [
4]. In addition, facts of the higher O
2 in their chemical chain and the absence of both aromatics and sulfur in the chemical composition reduce the particle emission and lead to a more complete combustion and a cleaner burn [
5]. Despite the mentioned benefits of biodiesels, they have higher viscosity (than conventional diesels), which causes less atomization and lower energy content because of high oxygen by weight [
6].
Due to the benefits of biodiesels, they have been extensively studied to assess their improvements on compression ignition engines and significant results regarding their effect on emission and performance were obtained [
7]. Earlier studies [
8,
9,
10] revealed that addition of biodiesel to diesel leads to an increase in the brake specific fuel consumption and a decrease in the thermal efficiency of the combustion due to their lower gross calorific value (GCV) than diesels (i.e., biodiesels reduce the engine power and increase the fuel consumption). On the one hand, it has been shown that biodiesels have higher oxygen content and less aromatic compounds compared to diesels, which reduces hydrocarbon (HC), carbon monoxide (CO), particulate mass (PM) and particulate number (PN) emissions [
11,
12]. Furthermore, it has been presented that the nitrogen oxide (NO
x) emissions of compression ignition engines increase due to the higher oxygen content of biodiesels [
13,
14]. In addition to this rise in NO
x, Gokalp et al. have reported a CO
2 increase due to the greater available time for converting the formed CO into CO
2 when an engine runs with biodiesel blended fuels [
4].
A wide range and large number of related experiments were reported in the literature [
1,
6,
15,
16], using various biodiesel-to-diesel blend ratios in accordance with the transient regulation test cycle mandated by the EU, namely, the New European Driving Cycle (NEDC), in order to investigate the effects of biodiesels on the exhaust emissions of passenger cars. Lopes et al. [
15] and Serrano et al. [
6] concluded that blend ratio does not directly affect the emissions and the fuel consumption. Moreover, according to investigations made by Armas et al. [
16], the comparison of emissions using biodiesel and diesel gave different results under the first and second phases of NEDC which are defined as Elementary Urban Driving Cycle (UDC) and Extra Urban Driving Cycle (EUDC), respectively. NO
x emissions of biodiesel-added blends are lower in the UDC compared to diesels. In contrast, NO
x emissions of biodiesel-added blends are higher in the EUDC compared to diesels. Similarly, the fuel consumption increase of biodiesel-added blends in the UDC is less than the increase in the EUDC. Armas et al. stated that the lower load conditions of the EUDC than the UDC cause these different emission behaviours [
16].
Although the NEDC has been used for twenty years for the Type Approval (TA) procedure, the United Nations Economic Commission for Europe (UNECE) started the development of a new TA procedure in 2009, namely Worldwide Harmonized Light Vehicles Test Procedure (WLTP), to have a more realistic driving cycle [
17]. Phase-1 version of the WLTP with the name of Global Technical Regulation was released in 2015 [
18]. Although researchers have investigated exhaust emission and fuel consumption difference of the NEDC and the Worldwide Harmonized Light Vehicles Test Cycle (WLTC) [
19,
20], very limited experimental data exists in the literature on the effects of biodiesel over the WLTC.
In this study, a two-phase experimental analyses were carried out to investigate the effects of biodiesel produced from canola oil on emission and performance of diesel engines. A vast majority of studies in the literature investigated the effects of biodiesels on the performance and emission, adopting transient regulation cycles. The emissions and performance differences of biodiesel usage under the NEDC and WLTC have not been investigated yet. Thus, in this study, a biodiesel-blended fuel is tested under both the NEDC and WLTC. In the first part, a EURO-5 compliant diesel passenger vehicle was tested under the NEDC and in the second part the WLTC experiments were performed to investigate the effects of biodiesel on the emission and performance of the same vehicle.
2. Materials and Methods
2.1. Test Vehicle
The vehicle utilized in the experiments is a 2014 model year Ford Fiesta, which has a turbocharged 1.5-L diesel engine equipped with a common-rail direct injection. Besides, the vehicle has a diesel particulate filter (DPF) and diesel oxidation catalyst (DOC) in its exhaust configuration to comply with EURO-5 emission standards. The technical specifications of the vehicle and engine are listed in
Table 1. Usage of 1.5-L diesel engine is quite common in the Turkish market, as counterpart vehicles such as the Peugeot 206, Citroen C3, and Renault Megane also use similar 1.5-L diesel engines.
2.2. Test Fuel
The Turkish Government permits the use of diesels and biodiesels complying with EN590 and EN14214 standards, respectively. The diesel fuel that was needed for our experiments was bought from a Shell Oil Company gas station, whereas pure biodiesel, which was produced from canola oil, was supplied from DB Tarımsal Energy Company (Izmir, Turkey). One blend of diesel and biodiesel with thirty percent volumetric proportion of biodiesel and seventy percent volumetric proportion of diesel were prepared. This prepared biodiesel diesel blend was named B30, whereas B00 was used to designate the pure diesel in this study. The physical properties of the pure diesel and biodiesel-diesel blend were analyzed at the fuel analyses laboratory of the TUBITAK Marmara Research Center (MRC) Energy Institute. The pure biodiesel analysis results were acquired from the DB Tarimsal Energy Company. The physical properties of all test fuels are provided in
Table 2. Although the biodiesel has similar properties to the diesel,
Table 2 summarizes the differences. The density, viscosity, and flash point temperature of pure biodiesel (B100) are higher than those of pure diesel (B00); on the other hand, the lubricity and GCV of B00 are higher than those of B100.
In addition to the physical properties of biodiesel and diesel, the molecular formulas of diesel and biodiesel are different. Heywood provided the general chemical formula of diesel as C
nH
1.8n [
21]. Furthermore, Bermudez et al. [
5], Salamanca et al. [
22], Suh and Lee [
23] and Ozener et al. [
13] have used a similar molecular formula for diesel in their studies, whereas, they provided the molecular formulas of biodiesel as C
18.3H
34O
2, C
18.05H
34.9O
2, C
18.74H
34.43O
2 and C
18.74H
34.51O
2 respectively. The percentage of biodiesel’s oxygen weight to total weight of the whole molecule is more than 11%. Therefore, the oxygen content of the biodiesel is richer than that of diesel.
The theoretical stoichiometric Air Fuel Ratios (AFRs) of pure diesel and biodiesel are different as their molecular formulas are different. The molecular formula of diesel (C
14.1H
25.8) was selected from the experimental studies. The molecular formula of biodiesel (C
18.4H
34.2O
2) was provided by DB Energy, which is calculated from fatty acid distribution. Then the oxygen molecules necessary for theoretical combustion of the diesel and biodiesel were calculated according to Equations (1) and (2). The AFRs for diesel and biodiesel were calculated by dividing the molecular weight of each fuel by the necessary air weight as provided in
Table 2:
Once the AFR was calculated, the lambda (λ) of each fuel was calculated by Equation (3). MAF and F
mass are the air and fuel flow to the engine which were gathered from the On Board Diagnostics (OBD) port of the vehicle.
Figure 1 shows the λ change over both cycles for B00 and B30. Over the WLTC, λ varied from 1.2 to 4.5 according to the engine operating point, whereas λ changed from 1.0 to 4.0 over the NEDC. In both cycles the blue line (B30) is slightly higher than the black line (B00), therefore B30 has higher lambda than B00, as can be seen in
Figure 1.
The impact of biodiesel on emissions and performance increases when a higher amount of biodiesel is blended into diesel. Nevertheless the effects of the biodiesel blend is not proportional to the blend ratio [
24,
25]. Moreover, higher blends of biodiesel to diesel of more than 30% may exceed the legal limit of EN590 and are not common [
26], therefore B30 was selected for experiments to compare the differences between WLTC and NEDC.
2.3. Experimental Setup
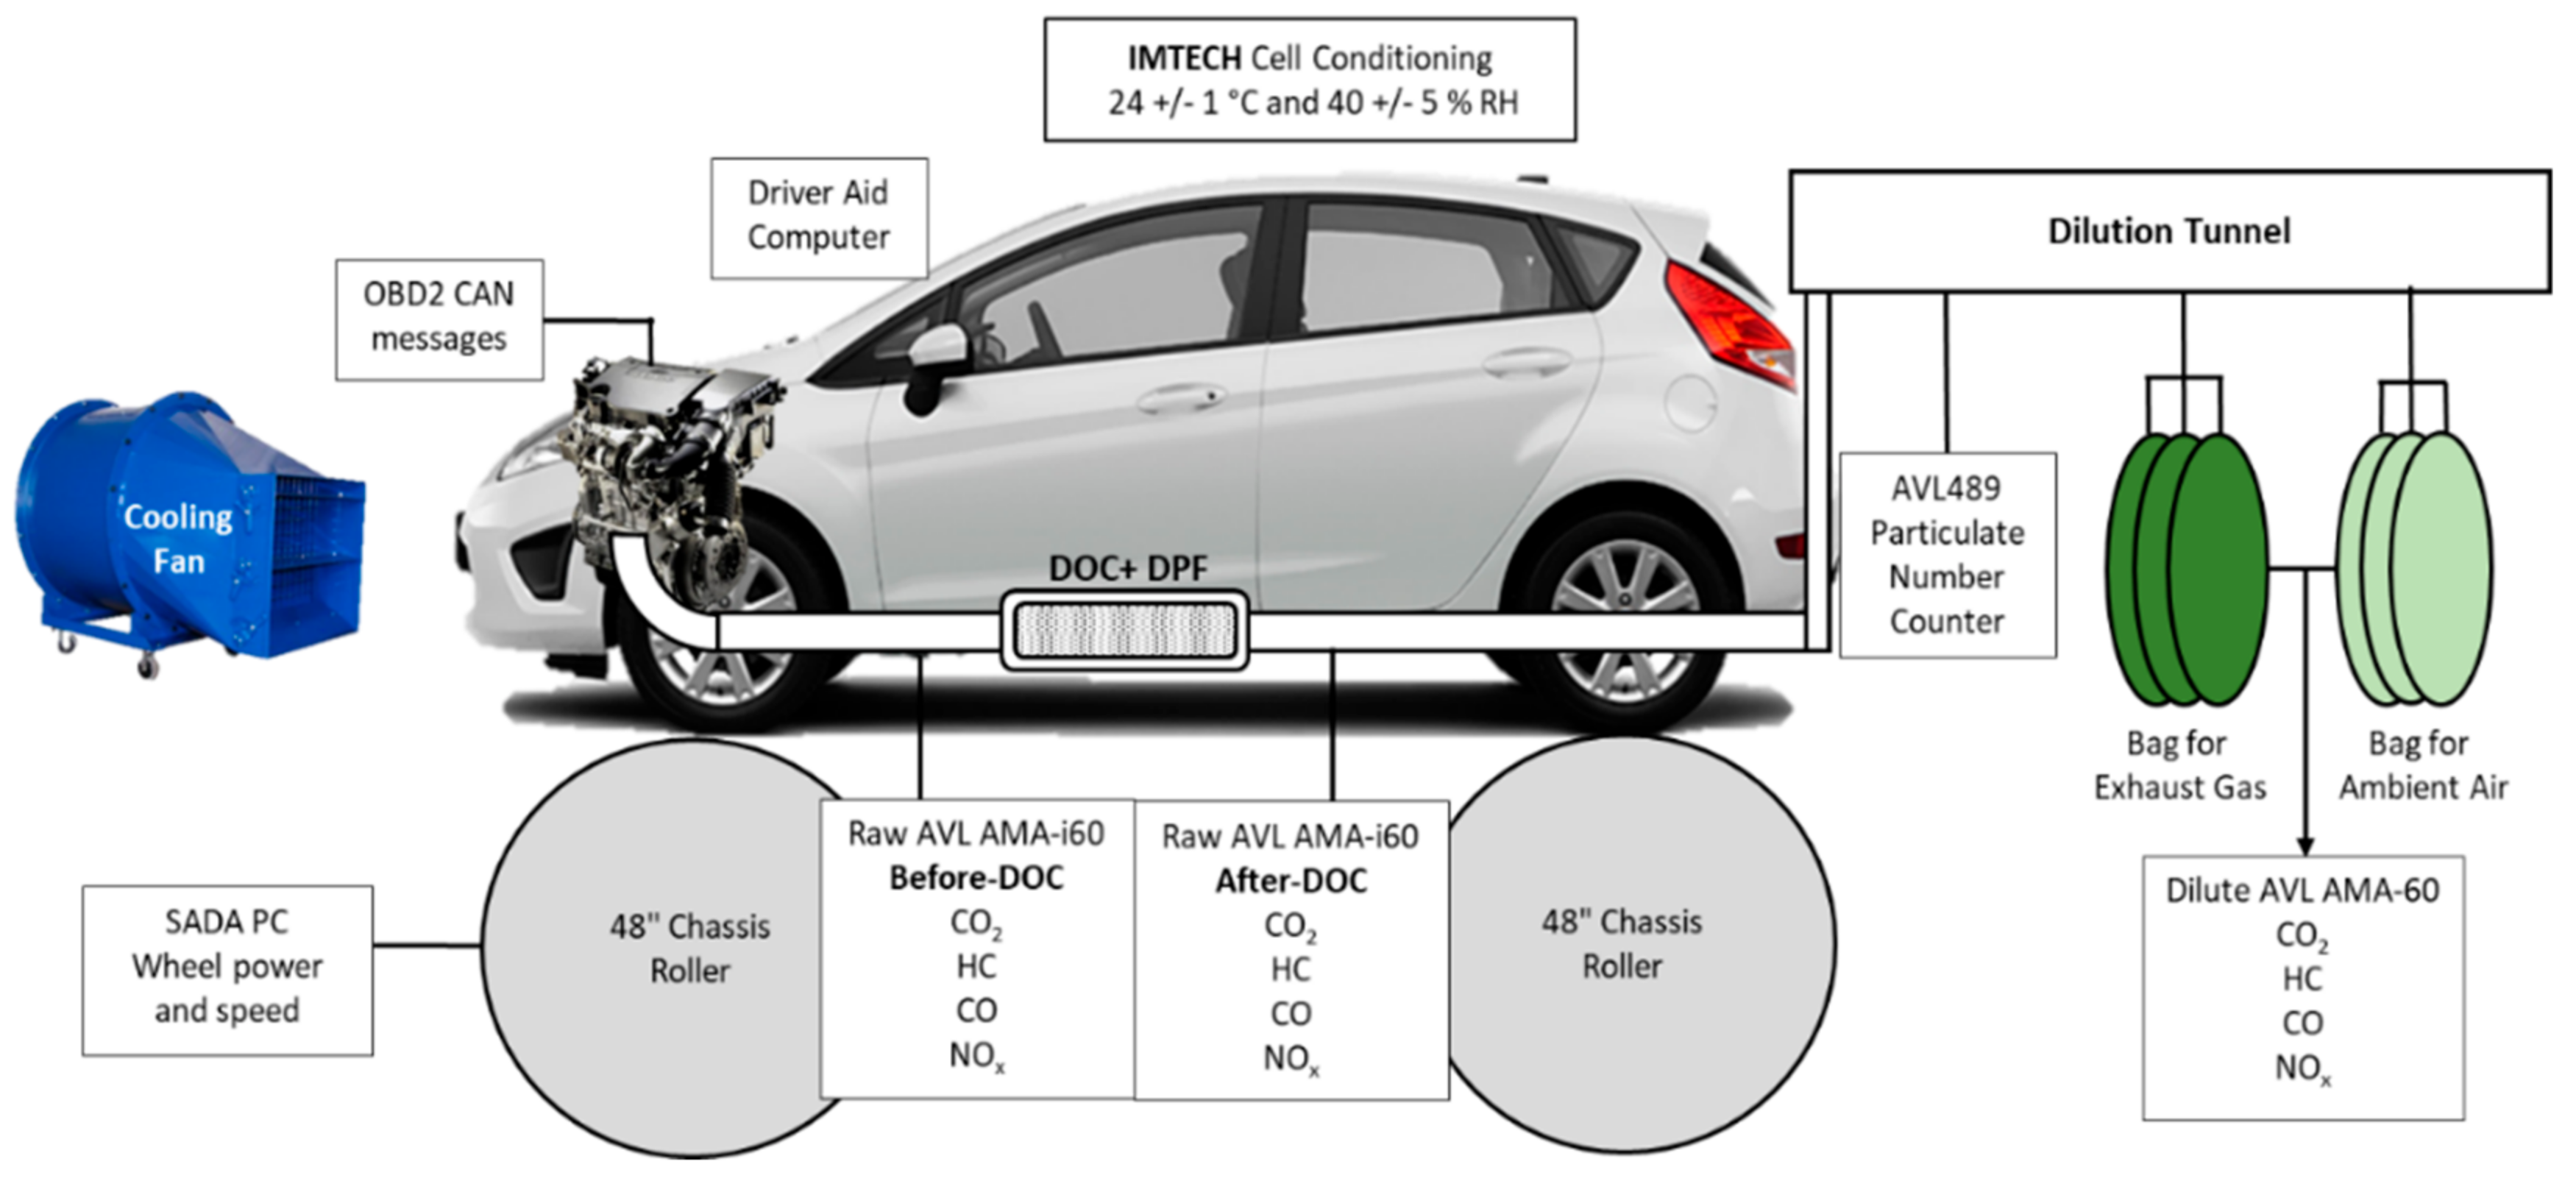
The experiments of this study were performed on the two axle chassis dynamometer of the TUBITAK MRC Energy Institute. The chassis dynamometer is capable of decelerating or accelerating the test vehicle using its 220-kW AC electric motors on both its axles. The exhaust emission measurement system of the chassis dynamometer has a dilution tunnel, constant volume sampler, AVL AMA-i60 dilute and raw exhaust gas analyzers (AVL Gmbh, Graz, Austria), an AVL particulate number counter device, an IMTECH test cell temperature and humidity controller (Weisstechnik Gmbh, Hamburg, Germany), a SADA wheel power and speed measurement computer (AVL Gmbh, Graz, Austria), and a driver aid computer. A schematic of the chassis dynamometer with its measurement devices can be seen in
Figure 2.
The driver aid computer is necessary for the driver to follow the transient cycle. It shows current and target vehicle velocity on a time scale. Power, force and velocity of the vehicle were measured via the chassis dynamometer. In addition, coast down parameters, which were selected from “simulated inertia and dyno loading requirements” table in UNECE R83, were also applied from the chassis dynamometer computer. Temperature and humidity of the chassis dynamometer were controlled with the Imtech climatic system. All tests were performed at 24 ± 1 °C and 40 ± 5 percent relative humidity. As well as dilute emission measurement of the NEDC according to the UNECE R101 regulation, to be able to determine emission behavior during the NEDC, raw emissions of CO, HC, NOx, and CO2 before and after DOC were measured by AVL AMA-i60 raw gas analyzers.
The AVL diesel particulate number measurement device was used to record particulate number (PN) emission over the NEDC and WLTC as a PN emission limit has been applied since September 2014 with the Euro-5b emissions regulation.
In addition to emission data, the OBD port of the vehicle was used to acquire available engine sensor data. OBD data was used to evaluate vehicle condition during experiments. Original Equipment Manufacturers (OEMs) release CAN messages with the same ID via the OBD port to meet European OBD requirements for 2000 and later model year vehicles. Data of the engine sensors that were acquired from the OBD port are as follows; acceleration pedal position (APP), engine speed, manifold air pressure, air flow sucked by engine, exhaust gas recirculation (EGR) valve position, exhaust gas temperature before and after the diesel particulate filter, battery voltage, injection fuel pressure, total fuel injected to the cylinder and engine coolant temperature.
2.4. Test Procedure
The NEDC and WLTC testing were conducted with diesel and biodiesel-diesel blends to investigate the emissions of each cycle, to explore the biodiesel impact on the upcoming TA procedure and to compare the biodiesel effects on each cycle.
Experiments started with the NEDC testing. First, to drain the fuel tank, the vehicle was driven on the chassis dynamometer until all the fuel was depleted. Afterwards, the vehicle was refueled with three liters of prepared test fuel and parked in a soaking area to condition for at least 8 h before the NEDC testing as defined in the regulations. During soaking, the 12-volt battery of the vehicle was charged and tire pressure was set to 30 PSI as they have impacts on the results. After soaking, the vehicle was placed on the chassis dynamometer without cranking the engine as described in UNECE R83. All NEDC experiments were conducted with the same driver and under the same conditions to minimize any external effects on the results. Three cold NEDC tests were performed, first with B00 and then B30.
After completing the NEDC tests, WLTC tests were performed with B00 and B30 in order to examine the effects of biodiesel on the regulated emissions of the new TA procedure. Similar to the NEDC procedure, first B00 and then B30 were added to the drained fuel tank. Three cold WLTC experiments were also done for each fuel after 8 h of soaking.
2.5. Calculation Method
Evaluating the acquired experimental data is very critical for a proper comparison of different cases. The results of the NEDC experiments were automatically calculated via the AVL IGEM software according to the UNECE-R83 regulation from the dilute emission measurement results. In addition to dilute emission measurements, the IGEM software was used to calculate the results from raw emission data to evaluate the accuracy of the dilute emission measurements.
The WLTC experiments’ emission data were evaluated according to UNECE Regulation 49 (emission of pollutants of heavy vehicles). UNECE-R49 defines the necessary formulation to calculate the mass of the pollutants from raw emission measurements, therefore, Equation (4) from UNECE-R49 was used while calculating the mass emissions from raw emission measurements, where u is a different constant for each exhaust gas that is calculated from its molecular mass, c is the instantaneous concentration of the component in the exhaust gas (ppm), q is the instantaneous exhaust mass flow (kg/s), f is the data sampling rate (Hz) and n is the number of measurements. Additionally, statistical analysis of the results of the NEDC and WLTC were performed by using both bag and raw emission measurements:
3. Discussion
The conditions of both the test vehicle and laboratory have impacts on the results. Brace et al. and Loiselle-Lapointe et al. studied the effect of testing factors and found out that the battery state of charge, engine oil level, pedal busyness, speed error, road fan speed, vehicle alignment, tire type, tire pressure, and simulated vehicle mass have significant impacts on the results [
27,
28]. As the same test vehicle was used for all experiments, tire type and vehicle mass were same for all cases. Influence of engine oil level, tire pressure, and battery state of charge on results were eliminated by controlling and recording values before each experiment by the test operator. Vehicle alignment, speed error and road fan speed were controlled with chassis dynamometer control system’s sensors. In order to minimize the effect of pedal busyness the same driver performed all experiments.
In addition to these parameters, engine sensors were monitored via OBD during each experiment to ensure that the same conditions were used. The engine speed, APP, battery voltage and engine coolant temperature of the vehicle were monitored and controlled during the experiments to minimize the effects of these parameters on emissions. Although there are minor differences, an experienced driver could drive the cycles without any violation as desired in the TA procedure.
Results of the NEDC and WLTC experiments with B00 and B30 were grouped to be able to compare the effects of biodiesel on CO2, NOx, HC, CO and PN over both cycles. Moreover, a brief comparison of the load distribution of the NEDC and WLTC was performed.
3.1. Comparison of Load Profile and Cycle Dynamism of the WLTC and the NEDC
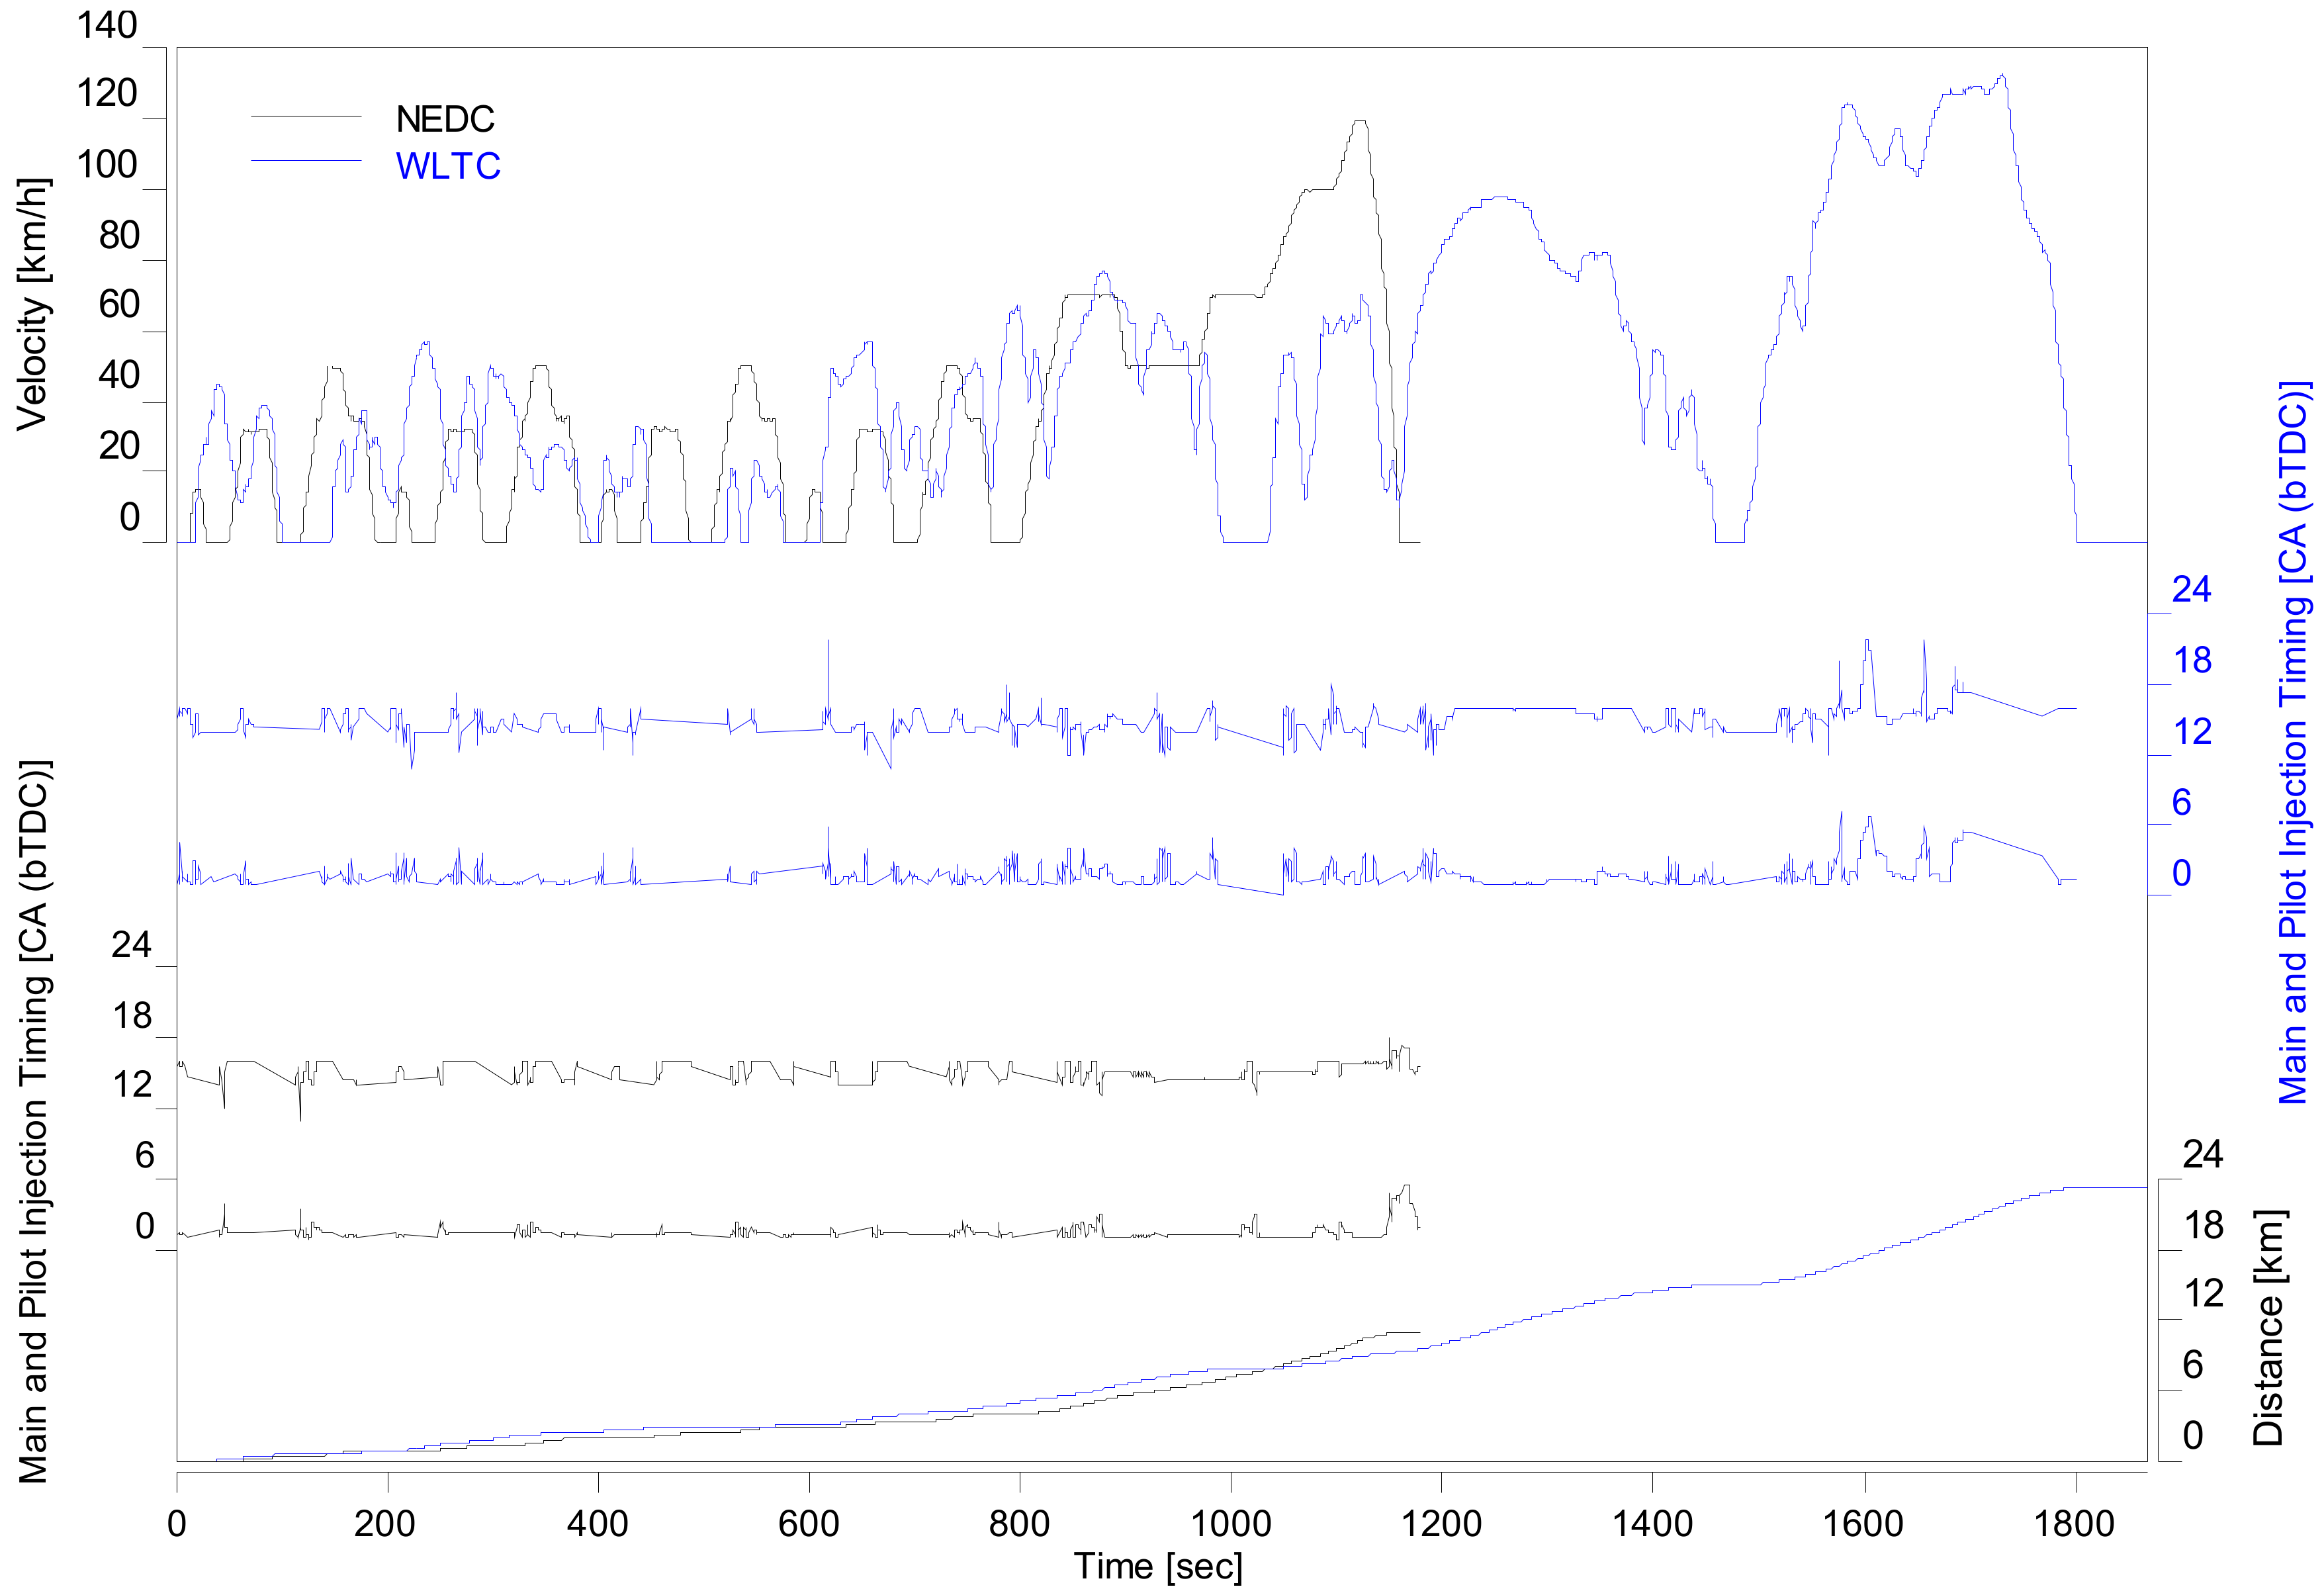
The European Commission has been following WLTP instead of the NEDC for TA procedure as of January 2018. The European Commission developed a longer cycle, in terms of both duration and distance, than the NEDC for the TA procedure to simulate more realistic driving behaviour [
17]. Travel duration and distance of the WLTC are 1800 s and 23.27 km respectively, while the NEDC lasts 1180 s with a total distance of 11.03 km, as can be seen in
Figure 3.
Besides, the engine of the test vehicle has a split injection strategy as shown in
Figure 3. An additional pilot injection was configured with the main injection. Timing of the main injection was changed from 3 to 6 crank angle (CA) before top dead center (bTDC). There is 12 CA duration between the main and pilot injection. Timing of the pilot injection was changed from 10 to 19 CA bTDC. When the engine runs under higher loads, where the velocity of the vehicle is over 50, timing of main and pilot injections were earlier than TDC compared to lower engine loads.
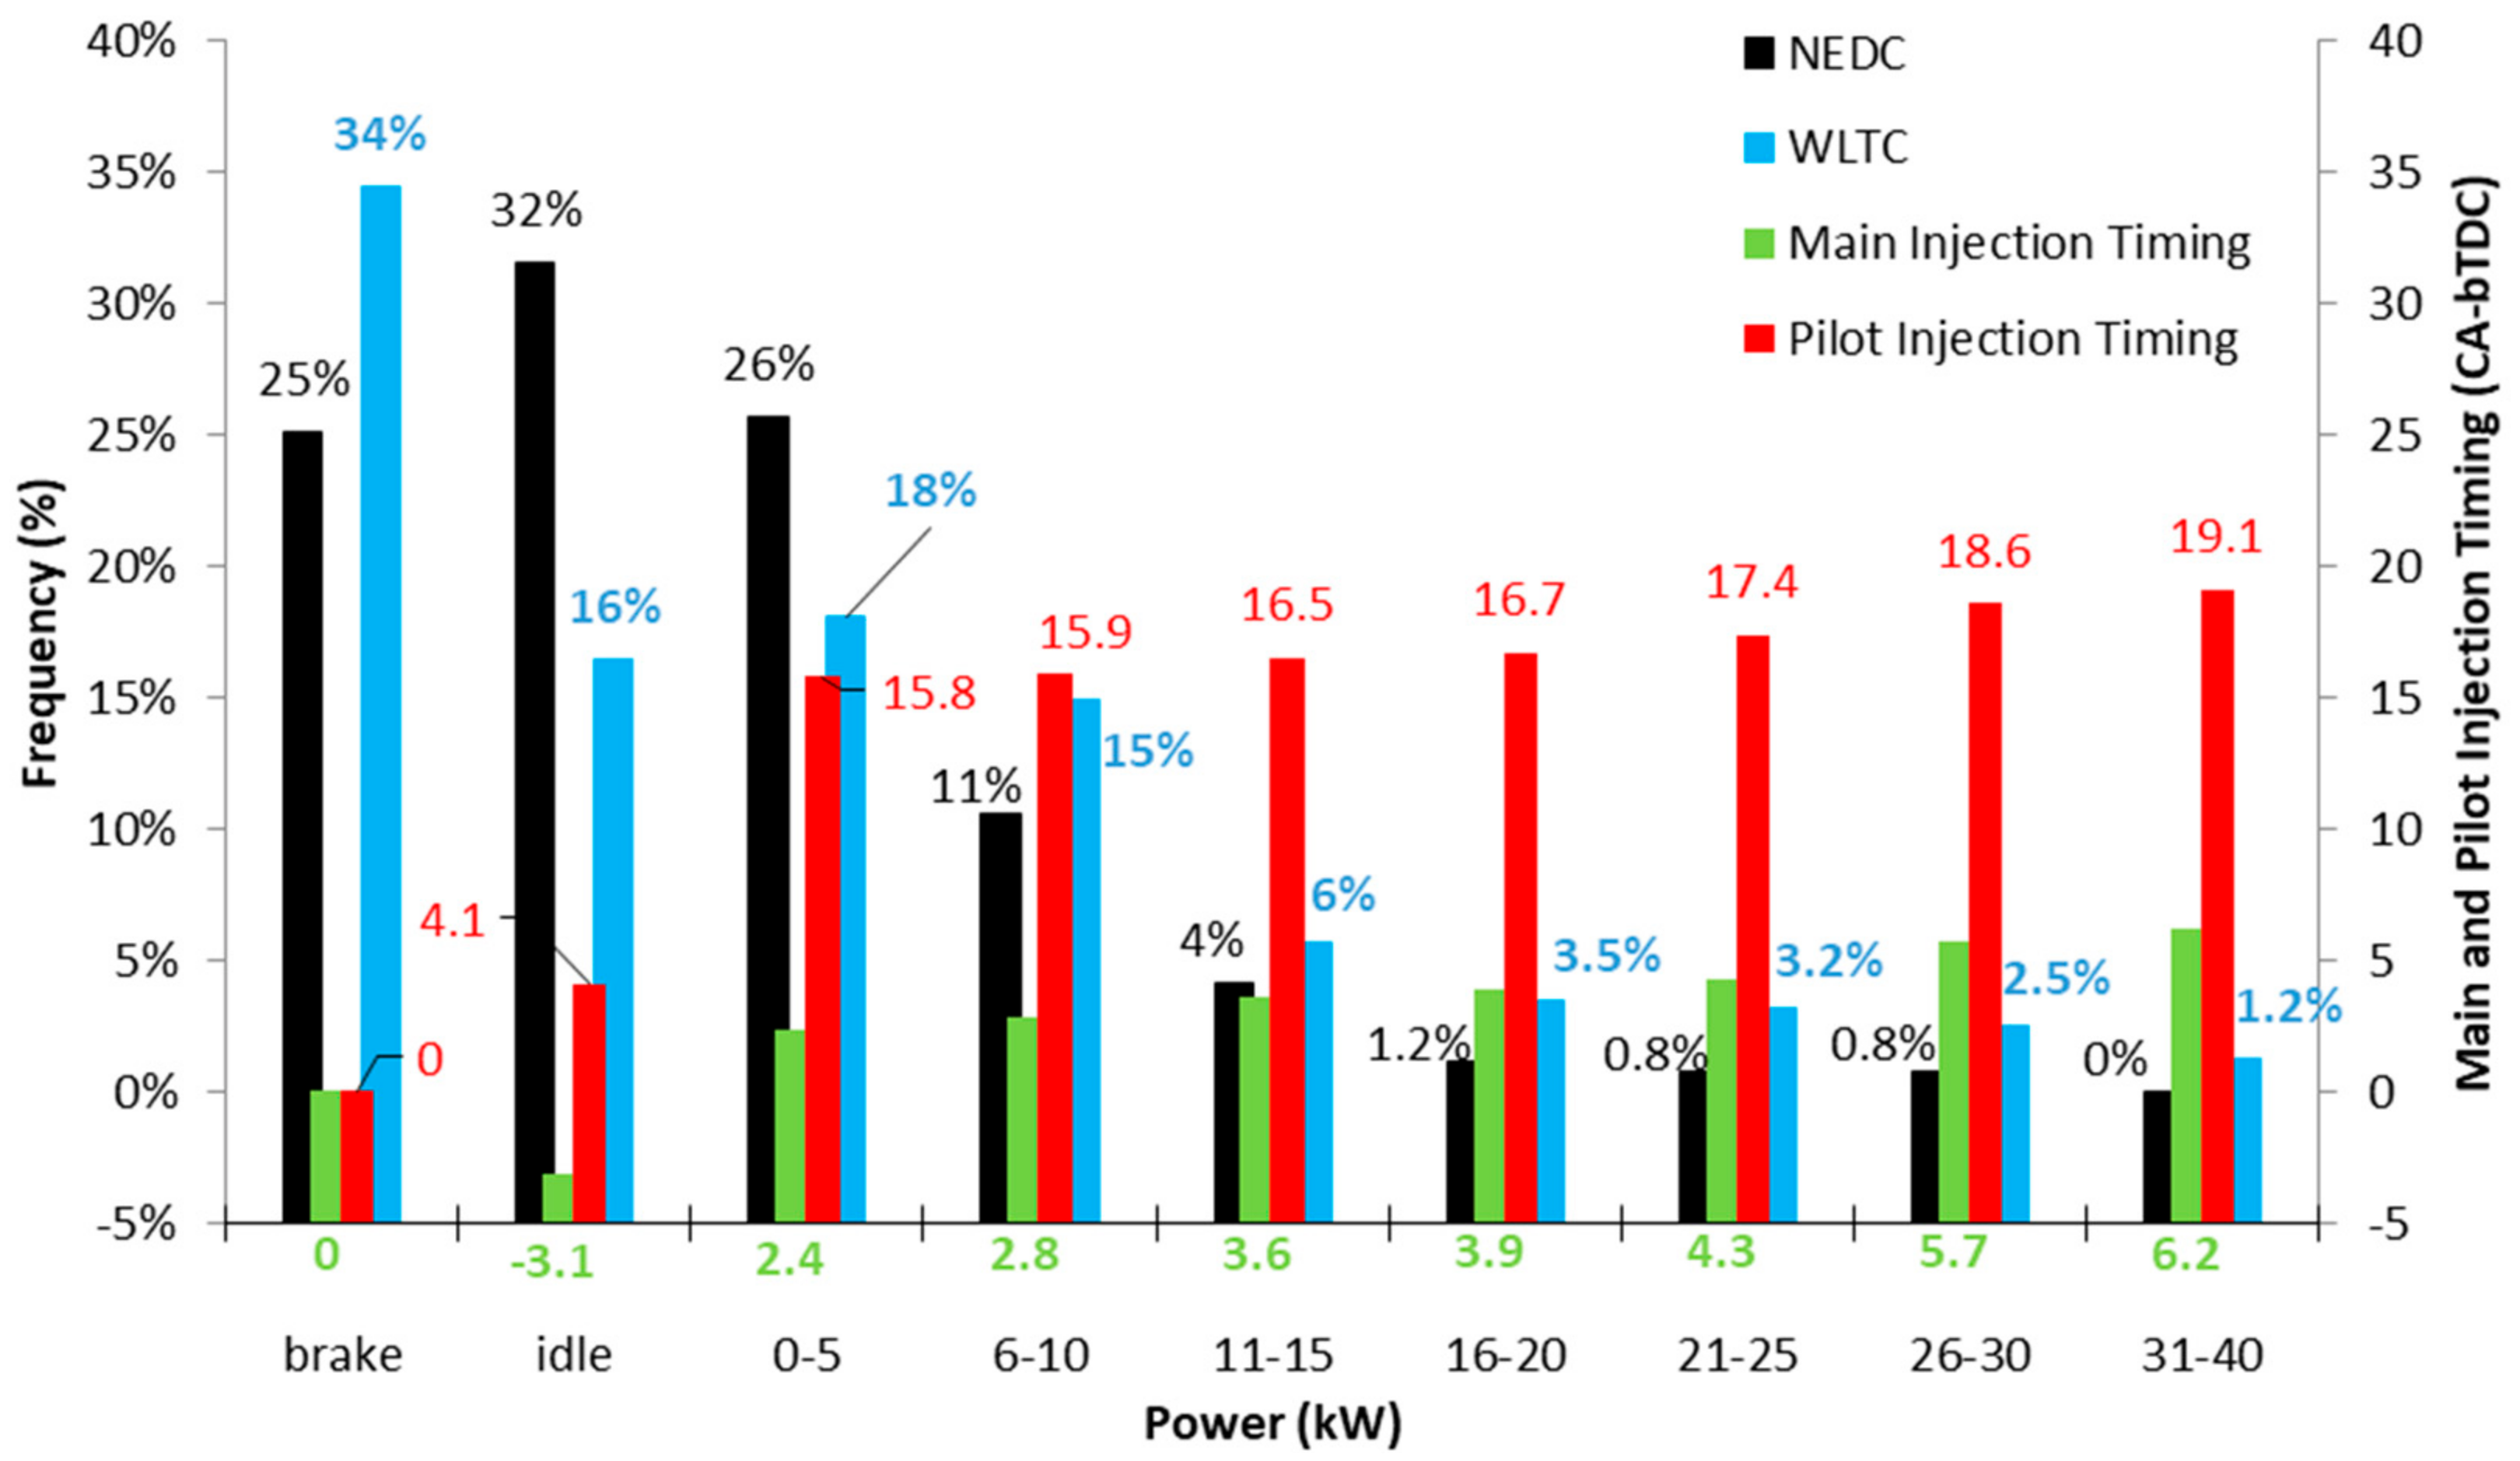
In order to understand the power distribution of the NEDC and WLTC, the gathered wheel load data was grouped as shown in
Figure 4. Injection timing also added to
Figure 4 to indicate that both cycles have the same injection configuration when the engine loads were the same.
Brake label is used for deceleration operation and total braking time is divided to the total cycle time to show the frequency of braking duration in the overall cycle. The remaining zero (idle) and positive wheel power operation points are also grouped as braking operation and also shown in
Figure 4. Frequency of idling and power between 0 and 5 kW operation under the NEDC are 32% and 26%, which is more than half of the cycle, whereas under the WLTC they are 16% and 18% respectively, which enables the WLTC to have a better distribution of the load over the cycle. Green and red bars show the main and pilot injection timings, respectively. As there is no fuelling under braking, injection time is 0. The engine has a different injection configuration under idle; the main injection timing was only after TDC at idle. Main and pilot injections were injected earlier under higher load conditions compared to lower load conditions, as can be seen in
Figure 4. Pilot injection was advanced from 15.8 to 19.1 CA bTDC from 5 to 40 kW, similarly the main injection timing was altered from 2.4 to 6.2 CA bTDC. Additionally, to compare the effects of the biodiesel derived from canola oil on the emissions and performance of the WLTC and the NEDC, the results of each cycle are also compared from a power and emission point of view.
3.2. CO2 Emission and Fuel Consumption
Considerable research has been conducted regarding biodiesel’s impact on CO
2 emissions due to its favorable influence on the environment. However, CO
2 emissions are affected by combustion efficiency-related engine parameters as well as the biodiesel used [
7]. A wide range of experimental results exist in the literature show that addition of biodiesel to diesel both increases and decreases the CO
2 emissions [
7,
9,
11]. According to some researchers, an increase of the CO
2 is related to the 11% oxygen content of biodiesel in the molecular formula [
7,
29] and more complete combustion [
9], whereas many other researchers claim that the lower carbon to hydrogen ratio of biodiesel causes less CO
2 emissions than pure diesel [
11].
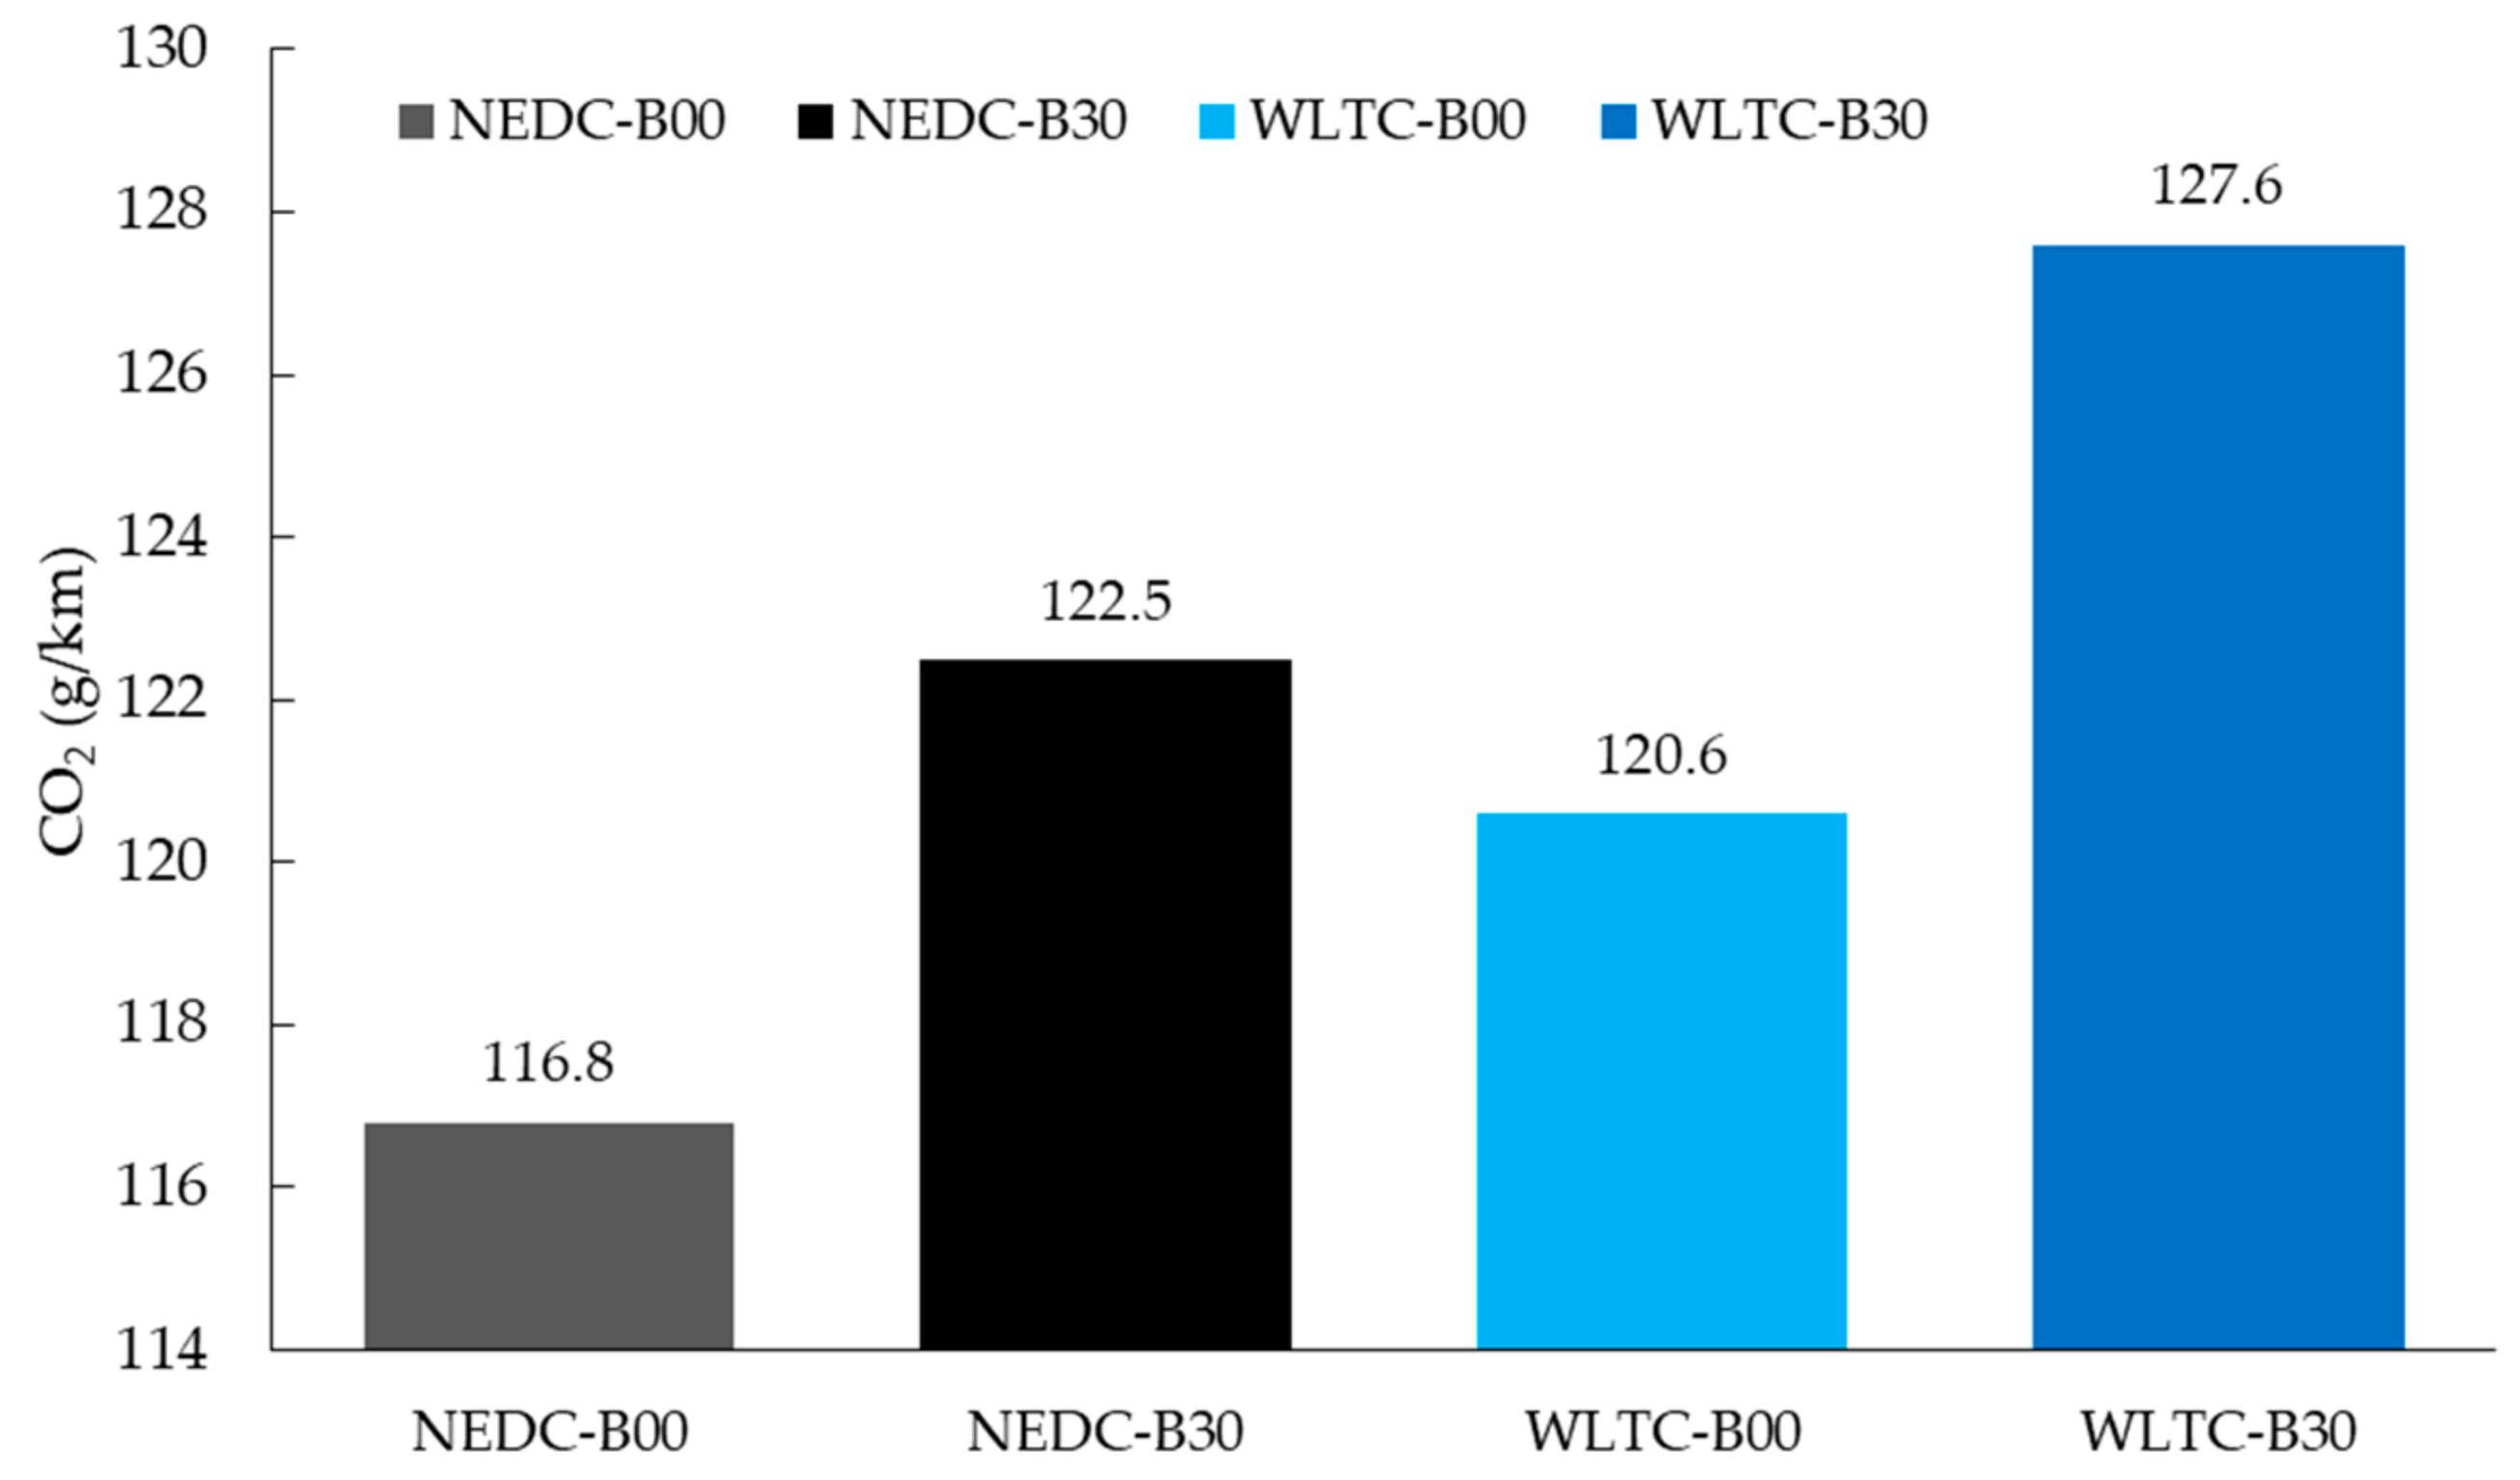
Biodiesel-added fuel emitted more CO
2 emissions than diesel fuel both under the NEDC and the WTLC, as shown in
Figure 5. Since identical engine parameters were used during the biodiesel and diesel tests, it is found that combustion of biodiesel yielded more efficient results than diesel around higher load conditions within the cycles’ speed range.
Results of the experiments showed that biodiesel-added blends have higher fuel consumption than pure diesel under the NEDC and WLTC due to biodiesel’s lower GCV than pure diesel. Besides having lower GCV, due to the combined effect of AFR, combustion temperature, injected fuel pressure, start of injection (SOI), piston bowl geometry, and biodiesel blend ratio on combustion, CO
2 emission varied according to both load and engine conditions. However, even though there is an increase at measured CO
2 in the exhaust gas with biodiesel usage, it should cause less environmental concern as the Argonne National Laboratory study on B100 reveals that life-cycle greenhouse gas emission of biodiesel is 74% lower than that of pure diesel [
30].
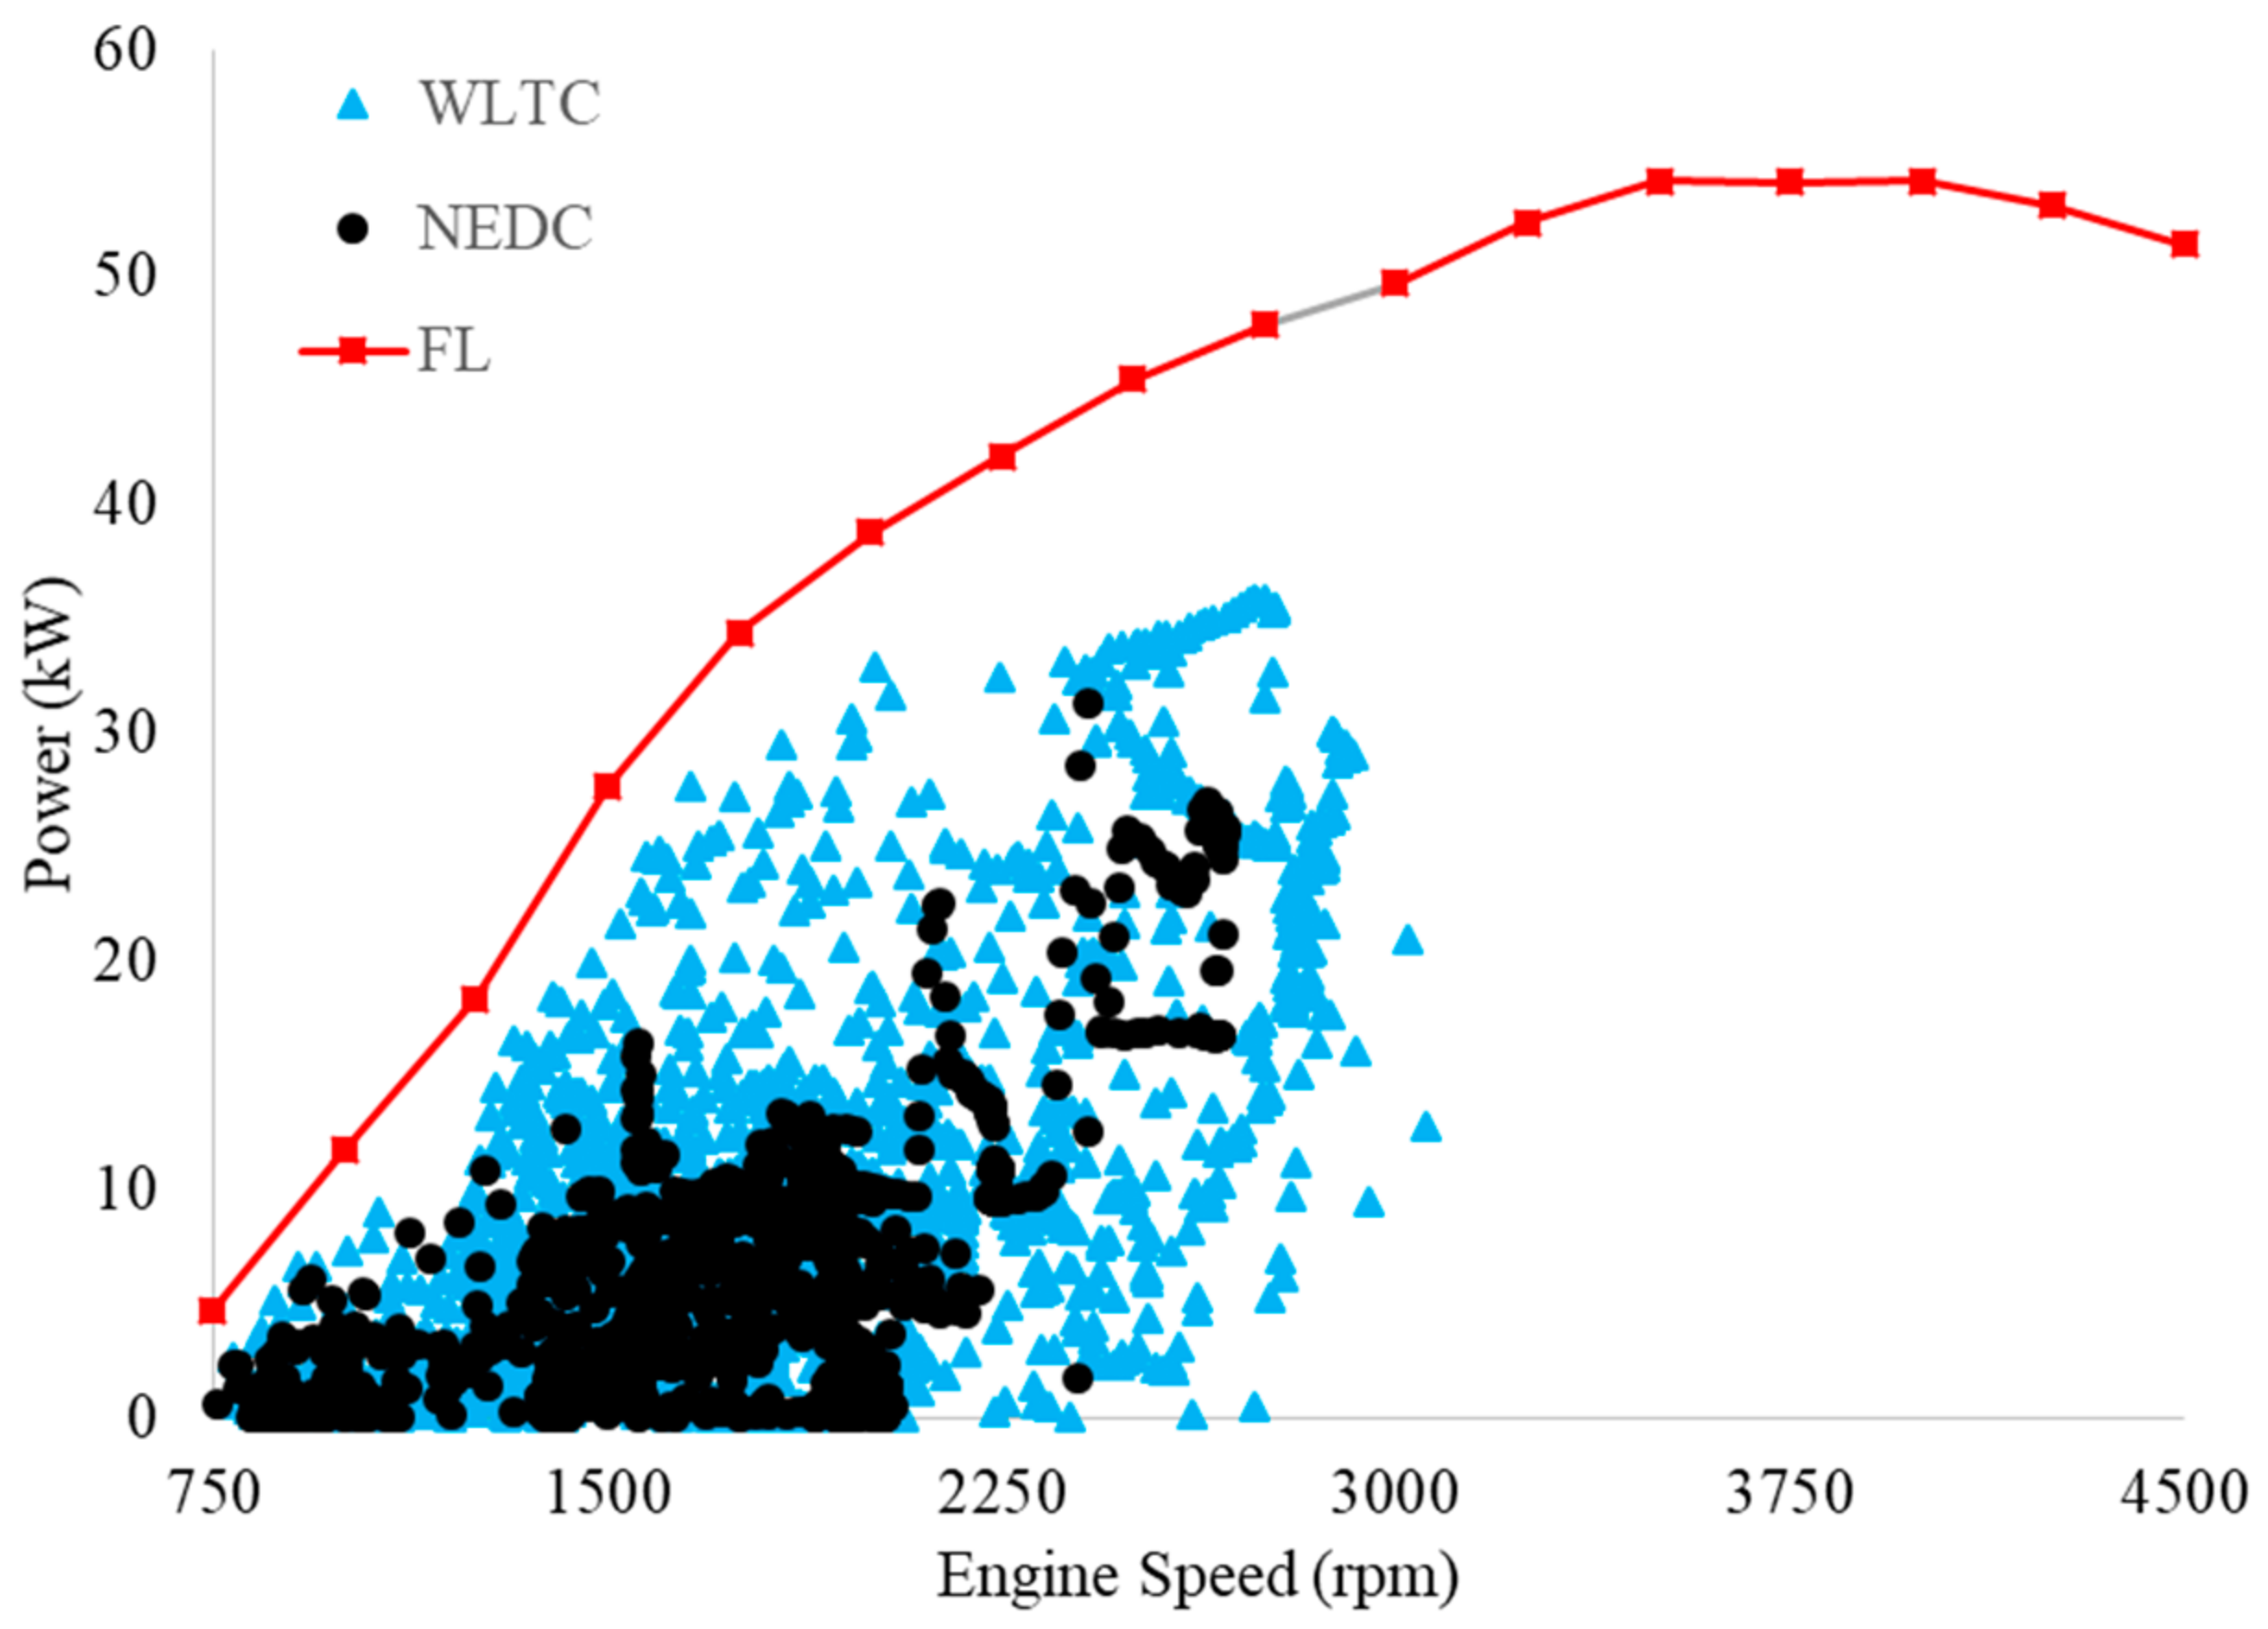
Aside from the wheel power, engine load data according to engine speed under the WLTC and NEDC were plotted to analyze the engine load profile as shown in
Figure 6. Besides, full load (FL) power of the engine, which was measured under a fully open acceleration throttle position on the chassis dynamometer [
31], was added to
Figure 6 to indicate the upper power limit of the engine. The engine operates under higher speed and power conditions in the WLTC compared to the NEDC, which is consistent with the velocity profile of each cycle. Moreover, higher CO
2 emissions in g/km were released over the WLTC (120.6 and 127.6) than the NEDC (116.8 and 122.5) with B00 and B30, respectively. Therefore, the WLTC is determined to operate under higher load and cause higher CO
2 emissions compared to the NEDC.
3.3. Comparison of CO, HC, and NOx Emissions
Although the effects of biodiesel on the exhaust emissions of the NEDC and WLTC differ due to the different velocity and load profile, the use of alternative fuel is encouraged regardless of the TA procedure as the use of alternative fuel reduces the greenhouse gas emissions.
In this section, CO, HC, and NO
x emissions of the WLTC and the NEDC are compared for B00 and B30 in order to understand the emission sensitivity of each cycle. CO and HC conversion efficiency of the DOC is directly related to exhaust temperature due to working principle of the DOC. HC and CO in the exhaust can be converted to H
2O and CO
2 when the temperature at the entrance of the DOC reaches 200 °C, which is the so-called light off temperature. Owing to the higher velocity profile at the beginning of the WLTC compared to the NEDC, exhaust temperature escalation initiated earlier in the WLTC. Moreover, due to the relatively shorter idle duration in the WLTC (compared to the NEDC), resulted in better CO and HC emission conversion over the DOC as shown in
Figure 7.
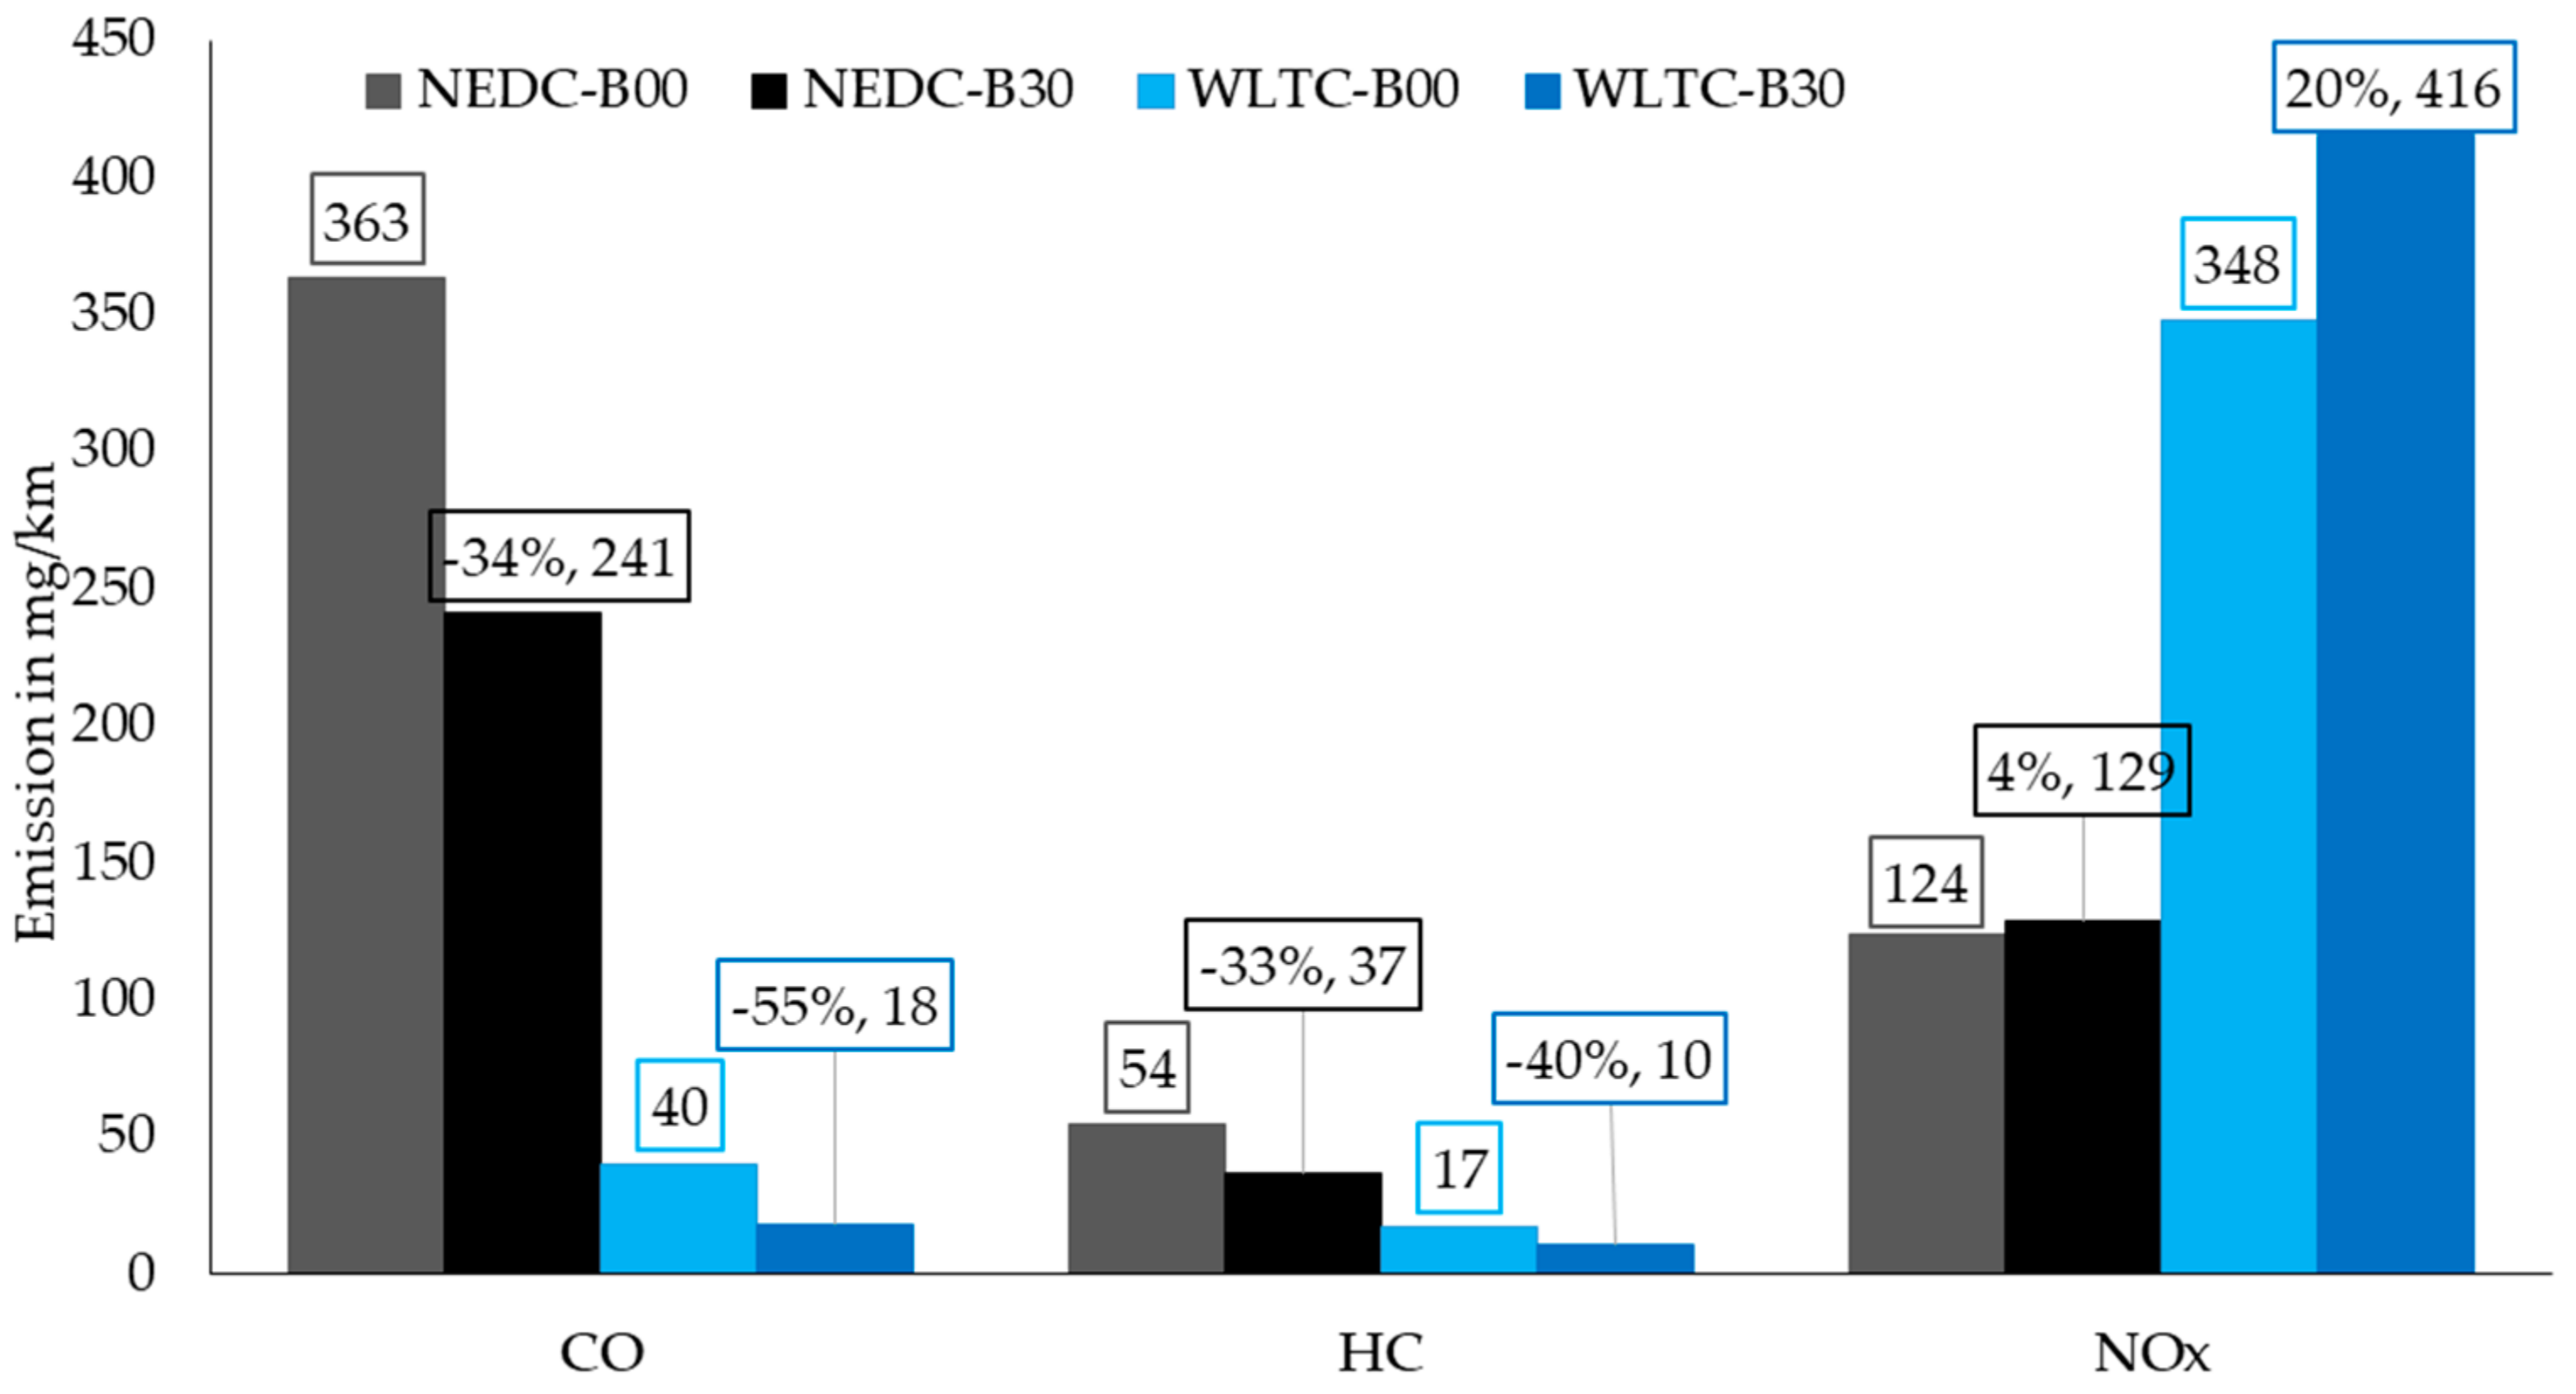
In addition, the use of B30 reduces CO and HC emissions by 34% and 33% under the NEDC whereas the reduction becomes 55% and 40% under the WLTC, respectively, as can be seen in
Figure 8. Therefore, it can be concluded that vehicles can satisfy the CO and HC regulation limit easier under the WLTC compared to the NEDC and WLTC is more sensitive to biodiesel than the NEDC.
Contrary to CO and HC emissions, both NO
x emissions and the rise in NO
x emissions due to biodiesel addition are higher over the WLTC than the NEDC, as can be seen in
Figure 8.
Due to more transient and higher velocity operation profile under the WLTC, NO
x emissions are higher during the WLTC. Especially in the last 200 s of the WLTC, where the vehicle speed exceeds 130 km/h, the NO
x emissions reach 900 ppm, while the maximum NO
x emissions during the NEDC is approximately 300 ppm, as shown in
Figure 7.
In summary, the experiments show that lower CO and HC emissions can be achieved under the WLTC compared to the NEDC while there is clear NO
x emission increase. This result is consistent with the Bielaczyc et al.’s experiments that compared emissions of six different vehicles with pure diesel under the NEDC, WLTC, and FTP-75 [
32]. In addition, the variation of CO, HC, and NO
x emissions from B00 to B30 is higher in percentage under the WLTC than the NEDC, which may be attributed to a higher in-cylinder temperature during the WLTC due to its higher engine speed and load profile compared to the NEDC.
3.4. Comparison of Particulate Number Emission
In addition to gaseous exhaust emissions (CO, HC, and NO
x), the EU regulations have been restricting the particulate mass (PM) and the particulate number (PN) emissions due to their harmful effects on human health. The main source of the soot emissions is the carbon atoms in the diesel fuel. Soot formation begins once the fuel has a hydrogen to carbon ratio around 2 and contains 12 to 22 carbon atoms [
21]. However, regardless of the carbon atom content, the lower aromatics and higher oxygen content of biodiesel prevents the creation of particles and enhances the oxidation of particulate matter [
7,
12].
Although the EU limits both PM and PN emissions, Chuepeng et al. showed the existence of a correlation between the two emissions [
33]. As PN and PM emissions have a similar trend, only emitted PN emissions under the NEDC and WLTC were compared herein.
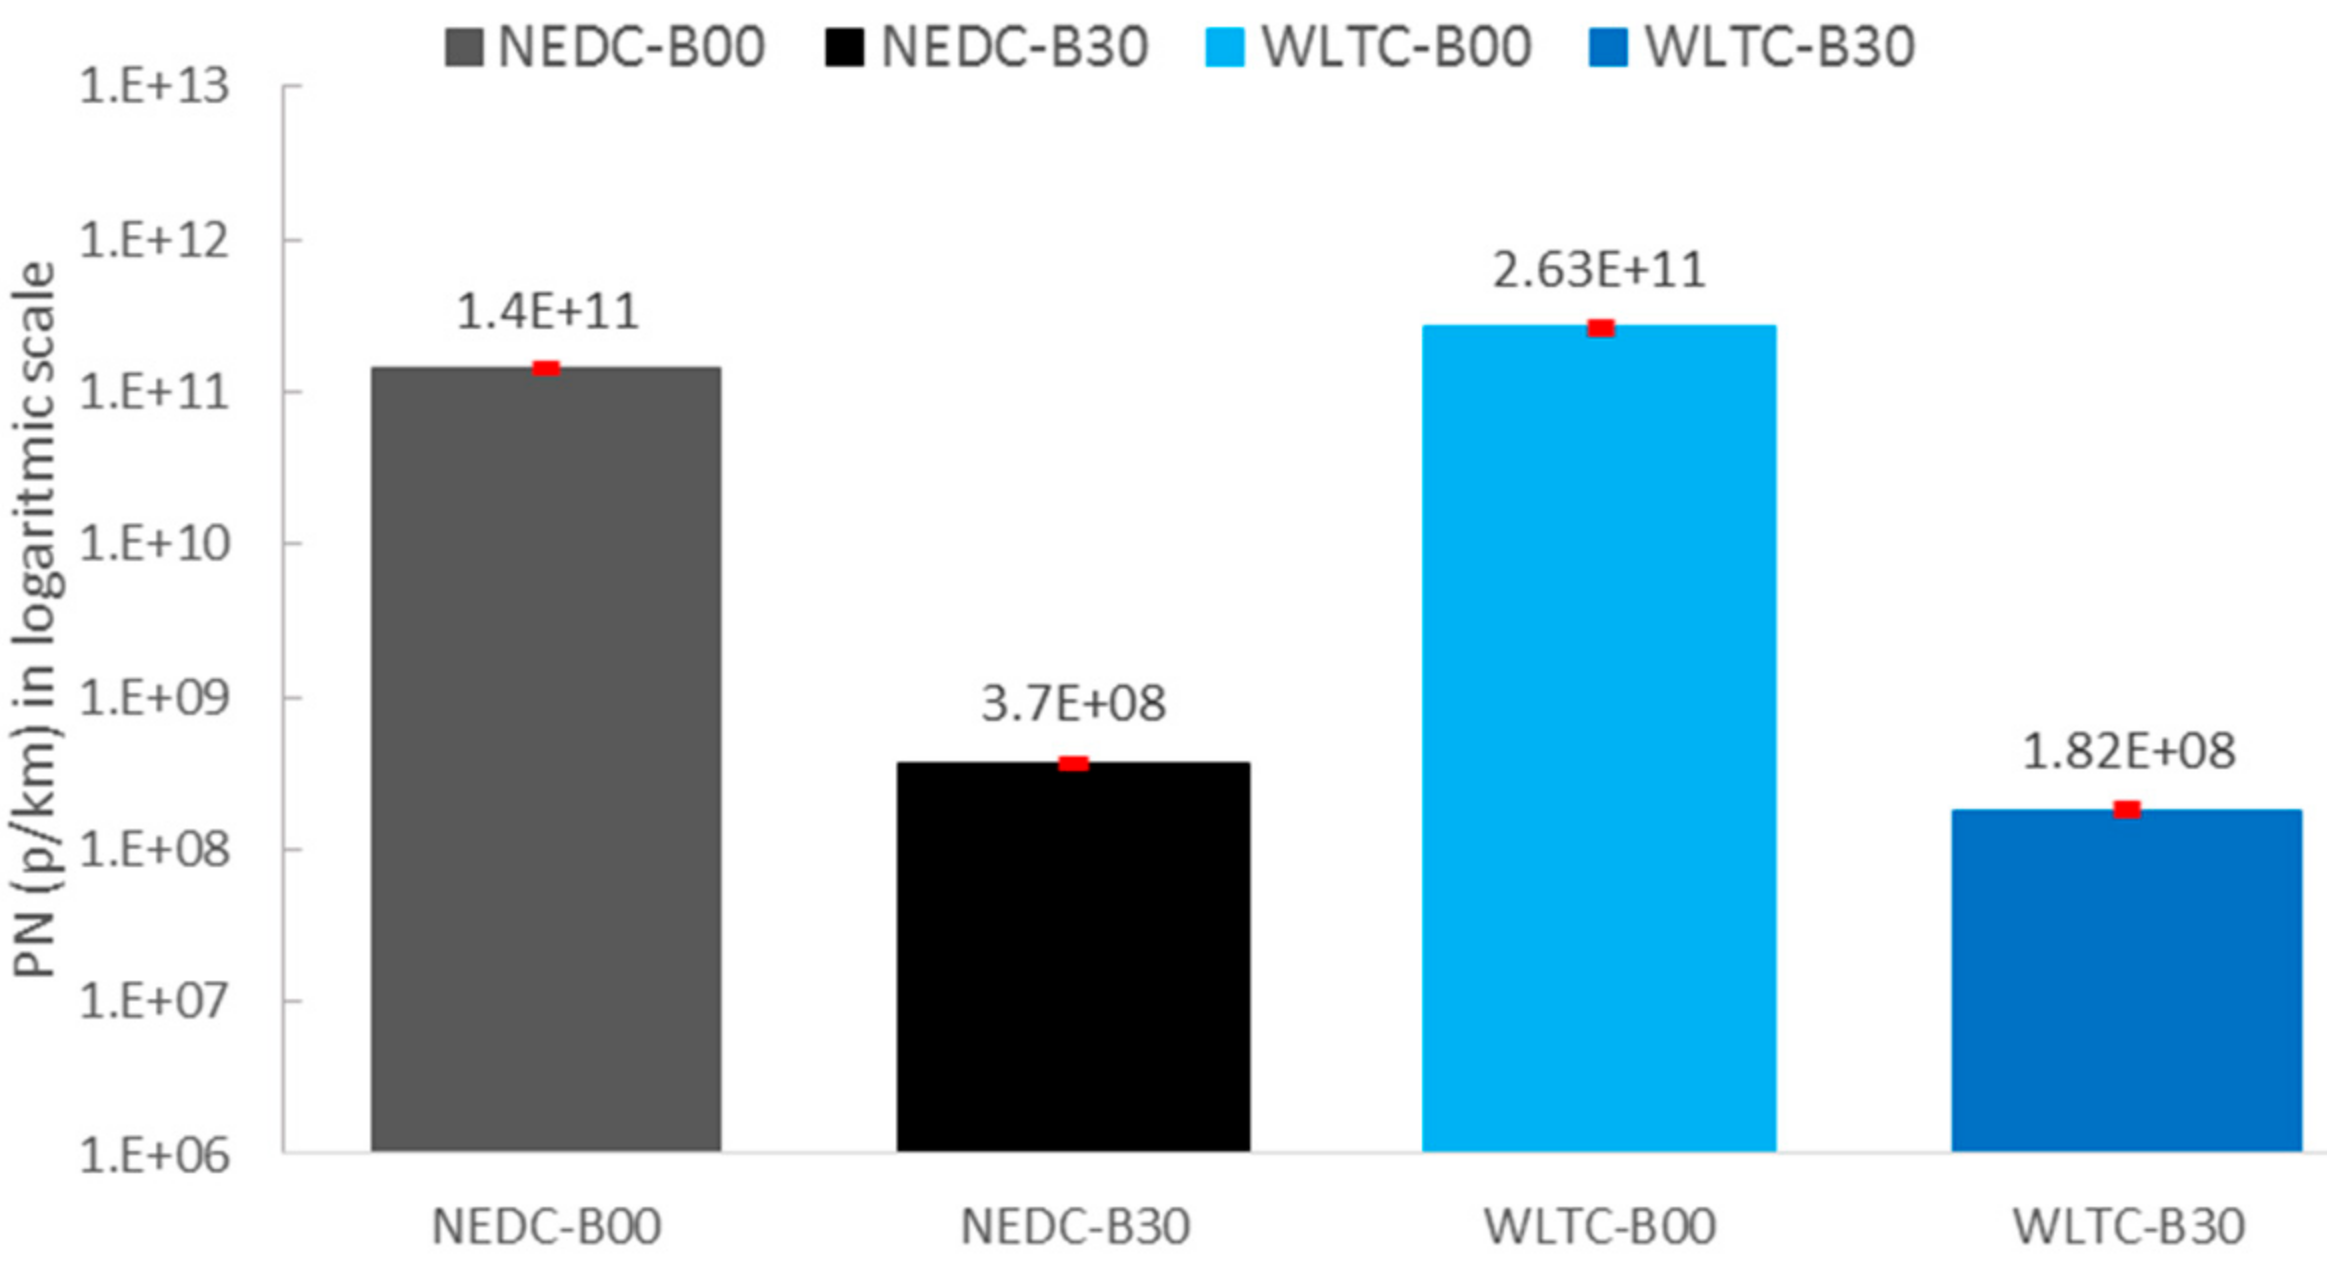
The PN emissions are plotted on a logarithmic scale in
Figure 9 due to the large size of the measured values. Moreover, the reduction rate of the PN emissions was calculated over logarithmic values. The engine emitted 25% and 31% lower PN emissions under the NEDC and WLTC, respectively, with B30 compared to B00 as shown in
Figure 9. Although higher PN emissions were observed in the WLTC than the NEDC with B00, PN emissions under the WLTC were reduced below the PN emissions under the NEDC with B30, which indicates that the WLTC is more sensitive than the NEDC to biodiesel use also for PN emissions. The higher load profile (i.e., in-cylinder temperature) of the WLTC compared to the NEDC may be the reason for the larger PN emission decrease of the WLTC as Leung et al. have also found that biodiesel causes larger decreases in soot emissions under the higher load conditions of their single-cylinder engine [
34].
4. Conclusions and Recommendations
In this study, a Euro-5 capable passenger car with a 1.5 L diesel engine was instrumented to be tested under the NEDC and WLTC. The main goal of this study was to understand the effects of biodiesel use on the current and upcoming EU regulation cycles, to compare both cycles’ biodiesel sensitivity, and to investigate the suitability of biodiesel use to have lower exhaust emissions and fuel consumption by evaluating the effects of biodiesel on the performance and combustion.
Based on the conducted experiments and associated analyses and evaluations, the following conclusions are drawn:
Environmental conditions and vehicle parameters were kept the same during all experiments, therefore the differences found in exhaust emissions, performance and combustion parameters are determined to be mainly due to the biodiesel blend ratios.
In order to keep the power levels identical, such as in the NEDC and WLTC, higher consumption of biodiesel is found to be necessary compared to diesel, as biodiesel has lower GCV than diesel.
Theoretical combustion of the biodiesel need lower air compared to diesel. The AFR of the biodiesel is 12.47 whereas the AFR of the diesel is 14.54.
NOx emissions increased 4% and 20% under the NEDC and WLTC, respectively, with biodiesel use due to its higher oxygen content and the shorter IDD of biodiesel compared to diesel. Besides, biodiesel caused more NOx emissions under high load and more transient operation conditions compared to low load and steady state operation conditions.
Fuelling with B30 reduced CO emission 34% under the NEDC and 55% under the WLTC. Like CO, 33% and 40% reductions were observed in HC emissions under the NEDC and WLTC, respectively.
Reduction rates of the PN emissions were calculated from logarithmic values and the addition of biodiesel to diesel allowed us achieve 24% and 31% lower PN emissions under the NEDC and WLTC, respectively.
CO, HC, and PN emissions can be drastically reduced by use of a 30% blend of biodiesel. Mainly the higher oxygen content of the biodiesel (compared to diesel) allows one to achieve more complete combustion.
Exhaust emissions of the WLTC are more sensitive to biodiesel-blended fuels than the NEDC. The use of biodiesel caused a higher increase in NOx and CO2 emissions whereas a higher decrease in CO, HC, and PN emissions under the WLTC (compared to the NEDC), respectively, due to higher velocity profile and exhaust temperature of the WLTC.
The aforementioned improvements at CO, HC and PN may allow the OEMs to reduce the size of DOC and DPF in the exhaust. Moreover, OEM may request to use biodiesel-blended diesel for certification tests. In further studies, additional improvements in NOx may also be observed by conducting experiments with a vehicle compliant with EURO-6 emissions.


