Article

Improved Boiler-Turbine Coordinated Control of CHP Units with Heat Accumulators by Introducing Heat Source Regulation

1
State Key Laboratory of Alternate Electrical Power System with Renewable Energy Sources, Beijing 102206, China
2
School of Control and Computer Engineering, North China Electric Power University, Beijing 102206, China
3
School of Humanities and Social Sciences, North China Electric Power University, Beijing 102206, China
*
Author to whom correspondence should be addressed.
Energies 2018, 11(10), 2815; https://doi.org/10.3390/en11102815
Submission received: 12 September 2018 / Revised: 16 October 2018 / Accepted: 16 October 2018 / Published: 18 October 2018

Abstract

:
It is significant for power system stability to improve the operation flexibility of grid-connected units. Such improvement has always been a hot topic, especially for coal-fired units. In recent decades, it has become increasingly urgent and challenging as large-scale fluctuant renewable energy is connected to the power grid. Boiler-turbine coordinated control strategy (CCS), which is employed to perform unit load control according to automatic generation control (AGC), has a slow ramp rate in general on account of large delay and inertia of boiler, so to improve the unit operating flexibility, it is necessary to explore usable heat storage and optimize the control strategy. In combined heat and power (CHP) units with heat accumulators, their heat and power are decoupled. Therefore the extraction steam that goes to the heating station can be regulated flexibly even operating in “heat-led mode”. The change of extraction steam flow has a significant influence on the turbine power output, so we propose to improve the load-following capability of CHP units by regulating the heat source flow. In this paper, the influencing model is set up, and it is about heat source flow variations on the electric power output. The load control strategy is further optimized and designed through combinations of CCS and heat source regulation. Finally simulations and analysis are performed on a 330MW CHP unit, and the results reveal that the power ramp rate with our strategy is two times faster than that with traditional strategy.

1. Introduction

In recent years, large-scale of renewable energy sources (RES) such as wind and solar energy have dramatically increased around the world [1,2]. However, such fluctuant and intermittent RES bring great challenges to grid stability and security, which has resulted in an increasing proportion of wind curtailment all over the world [3,4], so the power system requires new solutions that can guarantee high operational flexibility to balance electrical supply and demand [5]. For those countries whose dominant power is coal-fired power, coal-fired power units are the main participants in the load cycling and frequency regulation. Therefore, they have to operate along-side new renewables, and they play an essential role in accommodating RES.
In order to meet automatic generation control (AGC) demands in time, a flexible coal-fired unit should have the ability to modulate electric power. For example, the rise and fall of ramp rates should be fast [6]. At present, boiler-turbine coordinated control strategy (CCS), which is mainly about using the thermal storage in the boiler system, is a popular strategy to regulate steam turbine output power in thermal power plants [7]. However, the slow response is caused by the large delay from mass transport, fuel grinding, and heat’s transfer to the water-steam cycle [8]. Therefore, most literatures tend to optimize CCS by using advanced control algorithms. Sondhi and Hote [9] designed a fractional order PID controller for single-area LFC for all three types of turbines. Yu and Xu [10] proposed to apply feedback linearization technique to the power output control of a boiler-turbine generating unit, and they even designed a nonlinear coordinated controller. Furthermore, robust control [11,12], predictive control [13,14] and fuzzy control [15] have been studied and applied. Apart from the stored energy of the boiler, a large amount of thermal storage existing in the turbine side has being exploited and utilized in recent years. Lausterer [16] proposed condensate throttling to rapidly increase the power output of thermal power plants and Hu et al. [17] set up its nonlinear dynamic model for controller design. Zhao et al. [6] and Umezawa [18] developed feed water bypass and high-pressure (HP) extraction throttling techniques to improve the flexibility of unit. All of the above researches take maximum advantages of boiler and turbine storage to enhance unit operating flexibility and make great contributions on grid stability.
For combined heat and power (CHP) units, they have another available storage in district heat network (DHN) [19] or heat accumulator (HA) [20] despite the above storages. Generally, this storage is used to decouple the unit heat and power to expand their feasible operating area or to improve the economic performance. Zheng et al. [21] proposed to improve the CHP units’ operational flexibility for wind power integration through utilizing the thermal inertia of DHN. Li and other scholars of the related paper [22] formulated a CHP dispatch model considering both the pipelines’ dynamic thermal performance and the buildings’ thermal inertia. Yang et al. [23] and Gu et al. [24] optimized the CHP operating modes considering thermal inertia of district heating network and buildings. Besides, there are many researches that exploit the economic performance, because the CHP plants are integrated with heat accumulators. Korpela et al. [25] presented an analysis on dynamic operability of interconnected CHP plants and district heating networks in Finland. And his analysis was based on the fact that the heat load and electric production can be decoupled temporarily by using the heat storage capacity of DH networks and heat accumulator. Streckienė et al. [26] made an analysis to select an optimal capacity of CHP plant combined with heat accumulator in a competitive energy market, the German spot market. The paper shows an impact of store volume of heat accumulator on generation and their impact on CHP’s income. Željko et al. [27] made an investigation of the heat accumulator’s impact on the EL-TO Zagreb CHP plant economic performance. The Advanced Cogeneration Optimization Model (ACOM) optimization code was used to achieve economic benefits in two ways: the first way is increasing electricity generation during periods of higher electricity prices, and the other is decreasing the total annual electric energy production. Zhao et al. [28] took both heat storage tank and DHN with known heat load into account to optimize the operation of a CHP plant in Finland. The aim of the analysis was to adjust electric energy production by optimizing appropriate water inlet temperature and management strategy of heat accumulator. Nuytten et al. [29] presented a model that confirms the theoretical maximum of flexibility of a combined heat and power system. This system couples to a thermal energy storage solution that can be either centralized or decentralized. But rarely did researchers use the heat storage to improve the unit power ramp rate and control performance.
So it is innovative to improve the load-following capability of CHP units through heat source regulation. However, as sustainable power support originates from fuel supply, heat source regulation should be combined with traditional CCS. So in this paper, an optimized control strategy will be put forward to improve the CHP operating flexibility.
The paper is organized as follows: Section 2 sets up the heat-power conversion model and compensation model of heat accumulator. Section 3 designs an optimized control strategy by combining heat source regulation with traditional CCS. Section 4 shows a case study with simulation and analysis. Section 5 provides the concluding remarks.

2. Model Description

2.1. Plant Description

CHP is well known as cogeneration, and it means using a single piece of plant to generate heat and electricity simultaneously [22]. However, each CHP unit has a heat-power feasible operation region, i.e., heat and power are coupled. As CHP units generally operate in a heat-led mode to meet the heat demand in real time, they decrease the operating flexibility of electric power output. As shown in Figure 1, heat accumulators (HA) are the popular solution to increase the flexibility of CHP units. When necessary, they, as a part of the heat source, are employed to replace CHP units to supply heat. On one hand, it reduces CHP power production to expand the power dispatch ranges; on the other hand, it allows part of heat sources to convert into power to accelerate power ramp rate. The operating point change of the two cases are shown in Figure 2 and Figure 3. In Figure 2 and Figure 3, the points of A, C, D and F are typical operating points of the CHP unit. Point A is the point of rated power load condition. Point C is point of the rated heating load condition. Point D is the maximum heating capacity operating point under minimum load of CHP unit. Point F is the minimum power load operating point. The line AB and EF mean that the HA is responsible for all heating, while the CHP unit is only responsible for generating electricity. For the second case, the heat-power conversion model and the HA compensation characteristics should be firstly made clear to develop the optimized load control strategy.

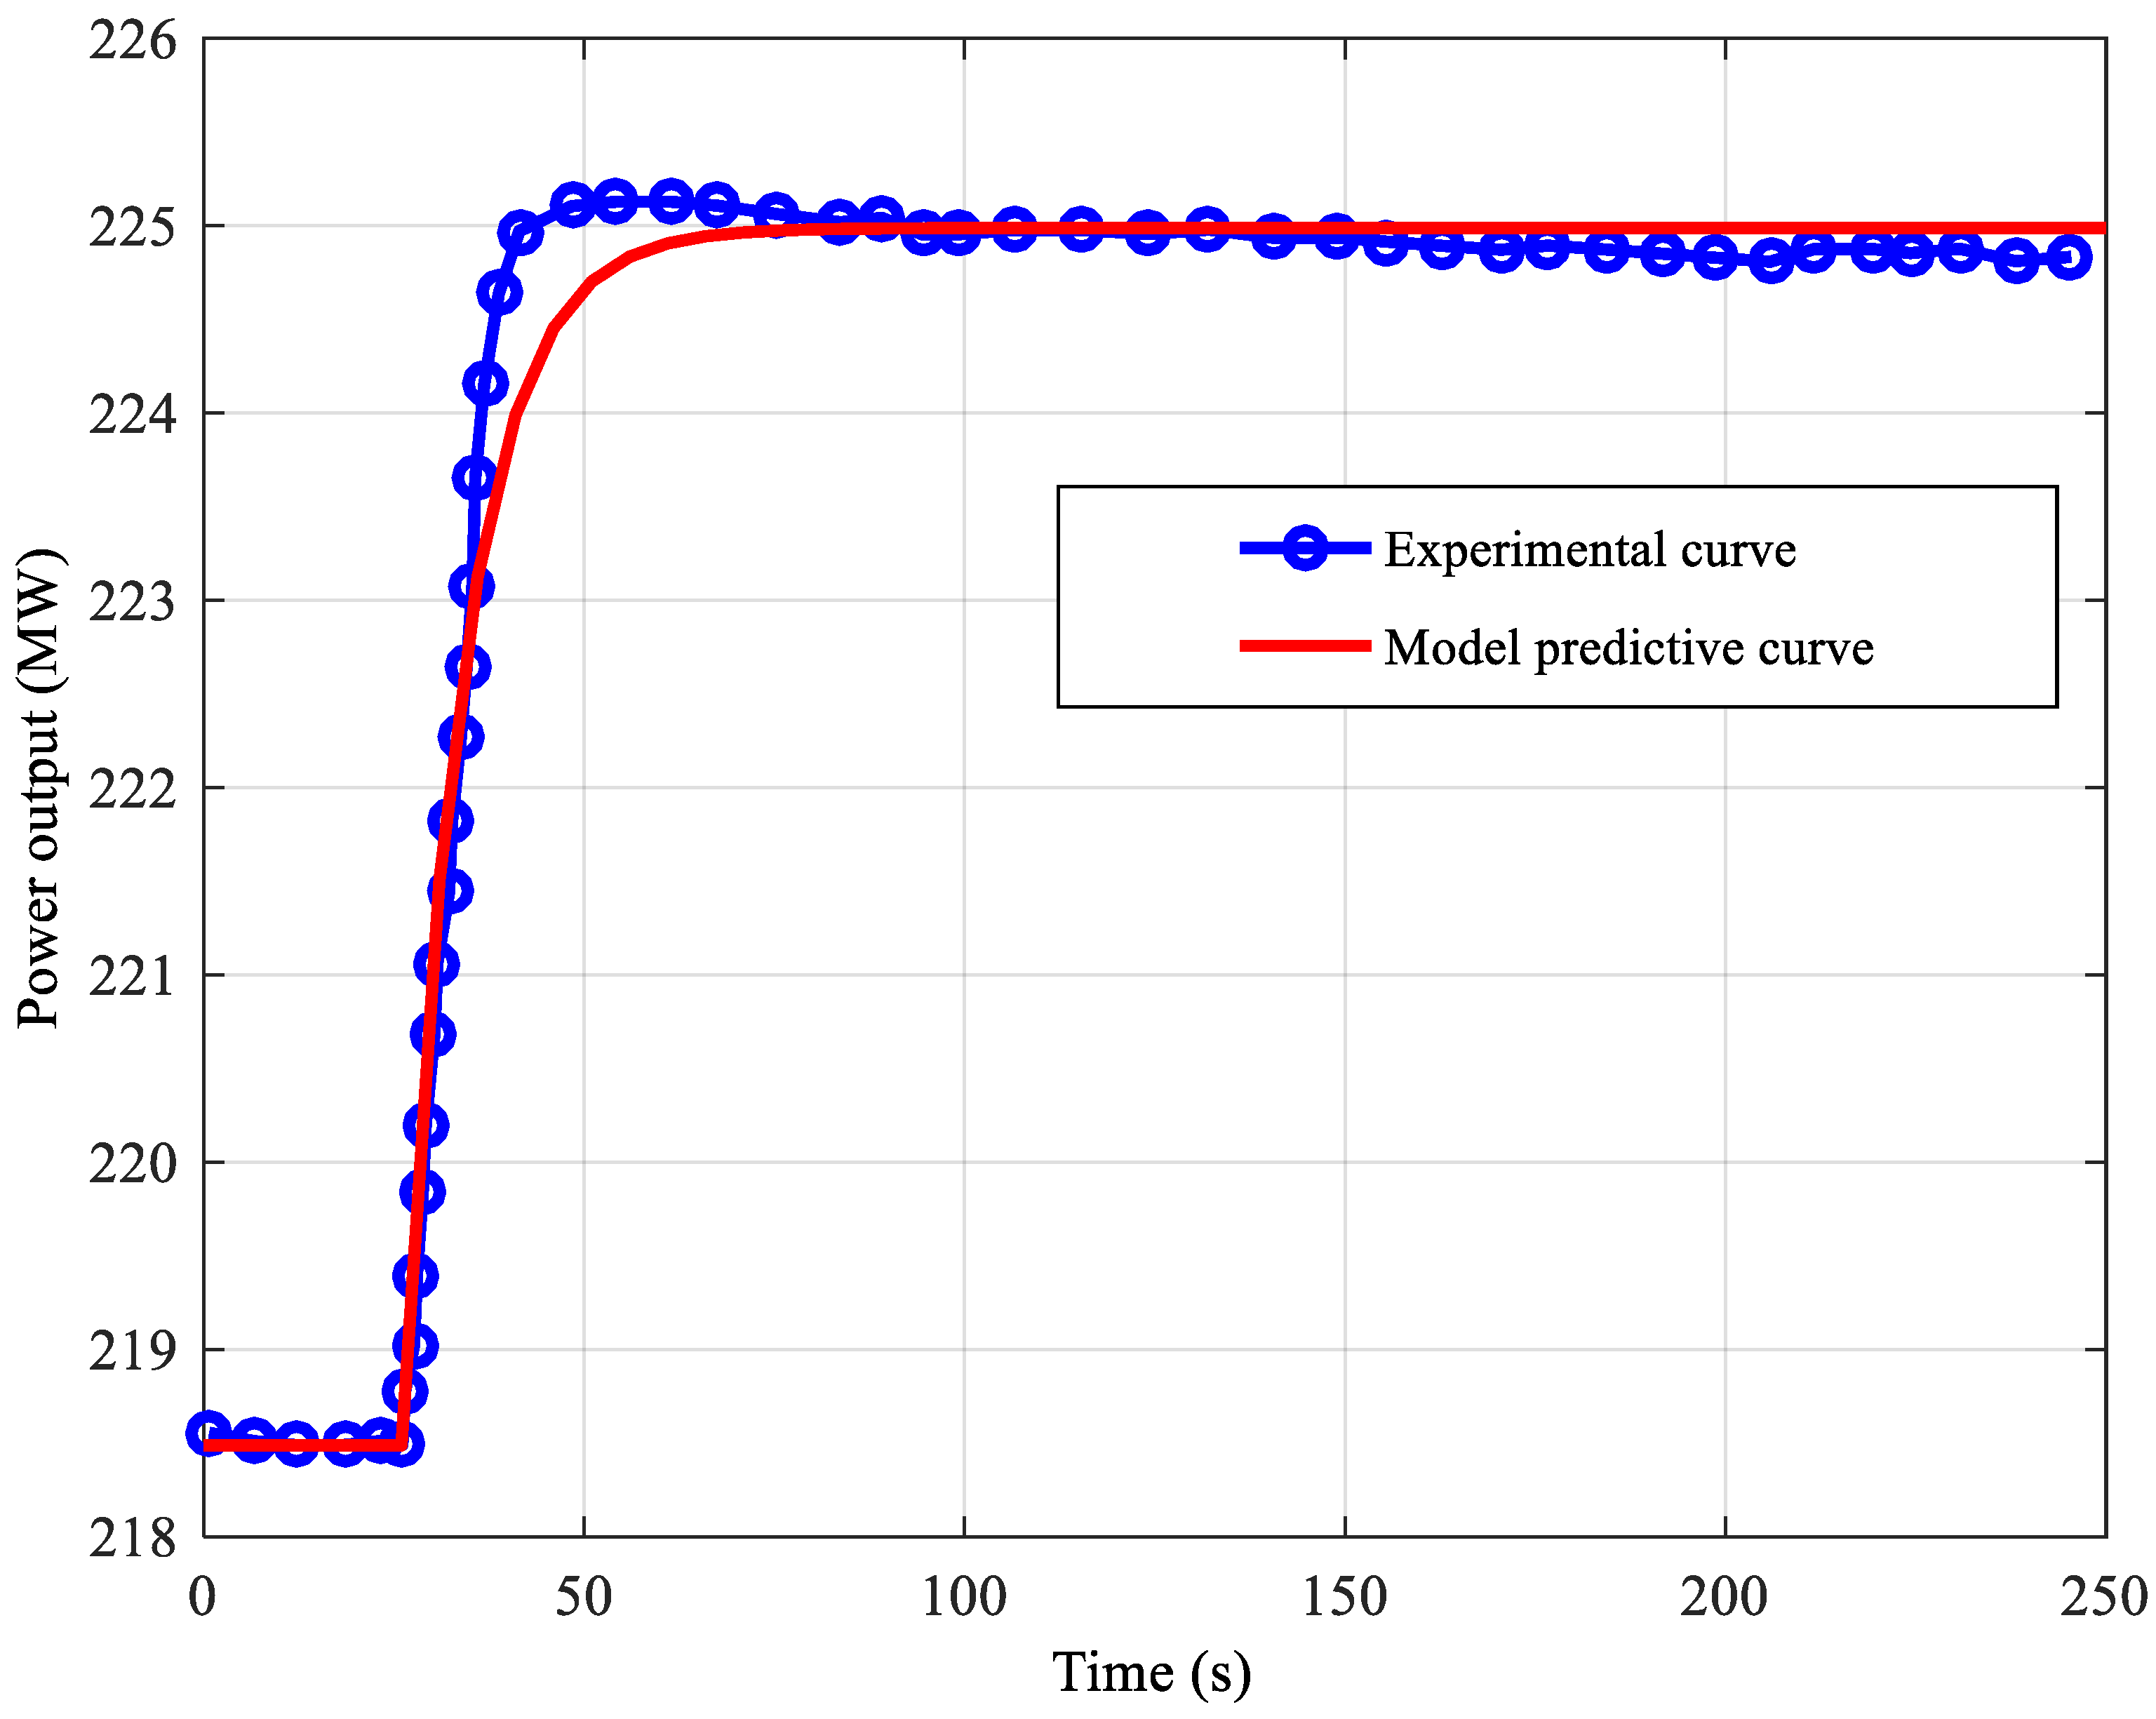
2.2. Heat-Power Conversion Model

The heat source of heating station is the extraction steam that comes from the turbine cylinder, and its flow depends on the opening of the butterfly valves [30]. When the heat source flow decreases, this part of the extraction steam will enter the turbine and do work. Therefore the electric power output of the turbine will increase [31]. This process usually ends in half a minute. Figure 4 shows the power output variations of a 300 MW CHP unit caused by the change of heat source flow. The unit is a subcritical, single-reheated, and condensing turbine unit. In the rated load condition, the main steam pressure is 16.67 MPa, and its temperature is 535 °C. To the reheated steam, the pressure and temperature are separately 3.05 MPa and 537 °C. This experiment is carried out at the rated heating load point of the unit. The main parameters are as the following: the generating capacity of the unit is 23 5 MW; the opening of the extraction butterfly valve is 54.526%; the heat source flow is 400 t/h. When the unit has been operated in the steady state, we change the opening of the extraction butterfly valve and meanwhile remain all other parameters unchanged. Because these parameters might influence power output invariant (for example, fuel flow, live steam valve opening and so on) and record the power output curves. The experimental curves are given in Figure 4 with blue line, which exhibits the power output response to the heat source flow step change. The power output increases 6.7 MW in about 22 s, amounting to the ramp rate of 18.3 MW/min, i.e., 6.1% of rated power per minute. This ramp rate is over three times that obtained with CCS.
The shape of the turbine power output changing is well dovetailed with step response curve of one-order inertia delay model, so a one-order inertia delay model is used to describe the heat-power conversion process:
G ( s ) = Δ P ( s ) Δ m h ( s ) = K T s + 1  
where ΔP is the power output variations; Δmh is the heat source flow change; K is the gain coefficient; T is the time constant; ands is the complex parameters in transfer function.
The model predictive curve, which is shown in Figure 4 with red line, follows the experimental curve with good trend and accurate relationships.
This model structure is applicable to all kinds of CHP units. However, the structure parameters (K and T) differ from unit types and operating conditions. Generally, the time constant keeps between 10 s and 20 s. Considering that variations in this range have little influence on the control performance with controllers, the time constant T generally takes an approximate value.
The gain coefficient K reflects the static relationship between variations of heat source flow and power output. The change of heat source flow not only directly affects the power output, but also changes the steam-water distributions of deaerator and low pressure (LP) preheaters, which will finally lead to the change of their corresponding steam extractions and unit power output.
The heat source extraction will enter deaerator after heat transfer, so the steam-water distribution equation [32] of a thermodynamic system with “three high-pressure preheaters, three low-pressure preheaters and one deaerator” can be developed as:
m f w τ = A m + m h A h  
where mfw is the feed water mass flow; τ is the column vector of feed water enthalpy rise, 7 × 1; A is the system characteristic matrix, 7 × 7; m is column vector of extraction steam flow, 7 × 1; mh is the heat source extraction flow; and Ah is the characteristic column vector of heat source extraction. It is expressed as follows:
A h = [ 0 0 0 h h , w h w , 5 τ 5 τ 6 τ 7 ] T  
where the change of the heat source flow basically does not affect the first several stages of extraction steam, so the first three parameters of Ah are 0. hh,w is the drainage water enthalpy from heating station; hw,i is the outlet water enthalpy of the ith preheater; and τi is the feed water enthalpy rise of the ith preheater, τi = hw,i − hw,(i+1).
The power output can be calculated through the do work expression:
P = m f w ( h 0 + σ h c ) m T Δ h ( m h + m t ) ( h 4 h c )  
where: h0 is the live steam enthalpy; σ is the enthalpy rise of reheated steam; mt is the mass flow of extraction steam for feed water pump turbine; hc is the exhausted steam enthalpy, and hi (i = 1, 2, 3, 4, 5, 6, 7) means enthalpy of ith extraction steam:
Δ h = [ h 1 + σ h c h 2 + σ h c h 3 h c h 4 h c h 5 h c h 6 h c h 7 h c ] T  
Combining Equation (2) with Equation (4), we will have:
P = m f w ( h 0 + σ h c ) [ A 1 ( m f w τ m h A h ) ] T Δ h ( m h + m t ) ( h 4 h c )  
and the static relationship between variations of heat source flow and power output can be further obtained:
K = P m h = A h T ( A 1 ) T Δ h ( h 4 h c )  
Here, we take a 330 MW CHP unit for example to verify the accuracy of our proposed model. The results as shown in Table 1 reveal that the relative error of our model is no more than 1%.
Furthermore, more results about another 3 typical-grade CHP units are shown in Table 2. The results in Table 2 show that the gain coefficient K is generally different in different grades of CHP units. But for the same unit, the ratio is basically the same under different steam turbine load conditions and different heating conditions. Moreover, it will not change with load.

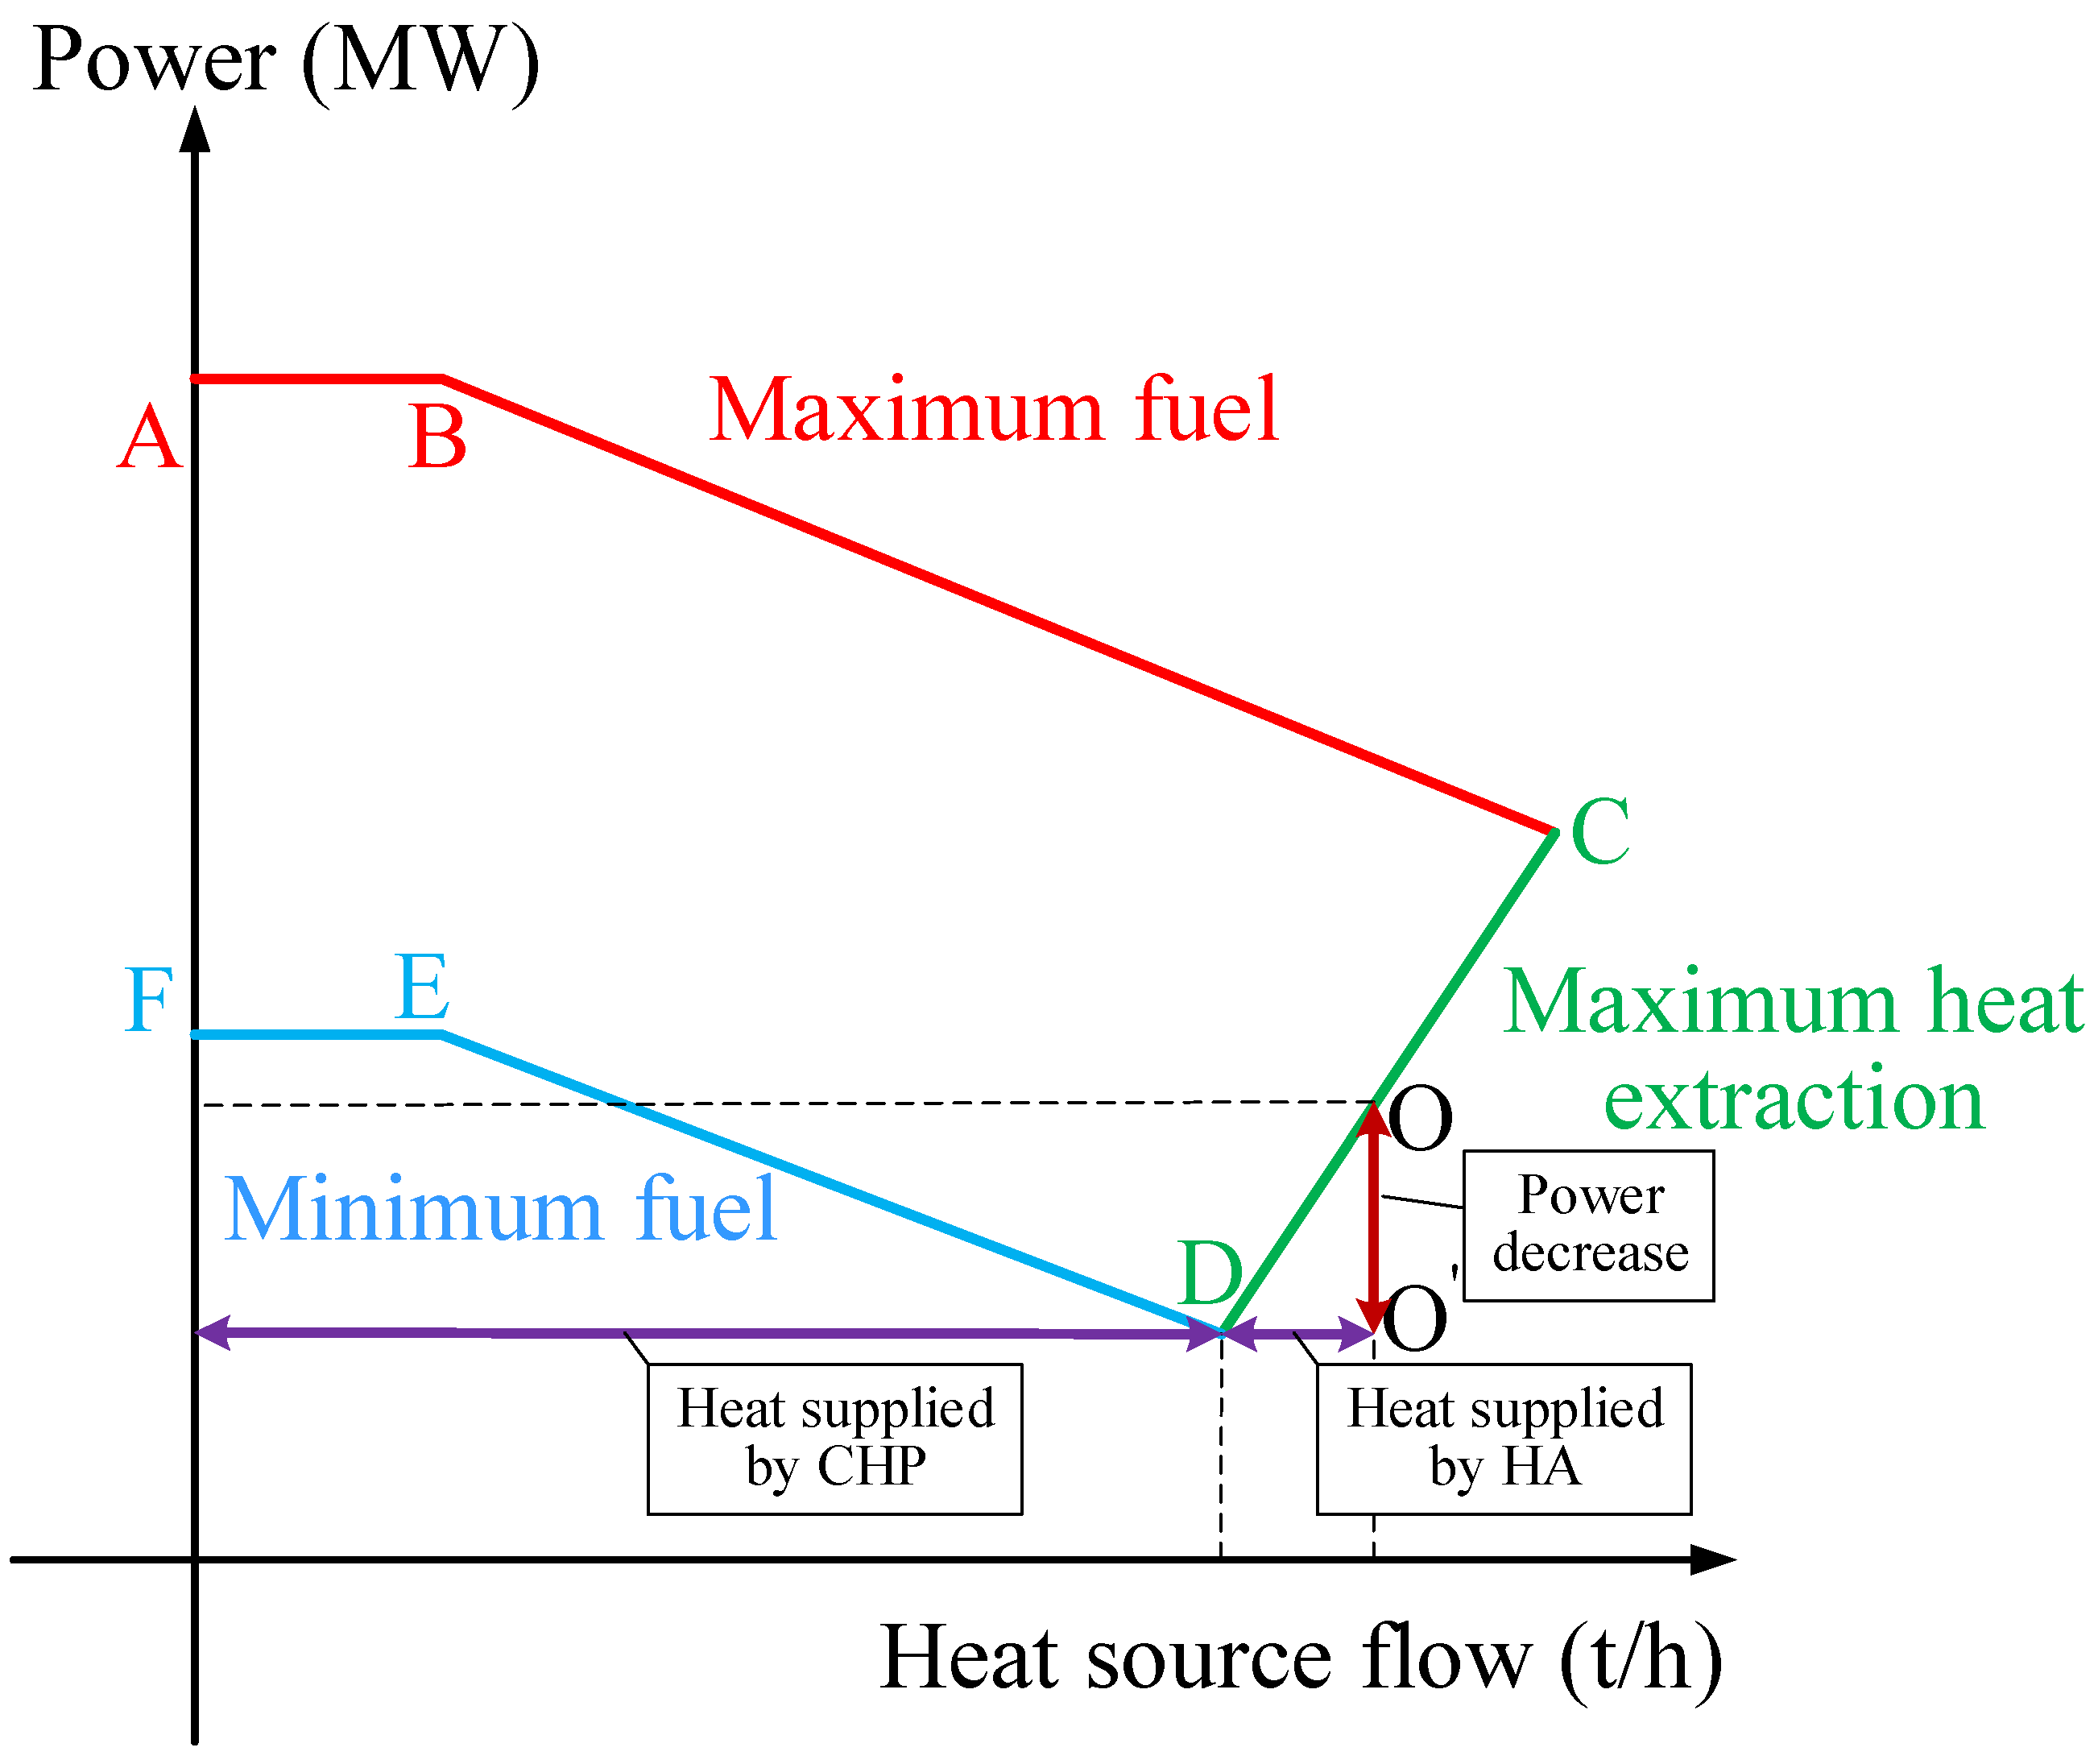
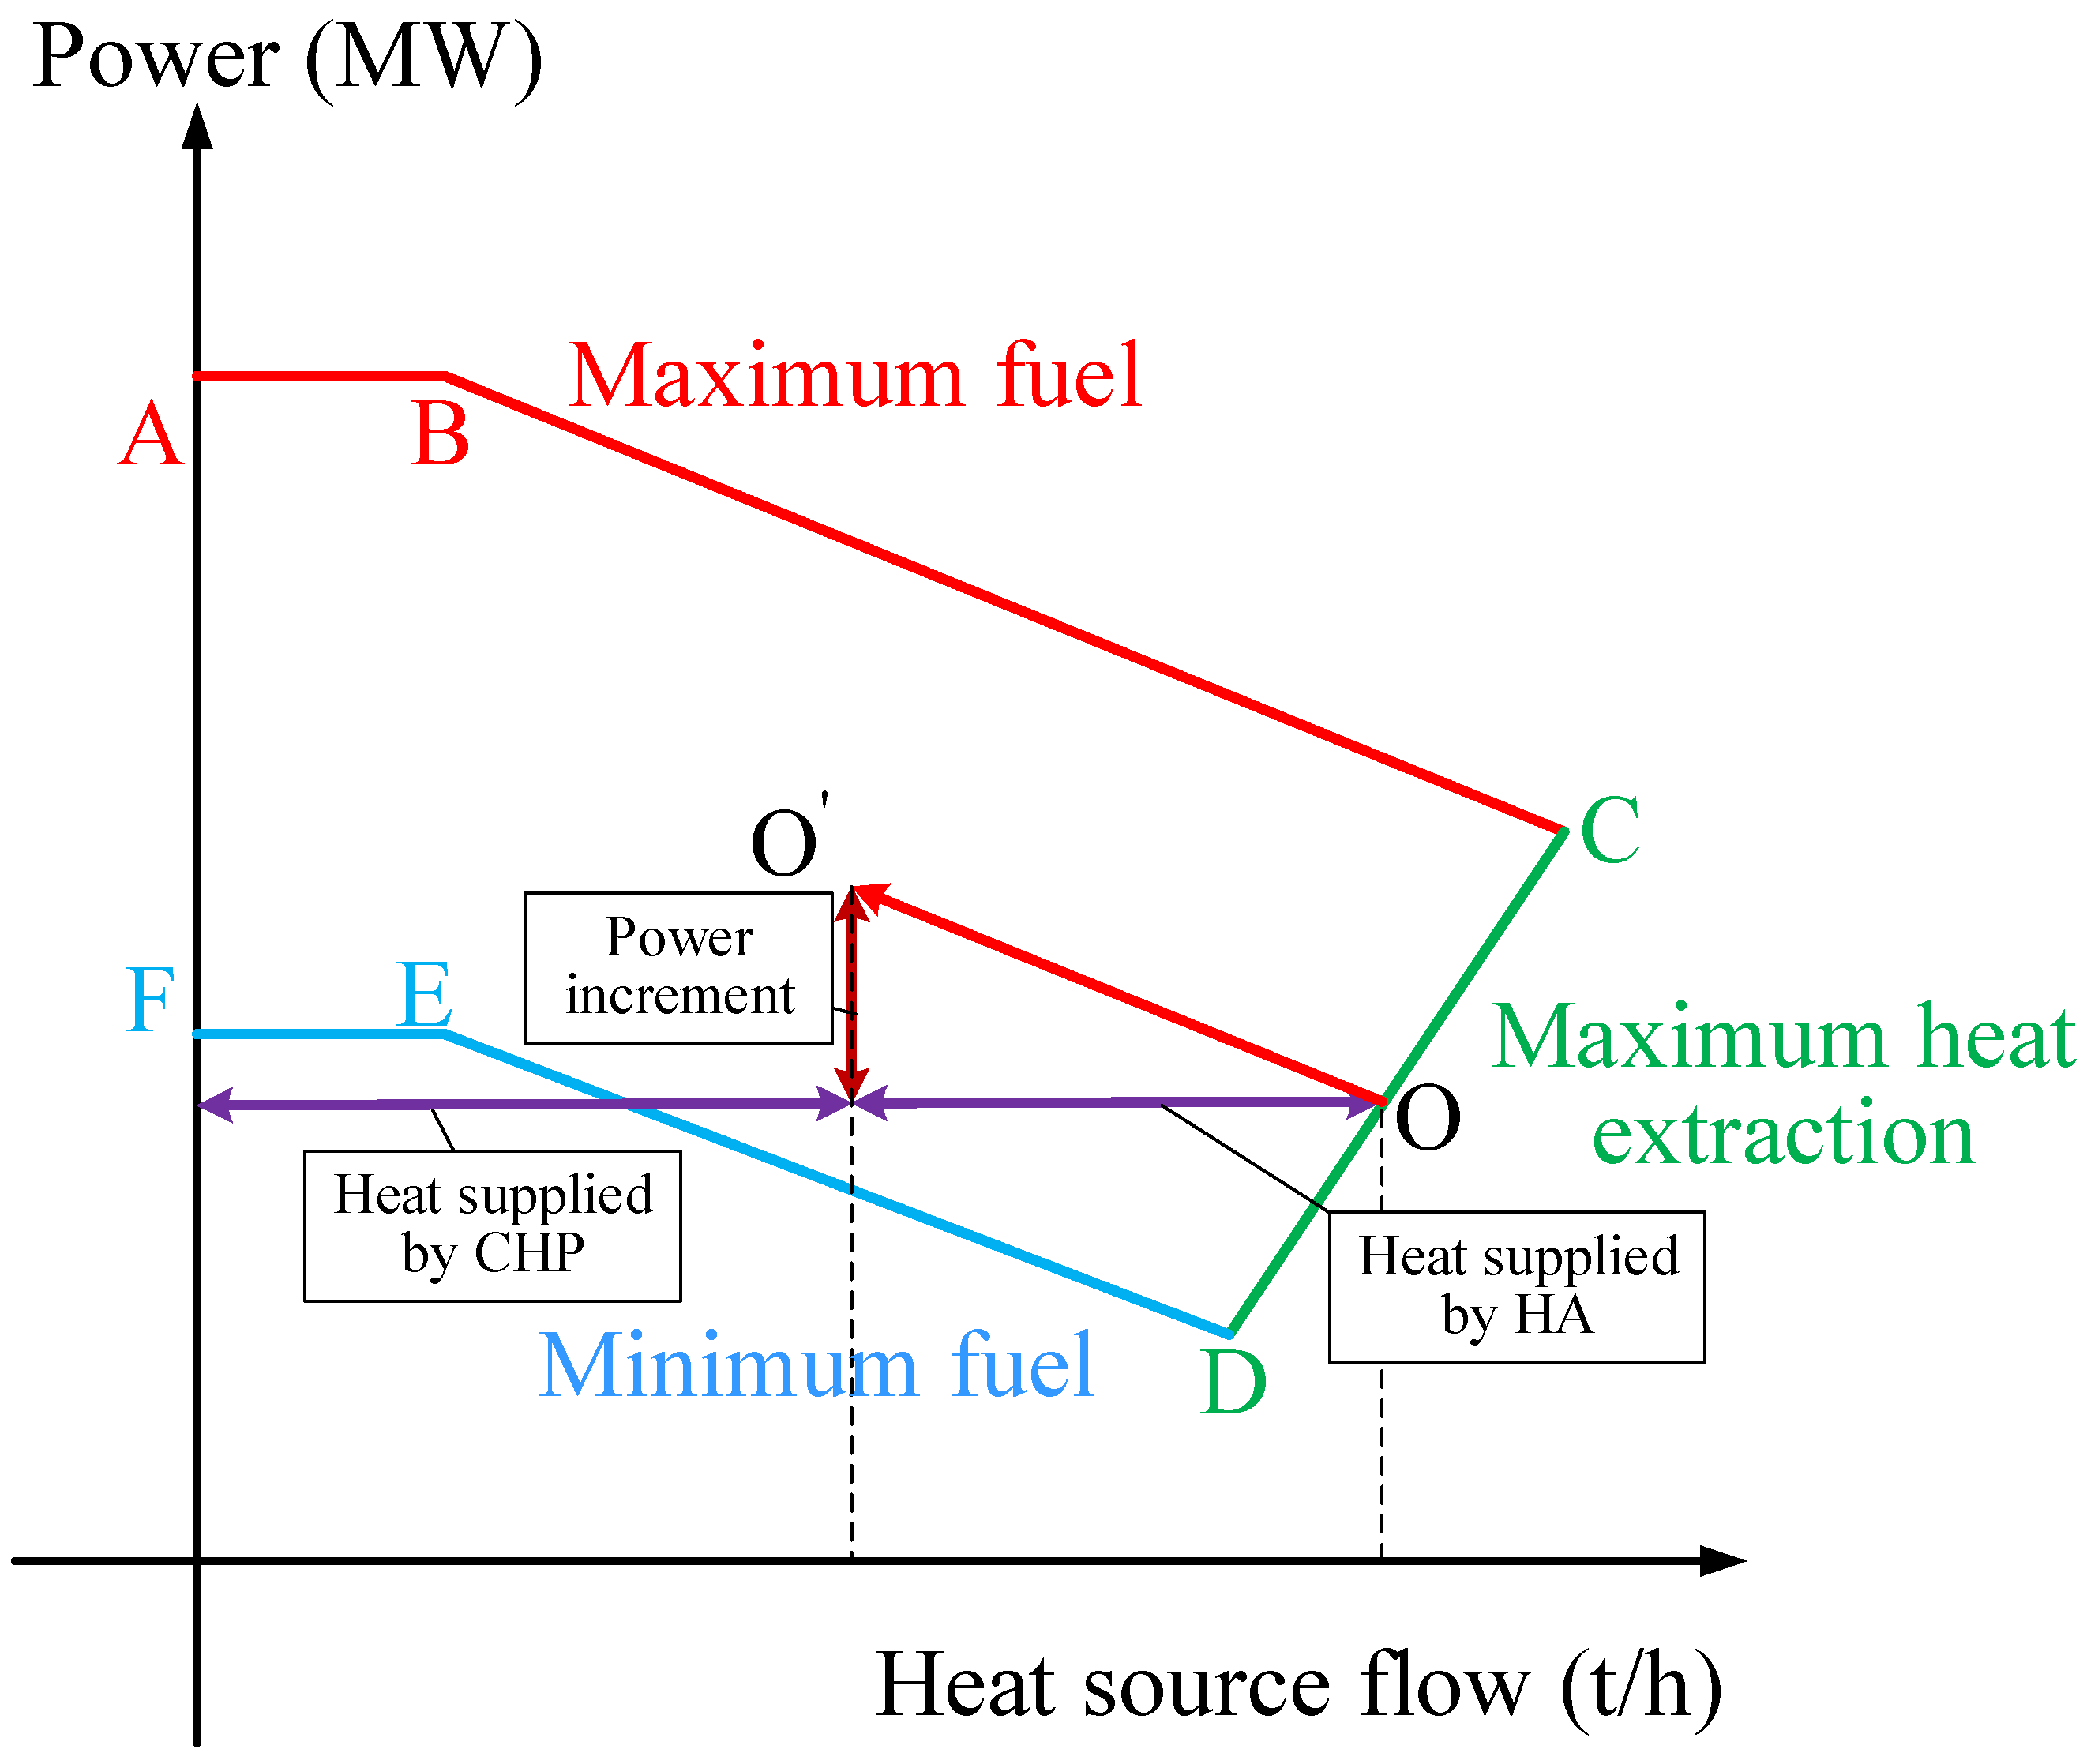
2.3. Compensation Characteristics of HA

In the rated operating conditions, the heat demand is totally supplied by CHP, and HA keeps in a static state at this moment. The energy balance equation of the heating station is as follows:
m h , 0 ( h 4 h h , w ) = m c i r C p ( T o u t T i n )  
where mcir is the mass flow of circulating water in heat network; Cp is the specific heat of circulating water in heat network; Tout and Tin are the outlet and inlet water temperature of heating station.
When it is necessary to make power output increase with a rapid ramp rate, the heat source extraction flow is regulated to decrease, and meanwhile HA [33] will discharge to compensate the decrease of heat source. The discharge flow of hot water is:
m H A , d i s = m c i r m h ( h 4 h h , w ) C p ( T o u t T i n )  
In like manner, the charge flow of hot water in HA charging operation is:
m H A , c h a = m h ( h h h h , w ) C p ( T o u t T i n ) m c i r  
Suppose that hot water flow charging in HA is positive and hot water discharging from HA is negative, the relationship between the change of heat source extraction flow and hot water flow of HA can be expressed as:
m H A , 0 = Δ m h ( h h h h , w ) C p ( T o u t T i n )  

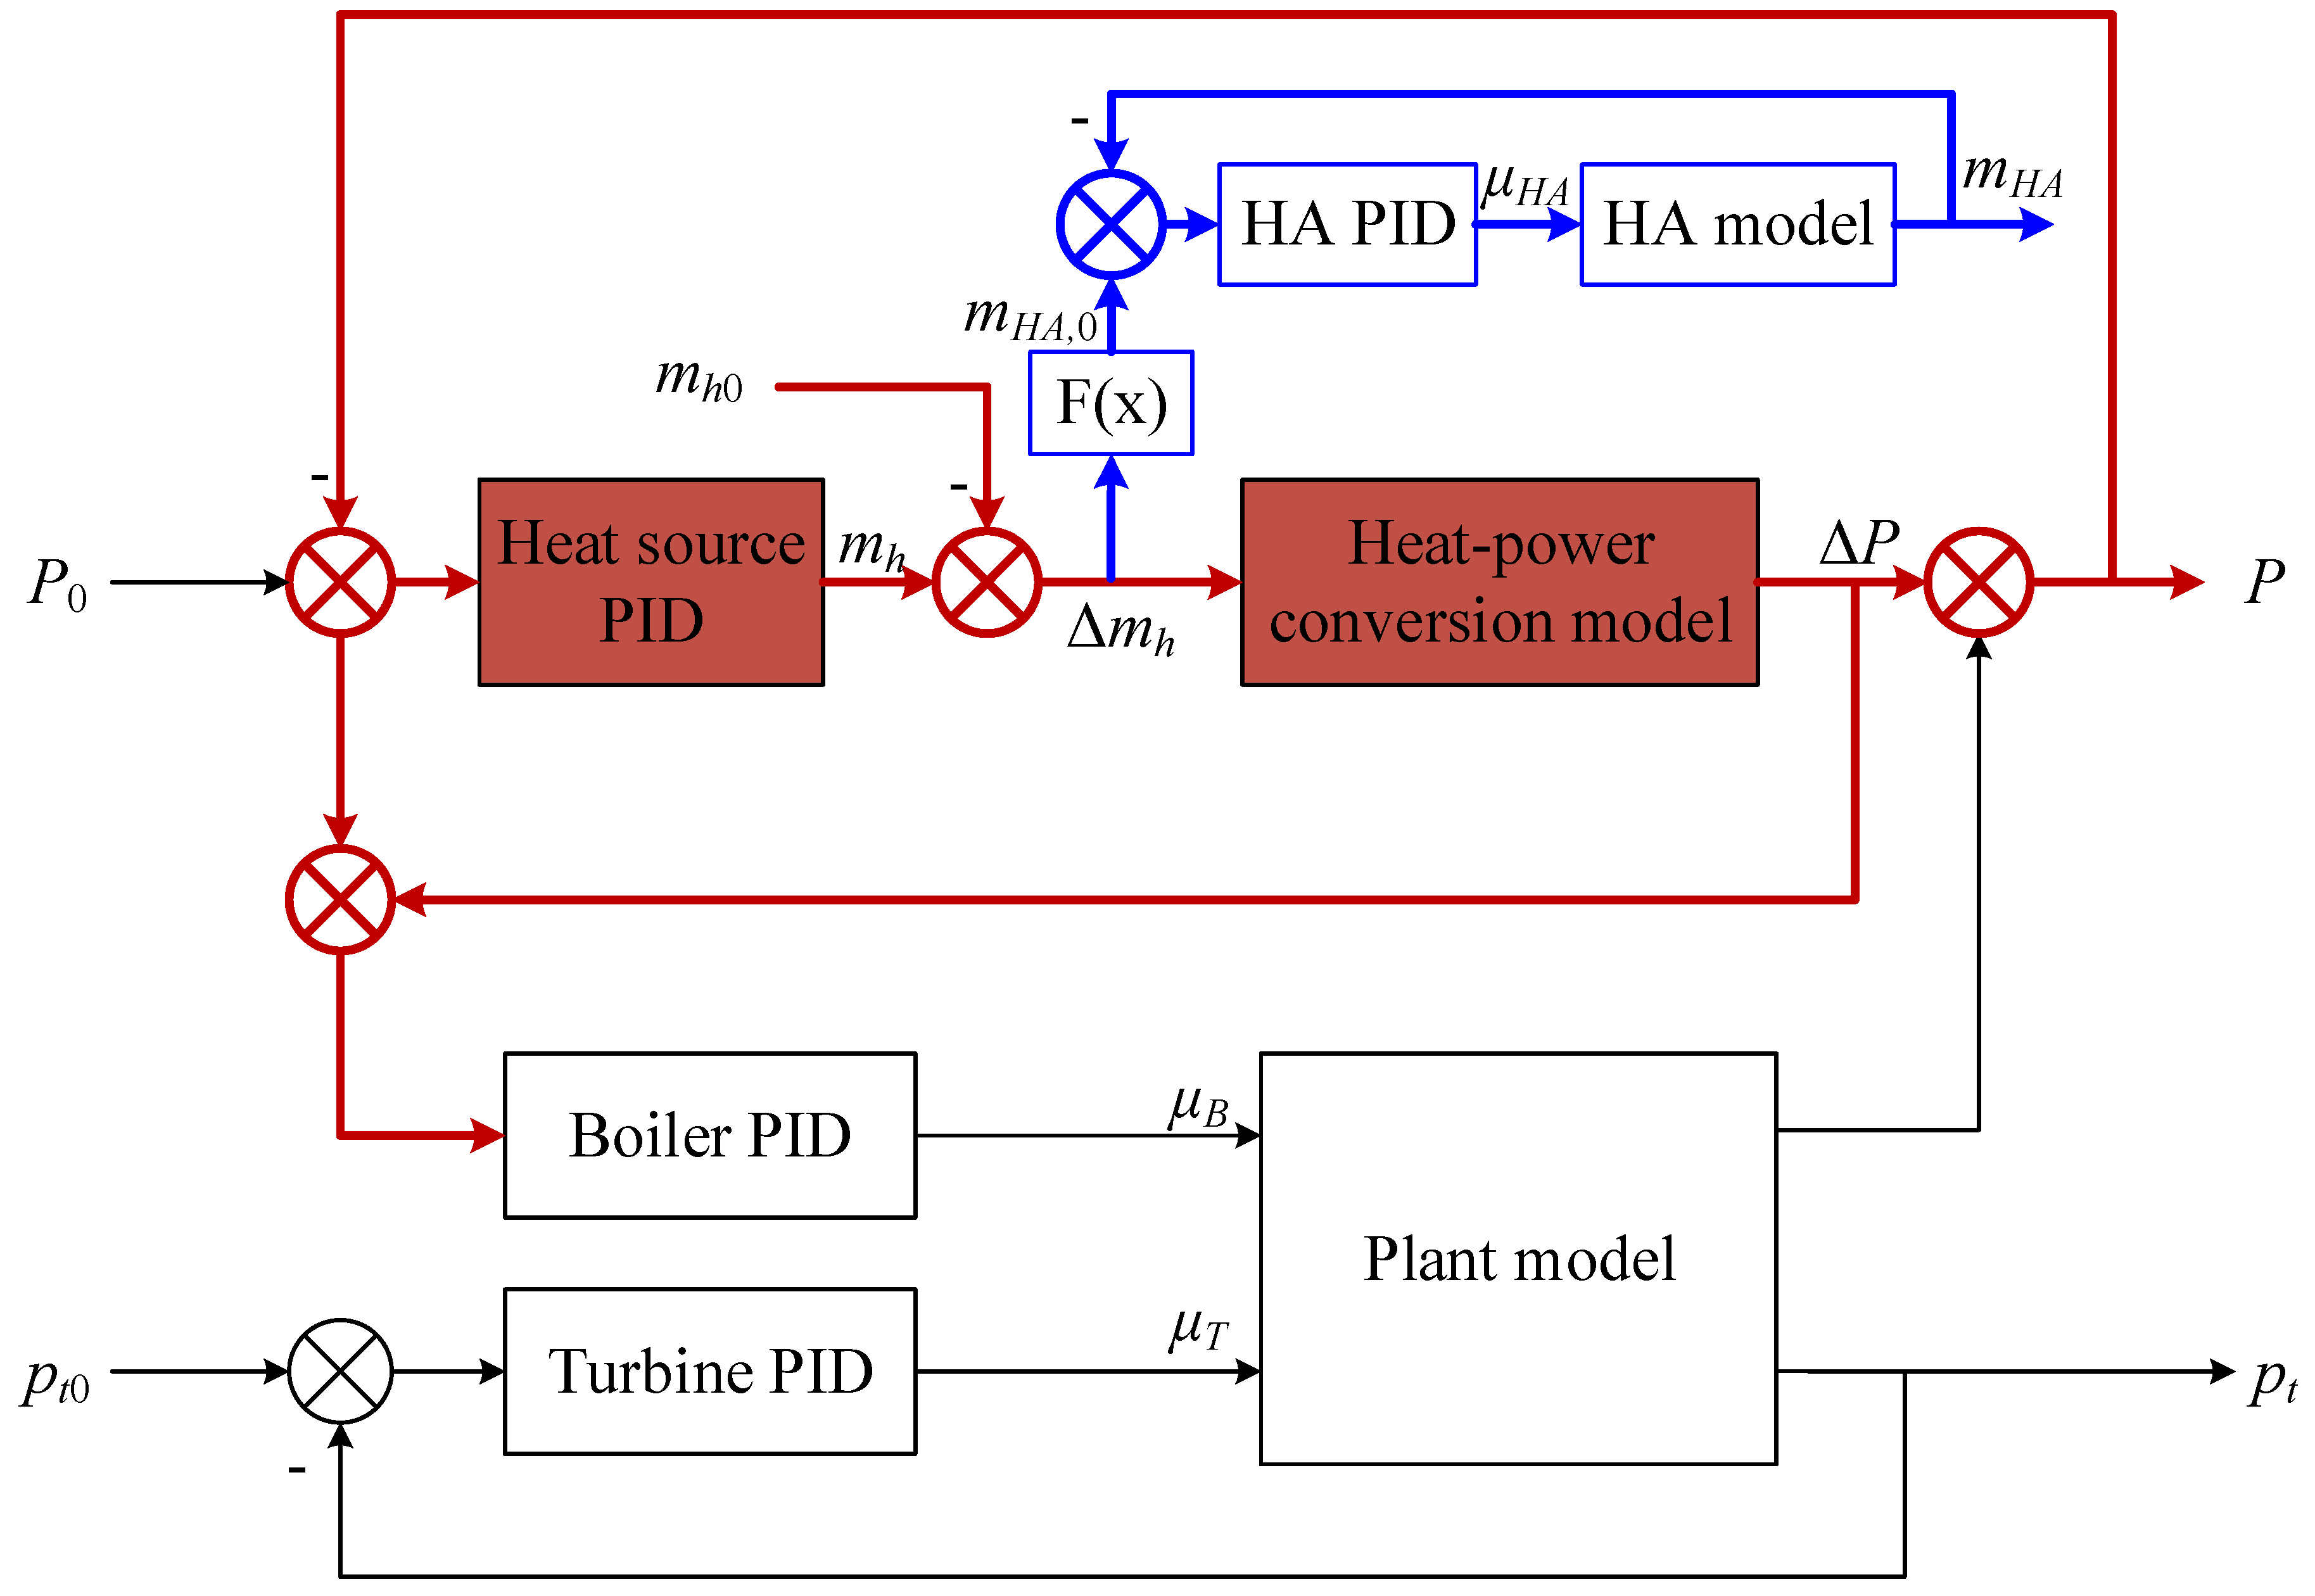
3. Optimized Control Strategy Design

As introduced in Section 2.2, increasing or decreasing the heat source extraction steam flow can rapidly lead to the decrease or increase of power output, so this can hopefully be used to accelerate the power output response and improve the load-following capability of CHP units. In order not to affect heat consumers, HA should be cooperated with heat source flow regulation. However, a sustained increase of power output can only result from an increase in fuel input, since the storage capacity is always limited. Therefore, the heat source regulation could not be taken as a single control method for power load control but an assistant control method for traditional CCS. It is known to all that the coordinated control system (CCS) is a complex multivariable system with strong coupling characteristics. The CCS takes boiler and steam turbine with different dynamic characteristics as a whole to control them. Thus, according to the load demand of power grid, the boiler and steam turbine can be regulated at the same time, and the deviation of main operation parameters can meet the load demand. The stability of parameters can be ensured. In drum boiler units, the coordinated control system is often simplified to a two-input and two-output dynamic control system. The inputs are usually boiler fuel flow (µB) and the live steam valve opening (µT). The outputs are turbine power output (P) and main steam pressure of turbine inlet (PT). There are two operation modes of load control system for CCS: boiler follow mode (BF) and turbine follow mode (TF). The boiler follow mode has the advantage of fast load changing, but the parameters of unit will be in a large range. While the turbine follow mode is good at keeping the operation parameters steady and safe. Before optimizing the control strategy, some key principles must be specified first:
(1)
Heat source extraction regulation should play a major role in the initial control period, and finally heat source extraction flow should recover to its former value.
(2)
Fuel flow should follow the power demand and support the total power change at the end of control.
(3)
The set point of HA hot water flow should be given so as to control HA.
Taking the above principles into account, an optimized control strategy is designed as shown in Figure 5. Firstly, the power difference between its set point and actual value is taken as the input of heat source controller, and such design can ensure maximum utilization of rapid power response of heat source regulation. Secondly, turbine follow (TF) mode [34] is chosen as the basic CCS. In this case, fuel flow mainly regulates power output, and live steam valve mainly controls live steam pressure.
For one thing, this design avoids large fluctuation of live steam pressure; for another thing, it ensures accurate energy correlationship between power output and fuel supply. Different from traditional CCS, in our optimized control strategy, the input value of boiler controller is no longer the difference value between set point and actual power output. It is the sum of difference value and the changing value of the unit load caused by the change of heat source flow. This design not only ensures the fuel supply not to be retarded by heat source flow regulation, but also always keeps consistent with actual power-fuel demand during the control process. More importantly, in the final control state, the fuel supply can satisfy the power demand by itself, which forces the heat source flow to recover to its former value. In this way, the heat source regulation plays an important role in the initial control period to accelerate the power response, and the fuel regulation plays a vital role in the middle and final control period to ensure sustainable energy supply. Finally, the heat source variations are converted into the hot water flow order of HA by the method introduced in Section 2.3, and then directing the HA controller to regulate the hot water flow to compensate the heat demand. In this figure, P is actual power outpu; pt is live steam pressure; μB is boiler fuel flow; μT is live steam valve opening; and μHA is water inlet and outlet valves of HA.

4. Simulations and Analysis

A 330 MW CHP unit is taken as an example in this paper. The unit is a subcritical, single-reheated, and condensing turbine unit. In the rated load condition, the main steam pressure is 17.5 MPa, and its temperature is 540 °C. To the reheated steam, the pressure and temperature are separately 3.44 MPa and 540 °C, and the rated pressure of heating extraction steam is 0.4 MPa. Its rated heating extraction flow is 300 t/h and the maximum is 400 t/h. Its linearized system model at 90% turbine load point is expressed as [35]:
[ P p t ] = [ G 11 ( s ) G 12 ( s ) G 21 ( s ) G 22 ( s ) ] [ μ B μ T ]  
where:
G 11 ( s ) = 2.069 ( 311 s + 1 ) ( 149 s + 1 ) 2 ( 22.4 s + 1 )  
G 12 ( s ) = 4.665 s ( 99 s + 1 ) ( 55 2 s 2 + 50 s + 1 ) 2 ( 4.1 s + 1 )  
G 21 ( s ) = 1.265 ( 205 s + 1 ) ( 128 s + 1 ) 2 ( 11.7 s + 1 )  
G 22 ( s ) = 1.42 ( 0.04 + 0.96 70 s + 1 )  
Taking this unit as the research objective, traditional CCS and our optimized control strategy are tested and simulated as follows.

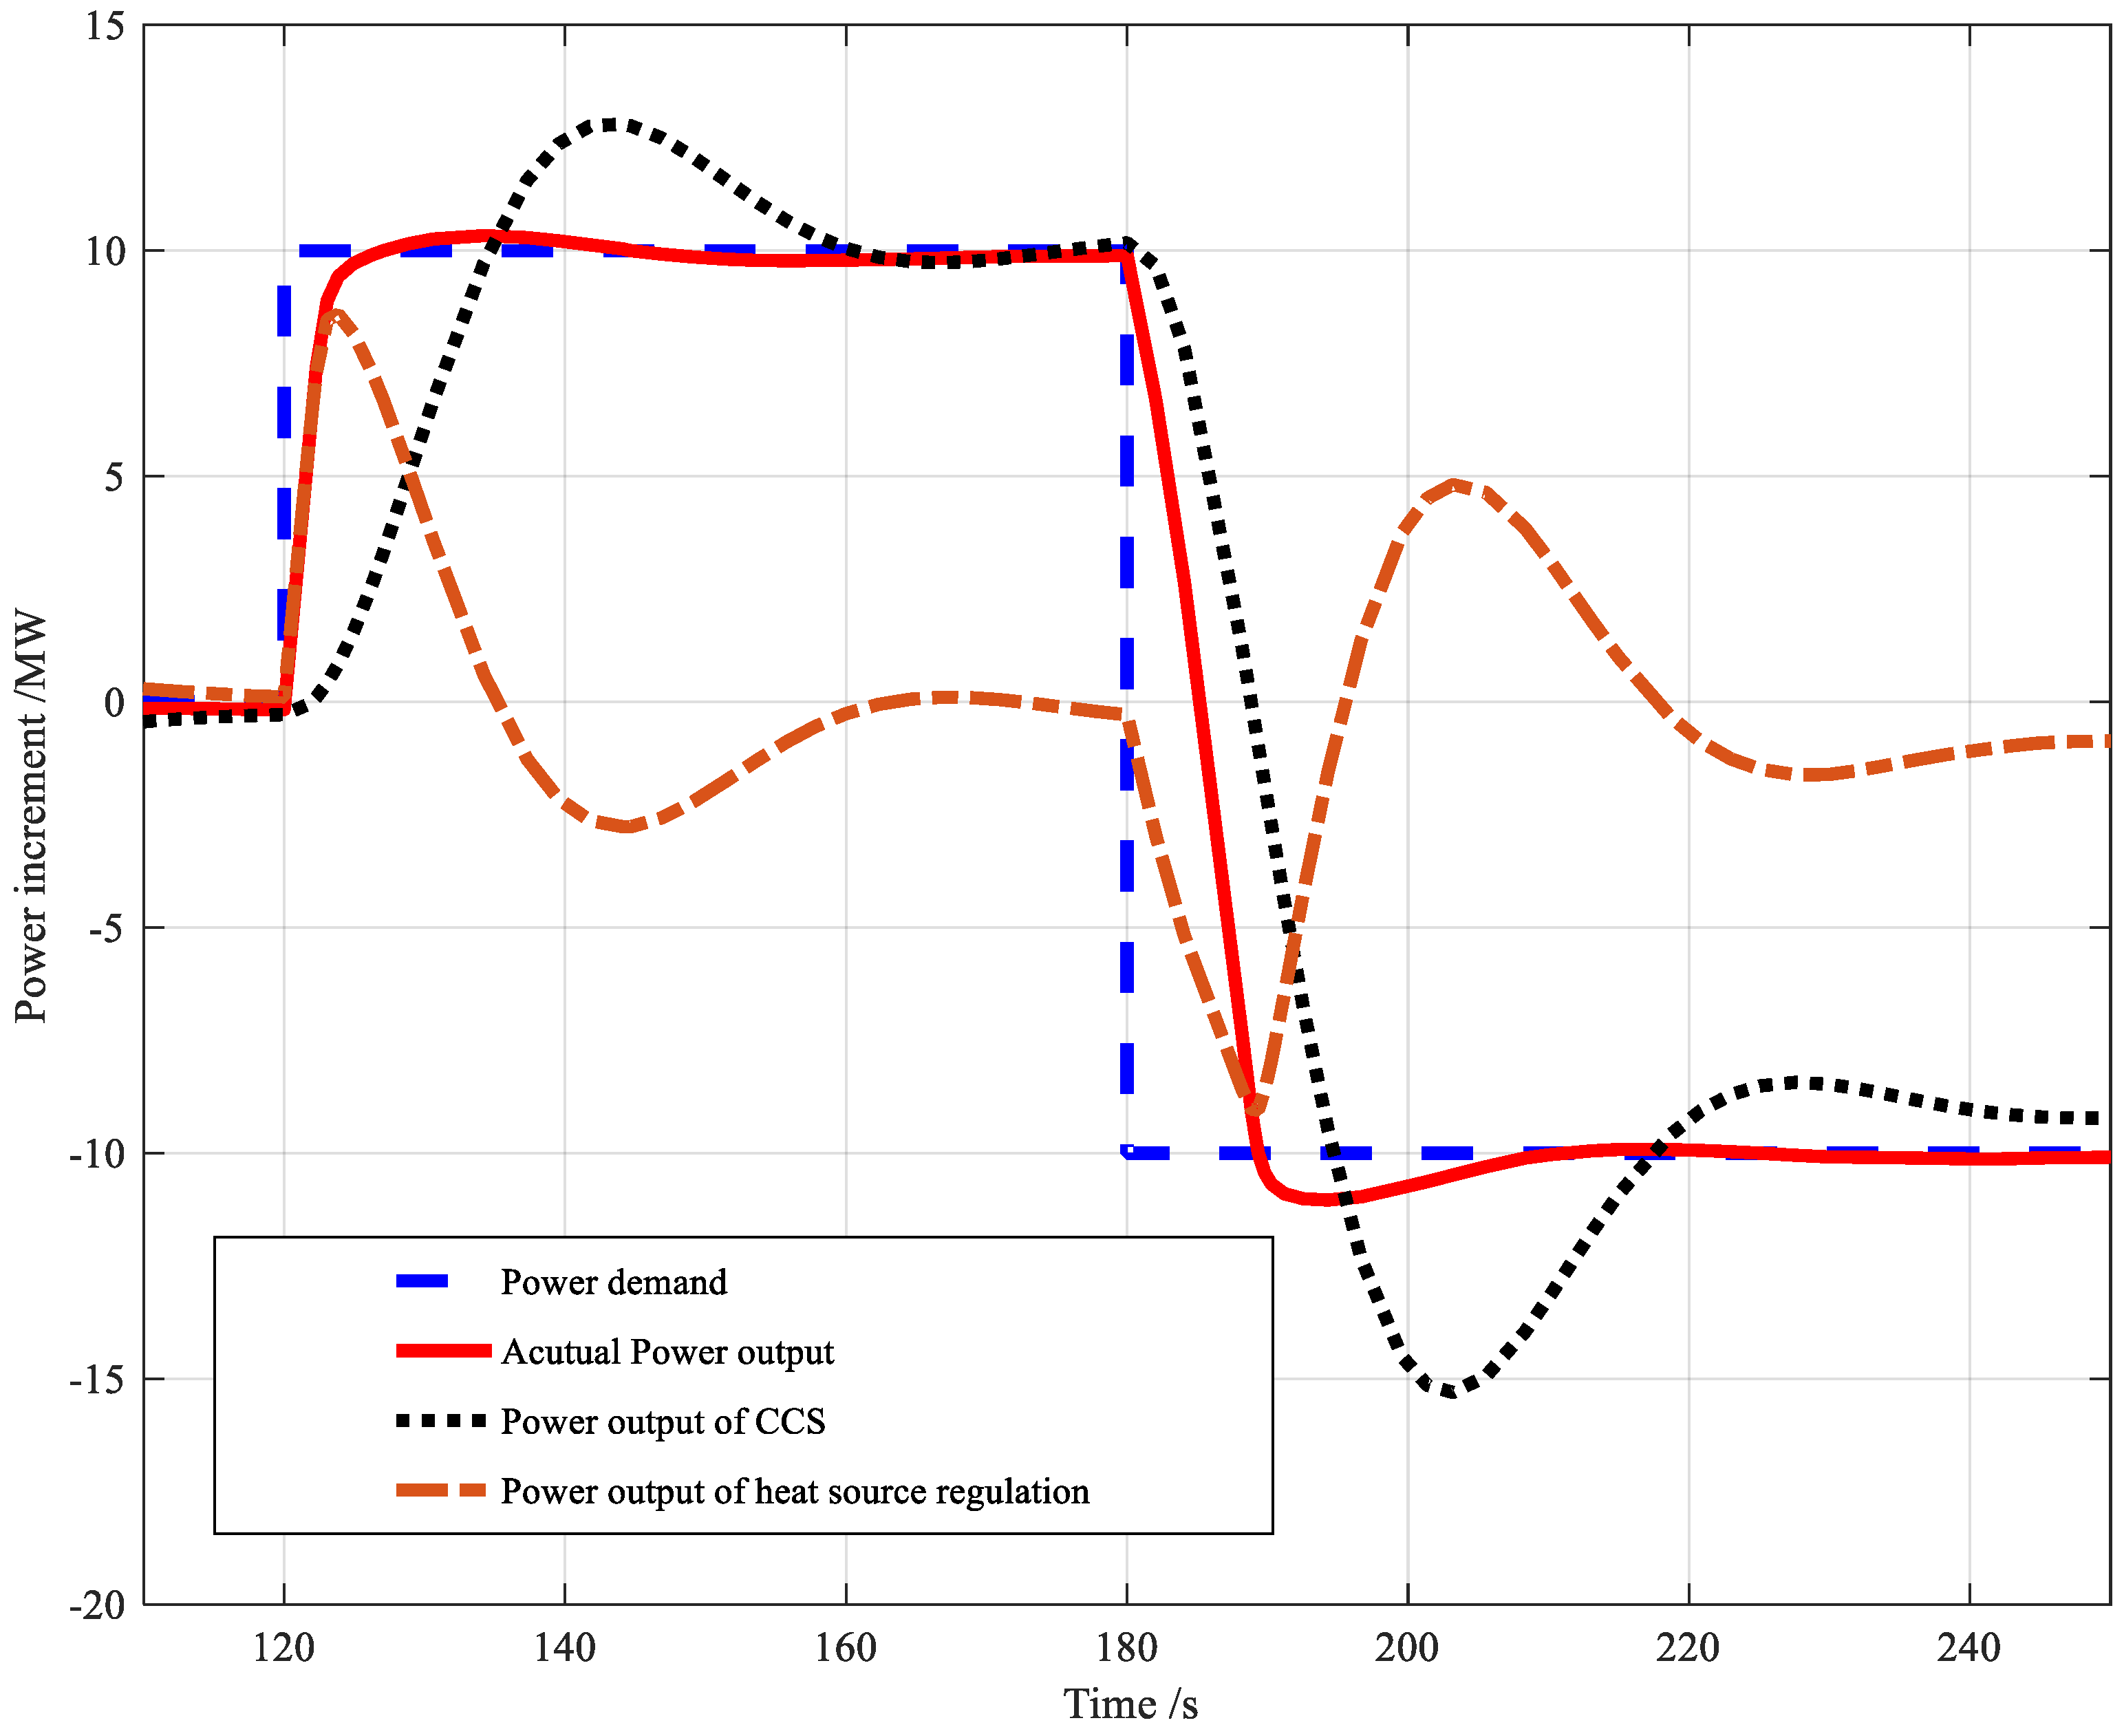
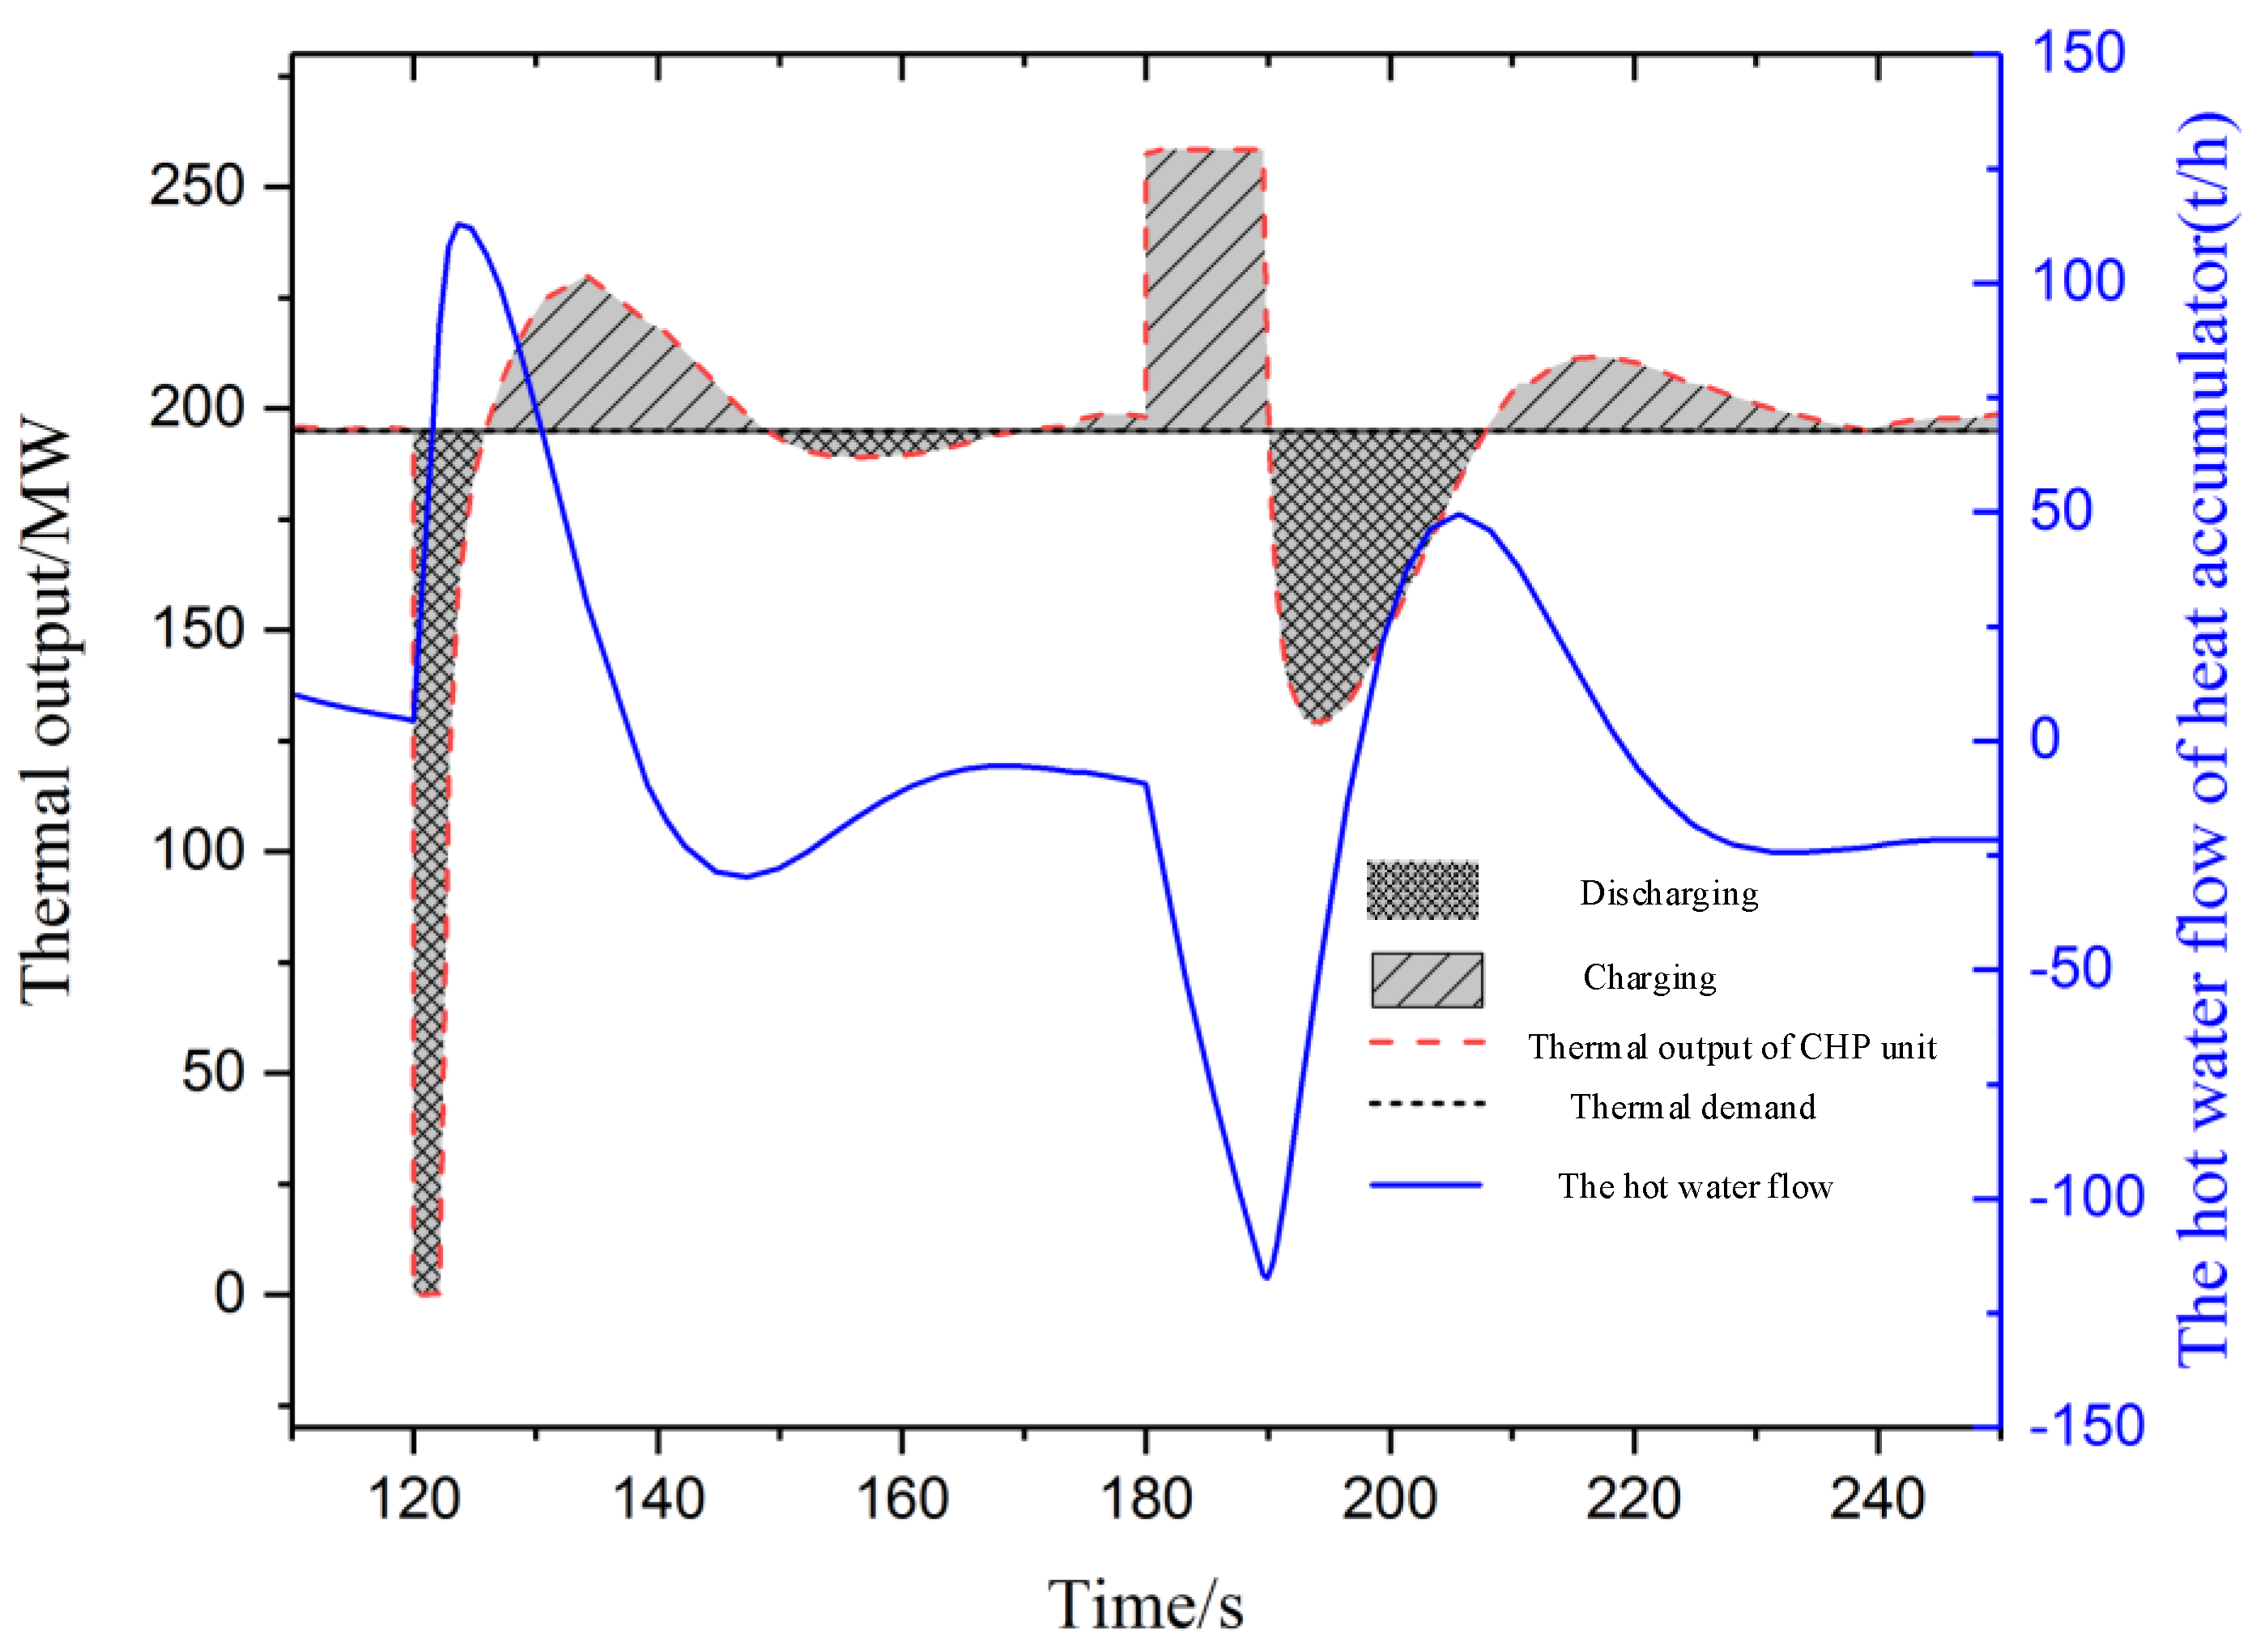
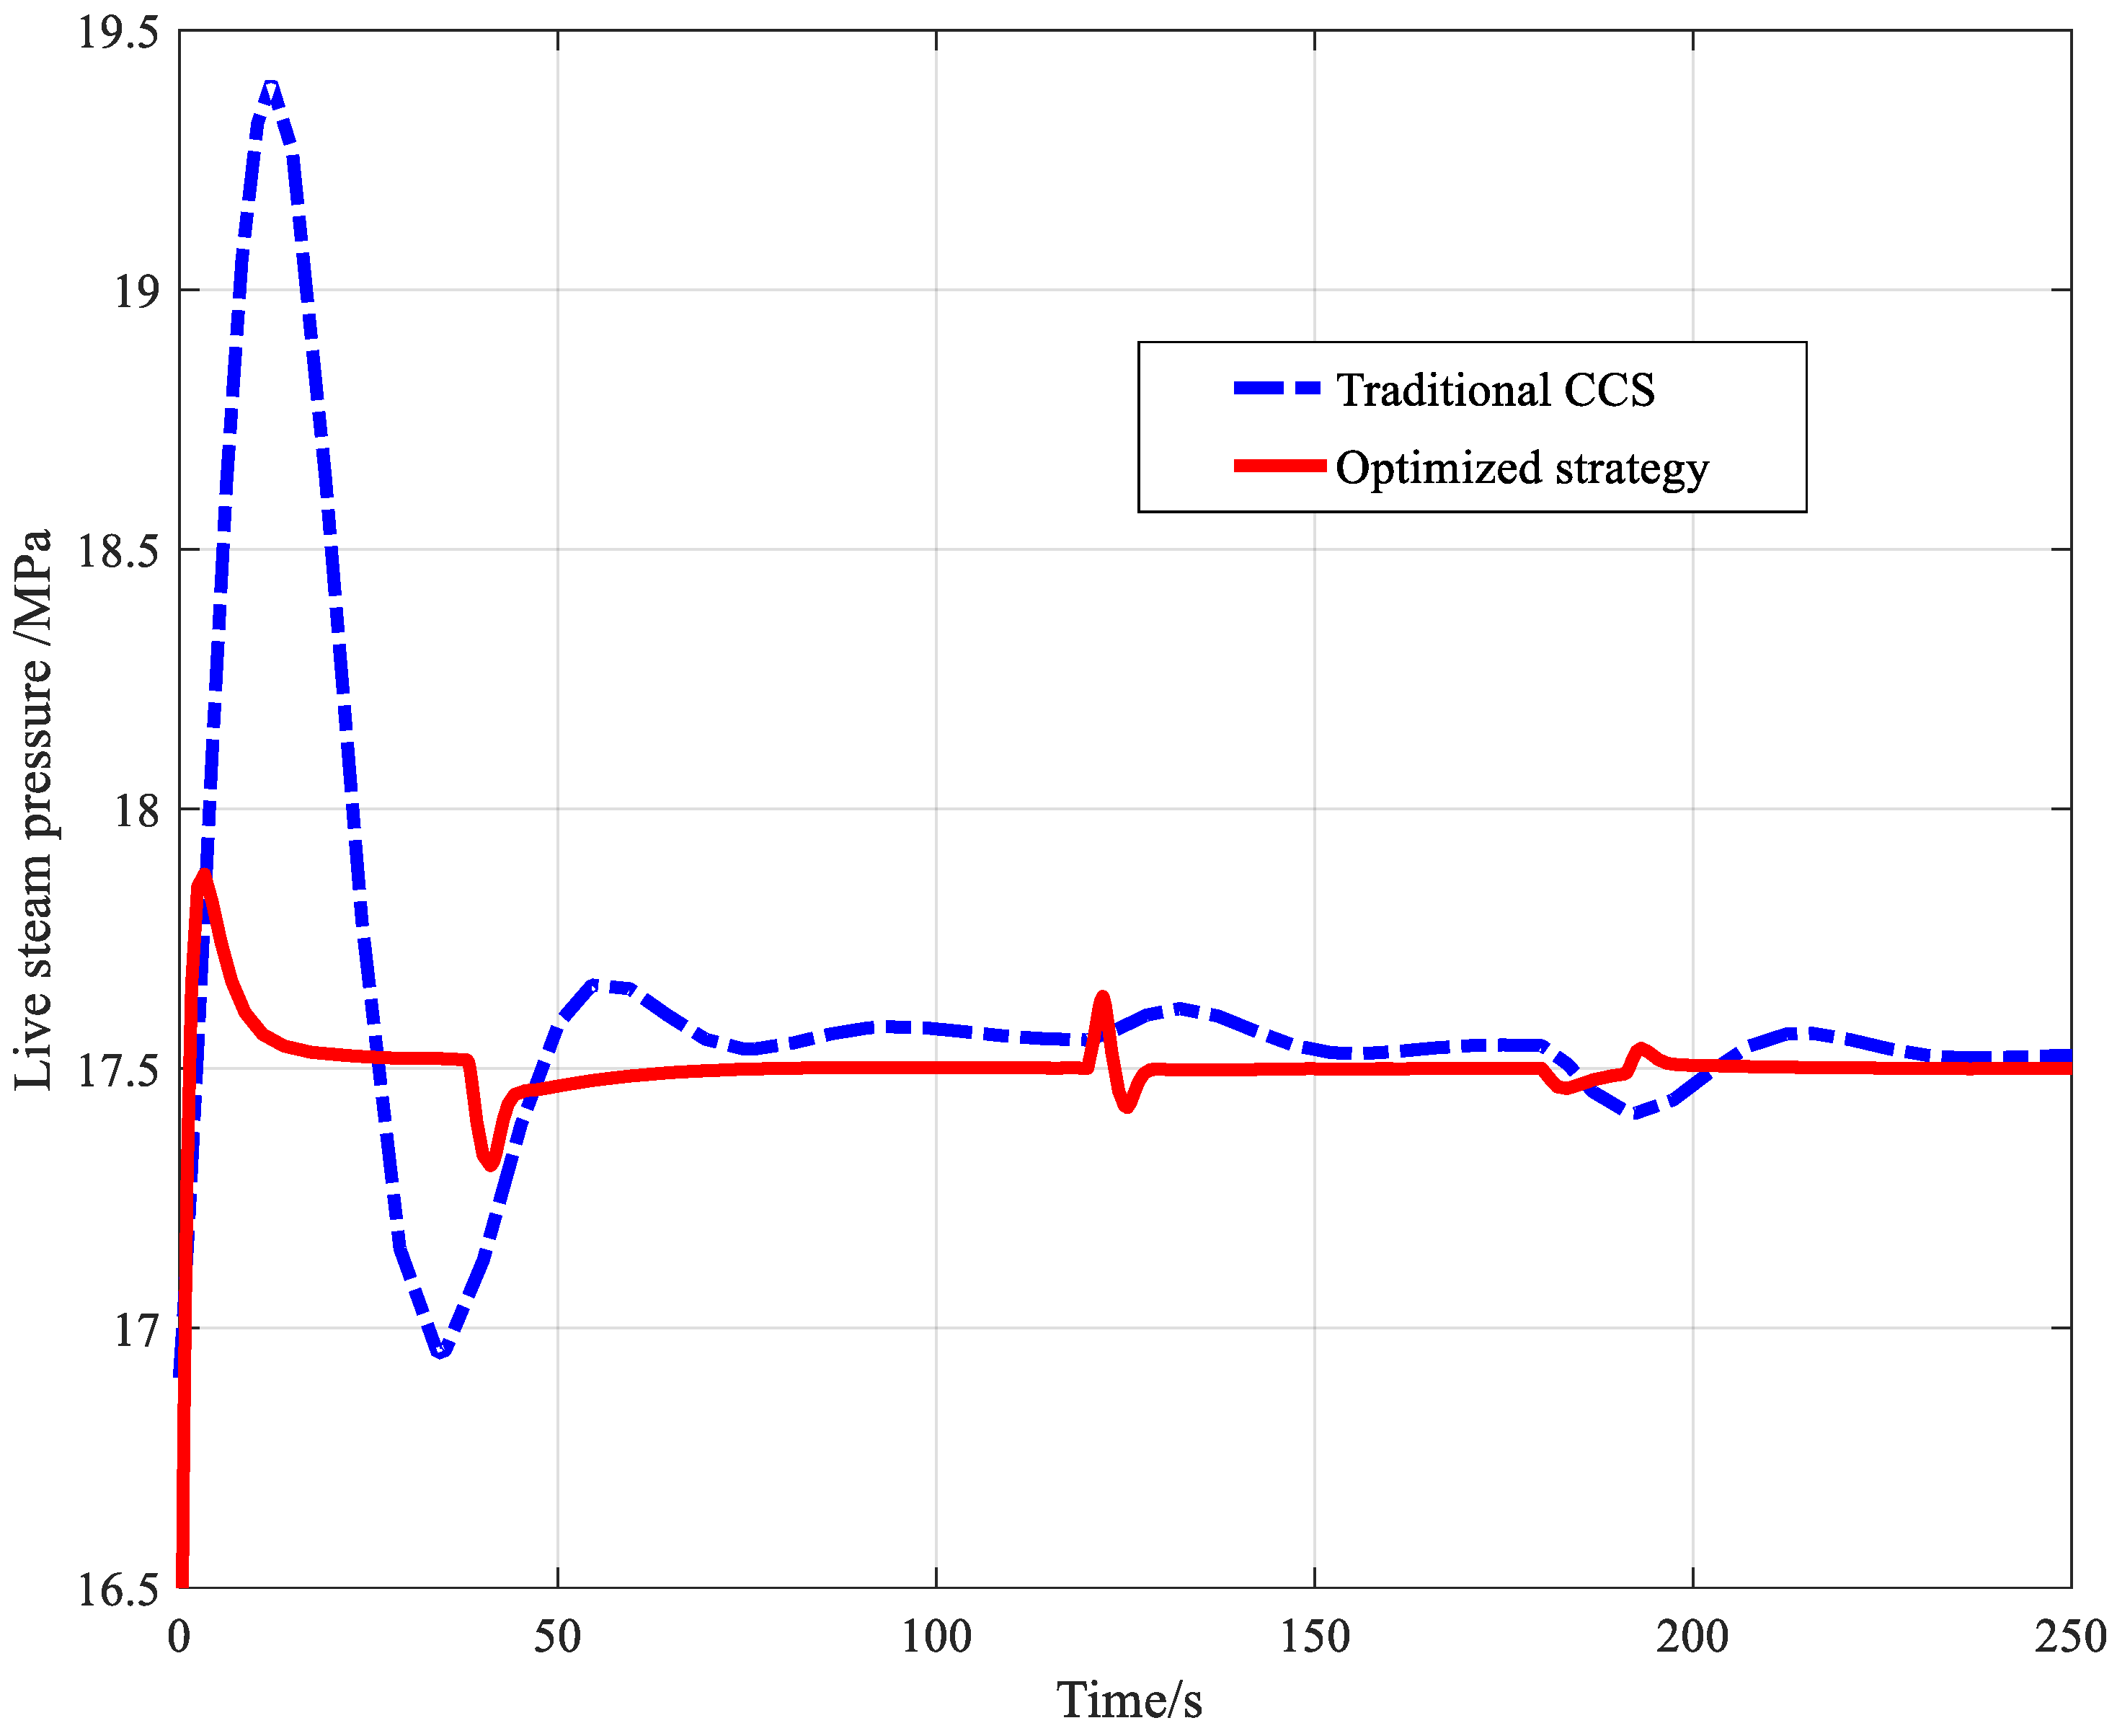
4.1. Power Step Test

A simulation at its 90% turbine load point will be made as following. At 120 s, the load of the unit stabilizes at the load 300 MW, and the set point for its steam pressure is 17.5 MPa. Then a turbine power step increase of 10 MW in 120 s is given. After the system is stabilized again, the power instruction of the unit is reduced by 20 MW at 180 s. Figure 6 and Figure 7 show the power load response and the live steam pressure response curves by applying traditional CCS and our optimized control strategy, respectively. It can be seen from the curves that the power response with our strategy has shorter adjustment time and smaller overshoot compared to traditional CCS; and the live steam pressure can recover to its set point more swiftly with smaller fluctuation. Quantitative calculations on some control performance indices including the IAE index (JIAE), ITAE index (JITAE) and AGC assessment index [36] are also given in Table 3. The indices’ comparisons between 2 strategies all prove that our optimized control strategy is significantly superior to traditional CCS.
In order to make clear the actions of CCS and heat source regulation with our optimized control strategy, the power response curves of CCS channel and heat source regulation channel are separately exhibited in Figure 8. It can be seen from Figure 8 that the actual power output is the sum of CCS output and heat source regulation output, and the heat source regulation becomes to act much faster than CCS when the power demand is stepped at 120 s and 180 s. When the fuel flow gradually matches power demand, the heat source regulation starts to weaken and even does not work at the end of control (160 s to 180 s, and 230 s to 250 s). The conclusion can be made that our optimized strategy meets the design requirements introduced in Section 3: heat source regulation mainly taking actions in the initial control period for rapid power response, and fuel regulation mainly taking actions in the middle and final control periods for control accuracy.
Evidently, during the above control process, HA undergoes continuous discharging and charging periods in order to make up the heat gap caused by heat source regulation. Figure 9 shows the HA operating conditions and its hot water flow output during the above simulation. It can be seen that thermal power output begins to rapidly drop off from 195 MW to 0 MW at 120 s, and meanwhile HA starts to discharge to compensate heat demand. HA goes through several charging and discharging processes with change of CHP heat output, and it finally becomes stable. During the whole regulating process, the total heat supplied by CHP and HA together keeps constant. In the same manner for the power-down process since 180 s, HA quickly becomes to charge when more heat source are extracted for powering down. Finally the HA hot water flow would stabilize to nearly zero at the end of power regulation.

4.2. Power Ramp Test

In order to obtain the power ramp rate of the optimized strategy, a further simulation test with ramp input is given as following: after the power becomes stable, at 150 s, a power disturbance with the ramp rate of 18 MW/min, i.e., 6% of its rated-heating power per minute, is imposed; after rebalance to a new point, at 280 s, a power disturbance with the ramp rate of 12 MW/min, i.e., 5% of its rated-heating power per minute, is imposed. The simulation curves with 2 different strategies are shown in Figure 10.
It can be seen from the figure that the control performance with our optimized strategy is superior to that with traditional CCS. The power output with the optimized strategy almost perfectly tracks the power demand, i.e., the power ramp rate of our strategy reaching 6% of its rated-heating power per minute, about two times faster than that of the traditional CCS.

5. Conclusions

In this paper, heat source regulation is firstly proposed to improve the CHP operating flexibility. The heat-power conversion model is set up to simulate the dynamic and static relationship between heat source flow variation and electric power output. An optimized control strategy is designed through combinations of traditional CCS and heat source regulation to improve the flexibility of unit. HA compensation water flow is calculated and controlled to keep the total heat output invariant. Finally, a 330 MW CHP unit is taken as an example to test and verify the effectiveness of our optimized strategy. The simulating curves and calculating indices prove that the unit load-following capability is significantly improved with our optimized strategy, and the heat source flow would be recovered to its former value at the end of control. The power ramp test can help to make a conclusion that the ramp rate of optimized strategy reaches 18 MW/min, about two times faster than that of traditional CCS. Moreover, the strategy is easy to be applied in reality, because it needs no hardware update. The most efficient way is to improve the power load control logic in the distributed control system (DCS). The strategy is also applicable for CHP units without Has, because heat source flow can be regulated to its former value in a short control period and have little impact on heat consumers.

Author Contributions

W.W. conceived and designed the algorithm; Y.S. organized and processed the data; S.J. performed the experiments; W.Z. and C.C. analyzed the results. All authors approved the manuscript.

Funding

This research was funded by Young Elite Scientists Sponsorship Program by CAST (2017QNRC001), the National Natural Science Foundation of China (U1766204) and the Fundamental Research Funds for the Central Universities (2018ZD05).

Conflicts of Interest

The authors declare no conflict of interest.

Nomenclature

PActive power
KGain coefficient
TTime constant
mfwFeed water mass flow
ASystem characteristic matrix
h0Live steam enthalpy
σReheater enthalpy rise
hcExhausted steam enthalpy
mHAWater mass flow of HA
μHAValve opening of HA
ptLive steam pressure
G(s)Transfer function
μBBoiler fuel flow
IAEIntegrated absolute error
K1Regulating rate factor
K3Responding rate
mhHeat source mass flow
τColumn vector of feed water enthalpy rise
mColumn vector of extraction steam flow
AhCharacteristic column vector of heat source extraction
hh,wDrainage water enthalpy from heating station
hw,iOutlet water enthalpy of the ith preheater
τiFeed water enthalpy rise of the ith preheater
mtMass flow of extraction steam for feed water pump turbine
CpSpecific heat of circulating water
ToutOutlet water temperature of heating station
TinInlet water temperature of heating station
mcirMass flow of circulating water in heat network
μTLive steam valve opening
ITAEIntegrated time absolute error
K2Regulating AC-curacy factor
KPOverall index

References

  1. Jovanovic, N.; García-González, J.; Cerisola, S.; Barquin, J. Impact of risk aversion on the operation of hydroelectric reservoirs in the presence of renewable energy sources. Energies 2018, 11, 1389. [Google Scholar] [CrossRef]
  2. Rikos, E.; Caerts, C.; Cabiati, M.; Syed, M.; Burt, G. Adaptive fuzzy control for power-frequency characteristic regulation in high-res power systems. Energies 2017, 10, 982. [Google Scholar] [CrossRef]
  3. Waite, M.; Modi, V. Modeling wind power curtailment with increased capacity in a regional electricity grid supplying a dense urban demand. Appl. Energy 2016, 183, 299–317. [Google Scholar] [CrossRef] [Green Version]
  4. Dong, C.; Qi, Y.; Dong, W.; Lu, X.; Liu, T.; Qian, S. Decomposing driving factors for wind curtailment under economic new normal in China. Appl. Energy 2018, 217, 178–188. [Google Scholar] [CrossRef]
  5. Benato, A.; Stoppato, A.; Mirandola, A. Dynamic behaviour analysis of a three pressure level heat recovery steam generator during transient operation. Energy 2015, 90, 1595–1605. [Google Scholar] [CrossRef]
  6. Zhao, Y.; Wang, C.; Liu, M.; Chong, D.; Yan, J. Improving operational flexibility by regulating extraction steam of high-pressure heaters on a 660 MW supercritical coal-fired power plant: A dynamic simulation. Appl. Energy 2018, 212, 1295–1309. [Google Scholar] [CrossRef]
  7. Tian, Z.; Yuan, J.; Xu, L.; Zhang, X.; Wang, J. Model-based adaptive sliding mode control of the subcritical boiler-turbine system with uncertainties. ISA Trans. 2018, 79, 161–171. [Google Scholar] [CrossRef] [PubMed]
  8. Sun, L.; Li, D.; Lee, K.Y.; Xue, Y. Control-oriented modeling and analysis of direct energy balance in coal-fired boiler-turbine unit. Control Eng. Pract. 2016, 55, 38–55. [Google Scholar] [CrossRef]
  9. Sondhi, S.; Hote, Y.V. Fractional order PID controller for load frequency control. Energy Convers. Manag. 2014, 85, 343–353. [Google Scholar] [CrossRef]
  10. Yu, D.; Xu, J. Nonlinear coordinated control of drum boiler power unit based on feedback linearization. IEEE Trans. Energy Convers. 2005, 20, 204–210. [Google Scholar] [CrossRef]
  11. Moradi, H.; Bakhtiari-Nejad, F.; Saffar-Avval, M. Robust control of an industrial boiler system; a comparison between two approaches: Sliding mode control & technique. Energy Convers. Manag. 2009, 50, 1401–1410. [Google Scholar] [CrossRef]
  12. Yu, T.; Chan, K.W.; Tong, J.P.; Zhou, B.; Li, D.H. Coordinated robust nonlinear boiler-turbine-generator control systems via approximate dynamic feedback linearization. J. Process. Control 2010, 20, 365–374. [Google Scholar] [CrossRef]
  13. Liu, X.; Cui, J. Economic model predictive control of boiler-turbine system. J. Process. Control 2018, 66, 59–67. [Google Scholar] [CrossRef]
  14. Kong, X.; Liu, X.; Lee, K.Y. Nonlinear multivariable hierarchical model predictive control for boiler-turbine system. Energy 2015, 93, 309–322. [Google Scholar] [CrossRef]
  15. Wu, X.; Shen, J.; Li, Y.; Lee, K.Y. Data-driven modeling and predictive control for boiler-turbine unit using fuzzy clustering and subspace methods. ISA Trans. 2014, 53, 699–708. [Google Scholar] [CrossRef] [PubMed]
  16. Lausterer, G.K. Improved maneuverability of power plants for better grid stability. Control Eng. Pract. 1998, 6, 1549–1557. [Google Scholar] [CrossRef]
  17. Hu, Y.; Zeng, D.L.; Liu, J.Z.; Zhao, Z.; Li, Y.Z. Dynamic model for controller design of condensate throttling systems. ISA Trans. 2015, 58, 622–628. [Google Scholar] [CrossRef] [PubMed]
  18. Umezawa, S. Output increase of conventional thermal power plants by the method of feed water bypassing feed water heaters. Mech. Engi. J. 2014, 1, TEP0043. [Google Scholar] [CrossRef]
  19. Li, Z.; Wu, W.; Shahidehpour, M.; Wang, J.; Zhang, B. Combined heat and power dispatch considering pipeline energy storage of district heating network. IEEE Trans. Sustain. Energy 2016. [Google Scholar] [CrossRef]
  20. Chen, X.; Kang, C.; O’Malley, M.; Xia, Q.; Bai, J.; Liu, C.; Sun, R.; Wang, W.; Li, H. Increasing the flexibility of combined heat and power for wind power integration in china: Modeling and implications. IEEE Trans. Power Syst. 2015, 30, 1848–1857. [Google Scholar] [CrossRef]
  21. Zheng, J.; Zhou, Z.; Zhao, J.; Wang, J. Integrated heat and power dispatch truly utilizing thermal inertia of district heating network for wind power integration. Appl. Energy 2018, 211, 865–874. [Google Scholar] [CrossRef]
  22. Li, P.; Wang, H.; Lv, Q.; Li, W. Combined heat and power dispatch considering heat storage of both buildings and pipelines in district heating system for wind power integration. Energies 2017, 10, 893. [Google Scholar] [CrossRef]
  23. Yang, Y.; Wu, K.; Long, H.; Gao, J.; Yan, X.; Kato, T.; Suzuoki, Y. Integrated electricity and heating demand-side management for wind power integration in China. Energy 2014, 78, 235–246. [Google Scholar] [CrossRef]
  24. Gu, W.; Wang, J.; Lu, S.; Luo, Z.; Wu, C. Optimal operation for integrated energy system considering thermal inertia of district heating network and buildings. Appl Energy 2017, 199, 234–246. [Google Scholar] [CrossRef]
  25. Korpela, T.; Kaivosoja, J.; Majanne, Y.; Laakkonen, L.; Nurmoranta, M.; Vilkko, M. Utilization of district heating networks to provide flexibility in CHP production. Energy Procedia 2017, 116, 310–319. [Google Scholar] [CrossRef]
  26. Streckienė, G.; Martinaitis, V.; Andersen, A.N.; Katz, J. Feasibility of CHP-plants with thermal stores in the German spot market. Appl. Energy 2009, 86, 2308–2316. [Google Scholar] [CrossRef]
  27. Željko, B.; Kopjar, D. Improvement of the cogeneration plant economy by using heat accumulator. Energy 2006, 31, 2285–2292. [Google Scholar] [CrossRef]
  28. Zhao, H.; Holst, J.; Arvastson, L. Optimal operation of coproduction with storage. Energy 1998, 23, 859–866. [Google Scholar] [CrossRef]
  29. Nuytten, T.; Claessens, B.; Paredis, K.; Van Bael, J.; Six, D. Flexibility of a combined heat and power system with thermal energy storage for district heating. Appl. Energy 2013, 104, 583–591. [Google Scholar] [CrossRef]
  30. Diangelakis, N.A.; Panos, C.; Pistikopoulos, E.N. Design optimization of an internal combustion engine powered CHP system for residential scale application. Comput. Manag. Sci. 2014, 11, 237–266. [Google Scholar] [CrossRef]
  31. Savola, T.; Fogelholm, C.J. MINLP optimisation model for increased power production in small-scale CHP plants. Appl. Therm. Eng. 2007, 27, 89–99. [Google Scholar] [CrossRef]
  32. Liu, J.; Hu, Y.; Zeng, D.; Wang, W. Optimization of an air-cooling system and its application to grid stability. Appl. Therm. Eng. 2013, 61, 206–212. [Google Scholar] [CrossRef]
  33. Lissner, M.; Tissot, J.; Leducq, D.; Azzouz, K.; Fournaison, L. Performance study of latent heat accumulators: Numerical and experimental study. Appl. Therm. Eng. 2016, 102, 604–614. [Google Scholar] [CrossRef]
  34. Tan, W.; Liu, J.; Fang, F.; Chen, Y. Tuning of PID controllers for boiler-turbine units. ISA Trans. 2004, 43, 571–583. [Google Scholar] [CrossRef]
  35. Wang, W.; Liu, J.; Zeng, D.; Niu, Y.; Cui, C. An improved coordinated control strategy for boiler-turbine units supplemented by cold source flow adjustment. Energy 2015, 88, 927–934. [Google Scholar] [CrossRef]
  36. Long, D.; Wang, W.; Yao, C.; Liu, J. An experiment-based model of condensate throttling and its utilization in load control of 1000 MW power units. Energy 2017, 133, 941–954. [Google Scholar] [CrossRef]
Figure 1. Schematic diagram for the CHP with HA.
Energies 11 02815 g001
Figure 2. Diagram of reducing power production of CHP units through HA.
Energies 11 02815 g002
Figure 3. Diagram of accelerating power ramp rate of CHP units through HA.
Energies 11 02815 g003
Figure 4. Experimental and model predicted curves of heat source extraction flow and power output.
Energies 11 02815 g004
Figure 5. Optimized control strategy structure by combinations of CCS and heat source regulation.
Energies 11 02815 g005
Figure 6. Response curves of power output with power step input by two different strategies.
Energies 11 02815 g006
Figure 7. Response curves of live steam pressure with power step input by two different strategies.
Energies 11 02815 g007
Figure 8. Power responses of CCS and heat source regulation with our optimized control strategy.
Energies 11 02815 g008
Figure 9. The thermal power output in the process of variable load.
Energies 11 02815 g009
Figure 10. Response curves of power output with power ramp input by two different strategies.
Energies 11 02815 g010
Table 1. Calculation results on a 330 MW unit.
Main Steam Flow (t/h)Heat Source Flow (t/h)Rated Power Output (MW)K with Rated DataPredicted KPredicted Power Output (MW)Relative Error
11370348.481--348.5690.02%
1137500280.443−0.1361−0.1388279.1770.45%
1137600266.889−0.1360−0.1388265.2980.59%
Table 2. Predicted K for some typical units.
Unit TypeHeating Drainage Water DirectionMain Steam Flow (t/h)Heat Source Flow (t/h)Predicted KPredicted Power Output (MW)
310 MWDeaerator9850--302.9555
985100−0.1159291.3618
985200−0.1158279.7680
10380--280.6682
1038150−0.0887267.3590
1038300−0.0887254.0498
600 MW6# LP preheater15330--503.3288
15332000.1899465.3421
15334000.1899427.3553
1856450--497.2991
1856500−0.1740488.5960
1856550−0.1741479.8929
850 MW5# LP preheater19130--690.1195
1913200−0.1420661.7166
1913400−0.1419633.3137
24690--855.0893
2469250−0.1267823.4086
2469500−0.1267791.7279
Table 3. Control performance index with two different strategies.
Performance IndexTraditional CCSOptimized Strategy
IAE index77.414.5
ITAE index14,0972725
AGC index: K10.91.49
AGC index: K21.2261.855
AGC index: K31.732.00
AGC index: KP1.9085.527

