Article

Using SVM-RSM and ELM-RSM Approaches for Optimizing the Production Process of Methyl and Ethyl Esters

by
Sina Faizollahzadeh Ardabili
1,
Bahman Najafi
1,
Meysam Alizamir
2,
Amir Mosavi
3,4,5,
Shahaboddin Shamshirband
6,7,* and
Timon Rabczuk
8
1
Biosystem Engineering Department, University of Mohaghegh Ardabili, Ardabil 5619911367, Iran
2
Department of the Civil Engineering, Hamedan Branch, Islamic Azad University, Hamedan, Iran
3
Institute of Structural Mechanics, Bauhaus University Weimar, D-99423 Weimar, Germany
4
Institute of Automation, Obuda University, 1431 Budapest, Hungary
5
Institute of Advanced Studies Koszeg (IASK), 9730 Koszeg, Hungary
6
Department for Management of Science and Technology Development, Ton Duc Thang University, Ho Chi Minh City, Vietnam
7
Faculty of Information Technology, Ton Duc Thang University, Ho Chi Minh City, Vietnam
8
Department of Computer Engineering, College of Computer and Information Sciences, King Saud University, Riyadh, Saudi Arabia
*
Author to whom correspondence should be addressed.
Energies 2018, 11(11), 2889; https://doi.org/10.3390/en11112889
Submission received: 15 July 2018 / Revised: 18 September 2018 / Accepted: 8 October 2018 / Published: 24 October 2018

Abstract

:
The production of a desired product needs an effective use of the experimental model. The present study proposes an extreme learning machine (ELM) and a support vector machine (SVM) integrated with the response surface methodology (RSM) to solve the complexity in optimization and prediction of the ethyl ester and methyl ester production process. The novel hybrid models of ELM-RSM and ELM-SVM are further used as a case study to estimate the yield of methyl and ethyl esters through a trans-esterification process from waste cooking oil (WCO) based on American Society for Testing and Materials (ASTM) standards. The results of the prediction phase were also compared with artificial neural networks (ANNs) and adaptive neuro-fuzzy inference system (ANFIS), which were recently developed by the second author of this study. Based on the results, an ELM with a correlation coefficient of 0.9815 and 0.9863 for methyl and ethyl esters, respectively, had a high estimation capability compared with that for SVM, ANNs, and ANFIS. Accordingly, the maximum production yield was obtained in the case of using ELM-RSM of 96.86% for ethyl ester at a temperature of 68.48 °C, a catalyst value of 1.15 wt. %, mixing intensity of 650.07 rpm, and an alcohol to oil molar ratio (A/O) of 5.77; for methyl ester, the production yield was 98.46% at a temperature of 67.62 °C, a catalyst value of 1.1 wt. %, mixing intensity of 709.42 rpm, and an A/O of 6.09. Therefore, ELM-RSM increased the production yield by 3.6% for ethyl ester and 3.1% for methyl ester, compared with those for the experimental data.

1. Introduction

Nowadays, dependence on fossil fuels have caused an environmental crisis and a high production volume of pollutants [1,2]. Recently, the benefits of biofuels and comprehensive research in the field of converting renewable resources into the biofuels [3,4] have attracted much attention regarding the possibility of producing and using renewable fuels [5] such as biodiesel [6].
Waste oils, edible and nonedible oils, and animal fats are common feed-stocks to produce biodiesel [7,8,9]. The biodiesel is produced from a reaction between a short chain alcohol and oils through a transesterification process in the presence of an acidic or alkaline catalyst [10,11].
The numerous advantages of biodiesel as an alternative fuel has led many researchers to produce, evaluate, and use this fuel recently. Xue et al. [12] produced biodiesel from soybean and Jatropha oils using a magnetic catalyst. Ma et al. [13] produced biodiesel from unrefined methanol during a transesterification process. Román-Figueroa et al. [14] produced biodiesel from crude castor oil (Ricinus communis) during a non-catalytic supercritical methanol transesterification process. Raia et al. [15] produced biodiesel from Jatropha curcas L. oil during simultaneous esterification and transesterification mechanisms using sulfated zirconia. They found that the esterification mechanism is faster than transesterification in the beginning reaction. Ali et al. [16] produced biodiesel from waste cooking oil (WCO) using purified lipase of Pseudomonas aeruginosa. They reached a maximum biodiesel yield of 86% by optimizing the reaction conditions. Carvalho et al. [17], produced biodiesel from Mucor circinelloides in the presence of ethanol and impregnated heteropoly acid on alumina as a catalyst during one and two-step transesterification mechanisms.
The production of a desired product needs an effective use of an experimental model [18]. There are several modeling methods and the simplest method of modeling is a mathematical approach (or sometimes is remembered as a classic model) [19]. Modeling methods contain a wide range of methods from mathematical to soft computing methods, but modeling an ill-defined system, such as a biodiesel production process, becomes even more pronounced using mathematical and statistical techniques due to the complexity and the biological nature of biodiesel [20,21].
Soft computing methods are able to do complex modeling tasks without the need for relations governing the system. Adaptive neuro-fuzzy inference system (ANFIS) and artificial neural networks (ANNs) are different types of soft computing methods. Neural networks are widely applied on biodiesel production by various researchers. Recently models developed with the basis of soft computing methods have been used for the study and prediction of processes. Many of them originated from ANN models. The mentioned models have a high performance and accuracy. The arrival of these models to studies related to the production and the use of biodiesel will improve efficiency.
Sharon et al. [22] studied trained ANN in a SIMULINK model for biodiesel production and the prediction of a diesel engine performance. They studied the effect of NaOH on transesterification of fried oils. Fahmi and Cremaschi [23] developed ANN as alternative models to replace the real operation, thermodynamics, and complex models. They found that the ANN method reduces the computation cost. Moradi et al. [24] studied transesterification of soybean oil to biodiesel using KOH in different conditions. They applied ANN to estimate the biodiesel yield. Chakraborty and Sahu [25] evaluated the biodiesel production from waste goat tallow using a response surface method (RSM) and ANN. Farobie et al. [26] employed an ANN method to model the biodiesel production process in the presence of methanol and ethanol. Maran and Priya [27] applied ANN and RSM methods to predict the biodiesel production process from Azadirachta indica oil during an ultrasound-assisted intensification process. They reported ANN has better performance compared to RSM for predicting biodiesel production in the mentioned process. Maran and Priya [28] in another study employed RSM and ANN methods for modeling biodiesel production from muskmelon oil using an ultrasound-assisted reactor. The prediction ability of the ANN model was much better than RSM. Betiku et al. [29] developed ANN with a genetic algorithm (GA) and RSM models to model and optimize the transesterification step from the production of biodiesel from shea oil. Sarve et al. [30] applied RSM and ANN methods in a comparative study to produce biodiesel from Sesamum indicum L. oil in the presence of barium hydroxide as a catalyst for the reaction. Based on the results, ANN showed better prediction capability than RSM.
In a study by Aghbashlo et al. [31], the ELM method with wavelet transform (WT) algorithm was applied to predict the performance of diesel engine running on diesel/biodiesel blends from the viewpoint of exergetic theory. They compared the performance of ELM-WT, ELM, genetic programming (GP), and ANN models for the exergetic modeling of the engine.
Nowadays, using hybrid methods has become popular in modeling and estimating studies. These methods combine more than one classifier, estimator, or uses one for estimating and the other for optimizing. This helps to improve the current system performance and accuracy to get better results in the biodiesel production process or to optimize the production process. Based on the developed studies, the hybrid approach performs better than the single approach. Srivastava et al. [32] employed a hybrid optimization method using RSM, ANN, and GA to optimize the biodiesel production during supercritical methanol transesterification. Saeidi et al. [33] used a modified data envelopment analysis (MDEA), as a hybrid of data envelopment analysis (DEA) with ANN to design a multi-response problem, which was validated by RSM to optimize the biodiesel production from waste cooking palm oil. Sajjadi et al. [34] used ANFIS-PSO, ANFIS-GA and ANFIS-DE methods to estimate the effect of ultrasound and mechanically stirring systems on biodiesel synthesis in the transesterification process.
The present study follows from our previous study in reference [35]. The main point of the present study is to the use ELM and SVR methods to estimate the yield of methyl and ethyl esters through a trans-esterification process from WCO based on American Society for Testing and Materials (ASTM) standards and link them with an RSM to optimize the process (as a hybrid ELM-RSM and ELM-SVR) to provide a novel hybrid approach. To our best knowledge, this is the first report on biodiesel production with these approaches. The results of this study can help achieve efficient production and develop automatic devices and processes for the production of biodiesel. In reference [35], the main platform of modeling was to employ the single ANN method, RSM, and hybrid ANFIS methods to estimate the yield and cost of biodiesel production. The present study completes the previous study by developing hybrid ELM-RSM and ELM-SVR methods that enable us to focus on both prediction and optimization of the complex production system (biodiesel production system).

2. Material and Methodology

Biodiesel Production and Properties Measuring

In the present study, the biodiesel was produced from WCO during a transesterification process in the presence of a NaOH catalyst using ethanol and methanol. Figure 1 shows the production stages graphically.
WCO is a low cost material for biodiesel production [36,37]. Biodiesel production yield (BPY) was measured in various conditions. Reaction temperature, alcohol type, molar ratio of alcohol to oil, amount of catalyst, mixing intensity, and reaction time were considered as independent variables of the tests (input variables of the model). Based on the definition, the biodiesel production efficiency is equal to the ratio of produced biodiesel weight to the initial weight of the oil [38,39,40,41]. The data of the biodiesel production and testing variables are tabulated on Table 1.

3. Extreme Learning Machine

Extreme learning machines (ELMs) have become an interesting topic for research in recent years. These methods were first introduced by Huang et al. [42]. The ELM model operates on generalized single-hidden-layer feed-forward networks (SLFNs) based on structural risk minimization principles. In the ELM, the hidden layer does not need to be set and the functions of this layer, which is a feature transfer to the new space, are already specified. Support vector machine (SVM), radial basis function (RBF), and single layer feed forward models are special cases of this model. Figure 2 presents the architecture of the ELM model [43].
In this case, the researchers have focused on several main goals:
(1)
The ELM model can provide an integrated template for a variety of types of broad features that can be used in a hidden layer, which can be directly used in multi-part and regression categorizations [31].
(2)
From the viewpoint of optimizing, ELM contains more restrictive constraints than PSVM and LS-SVM.
(3)
SVM and LS-SVM models have more computational complexity than ELM.
(4)
Theoretically, the ELM model can estimate each integer target function and classify each distinct region. Practical results show that this model has better scalability, for regression and two-class categorization, it has similar generalizability, and for multi-class categorization, it has better generalizable and a much higher computation rate than the conventional SVM and LS-SVM methods [43].
ELM uses the same kernel as SVM, such as the linear kernel and the RBF kernel.
Linear kernel (core function): k (xi, xj) = xi.xj;
RBF kernel (core function): k   ( x i , x j ) = e x p ( x i x j 2 2 σ 2 ) .
Recent research showed that proximal support vector machine (PSVM), least square support vector machine (LS-SVM), and regularization algorithms can be further simplified and placed in an integrated format called ELM.
This model aims to provide an integrated model that incorporates all of the above-mentioned methods not initially referred to as ELMs. The ELM model was originally proposed for SLFNs and then was extended to the generalized SLFNs. For L samples (xi, ti) [xi = [xi1, xi2, …, xin]TϵRn and ti = [ti1, ti2, …, tin]TϵRm], Equation (1) estimates the SLFNs with k hidden nodes and h(x) activation function.
f ( x ) = h ( x ) β = i = 1 L β i h i ( x ) = i = 1 L β i h i ( w i . x j + b i ) = o j , j = 1 , , k
  • wi presents the weight vector between input and hidden nodes;
  • βi presents the weight vector between output and hidden nodes;
  • bi presents the threshold of the ith hidden node.
Unlike the usual learning methods, the ELM not only tries to minimize the error of the training data, it also tries to minimize the norm of the weights of the output [44]. According to the Barlet theory for SLFNs, a soft weight loss along with the reduction of the training error is better for generalizability [45]. Therefore, the ELM target function that attempts to reduce the training error and the weights norm of the output is as Equation (2):
Minimize :   H β T 2   and   β
where:
H = [ h ( w 1 . x 1 + b 1 ) h ( w L . x 1 + b L ) h ( w 1 . x k + b 1 ) h ( w L . x k + b L ) ] k * L
β = [ β 1 T : β L T ] L * m
T = [ t 1 T : t L T ] L * m
• H is the hidden layer output matrix on the neural network.
The output weights can be calculated using the following equation:
β = H T
•  H is the inverse of the hidden layer output matrix H.
More details about the ELM are available in references [42,43]. The user-defined function was obtained using a trial and error method. The parameters of this function are given in Table 2.

4. Support Vector Machine

SVM is considered to be a soft computing method, which i based on statistical learning theory with a wide application in many fields of science for classification and regression problems [46,47]. One of the advantages of this method is that the SVM reduces the generalized upper bound error rather than the local training error which makes it more particular compared to other machine learning methods.
For xi input data and yi target data with data size of n ( { x i ,   d i } i n ), Equations (7) and (8) give the SVM estimation:
f ( x ) = w φ ( x ) + b
R S V M s ( C ) = 1 2 w 2 + C 1 n i = 1 n L ( x i , y i )
  • φ ( x ) is defined as the high dimensional space feature that mapped the input space vector x;
  • w is defined as the normal vector;
  • C 1 n i = 1 n L ( x i , y i ) is defined as the empirical error.
The parameters w and b can be calculated by minimizing the RSVMs for a regular couple of ( w , ξ * ) .
M i n i m i z e R S V M s ( w , ξ * ) = 1 2 w 2 + C i = 1 n ( ξ i + ξ i n ) Sub . to { d i w φ ( x i ) + b i ε + ξ i w φ ( x i ) + b d i ε + ξ i * ξ i , ξ i * 0 , i = 1 , , l
  • C is defined as positive regularization parameter for minimizing the empirical error;
  • ξ i , ξ i * are the penalties of the training error by the loss function;
  • ε is the chosen error tolerance.
In natural processes, the predictor variables (from the input space) and objective variables (from output space) have a nonlinear relation. Mapping the input space onto the feature space using a kernel function can solve this limitation. Lagrange multipliers solve Equation (10). Any function satisfying the Mercer condition qualifies as a kernel function. The generalization ability is affected by the kernel function. Linear, sigmoid, polynomial, and RBFs are four basic kernel functions. Among these four, the RBF is the simplest, and most efficient and adaptive function. The RBF kernel function is as follows:
K ( x i , x j ) = exp ( γ x i x j 2 )
  • (xi, xj) are the vectors of the input space;
  • γ is the regularization parameter.
The accuracy and performance of the RBF kernel function depends on γ, C, and ε. In the present study, these parameters are determined during a trial and error method as 0.35, 1000 and 0.05 respectively for γ, C, and ε.
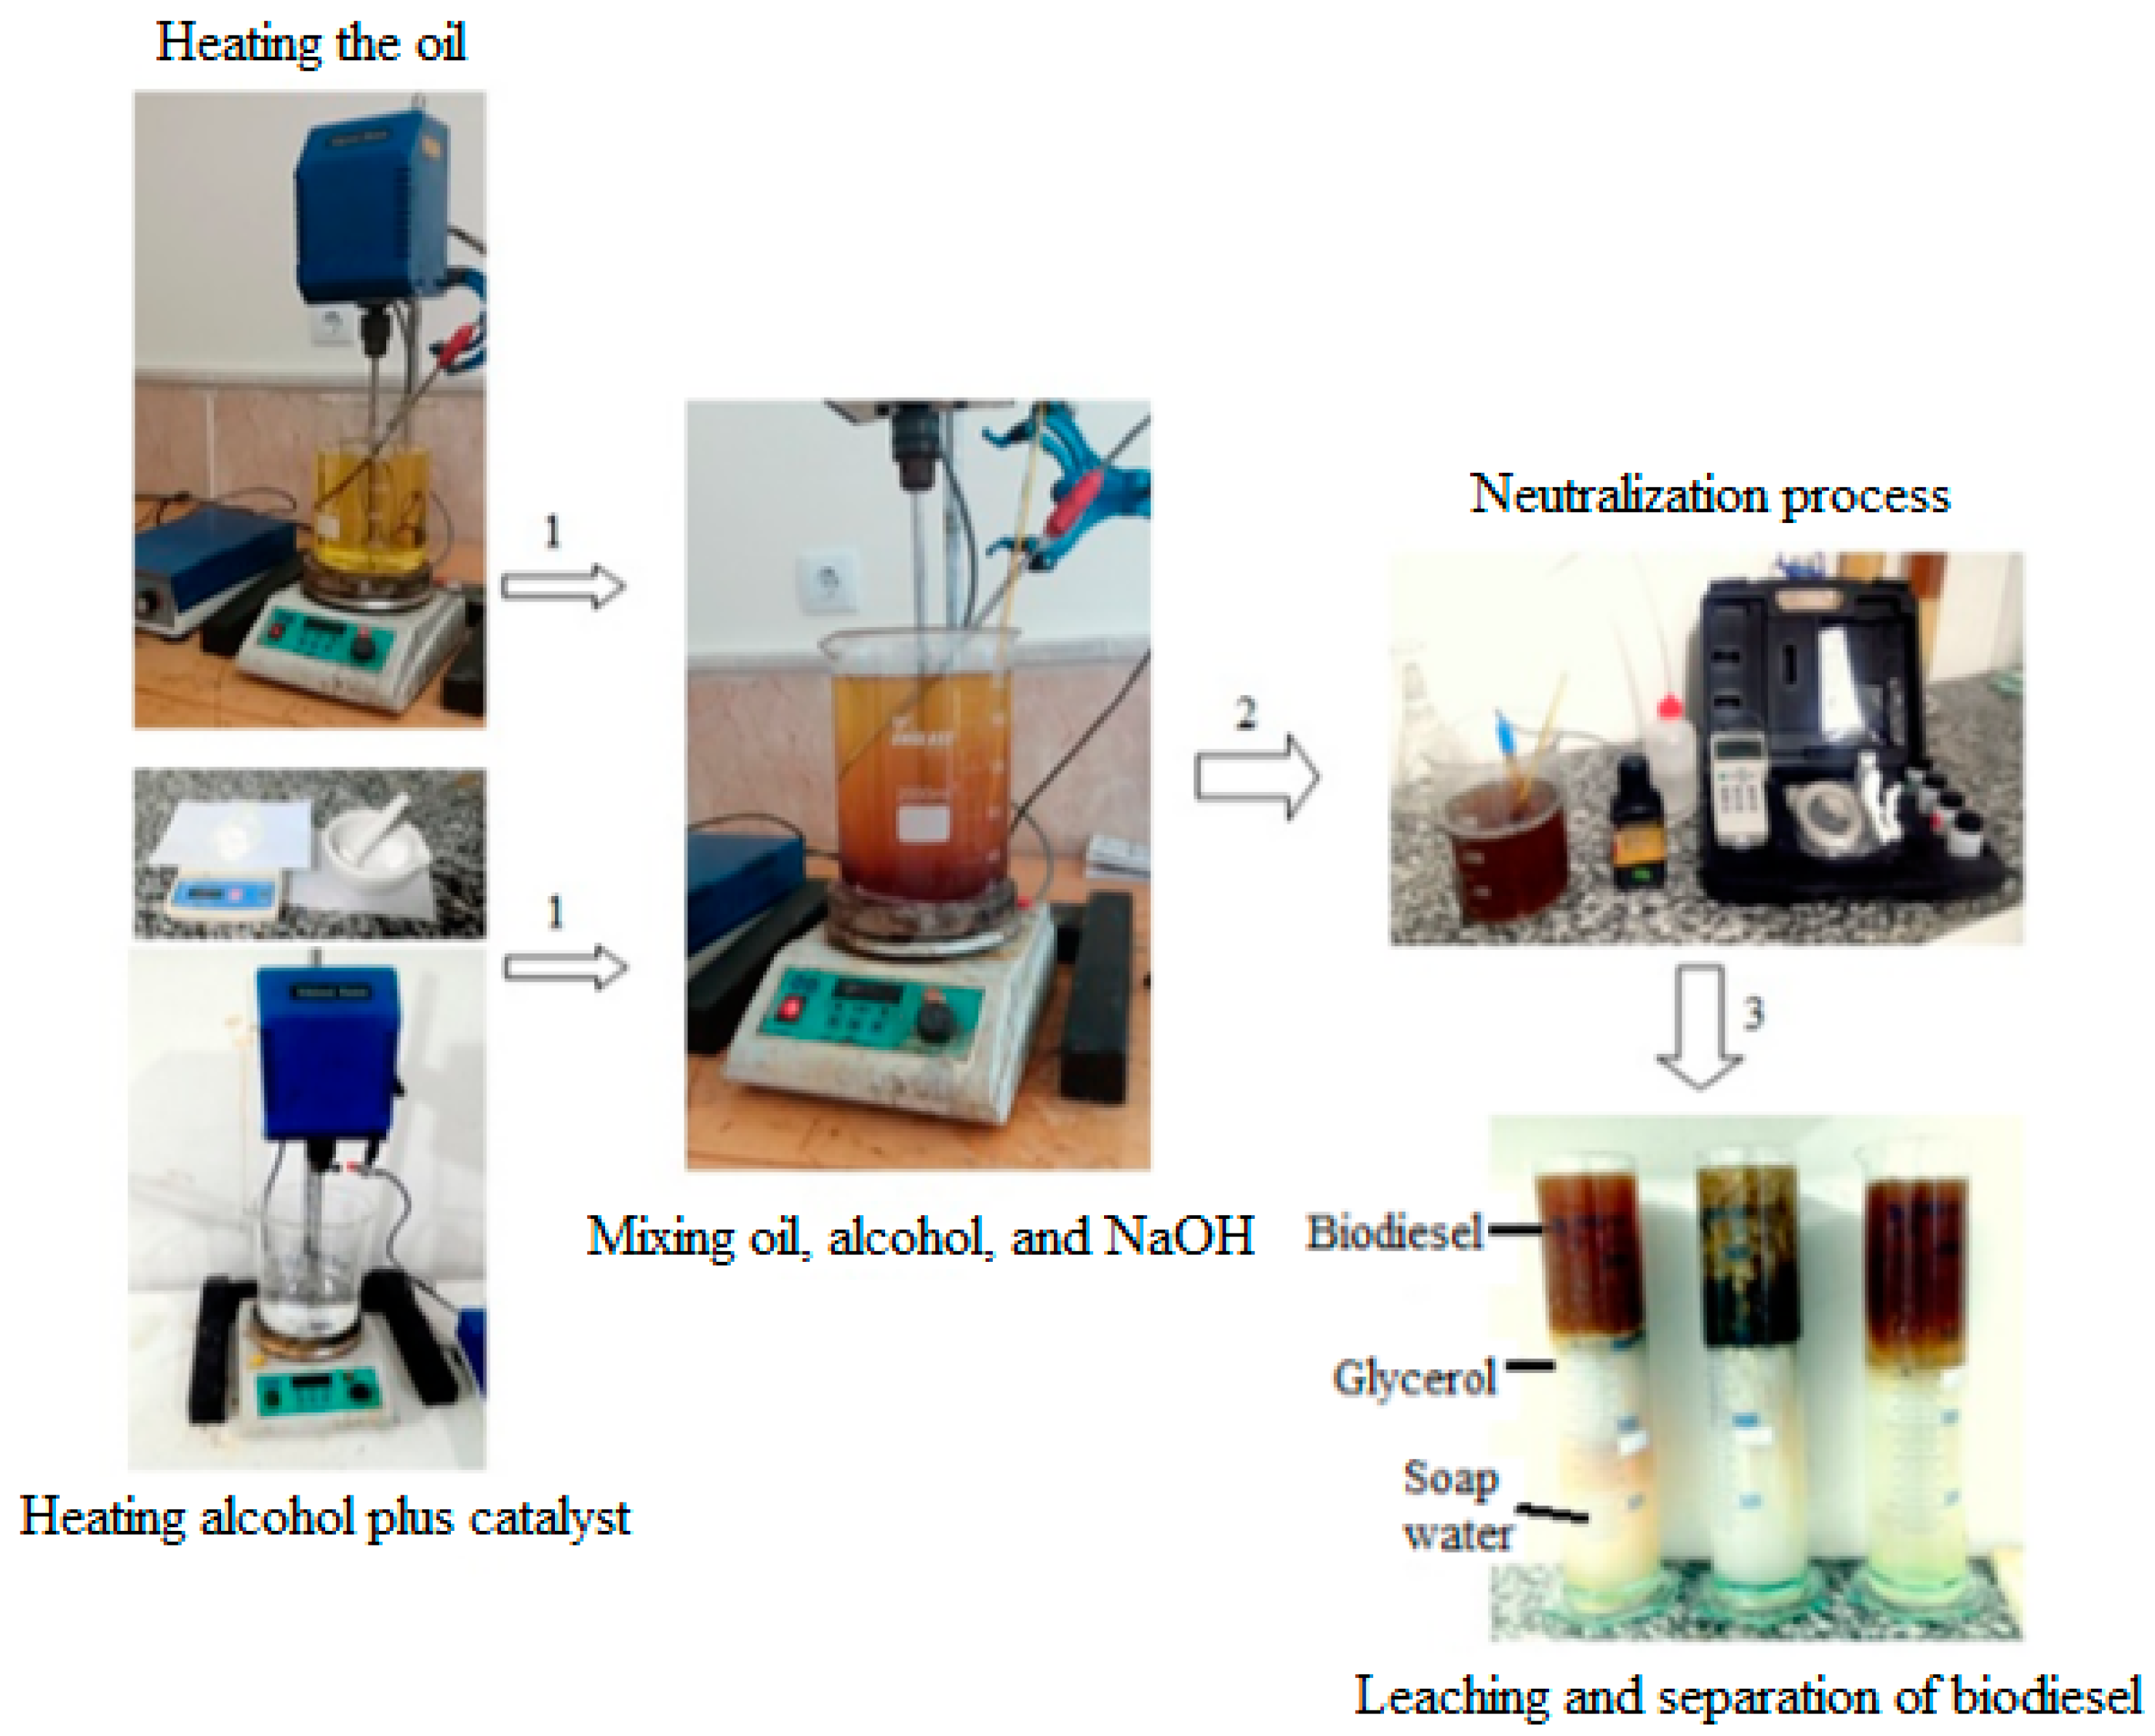
5. Evaluation of Developed Models

The performance of each model is calculated by comparing the outputs of the models and the target values. Comparisons were performed by employing mean absolute error (MAE), root mean square error (RMSE), and r.
R M S E = 1 N j = 1 N ( A P ) 2
M A E = 1 N j = 1 N | A P |
r = ( 1 ( i = 1 n ( A P ) 2 i = 1 n ( A ) 2 ) )
where A is the target value, P is the predicted value, and N is the number of data points. MAE and RMSE calculate the difference of the target and predicted values and r is a measure of the linearity between target and predicted values [20,21].

6. Results

Data were collected during a transesterification process for producing ethyl and methyl esters (Table 1). The study used temperature (°C), time (min), A/O, catalyst (wt. %), mixing intensity (rev/min), and ethyl and methyl esters yields (%).
Based on Table 1, the results of the experimental approach show that the high production yield for ethyl and methyl esters were 93.5% and 95.5%, respectively, which was accrued at a temperature of 70 °C, a process time of 90 min, an A/O of 6:1, a catalyst value of 1 wt. %, and a mixing intensity of 600 rpm. Selecting the input variables is one of the most important issues when developing prediction models. Table 3 and Table 4 present the variance analysis of biodiesel production data for ethanol and methanol, respectively. The effect of all parameters on biodiesel production for both alcohol types were significant effects at probability level of 1%, therefore all parameters were effective in biodiesel production and were involved. Using them can provide a good prediction, therefore it can be presented as a model with one output and five inputs, as given in Equation (14). Therefore, data were divided into two categories: input data (including temperature (°C), time (min), A/O, catalyst (wt. %), and mixing intensity) and output data (methyl ester/ethyl ester yield (%)).
B P Y = f ( T e m p . , R . t i m e , A / O , Cat . , Sti . )
Accordingly, due to the correlation of input variables and output variables, it was possible to model the output variables against the input variables. In the following, the results of modeling are presented.

7. The Results of Modeling

In this section, the results of modeling using ELM and SVM methods are presented and compared with the results of a study previously developed by Najafi et al. [35]. Table 5 reports the results of the training process for the best predictor of both ELM and SVM methods. The training process was performed by choosing the best predictor and accordingly choosing the parameters of the user-defined functions. The training process was performed using 75% of data. The models were developed using MATLAB Software R2012a (MathWork Inc., New York, NY, USA). Based on Table 5, the best ELM-based predictor, which was obtained using 15 neurons on a hidden layer and a sigmoid function as an activation function, provided a correlation of 0.9815 and 0.9863 and RMSE of 1.78 and 1.7 for estimating methyl and ethyl esters, respectively; on the other hand, in the case of using the SVM methodology, the best predictor was obtained by using the RBF kernel with parameters of 1000, 0.05, and 0.35 for C, ε, and γ, respectively, with high correlation coefficients of 0.9656 and 0.9769 and low RMSEs of 2.407 and 2.148 for methyl and ethyl esters, respectively.
As is clear from Table 5, the ability of the developed models in estimating ethyl ester was a little more than predicting methyl ester (based off high correlation values of estimating ethyl ester and low RMSE values for ELM, SVM, MLP, RBF, and ANFIS).
However, in the case of comparing models in the training stage, the ability of the ELM method to estimate both of the methyl and ethyl esters was significantly higher than that of the SVM method, which was developed in the present study (with a higher correlation coefficient of 0.9815 and 0.9863 and lower RMSE values of 1.78 and 1.7 for methyl and ethyl esters, respectively), and MLP, RBF and ANFIS techniques, which were developed by Najafi et al. [35].
In the case of testing the developed methods using the other 25% of the data, the results were a little different compared to the training stage (Table 6). More specifically, the ability of SVM in the testing stage for estimating methyl ester production was higher than that of ethyl ester production, unlike the training stage (with correlation coefficients of 0.915 and 0.8945 and RMSE values of 2.805 and 2.105 for methyl and ethyl esters, respectively). On the other hand, it can be seen that the ability of each predictor has been reduced in the testing stage compared to the training stage. To see the reduction of the modeling capability quantitatively, the factor of comparison of training and testing capability (CTTC) was employed (Equation (15)). In fact, this factor indicates the difference percentage of each parameter in testing and training stages. Based on these two factors, the CTTCr indicates the difference percentage for the correlation coefficient in the testing stage compared to the training stage where this parameter describes the reduction or increase of modeling performance of the testing stage compared to the training stage:
C T T C r = R t e s t R t r a i n R t r a i n × 100
where rtrain is the correlation coefficient of the training stage and rtest is the correlation coefficient of the testing stage.
As is clear from Table 6, both ELM and SVM had a reduction in modeling performance as seen by the negative sign for CTTCr. In the ELM model, the reduction of modeling performance in the case of methyl ester production was higher than that of ethyl ester production (−5.2% and −2.9% for methyl and ethyl esters, respectively), but in the case of the SVM model, the reduction of the modeling performance in the case of ethyl ester production was higher than that of methyl ester production (−5.2 and −8.4 for methyl and ethyl esters, respectively). Figure 3 also indicates the scatter plot of the testing stage for ELM and SVM for the production of methyl and ethyl esters. Based on Figure 3, it is clear that the ability of ELM in the case of ethyl ester production was higher than that of methyl ester production (with R2 values of 0.9179 and 0.8649 for methyl and ethyl esters, respectively) but in the case of the SVM method, the result is the opposite such that the ability of the SVM in the case of methyl ester production was higher than that of ethyl ester production (with R2 values of 0.8387 and 0.8002 for methyl and ethyl esters, respectively).

8. Hybrid Modeling

This section describes a novel hybrid method by merging RSM, SVM, and ELM methods (i.e., RSM-SVM and RSM-ELM). In statistics, RSM provides the relationships among several explanatory variables and response variables. The method was introduced by Box and Wilson in 1951 [48]. This methodology was performed on Design Expert Software Version 7.0 (Stat-Ease Inc., Minneapolis, MN, USA, 2005). The quadratic process order and manual selection were selected using a trial and error method to model the production of methyl and ethyl esters based on input variables. Modeling results had very good results so that the relation of predicted and target values had correlation coefficients of 0.983 and 0.9743 for methyl and ethyl esters, respectively. Figure 4 indicates the schematic diagram of the developed hybrid models.
The general logic of this model was that the inputs were imported to both RSM and ELM or SVM predictor simultaneously, then the output of the predictor was imported to the RSM method as the response of the system. Finally, the RSM method exports the desired results.
After preparing the model, data were imported to the model and the output of the model were extracted. In this stage, the mode was employed as a predictor model. The results are presented in Table 7.
Using a hybrid method improved and increased the system prediction efficiency compared to the testing stage of each predictor (Table 6). In this case, the RSM-ELM method had a high prediction capability compared to that of the RSM-SVM method.
After ensuring the accurate operation of the developed hybrid methods, it was the time for entering the optimization phase. The optimization phase was performed in three stages, one with experimental data, a second with data generated using the ELM method, and the third with data generated using the SVM method. All three phases were performed to maximize the methyl or ethyl esters production yield.
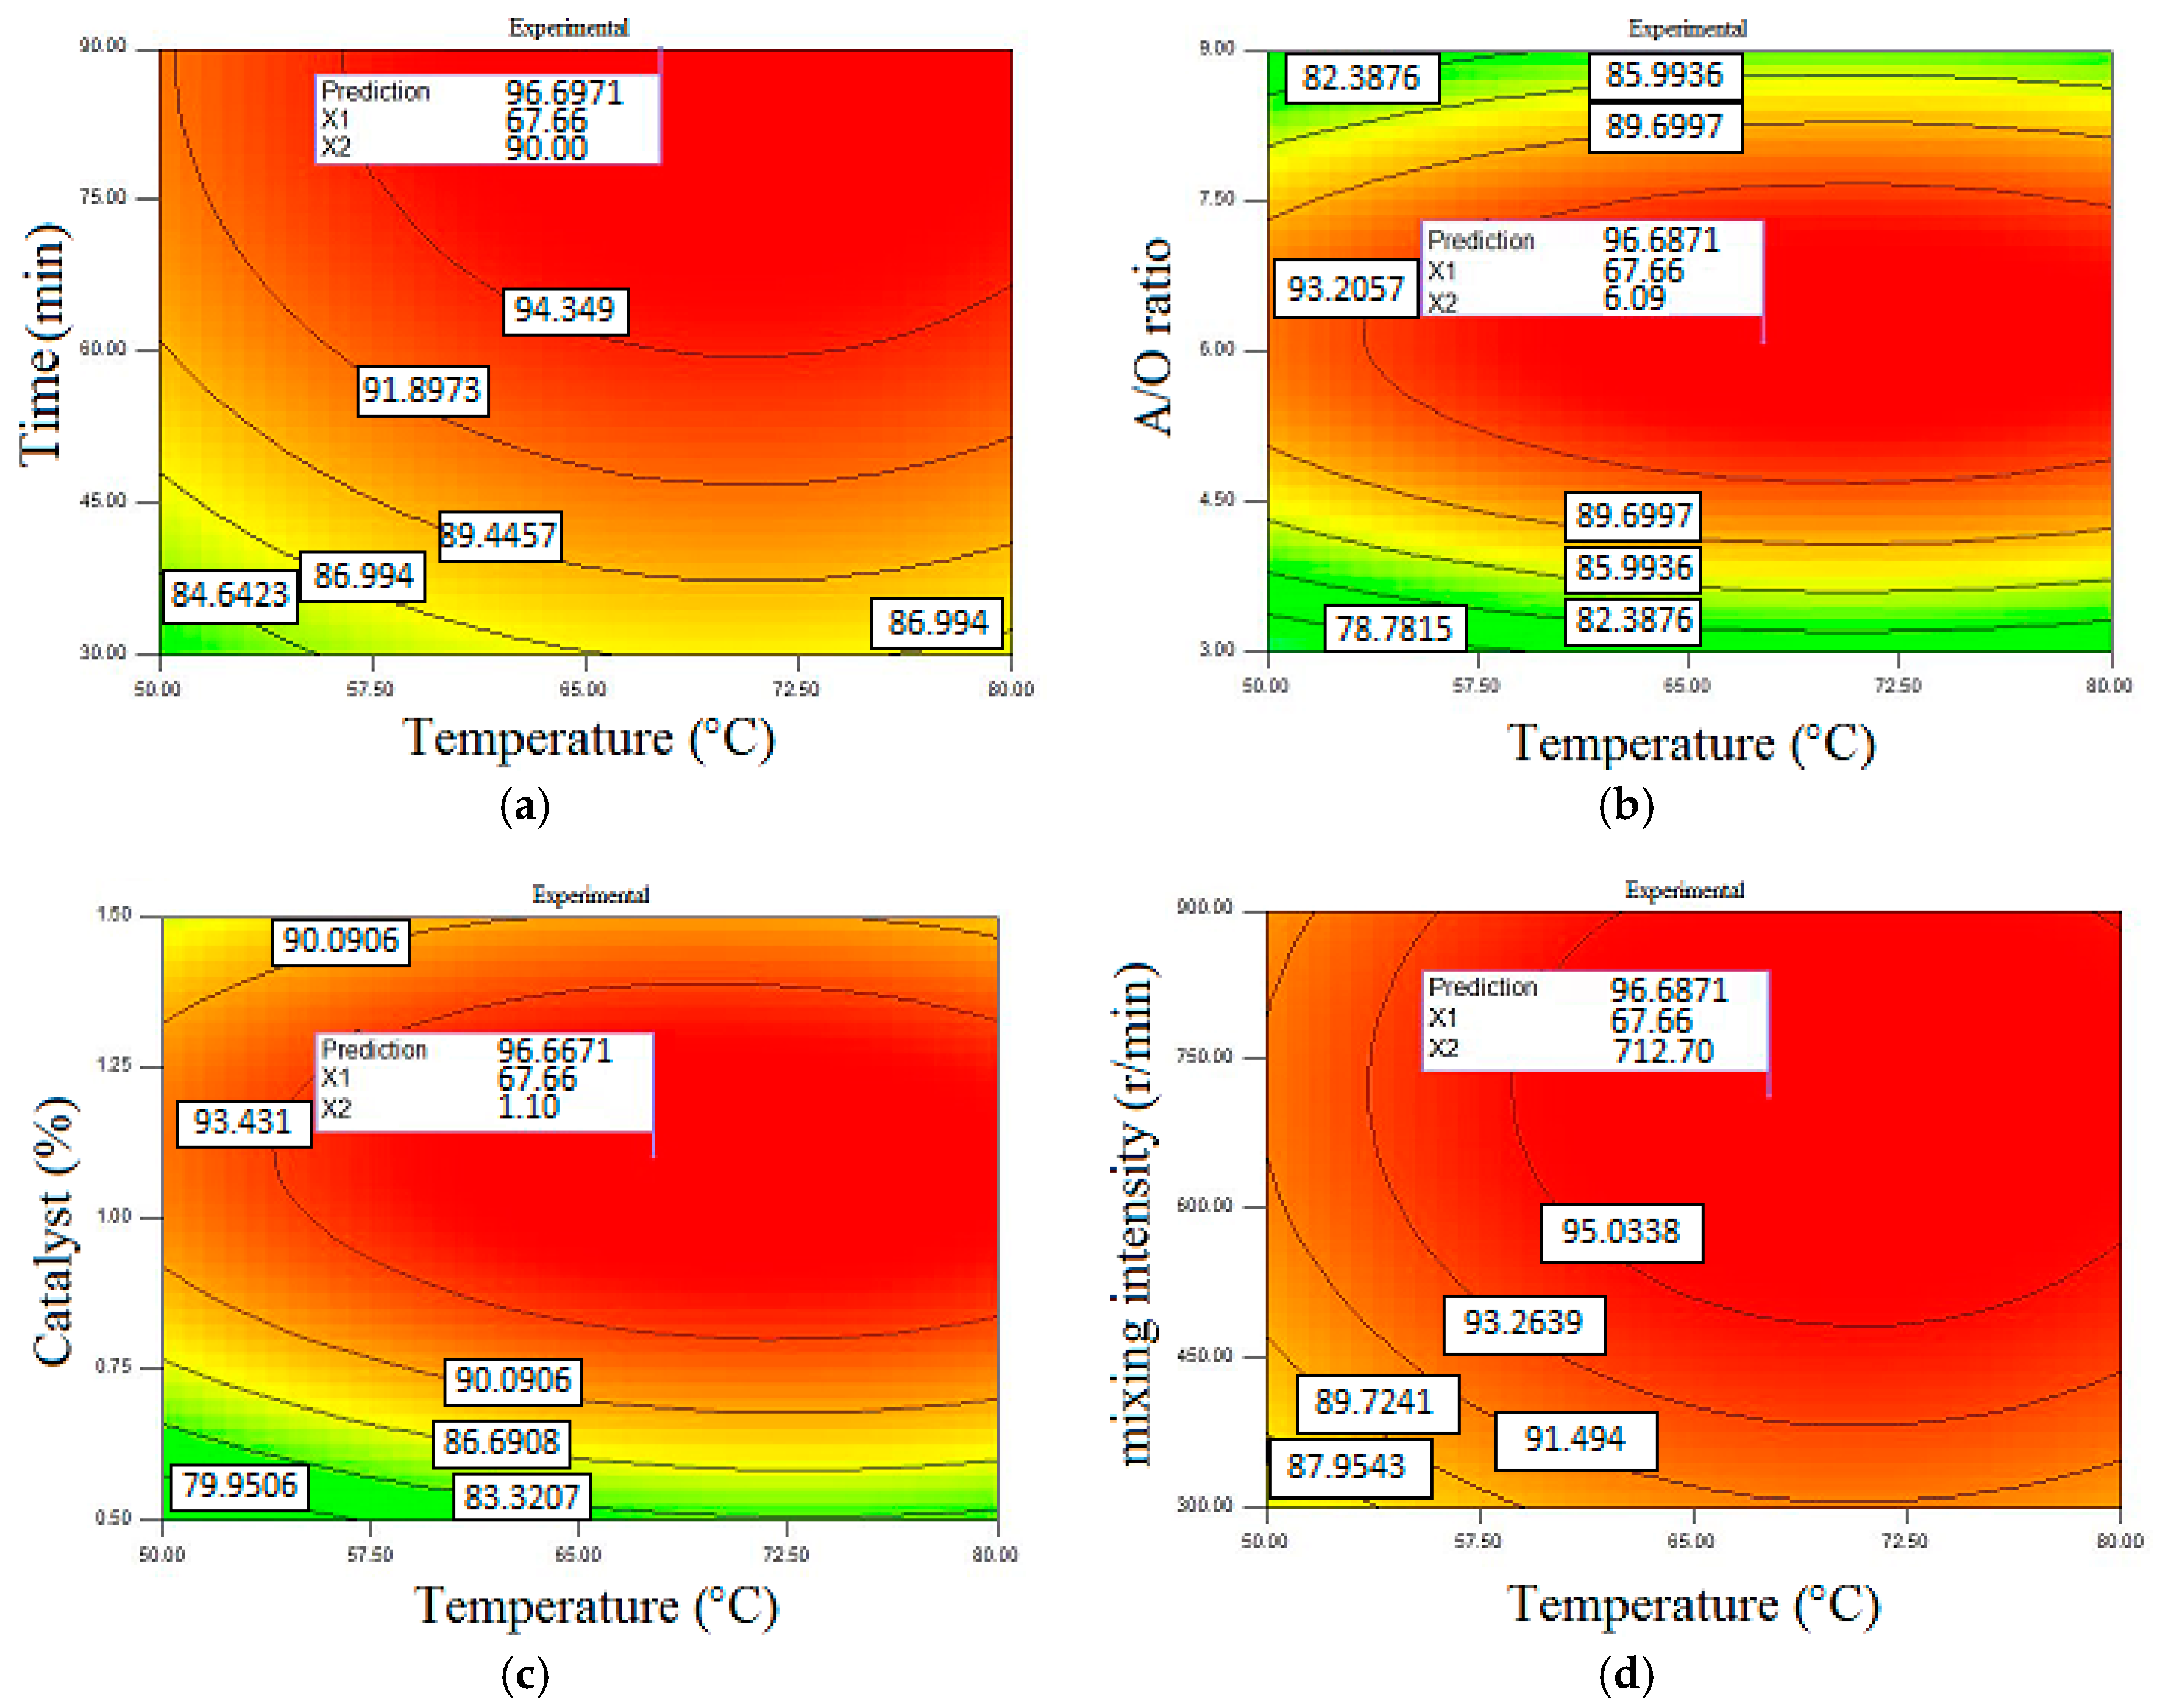
Figure 5 presents the optimization conditions of methyl ester production in the case of importing experimental data. This model provided the maximum methyl ester yield of 96.68% with a reaction time of 90 min, temperature of 67.66 °C, A/O of 6.09, catalyst of 1.1 wt. %, and mixing intensity of 712.7 rev/min.
Figure 6 presents the optimization conditions of ethyl ester production in the case of importing experimental data. This model provided the maximum ethyl ester yield of 97.77% with a reaction time of 90 min, temperature of 68.02 °C, A/O of 5.78, catalyst of 1.15 wt. %, and mixing intensity of 652.96 rev/min.
Figure 7 presents the optimization condition of methyl ester production in the case of importing the generated data of the ELM method. This model provided the maximum methyl ester yield of 96.86% with a reaction time of 89.9 min, temperature of 67.62 °C, A/O of 6.09, catalyst of 1.1 wt. %, and mixing intensity of 709.42 rev/min.
Figure 8 presents the optimization condition of ethyl ester production in the case of importing the generated data of the ELM method. This model provided the maximum ethyl ester yield of 98.46% with a reaction time of 90 min, temperature of 68.48 °C, A/O of 5.77, catalyst of 1.15 wt. %, and mixing intensity of 650.07 rev/min.
Figure 9 presents the optimization condition of methyl ester production in the case of importing the generated data of the SVM method. This model provided the maximum methyl ester yield of 94.406% with a reaction time of 90 min, temperature of 67.54 °C, A/O of 6.08, catalyst of 1.1 wt. %, and mixing intensity of 717.98 rev/min.
Figure 10 presents the optimization condition of ethyl ester production in the case of importing the generated data of the SVM method. This model provided the maximum ethyl ester yield of 95.75% with reaction time of 90 min, temperature of 69.42 °C, A/O of 5.58, catalyst of 1.2 wt. %, and mixing intensity of 652.46 rev/min.
The total results are collected in Table 8 with separated inputs and outputs. Based on Table 8, using the RSM and RSM-ELM provided a high production yield of methyl and ethyl esters compared to experimental condition, while in case of production of methyl ester, RSM-SVM provided the lowest methyl ester production yield. The maximum methyl ester production was related to the use of the RSM-ELM method with a yield of 96.86%, and maximum ethyl ester production yield was also related to the RSM-ELM method with a yield of 98.46%. Using the RSM-ELM method reduced the reaction temperature to 67.62 °C and 68.48 °C for methyl and ethyl esters, respectively, which reduced the required thermal energy for production, but increased other parameters including A/O, catalyst, and mixing intensity.

9. Conclusions

The present study employed novel hybrid ELM-RSM and SVR-RSM techniques to obtain a maximum yield of methyl and ethyl esters through a trans-esterification process from WCO based on ASTM standards and also to explain the importance of hybrid approaches from the viewpoint of accuracy and functionality. Given that the biodiesel production process is a time-consuming and costly process, any trial and error in the production process will be detrimental to the manufacturer. Using the policy in this study can reduce additional errors and in fact increase production efficiency. This study can also encourage interested scholars to study further in the field of using hybrid methods for the optimization of processes.
Input variables were temperature (°C), time (min), A/O, catalyst (wt. %), and mixing intensity (rev/min), and output variables were the production yield (%) of ethyl or methyl esters. Based on the results, the ability of both models (ELM and SVR) in estimating ethyl ester was a little more than that for the prediction of methyl ester, where this ability in the case of using the SVM methodology was more sensible. Using the hybrid method improved and increased the optimization of the system efficiency. Based on the results of the optimizing stage, the RSM-ELM technique could increase the methyl and ethyl esters production from 93.5% (in case of using experimental data) to 96.86% and from 95.5% (in case of using experimental data) to 98.46%, respectively.
In general, using the ELM method provided a high accuracy for estimation of the production yield and employing the RSM-ELM method increased the production yield, and the increase of the ethyl ester production was more sensible compared to that of the methyl ester production. Due to the time-consuming nature of the optimization process in using different methods, this study could provide a new approach for the optimum production of the ethyl or methyl esters for researchers. Therefore, by using the results of this study, there is no need for trial and error in modeling and optimizing the production process in different ways.

Author Contributions

S.F.A. and B.N. conceived, designed and performed the experiments and analyzed data; S.F.A., M.A., A.M. and S.S. developed the soft-computing methodology and wrote the paper; A.M. and T.R. contributed the proofreading, analysis tools and additional information.

Conflicts of Interest

The authors declare no conflict of interest.

Abbreviations

A/OAlcohol to oil molar ratio
ELMExtreme learning machine
RSMresponse surface methodology
BPYBiodiesel production yield
SVMSupport vector machine
ASTMAmerican Society for Testing and Materials
ANFISAdaptive neuro-fuzzy inference system
WTWavelet transform
DEAData envelopment analysis
LSLeast squares
DEData envelopment
GPGenetic programming
MLPMulti-layered perceptron
RBFRadial basis function
ANNsArtificial neural networks
RMSERoot mean square error
rCorrelation coefficient
MAEMean absolute error
dfDegree of freedom
GAGenetic algorithm
PSOParticle swarm optimization
WCOWaste cooking oil

References

  1. Faizollahzadeh Ardabili, S.; Najafi, B.; Shamshirband, S.; Minaei Bidgoli, B.; Deo, R.C.; Chau, K.-W. Computational intelligence approach for modeling hydrogen production: A review. Eng. Appl. Comput. Fluid Mech. 2018, 12, 438–458. [Google Scholar] [CrossRef]
  2. Ghazanfari, J.; Najafi, B.; Faizollahzadeh Ardabili, S.; Shamshirband, S. Limiting factors for the use of palm oil biodiesel in a diesel engine in the context of the ASTM standard. Cogent Eng. 2017, 4, 1411221. [Google Scholar] [CrossRef]
  3. Mohammadshirazi, A.; Akram, A.; Rafiee, S.; Kalhor, E.B. Energy and cost analyses of biodiesel production from waste cooking oil. Renew. Sustain. Energy Rev. 2014, 33, 44–49. [Google Scholar] [CrossRef]
  4. Gong, M.; Yang, J.; Zhang, J.; Zhu, H.; Tong, T. Physical–chemical properties of aged asphalt rejuvenated by bio-oil derived from biodiesel residue. Constr. Build. Mater. 2016, 105, 35–45. [Google Scholar] [CrossRef]
  5. Najafi, B.; Faizollahzadeh Ardabili, S.; Mosavi, A.; Shamshirband, S.; Rabczuk, T. An Intelligent Artificial Neural Network-Response Surface Methodology Method for Accessing the Optimum Biodiesel and Diesel Fuel Blending Conditions in a Diesel Engine from the Viewpoint of Exergy and Energy Analysis. Energies 2018, 11, 860. [Google Scholar] [CrossRef]
  6. Tomic, M.; Savin, L.; Micic, R.; Simikic, M.; Furman, T. Possibility of using biodiesel from sunflower oil as an additive for the improvement of lubrication properties of low-sulfur diesel fuel. Energy 2014, 65, 101–108. [Google Scholar] [CrossRef]
  7. Lanjekar, R.; Deshmukh, D. A review of the effect of the composition of biodiesel on NOx emission, oxidative stability and cold flow properties. Renew. Sustain. Energy Rev. 2016, 54, 1401–1411. [Google Scholar] [CrossRef]
  8. Verma, P.; Sharma, M.; Dwivedi, G. Operational and Environmental Impact of Biodiesel on Engine Performance. Int. J. Renew. Energy Res. 2015, 5, 961–970. [Google Scholar]
  9. Verma, P.; Sharma, M.; Dwivedi, G. Evaluation and enhancement of cold flow properties of palm oil and its biodiesel. Energy Rep. 2016, 2, 8–13. [Google Scholar] [CrossRef]
  10. Zhang, H.; Li, H.; Pan, H.; Liu, X.; Yang, K.; Huang, S.; Yang, S. Efficient production of biodiesel with promising fuel properties from Koelreuteria integrifoliola oil using a magnetically recyclable acidic ionic liquid. Energy Convers. Manag. 2017, 138, 45–53. [Google Scholar] [CrossRef]
  11. Verma, P.; Sharma, M.; Dwivedi, G. Prospects of bio-based alcohols for Karanja biodiesel production: An optimisation study by Response Surface Methodology. Fuel 2016, 183, 185–194. [Google Scholar] [CrossRef]
  12. Xue, B.-J.; Luo, J.; Zhang, F.; Fang, Z. Biodiesel production from soybean and Jatropha oils by magnetic CaFe2O4–Ca2Fe2O5-based catalyst. Energy 2014, 68, 584–591. [Google Scholar] [CrossRef]
  13. Ma, Y.; Wang, Q.; Zheng, L.; Gao, Z.; Yang, Y.; Wang, N.; Ma, H. Biodiesel production using unrefined methanol as transesterification agent and the research of individual effect of impurities. Energy 2015, 82, 361–369. [Google Scholar] [CrossRef]
  14. Román-Figueroa, C.; Olivares-Carrillo, P.; Paneque, M.; Palacios-Nereo, F.J.; Quesada-Medina, J. High-yield production of biodiesel by non-catalytic supercritical methanol transesterification of crude castor oil (Ricinus communis). Energy 2016, 107, 165–171. [Google Scholar] [CrossRef]
  15. Raia, R.Z.; da Silva, L.S.; Marcucci, S.M.P.; Arroyo, P.A. Biodiesel production from Jatropha curcas L. oil by simultaneous esterification and transesterification using sulphated zirconia. Catal. Today 2017, 289, 105–114. [Google Scholar] [CrossRef]
  16. Ali, C.H.; Qureshi, A.S.; Mbadinga, S.M.; Liu, J.-F.; Yang, S.-Z.; Mu, B.-Z. Biodiesel production from waste cooking oil using onsite produced purified lipase from Pseudomonas aeruginosa FW_SH-1: Central composite design approach. Renew. Energy 2017, 109, 93–100. [Google Scholar] [CrossRef]
  17. Carvalho, A.K.F.; da Conceição, L.R.V.; Silva, J.P.V.; Perez, V.H.; de Castro, H.F. Biodiesel production from Mucor circinelloides using ethanol and heteropolyacid in one and two-step transesterification. Fuel 2017, 202, 503–511. [Google Scholar] [CrossRef]
  18. Muthukumaran, C.; Praniesh, R.; Navamani, P.; Swathi, R.; Sharmila, G.; Kumar, N.M. Process optimization and kinetic modeling of biodiesel production using non-edible Madhuca indica oil. Fuel 2017, 195, 217–225. [Google Scholar] [CrossRef]
  19. Faizollahzadeh Ardabili, S.; Mahmoudi, A.; Gundoshmian, T.M.; Roshanianfard, A. Modeling and comparison of fuzzy and on/off controller in a mushroom growing hall. Measurement 2016, 90, 127–134. [Google Scholar] [CrossRef]
  20. Faizollahzadeh Ardabili, S.; Najafi, B.; Ghaebi, H.; Shamshirband, S.; Mostafaeipour, A. A novel enhanced exergy method in analysing HVAC system using soft computing approaches: A case study on mushroom growing hall. J. Build. Eng. 2017, 13, 309–318. [Google Scholar] [CrossRef]
  21. Faizollahzadeh Ardabili, S.; Mahmoudi, A.; Mesri Gundoshmian, T. Modeling and simulation controlling system of HVAC using fuzzy and predictive (radial basis function, RBF) controllers. J. Build. Eng. 2016, 6, 301–308. [Google Scholar] [CrossRef]
  22. Sharon, H.; Jayaprakash, R.; Sundaresan, A.; Karuppasamy, K. Biodiesel production and prediction of engine performance using SIMULINK model of trained neural network. Fuel 2012, 99, 197–203. [Google Scholar] [CrossRef]
  23. Fahmi, I.; Cremaschi, S. Process synthesis of biodiesel production plant using artificial neural networks as the surrogate models. Comput. Chem. Eng. 2012, 46, 105–123. [Google Scholar] [CrossRef]
  24. Moradi, G.; Dehghani, S.; Khosravian, F.; Arjmandzadeh, A. The optimized operational conditions for biodiesel production from soybean oil and application of artificial neural networks for estimation of the biodiesel yield. Renew. Energy 2013, 50, 915–920. [Google Scholar] [CrossRef]
  25. Chakraborty, R.; Sahu, H. Intensification of biodiesel production from waste goat tallow using infrared radiation: Process evaluation through response surface methodology and artificial neural network. Appl. Energy 2014, 114, 827–836. [Google Scholar] [CrossRef]
  26. Farobie, O.; Hasanah, N.; Matsumura, Y. Artificial neural network modeling to predict biodiesel production in supercritical methanol and ethanol using spiral reactor. Procedia Environ. Sci. 2015, 28, 214–223. [Google Scholar] [CrossRef]
  27. Maran, J.P.; Priya, B. Modeling of ultrasound assisted intensification of biodiesel production from neem (Azadirachta indica) oil using response surface methodology and artificial neural network. Fuel 2015, 143, 262–267. [Google Scholar] [CrossRef]
  28. Maran, J.P.; Priya, B. Comparison of response surface methodology and artificial neural network approach towards efficient ultrasound-assisted biodiesel production from muskmelon oil. Ultrason. Sonochem. 2015, 23, 192–200. [Google Scholar] [CrossRef] [PubMed]
  29. Betiku, E.; Okunsolawo, S.S.; Ajala, S.O.; Odedele, O.S. Performance evaluation of artificial neural network coupled with generic algorithm and response surface methodology in modeling and optimization of biodiesel production process parameters from shea tree (Vitellaria paradoxa) nut butter. Renew. Energy 2015, 76, 408–417. [Google Scholar] [CrossRef]
  30. Sarve, A.; Sonawane, S.S.; Varma, M.N. Ultrasound assisted biodiesel production from sesame (Sesamum indicum L.) oil using barium hydroxide as a heterogeneous catalyst: Comparative assessment of prediction abilities between response surface methodology (RSM) and artificial neural network (ANN). Ultrason. Sonochem. 2015, 26, 218–228. [Google Scholar] [CrossRef] [PubMed]
  31. Aghbashlo, M.; Shamshirband, S.; Tabatabaei, M.; Yee, L.; Larimi, Y.N. The use of ELM-WT (extreme learning machine with wavelet transform algorithm) to predict exergetic performance of a DI diesel engine running on diesel/biodiesel blends containing polymer waste. Energy 2016, 94, 443–456. [Google Scholar] [CrossRef]
  32. Srivastava, G.; Paul, A.K.; Goud, V.V. Optimization of non-catalytic transesterification of microalgae oil to biodiesel under supercritical methanol condition. Energy Convers. Manag. 2018, 156, 269–278. [Google Scholar] [CrossRef]
  33. Saeidi, S.; Jouybanpour, P.; Mirvakilli, A.; Iranshahi, D.; Klemeš, J.J. A comparative study between Modified Data Envelopment Analysis and Response Surface Methodology for optimisation of heterogeneous biodiesel production from waste cooking palm oil. J. Clean. Prod. 2016, 136, 23–30. [Google Scholar] [CrossRef]
  34. Sajjadi, B.; Asaithambi, P.; Raman, A.A.A.; Ibrahim, S. Hybrid nero-fuzzy methods for estimation of ultrasound and mechanically stirring Influences on biodiesel synthesis through transesterification. Measurement 2017, 103, 62–76. [Google Scholar] [CrossRef]
  35. Najafi, B.; Faizollahzadeh Ardabili, S.; Shamshirband, S.; Chau, K.-W.; Rabczuk, T. Application of ANNs, ANFIS and RSM to estimating and optimizing the parameters that affect the yield and cost of biodiesel production. Eng. Appl. Comput. Fluid Mech. 2018, 12, 611–624. [Google Scholar] [CrossRef]
  36. Khalife, E.; Kazeroni, H.; Mirsalim, M.; Shojaei, T.R.; Mohammadi, P.; Salleh, A.M.; Najafi, B.; Tabatabaei, M. Experimental investigation of low-level water in waste-oil produced biodiesel-diesel fuel blend. Energy 2017, 121, 331–340. [Google Scholar] [CrossRef]
  37. Najafi, B. Artificial neural networks used for the prediction of the diesel engine performance and pollution of waste cooking oil biodiesel. Modares Mech. Eng. 2011, 11, 11–20. [Google Scholar]
  38. Mostafaei, M.; Javadikia, H.; Naderloo, L. Modeling the effects of ultrasound power and reactor dimension on the biodiesel production yield: Comparison of prediction abilities between response surface methodology (RSM) and adaptive neuro-fuzzy inference system (ANFIS). Energy 2016, 115, 626–636. [Google Scholar] [CrossRef]
  39. Pinzi, S.; Lopez-Gimenez, F.; Ruiz, J.; Dorado, M. Response surface modeling to predict biodiesel yield in a multi-feedstock biodiesel production plant. Bioresour. Technol. 2010, 101, 9587–9593. [Google Scholar] [CrossRef] [PubMed]
  40. Heaven, S.; Salter, A.M.; Banks, C.J. Integration of on-farm biodiesel production with anaerobic digestion to maximise energy yield and greenhouse gas savings from process and farm residues. Bioresour. Technol. 2011, 102, 7784–7793. [Google Scholar] [CrossRef] [PubMed] [Green Version]
  41. Zheng, L.; Li, Q.; Zhang, J.; Yu, Z. Double the biodiesel yield: Rearing black soldier fly larvae, Hermetia illucens, on solid residual fraction of restaurant waste after grease extraction for biodiesel production. Renew. Energy 2012, 41, 75–79. [Google Scholar] [CrossRef]
  42. Huang, G.-B.; Zhu, Q.-Y.; Siew, C.-K. Extreme learning machine: A new learning scheme of feedforward neural networks. In Proceedings of the 2004 IEEE International Joint Conference on Neural Networks, Budapest, Hungary, 25–29 July 2004; pp. 985–990. [Google Scholar]
  43. Huang, G.-B.; Zhu, Q.-Y.; Siew, C.-K. Extreme learning machine: Theory and applications. Neurocomputing 2006, 70, 489–501. [Google Scholar] [CrossRef] [Green Version]
  44. Hossain, M.; Mekhilef, S.; Danesh, M.; Olatomiwa, L.; Shamshirband, S. Application of extreme learning machine for short term output power forecasting of three grid-connected PV systems. J. Clean. Prod. 2017, 167, 395–405. [Google Scholar] [CrossRef]
  45. Sajjadi, S.; Shamshirband, S.; Alizamir, M.; Yee, L.; Mansor, Z.; Manaf, A.A.; Altameem, T.A.; Mostafaeipour, A. Extreme learning machine for prediction of heat load in district heating systems. Energy Build. 2016, 122, 222–227. [Google Scholar] [CrossRef]
  46. Vapnik, V. Statistical Learning Theory; Wiley-Interscience: New York, NY, USA, 1998. [Google Scholar]
  47. Ghorbani, M.A.; Shamshirband, S.; Haghi, D.Z.; Azani, A.; Bonakdari, H.; Ebtehaj, I. Application of firefly algorithm-based support vector machines for prediction of field capacity and permanent wilting point. Soil Tillage Res. 2017, 172, 32–38. [Google Scholar] [CrossRef]
  48. Box, G.E.; Wilson, K.B. On the Experimental Attainment of Optimum Conditions. In Breakthroughs in Statistics; Springer: New York, NY, USA, 1992; pp. 270–310. [Google Scholar]
Figure 1. The stages of biodiesel production.
Energies 11 02889 g001
Figure 2. The structure of extreme learning machine (ELM) model.
Energies 11 02889 g002
Figure 3. The scatter plot of the testing stage: (a) ELM-methyl ester; (b) ELM-ethyl ester; (c) SVM-methyl ester; and (d) SVM-ethyl ester.
Energies 11 02889 g003
Figure 4. Schematic diagram of the developed hybrid method.
Energies 11 02889 g004
Figure 5. The optimization condition of methyl ester production in the case of importing experimental data. (a) Response surface based on time (min) and temperature (°C); (b) response surface based on A/O and temperature (°C); (c) response surface based on catalyst (wt. %) ratio and temperature (°C); and (d) response surface based on mixing intensity (r/min) and temperature (°C).
Energies 11 02889 g005
Figure 6. The optimization condition of ethyl ester production in the case of importing experimental data. (a) Response surface based on time (min) and temperature (°C); (b) response surface based on A/O and temperature (°C); (c) response surface based on catalyst (wt. %) ratio and temperature (°C); and (d) response surface based on mixing intensity (r/min) and temperature (°C).
Energies 11 02889 g006
Figure 7. The optimization condition of methyl ester production in the case of using the RSM-ELM method. (a) Response surface based on time (min) and temperature (°C); (b) response surface based on A/O and temperature (°C); (c) response surface based on catalyst (wt. %) ratio and temperature (°C); and (d) response surface based on mixing intensity (r/min) and temperature (°C).
Energies 11 02889 g007aEnergies 11 02889 g007b
Figure 8. The optimization condition of ethyl ester production in the case of using the RSM-ELM method. (a) Response surface based on time (min) and temperature (°C); (b) response surface based on A/O and temperature (°C); (c) response surface based on catalyst (wt. %) ratio and temperature (°C); and (d) response surface based on mixing intensity (r/min) and temperature (°C).
Energies 11 02889 g008
Figure 9. The optimization condition of methyl ester production in the case of using the RSM-SVM method. (a) Response surface based on time (min) and temperature (°C); (b) response surface based on A/O and temperature (°C); (c) response surface based on catalyst (wt. %) ratio and temperature (°C); and (d) response surface based on mixing intensity (r/min) and temperature (°C).
Energies 11 02889 g009
Figure 10. The optimization condition of ethyl ester production in the case of using the RSM-SVM method. (a) Response surface based on time (min) and temperature (°C); (b) response surface based on A/O and temperature (°C); (c) response surface based on catalyst (wt. %) ratio and temperature (°C); and (d) response surface based on mixing intensity (r/min) and temperature (°C).
Energies 11 02889 g010
Table 1. Data of experimental test and biodiesel production yield (BPY) of biodiesel. A/O: alcohol to oil molar ratio.
T (°C)Time (min)A/OCatalyst (wt. %)Mixing Intensity (rpm)BPY (%)
EthanolMethanol
5090613008187
6090613008390
7090613008591
8090613008488
5090616008992
6090616009094
70906160093.595.5
8090616009193
5090619008792
6090619008994
7090619009295
8090619009093
7030316005560
7060316006371
7030616008688
7060616009293
7030916008081
7060916008587
509060.56007874
609060.56008379
709060.56008684
809060.56008584
509061.56009084
609061.56009387
709061.56009491
809061.56009191
7090316008981
70909160093.585
Table 2. The parameters of the user-defined function.
Number of LayersNeuronsLearning RuleActivation Function
InputHiddenOutput
35152ELMSigmoid f.
Table 3. Tests of between-subjects effects (dependent variable: BPYet). df: degree of freedom. R2 = 0.933 (adjusted R2 = 0.880).
SourceSum of SquaresdfMean SquareFSig.
Temperature84.560328.18711.7320.000
time112.002256.00123.3100.000
A/O37.835218.9187.8740.005
Catalyst209.6592104.83043.6340.000
Mixing intensity155.706277.85332.4060.000
Error33.634142.402
Total200,437.50026
Table 4. Tests of between-subjects effects (dependent variable: BPYmet). R2 = 0.929 (adjusted R2 = 0.874).
SourceSum of SquaresdfMean SquareFSig.
Temperature74.507324.8366.5680.005
time56.090228.0457.4170.006
A/O229.5902114.79530.3590.000
Catalyst355.3092177.65446.9830.000
Mixing intensity50.913225.4576.7320.009
Error52.938143.781
Total203,062.25026
Table 5. The results of the training stage for both ELM and SVM methodologies.
ELMSVMMLP [35]ANFIS [35]RBF [35]
rRMSErRMSErRMSErRMSErRMSE
Methyl ester0.98151.780.96562.4070.913.090.952.20.952.2
Ethyl ester0.98631.70.97692.1480.923.040.933.210.933.21
Table 6. The results of the testing stage for both ELM and SVM methodologies.
ELMSVMMLP [35]ANFIS [35]RBF [35]
rCTTCr *RMSErCTTCrRMSErRMSErRMSErRMSE
Methyl ester0.93−5.2%1.7190.915−5.2%2.8050.93.350.942.420.952.34
Ethyl ester0.958−2.9%1.4830.8945−8.4%2.1050.923.530.923.370.923.39
* CTTC: Comparison of training and testing capability.
Table 7. The results of the testing stage for both RSM-ELM and RSM-SVM methodologies.
RSM-ELMRSM-SVM
rStd. DevrStd. Dev
Methyl ester0.97272.740.94533.34
Ethyl ester0.9643.520.9623.35
Table 8. General results of optimizing.
ExperimentalRSMELM-RSMSVM-RSM
MethylEthylMethylEthylMethylEthylMethylEthyl
Production yield (%)95.593.596.6897.7796.8698.4694.40695.75
Time (min)9090909089.9909090
Temperature (°C)707067.6668.0267.6268.4867.5469.42
A/O666.095.786.095.776.085.58
Catalyst (wt. %)111.11.151.11.151.11.2
Mixing intensity (rev/min)600600712.7652.96709.42650.07717.98652.46

