Article

Mathematical Modeling of Non-Premixed Laminar Flow Flames Fed with Biofuel in Counter-Flow Arrangement Considering Porosity and Thermophoresis Effects: An Asymptotic Approach

1
School of Engineering, Iran University of Science and Technology, Narmak, Tehran 16846-13114, Iran
2
School of Engineering, RMIT University, Melbourne, VIC 3083, Australia
*
Author to whom correspondence should be addressed.
Energies 2018, 11(11), 2945; https://doi.org/10.3390/en11112945
Submission received: 2 October 2018 / Revised: 24 October 2018 / Accepted: 24 October 2018 / Published: 29 October 2018
(This article belongs to the Special Issue Biofuel and Bioenergy Technology)

Abstract

:
Due to the safe operation and stability of non-premixed combustion, it can widely be utilized in different engineering power and medical systems. The current paper suggests a mathematical asymptotic technique to describe non-premixed laminar flow flames formed in organic particles in a counter-flow configuration. In this investigation, fuel and oxidizer enter the combustor from opposite sides separately and multiple zones including preheating, vaporization, flame and post-flame zones were considered. Micro-sized lycopodium particles and air were respectively applied as a biofuel and an oxidizer. Dimensionalized and non-dimensionalized mass and energy conservation equations were determined for the zones and solved by Mathematica and Matlab software by applying proper boundary and jump conditions. Since lycopodium particles have numerous spores, the porosity of the particles was involved in the equations. Further, significant parameters such as lycopodium vaporization rate and thermophoretic force corresponding to the lycopodium particles in the solid phase were examined. The temperature distribution, flame sheet position, fuel and oxidizer mass fractions, equivalence ratio and flow strain rate were evaluated for the counter-flow non-premixed flames. Ultimately, the thermophoretic force caused by the temperature gradient at different positions was computed for several values of porosity, fuel and oxidizer Lewis numbers.

1. Introduction

Considering the progressive depletion of fossil fuels, the soaring costs of these fuels and the greenhouse gas (GHG) emissions associated with them, significant attention has been turned toward using alternatives to these fuels [1,2]. In recent years, bioenergy has been introduced as a reasonable form of renewable energy with a high degree of sustainability for use in various industrial and medical applications [3]. Bioenergy can readily be achieved through the combustion of biomass fuels [4]. On the basis of structure, combustion is categorized into premixed, partially premixed and non-premixed flames [5,6], among which non-premixed combustion is widely utilized in engineering combustion power systems due to its safe operation and stability [7]. So far, different experimental and analytical investigations have been performed by various researchers to specify the propagation of non-premixed flames through biofuels.
Joshi and Berlad [8] experimentally studied the behavior of premixed flames through a lycopodium-air mixture and reported the flame temperature distribution in the vertical position. In another investigation, Berlad and Joshi [9] used both analytical and experimental approaches to model the extinction and temperature distribution of premixed flames burning lycopodium dust clouds. Berlad and Tangirala [10] studied the effect of thermal radiation on the behavior and structure of lycopodium-fueled flames considering a small quantity of gravity force. The behavior of a triple-zone premixed flame containing uniformly-distributed lycopodium particles was developed by Seshadri, applying an asymptotic method [11]. Han et al. [12] experimentally perused flame propagation through a lycopodium–air mixture within a vertical duct and evaluated the weight loss of the lycopodium particles and flame velocity. In further experimental work, Han et al. [13] investigated the propagation of lycopodium dust particles in a premixed combustible system using particle image velocimetry (PIV). Xi et al. [14] used an experimental method to study the pulsation characteristics of a swirl non-premixed flame. Proust [15] experimentally investigated flame propagation through lycopodium-air and sulphur flour-air mixtures. Skjold et al. [16] examined turbulent flame propagation through lycopodium dust clouds at a constant pressure and made a comparison between the structures of the produced premixed and non-premixed flames. Shamooni et al. [17] employed a finite-rate scale similarity method to predict the combustion and heat release rates in non-premixed jet flames. A two-dimensional analytical model was presented by Rahbari et al. [18] for premixed flames propagating through a lycopodium-air mixture taking into account the particle size and equivalence ratio parameters. Bidabadi and Esmaeilnejad et al. [19] suggested an analytical triple-zone model for counter-flow premixed flames propagating through a lycopodium-air mixture. Bidabadi et al. [20] proposed a non-premixed triple-zone combustion model for lycopodium dust flames in a counter flow configuration. Xi et al. [21] experimentally and numerically simulated the flame shape and size for a high-pressure turbulent non-premixed swirl combustion. The combustion behavior of non-premixed micro-jet flames through a methane-air mixture in a co-flow configuration was reported by Li et al. [22]. Bidabadi et al. [23] theoretically investigated the effect of thermal resistance on the structure of the premixed combustion of micro-organic dust particles with air. Spijker and Raupenstrauch [24] performed a numerical investigation to reveal the effect of the inner structure of lycopodium particles on the propagation of premixed flames. Chen et al. [25] experimentally described the temperature distribution of the propagation of premixed flames through a methane-air mixture considering the porosity parameter. Bidabadi et al. [26] developed a method for the theoretical investigation of multi-zone counter-flow premixed flames burning lycopodium dust clouds considering the vaporization rate. Ji et al. [27] experimentally computed the maximum pressure and the maximum rate of pressure rise of several hybrid mixtures taking into account different venting diameters and static activation pressures. Di Benedetto et al. [28] employed a theoretical/numerical method to determine the minimum ignition temperature of polyethylene dust at several dust concentrations in air. Sanchirico et al. [29] evaluated the flammability and combustion behavior of several complex hybrid mixtures, e.g., mixtures of nicotinic acid, lycopodium and methane, at different dust concentrations. In another study, Sanchirico et al. [30] experimentally demonstrated the combustion and flammability behavior of combustible dust mixtures including lycopodium, Nicotinic acid and Ascorbic acid.
As reviewed of the literature, numerous theoretical and experimental examinations have been undertaken on the behavior of premixed flames propagating through organic fuels. Until now, no comprehensive mathematical models have been available in the literature on the behavior of multi-zone counter-flow non-premixed flames. In most of the previous studies, in which limited models were introduced, the shape of lycopodium particles was considered to be spherical while these particles consist of numerous minute spores that can affect the structure of premixed and non-premixed flames [12]. In addition, the thermophoretic force, caused by a temperature gradient for transferring micro-sized fuel particles, has not yet been investigated mathematically for non-premixed flames.
The current paper aimed to theoretically describe the structure of counter-flow non-premixed flames through organic particles taking into account the effects of fuel particle porosity and thermophoresis. The biofuel particles and oxidizer were separately injected into a combustor from opposite sides. Multiple zones composed of preheating, vaporization, flame and post-flame zones, are presented. Lycopodium particles and air were injected into the system as biomass and oxidizer, respectively. The governing equations, including mass and energy conservation equations, were derived for the above-mentioned zones. The impacts of fuel particle porosity, vaporization and thermophoresis on the structure of the flames are discussed. Changes in the flame temperature and the location of the flame sheet with fuel and oxidizer Lewis numbers were examined for several porosity factors. Additionally, the influence of the equivalence ratio on the temperature distribution was evaluated. Afterwards, the mass fractions and temperature distributions of the biofuel and oxidizer at different positions were obtained. Then, variations of the flow critical strain rate with oxidizer and fuel Lewis numbers are described. Finally, the thermophoretic force caused the temperature gradient of the solid particles was computed for several different porosity factors, fuel and oxidizer Lewis numbers.

2. Theoretical Modeling

2.1. Lycopodium Characteristics

In the last couple of decades, the accidental ignition of flammable organic and inorganic dusts, as well as knowledge of combustion and flammability, has gained much attention [31]. Lycopodium particles have been introduced as a reasonable reference for volatile biomass fuels due to its excellent dispersibility and flammability [12]. Lycopodium can efficiently be used as a reference fuel for testing different biomass-fueled systems and recognizing the combustion processes in the systems prior to industrial scale-up [12,29,30]. A lycopodium particle typically contains almost 50% fat oil, 2% sucrose and 24% sporopollenin [12]. One of the main advantages of this biofuel is that almost no solid residue is produced during the combustion process [12]. In this study, as can be found in the literature, it was assumed that a gaseous fuel with a certain chemical composition, gaseous methane, is produced through the vaporization of these volatile particles [11]. In this regard, the pyrolysis process was disregarded in the current study. It should be noted that lycopodium particles are mono-disperse in size [14] and contain numerous minute spores [12], as illustrated in Figure 1. Moreover, when the lycopodium particles were injected into a combustible system via a nozzle, they did not undergo breakage due to their sponge-like behavior (i.e., the numerous minute spores are “elastic”) [31].

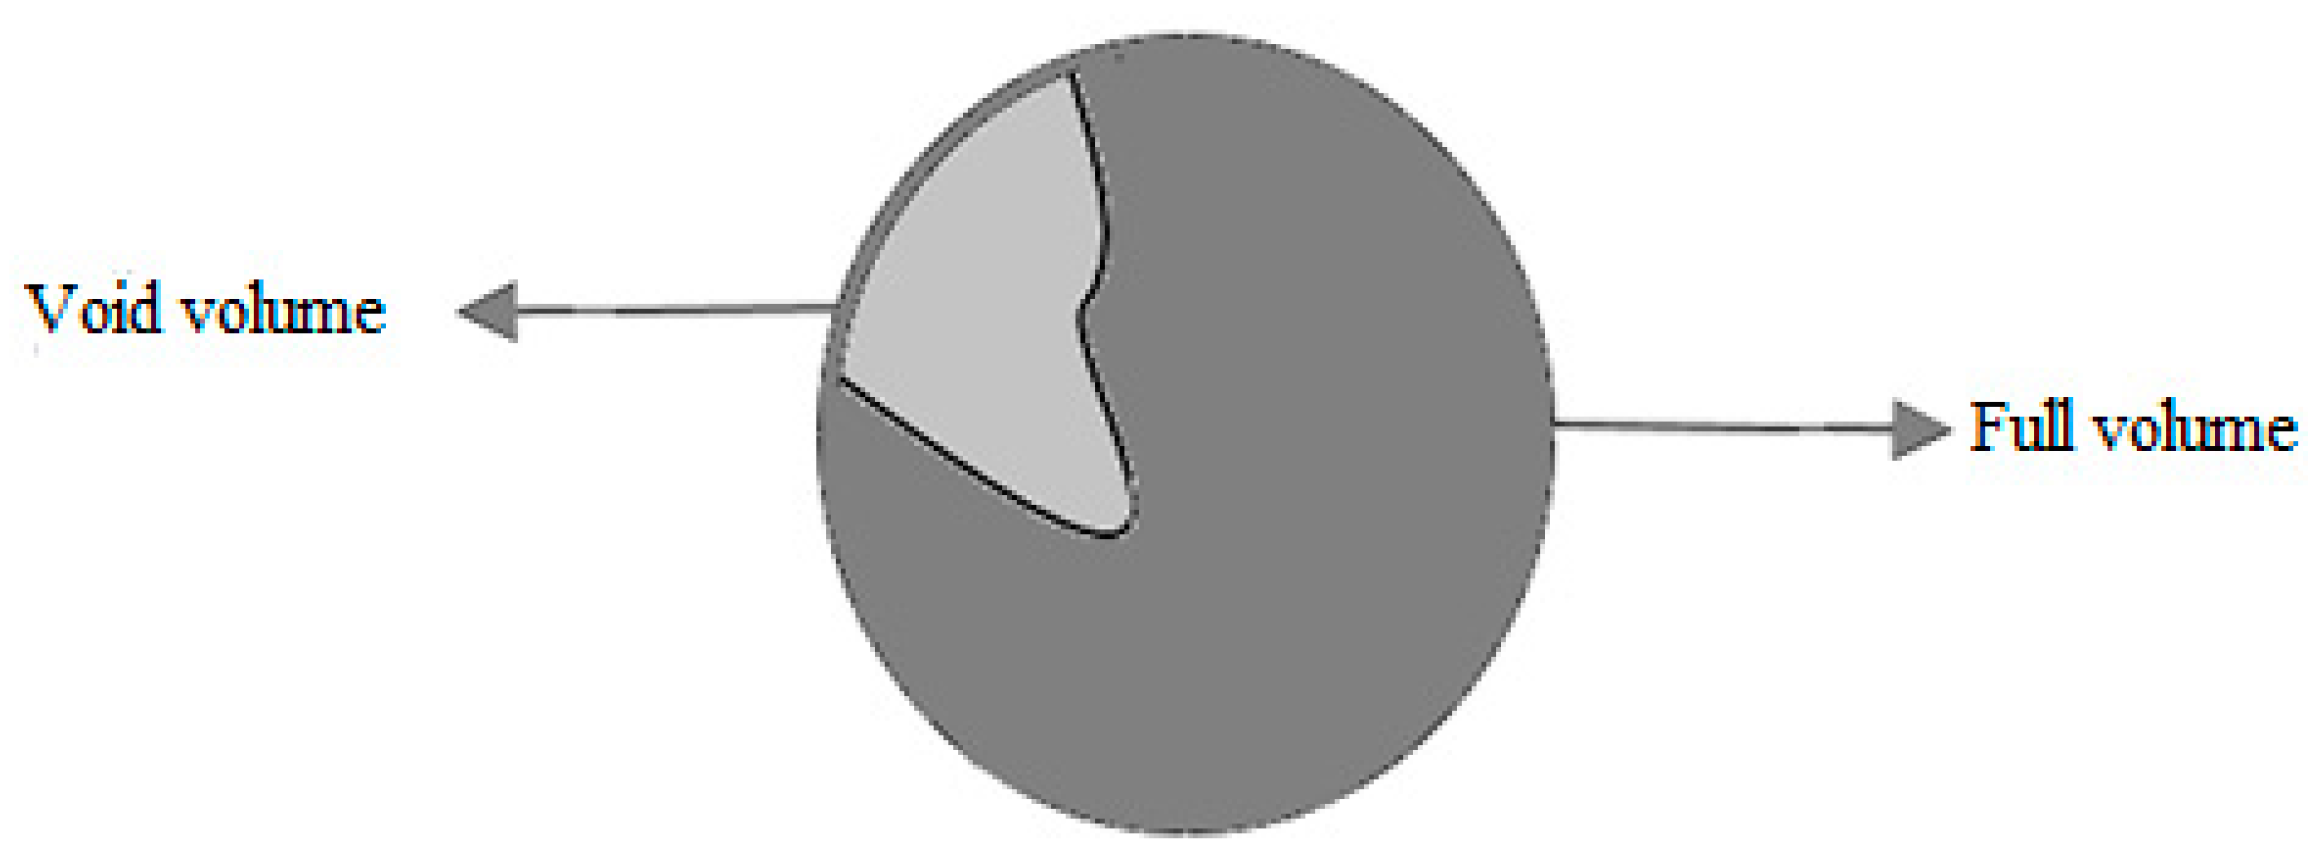
2.2. Porosity of Lycopodium Particles

As described in Figure 1, lycopodium particles are not completely spherical-shaped particles. Therefore, the porosity effect should be involved in the modeling of the flame structures fueled by these particles. Figure 2 shows the porosity of the lycopodium particles considered in this study.
The volume porosity and porosity factor [32] are defined by the following equations, respectively:
ε = V v o i d V t o t a l
f e = 1 ε
where ε , V v o i d and V t o t a l are the fraction of the empty volume, void volume and total volume, respectively.

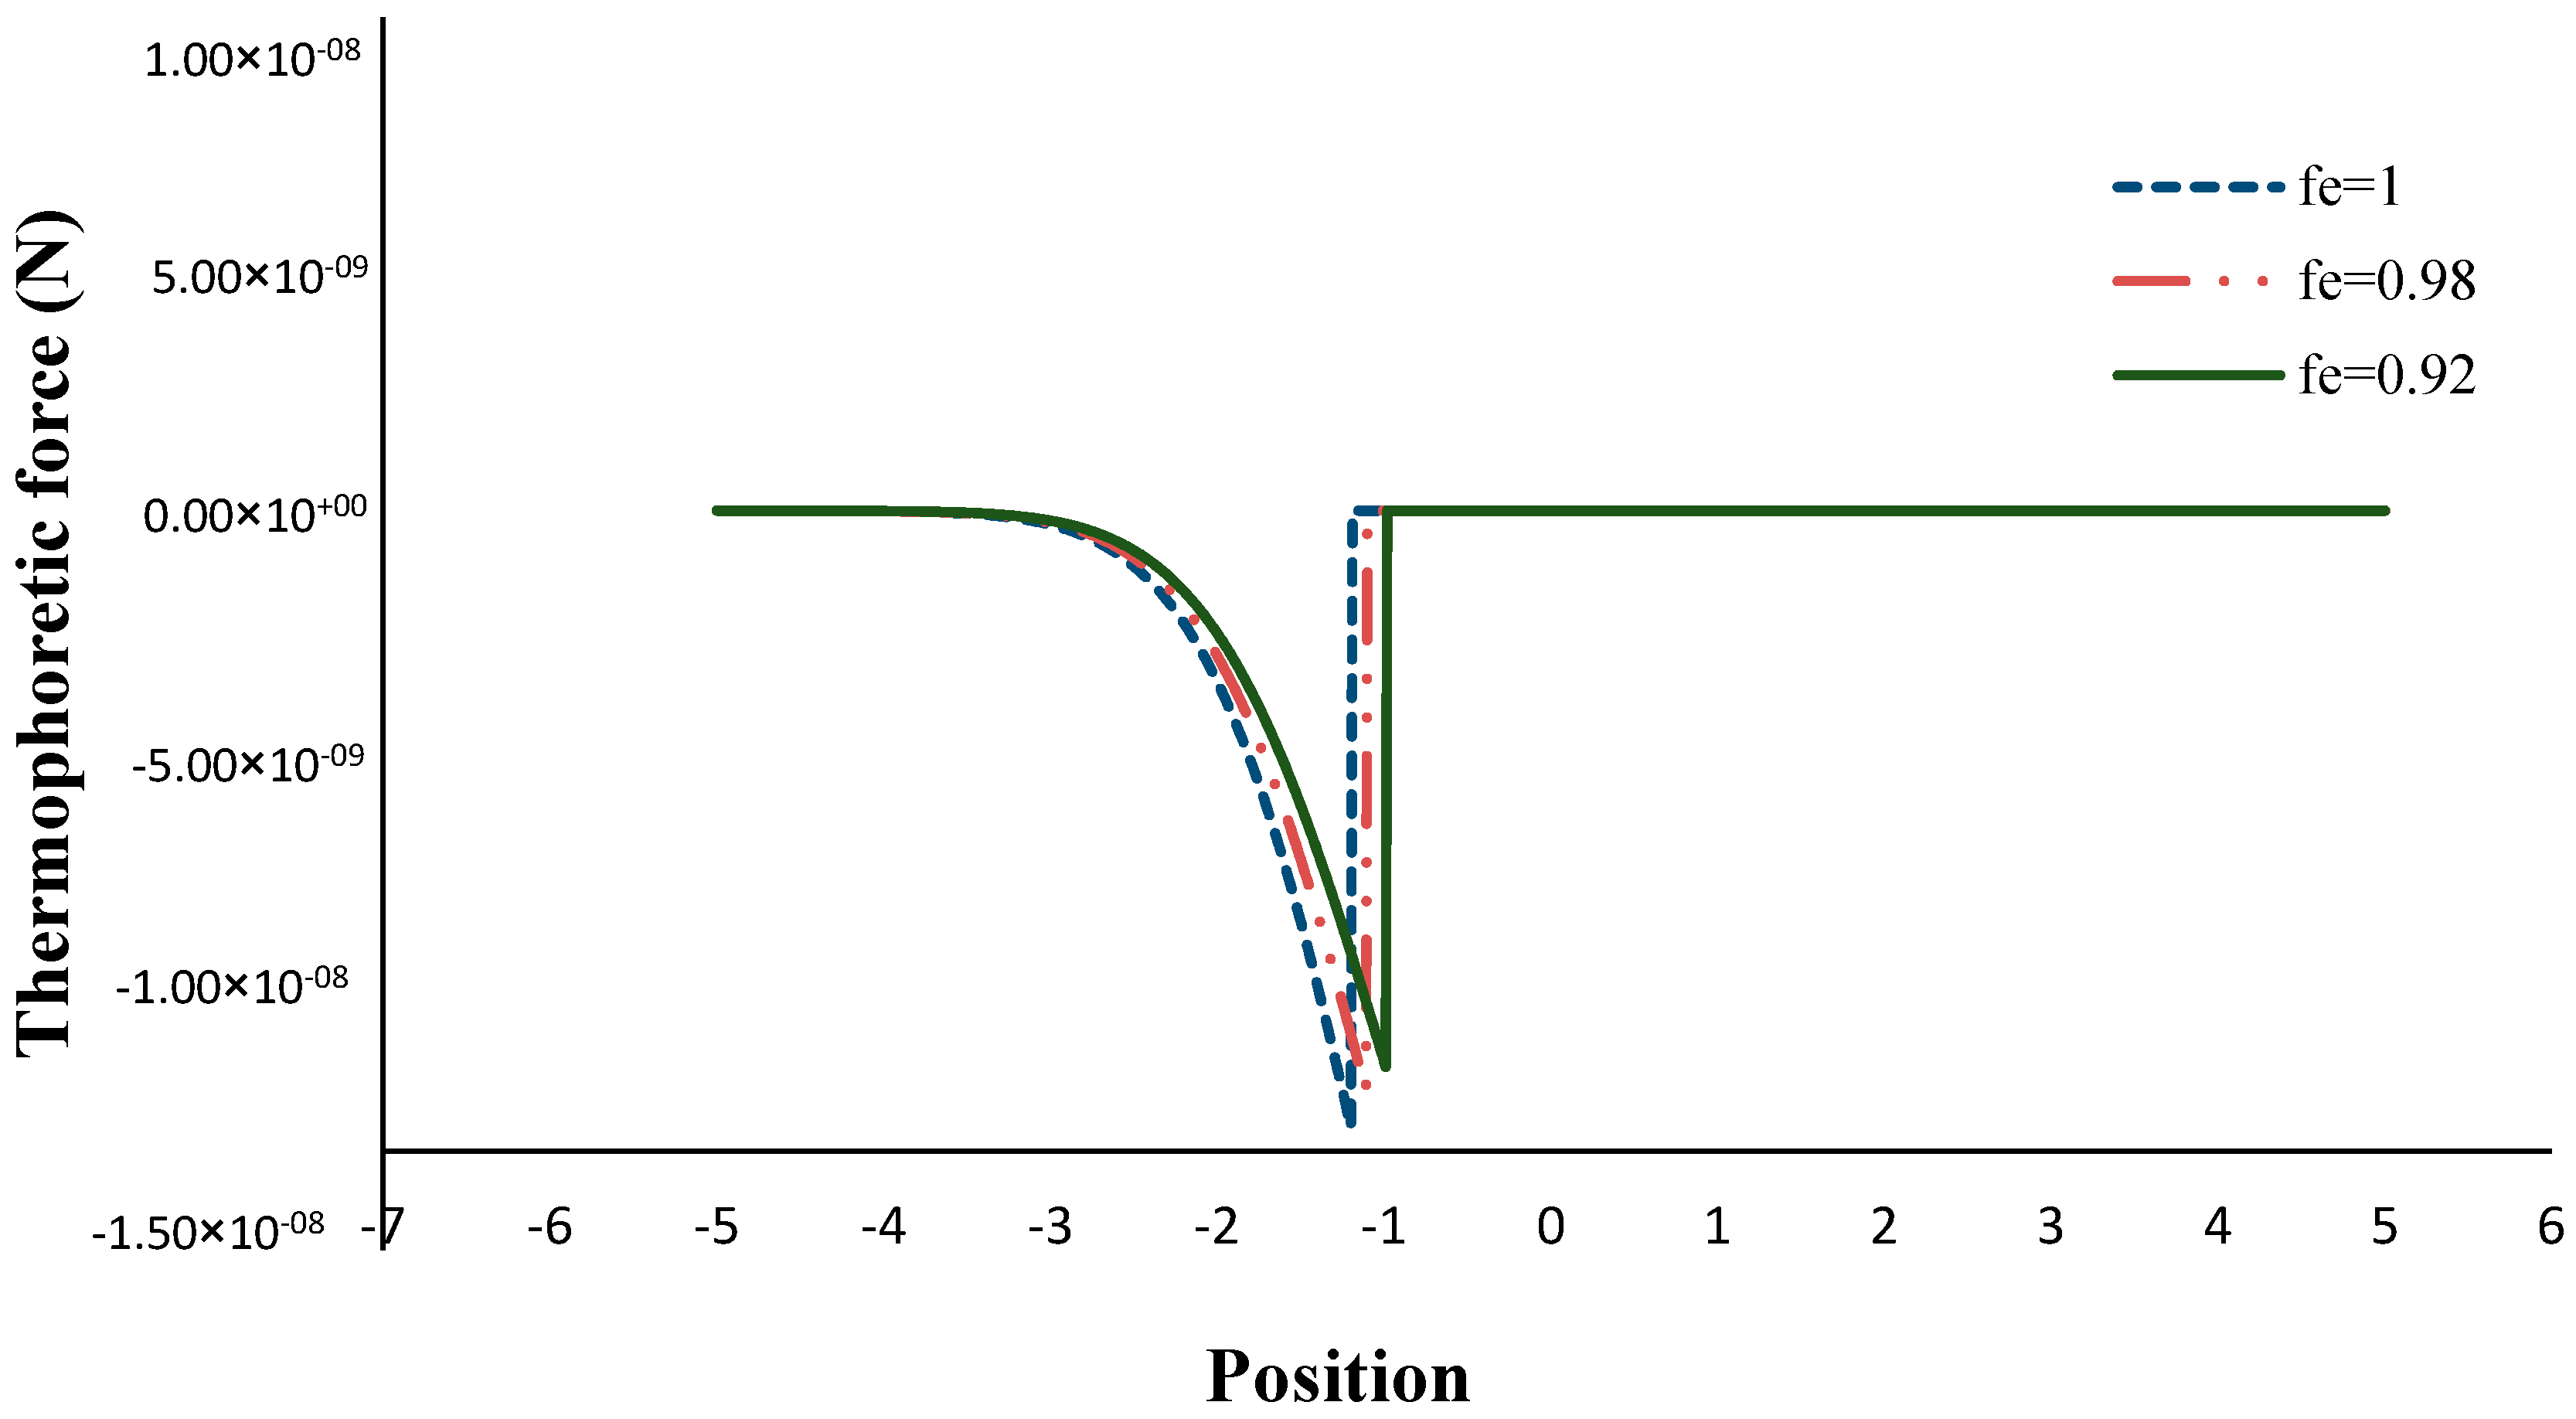
2.3. Thermophoretic Force

The thermophoresis phenomenon, first introduced by Tyndall, is due to the temperature gradient that transfers micro-sized particles from a warmer zone to a colder zone [33,34,35]. This phenomenon is notably influenced by the particle size and mean free path of the molecules [36,37,38]. It should be pointed out that the ratio of the molecules mean free path to diameter is represented by the Knudsen number that can be obtained by the following equation [36]:
K n = L r p
where r p is the radius of the particles, and L is the mean free path of the molecules that can be defined as follows [36,38]:
L = μ ρ g C ¯
where is equal to 0.941 [38], and μ and ρ g are the dynamic viscosity of the fuel particles and the density of the gas, respectively. c ¯ is the mean thermal velocity of the molecules that can be expressed as follows [36]:
c ¯ = 8 R T π M
where T and M are the temperature and molecular mass, respectively. In addition, R is the universal gas constant, which is equal to 8.314 J mol · K .
To assess the thermophoretic force, the following correlation can be applied [36]:
F T h = 3 π μ 2 r p k T T ρ g T
where k T is calculated by the following correlation [36]:
k T = 2 C k ( k g k p + C t K n ) ( 1 + 3 C m K n ) ( 1 + 2 k g k p + 2 C t K n )
where μ , r p , k g , k p , T and T are the dynamic viscosity of the fuel particles, the particle radius, the gas thermal conductivity, the solid particle thermal conductivity, the temperature gradient and the ambient temperature, respectively. C k , C t and C m are the temperature jump, the temperature creep and the velocity jump coefficients [37]. Table 1 lists the constant parameters used in Equation (7).
The Knudsen number can be obtained by the following correlation [36]:
Assuming small Knudsen numbers, the Talbot correlation (Equation (6)) can be rewritten as follows [36,38,39]:
F T h , c o n t i n u m = 6 π μ 2 r p C p k g k p + 2 k g T ρ g T
where C p is the specific heat of the lycopodium particles.

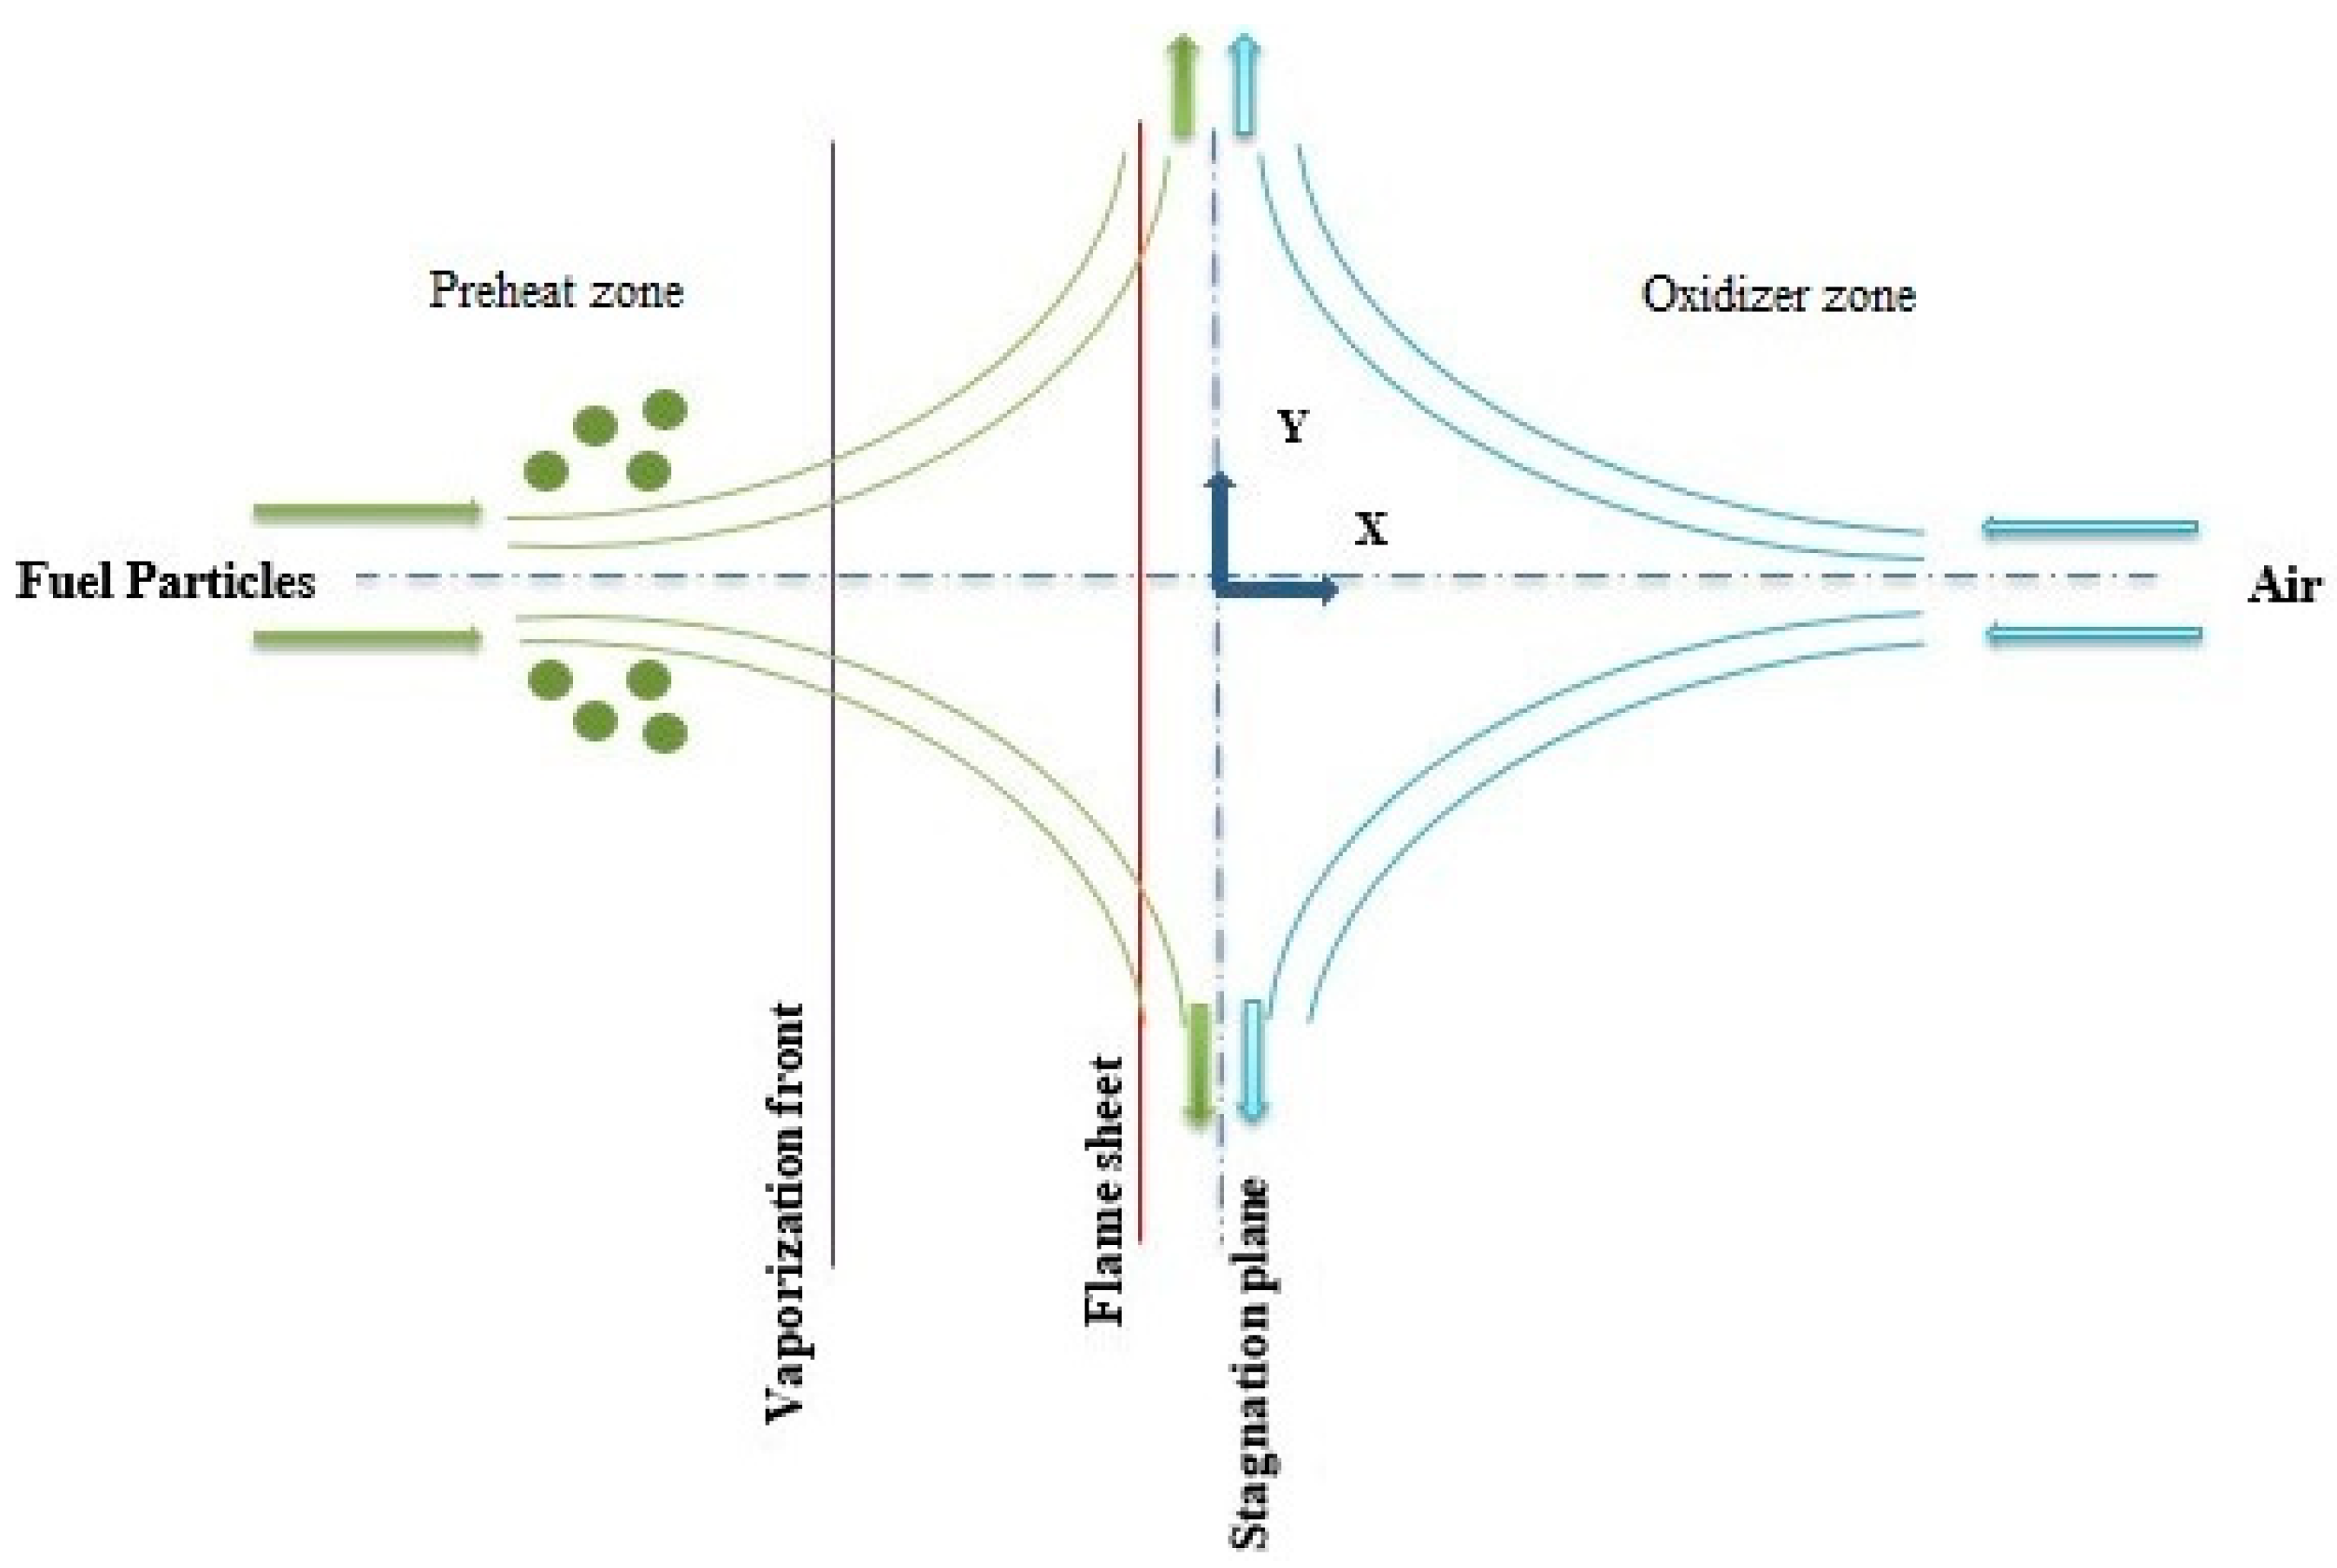
2.4. The Flame Structure

Figure 3 represents the structure of a non-premixed flame, in which the biofuel and oxidizer were entrained in a counter-flow configuration. Regarding this figure, the porous biofuel particles and oxidizer separately enter the combustor from −∞ and +∞ (opposed sides), respectively. In this analysis, a gaseous fuel with a specific chemical composition, gaseous methane, was produced from solid biofuel particles once they asymptotically crossed the vaporization front [11]. Subsequently, the gaseous fuel blended with the oxidizer within the reaction zone and a huge quantity of thermal bioenergy was released. In this investigation, an asymptotic approach was used to model the vaporization and the reaction processes. Besides, the momentum of the fuel and oxidizer streams was considered to be equal so a stagnation plane was placed in the middle of the fuel and oxidizer nozzles. The location of the stagnation plane was employed as the reference coordinate for measuring the location of the flame sheet and vaporization front, as shown in Figure 3. The mass particle concentration value at −∞ was assumed to be less than 100 gr/cm3. Therefore, the initial position of the flame sheet was presumed to be on the left-hand side of the stagnation plane. It should be noted that the flame sheet position was the axial distance from the stagnation plane at which the flame front was detected.

2.5. Mathematical Modeling of the Flame

In this paper, the vaporization rate was modeled as the amount of gaseous fuel mass per unit volume per unit time that can be described as follows [40]:
ω v = Y s τ v a p H ( T T v )
where Y s , τ v a p , H , T and T v are the mass fraction of solid particles, the constant vaporization characteristic time, the Heaviside function, the fuel temperature and the vaporization temperature of the particles. The Heaviside function is defined as follows:
H ( T T v ) = { 0 T < T v 1 T T v .
The thermal diffusivity (α) to mass diffusivity (D) ratio (i.e., Lewis number) is defined as follows [41]:
L e = α D .
Chemical kinetics were assumed to be a one-stage reaction and expressed as follows [42]:
v F [ F ] + v O [ O ] v p r o d u c t [ P ]
where [ F ] , [ O ] and [ P ] denote the fuel, oxidizer and products, respectively. υ F , υ O and υ P are the stoichiometric coefficients of the fuel, oxidizer and products, respectively. The one-dimensional velocity field of the particles was considered as follows:
u = a X
where u and a represent the velocity in the X direction and the flow strain rate, respectively.
The following assumptions were considered in this analysis:
  • For simplicity, it was assumed that values of density and specific heat were constant and the momentum of the fuel and oxidizer streams were the same.
  • The vaporization process occurred in a very thin zone (asymptotic limit).
  • Thermal radiation and heat losses were disregarded.
  • Lycopodium particles were uniformly dispersed. In other words, the size and shape of the particles were assumed to be the same.
  • A large Zeldowich number was presumed. Thus, the thickness of the flame zone would be too small.
  • The ambient temperature ( T ± ) was assumed to be 300 K.
  • In order to analytically solve the coupled complex conservation equations of mass and energy in the considered zones, it was assumed that a gaseous fuel with a certain chemical composition evolved from the asymptotic vaporization of the lycopodium particles. Therefore, pyrolysis was disregarded as clearly considered in References [11,20,43].
  • No chemical interaction occurred between the solid particles before the vaporization front.

2.5.1. Dimensionalized Governing Equations

The conservation of mass equation for a fuel in the gaseous phase was derived, considering the effect of porosity:
a X d Y F d X = D F d 2 Y F d X 2 f e ω F ρ + f e ω v ρ
where D F , Y F and ω F are the fuel diffusivity, the gaseous fuel mass fraction and the chemical reaction rate, respectively. The chemical reaction rate was obtained using a one-step Arrhenius correlation [44,45]:
ω F = β ρ 2 v F v O Y F ¯ Y O ¯ e x p ( E R T )
where β and E are the frequency constant and overall activation energy, respectively. Y F ¯ and Y O ¯ are expressed as follows [41]:
Y F ¯ = Y F m v F m F
Y O ¯ = Y O m v O m O
where Y O and Y F represent the oxidizer and fuel volume fractions. m F and m O are the fuel and oxidizer molecular weights, and m denotes the molecular weight of the mixture.
By neglecting the diffusion of the solid particles (no interaction exists between the solid particles), the mass conservation equation for the solid fuel particles can be presented as follows:
a X d Y s d X = ω v
where Y s and ω v are the mass fraction and vaporization rate of the solid fuel particles, respectively.
The conservation equation of energy was obtained as follows:
a X d T d X = D T d 2 T d X 2 + f e ω F Q ρ C f e ω v Q v C
where Q is the released heat per unit mass of consumed fuel, Q v is the latent heat of vaporization and D T = λ ρ C is the thermal diffusivity coefficient. In Equation (19), C represents the specific heat capacity of the mixture that can be calculated using the following correlation [40,46,47]:
C = C a + f e 4 ρ p 3 ρ π r 3 C p n p
where ρ p is the density of the solid particles and n p is the particle number density per unit volume. The density of the mixture is stated as follows, taking into account the porosity of the particles [40]:
ρ = ρ a + f e 4 3 π r p 3 n p ρ p .
The conservation of mass equation for the oxidizer is as follows:
a X d Y O d X = D O d 2 Y O d X 2 f e ϑ ω F ρ
where D O and Y O are the oxidizer mass diffusion and mass fraction, respectively.

2.5.2. Normalization of the Governing Equations

For normalizing the governing equations, the following parameters were employed [41]:
θ = C ( T T ) Q Y F ,   y F = Y F Y F ,   y O = Y O ϑ Y F ,   y s = Y s Y F ,   x = X λ ρ C a
where θ , y F , y O , y S and x are the normalized forms of the temperature, the fuel mass fraction, the oxidizer mass fraction, the solid fuel mass fraction and position, respectively. Y F is the initial mass fraction of the fuel in the gaseous phase at x (where fuel particles exit in the fuel nozzle). By applying the non-dimensionalized parameters (Equation (23)) into Equations (14), (18), (19) and (22) and considering the definition of a chemical reaction, the vaporization rate and Lewis number, the following normalized equations were obtained for the gaseous fuel mass conservation (Equation (24)), the solid fuel mass conservation (Equation (25)), the oxidizer mass conservation equation (Equation (26)) and the energy conservation equation (Equation (27)), respectively:
1 L e F d 2 y F d x 2 + x d y F d x + f e y s a τ v a p H ( T T v ) = f e D c y F y O exp ( T a T )
x d y s d x = y s a τ v a p H ( T T v )
x d y O d x + 1 L e O d 2 y O d x 2 = f e D c y F y O exp ( T a T )
d 2 θ d x 2 + x d θ d x f e q a τ v a p y s H ( T T v ) = f e D C y F y O exp ( T a T )
where T a is the activation temperature, which is defined as T a = E R ( E is the overall activation energy), q is defined as q = Q v Q and D C is the Damkohler number, which was determined using the following equation [41]:
D C = ρ B ϑ O Y F / W F a
where ϑ O is the number of moles of oxygen participating in the reaction with one mole of fuel and W F is the molecular weight of the fuel.

2.5.3. Boundary and Jump Conditions

In order to solve the non-dimensionalized governing equations in each of the zones, proper boundary and jump conditions were used. In this study, the following division was considered:
Preheat zone: R 1 :   { x |   < x x v }
Post vaporization zone: R 2 :   { x |   x v x x f }
Oxidizer zone: R 3 :   { x |   x f x < }
where x v and x f are locations of the vaporization front and flame sheet, respectively. As previously mentioned, solid particles turned into the gaseous phase asymptotically once they passed the vaporization front. Therefore, the following conditions were considered:
< x x v : y s = 1 x v x < : y s = 0
The following boundary conditions were applied in the analysis of the counter-flow non-premixed flame:
y F = 0 , y O = 0 , y s = 1 , θ = 0 @   x
y F = 0 , y O = α , y s = 0 , θ = 0 @   x +
where α was obtained using the following correlation [38]:
α = Y O , ϑ Y F
The above boundary conditions were defined for the temperature and mass fraction of the fuel and oxidizer at x = and x = + . Nevertheless, to detect the positions of the vaporization front ( x v ) and flame sheet ( x f ), and the corresponding temperature and mass fractions, and enforce the continuity throughout the system, additional conditions were required at x = x v and x = x f . It should be pointed out that at the flame sheet, θ = θ f and y = y F , and at the vaporization front, θ = θ v and y = y F v , which must be solved. Since the current analysis was conducted based on an asymptotic concept, the vaporization and reaction processes occurred within a very thin zone. At the vaporization front, the convection and reaction terms were neglected compared to the diffusion and vaporization terms. Moreover, at the flame sheet position, the convection and vaporization terms can be disregarded against the reaction and diffusion terms. By using the aforementioned explanations and integrating Equations (24), (26) and (27) from x v to x v + and x f to x f + , the following jump conditions were obtained at x = x v and x = x f , respectively, as below:
1 L e F [ d y F d x ] = [ d θ d x ] = q x v ,   [ d y O d x ] = 0 , [ y F ] = [ y O ] = [ θ ] = 0 @   x = x v
1 L e O [ d y O d x ] = 1 L e F [ d y F d x ] = [ d θ d x ] ,   [ y F ] = [ y O ] = [ θ ] = 0 @   x = x f
where [] (square brackets) is defined as [] = (   ) + (   ) . No reaction occurred at the vaporization front. Therefore, the following governing equations were used for the modeling of the vaporization process:
d 2 θ d x 2 + x d θ d x f e q a τ v a p y s H ( T T v ) = 0
1 L e F d 2 y F d x 2 + x d y F d x + f e y s a τ v a p H ( T T v ) = 0
1 L e O d 2 y O d x 2 + x d y O d x = 0 .
By integrating the above equations from x v to x v + , the following equations were achieved:
1 L e F [ d y F d x ] = [ d θ d x ] = q x v
[ d y O d x ] = 0
Equations (38) and (39) describe the jump conditions at the vaporization front ( x v ). In order to obtain the jump condition at the flame sheet ( x f ), the vaporization terms were neglected relative to the diffusion and reaction terms. Further, since the value of the Zeldovich number was presumed to be very large, the thickness of the reaction zone would be very small and the convection term can be neglected. Hence, the following equations were used to model the reaction process:
d 2 θ d x 2 = f e D C y F y O exp ( T a T )
1 L e F d 2 y F d x 2 = f e D c y F y O exp ( T a T ) .
By aggregating Equations (40) and (41), the following equation was achieved:
d 2 θ d x 2 + 1 L e F d 2 y F d x 2 = 0 .
By performing a similar procedure for the oxidizer, the following equation was obtained:
1 L e O d 2 y O d x 2 = f e D c y F y O exp ( T a T ) .
The following equation was determined by aggregating Equations (40) and (41):
d 2 θ d x 2 + 1 L e O d 2 y O d x 2 = 0 .
Finally, by integrating Equations (42) and (44) from x f to x f + , the jump condition at the flame sheet was achieved as follows:
1 L e F [ d y F d x ] = 1 L e O [ d y O d x ] = [ d θ d x ] .

2.5.4. Solution of the Governing Equations

In this subsection, the solution of the non-dimensionalized governing equations is presented considering the boundary and jump conditions. It must be noted that for solving the complex equations, Mathematica and Matlab software were employed.
◾ Zone R1: x x υ
● Temperature distribution
In this zone, the temperature distribution was obtained by solving Equation (35):
θ = C 1 π 2   e r f ( x 2 ) + C 2
Considering the presented boundary conditions, C 1 and C 2 were calculated and the following function was achieved for the temperature distribution:
θ = θ v e r f ( x 2 ) + 1 e r f ( x v 2 ) + 1 .
● Oxidizer mass fraction
By solving Equation (37), the following equation was obtained for the oxidizer mass fraction:
y O = C 1 1 L e O π 2 e r f ( x 2   1 L e O ) + C 2 .
By applying the boundary conditions, C 1 and C 2 were found to be zero and therefore the mass fraction of the oxidizer will be zero:
y O = 0 .
● Fuel mass fraction
By solving Equation (36), the following equation was obtained for the fuel mass fraction in this zone:
y f = C 1 1 L e f π 2 e r f ( x 2   1 L e f ) + C 2 .
By using the boundary conditions presented in Equation (51), the fuel mass fraction function was calculated as presented in Equation (52).
x = y F = 0 ,   x = x v y F = y F v
y f = y F v [ e r f ( x 2   1 L e f ) + 1 ] e r f ( x v 2   1 L e f ) + 1 .
◾ Zone R2: x υ x x f
● Temperature distribution
As previously mentioned, the solid fuel particles were immediately turned into a gaseous fuel once they crossed the vaporization front. In this zone, the following boundary conditions were applied:
x = x v θ = θ v ,   x = x f θ = θ f .
By solving Equation (35) and using these boundary conditions, the temperature distribution of a gaseous fuel was obtained as follows:
θ = θ v + ( e r f ( x 2 ) e r f ( x v 2 ) ) θ f θ v e r f ( x f 2 ) e r f ( x v 2 )
● Oxidizer mass fraction
In this zone, there was no oxidizer; thus, the mass fraction of the oxidizer was found to be zero.
y O = 0 .
● Fuel mass fraction
The fuel mass fraction was obtained by solving Equation (36) and applying the following boundary conditions:
x = x v y F = y F v ,   x = x f y F = 0
y F = y F v [ e r f ( x 2   1 L e f ) e r f ( x f 2   1 L e f ) ] [ e r f ( x v 2   1 L e f ) e r f ( x f 2   1 L e f ) ] .
◾ Zone R3: x f x +
● Temperature distribution
In this zone, no gaseous fuel existed. The temperature distribution can be achieved by calculating Equation (35) and using the following boundary conditions:
x = x f θ = θ f ,   x = + θ = 0
θ = θ f e r f ( x 2 ) 1 e r f ( x f 2 ) 1 .
● Oxidizer mass fraction
The oxidizer mass fraction was obtained by solving Equation (37), considering the below boundary conditions:
x = x f y O = 0 ,   x = + y α = 0
y O = α [ e r f ( x 2   1 L e O ) e r f ( x f 2   1 L e O ) ] 1 e r f ( x f 2   1 L e O ) .
● Fuel mass fraction
In this zone, there was no fuel. Hence, the fuel mass faction was found to be zero:
y F = 0 .
It is notable that the values of the five parameters including the flame temperature, the fuel mass fraction, the oxidizer mass fraction and the location of the vaporization front and flame sheet were unknown.

2.6. Flame Zone Analysis

In order to study the flame zone, as previously expressed, it was assumed that the quantity of the Zeldovich number was very large so the thickness of the flame zone will be very small. In this regard, employing an asymptotic approach could be a promising technique for analyzing this zone. The Zeldovich number was calculated using the following correlation:
Z e = E Q Y F R C T f 2
where E , R and T are the reaction activation energy, the universal gas constant and the flame temperature, respectively. To evaluate the critical extinction of the flame, a reduced Damkohler number was applied. Below is the critical extinction of the Damkohler number [41]:
δ 0 E 2 e ( Z f 2 Z f 2 + 1.04 Z f 3 + 0.44 Z f 4 )
where Z f = 1 2 e r f c ( x f 2 ) and δ 0 are an order of unity that can be approximated using the following equation:
δ = δ 0 + O ( 1 Z e )
where δ is the reduced Damkohler number that can be calculated using the following equation:
δ = 8 π exp ( x f 2 ) D L e O L e f Z f 2 α 2 F O f 2 Z e 3 exp ( T a T f )
where F O f is defined as follows [38]:
F O f F O ( x f , L e O ) = t O f t L e O f ( 1 0.276 t f + 2.15 t f 2 1 0.276 t O f + 2.15 t O f 2 )
t O f = 1 + 0.33333 x f L e O
t f = 1 + 0.33333 x f .
By substituting Equation (64) into Equation (66), the following correlation was obtained:
D 0 E α 2 F O f 2 Z e 3 exp ( T a T f x f 2 + 1 ) 4 π L e O L e f Z f ( 1 2 Z f + 1.04 Z f 2 + 0.44 Z f 3 ) .
According to Equation (70), it can be readily implied that D O E mainly depends on the flame sheet position ( x f ) and the flame temperature ( T f ). The ratio of a to a 0 (for which L e O = L e F = 1 ) is presented in the following:
( a a 0 ) c r i t = L e O L e f F O f 2 ( T f T f 0 ) 6 η 2 d E exp [ T a T f 0 ( 1 T f 0 T f ) + ( x f 2 ( x f 0 ) 2 ) ] .
Equation (71) describes the critical strain rate as a function of the fuel and oxidizer Lewis numbers. In this equation, η and d E are expressed as follows [20]:
η = Z f Z f 0
d E = η 1 2 Z f + 1.04 Z f 2 + 0.44 Z f 3 1 2 Z f 0 + 1.04 ( Z f 0 ) 2 + 0.44 ( Z f 0 ) 3 .

2.7. Calculation of the Thermophoretic Force

● Zone R1: x x υ
By applying θ = θ v e r f ( x 2 ) + 1 e r f ( x v 2 ) + 1 into Equation (47), the thermophoretic forcewas obtained as follows:
T = ( ( e r f ( x 2 ) + 1 ) × 1107.65 ) + 300
T ( x ) = d T d x = 1107.65 2 exp ( x 2 2 ) π 1 2
F T h , c o n t i n u u m = 3.3132 × 10 7 × exp ( x 2 2 )
According to the definition of the thermophoretic force, this force mainly depends on the temperature gradient and the radius of the fuel particles. As previously mentioned, after the vaporization front, the solid fuel particles were completely transformed into a gaseous fuel. In this regard, the radius of the particles and subsequently the value of the thermophoretic force will be almost zero.

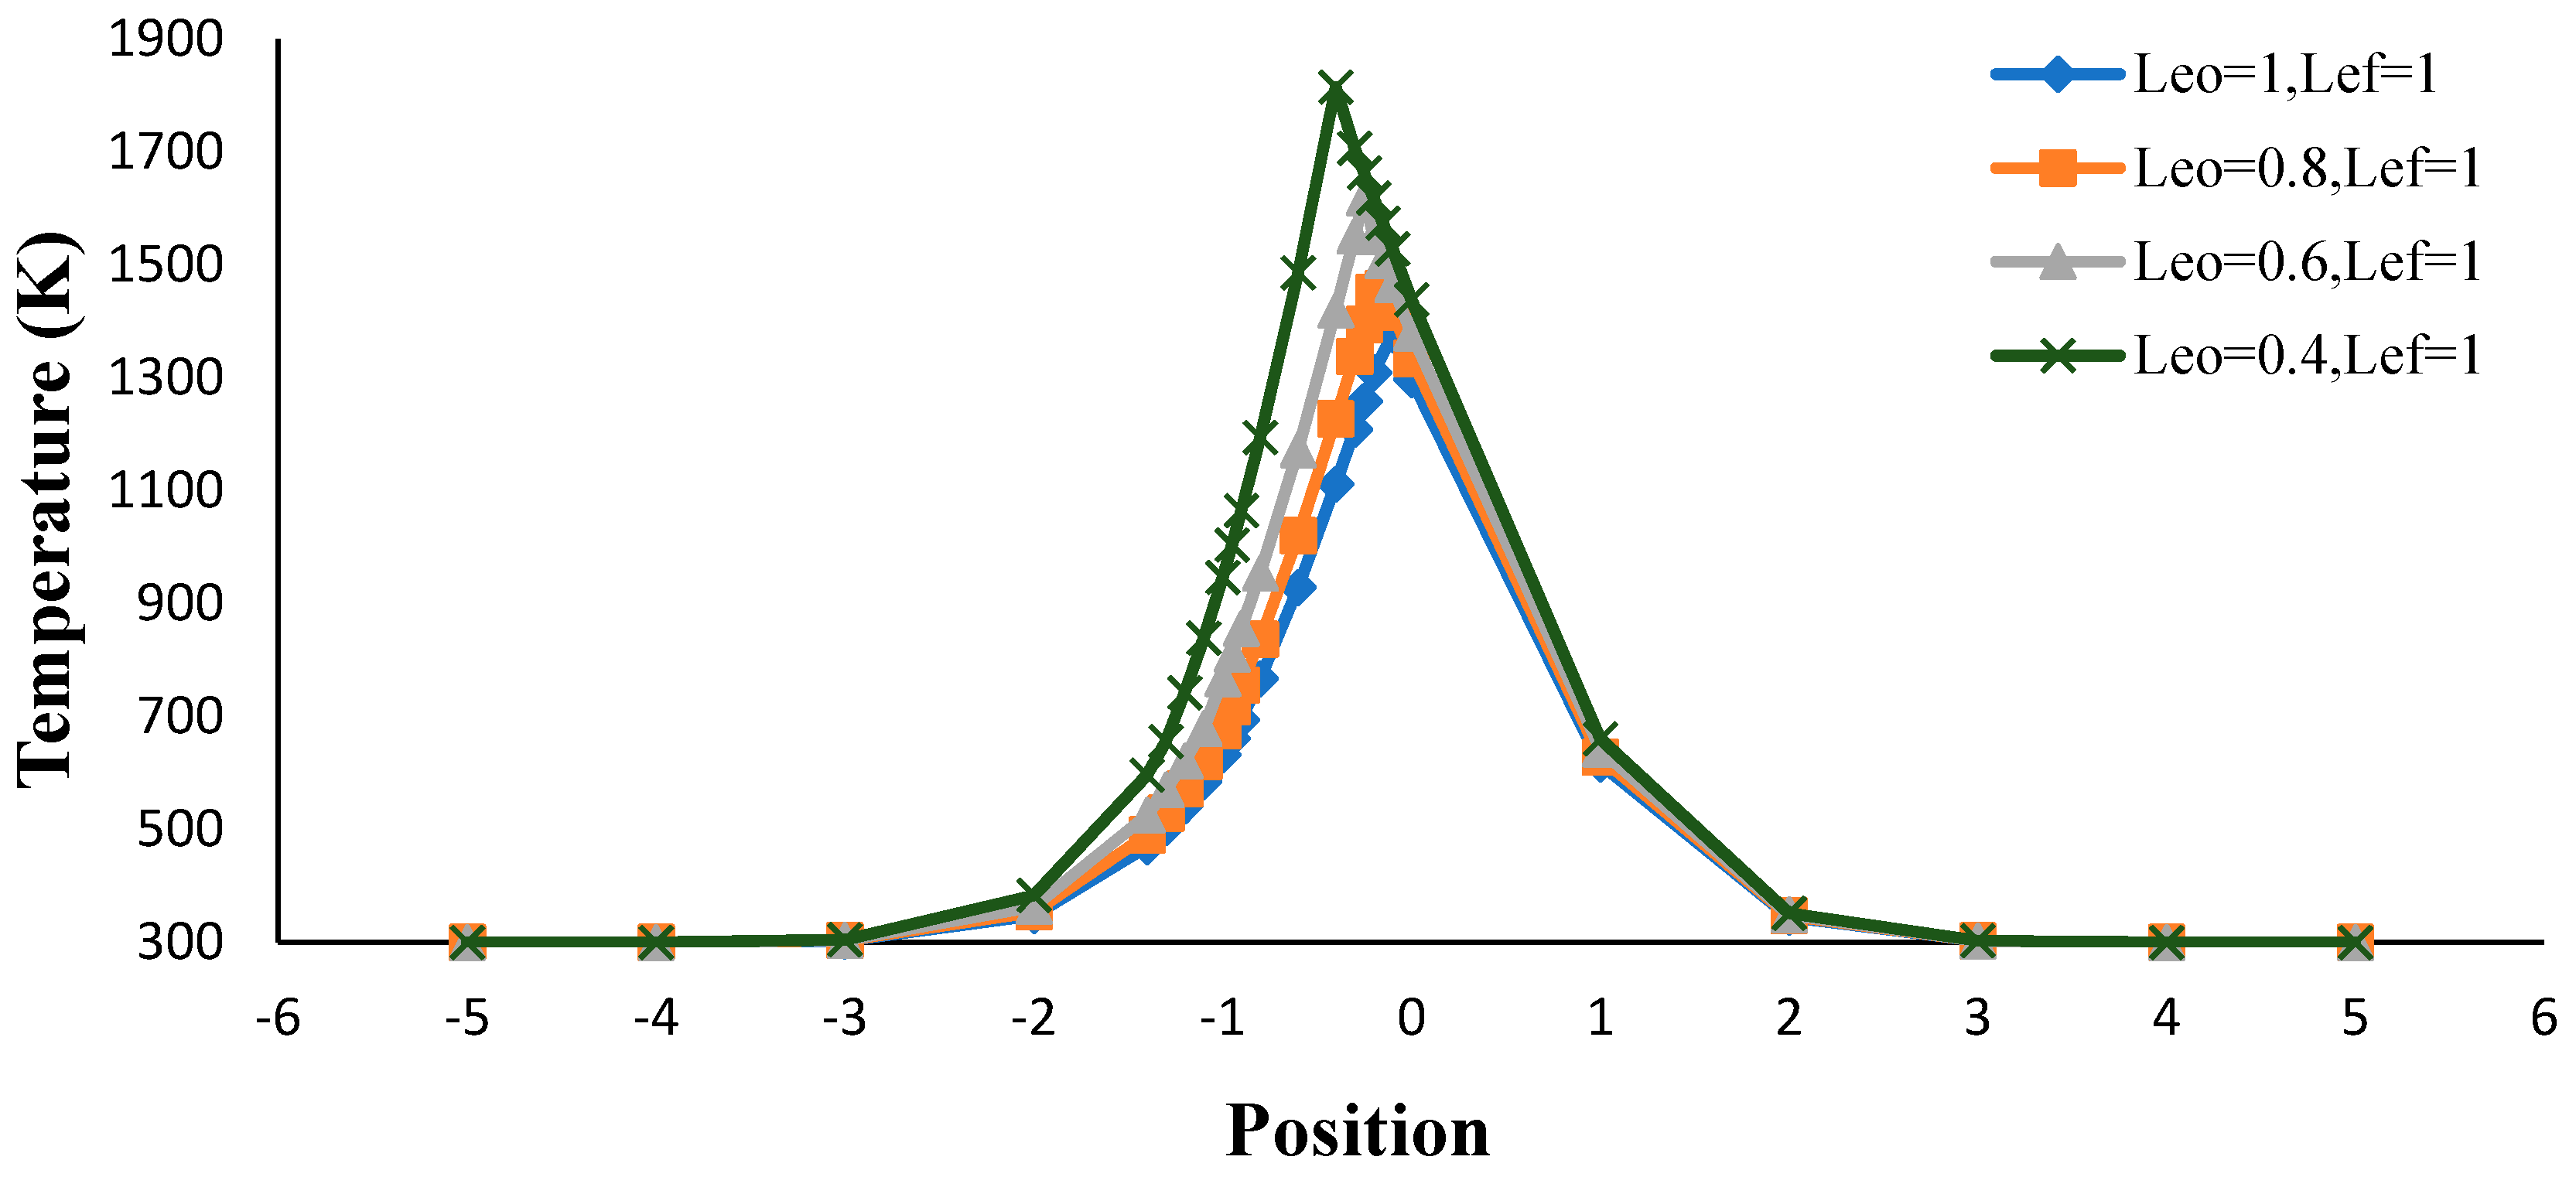
3. Results and Discussion

The properties of the lycopodium biofuel used in the present study are listed in Table 2.
In this section, changes in flame temperature, the flame sheet position, the mass fractions of the biofuel and oxidizer, the flow strain rate and the thermophoretic force with Lewis number, the position and the equivalence ratio were studied. In order to follow the temperature and mass fraction distributions of the fuel and oxidizer, solutions of the mass and energy conservation equations were used considering the afore-presented boundary and jump conditions. As mentioned earlier, the locations of the flame sheet and vaporization front were measured relative to the location of the stagnation plane whose position was employed as the reference coordinate. As assumed in References [11,48], the fuel supplied by the vaporization of the lycopodium particles was gaseous methane. The complete reaction of gaseous methane with air is considered as follows:
CH 4 + 2 ( O 2 + 3.76 N 2 ) CO 2 + 2 H 2 O + ( 7.52 ) N 2 .
By taking into account the volatility of the biofuel, the effective gas phase equivalence ratio is defined as follows [11,48]:
ϕ u = 17.18 Y F 1 Y F
where Y F was calculated using the following equation [11,48]:
Y F = 4 3 π r p 3 n p ρ p ρ .
In order to include the effect of particle porosity, the following correlation was applied:
Y F = f e 4 3 π r p 3 n p ρ p ρ
Figure 4 shows the variations of flame temperature ( K ) with the fuel Lewis number for several porosity factors when the oxidizer Lewis number was unified. With regard to the definition of the Lewis number in Equation (11) (the ratio of thermal diffusivity to mass diffusivity), an increase of the Lewis number leads to a reduction in the fuel mass fraction. Therefore, an accessible fuel reaching the reaction zone declined, which leads to a decrease in flame temperature. As can be observed, an increment in the fuel Lewis number from 0.2 to 1.4 resulted in a gradual increase of the flame temperature between ~1355 and 1615 K for a lycopodium mass concentration of 1000 kg m 3 and a unity value of the porosity factor. It is worth mentioning that decreasing the porosity factor caused a decline in the flame temperature.
Figure 5 shows the change in the flame sheet position with the fuel Lewis number for several porosity factors assuming that a unity value of the oxidizer Lewis number. Again, considering the definition of the Lewis number, increasing the Lewis number leads to a reduction in the fuel mass fraction and flame temperature. Thus, the amount of available fuel for the combustion process decreased leading to the movement of the flame sheet toward the fuel nozzle (left-hand side of the stagnation plane). According to Figure 5, increasing the fuel Lewis number from 0.2 to 1.4 changed the flame sheet position from 0.0967 to −0.1545 when the value of the porosity factor was unity.
Figure 6 indicates a change in flame temperature with the oxidizer Lewis number for different porosity factors when the fuel Lewis number was unity. As it is seen in Figure 6, an increase of the oxidizer Lewis number caused a decline in the mass diffusivity of the oxidizer (according to the Lewis number formula) leading to a decline in the flame temperature. For the considered range of the oxidizer Lewis number from 0.3 to 1, the flame temperature varied from 1955 K to 1391 K .
Figure 7 represents the change in the flame sheet position with the oxidizer Lewis number for different porosity factors and a unity magnitude of the fuel Lewis number. According to the figure, an increment in the oxidizer Lewis number caused a rise in the value of the flame sheet position. In other words, the flame sheet shifted toward the oxidizer nozzle. Based on the Lewis number formula, increasing the oxidizer Lewis number reduces the mass diffusivity of oxidizer. Accordingly, the flame sheet moved toward the oxidizer zone. Regarding Figure 7, for the considered values of the oxidizer Lewis number from 0.3 to 1, the flame sheet position changed gradually from −0.533 to −0.119. Moreover, increasing the particle porosity factor increased the flame temperature and shifted the flame sheet toward the oxidizer zone. With an increasing porosity factor, the available fuel mass for the reaction decreased so the flame sheet would be closer to the fuel nozzle. For validation purposes, the current results were compared to the numerical results reported by Wang [42] for a methane-air mixture under the same conditions (the unity values of the porosity factor and the fuel Lewis number). As represented in Figure 7, there was consistency between the present analytical results and the data provided by Reference [42] for the case in which the porosity factor was unity.
In Figure 8, the effect of the fuel Lewis number on the temperature distribution of the flame is shown for different mass particle concentrations. With regard to Figure 8, an increase of the fuel Lewis number resulted in a decrease of the flame temperature, which can readily be explained by the definition of the Lewis number. According to this figure, by increasing the fuel Lewis number from 0.5 to 1, the flame temperature varied from about 1380 to 1485 K. Furthermore, by increasing the value of the mass particle concentration, the amount of available fuel for the formation of the flame increased, resulting in an increase of the flame temperature.
Figure 9 depicts the effect of the fuel Lewis number on the location of the flame sheet considering several different mass particle concentrations. By increasing the fuel Lewis number from 0.5 to 1, the flame sheet position ranged from −0.096 to −0.01765 when the mass particle concentration was 900 kg/m3. Increasing the Lewis number of the fuel decreased the amount of fuel mass approaching the reaction zone, which shifted the flame sheet toward the fuel nozzle. It is notable that the mass fraction of the fuel for the reaction process increased with an increase in the mass particle concentration. Therefore, further fuel mass diffusivity pushed the flame sheet toward the oxidizer zone.
The variation of the flame temperature with an effective equivalence ratio ( ϕ u ) is drawn in Figure 10 for different lycopodium radii. As it is observed in Figure 10, an increase of the equivalence ratio resulted in an increment in the flame temperature. In addition, increasing the size of the fuel particles (from 8 to 18 μm) caused a reduction in the flame temperature. An enhancement of the particle size decreased the ratio of the particle surface to the particle volume. On this basis, a portion of released heat during the reaction was consumed for the preheating and vaporization of the lycopodium particles with larger diameters that led to a decrease in the flame temperature.
Figure 11 represents the change in the temperature distribution with the flame position for various oxidizer Lewis numbers when the fuel Lewis number was unity. According to Figure 11, the temperature of the fuel particles grew until it approached the maximum temperature corresponding to the flame sheet position. The temperature of the oxidizer also grew until it reached the flame temperature (right-hand side of the stagnation plane). Reducing the oxidizer Lewis number from 1 to 0.4 caused a decrease in the flame temperature and a shift of the flame sheet toward the oxidizer nozzle.
In Figure 12, changes in the gaseous fuel and oxidizer mass fractions with the flame position are described for several different mass particle concentrations. Regarding Figure 12, the gaseous fuel mass fraction increased until it reached the vaporization front at which the mass fraction of gaseous fuel was the lowest. Afterwards, the gaseous fuel was oxidized and consumed in the reaction zone so its mass fraction reduced to zero. From the opposite side, the oxidizer flowed toward the reaction zone and was consumed for the generation of the flame. Therefore, its mass fraction decreased as it moved closer to the flame front. Similarly to the fuel mass fraction, the oxidizer was entirely consumed at the flame front position and its mass fraction became zero. It can also be implied that increasing the value of the porosity factor increased the gaseous fuel mass fraction. Therefore, the vaporization front moved toward the oxidizer nozzle.
Figure 13 and Figure 14 illustrate the effects of the fuel and oxidizer Lewis numbers on the critical strain rate ( a a 0 ) for different porosity factors. According to Figure 13, for unity values of the fuel Lewis number and the porosity factor, increasing the oxidizer Lewis number led to a decline in the ratio of a a 0 . Moreover, decreasing the value of the porosity factor decreased the value of x f leading to a decrease of a a 0 . It is notable that by increasing the value of a a 0 , the flame sheet shifted toward the oxidizer zone. Figure 14 demonstrates the variation of a a 0 with the fuel Lewis number considering different porosity factors when the oxidizer Lewis number was unity. Regarding this figure, the value of a a 0 decreased as the fuel Lewis number increased. Decreasing the fuel Lewis number incremented the value of the flame sheet position ( x f ) and so a remarkable enhancement in the value of the exponential term in Equation (71) that resulted in an increase in the value of a a 0 . In order to validate the results, a comparison was made between the results obtained for a a 0 in this investigation and the results provided by Seshadri and Trevino [41] for the critical strain rate under the same conditions ( T a = 30,000 K and the oxidizer Lewis number was unity). With regard to Figure 14, a reasonable agreement exists between the compared results under the considered conditions.
Figure 15 and Figure 16 delineate the impact of the oxidizer and fuel Lewis numbers on the thermophoretic force for the unity value of the porosity factor, respectively. According to these figures, until reaching the vaporization front, the thermophoretic force continuously reduced with the flame position. As the oxidizer and fuel Lewis numbers decreased, the maximum temperature occurring at the reaction zone increased. In this regard, a temperature gradient and subsequently the value of the thermophoretic force increased. Further, it can be seen that by decreasing the oxidizer and fuel Lewis numbers, the location of the minimum thermophoretic force moved toward the fuel nozzle. As there was no solid fuel after the vaporization front, the value of r p and the thermophoretic force will be zero.
The impact of porosity on the thermophoretic force is illustrated in Figure 17 taking into account the unity values of the oxidizer and fuel Lewis numbers. According to this figure, an increase of the porosity factor enhanced the thermophoretic force. By increasing the porosity factor, the accessible fuel that approached the flame zone decreased leading to a decline in the value maximum flame temperature. In this regard, the temperature gradient term in Equation (8) decreased causing a decline in the value of the thermophoretic force. Similarly to Figure 15 and Figure 16, since no solid fuel existed after the vaporization front, the value of r p and then the thermophoretic force will be zero.

4. Conclusions

Due to its appropriate dispersibility and flammability, lycopodium has been used as a reasonable reference organic fuel for testing different combustion systems and recognizing the processes occurring in the system prior to industrial scale-up. To provide helpful theoretical results about the effective parameters (i.e., the porosity and thermophoretic force), this paper used a mathematical approach to study the structure of multi-zone counter non-premixed flames fueled by lycopodium particles. Preheat, vaporization, flame and oxidizer zones were considered for the flame. Mass and energy equations were obtained for the zones. In this analysis, the porosity of the biofuel particles was also taken into account. Further, the vaporization rate and thermophoresis effects were modelled. Changes in the flame temperature and flame sheet position with fuel and oxidizer Lewis numbers were presented by considering different porosity factors. The impacts of the effective equivalence ratio, the flow critical strain rate, and the gaseous fuel and oxidizer mass fractions were evaluated. Finally, the thermophoretic force caused by the temperature gradient was obtained for different porosity factors, fuel and oxidizer Lewis numbers. For the case in which the oxidizer and fuel Lewis numbers were equal to 0.4 and 1, a maximum temperature of the flame was found to be ~1860 K. The maximum mass fraction of gaseous fuel that occurred at the vaporization front was found to be 0.44 when the value of the porosity factor was unity. In this analysis, for the unity value of the fuel Lewis number, the minimum value of the thermophoretic force was found to be 1.48 × 10 8   N , when the oxidizer Lewis number was 0.4. On the other hand, for the unity value of oxidizer Lewis number, the minimum value of the thermophoretic force was equal to 1.53 × 10 8 N at a fuel Lewis number of 0.4. By considering the porosity factor, the minimum value of the thermophoretic force occurred at a unity value of the porosity factor and its value was found to be 1.28 × 10 8   N . Studying the effects of oscillation and instability and calculating the quenching distance for counter-flow non-premixed combustion can be considered in future works. The main conclusions of the present study are summarized as follows:
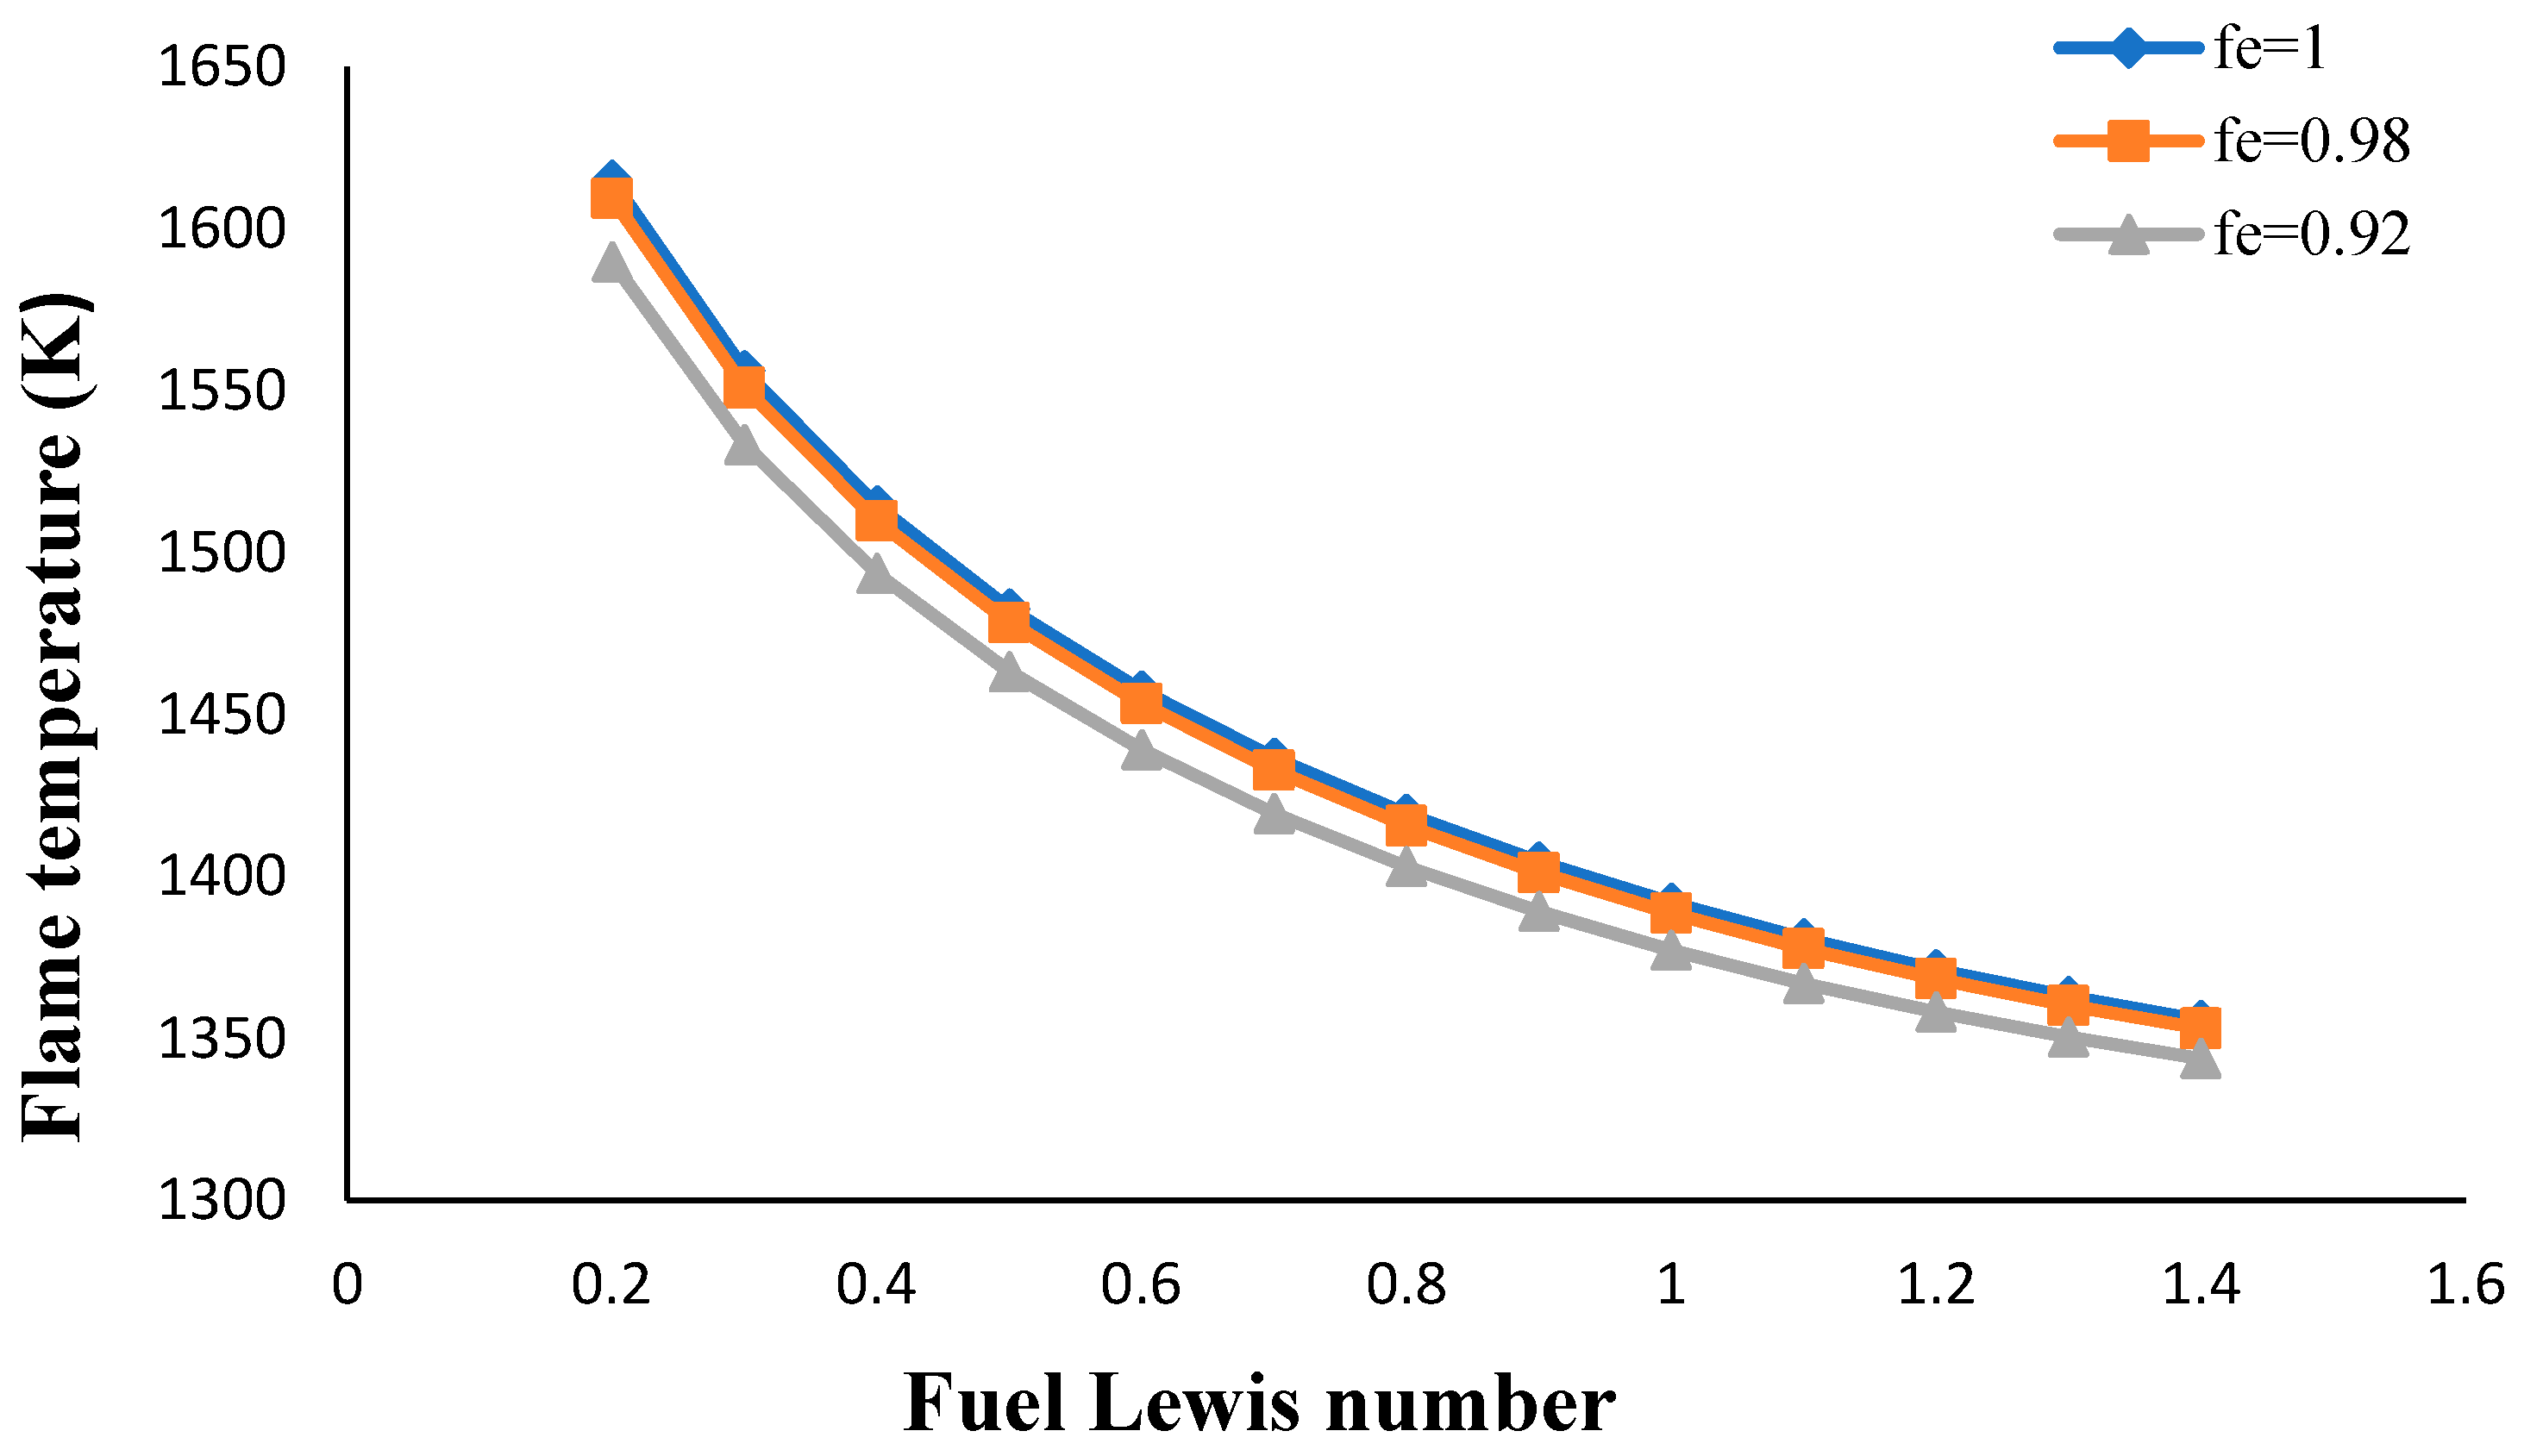
  • The flame temperature increased by decreasing the volume porosity, fuel and oxidizer Lewis numbers.
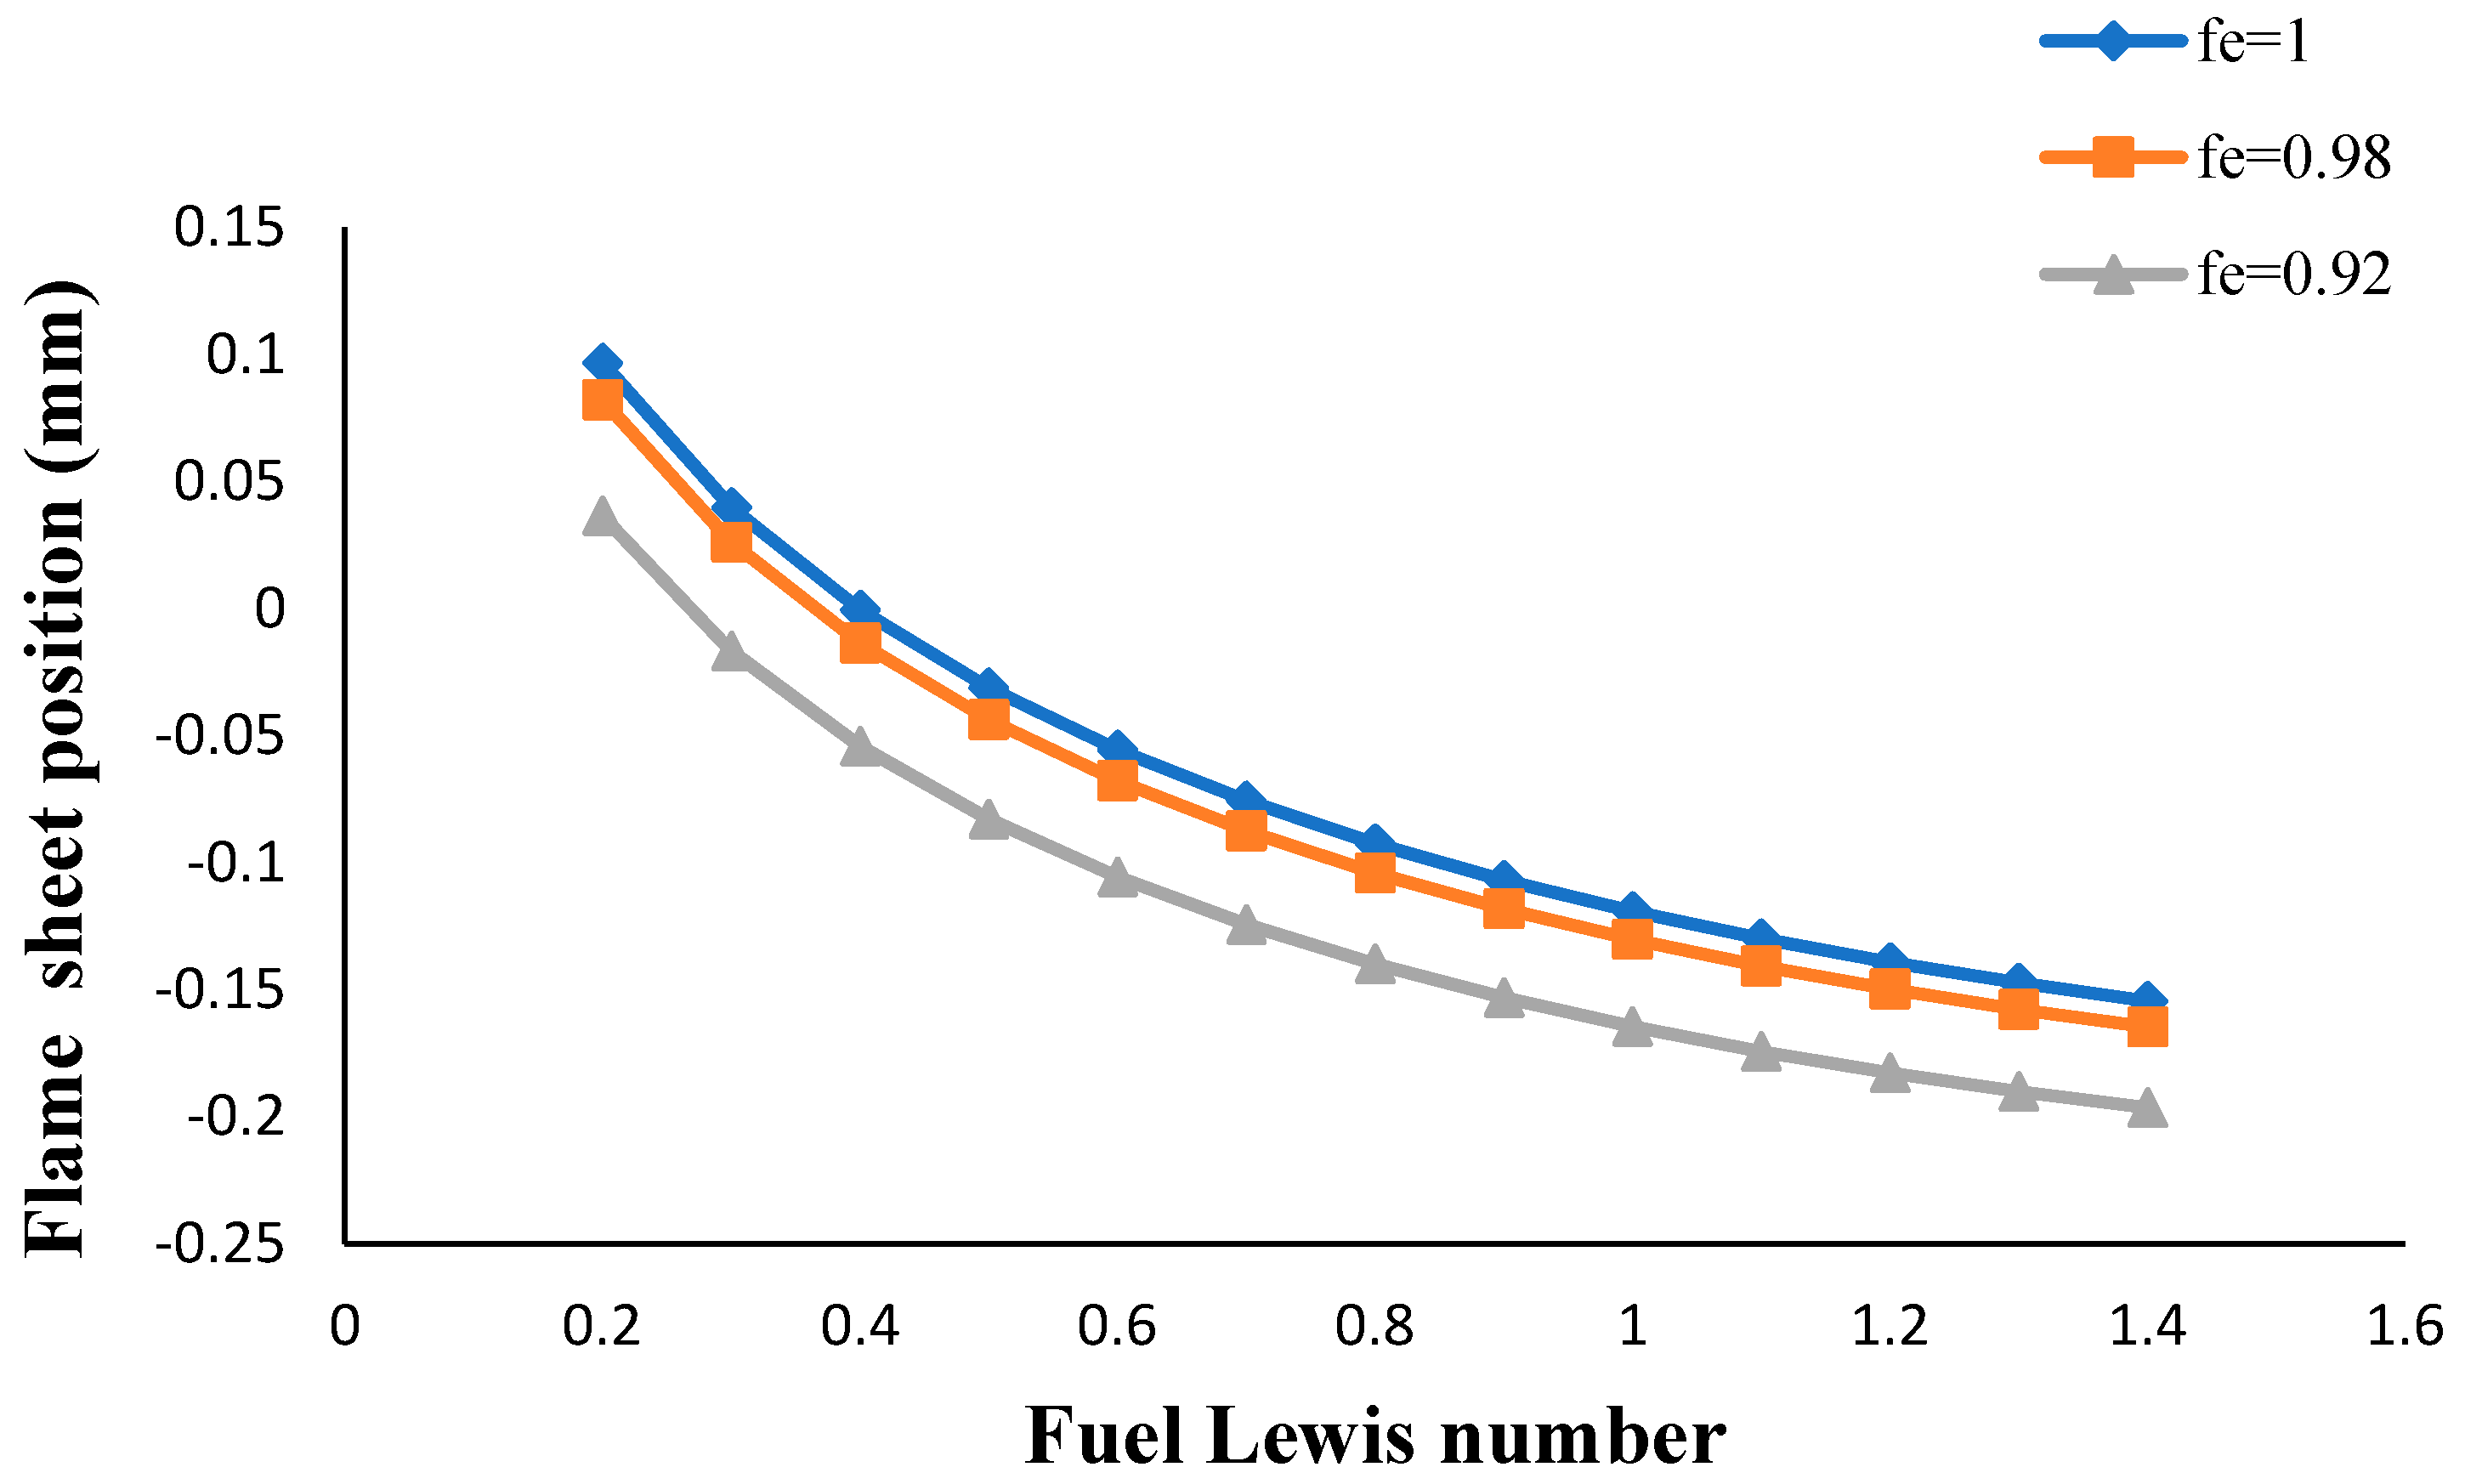
  • The flame sheet position moved toward the fuel nozzle with an increasing volume porosity and fuel Lewis number.
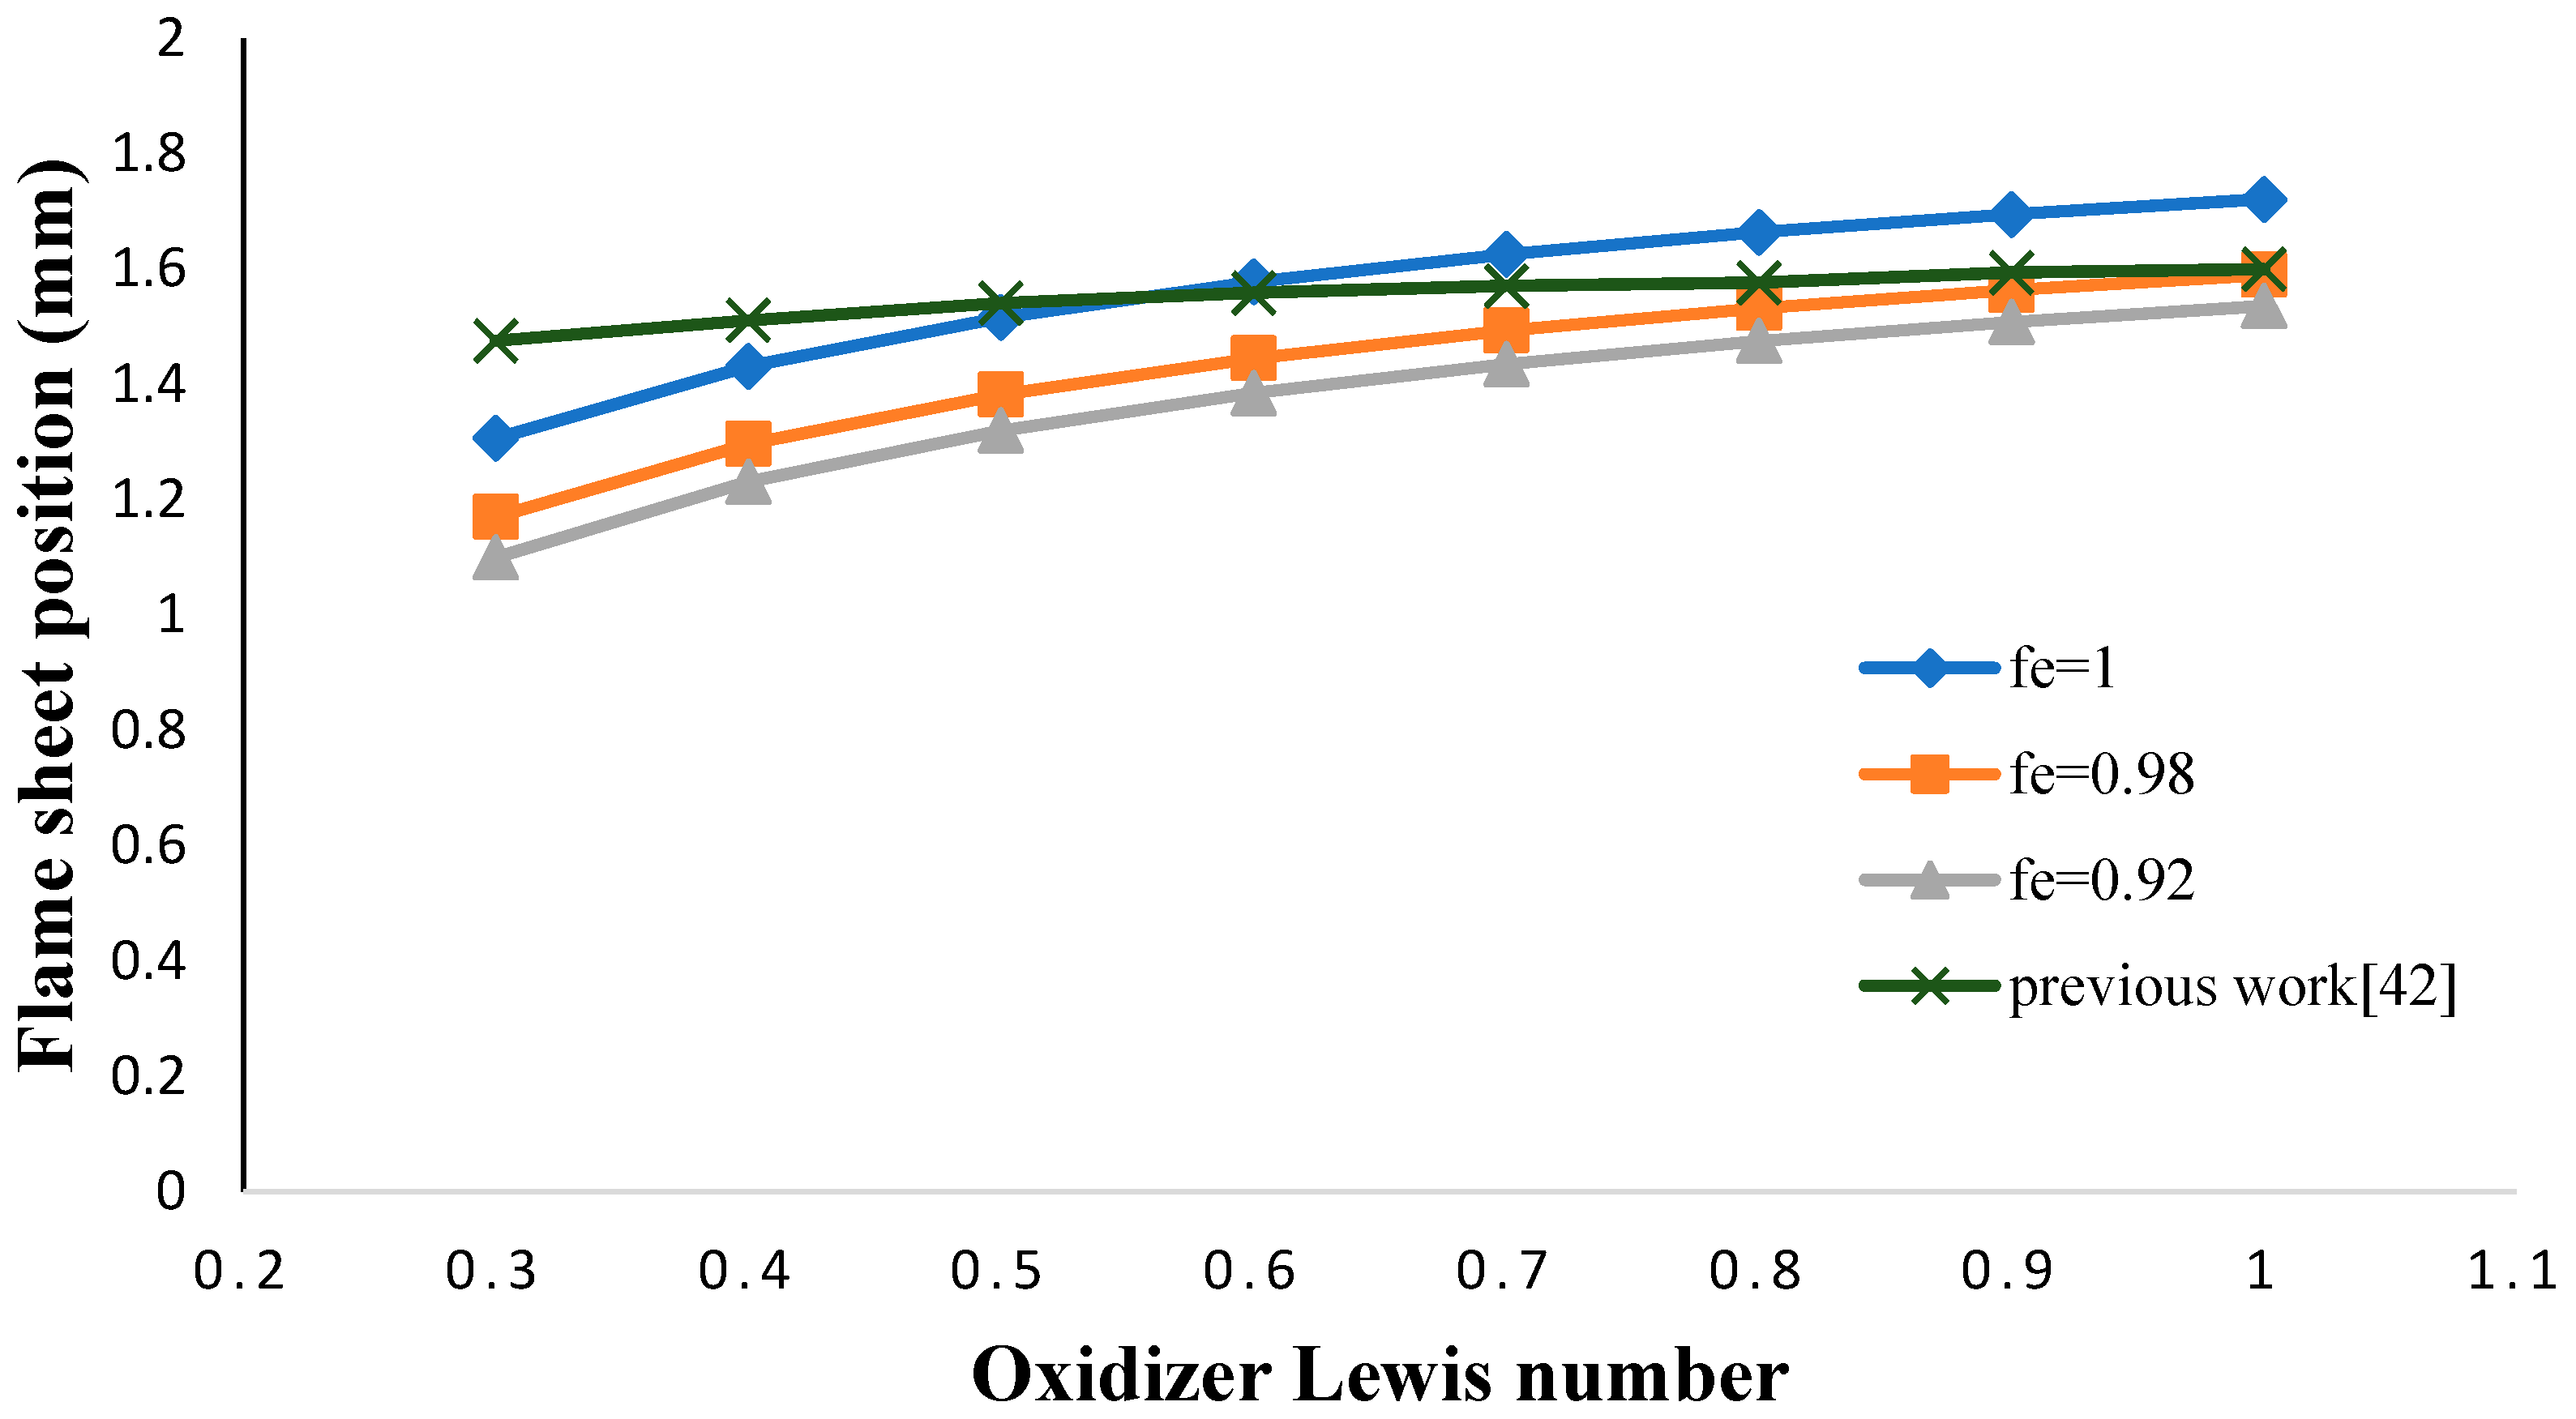
  • The flame sheet position shifted toward the fuel nozzle by decreasing the oxidizer Lewis number.
  • The thermophoretic force increased by decreasing the volume porosity, fuel and oxidizer Lewis numbers.
  • The critical strain rate increased by decreasing the volume porosity, fuel and oxidizer Lewis numbers.

Author Contributions

Project Administration, M.B.; Methodology and Analysis, P.G.N.; Methodology and Validation, H.R. and S.S.; Writing-Original, S.S.; Writing-Review & Editing, B.S.; Analysis-Review M.B. & B.S.

Funding

This research received no external funding.

Conflicts of Interest

The authors declare no conflicts of interest.

Nomenclature

a Strain rate
C ¯ Mean thermal velocity of gas molecular
C a gaseous phase specific heat ( kJ kg · K )
C k temperature jump coefficient
C p Solid particle specific heat ( kJ kg · K )
C t Temperature creep coefficient
C m Velocity jump coefficient
C s Gas velocity discontinuities coefficient
D C Damkohler number
D F Mass diffusivity coefficient of gaseous fuel (m2/s)
D O Mass diffusivity coefficient of oxidizer (m2/s)
D 0 E Critical Damkohler number
D T Thermal diffusivity coefficient (m2/s)
E activation energy (kj)
e r f i ( x ) Error function
f e Porosity factor
H Heavi side function
k g Gas thermal conductivity ( kJ m · s · K )
k p Lycopodium thermal conductivity ( kJ m · s · K )
k T Constant Defined in Equation (4)
L Mean free path
L e Lewis number
m Mixture molecular mass ( kg mol )
m f Fuel molecular mass ( kg mol )
m O Oxygen molecular mass ( kg mol )
n p Number of particle per volume unit
Q Reaction heat per unit of fuel mass ( kJ kg )
q Dimensionless heat
R Universal constant of gases ( m 3 Pa mol · K )
r p Particle radius
T Fuel temperature ( K )
T a activation temperature (K)
T f Flame temperature (K)
T v Particle Start temperature of vaporization ( K )
W F molecular weight of fuel
x Dimension length
x f Flame position
x v Vaporization front position
Y F Gaseous fuel mass fraction
Y O Oxidizer mass fraction
Y s Particle mass fraction
y F Dimensionless fuel mass fraction
y O Dimensionless oxidizer mass fraction
y s Dimensionless mass fraction of solid particles
Z Secondary coordinate axis
Z e Zeldovich number
Greek symbols
α Initial mass fraction of oxidizer
ε Volume porosity
ΘDimensionless Temperature
λ Thermal conductivity of fuel or oxidizer ( kJ m · s · K )
μ Dynamic viscosity
υ F Fuel stoichiometric coefficient
υ O oxidizer stoichiometric coefficient
υ p r o d u c t Product stoichiometric coefficient
ρ Density ( kg m 3 )
ρ a Gaseous phase density ( kg m 3 )
ρ p Density of Solid particle ( kg m 3 )
τ v a p constant time characteristic of vaporization
ω v Particle vaporization rate ( kg m · s 2 )
ω F Rate of chemical reaction ( kg m · s 2 )
Constant and equal to 0.941

References

  1. Caputo, A.C.; Palumbo, M.; Pelagagge, P.M.; Scacchia, F. Economics of biomass energy utilization in combustion and gasification plants: Effects of logistic variables. Biomass Bioenergy 2005, 28, 35–51. [Google Scholar] [CrossRef]
  2. Wahlund, B.; Yan, J.; Westermark, M. Increasing biomass utilisation in energy systems: A comparative study of CO2 reduction and cost for different bioenergy processing options. Biomass Bioenergy 2004, 26, 531–544. [Google Scholar] [CrossRef]
  3. Demirbas, A.H.; Demirbas, I. Importance of rural bioenergy for developing countries. Energy Convers. Manag. 2007, 48, 2386–2398. [Google Scholar] [CrossRef]
  4. Hall, D.O.; Scrase, J.I. Will biomass be the environmentally friendly fuel of the future? Biomass Bioenergy 1998, 15, 357–367. [Google Scholar] [CrossRef]
  5. Hu, Y.; Kurose, R. Nonpremixed and premixed flamelets LES of partially premixed spray flames using a two-phase transport equation of progress variable. Combust. Flame 2018, 188, 227–242. [Google Scholar] [CrossRef]
  6. Bhoi, P.R.; Channiwala, S.A. Emission characteristics and axial flame temperature distribution of producer gas fired premixed burner. Biomass Bioenergy 2009, 33, 469–477. [Google Scholar] [CrossRef]
  7. Akbarzadeh, M.; Birouk, M. Effect of Fuel Nozzle Geometry on the Stability of Non-Premixed Turbulent Methane Flame. In Proceedings of the 23rd ICDERS, Irvine, CA, USA, 24–29 July 2011. [Google Scholar]
  8. Josh, N.D.; Berlad, A.L. Gravitational effects on stabilized, premixed, lycopodium-air flames. Combust. Sci. Technol. 1986, 47, 55–68. [Google Scholar] [CrossRef]
  9. Berlad, A.L.; Joshi, N.D. Gravitational effects on the extinction conditions for premixed flames. Acta Astronaut. 1985, 12, 539–545. [Google Scholar] [CrossRef]
  10. Berlad, A.L.; Tangirala, V.; Facca, L.R. Radiative structures of lycopodium-air flames in low gravity. J. Propuls. Power 1991, 7, 5–8. [Google Scholar] [CrossRef]
  11. Seshadri, K.; Berlad, A.L.; Tangirala, V. The structure of premixed particle-cloud flames. Combust. Flame 1992, 89, 333–342. [Google Scholar] [CrossRef]
  12. Han, O.S.; Yashima, M.; Matsuda, T.; Matsui, H.; Miyake, A.; Ogawa, T. Behavior of flames propagating through lycopodium dust clouds in a vertical duct. J. Loss Prev. Process. Ind. 2000, 13, 449–457. [Google Scholar] [CrossRef]
  13. Han, O.S.; Yashima, M.; Matsuda, T.; Matsui, H.; Miyake, A.; Ogawa, T. A study of flame propagation mechanisms in lycopodium dust clouds based on dust particles’ behavior. J. Loss Prev. Process. Ind. 2001, 14, 153–160. [Google Scholar] [CrossRef]
  14. Xi, Z.; Fu, Z.; Hu, X.; Sabir, S.; Jiang, Y. An experimental investigation on flame pulsation for a swirl non-premixed combustion. Energies 2018, 11, 1757. [Google Scholar] [CrossRef]
  15. Proust, C. Flame propagation and combustion in some dust-air mixtures. J. Loss Prev. Process. Ind. 2006, 19, 89–100. [Google Scholar] [CrossRef]
  16. Skjold, T.; Olsen, K.L.; Castellanos, D. A constant pressure dust explosion experiment. J. Loss Prev. Process. Ind. 2013, 26, 562–570. [Google Scholar] [CrossRef]
  17. Shamooni, A.; Cuoci, A.; Faravelli, T.; Sadiki, A. Prediction of Combustion and Heat Release Rates in Non-Premixed Syngas Jet Flames Using Finite-Rate Scale Similarity Based Combustion Models. Energies 2018, 11, 2464. [Google Scholar] [CrossRef]
  18. Rahbari, A.; Shakibi, A.; Bidabadi, M. A two-dimensional analytical model of laminar flame in lycopodium dust particles. Korean J. Chem. Eng. 2015, 32, 1798–1803. [Google Scholar] [CrossRef]
  19. Bidabadi, M.; Esmaeilnejad, A. An analytical model for predicting counterflow flame propagation through premixed dust micro particles with radiative heat loss. J. Loss Prev. Process. Ind. 2015, 35, 182–199. [Google Scholar] [CrossRef]
  20. Bidabadi, M.; Ramezanpour, M.; Poorfar, A.K.; Monteiro, E.; Rouboa, A. Mathematical Modeling of a Non-premixed Organic Dust Flame in a Counterflow Configuration. Energy Fuels 2016, 30, 9772–9782. [Google Scholar] [CrossRef]
  21. Xi, Z.; Fu, Z.; Hu, X.; Sabir, S.W.; Jiang, Y. An Investigation on Flame Shape and Size for a High-Pressure Turbulent Non-Premixed Swirl Combustion. Energies 2018, 11, 930. [Google Scholar] [CrossRef]
  22. Li, X.; Zhang, J.; Yang, H.; Jiang, L.; Wang, X.; Zhao, D. Combustion characteristics of non-premixed methane micro-jet flame in coflow air and thermal interaction between flame and micro tube. Appl. Therm. Eng. 2017, 112, 296–303. [Google Scholar] [CrossRef]
  23. Bidabadi, M.; Harati, M.; Afzalabadi, A.; Rahbari, A. Effect of Thermal Resistance on the Random Combustion of Micro-Organic Dust Particles. J. Energy Eng. 2017, 144, 04017073. [Google Scholar] [CrossRef]
  24. Spijker, C.; Raupenstrauch, H. Numerical investigation on inner particle effects in Lycopodium/Air dust deflagrations. J. Loss Prev. Process. Ind. 2017, 49, 870–879. [Google Scholar] [CrossRef]
  25. Chen, L.; Xia, Y.F.; Li, B.W.; Shi, J.R. Flame front inclination instability in the porous media combustion with inhomogeneous preheating temperature distribution. Appl. Therm. Eng. 2018, 128, 1520–1530. [Google Scholar] [CrossRef]
  26. Bidabadi, M.; Ebrahimi, F.; Bordbar, V. Modeling multi regional counter flow combustion of lycopodium dust cloud with considering radiative heat loss. J. Cent. South Univ. 2017, 24, 2638–2648. [Google Scholar] [CrossRef]
  27. Ji, W.; Yu, J.; Yu, X.; Yan, X. Experimental investigation into the vented hybrid mixture explosions of lycopodium dust and methane. J. Loss Prev. Process. Ind. 2018, 51, 102–111. [Google Scholar] [CrossRef]
  28. Di Benedetto, A.; Di Sarli, V.; Russo, P. On the determination of the minimum ignition temperature for dust/air mixtures. Chem. Eng. Trans. 2010, 19, 189–194. [Google Scholar]
  29. Sanchirico, R.; Russo, P.; Saliva, A.; Doussot, A.; Di Sarli, V.; Di Benedetto, A. Explosion of lycopodium-nicotinic acid–methane complex hybrid mixtures. J. Loss Prev. Process. Ind. 2015, 36, 505–508. [Google Scholar] [CrossRef]
  30. Sanchirico, R.; Russo, P.; Di Sarli, V.; Di Benedetto, A. On the explosion and flammability behavior of mixtures of combustible dusts. Process. Saf. Environ. Prot. 2015, 94, 410–419. [Google Scholar] [CrossRef]
  31. Sanchirico, R.; Di Sarli, V.; Russo, P.; Di Benedetto, A. Effect of the nozzle type on the integrity of dust particles in standard explosion tests. Powder Technol. 2015, 279, 203–208. [Google Scholar] [CrossRef]
  32. Kassebaum, J.L.; Chelliah, H.K. Oxidation of isolated porous carbon particles: Comprehensive numerical model. Combust. Theory Model. 2009, 13, 143–166. [Google Scholar] [CrossRef]
  33. Comtois, P. John Tyndall and the floating matter of the air. Aerobiologia 2001, 17, 193–202. [Google Scholar] [CrossRef]
  34. Davies, C.N. Aerosol Science; London Academic Press: London, UK, 1966. [Google Scholar]
  35. Braun, D.; Libchaber, A. Trapping of DNA by thermophoretic depletion and convection. Phys. Rev. Lett. 2002, 89, 188103. [Google Scholar] [CrossRef] [PubMed]
  36. Talbot, L.R.; Cheng, R.K.; Schefer, R.W.; Willis, D.R. Thermophoresis of particles in a heated boundary layer. J. Fluid Mech. 1980, 101, 737–758. [Google Scholar] [CrossRef]
  37. Bakanov, S.P. The thermophoresis of solids in gases. J. Appl. Math. Mech. 2005, 5, 767–772. [Google Scholar] [CrossRef]
  38. Rahbari, A.; Wong, K.F.; Vakilabadi, M.A.; Poorfar, A.K.; Afzalabadi, A. Theoretical investigation of particle behavior on flame propagation in lycopodium dust cloud. J. Energy Resour. Technol. 2017, 139, 012202. [Google Scholar] [CrossRef]
  39. Bidabadi, M.; Natanzi, A.H.; Mostafavi, S.A. Thermophoresis effect on volatile particle concentration in micro-organic dust flame. Powder Technol. 2012, 217, 69–76. [Google Scholar] [CrossRef]
  40. Haghiri, A.; Bidabadi, M. Modeling of laminar flame propagation through organic dust cloud with thermal radiation effect. Int. J. Therm. Sci. 2010, 49, 1446–1456. [Google Scholar] [CrossRef]
  41. Seshadri, K.; Trevino, C. The influence of the Lewis numbers of the reactants on the asymptotic structure of counterflow and stagnant diffusion flames. Combust. Sci. Technol. 1989, 64, 243–261. [Google Scholar] [CrossRef]
  42. Wang, H.Y.; Chen, W.H.; Law, C.K. Extinction of counterflow diffusion flames with radiative heat loss and nonunity Lewis numbers. Combust. Flame 2007, 148, 100–116. [Google Scholar] [CrossRef]
  43. Bidabadi, M.; Panahifar, P.; Sadeghi, S. Analytical development of a model for counter-flow non-premixed flames with volatile biofuel particles considering drying and vaporization zones with finite thicknesses. Fuel 2018, 231, 172–186. [Google Scholar] [CrossRef]
  44. Linan, A. The asymptotic structure of counterflow diffusion flames for large activation energies. Acta Astronaut. 1974, 1, 1007–1039. [Google Scholar] [CrossRef] [Green Version]
  45. Fendell, F.E. Ignition and extinction in combustion of initially unmixed reactants. J. Fluid Mech. 1965, 21, 281–303. [Google Scholar] [CrossRef]
  46. Huang, Y.; Risha, G.A.; Yang, V.; Yetter, R.A. Effect of particle size on combustion of aluminum particle dust in air. Combust. Flame 2009, 156, 5–13. [Google Scholar] [CrossRef]
  47. Wichman, I.S.; Yang, M. Double-spray counterflow diffusion flame model. Strain 1998, 2, 373–398. [Google Scholar] [CrossRef]
  48. Rockwell, S.R.; Rangwala, A.S. Modeling of dust air flames. Fire Saf. J. 2013, 59, 22–29. [Google Scholar] [CrossRef]
Figure 1. Scanning electron microscopy of lycopodium biofuel particles [22].
Energies 11 02945 g001
Figure 2. Schematic representation of the porous biofuel particle considered in the current analysis.
Energies 11 02945 g002
Figure 3. Schematic of the non-premixed flame in a counter-flow arrangement.
Energies 11 02945 g003
Figure 4. Flame temperature against the fuel Lewis number for several porosity factors.
Energies 11 02945 g004
Figure 5. Flame sheet position against the fuel Lewis number for different porosity factors.
Energies 11 02945 g005
Figure 6. Flame temperature against the oxidizer Lewis number for several porosity factors.
Energies 11 02945 g006
Figure 7. Flame sheet position against the oxidizer Lewis number for different porosity factors.
Energies 11 02945 g007
Figure 8. Flame temperature against the fuel Lewis number for several values of mass particle concentration.
Energies 11 02945 g008
Figure 9. Flame sheet position against the fuel Lewis number for different mass particle concentrations.
Energies 11 02945 g009
Figure 10. Flame temperature against the effective equivalence ratio ( ϕ u ) considering several lycopodium radii.
Energies 11 02945 g010
Figure 11. Temperature distribution against position for different oxidizer Lewis numbers.
Energies 11 02945 g011
Figure 12. Oxidizer and gaseous fuel mass fractions against the position for different mass particle concentrations.
Energies 11 02945 g012
Figure 13. Critical flow strain rate against the oxidizer Lewis number for several porosity factors.
Energies 11 02945 g013
Figure 14. Critical flow strain rate against the fuel Lewis number for different porosity factors.
Energies 11 02945 g014
Figure 15. Thermophoretic force against the position for different oxidizer Lewis numbers.
Energies 11 02945 g015
Figure 16. Thermophoretic force against position for different fuel Lewis numbers.
Energies 11 02945 g016
Figure 17. Thermophoretic force against position for different porosity factors.
Energies 11 02945 g017
Table 1. Constant parameters used in Equation (7) [36,37].
ParameterValue
k p 1.446538 × 10 4 kj m · s · K
k g 0.3468 × 10 4 kj m · s · K
C k 1.147
C t 2.2
C m 1.146
Table 2. Properties of the biofuel particles and oxidizer [15,41,48].
PropertyValuePropertyValue
ρ p 1000 kg m 3 C p 5.67 kJ kg · K
ρ a 1.2 kg m 3 C a 1.001 kJ kg · K
Q 64,895.4 kJ kg q 0.4
r 12 μ m n 12 Giga
T i n 300 K T v a p 650 K
v 2 y O , + 0.13

