Review

Application of Operando X-ray Diffractometry in Various Aspects of the Investigations of Lithium/Sodium-Ion Batteries

Centre d’excellence en électrification des Transports et Stockage d’énergie, 1806 Lionel Boulet, Varennes, QC J3X 1S1, Canada
*
Author to whom correspondence should be addressed.
Energies 2018, 11(11), 2963; https://doi.org/10.3390/en11112963
Submission received: 28 September 2018 / Revised: 22 October 2018 / Accepted: 24 October 2018 / Published: 1 November 2018
(This article belongs to the Special Issue Electrochemical Energy Conversion and Storage Technologies 2018)

Abstract

:
The main challenges facing rechargeable batteries today are: (1) increasing the electrode capacity; (2) prolonging the cycle life; (3) enhancing the rate performance and (4) insuring their safety. Significant efforts have been devoted to improve the present electrode materials as well as to develop and design new high performance electrodes. All of the efforts are based on the understanding of the materials, their working mechanisms, the impact of the structure and reaction mechanism on electrochemical performance. Various operando/in-situ methods are applied in studying rechargeable batteries to gain a better understanding of the crystal structure of the electrode materials and their behaviors during charge-discharge under various conditions. In the present review, we focus on applying operando X-ray techniques to investigate electrode materials, including the working mechanisms of different structured materials, the effect of size, cycling rate and temperature on the reaction mechanisms, the thermal stability of the electrodes, the degradation mechanism and the optimization of material synthesis. We demonstrate the importance of using operando/in-situ XRD and its combination with other techniques in examining the microstructural changes of the electrodes under various operating conditions, in both macro and atomic-scales. These results reveal the working and the degradation mechanisms of the electrodes and the possible side reactions involved, which are essential for improving the present materials and developing new materials for high performance and long cycle life batteries.

1. Introduction

Lithium-ion batteries (LIBs) have been widely used because of their relatively high energy/power densities, long cycle life and slow self-discharge, whereas sodium-ion batteries (SIBs) are considered as low cost alternatives for large-scale energy storage systems. To fulfil the demands of energy storage in the transportation and power utility industries, batteries with high energy density and long cycle life are needed. Therefore, it is critical to improve present electrode and electrolyte materials as well as develop new ones for obtaining high quality batteries [1,2,3]. The known electrode materials are classified into three main categories: (a) insertion type, including layered oxides (LMTO2, NaxMTO2, MT = transition metal(s)); spinel oxides (LiMT2O4), tunnel type oxides (NaxMTO2) and polyanionic compounds (Li/NaMTPO4, Na3V2(PO4)3, Na2F2(SO4)3); (b) conversion type (S, MF, MCl, M = metal) and (c) alloying type, (Si, Sn and intermetallic compounds) [4,5,6].
LiMTO2 layered oxides, including LiCoO2 (LCO), LiNi1−x−yMnxCoyO2 (NMC) and Li2MnO3-NMC, have high capacity, high voltage, long cycling life and good rate performance, which are widely used in the consumer electronics and electrical vehicles, but these materials show high initial reversible capacity loss, low thermal stability and reduced safety as well as high cost [5,7,8,9,10]. Spinel LiMT2O4 compounds (MT = Mn, Mn+Ni) have high energy density, high voltage and low cost, but their cycling life at high rates is insufficient for practical applications [11,12,13,14]. LiFePO4 is the best known in the LiMTPO4 family with its low cost and high safety despite its low potential among the family members (MT = Mn, Co and Ni) [15,16,17,18,19,20].
NaxMTO2 compounds are the promising cathode materials for SIBs. Single-transition metal P2-NaxMTO2 oxides (see Section 3.1.2 for P2 and O3 structure information) have high ionic conductivity, high capacity and high potential, but poor capacity retention [4]. As a result, various multi-transition metal P2-NaxMTO2 compounds, such as P2-Na0.66Ni0.34Mn0.66O2 and P2-Na0.68Cu0.34Mn0.66O2, are developed to enhance the capacity retention. Multi-transition metal O3-NaxMTO2 oxides, e.g., Na0.9Ni0.4MnxTi0.6−xO2 and Na0.9Cu0.22Mn0.48Fe0.3O2, have relatively high reversible capacities and good retentions [21,22]. Among the poly-anionic compounds, nano-maricite NaFePO4 has a high reversible capacity and capacity retention [23]. In addition, NASICON structured Na3V2(PO4)3 and Na4MTV(PO4)3 possess reversible capacities ≥100 mAh g−1 and good capacity retentions [24,25].
Graphite carbon is a low cost anode material used in commercial LIBs with its moderate energy/power densities and long cycle life despite its interaction with a propylene carbonate-based electrolyte [26] and ~10% uniaxial change along c-axis [5]. Unfortunately, it shows poor electrochemical Na+ storage with the carbonate electrolyte. Hard carbon is considered as a promising anode for SIBs, its nanoparticles and nano-voids lead to reduced and isotropic volume expansion as well as excess gravimetric capacity [5,27,28]. Spinel Li4Ti5O12 is another anode material, its “zero strain” character in LIBs allows high rate and long cycle life; but it reacts with organic electrolyte [29,30]. Recently, new anode materials, such as expanded graphite [31,32], ReS2 [33], textured TiO2 nanotube [34] and N-doped Fe3C@C/Se [35], have been studied, which show high capacities.
The electrolyte is an important factor determining cell stability, cycle life and safety for all batteries [36,37,38,39,40]. Electrolytes are classified as: (a) non-aqueous liquids (e.g., carbonate-based electrolytes; ionic liquids) (b) polymers (e.g., polyethylene oxide (PEO)); (c) ceramics (e.g., Li7La3Zr2O12, K2Fe4O7); and (d) aqueous solutions. Organic solvent-based electrolytes are widely used in rechargeable batteries, but safety concerns arise from their flammable, volatile and toxic natures. Ionic liquids [36,41,42,43,44] are proposed as alternatives to solve the flammability problem, but with a high cost. Recently, great effort is being devoted to “all solid” batteries, polymer electrolytes, PEO [36,45,46,47], having become one of the promising choices. In addition, garnet-type Li7La3Zr2O12 with its room temperature ion conductivity of 10−4 S cm−1 has also attracted a lot of attention [48,49,50].
Currently, although many materials are studied as electrodes for LIBs and SIBs, only a few are used in commercial batteries because most of them cannot meet the requirements of practical applications. Even the batteries already on the market still need improvement, especially the cycle life, which is a function of cycle rate, cycle voltage and environment. The ultimate cause of capacity fade is the microstructure changes of the electrode materials during cycling, such as formation of a solid electrolyte interface, irreversible phase transformation, and the impact of phase transition on capacity retention of different materials. Thus, it is essential to understand the reaction mechanisms of electrode materials under various conditions in order to ameliorate their performance.
A better understanding of the working and capacity fade mechanisms of batteries is the key to improve their properties and increase cycle life. Various ex-situ material characterization techniques are used to examine the pristine and cycled electrodes; among them, X-ray diffraction (XRD) and neutron diffraction (ND) are two of the most important techniques to analyze and determine the structure change of the crystalline phases in the electrode materials [51,52,53]. However, the ex-situ methods cannot provide real-time information of the electrodes during cycling, which is indispensable for the comprehension of the working and degradation mechanisms of the batteries. The characterization techniques have advanced significantly in the past few years, with operando/in-situ (operando and in-situ will be used interchangeably hereafter) methods widely applied in monitoring the real-time dynamics of electrodes in batteries under various operating conditions. The phase transformation and crystal structure change during cycling are investigated via operando XRD [12,54,55,56,57,58,59,60] and operando ND [61,62,63,64,65]. The former is widely used because of equipment availability and relatively simple operating procedures; in contrast, ND is not as popular due to the expensive neutron sources and high maintenance cost, despite its advantage of high penetration, high signal-to-noise ratio and high sensitivity to the light elements (such as lithium) as compared to XRD. Operando X-ray diffraction-computed tomography (XRD-CT) [66] and operando hard X-ray microscopy [67] are employed to track space-resolved information, the former probes the crystal structures and transformations at millimeter scale, whereas the latter reveals the dynamic phase transformation process on both single and multi-particles. The diffraction technique measures the collective properties of the electrode, whereas the complimentary information of the local and surface/interface structures, such as the oxidation state of ions, coordination number, average interatomic distances, and electronic configuration changes during the electrochemical process are obtained by operando X-ray absorption spectroscopy (XAS) [68,69,70,71,72,73], Raman spectroscopy [74,75,76,77,78] and Fourier-transform infrared (FTIR) [79,80,81,82]. The electrode changes occurring under working conditions are also observed via operando scanning electron microscopy (SEM) [83,84,85] and (scanning) transmission electron microscopy ((S)TEM) [86,87,88,89,90,91] at the micro- and nano-scales and analyzed with energy dispersive X-ray spectroscopy (EDS), electron energy loss spectroscopy (EELS) and electron diffraction. The information on crystal structure, phase transformation, multi-phase interface behavior, element location and distribution are revealed by operando measurements or multi-operando measurements, which enable researchers to understand the operation and failure mechanisms of electrodes as well as to improve the structure of the materials and enhance the performance of the batteries. Of all the operando techniques, X-ray diffraction is the most widely used due to readily availability of the instrument, simple cell design and the ability to: (1) resolve crystal structure and follow phase transformations [92,93,94,95,96,97,98,99,100]; (2) determine stress induced in electrodes during cycling [101]; (3) probe thermal stability [102,103,104,105]; (4) monitoring phase formation during heat treatments and provide information on the optimization of synthesis processes [106,107]. In the present work, we focus on the recent advances in operando XRD to explore the reaction mechanisms of lithium and sodium electrode materials with olivine structure, layered structure, spinel structure, tunneled structure, as well as to study the thermal stability of the electrodes and material synthesis process.

2. Operando X-ray Diffraction Technique

The operando XRD, both reflection and transmission modes are used to monitor crystal structure change and phase transitions of electrodes during the electrochemical process. Various in-situ cells were designed [108,109,110,111,112,113,114] with X-ray transparent windows, such as a beryllium disk [54,104,115], polymer films (Kapton, Mylar) [116,117] and aluminum foil [109,110]. A beryllium window has the advantages of maintaining contact between cell components and is nearly 100% X-ray transparent due to the rigidity of the metal disk and low X-ray absorption. However, beryllium corrosion was observed at voltage > 4.2 V [54,118], and it is toxic and expensive. On the other hand, Kapton, Mylar and aluminum are stable, low cost and non-toxic. They also allow X-rays to pass through with certain absorption, but it is difficult to keep cells with a large area window pressurized due to their flexibility. Aluminum foil is used as a current collector in many cases; the same aluminum foil is also used as an X-ray window to reduce undesired diffraction peaks in the spectra. The evolution of both cathode and anode can be monitored simultaneously via high-energy synchrotron X-rays in transmission mode [112,114,119,120,121,122].

3. The Operando XRD Studies in Li+/Na+ Batteries

3.1. Reaction Mechanisms

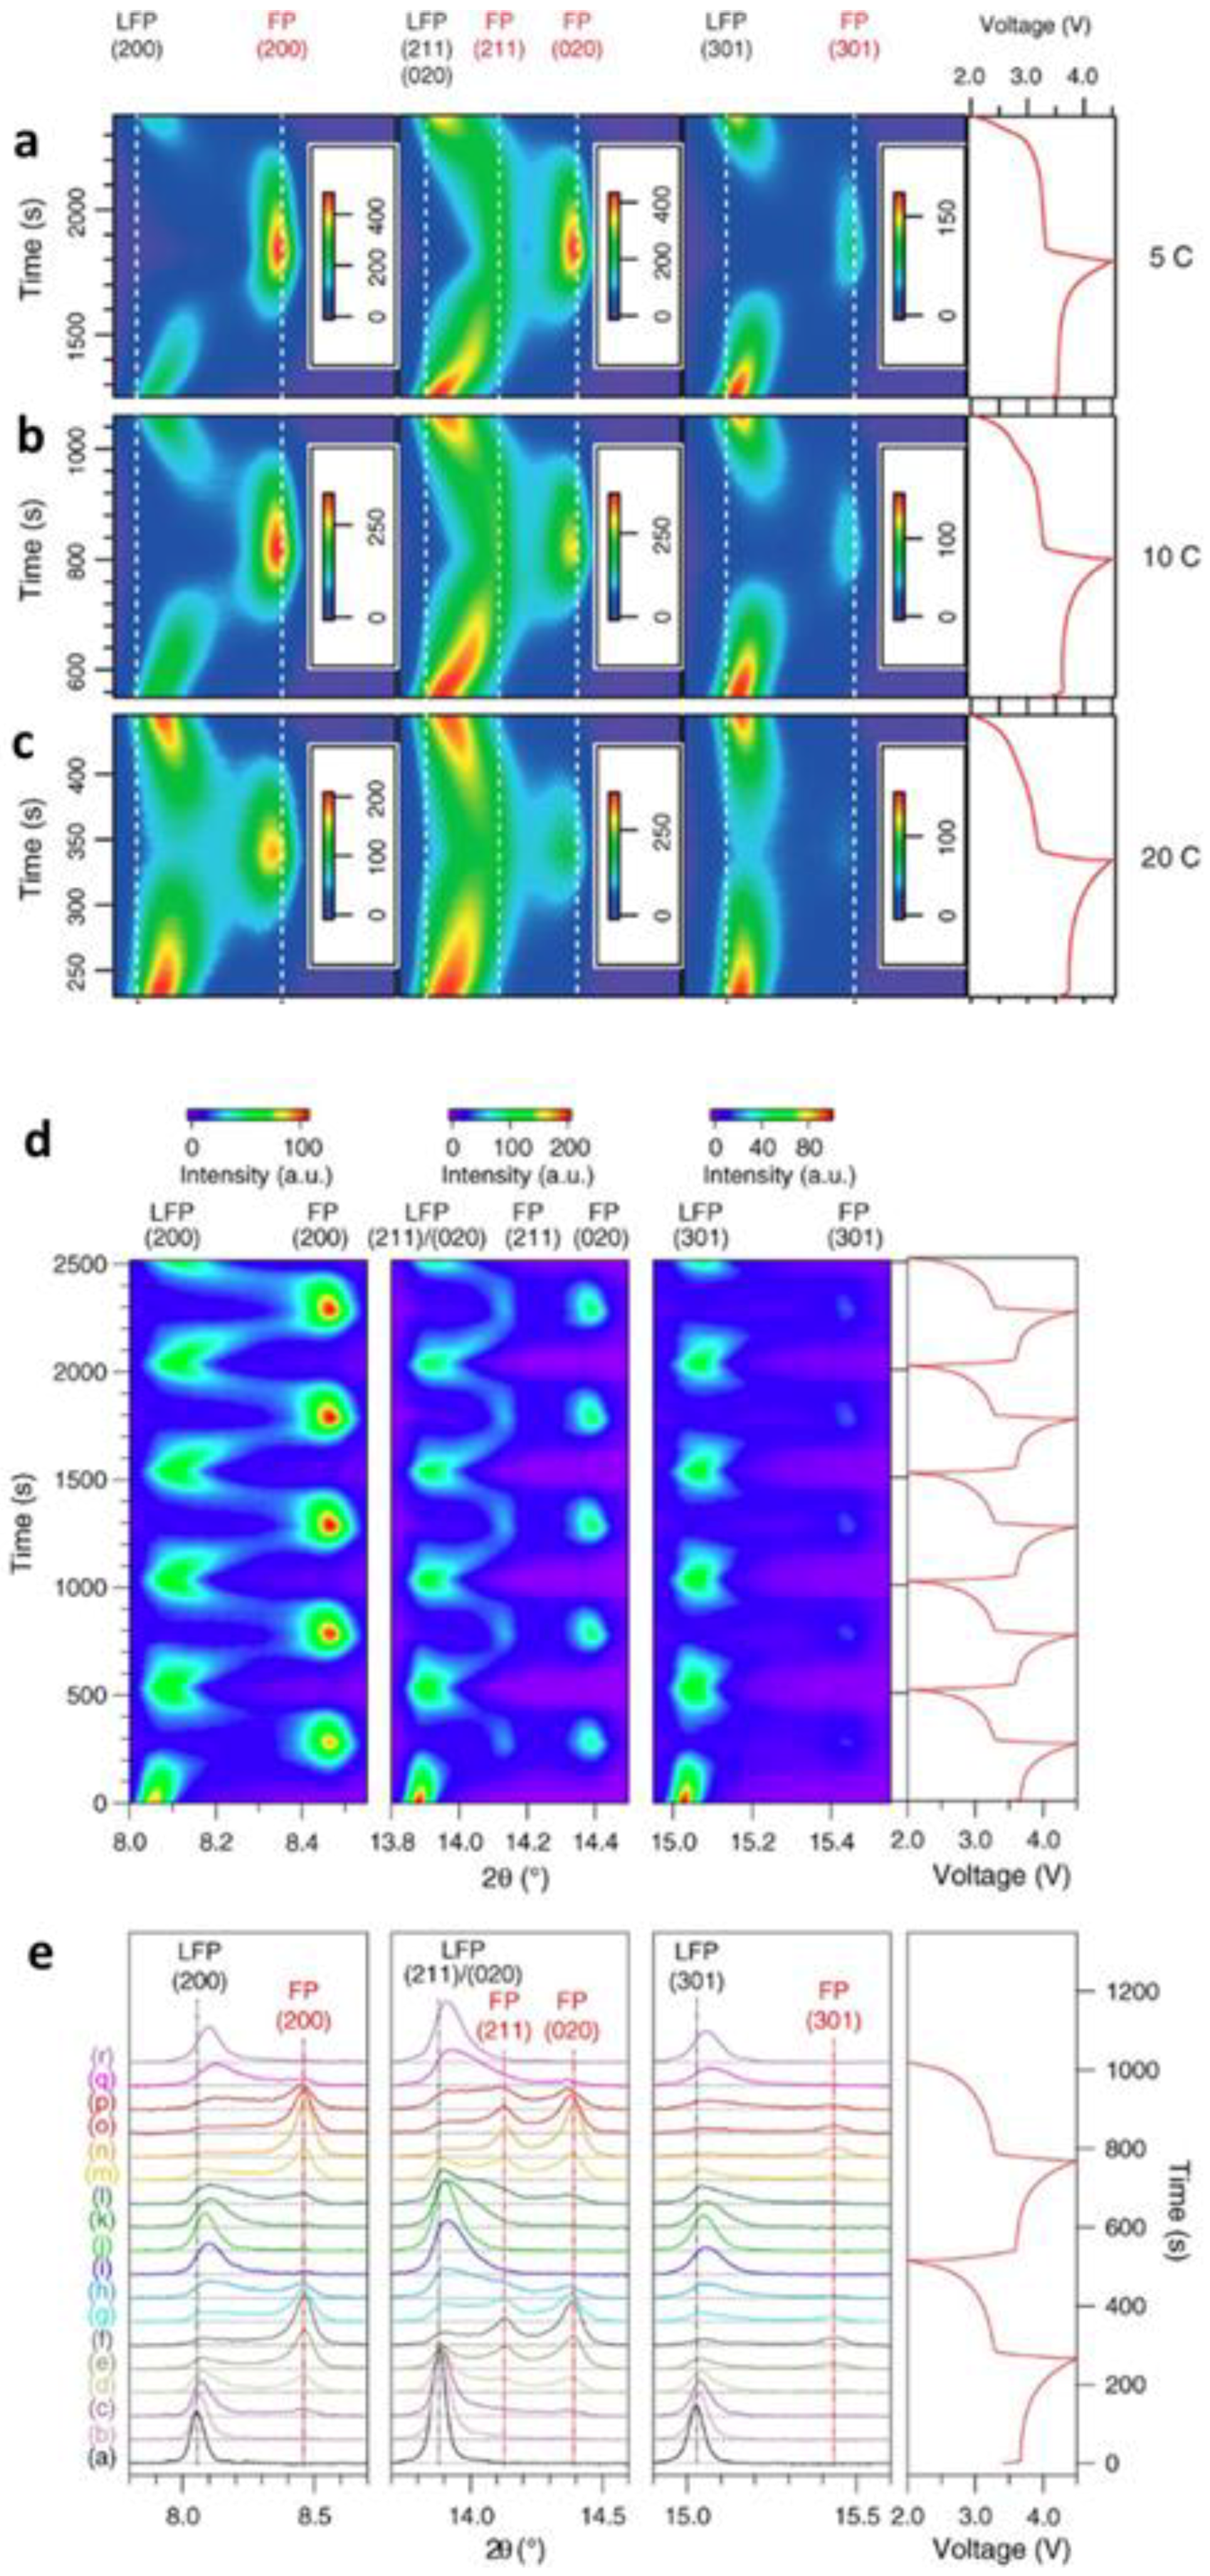
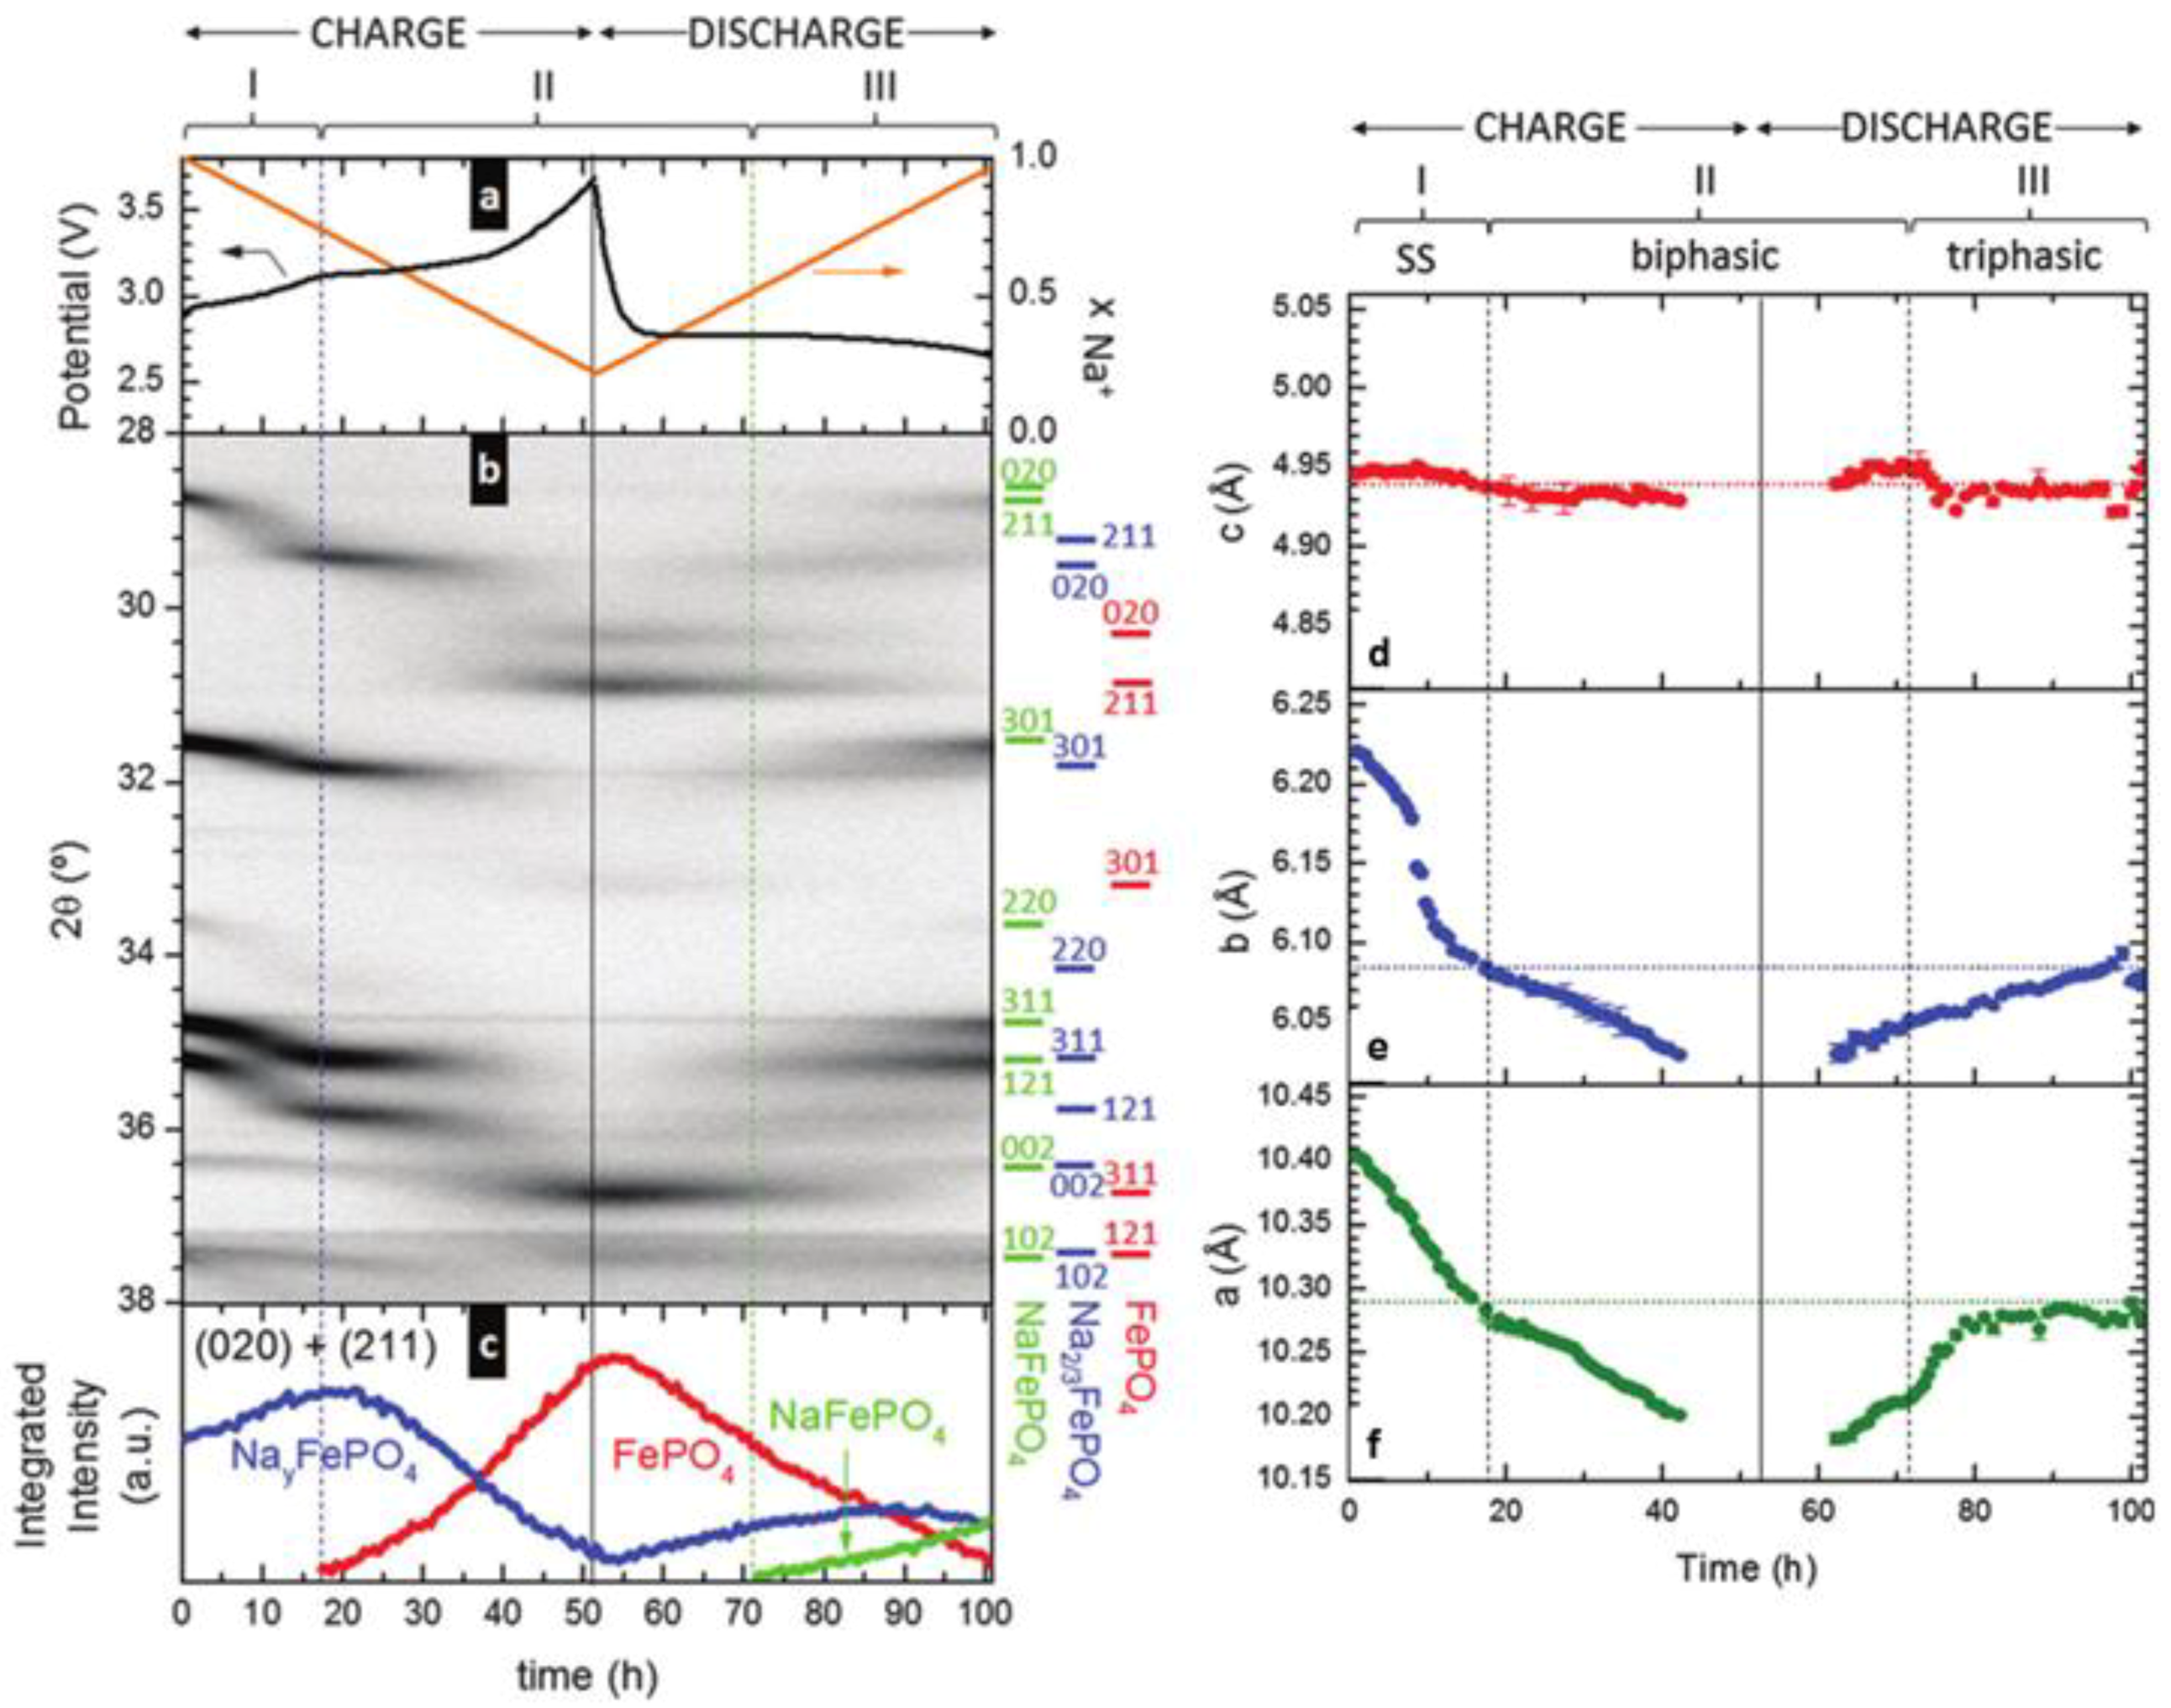
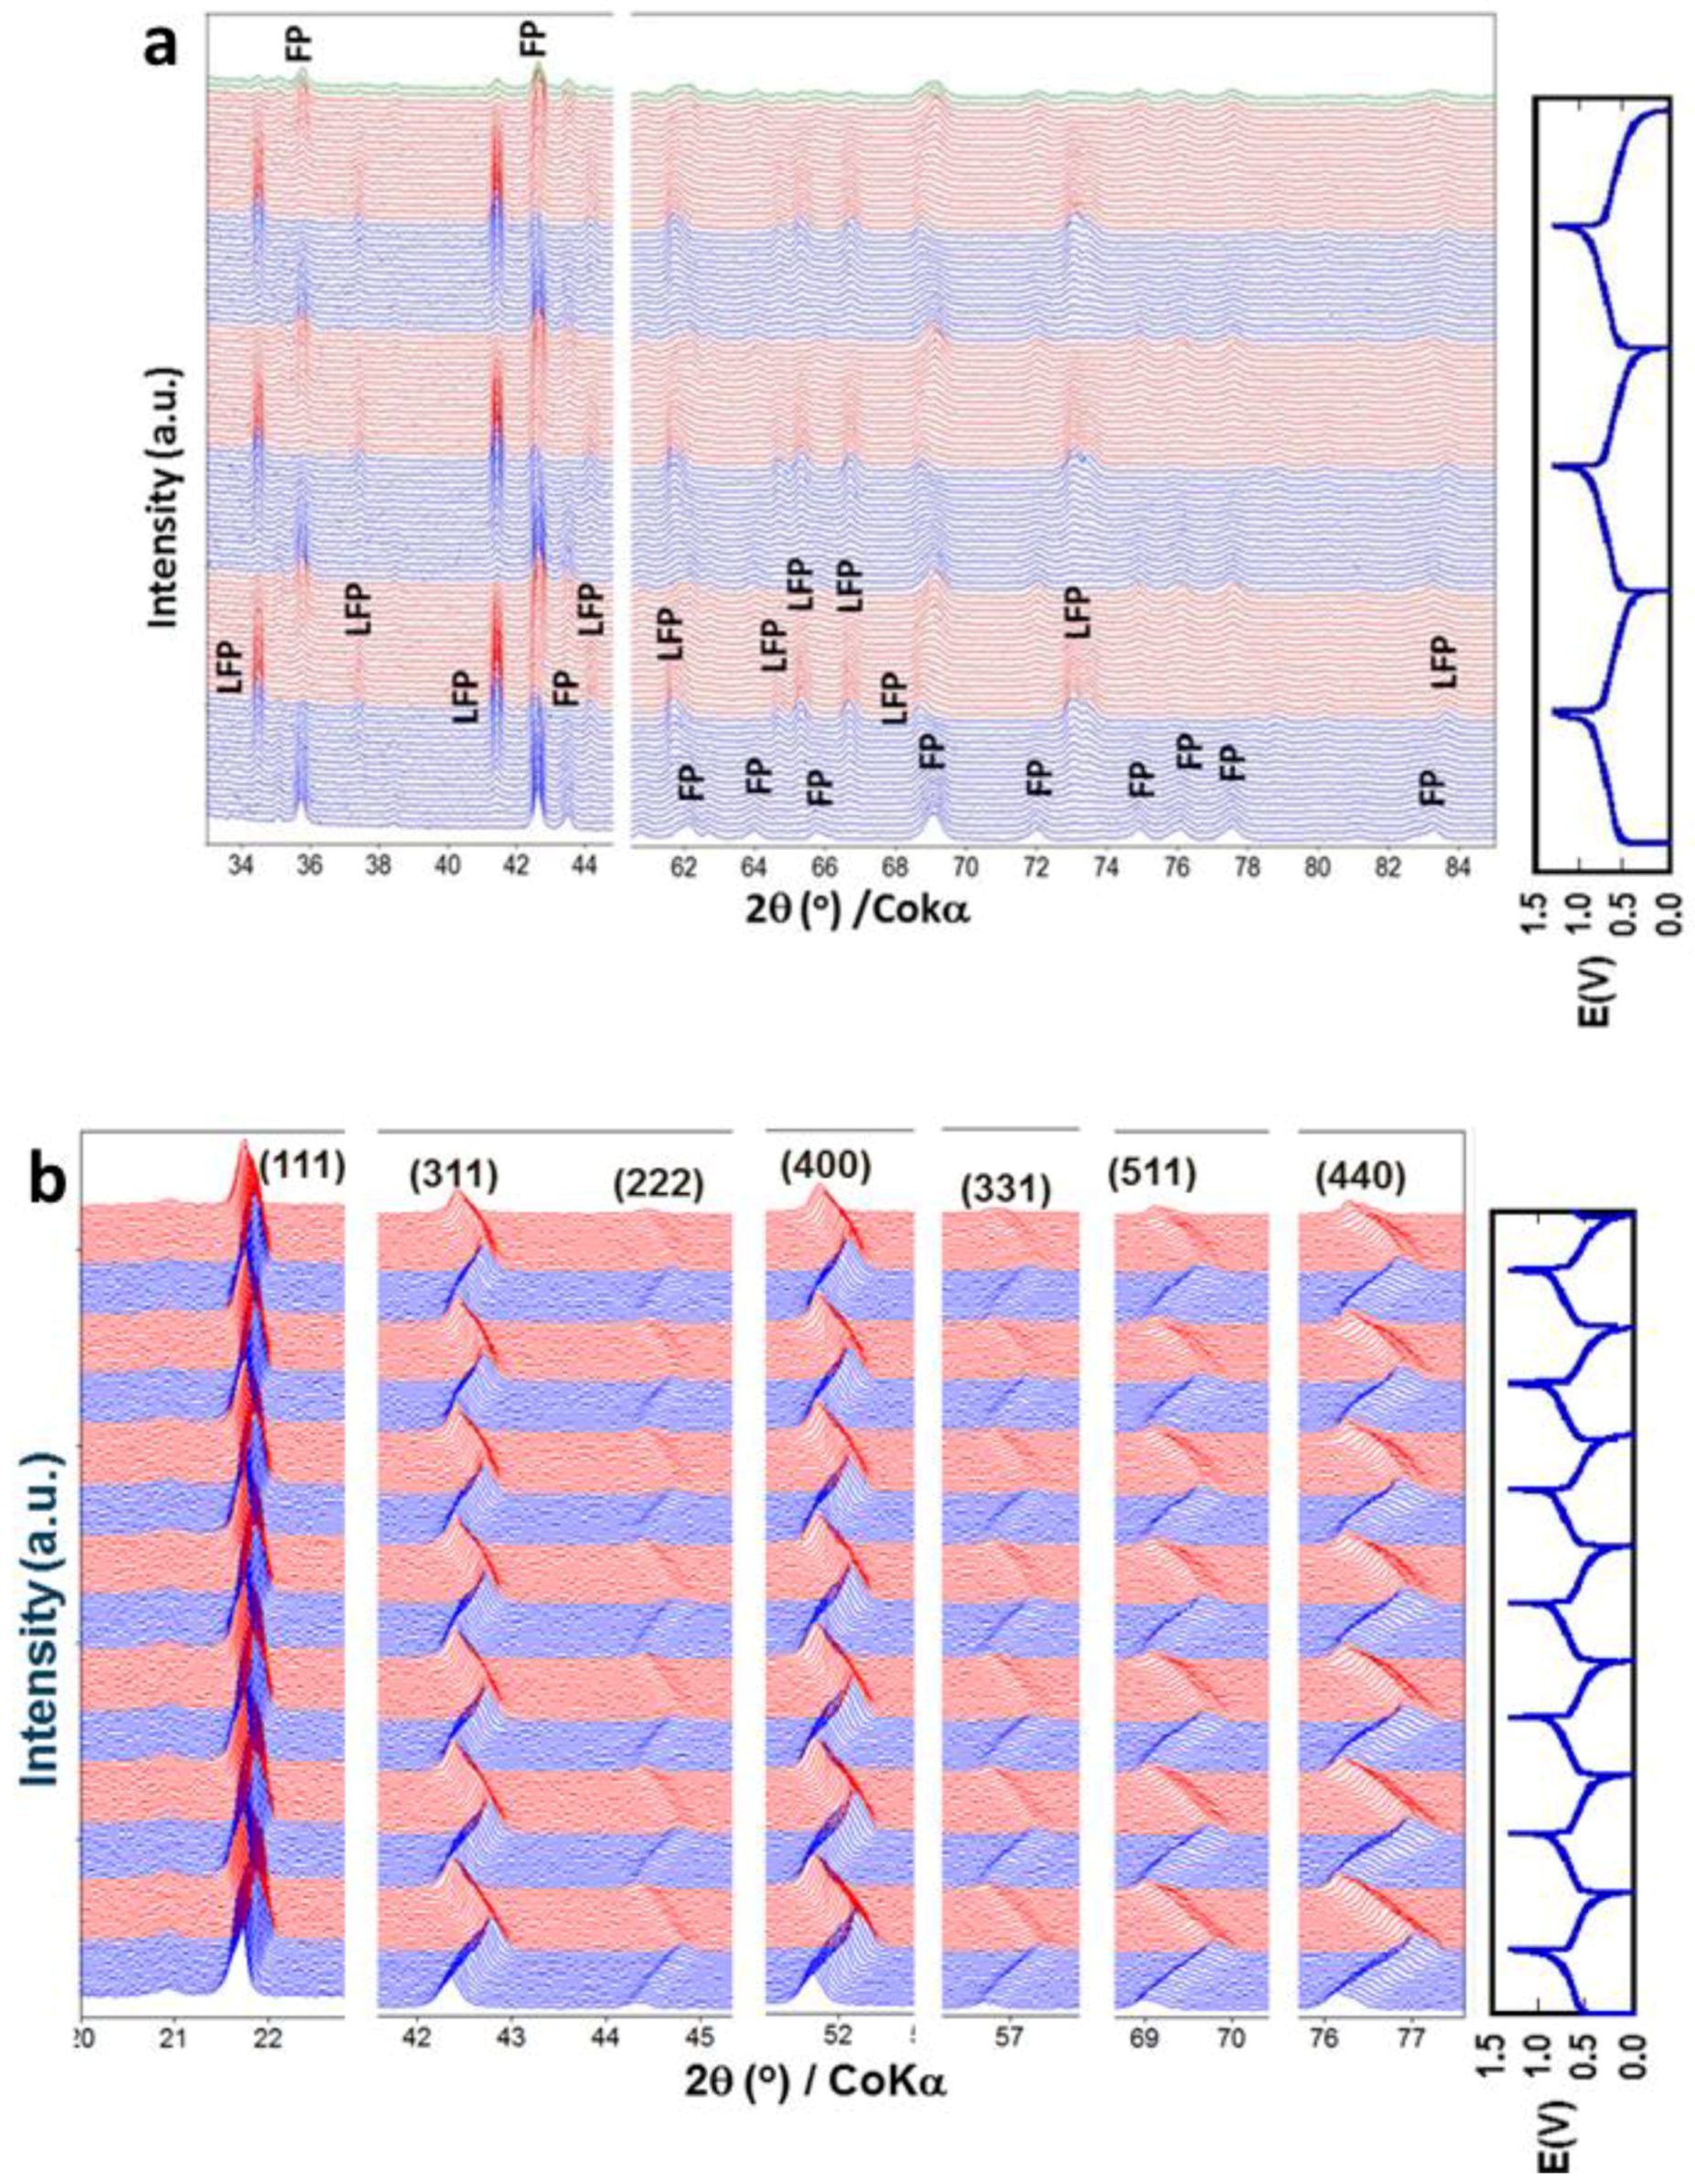
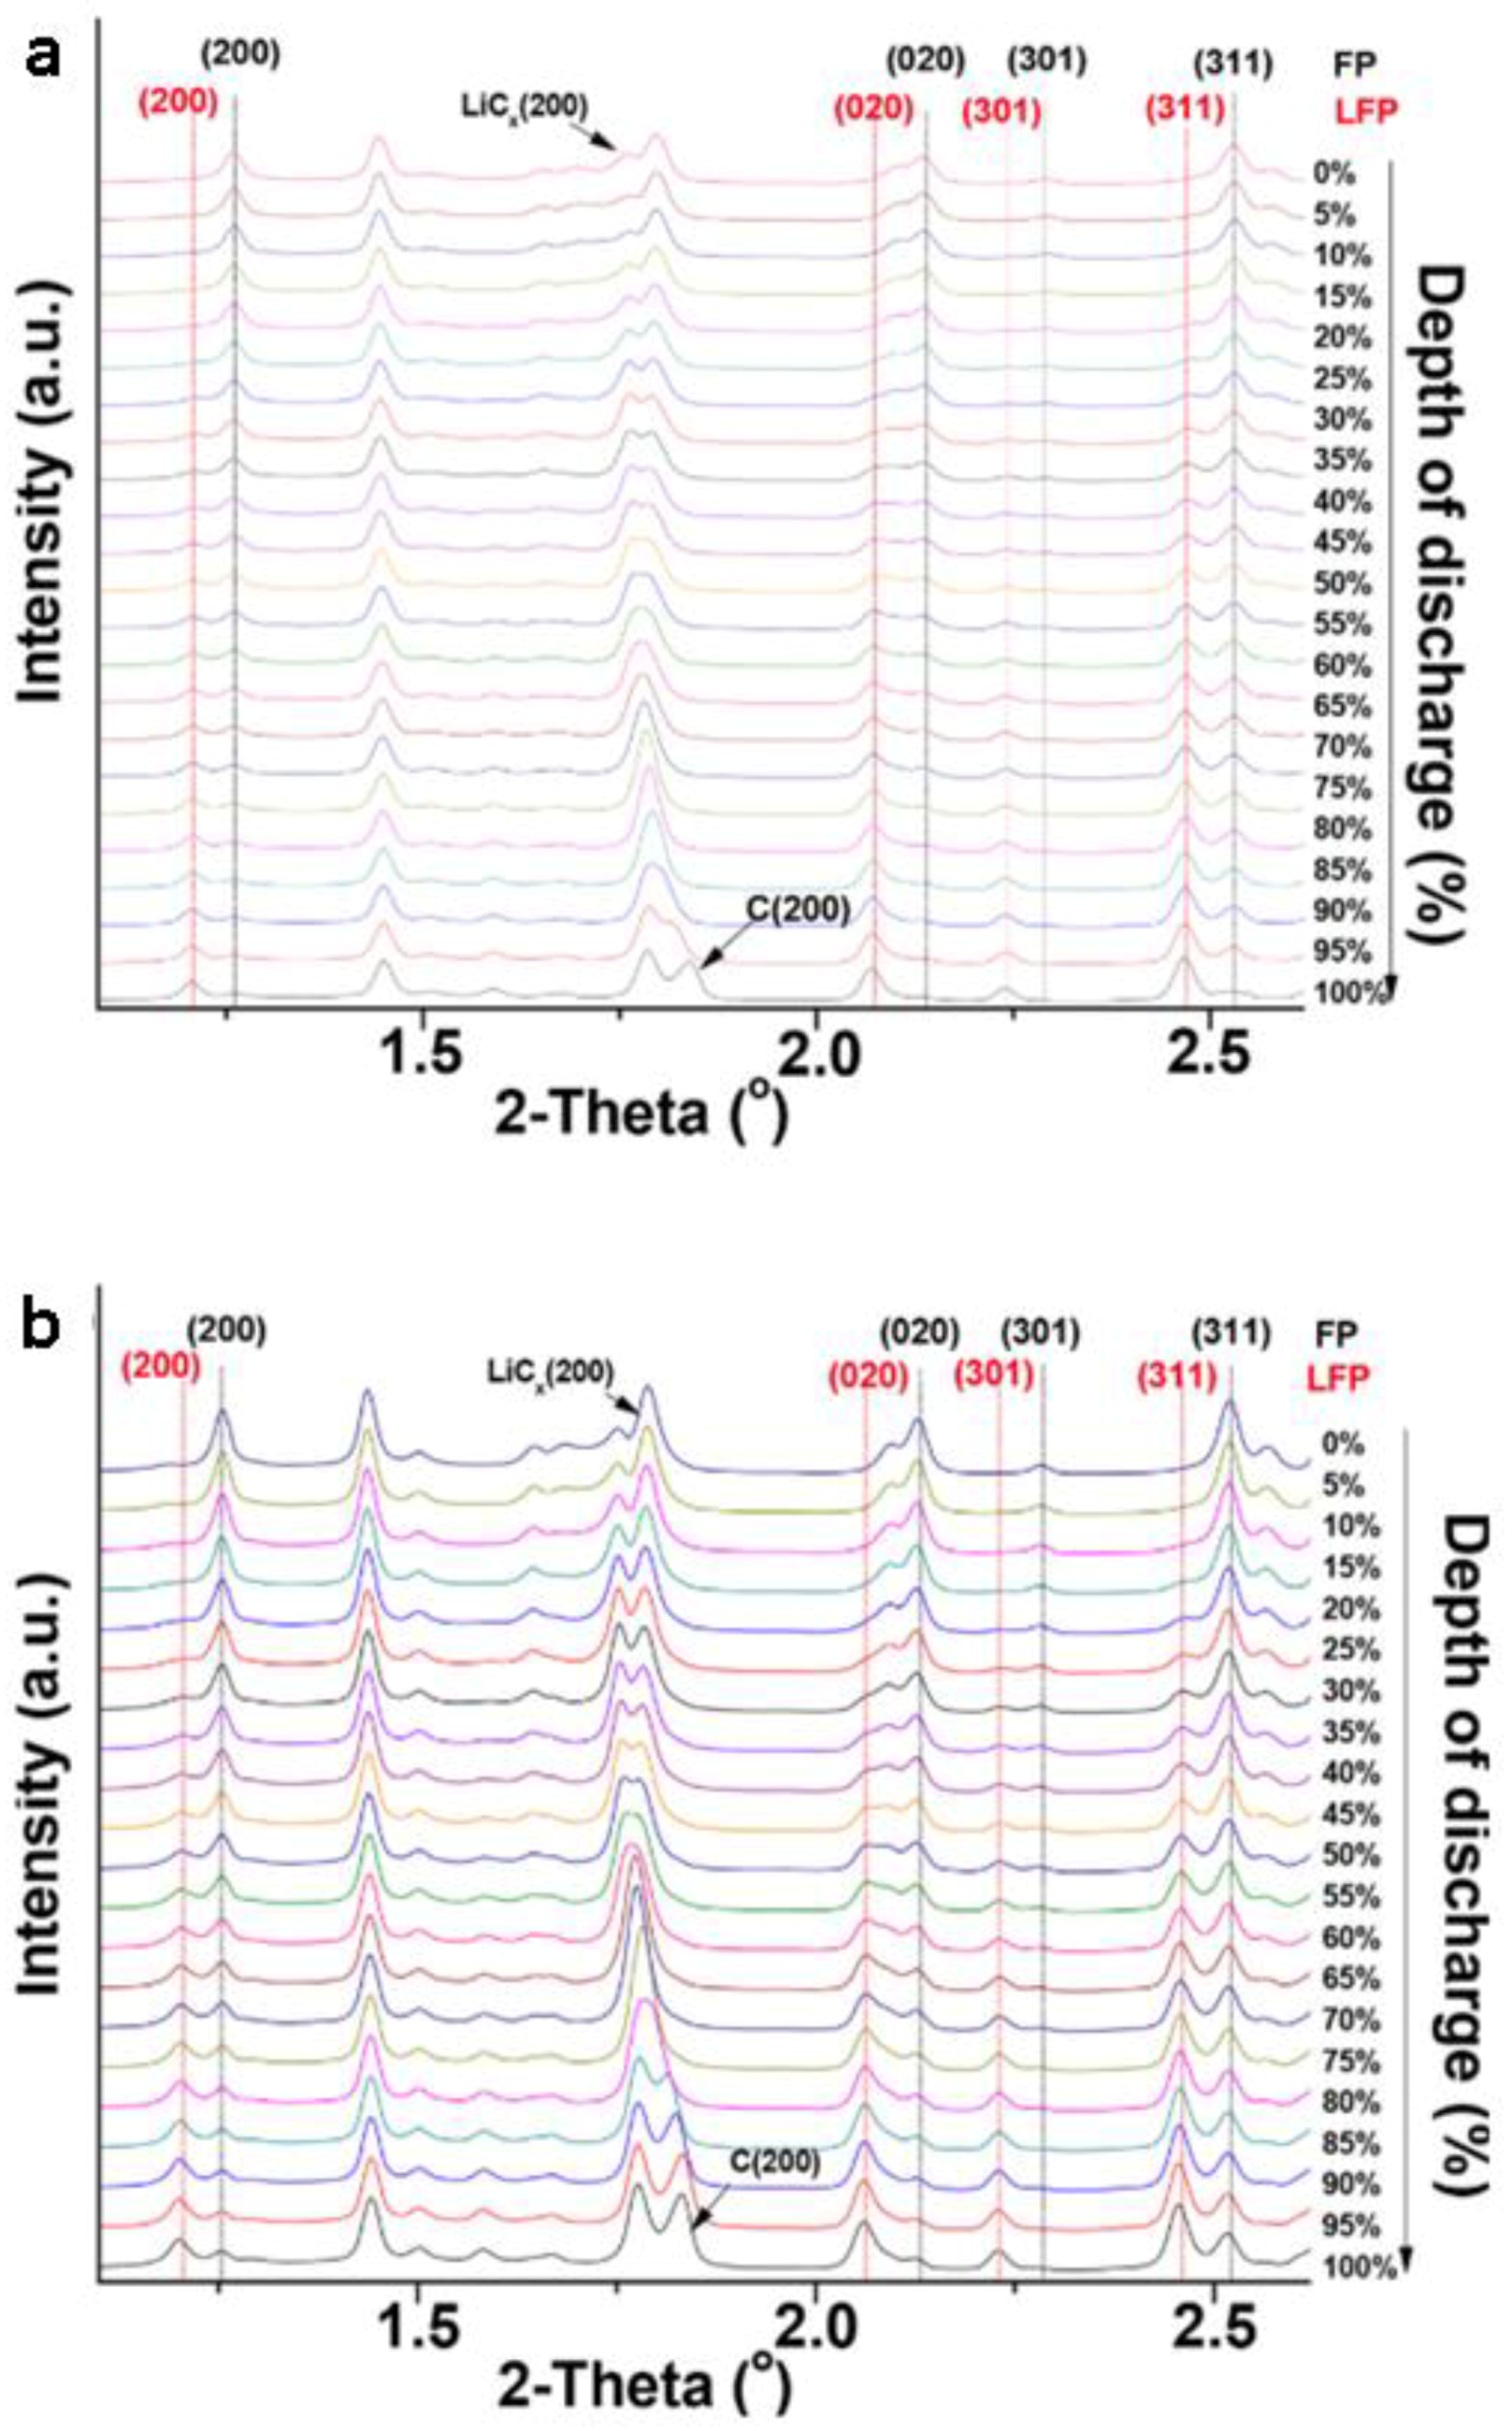
3.1.1. Olivine Structured Cathodes of LiFePO4 and NaFePO4

1. LiFePO4
LiFePO4 (LFP) is a promising cathode material with reasonable high capacity, superior cycle-life, structural and thermal stability, as well as low cost, non-toxicity and high safety despite its low operating voltage and low conductivity [123,124,125]. LFP and its charging end product FePO4 (FP) have olivine structure, with orthorhombic unit cell and Pnma space group (S.G.). Lithium-ion intercalation and de-intercalation occur in one dimensional channels along the [010] direction [91,126,127]. The two-phase reaction mechanism was first proposed due to the very narrow single-phase range near the stoichiometry compositions of Li1-βFePO4 and LiαFePO4, with β and α varying from 0.032–0.05 and 0.032–0.11 at room temperature, respectively [128,129,130]. The two-phase mechanism with LFP and FP domains that are separated by a phase boundary is supported by both ex-situ and in-situ TEM observations [91,131,132] and in-situ XRD results [16,100,133,134]. Detailed studies on the LiFePO4 to FePO4 transition demonstrate that the reaction mechanism not only depends on the material intrinsic properties, but also depends on the particle size and orientation [135,136,137,138,139], the cycling rate [140,141] and the strain [142,143] etc. Thus, the two-phase reaction is only applicable under certain conditions. Operando XRD is employed to explore the LFP–FP phase transformation mechanisms and their relation to material properties and operating conditions.
● The working mechanism of LFP under the quasi-equilibrium condition
In-situ XRD was conducted on LFP cycled at a low current of 2.3 mA g−1, which is close to the thermodynamic equilibrium condition [133]. Figure 1a shows that the starting cathode contains only LFP, but FP starts to form and grow as charge proceeds; only a small amount of LFP is left at the end of charge. During discharge, the LFP peaks grow at the expense of FP, and no FP peaks are observed at the end of discharge. The cycling is reversible, and only LFP and FP are observed, which is consistent with the two-phase reaction mechanism. In addition, the two-phase mechanism is also supported by in-situ high resolution TEM (HRTEM), Figure 1b–d show the migration of the phase boundary between FP and LFP along the [010] direction during lithiation and the dislocations induced at the phase boundary [91].
● The effect of particle size on the working mechanism
Meethong et al. [144] studied the size-effect on the lithium miscibility gap in Li1−βFePO4 at slow rate of C/50, and found the gap shrank as the particle size decreased. The solid-solution limits β and α (LiαFePO4) increased from ~0.03 to ~0.12 and ~0.01 to ~0.12, respectively, as the average particle size varied from 113 to 34 nm; similar results are obtained via neutron diffraction and theoretical calculation [138]. These results suggest that the phase transformation mechanism with small particles may be different from large particles, and operando XRD measurements have confirmed this proposal. Li et al. [137] monitored the phase transformations of [100] oriented LFP cathodes with three thicknesses in the [100] direction at a rate of C/5. Figure 2 focuses on the characteristic peaks (020)/(211) of LFP and FP.
During charge, the (020)/(211) of 12-nm-LFP continuous up shifts. At the end of charge, two peaks labelled as (211) and (020) correspond to FP phase. Upon discharge, the two FP peaks down shift continuously, eventually, the (020)/(211) peaks of LFP return to the initial position at the end of discharge. The continuous shift of the diffraction peaks indicates that the phase transformation is similar to that of the solid solution. For the thick [100]-LFP (46 nm), the positions of the (020)/(211) peaks of LFP are almost unchanged during charge, except for an initial small shift. The (020) and (211) peaks of FP are seen at Li+ < ~0.7; they are at nearly constant position until Li+ ~ 0.2, and the upshift of the peaks are observed between 0.1 < Li+ < 0.2. The main part of the phase transformation of this thick grain LFP follows a two-phase reaction, whereas the solid solution mechanism plays a role near the stoichiometry LFP and FP owing to the corresponding small solubility regions. This study demonstrates that the LFP-FP transition mechanism changes from two-phase to single-phase transition as the particle size decreases. This single-phase reaction path is also predicated by theoretical calculations under non-equilibrium conditions [145,146] and is evidenced by in-situ XRD measurements, as described below.
● The effect of cycling rate on the working mechanism
The influence of cycling rate on the reaction mechanism was investigated on nano-LFP (average size 186 nm) at rates of 5C–20C [141]. Figure 3a–c show the image plots of diffraction patterns for (200), (211)/(020) and (301) peaks of both LFP and FP with cells cycled at 5C, 10C and 20C, respectively. The positive intensities are clearly seen between LFP-(200) and FP-(200) as well as other diffraction lines, and the intensities increase with cycling rate. These positive intensities indicate the existence of phases with lattice parameters deviating from the stoichiometric values under equilibrium conditions. Figure 3d,e display the image plot and selected diffraction lines collected at 10C rate for multi-cycles. At the beginning of the first charge, all the diffraction peaks of LFP are symmetrical; they start to shift and broaden asymmetrically toward the high two theta direction as charging proceeds, meanwhile the FP phase is seen with broad peaks. At the end of discharge, neither the peak position nor the peak shape of LFP returns to their original states, suggesting the formation of a solid solution with less Li content and smaller unit cell than the initial LFP. These results illustrate that the LFP-FP transition not only depends on particle size, but also on cycling rate which is proportional to the applied current. The phase transition of nano-LFP goes through a non-equilibrium solid-solution path at high rate, which confirms the prediction of suppressing phase separation at high current. The LFP-FP transition occurs through a continuous change in structure instead of forming a distinct FP and avoids major re-arrangement of the crystal structure. This non-equilibrium single-phase transition reduces the stresses induced at the two-phase boundary, and interface energy. Thus, the energy barrier for phase transformation is reduced, which makes the high-rate cycling feasible.
● The effect of temperature on the working mechanism
The many in-depth studies on the LFP↔FP phase transition at room temperature provide a reasonably clear picture of the reaction mechanisms as well as the factors that affect the reaction paths. However, the performance of LFP at low temperature still cannot meet the requirements of many applications; therefore, it is necessary to comprehend the low temperature behavior to enhance battery performance. Yan et al. [147] have probed the phase transformation between −20 °C and 40 °C with operando XRD. Figure 4 demonstrates the evolution of XRD spectra of the nano-LFP (average size ~43 nm) electrodes cycled at 20 °C and 0 °C at three different rates, respectively. At 20 °C with scan rate of 1.4 mV/s, the XRD spectra (Figure 4d) show that the position of the LFP peaks are constant, and their disappearance is accompanied by the appearance of FP peaks during charge. The process is reversed during discharge. The image plots of the diffraction lines show almost no positive intensities between LFP and FP peaks (Figure 4a). This behavior is well-described by the two-phase reaction. As the scan rate is raised to 4.2 mV/s at the same temperature, certain positive intensities can be observed on the image plots in 41.7° < 2θ < 42.8° (Figure 4c), implying the solid-solution mechanism plays a role in the transition. This phenomenon is more obvious when the cell is cycled at 0 °C at the same fast rate. The spectra in Figure 4l show the asymmetrical broadening of (211), (311), (121) reflections; the extreme case is that the (311) peaks of LFP and FP are partially overlapped. These results suggest the existence of intermediate phases with lattice parameters between those of LiFePO4 and FePO4 at equilibrium state. The formation of the intermediate phases at 0 °C is due to the lower Li+ diffusivity at this temperature. The LFP-FP phase transformation is realized via the solid-solution route which is energetically favorable owing to the reduced interfacial and strain energies at the phase boundary.
In summary, the operando XRD measurements have revealed that the phase transformation mechanism of LFP depends on its particle size, the cycling rate/applied current and working temperature. With large particle size, slow cycling rate and relative high temperature(~room temperature), the transformation is dominated by the two-phase mechanism, whereas the solid-solution path is in control with nano-size particles, fast rate and relatively lower temperature (~0 °C).
2. NaFePO4
The understanding of LFP-FP phase transformation is well advanced with many in-depth studies on this system, especially with operando techniques. In contrast, the phase transition of its sodium counterpart, NaFePO4 (NFP), with higher theoretical capacity than other Fe-based poly-anion cathode materials, still needs to be explored in details. Galceran et al. investigated the phase transformation between NaFePO4 and FePO4 with operando XRD [148]. The average particle size of his electrode particles is 800 nm; the in-situ cell is cycled at a rate of C/66, its first cycle results are shown in Figure 5. Figure 5a plots the voltage and Na+ content versus time, which, unlike LFP, the voltage profile is asymmetrical.
Two voltage plateaus, separated by a voltage step at Na+ ~ 0.7, are seen on charge, whereas only one plateau is evident on discharge. Figure 5b is the image plot of the XRD spectra with (hkl) of the phases participated labelled on the right axis. At the initial stage of charge, a continuous shift of the NaFePO4 peaks, mostly to the high two theta direction, is observed, which is an indication of a solid-solution reaction; with further extraction of Na ions to Na+ ~ 0.7, a new intermediate phase forms, with sodium content ~ 0.7 and is identified as Na2/3FePO4 [149]. Continuing the extraction of Na+, FePO4 peaks appear and grow at the expense of the intermediate phase of Na2/3FePO4 until the end of charge. This two-phase reaction continues to hold to the first stage of the discharge process. At this stage, Na2/3FePO4 is formed and increased while FePO4 is consumed. Nevertheless, before reaching mid discharge, NaFePO4 peaks are detected together with the FePO4 and Na2/3FePO4 reflections; upon further discharge of the cell, the NaFePO4 increases mainly at the expenditure of FePO4. Therefore, three phases coexist until the end of discharge. In other words, the charge-discharge cycle can be divided into three stages, labelled as I, II, III at the top of Figure 5a. Stage I follows a solid-solution mechanism, whereas the two-phase reaction mechanism holds in stage II. The solid-solution and two-phase regions are separated at Na+ ~ 0.7 during charge, which is in agreement with the phase diagram of olivine NaFePO4 [150], and finally, in stage III, three phases participate the reaction. Figure 5c is a plot of the sum of the integrated intensities of the (020) and (211) peaks of NaFePO4, NaβFePO4 (0 < β < 1) and FePO4, which act as an indicator of the amount of phase. Figure 5d–f present the evolution of the cell parameters of NaxFePO4 during charge and discharge; the sudden change of the lattice parameters corresponds to the change of the reaction mechanisms. The phase transformation mechanism between olivine structured NaFePO4 and FePO4 is different from that of LiFePO4 ↔ FePO4; noticeably, the asymmetric reaction path between charge and discharge, and the three-phase reaction during the discharge. In addition, the solid-solution region (1 ≥ Na+ ≥ 0.7) near stoichiometry NaFePO4 is much greater than that near LiFePO4 under equilibrium conditions. In the LiFePO4 system, the size of the solid-solution region and phase transformation path depends on the particle size and current applied during cycling, as well as temperature, the effects of these factors on the Na+ solubility in NaFePO4 and phase transition mechanism need to be explored in future studies.

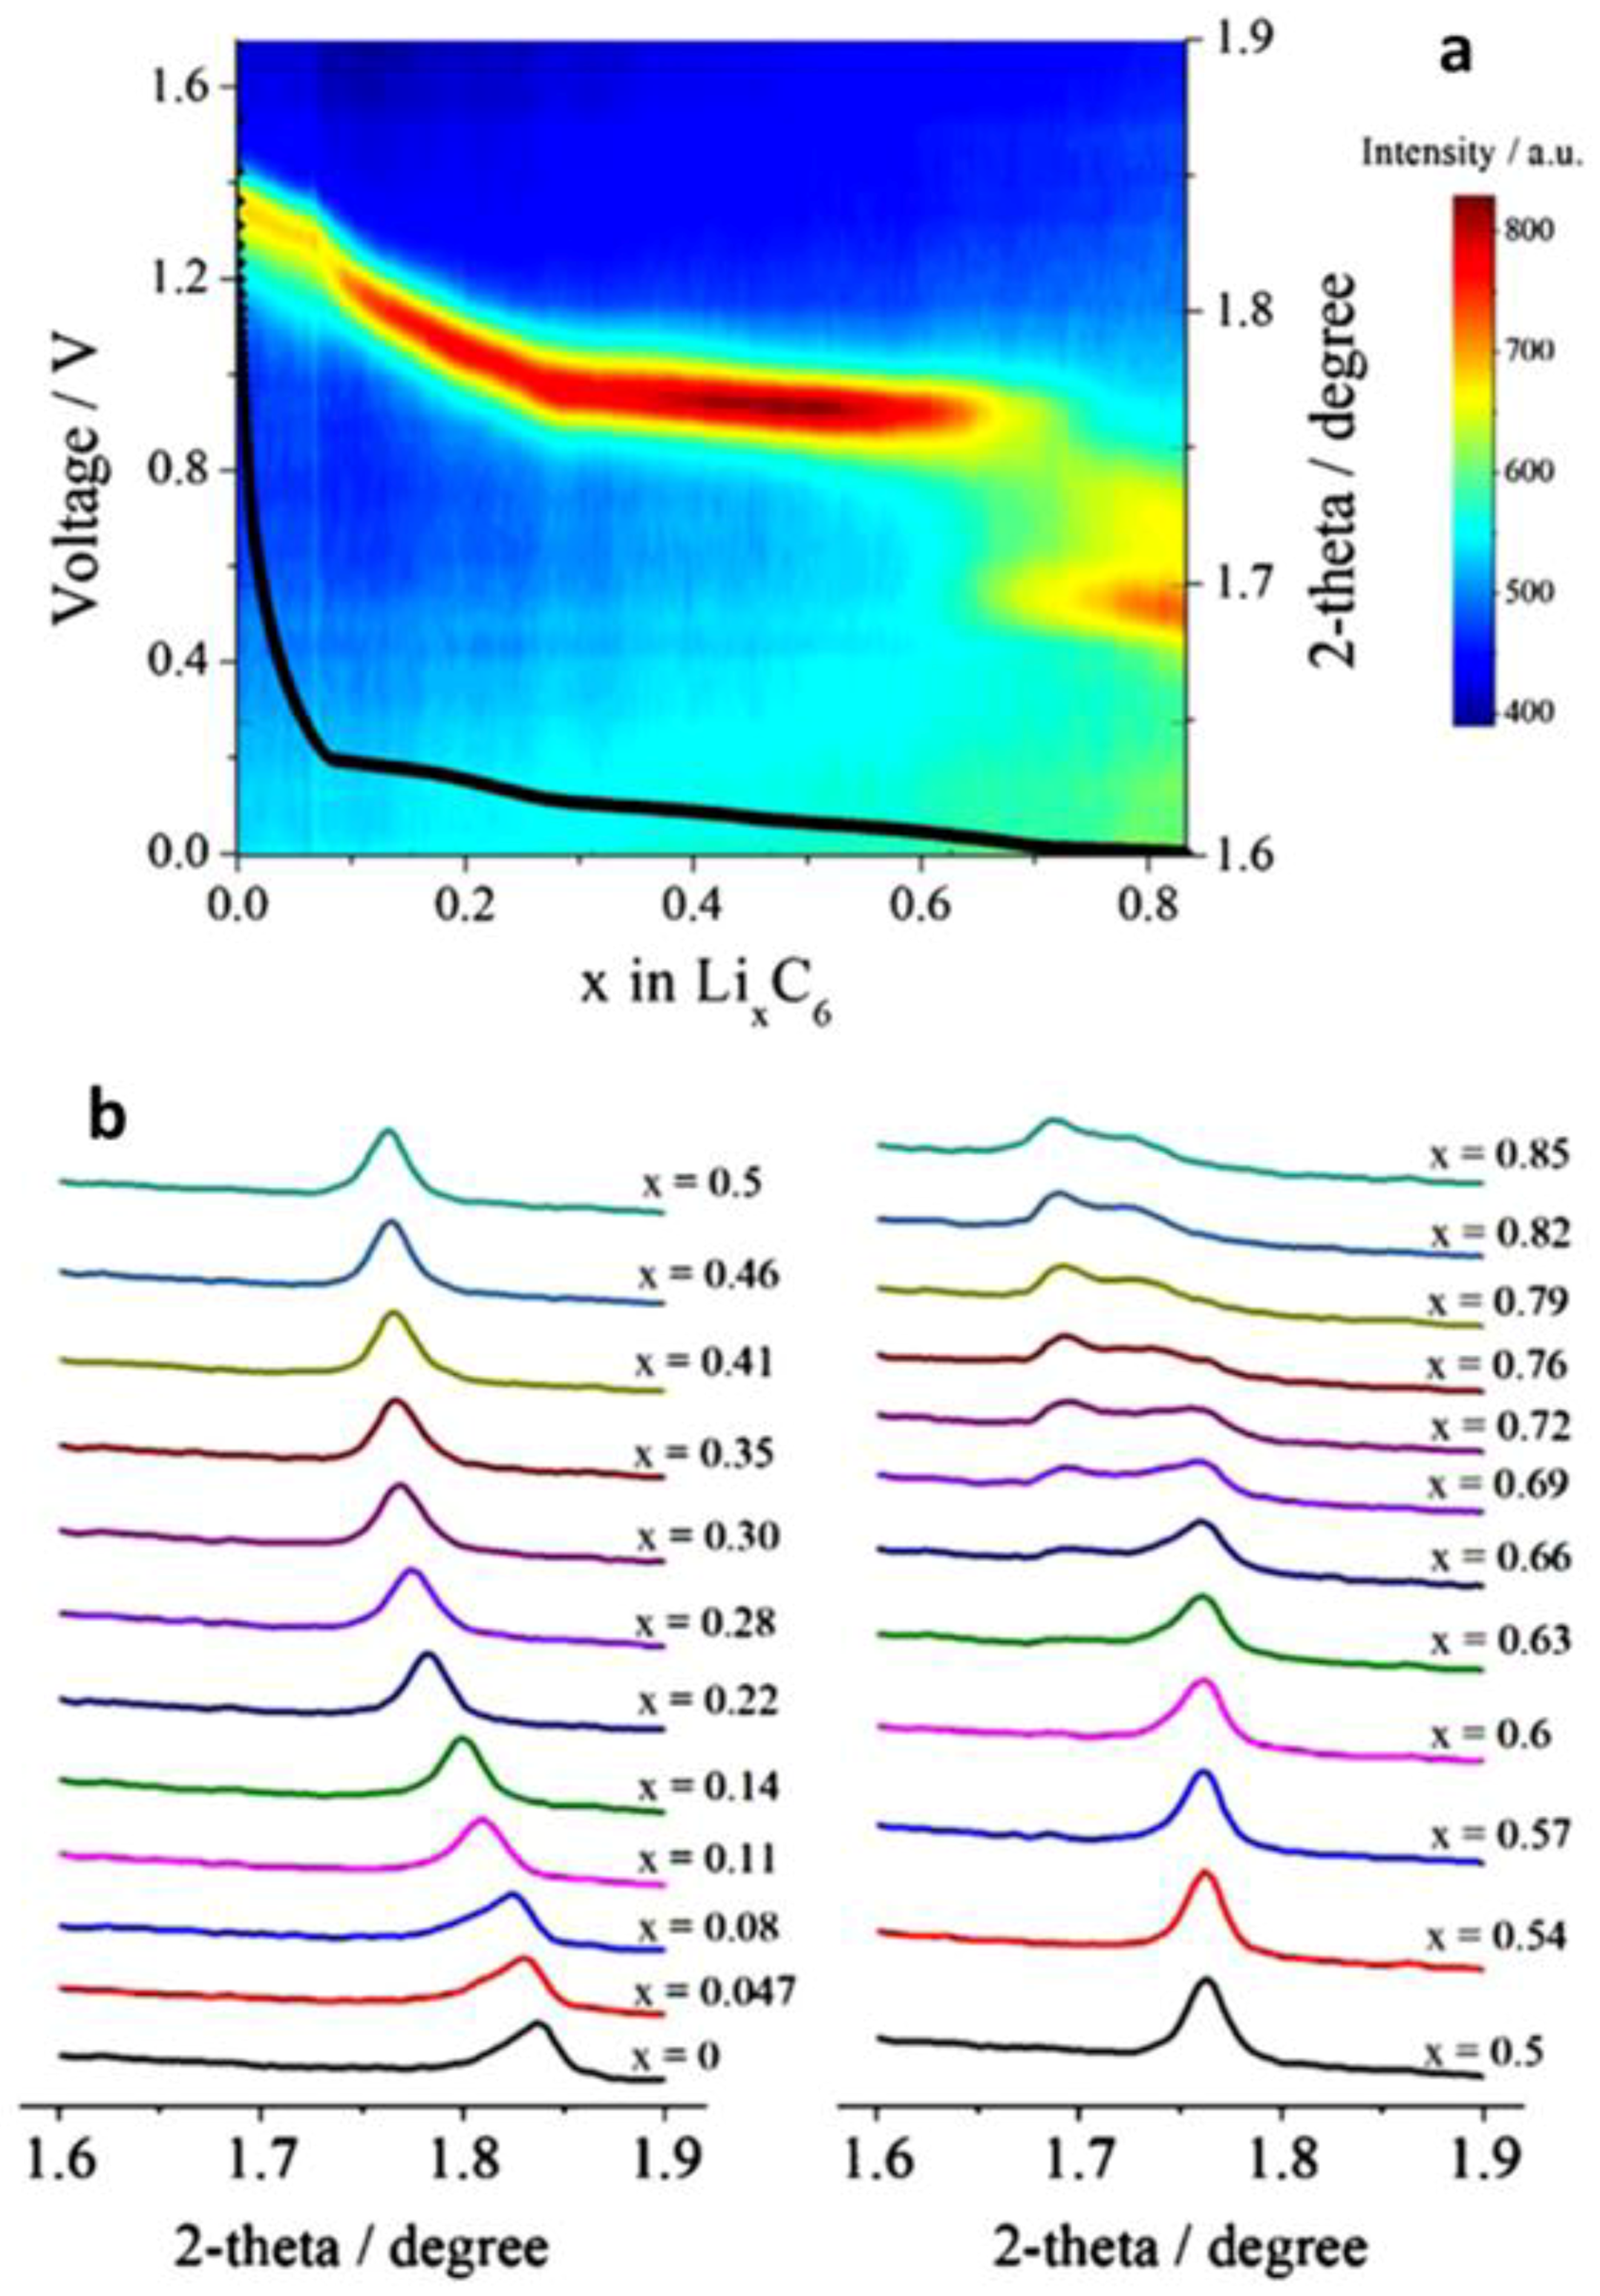
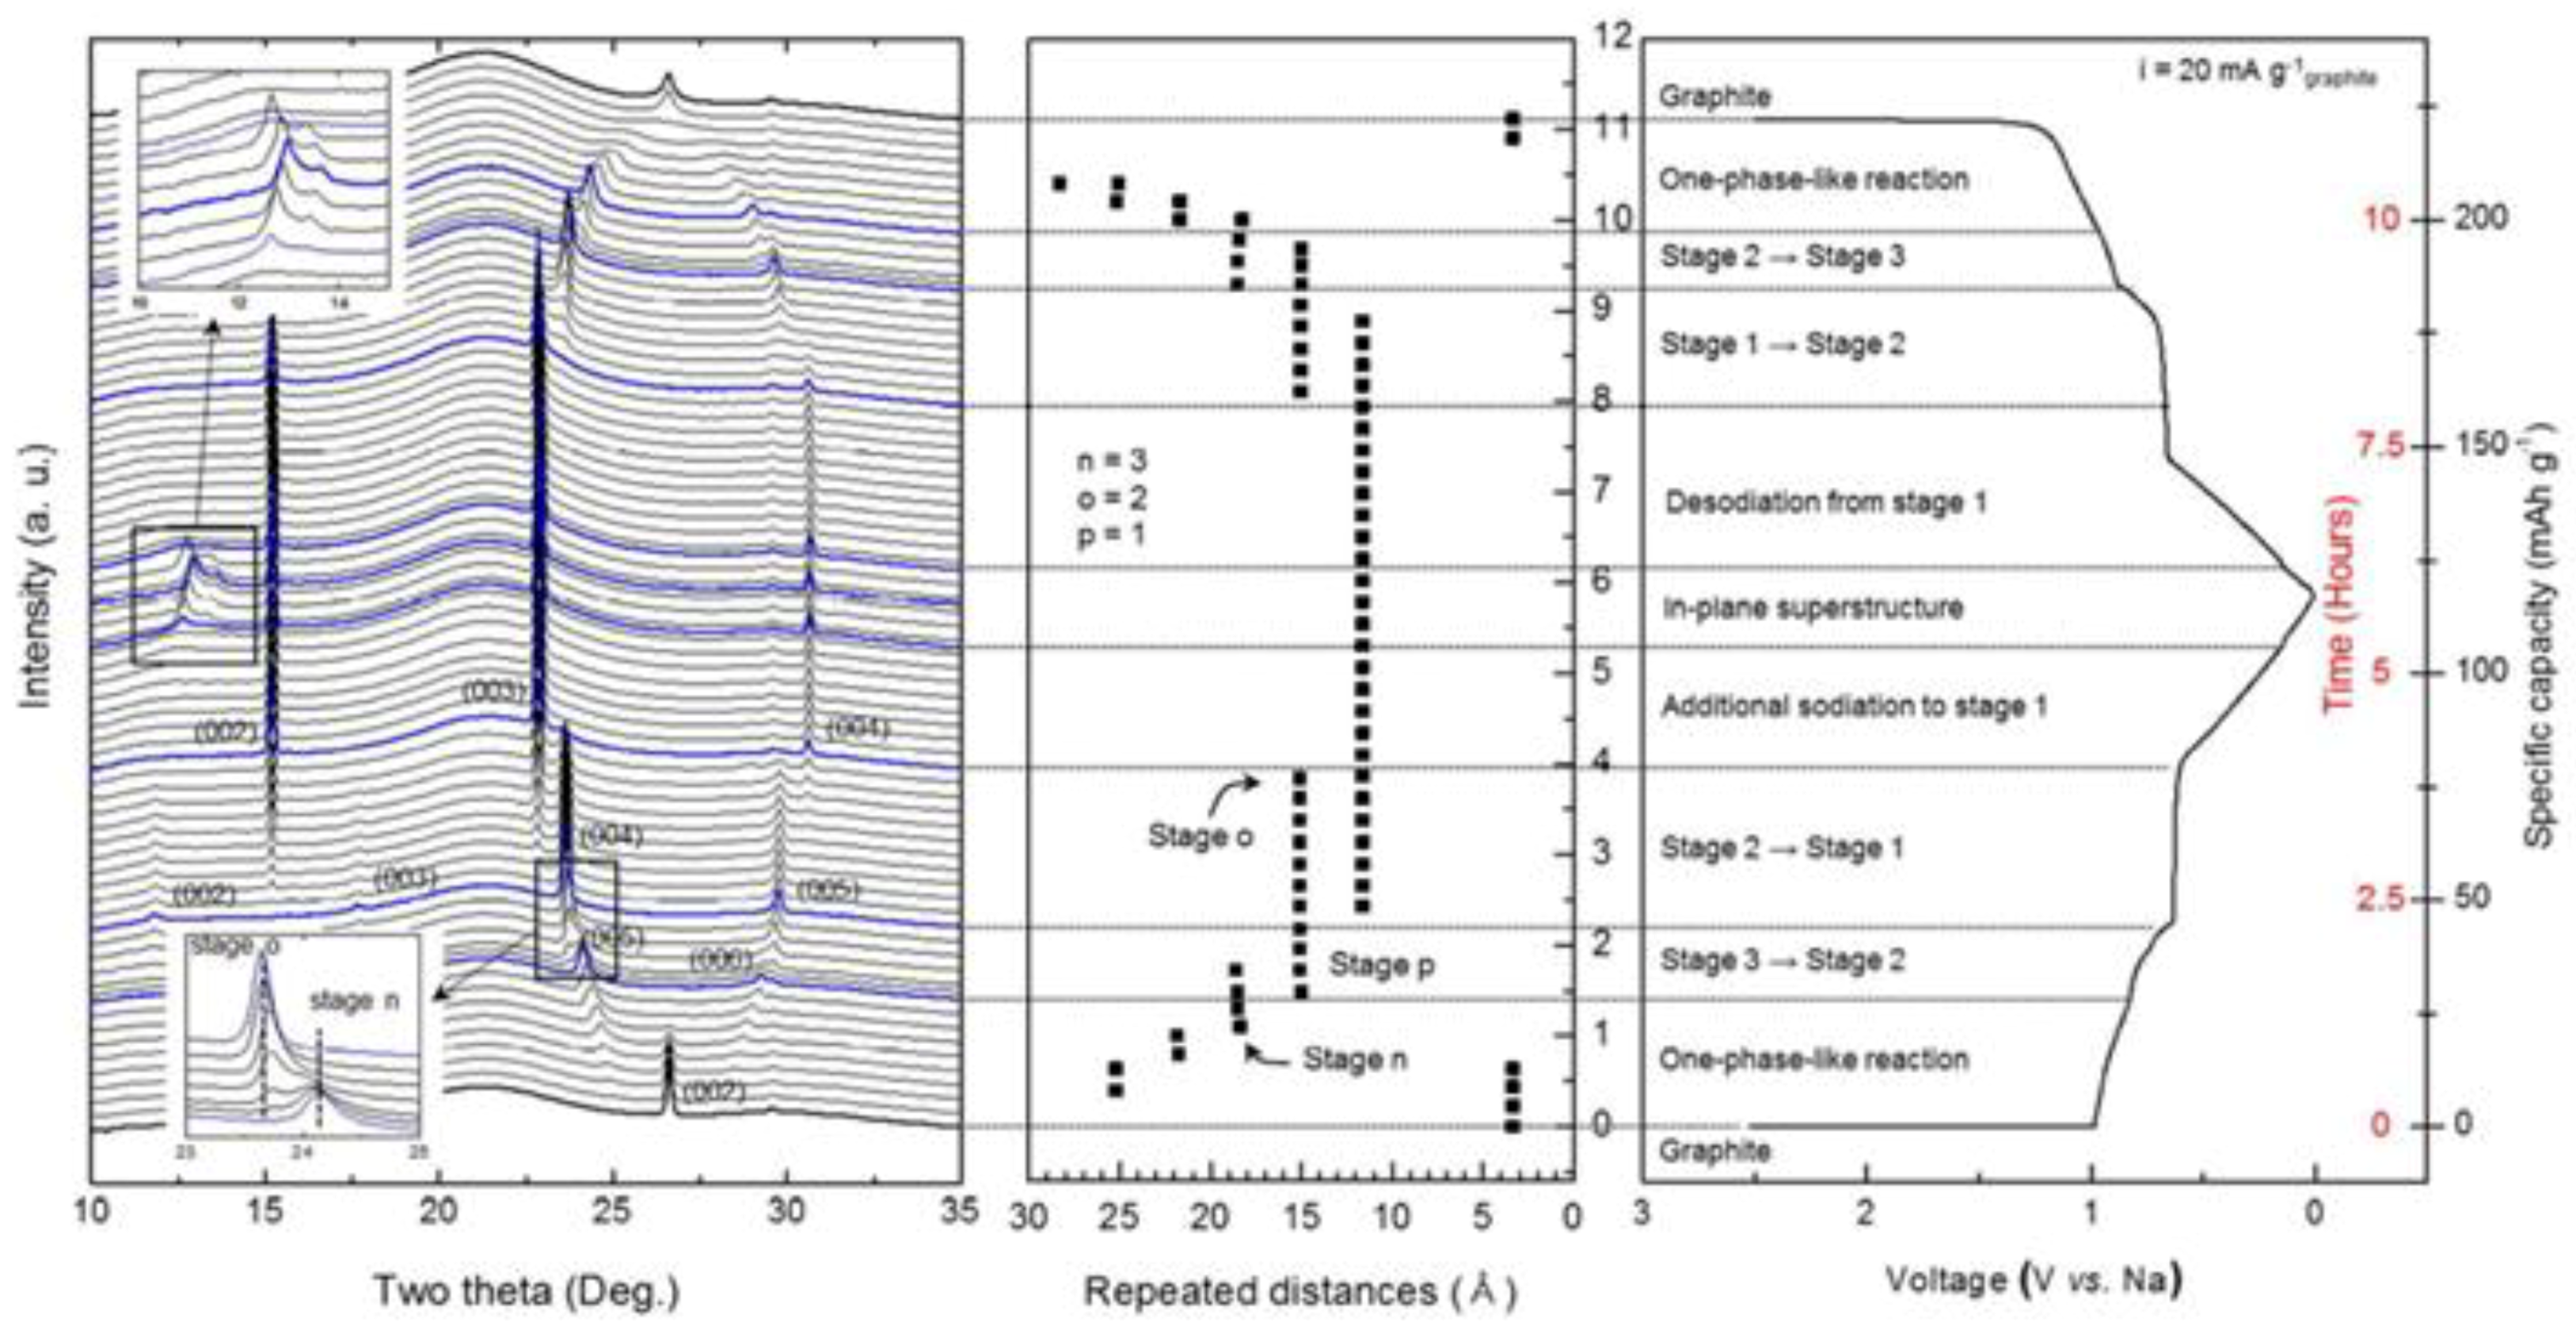
3.1.2. Layer Structured Li2MoO3, Nax(NiMn)O2 and Graphite

Layered oxide, especially the LiMO2 (M = 3d transition metals or their mixture) family, are the most widely used cathode materials in commercial lithium-ion batteries, because of their high voltage and high capacity. LiCoO2 is the first commercialized battery in this family. Many studies are focused on understanding the crystal structure change during cycling, which provide indispensable information for achieving high capacity and long cycling life. Operando XRD investigations revealed the complicated phase transition process involved at least four phases [54,151,152,153,154,155], which cause structure instability; as a consequence, the capacity fades. Adding other transition metals to LCO is found to be effective in suppressing the phase transitions and stabilizing the crystal structure, which lead to another commercial success of LiNi1−x−yMnxCoyO2 series battery with better stability and lower cost. In recent years, sodium-ion batteries have attracted more and more attention due to the concerns with potential shortage of Li resources and high cost for the large-scale energy storage applications [156]. One of the main challenges faced by sodium-ion batteries is the irreversible phase transformation during sodium intercalation and de-intercalation, complicated and often involves several phases, which leads to capacity loss and short cycle life. Here, we focus on the in-situ XRD studies on the phase transformations of the layer structured Li2MoO3, NaxMO2 cathodes and graphite anode during cycling.
In general, Li/NaxMO2 (M = transition metal) layered structures are classified into four groups (P2, O2, O3 and P3) based on the lithium/sodium-ion environment and the number of MO6 edge-sharing octahedral layers which have three possible positions for the oxygen atoms, named as A, B, C [157]. Figure 6 is a schematic diagram displaying the four crystal structures: (a) O3: 3 different MO2 layers (BA/CB/AC), Li+/Na+ are at Octahedral sites; (b) P3: 3 different MO2 layers (BA/AC/CB), Li+/Na+ are at trigonal Prismatic sites; (c) O2: 2 different MO2 layers (BA/CA), Li+/Na+ are located at the Octahedral sites; (d) P2: 2 different MO2 layers (BA/AB), Li+/Na+ are at trigonal Prismatic sites.
1. Li2MoO3
Many layered cathode materials have an O3-typed stacking, including the widely used and studied LiMO2 family. During charge, Li ions are constantly removed from the LiMO2 structure, leading to the changes of lattice parameters. In general, the lattice parameter c expands first and then contracts, often to a value smaller than that of the pristine state at high voltage due to the nearly empty Li layer [159,160,161]; this may cause the structure collapse in c-axis direction leading to the irreversible damage of the structure and capacity fade. To solve this problem, studies were devoted to discover and design new materials aimed at reducing the c variation during cycling to achieve the high-capacity retention and long cycle life. The Li2MoO3 with the disordered α-NaFeO2 structure has a reduced c variation range during cycling. In-situ XRD is employed to investigate how the structure changes during cycling [162]. Figure 7b displays the image plot of XRD spectra of a Li2MoO3 cathode during the first charge. The spectra of pristine and fully charged electrodes are in Figure 7a,c, respectively, and charge curve in Figure 7d, as well as lattice parameters obtained by Le Bail fitting of every spectrum with an R 3 ¯ m space group in Figure 7e. With careful examination of the evolution of the XRD image plot and the charge curve, the phase transformation can be summarized as follows:
(1)
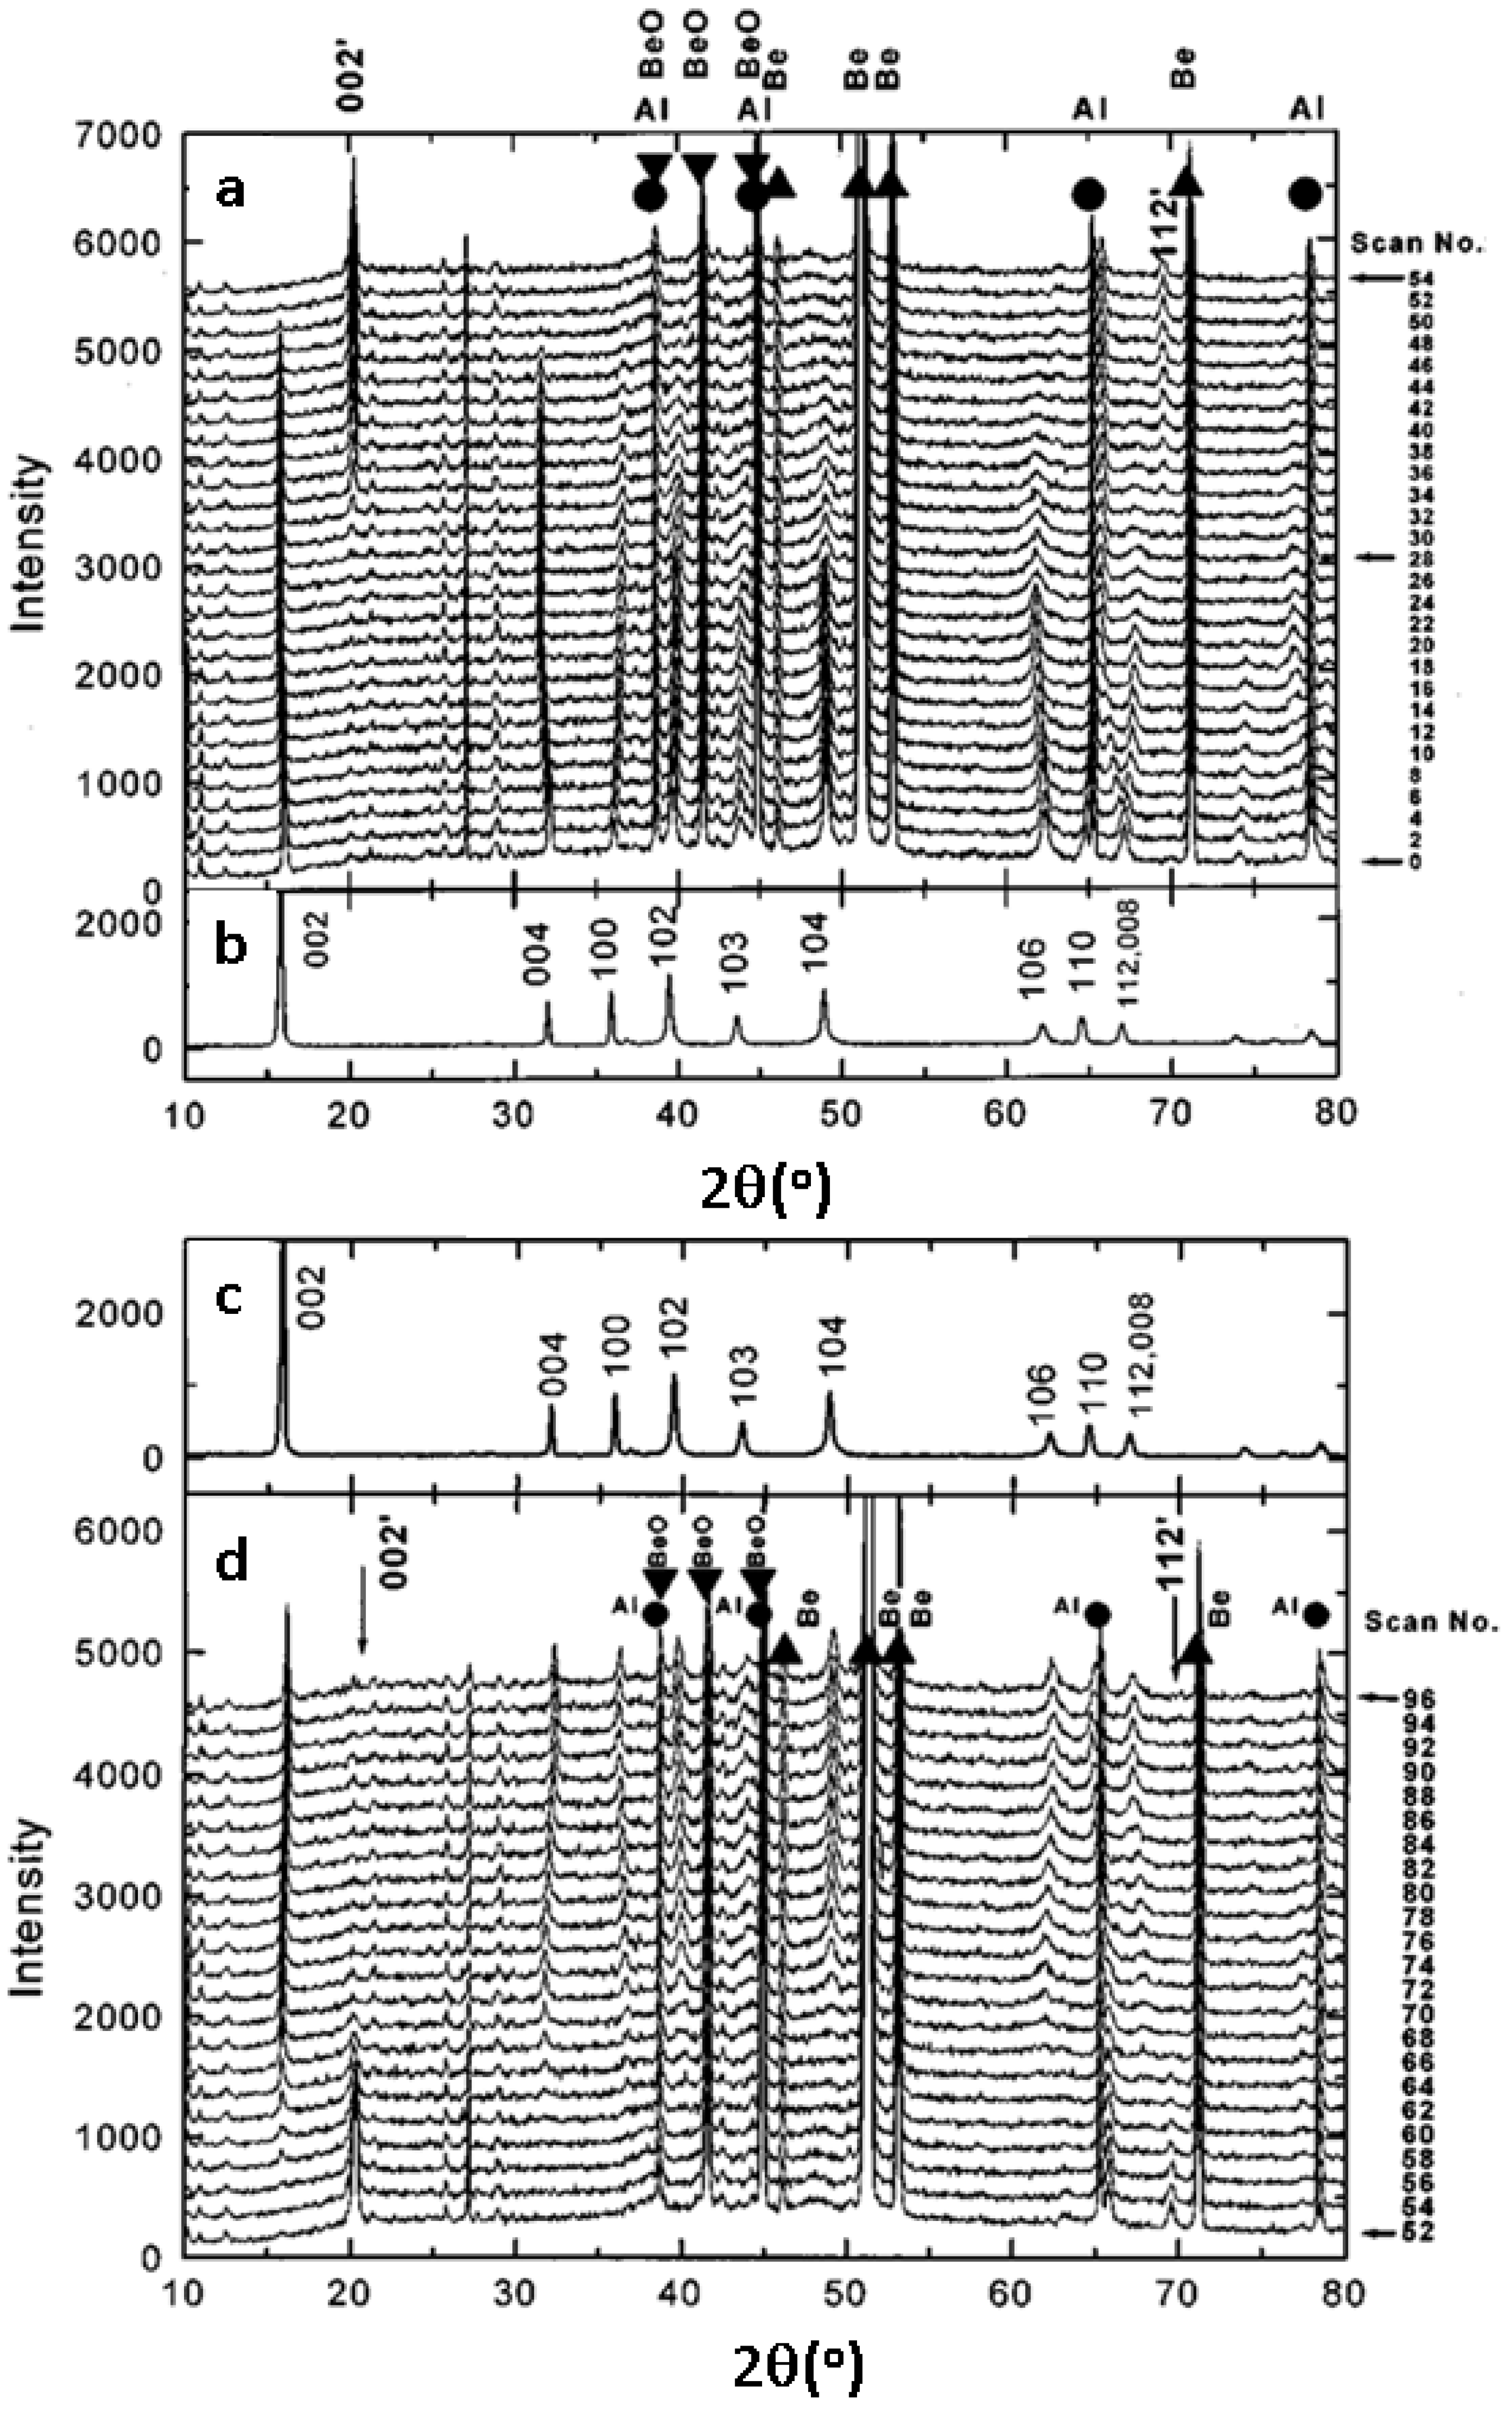
1.5 < Li+ < 2 (3 < V < 3.6 V), (003) and (110) diffractions shift to the lower angles continuously, indicating a solid-solution reaction with increasing c and a lattice parameters of the phase I, but the percentage increase of a is greater than c, implying that Li ions are mainly removed from the LiMo2 layers [163];
(2)
1.0 < Li+ < 1.5 (3.6 < V < 3.7 V), phase II, with the same layered structure as phase I, forms and grows at the expense of phase I. The lattice parameters of phase II are larger than those of phase I;
(3)
0.53 < Li+ < 1.0 (3.7 < V < 4.8 V), phase I is completely consumed and phase II grows via a solid solution route with a continuous increase of lattice parameters a and c.
Unlike the behavior of the cathode materials in the layered LiMO2 family, the Li2MoO3 has a continuous increase of c until 4.8 V, suggesting no structure collapse in the c-axis direction during high voltage charge. During discharge, the phase transformation process is reversed, and the lattice parameters a and c decrease continuously, eventually to the values close to the pristine cathode. The stabilization of Li2MoO3 during cycling is mainly attributed to the migration of some Mo ions from LiMo2 layer to the lithium layer, which is confirmed by STEM and neutron diffraction analysis of the pristine and fully charged Li2MoO3 [162,164]. Figure 7f,g display the STEM images obtained from Li0.53MoO3 and Li2MoO3 with the projection of Mo-O6 octahedral along the a-axis. The images show that the Mo-O6 octahedral changes from symmetric to distorted after de-lithiation and some Mo (black) move from the Li-Mo layer to the Li(white)-layer. The Mo ions in the Li+ layer can strengthen the connection between the two transition metal layers and act as supports to prevent structure collapse in c-axis direction.
2. P2-Na0.67Ni0.33Mn0.67O2
Lu and Dahn [165] first showed that the Na+ ions in the P2-Na0.67Ni0.33Mn0.67O2 structure can be completely extracted and the material has a capacity of ~170 mA g−1. They investigated the crystal structure change during charge and discharge with in-situ XRD, and their galvanostatic cycling curve displays seven and five distinctive voltage steps during charge and discharge, respectively, which is comparable to the existence of nine steps and phases in the phase diagram of P2-NaxCoO2 [166]. The phase transformation identified during the cycling is between P2 and O2 structures [167]. Figure 8b is the XRD spectrum of pristine Na0.67Ni0.33Mn0.67O2; Figure 8a displays in-situ XRD spectra collected during charge between 2.5 and 4.4 V with applied current of 5 mA g−1. During the initial stage of charge, the (00l) and (10l) peaks of P2-Na0.67Ni0.33Mn0.67O2 shift to a lower angle, while the (110) and (112) peaks shift to a higher angle indicating the expansion of the c axis and the contraction of the a axis. The in-situ XRD results indicate the crystalline phase is in P2 structure up to ~ 3.8 V, which is confirmed by electrochemical data and theoretical calculation. When the Na content is ~ 0.33 (~ 4 V), the broadening of the (10l) peaks is an indication of O2 type stacking faults in the P2 structure. A new set of Bragg peaks forms and grows on the 4.2 V plateau, accompanied by the gradual disappearance of the original peaks, suggesting a two-phase region. The new phase is determined to have an O2 structure. As the potential reaches 4.4 V, only the new phase is detected. During discharge (Figure 8d), the process is reversed; Na-ions are inserted back into the structure during discharge, and the structure transforms to P2 type, (Figure 8c). One of the advantages of the P2 phase is its stability in air and moisture, but the P2–O2 transformation involves a large volume change leading to fast discharge capacity fade.
3. Doped P2-Nax[NiMn]O2
Many studies have focused on solving this phase instability problem caused by phase transformation. The inactive elements, such as Li+, Mg2+ and Ti4+ are doped in the transition metal layer to stabilize the P2 structure during cycling, which improves the capacity and lengthen cycle life [168,169,170]. Xu et al. [170] investigated the Li substitution of transition metal in P2-Na0.8[Ni0.22Mn0.78]O2 with in-situ XRD. Figure 9a displays the evolution of XRD spectra of the Na0.8[Ni0.22Li0.12 Mn0.66]O2 cathode and a smooth charge curve to 4.4 V. Comparing these in-situ spectra to the spectrum of pristine powder (bottom, all the peaks are indexed by S.G. P63/mmc), the peaks shift from the original positions during Na-ion extraction, and all of the main peaks belong to the P2 phase. No new main peak is detected, indicating no significant phase transformation occurred, and the phase change is reversed during discharge from 4.4 to 2 V. Both the XRD spectra and the smooth charge curve suggest the de-intercalation follows the solid-solution route. Figure 9b plots the refined lattice parameters. Lattice parameter c increases continuously from beginning of charge (Na+ = 0.8) to ~0.27 mole of Na+ ions are extracted, which agrees well to the (004) peak shift to the lower 2θ direction in the range of 0.53 < Na+ < 0.80. Further extraction of Na+ to Na+ ~ 0.36 produces a slight shift of the position of the (004) line, corresponding to a small decrease of the c lattice parameter. The (100) peak shifts to the high 2θ direction during charge, resulting in a continuous decrease of lattice parameter a, which corresponds to the shortening of the distance between transition metals. The removal of Na+ ions not only changes the lattice parameters, but also induces stacking faults which broaden the (10l) peaks in the XRD pattern [167,171]. The simulated XRD spectra with different percentage of stacking fault are shown in Figure 9c, and the width of the (10l) peaks increasedwith the increased amount of the stacking faults. The stacking faults prevents the P2–O2 phase transformation during the extraction of Na+ upto 4.4 V, and the phase still maintains the P2 structure with local O2 type stacking fault. The strain and interface energies related to two phase separation are reduced by introducing the stacking fault in the structure, which stabilizes the P2 phase and increases capacity retention. When all of the Na+ ions are extracted from the structure, the O2 phase is observed, which points out that Li+ substitution can only postpone the P2–O2 phase transition to a higher voltage, but cannot prevent the transformation to O2-type completely.
Similar results were obtained with Mg-doped P2−Na0.67[Ni0.2Mg0.1Mn0.7]O2 [168,172]. Figure 10a shows the charge-discharge curve of the cell cycled between 2 and 4.5 V and the corresponding XRD in Figure 10b. The evolution of the XRD spectra shows no characteristic peak of the O2 phase in the voltage range of 4.2–4.5 V. Instead, a broad peak as a shoulder on the (004) diffraction of P2 phase is observed at Na+ ~ 0.35, which is a characteristic of the OP4 phase defined as an intergrowth structure between the P2 and O2-type structures [173]. As in the case of Li doping, the appearance of the OP4 phase stabilizes the P2 phase up to 4.5 V, which leads to improved cell performance.
4. Graphite
Graphite is the most widely used anode material, and is capable of hosting many types of guest species, as well as simultaneously intercalating more than one different guest species. Graphite intercalation compounds (GICs) exhibit distinctive properties compared to pristine graphite.
● Graphite Anode in Lithium Ion Battery
He et al. studied the dynamic structural change of graphite during the electrochemical lithium intercalation at 1/3 C by in-situ high-energy synchrotron XRD [119]. Figure 11a displays a contour plot of XRD patterns and discharge curve for the Li/graphite cell from 1.53 to 0.001 V at a rate of 1/3 C. Figure 11b is the corresponding XRD spectra collected at different lithium values (x). During lithiation, the graphite (002) peak shifts and splits. At the beginning, the (002) peak shifts from 1.83 to 1.76° in the range of 0 < x < 0.3, as well as increases in peak intensity. Between 0.3 < x < 0.5, the (002) peak intensity increases with no obvious peak shift. When x > 0.5, a new peak forms at 1.69° and grows at the expense of the 1.76° peak. The 1.76° peak finally disappears, accompanied by the appearance of a series of continuous intermediate peaks between 1.69 and 1.76°. The presence of the two-phase region in graphite and the continuous intermediate diffraction peaks is not compatible with the classical stage mechanism. Based on the analysis of XRD spectra, the authors proposed a different mechanism to describe the dynamic lithium intercalation under high current. At the very beginning of lithiation (x < 0.08), Li+ ions are randomly inserted into the graphite; as the process proceeds to x ~ 0.3, the intercalated lithium ions are distributed uniformly in the graphite. The structure transforms from AB lattice to the AA lattice with continued Li+ ion insertion [174]. When x > 0.5, the outer layers of graphite are occupied first, resulting in a Li-rich region and generates a Li+ gradient toward the inner layers of graphite. The growth of Li-rich phase as the continuous insertion of Li+-ions leads to the full-lithiated phase, LiC6.
● Graphite Anode in Sodium-ion Battery
Operando synchrotron XRD patterns were collected from a graphite anode in a Na half-cell with 1 M NaPF6 in DEGDME (diethylene glycol dimethyl ether) cycled at a current density of 20 mA g−1, see Figure 12 [95]. During sodium intercalation (sodiation) and de-intercalation (de-sodiation), the pristine graphite transforms into multiple new phases involving one or two-phase reactions and is completely restored to the pristine state after de-sodiation. The evolution of the XRD spectra implies a staging behavior during cycling. Initially, the (002) peak at ~27° down shifts slightly signifying a solid-solution reaction. The reaction proceeds until the graphite capacity reaches 31 mAh g−1 (t = 1.5 h, Na:C = 1:72), stage 3 GIC forms, and the (002) splits to (005) and (006). Moreover, with sodiation to Na:C = 1:50 (t = 2.2 h), a two-phase reaction started in this region, and stage 2 GIC forms at the expense of stage 3 GIC. After stage 3 GIC is exhausted, stage 1 GIC appears and grows at the expense of stage 2 GIC. The single phase of stage 1 GIC is observed after 4 h of sodiation, and exists in the range of Na:C from 1:28 to 1:21. Approaching the end of sodiation, new peaks appear between 12–14°, which are attributed to the in-plane super-structural ordering of the [Na-DEGME] complex. Correlating the results of operando XRD collected from electrochemical cycling and direct visualization coupled with density functional theory calculations, the authors proposed that Na intercalation occurs through multiple staging reactions; the final stage 1 GIC exists in the range of 1/28 < Na/C < 1/21. In addition, the intercalated Na+ ions and ether solvents are in the form of [Na-ether]+ complexes, that are double stacked in parallel with graphene layers in the graphite. The association between the solvent and intercalated metal species suggests the possible tunability of Na storage properties.

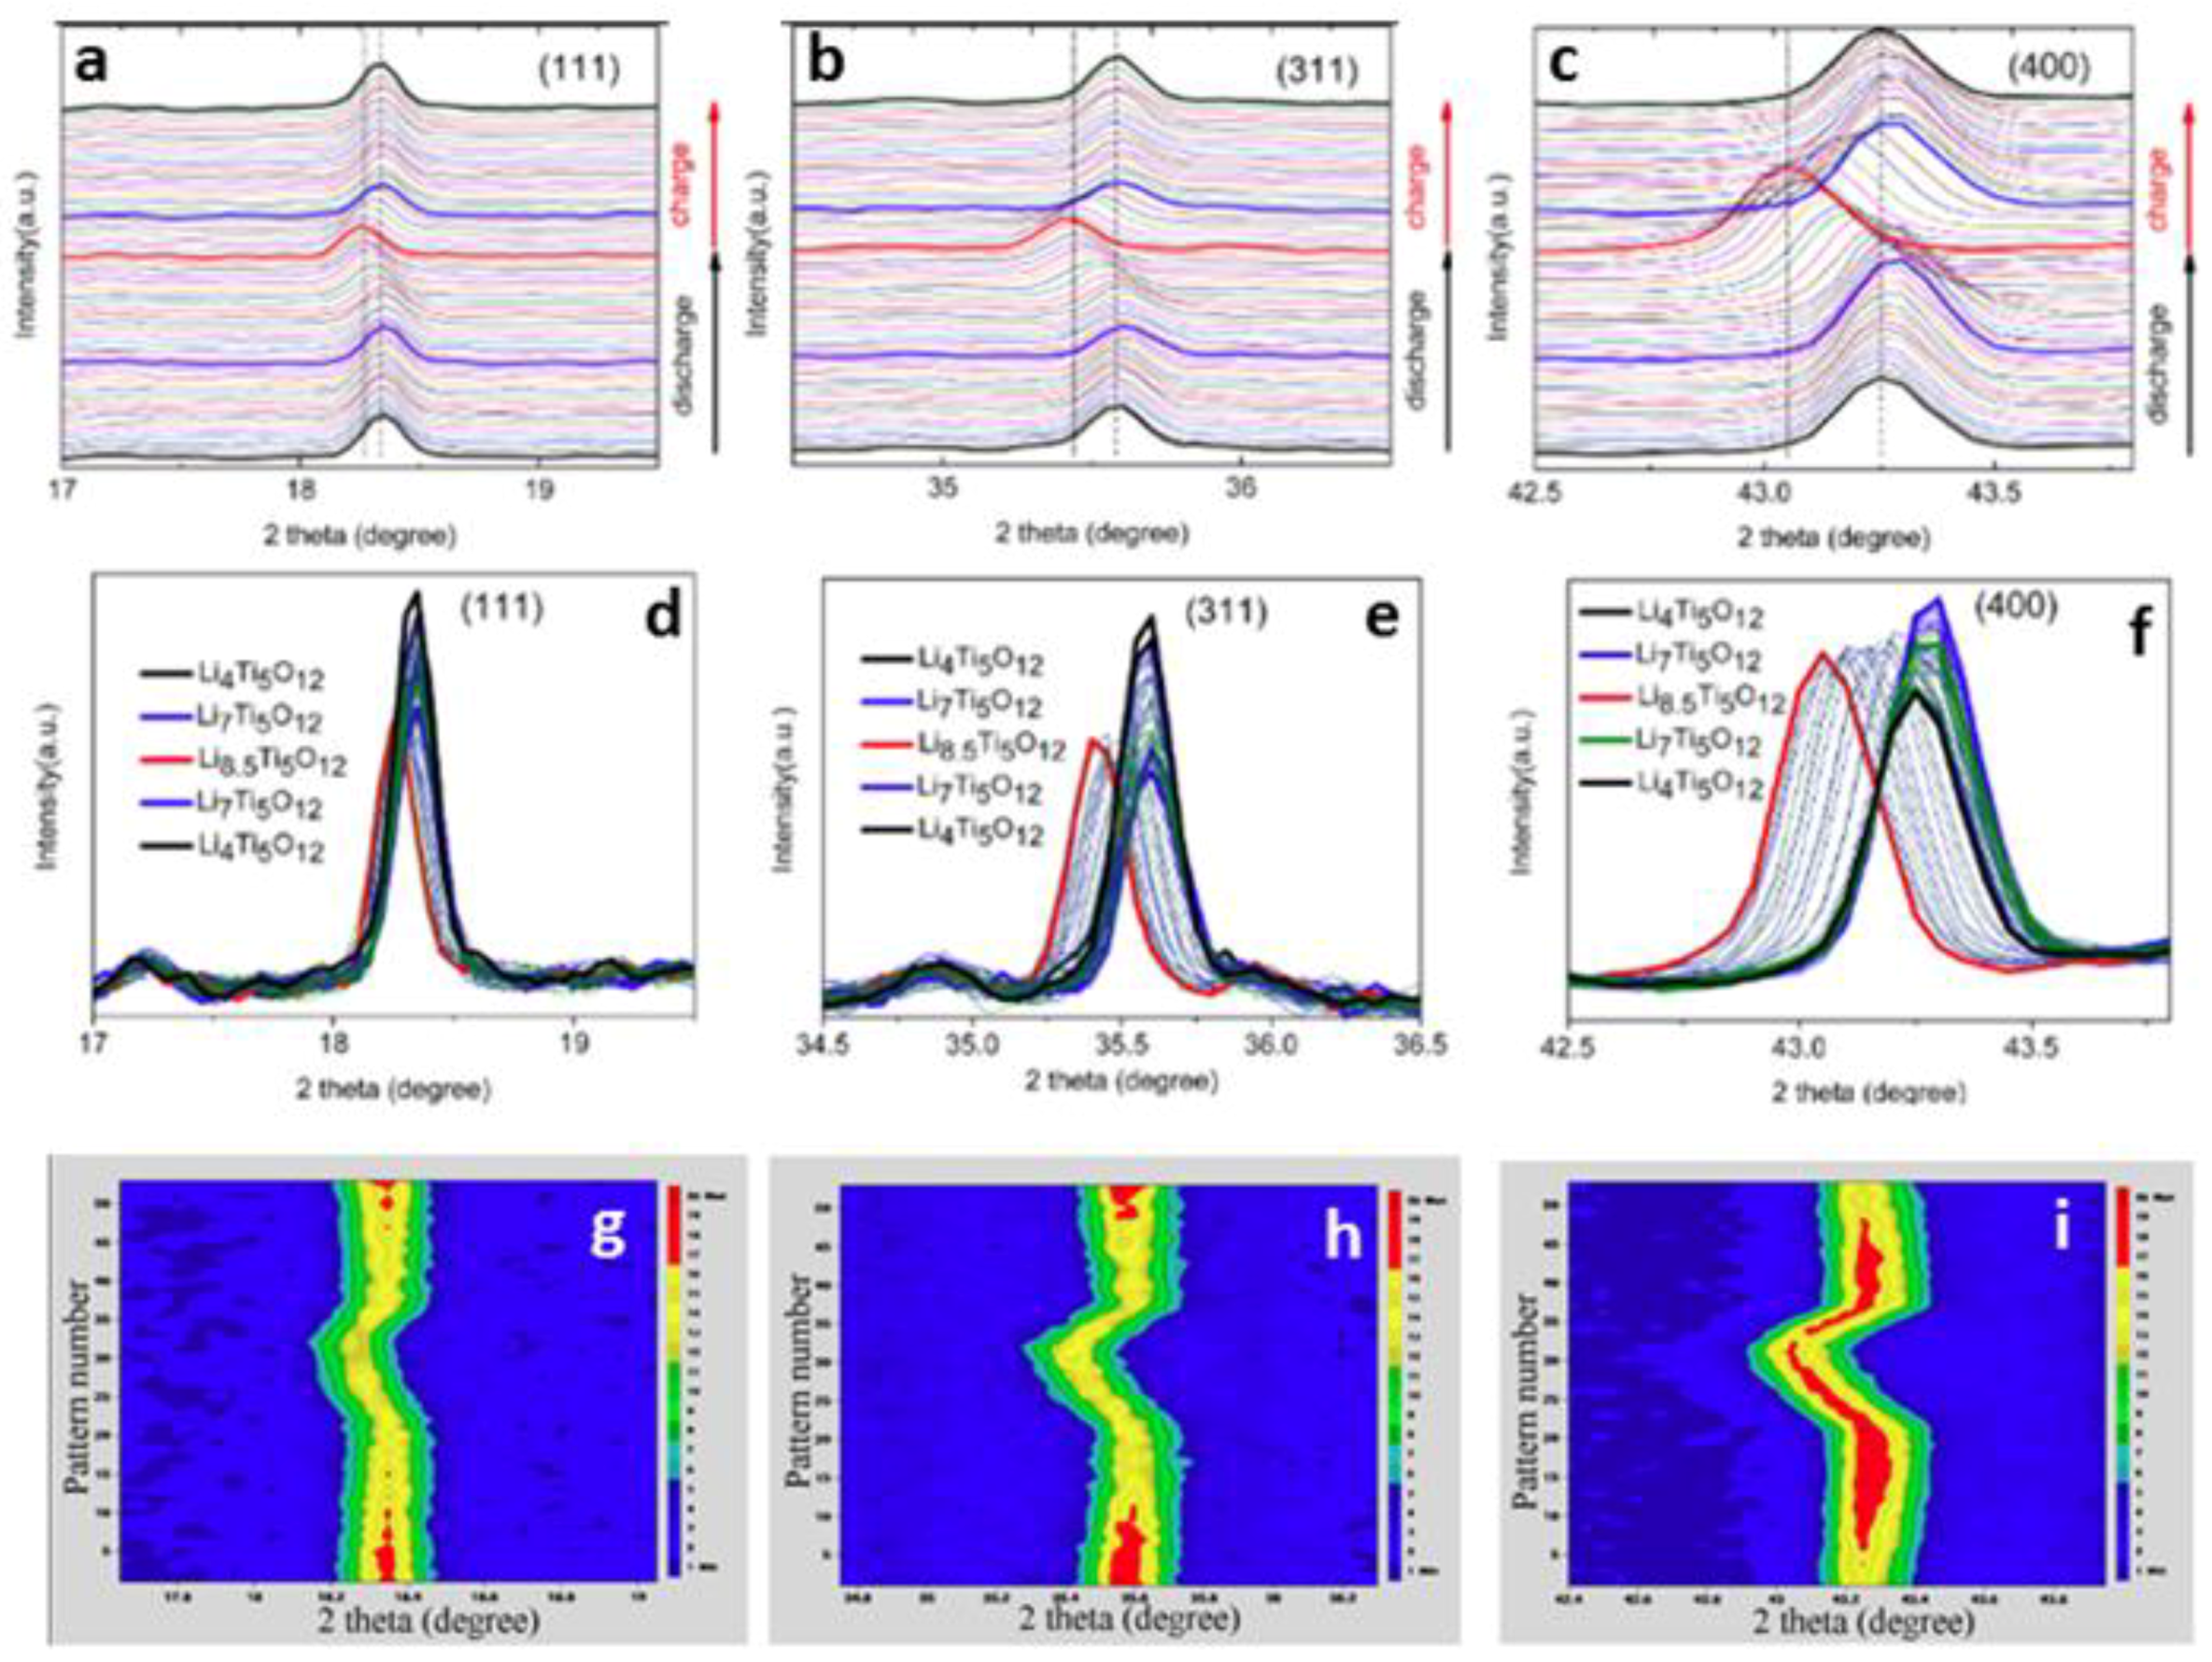
3.1.3. Spinel-Li4Ti5O12

1. Spinel-Li4Ti5O12 as anode in Li ion Battery
The spinel-Li4Ti5O12 (LTO) is known as a “zero-strain” anode for lithium ion batteries. The phase transformation of LTO in the lithium ion battery is proposed as [175]:
Li3 (8a) [LiTi54+](16d)O12(32e) + 3e + 3Li+ ↔ Li6(16c)[LiTi33+Ti24+](16d)O12 (32e)
in the 2.5 to 1.0 V range. The pristine and discharged phases are Li4Ti5O12 and Li7Ti5O12, respectively. Both compounds belong to the Fd 3 ¯ m space group, and the insertion of three Li+ ions in Li4Ti5O12 results in little changes in the lattice parameters, thus it is classified as zero-strain. Studies were conducted on this material in the voltage range of 1.0 to ~ 0 V for the purpose of raising its capacity beyond 175 mAh g−1 [176,177,178]. The reaction mechanism during cycling, especially at low voltage was investigated by operando XRD [115,175]. Figure 13 [115] presents the development of three characteristic diffraction lines and the corresponding image plots of Li4Ti5O12 cycled between 3.0 and 0.0 V. The (111), (311) and (400) peaks do not shift during discharge from 3.0 to 1.0 V, but with further discharge to 0.0 V, all three peaks shift to low angles gradually; they move reversibly to their initial positions upon charge to 1.0 V. This peak shift at low voltage is attributed to the two more Li ions inserted to the 8a sites of Li7Ti5O12 [175]:
Li6(16c)[LiTi33+Ti24+](16d)O12(32e) + 2e + 2Li+ ↔ Li2(8a)Li6(16c) [LiTi53+](16d)O12(32e)
The continuous shift of the diffraction lines suggests this phase transition follows a solid-solution path. The authors also calculated the lattice parameters of the fully discharged anode, which are very close to those of the original LTO with only 0.38% volume change. The small volume expansion indicates that the “zero strain” property is kept even at low voltage ~ 0.0 V.
1. Spinel-Li4Ti5O12 as anode in Na ion Battery
The Li4Ti5O12 can also be used as an anode in a sodium ion battery, despite the large volume change involved due to bigger size of Na+ than Li+ [179,180]. The mechanism of sodium insertion and extraction is different from that of lithium, and was studied by various techniques, including X-ray diffraction, electron microscopy, X-ray absorption, etc [60,99,181,182]. Figure 14a illustrates the evolution of the synchrotron XRD spectra during discharge-charge collected from a cell with C-Na3V2(PO4)3 cathode and Li4Ti5O12 anode in the range of 0.5–3.0 V at C/10 rate. The Li4Ti5O12/Li7Ti5O12 peaks shift slightly to the lower two theta direction during cycling, suggesting a solid-solution reaction. On the other hand, a new set of peaks attributed to Na6LiTi5O12 appears as discharge approaches the end and reaches maximum during the following charge process, then disappears before the end of charge. This delayed phase appearance is a result of slow Na+ diffusion in the crystal structure. The formation of Na6LiTi5O12 indicates that phase separation dominates the reaction. Equation (3) describes a three-phase separation mechanism for the sodium insertion/extraction in/out of LTO that was verified via STEM with the observation of the co-existence of three phases in a semi-discharged electrode as shown in Figure 14b [60].
2[Li3]8aV16c[LiTi5]16dO12 + 6Na+ + 6e- ↔ V8a[Li6]16c[LiTi5]16dO12 + V8a[Na6]16c[LiTi5]16dO12
where V = vacancy.
In addition, the influence of LTO particle size on the phase transformation of a chemical sodiated Li4Ti5O12 was investigated by operando synchrotron XRD [99]. A solid-solution reaction was observed over a wide range during Na insertion in the nanosized LTO (~44 nm), which is similar to the case of LFP.

3.1.4. Electrodes for Aqueous Battery

The aqueous lithium/sodium-ion batteries are low cost and safe choices for large-scale applications due to the use of low cost, non-flammable and highly conductive aqueous electrolyte, as well as being environmental benign. Some electrode materials have been proposed and evaluated [183,184,185], but the practical application of the aqueous batteries still faces great challenges. Recently, more and more investigations were dedicated to understand the working and degradation mechanisms of electrodes for aqueous batteries in order to enhance the battery performances.
1. Tunnel-type Ti-Na0.44MnO2
Wang et al. [186] investigated Ti-substituted Na0.44MnO2 oxide as a negative electrode for aqueous Na+-ion batteries and found it possesses superior cyclability. Na0.44MnO2 has an orthorhombic lattice with S.G. of Pbam; its structure has a large “S” typed tunnel. There are five different crystallographic sites for Mn ions, labelled as Mn(1) to Mn(5) and three sites for Na ions; the double and triple rutile-type chains of edge-sharing MnO6 octahedral and single chains of corner-sharing MnO5 support the structure and make it stable during Na+ extraction and insertion, see Figure 15d. Operando XRD and spherical aberration-corrected STEM are utilized to probe the sodium storage mechanism and accurately identify the Ti substitution sites. Figure 15a–c show the structure evolution of Na0.44[Mn0.44Ti0.56]O2 during a cycle of Na extraction and insertion, as well as the corresponding variations in lattice parameters. The main XRD reflections, such as (040), (130), (140), show a continuous peak shift during Na insertion/extraction and no new phase is detected in most part of the process. Therefore, the main crystal structure is maintained and the phase transition mainly follows a solid-solution path, whereas the un-doped Na0.44MnO2 manifests a two-phase reaction behavior [187]. In addition, a small biphasic region can be observed at the end of discharge, which the authors attribute to the smaller unit cell volume of Na0.44[Mn0.44Ti0.56]O2 than Na0.66[Mn0.44Ti0.56]O2 as well as the slow kinetics of the phase transformation. To understand the effect of Ti on the electrochemical performance and reaction mechanism, the crystal structure of Na0.44[Mn0.44Ti0.56]O2 and the valences of the Ti and Mn cations were studied by STEM/EELS and in-situ XAS. Figure 15e,f present the high-angle annular dark-field STEM (HAADF-STEM) and EELS images of as-made Na0.44[Mn0.44Ti0.56]O2 along the [001] zone axis. The EELS image clearly shows that Ti4+ replaces Mn4+ on the Mn(1)-Mn(4) positions, but not on Mn(5), which agrees with their Rietveld refinement of the synchrotron XRD spectra and the stable structure configuration from their density function calculation. During cycling, Ti and Mn(5) are at constant valence of 4+, whereas Mn(2) and Mn(3) participate in the redox reaction. This anode material has very stable cycling performance, which demonstrates the role of Ti in stabilizing the Na0.44MnO2 structure. This study reveals the difference in working mechanisms of this Ti-doped and un-doped tunnel-type electrode material and is helpful for designing new materials for high-performance aqueous sodium rechargeable batteries.
1. LiMn2O4-FePO4 aqueous Battery
For lithium-ion aqueous batteries, the main difficulty lies in capacity fade of the anode materials, such as activated carbon, LiV3O8, V2O5, LiTi2(PO4)3, TiO2 and Li4Ti5O12 [188,189,190,191,192]. Olivine-structured FePO4 and amorphous FePO4·2H2O were explored as anodes for aqueous lithium-ion batteries. Figure 16 plots the development of the XRD spectra of a LiMn2O4-FePO4 aqueous battery during charge-discharge. Olivine FePO4 undergoes a reversible two-phase transformation (FP ↔ LFP), similar to that in organic electrolytes, confirming the lithium intercalation and de-intercalation processes. Simultaneously, the LiMn2O4 cathode shows continuous reversible shifts of all the peaks indicating a solid-solution reaction. On the other hand, the in situ XRD spectra of amorphous anode in the LiMn2O4-FePO4 2H2O cell show the start of crystallization and nano-crystals are observed by TEM. Comparing the two materials, olivine FePO4 delivers higher capacity and higher rate, whereas amorphous FePO4·2H2O has a longer cycle life at a slower rate [193].

3.2. Degradation Mechanisms

One of the challenges that rechargeable batteries face is electrode degradation, which reduces battery capacity and shortens battery life. Understanding the degradation mechanism is the first step to solve the problem. Liu et al. [122] used the in-situ synchrotron XRD with a commercial 18650 LFP cell at different cycles to investigate the structure changes in the course of long term cycling to elucidate the capacity fade mechanism. Figure 17 plots the evolution of XRD spectra of the first and 2500th cycles during discharge at 1C rate. As the depth of discharge increases, the lithium ions are extracted from lithiated graphite and inserted into FP to form LFP. At the end of first discharge, all FP peaks disappear, see Figure 17a, whereas the FP peaks are still observed at the end of the 2500th discharge, Figure 17b.
The authors suggest that the presence of the FP phase is an indication of insufficient active lithium to complete the FP to LFP transformation at the end of discharge, and conclude that the loss of the source of active lithium-ion is the primary cause of the capacity fade. The amount of the inactive FP at 100% depth-of-discharge is proportional to the decrease of the available lithium-ion during cycling. As the numbers of cycle increase, the solid-solution range near the stoichiometry FP decreases, and the FP-LFP transition is close to the two-phase reaction. The decay of the solid-solution behavior is associated with the degradation of the rate performance of LFP at higher cycles.

3.3. Thermal Stability

The operando XRD is a technique that can be used in many aspects to study the performances of rechargeable batteries. Several examples presented above concern the working and degradation mechanisms of various electrode materials in non-aqueous and aqueous electrolytes. In addition, this technique is also useful in the investigation of the thermal stability of electrodes, which is an important issue in battery application.
1. O3-type NaNi2/3Sb1/3O2
The thermal stability of layered O3-type NaNi2/3Sb1/3O2 cathode material was studied by in-situ high temperature XRD (HTXRD). The NaNi2/3Sb1/3O2, which was synthesized at 950 °C, has a rhombohedral lattice with S.G. of R 3 ¯ m. It exhibits a reversible capacity of 52.5 mAh g−1 after 100 cycles with capacity retention of 62.4%. The operando XRD conducted during room temperature cycling reveals the reaction goes through a complicated multiphase phase transformation during charge, i.e., O3 → O3 + P3 → P3 → O1 + P3 → O1, the process is reversed upon discharge. The thermal stability test is conducted on NaNi2/3Sb1/3O2 to elucidate the structural evolution during cycling and its behavior at high temperature. Figure 18 presents the XRD data from a charged NaNi2/3Sb1/3O2 between 100 and 500 °C with 25 °C increment. The diffraction peaks show the co-existence of P3 (red) and O3 (black) phases with P3 dominant initially. As the temperature increases to 500 °C, only peak shifts due to cell expansion upon heating are observed. No new peak is detected, indicating the stabilities of P3 and O3 phases up to 500 °C, which demonstrates a superior thermal stability for sodium storage [194].
2. Layered-LiNixMnyCozO2
The thermal stability of charged LiNixMnyCozO2, where x + y + z = 1, with different cation ratios are examined by operando HTXRD and operando mass spectroscopy (MS). The layered LiNixMnyCozO2 has rhombohedral lattice and belongs to R 3 ¯ m space group. Figure 19a–d present image plots of the developments of XRD patterns from a series of delithiated LiNixMnyCozO2 cathodes in the temperature range of 25–600 °C [93]. The images show that these charged materials undergo a specific path of phase transitions from layered to spinel, and then to rock-salt as the heating temperature increases; the results are summarized in Table 1.
The results in Table 1 indicate that the thermal stability of the charged NMC is mainly governed by the nickel content; more nickel in the sample results in lower starting temperature for the phase transformation. This is due to the least stable nature of nickel among the three transition metals and the large amounts of unstable Ni4+ are reduced to Ni2+, which is accompanied by the release of oxygen during phase transformation. In addition, Mn is the most thermally stable element enhancing the thermal stability. A sudden decrease in thermal stability is observed by changing the composition from NMC532 to NMC622, indicating that NMC532 is the optimal composition for balancing good thermal stability and reasonable high capacity. A diagram of phase stability vs. temperature and Ni content is constructed based on the results discussed above, which can act as a guide for the design of the cathode materials, Figure 19e [93].
3. LiNi0.75Co0.15Al0.05Mg0.05O2 (NCA-Mg)-graphite cell
Overcharging lithium-ion batteries leads to rapid and exothermic reactions accompanied by side chemical reactions at the cathode and anode, which is a complex process and has direct impact on the cell life and safety. The behavior of a LiNi0.75Co0.15Al0.05Mg0.05O2-graphite cell under overcharge condition at 30 and 50 °C was probed by in-situ synchrotron XRD and X-ray absorption fine structure spectroscopy (XAFS). Figure 20a,b display the (003) diffraction (2θ: 18–19°) of NCA-Mg (rhombohedral, R 3 ¯ m) and (002) diffraction (2θ: 24–26.5°) of graphite (hexagonal, P63mc) at 30 and 50 °C with their voltage profiles in Figure 20c. The evolution of the diffractions can be divided into low, mid and high voltage regions. The following observations were noted during charge:
(1)
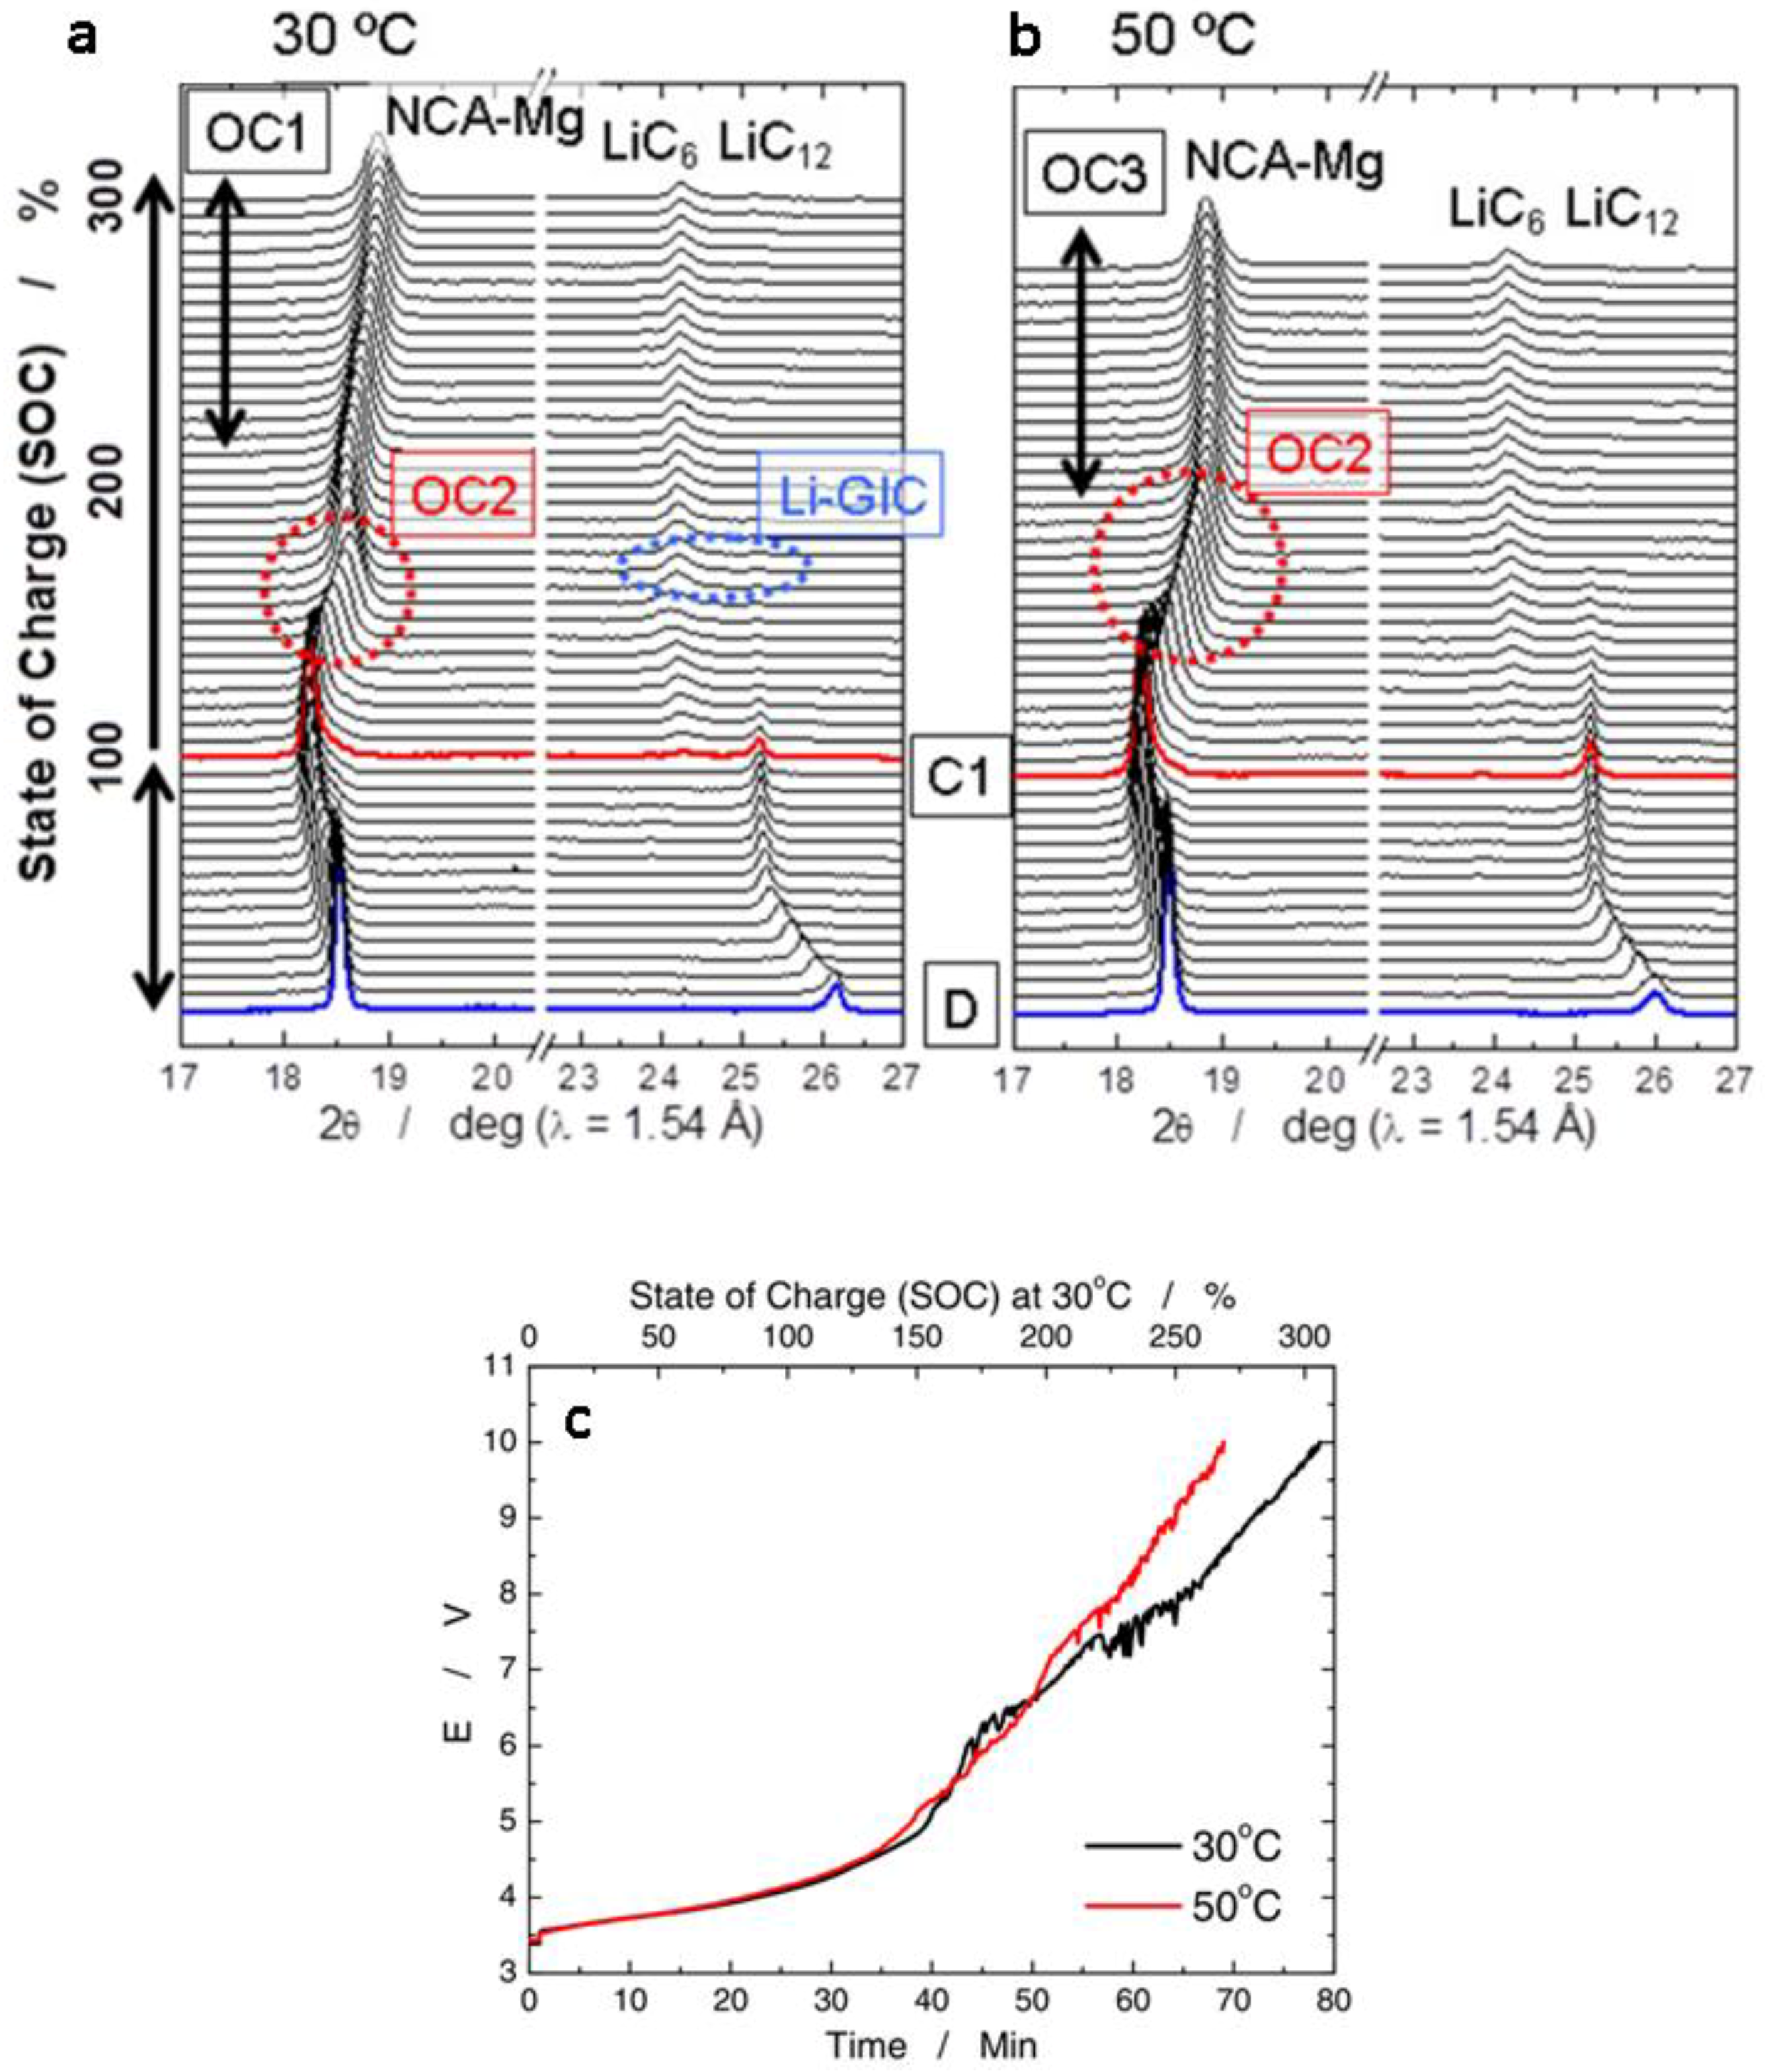
Low voltage region (0 ≤ SOC ≤ 100%, V ≤ 4.1V). The peak (003)NCA-Mg shifts to lower diffraction angle owing to the expansion of distance between transition metal layers induced by lithium de-intercalation. This distance reaches maximum when the cells are charged at 100% SOC (C1 in Figure 20a,b) at both 30 and 50 °C, implying the side reactions at NCA-Mg electrodes are negligible in this region;
(2)
Mid voltage region (100% < SOC < ~ 200%, V ≤ 6.6 V). The (003)NCA-Mg peaks shift back to higher angle caused by the contraction of the interlayer distance. The shift of (003)NCA-Mg is slower at 50 °C than at 30 °C in the region marked as OC2, suggesting more side reactions at 50 °C than at 30 °C. The X-ray absorption results indicate that the oxidation of nickel and cobalt in NCA-Mg reached the maximum values at cell voltage of 6.6 V;
(3)
High voltage region (~200% < SOC, V > 6.6 V). The rate of (003)NCA-Mg peak shift slows down in the case of 30 °C, suggesting that side reactions accelerated at the NCA-Mg cathode in the high voltage region, labeled as OC1 in Figure 20a. The cell at 50 °C exhibits no (003)NCA-Mg peak shift in the overcharge region with voltage > 8 V (OC3), indicating that the charging current is fully consumed by side reactions at NCA-Mg positive-electrode. On the anode side, lithium ions intercalate into graphite during charge. At 30 °C, fully-intercalated graphite, LiC6, is formed at the overcharge state, marked with “Li-GIC”. Graphite cannot accommodate more Li+ in the structure with charging the cell beyond this point, which results in lithium plating on the graphite anode [195,196]. In the cell at 50 °C, graphite is not fully intercalated with Li+ even at 10 V owing to the increased side-reactions on the graphite at this temperature. Based on the operando XRD and SAFS results, the authors proposed different side reaction mechanisms for the overcharged cells at 30 and 50 °C, which can help researchers to understand the overcharge effect on both cathode and anode, and to design batteries that can reduce and optimize the side reactions for the long life and safe batteries [197].
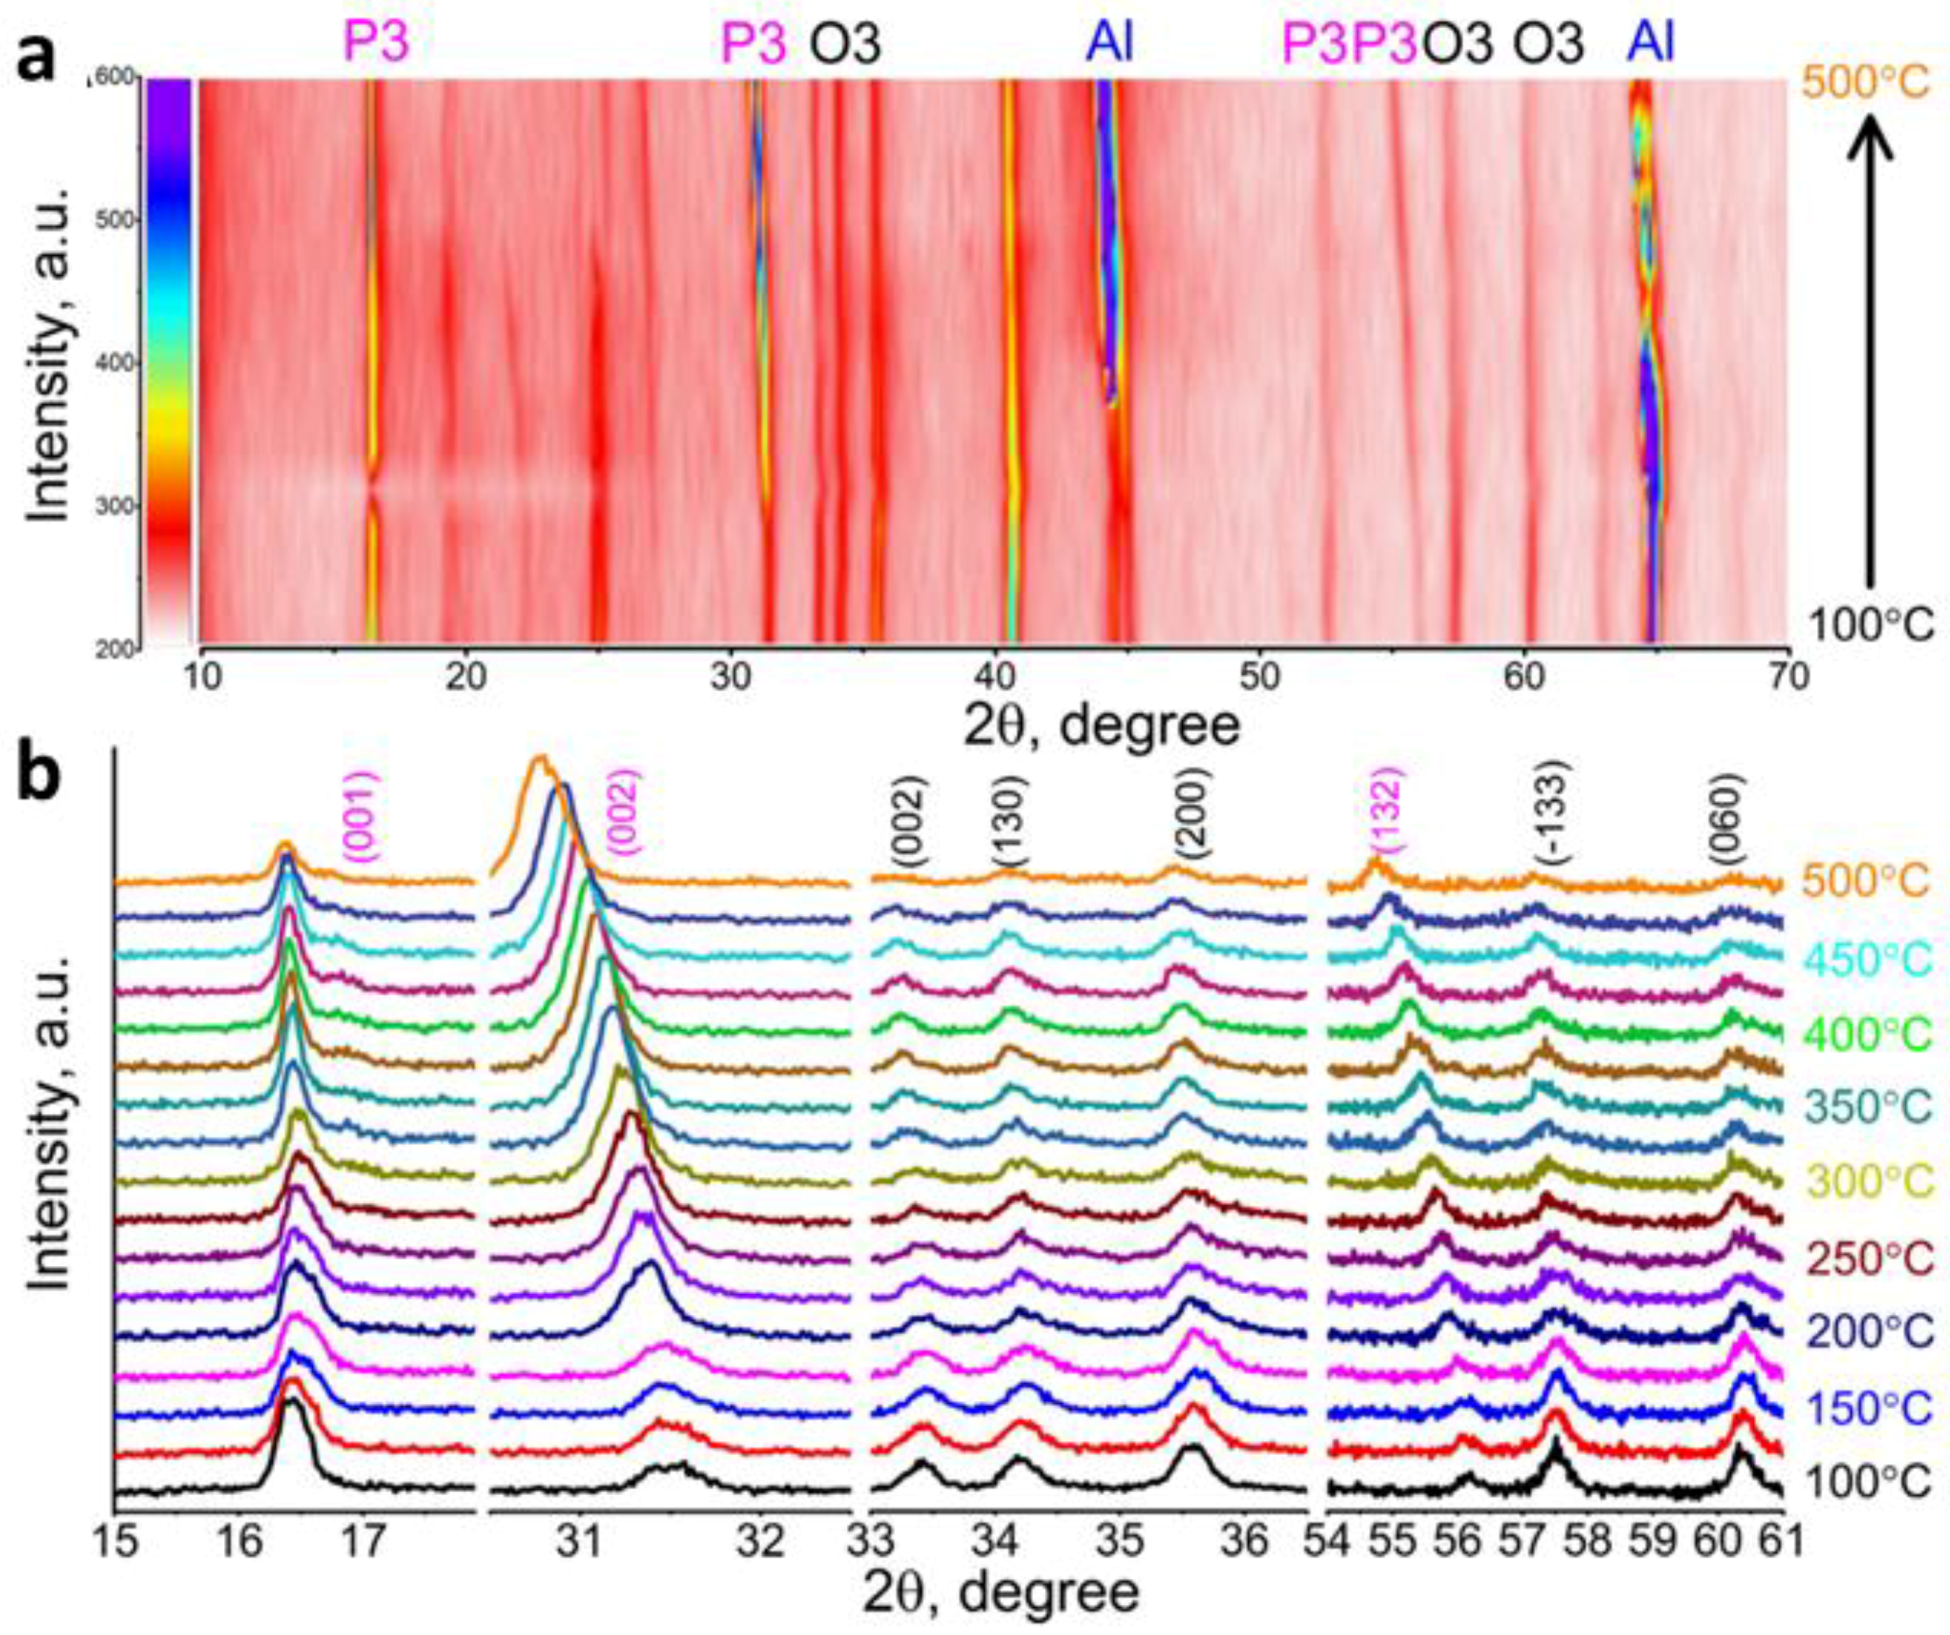
3.4. Heat Treatment

In-situ XRD is widely used in characterizing and monitoring phase formation, phase transformation, crystal growth, etc. during heat treatments. The observations provide valuable information on the optimization of the heat-treatment conditions for synthesizing materials with the desired structure and properties. Following are two examples of applying HTXRD in guiding the synthesis of suitable electrode materials.

3.4.1. Phase evolution of LiFePO4 Precursor

Parallel in-situ HTXRD and HTTEM studies on the LiFePO4 precursor made by a sol-gel method were conducted and revealed in-depth information on structure and morphology evolution of LiFePO4 precursors during heat treatment at the centi-meter and nano-meter scales. The optimum heat-treatment parameters to produce the high-quality electrode materials were verified by the electrochemical performance of the materials heated at different temperatures.
Figure 21a,b show the evolution of XRD spectra with temperatures in inert atmosphere. The starting precursor is amorphous and the nucleation of LiFePO4 starts at ~ 425–445 °C. The growth and sharpening of the diffraction peaks as the temperature increases is indicative of the crystal size increase. The average crystallite sizes, estimated by the Scherrer equation [198], changes from 14 to 79 nm with a temperature increase from 425 to 900 °C. The authors calculated the unit cell parameters of LFP as a function of temperature and derived a relation of volume thermal expansion with the temperature.
Figure 21c presents the in-situ HRTEM micrographs taken at different temperatures of a specific particle with corresponding selected area electron diffraction patterns (SAED) at the right. The crystalline lattice fringes are initially observed between 450 and 500 °C. At 450 °C, some particles show the lattice fringes, whereas others show small clusters of arranged atoms. The appearance of these clusters is an early indication of nucleation, which agrees with the in-situ XRD spectrum. The HRTEM images and SAED patterns indicate the formation and growth of LiFePO4 crystallites occur between 500 and 700 °C. These images show that the morphology of the particles become more porous, meanwhile, their surfaces and shapes changed slightly with increasing temperature.
Of the LFP heated from 500–900 °C, the one heated at 800 °C has the best electrochemical performance, despite a capacity that is still much lower than the theoretical values. The combination of parallel in-situ XRD and in-situ TEM studies with electrochemical performances of the materials reveals (1) the optimum heating conditions for obtaining materials with high performance; (2) the temperature effects on phase evolution, crystallinity and morphology of LiFePO4; and (3) the effect of crystal structure, crystal size and morphology on the electrochemical properties, which are essential information to produce high-quality electrode materials [199].

3.4.2. Phase Evolution of LiFePO4 Precursor

A composite material consisting of carbon-coated LiMn0.75Fe0.25PO4 nanoparticles within a 3D graphene micro-spherical is produced using a salt-assisted spray drying method. The goal is to improve the electrochemical properties of LiMn0.75Fe0.25PO4 by enhancing its electronic conductivity and Li+ diffusivity. The composite is synthesized by a spray-drying process using a solution mixture of chelated metal salts and subsequent heat treatment.
The phase evolution of the 3D LiMn0.75Fe0.25PO4/reduced graphene oxide (rGO) microspheres during heat treatment between 100 and 650 °C in an inert atmosphere is monitored by in-situ XRD; the development of the XRD patterns is shown in Figure 22 [18]. The as-spray-dried precursor is amorphous, see spectrum at 30 °C. The as-spray-dried precursor is then dried at 100 °C and becomes crystalline, with the pattern corresponding to a mixture of MCl2 (M = Fe and Mn) and LiH2PO4. When the temperature is increased to 280 °C, MPO4 and Li3PO4 phases are formed. Upon heating to 450 °C, an olivine LiMPO4 is observed, together with MPO4. Upon further temperature increase to 650 °C, single-phase LiMn0.75Fe0.25PO4 is obtained at the expense of the MPO4 phase. The result indicates that the maximum temperature required for achieve a single phase is ~ 650 °C. This in-situ XRD result indicates the LiMn0.75Fe0.25PO4 phase formation path as follows:
  • 30–100 °C: Li-Mn-Fe-PO4/GO precursor → (Mn/Fe)Cl2 + (Mn/Fe)PO4 + Li containing phase
  • 100–280 °C: (Mn/Fe)Cl2 +(Mn/Fe)PO4 + Li containing phase → Li3PO4 + (Mn/Fe)PO4
  • 280–450 °C: Li3PO4 + (Mn/Fe)PO4 → Li(Mn/Fe)PO4
  • 450–650 °C: (Mn/Fe)PO4 + Li containing phase → Li(Mn/Fe)PO4 (single phase)
The 3D LiMn0.75Fe0.25PO4/rGO microspheres that were synthesized exhibit a high tap density, high specific capacity, excellent rate capability, and superior cycling stability as a cathode material for lithium-ion batteries.

4. Conclusions

With the advances of X-ray diffractometer as well as the availability of synchrotron diffractometer, the operando X-ray diffraction technique is now widely used to explore various aspects of lithium/sodium-ion batteries, including: (a) the working mechanisms of electrodes, as well as the influences of particle size of the electrode material, the cycling current and the composition on the working mechanism; (b) the impact of overcharge on the electrode materials; (c) the thermal stability of the electrodes; (d) the degradation mechanism and (e) the synthesis of the materials. The information obtained from the operando XRD investigations make it possible to have an atomic level understanding on how the rechargeable batteries work in relation to their crystal structure, why they behave in their specific ways, how to change the undesired working mechanisms, how and why they fail, as well as the optimized conditions to produce the high quality materials. To improve the existing electrode materials and the design of new high performance ones, not only is the structure information of the collective materials obtained from XRD important, but also the local information on the atomic level. Thus, operando XRD should be developed in the direction of combining with other techniques to allow collecting different types of information simultaneously. Presently, XRD-MS, XRD-DSC, XRD-XAS, etc. are used in material research, but more multi-function instruments with rapid measurement/fast data collection are required. In addition, it is important to develop operando techniques with the capability of obtaining 3D crystal structure, as well as 3D morphology information of the electrodes, which is essential for improving electrode quality. Finally, the operando techniques should be able to measure the desired materials in the same environment and conditions as the battery in practical applications.

Author Contributions

W.Z. wrote the draft. All authors contributed to the writing, discussion and revision of the final version.

Funding

This research received no external funding.

Conflicts of Interest

All the authors declare no competing interests.

References

  1. Etacheri, V.; Marom, R.; Elazari, R.; Salitraa, G.; Aurbach, D. Challenges in the development of advanced Li-ion batteries: a review. Energy Environ. Sci. 2011, 4, 3243–3262. [Google Scholar] [CrossRef]
  2. Wen, J.; Yu, Y.; Chen, C. A Review on Lithium-Ion Batteries Safety Issues: Existing Problems and Possible Solutions. Mater. Express 2012, 2, 197–212. [Google Scholar] [CrossRef]
  3. Armand, M.; Tarascon, J.-M. Building better batteries. Nature 2008, 451, 652–657. [Google Scholar] [CrossRef] [PubMed]
  4. Li, Y.; Lu, Y.; Zhao, C.; Hu, Y.-S.; Titirici, M.-M.; Li, H.; Huang, X.; Chen, L. Recent advances of electrode materials for low-cost sodium-ion batteries towards practical application for grid energy storage. Energy Storage Mater. 2017, 7, 130–151. [Google Scholar] [CrossRef]
  5. Nitta, N.; Wu, F.; Lee, J.T.; Yushin, G. Li-ion battery materials: present and future. Mater. Today 2015, 18, 252–264. [Google Scholar] [CrossRef]
  6. Meng, J.; Guo, H.; Niu, C.; Zhao, Y.; Xu, L.; Li, Q.; Mai, L. Advances in Structure and Property Optimizations of Battery Electrode Materials. Joule 2017, 1, 522–547. [Google Scholar] [CrossRef]
  7. Ding, Y.; Wang, R.; Wang, L.; Cheng, K.; Zhao, Z.; Mu, D.; Wu, B. A Short Review on Layered LiNi0.8Co0.1Mn0.1O2 Positive Electrode Material for Lithium-ion Batteries. Energy Procedia 2017, 105, 2941–2952. [Google Scholar] [CrossRef]
  8. Ding, Y.; Mu, D.; Wu, B.; Wang, R.; Zhao, Z.; Wu, F. Recent progresses on nickel-rich layered oxide positive electrode materials used in lithium-ion batteries for electric vehicles. Appl. Energy 2017, 195, 586–599. [Google Scholar] [CrossRef]
  9. Manivannan, V.; Chennabasappa, M.; Garrett, J. Optimization and Characterization of Lithium Ion Cathode Materials in the System (1 – x – y)LiNi0.8Co0.2O2 • xLi2MnO3 • yLiCoO2. Energies 2010, 3, 847–866. [Google Scholar] [CrossRef]
  10. Rozier, P.; Tarascon, J.M. Review—Li-Rich Layered Oxide Cathodes for Next-Generation Li-Ion Batteries: Chances and Challenges. J. Electrochem. Soc. 2015, 162, A2490–A2499. [Google Scholar] [CrossRef]
  11. Liu, Q.; Wang, S.; Tan, H.; Yang, Z.; Zeng, J. Preparation and Doping Mode of Doped LiMn2O4 for Li-Ion Batteries. Energies 2013, 6, 1718–1730. [Google Scholar] [CrossRef]
  12. Zhu, W.; Liu, D.; Trottier, J.; Gagnon, C.; Guerfi, A.; Julien, C.M.; Mauger, A.; Zaghib, K. Comparative studies of the phase evolution in M-doped LixMn1.5Ni0.5O4 (M = Co, Al, Cu and Mg) by in-situ X-ray diffraction. J. Power Sources 2014, 264, 290–298. [Google Scholar] [CrossRef]
  13. Yang, J.; Han, X.; Zhang, X.; Cheng, F.; Chen, J. Spinel LiNi0.5Mn1.5O4 cathode for rechargeable lithiumion batteries: Nano vs micro, ordered phase (P4332) vs disordered phase (Fd3-m). Nano Res. 2013, 6, 679–687. [Google Scholar] [CrossRef]
  14. Liu, D.; Lu, Y.; Goodenough, J.B. Rate Properties and Elevated-Temperature Performances of LiNi0.5−xCr2xMn 1.5−xO4 (0 ≤ 2x ≤ 0.8) as 5 V Cathode Materials for Lithium-Ion Batteries. J. Electrochem. Soc. 2010, 157, A1269. [Google Scholar] [CrossRef]
  15. Dimesso, L.; Forster, C.; Jaegermann, W.; Khanderi, J.P.; Tempel, H.; Popp, A.; Engstler, J.; Schneider, J.J.; Sarapulova, A.; Mikhailova, D.; et al. Developments in nanostructured LiMPO4 (M = Fe, Co, Ni, Mn) composites based on three dimensional carbon architecture. Chem. Soc. Rev. 2012, 41, 5068–5680. [Google Scholar] [CrossRef] [PubMed]
  16. Shin, H.C.; Nam, K.W.; Chang, W.Y.; Cho, B.W.; Yoon, W.-S.; Yang, X.-Q.; Chung, K.Y. Comparative studies on C-coated and uncoated LiFePO4 cycling at various rates and temperatures using synchrotron based in situ X-ray diffraction. Electrochim. Acta 2011, 56, 1182–1189. [Google Scholar] [CrossRef]
  17. Joachin, H.; Kaun, T.D.; Zaghib, K.; Prakasha, J. Electrochemical and Thermal Studies of Carbon-Coated LiFePO4 Cathode. J. Electrochem. Soc. 2009, 156, A401–A406. [Google Scholar] [CrossRef]
  18. Kim, M.-S.; Kim, H.-K.; Lee, S.-W.; Kim, D.-H.; Ruan, D.; Chung, K.Y.; Lee, S.H.; Roh, K.C.; Kim, K.-B. Synthesis of Reduced Graphene Oxide-Modified LiMn0.75Fe0.25PO4 Microspheres by Salt-Assisted Spray Drying for High-Performance Lithium-Ion Batteries. Sci. Rep. 2016, 6, 26686. [Google Scholar] [CrossRef] [PubMed]
  19. Liu, D.; Zhu, W.; Kim, C.; Cho, M.; Guerfi, A.; Delp, S.A.; Allen, J.L.; Jow, T.R.; Zaghib, K. High-energy lithium-ion battery using substituted LiCoPO4: From coin type to 1 Ah cell. J. Power Sources 2018, 388, 52–56. [Google Scholar] [CrossRef]
  20. Vijaya Babu, K.; Seeta Devi, L.; Veeraiah, V.; Anand, K. Structural and dielectric studies of LiNiPO4 and LiNi0.5Co0.5PO4 cathode materials for lithium-ion batteries. J. Asian Ceram. Soc. 2016, 4, 269–276. [Google Scholar] [CrossRef]
  21. Qi, X.; Wang, Y.; Jiang, L.; Mu, L.; Zhao, C.; Liu, L.; Hu, Y.-S.; Chen, L.; Huang, X. Sodium-Deficient O3-Na0.9[Ni0.4MnxTi0.6−x]O2 Layered-Oxide Cathode Materials for Sodium-Ion Batteries. Part. Part. Syst. Charact. 2015, 33, 538–544. [Google Scholar] [CrossRef]
  22. Mu, L.; Xu, S.; Li, Y.; Hu, Y.-S.; Li, H.; Chen, L.; Huang, X. Prototype Sodium-Ion Batteries Using an Air-Stable and Co/Ni-Free O3-Layered Metal Oxide Cathode. Adv. Mater. 2015, 27, 6928–6933. [Google Scholar] [CrossRef] [PubMed]
  23. Kim, J.; Seo, D.-H.; Kim, H.; Park, I.; Yoo, J.-K.; Jung, S.-K.; Park, Y.-U.; Goddard, W.A., III; Kang, K. Unexpected discovery of low-cost maricite NaFePO4 as a high-performance electrode for Na-ion batteries. Energy Environ. Sci. 2015, 8, 540–545. [Google Scholar] [CrossRef]
  24. Jian, Z.; Han, W.; Lu, X.; Yang, H.; Hu, Y.-S.; Zhou, J.; Zhou, Z.; Li, J.; Chen, W.; Chen, D.; Chen, L. Superior Electrochemical Performance and Storage Mechanism of Na3V2(PO4)3 Cathode for Room-Temperature Sodium-Ion Batteries. Adv. Energy Mater. 2012, 3, 156–160. [Google Scholar] [CrossRef]
  25. Zhou, W.; Xue, L.; Lü, X.; Gao, H.; Li, Y.; Xin, S.; Fu, G.; Cui, Z.; Zhu, Y.; Goodenough, J.B. NaxMV(PO4)3 (M = Mn, Fe, Ni) Structure and Properties for Sodium Extraction. Nano Lett. 2016, 16, 7836–7841. [Google Scholar] [CrossRef] [PubMed]
  26. Aurbach, D.; Markovsky, B.; Weissman, I.; Levi, E.; Ein-Eli, Y. On the correlation between surface chemistry and performance of graphite negative electrodes for Li ion batteries. Electrochim. Acta 1999, 45, 67–86. [Google Scholar] [CrossRef]
  27. Wang, Y.; Feng, Z.; Zhu, W.; Gariépy, V.; Gagnon, C.; Provencher, M.; Laul, D.; Veillette, R.; Trudeau, M.; Guerfi, A.; et al. High Capacity and High Efficiency Maple Tree-Biomass-Derived Hard Carbon as an Anode Material for Sodium-Ion Batteries. Materials 2018, 11, 1294. [Google Scholar] [CrossRef] [PubMed]
  28. Wang, K.; Jin, Y.; Sun, S.; Huang, Y.; Peng, J.; Luo, J.; Zhang, Q.; Qiu, Y.; Fang, C.; Han, J. Low-Cost and High-Performance Hard Carbon Anode Materials for Sodium-Ion Batteries. ACS Omega 2017, 2, 1687–1695. [Google Scholar] [CrossRef]
  29. He, Y.-B.; Li, B.; Liu, M.; Zhang, C.; Lv, W.; Yang, C.; Li, J.; Du, H.; Zhang, B.; Yang, Q.-H.; et al. Gassing in Li4Ti5O12-based batteries and its remedy. Sci. Rep. 2012, 2, 913. [Google Scholar] [CrossRef] [PubMed]
  30. Han, X.; Ouyang, M.; Lu, L.; Li, J. Cycle Life of Commercial Lithium-Ion Batteries with Lithium Titanium Oxide Anodes in Electric Vehicles. Energies 2014, 7, 4896–4909. [Google Scholar] [CrossRef]
  31. Wen, Y.; He, K.; Zhu, Y.; Han, F.; Xu, Y.; Matsuda, I.; Ishii, Y.; Cumings, J.; Wang, C. Expanded graphite as superior anode for sodium-ion batteries. Nat. Commun. 2014, 5, 4033. [Google Scholar] [CrossRef] [PubMed] [Green Version]
  32. Zhang, J.; Lv, W.; Tao, Y.; He, Y.-B.; Wang, D.-W.; You, C.-H.; Li, B.; Kang, F.; Yang, Q.-H. Ultrafast high-volumetric sodium storage of folded-graphene electrodes through surface-induced redox reactions. Energy Storage Mater. 2015, 1, 112–118. [Google Scholar] [CrossRef]
  33. Liu, S.; Lei, W.; Liu, Y.; Zhang, W.-H. Uniform ReS2 porous nanospheres assembled from curly ReS2 few-layers with an expanded interlayer spacing for high-performance lithium-ion batteries. Chem. Eng. J. 2019, 357, 112–119. [Google Scholar] [CrossRef]
  34. Bella, F.; Muñoz-García, A.B.; Colò, F.; Meligrana, G.; Lamberti, A.; Destro, M.; Pavone, M.; Gerbaldi, C. Combined Structural, Chemometric, and Electrochemical Investigation of Vertically Aligned TiO2 Nanotubes for Na-ion Batteries. ACS Omega 2018, 3, 8440–8450. [Google Scholar] [CrossRef]
  35. Wang, H.; Jiang, Y.; Manthiram, A. N-doped Fe3C@C as an efficient polyselenide reservoir for high-performance sodium-selenium batteries. Energy Storage Mater. 2019, 16, 374–382. [Google Scholar] [CrossRef]
  36. Xu, K. Electrolytes and interphases in Li-ion batteries and beyond. Chem. Rev. 2014, 114, 11503–11618. [Google Scholar] [CrossRef] [PubMed]
  37. Zheng, J.; Lochala, J.A.; Kwok, A.; Deng, Z.D.; Xiao, J. Research Progress towards Understanding the Unique Interfaces between Concentrated Electrolytes and Electrodes for Energy Storage Applications. Adv. Sci. 2017, 4, 1700032. [Google Scholar] [CrossRef] [PubMed] [Green Version]
  38. Scheers, J.; Fantini, S.; Johansson, P. A review of electrolytes for lithium–sulphur batteries. J. Power Sources 2014, 255, 204–218. [Google Scholar] [CrossRef]
  39. Erickson, E.M.; Markevich, E.; Salitra, G.; Sharon, D.; Hirshberg, D.; de la Llave, E.; Shterenberg, I.; Rozenman, A.; Frimer, A.; Aurbach, D. Review—Development of Advanced Rechargeable Batteries: A Continuous Challenge in the Choice of Suitable Electrolyte Solutions. J. Electrochem. Soc. 2015, 162, A2424–A2438. [Google Scholar] [CrossRef]
  40. Cheng, X.B.; Zhang, R.; Zhao, C.Z.; Wei, F.; Zhang, J.G.; Zhang, Q. A Review of Solid Electrolyte Interphases on Lithium Metal Anode. Adv. Sci. 2016, 3, 1500213. [Google Scholar] [CrossRef] [PubMed]
  41. Zhou, Q.; Henderson, W.A.; Appetecchi, G.B.; Montanino, M.; Passerini, S. Physical and Electrochemical Properties of N-Alkyl-N-methylpyrrolidinium Bis(fluorosulfonyl)imide Ionic Liquids: PY13FSI and PY14FSI. J. Phys. Chem. B 2008, 112, 13577–13580. [Google Scholar] [CrossRef] [PubMed]
  42. Nazet, A.; Sokolov, S.; Sonnleitner, T.; Makino, T.; Kanakubo, M.; Buchner, R. Densities, Viscosities, and Conductivities of the Imidazolium Ionic Liquids [Emim][Ac], [Emim][FAP], [Bmim][BETI], [Bmim][FSI], [Hmim][TFSI], and [Omim][TFSI]. J. Chem. Eng. Data 2015, 60, 2400–2411. [Google Scholar] [CrossRef]
  43. Moreno, M.; Simonetti, E.; Appetecchi, G.B.; Carewska, M.; Montanino, M.; Kim, G.T.; Loeffler, N.; Passerini, S. Ionic Liquid Electrolytes for Safer Lithium Batteries. J. Electrochem. Soc. 2016, 164, A6026–A6031. [Google Scholar] [CrossRef] [Green Version]
  44. Marczewski, M.J.; Stanje, B.; Hanzu, I.; Wilkening, M.; Johansson, P. “Ionic liquids-in-salt”—A promising electrolyte concept for high-temperature lithium batteries? Phys. Chem. Chem. Phys. 2014, 16, 12341–12349. [Google Scholar] [CrossRef] [PubMed]
  45. Colò, F.; Bella, F.; Nair, J.R.; Gerbaldi, C. Light-cured polymer electrolytes for safe, low-cost and sustainable sodium-ion batteries. J. Power Sources 2017, 365, 293–302. [Google Scholar] [CrossRef]
  46. Edman, L. Ion Association and Ion Solvation Effects at the Crystalline−Amorphous Phase Transition in PEO−LiTFSI. J. Phys. Chem. B 2000, 104, 7254–7258. [Google Scholar] [CrossRef]
  47. Das, S.; Ghosh, A. Structure, ion transport, and relaxation dynamics of polyethylene oxide/poly (vinylidene fluoride co-hexafluoropropylene)—lithium bis(trifluoromethane sulfonyl) imide blend polymer electrolyte embedded with ionic liquid. J. Appl. Phys. 2016, 119, 095101. [Google Scholar] [CrossRef]
  48. Chan, C.K.; Yang, T.; Mark Weller, J. Nanostructured Garnet-type Li7La3Zr2O12: Synthesis, Properties, and Opportunities as Electrolytes for Li-ion Batteries. Electrochim. Acta 2017, 253, 268–280. [Google Scholar] [CrossRef]
  49. Wu, J.-F.; Chen, E.-Y.; Yu, Y.; Liu, L.; Wu, Y.; Pang, W.K.; Peterson, V.K.; Guo, X. Gallium-Doped Li7La3Zr2O12 Garnet-Type Electrolytes with High Lithium-Ion Conductivity. ACS Appl. Mater. Inter. 2017, 9, 1542–1552. [Google Scholar] [CrossRef] [PubMed]
  50. Xie, H.; Li, Y.; Goodenough, J.B. Low-temperature synthesis of Li7La3Zr2O12 with cubic garnet-type structure. Mater. Res. Bull. 2012, 47, 1229–1232. [Google Scholar] [CrossRef]
  51. Ooms, F.G.B.; Wagemaker, M.; van Well, A.A.; Mulder, F.M.; Kelder, E.M.; Schoonman, J. Structure determination of high-voltage LiMgδNi0.5-δMn1.5O4 spinels for Li-ion batteries. Appl. Phys. A 2002, 74, s1089–s1091. [Google Scholar] [CrossRef]
  52. Fürtauer, S.; Effenberger, H.S.; Flandorfer, H. CuLi2Sn and Cu2LiSn: Characterization by single crystal XRD and structural discussion towards new anode materials for Li-ion batteries. J. Solid State Chem. 2014, 220, 198–205. [Google Scholar] [CrossRef] [PubMed]
  53. Boivin, E.; Masquelier, C.; Croguennec, L.; Chotard, J.-N. Crystal Structure and Lithium Diffusion Pathways of a Potential Positive Electrode Material for Lithium-Ion Batteries: Li2VIII(H0.5PO4)2. Inorg. Chem. 2017, 56, 6776–6779. [Google Scholar] [CrossRef] [PubMed]
  54. Reimers, J.N.; Dahn, J.R. Electrochemical and In Situ X-ray Diffraction Studies of Lithium Intercalation in LixCo02. J. Electrochem. Soc. 1992, 139, 2091–2097. [Google Scholar] [CrossRef]
  55. Whitehead, A.H.; Edstrtim, K.; Rao, N.; Owen, J.R. In situ X-ray diffraction studies of a graphite-based Li-ion battery negative electrode. J. Power Sources 1996, 63, 41–45. [Google Scholar] [CrossRef]
  56. Yang, X.Q.; McBreen, J.; Yoon, W.-W.; Grey, C.P. Crystal structure changes of LiMn0.5Ni0.5O2 cathode materials during charge and discharge studied by synchrotron based in situ XRD. Electrochem. Commun. 2002, 4, 649–654. [Google Scholar] [CrossRef]
  57. Zhang, X.; Kuhnel, R.-S.; Schroeder, M.; Balducci, A. Revisiting Li3V2(PO4)3 as an anode—An outstanding negative electrode for high power energy storage devices. J. Mater. Chem. Phys. 2014, 2, 17906–17913. [Google Scholar] [CrossRef]
  58. Wang, H.; Wang, F. In situ, operando measurements of rechargeable batteries. Curr. Opin. Chem. Eng. 2016, 13, 170–178. [Google Scholar] [CrossRef] [Green Version]
  59. Zhang, G.; Xiong, T.; He, L.; Yan, M.; Zhao, K.; Xu, X.; Mai, L. Electrochemical in situ X-ray probing in lithium-ion and sodium-ion batteries. J. Mater. Sci. 2017, 52, 3697–3718. [Google Scholar] [CrossRef]
  60. Sun, Y.; Zhao, L.; Pan, H.; Lu, X.; Gu, L.; Hu, Y.S.; Li, H.; Armand, M.; Ikuhara, Y.; Chen, L.; et al. Direct atomic-scale confirmation of three-phase storage mechanism in Li4Ti5O12 anodes for room-temperature sodium-ion batteries. Nat. Commun. 2013, 4, 1870. [Google Scholar] [CrossRef] [PubMed]
  61. Bobrikov, I.A.; Samoylova, N.Y.; Sumnikov, S.V.; Ivanshina, O.Y.; Vasin, R.N.; Beskrovnyi, A.I.; Balagurov, A.M. In-situ time-of-flight neutron diffraction study of the structure evolution of electrode materials in a commercial battery with LiNi0.8Co0.15Al0.05O2 cathode. J. Power Sources 2017, 372, 74–81. [Google Scholar] [CrossRef]
  62. Dolotko, O.; Senyshyn, A.; Mühlbauer, M.J.; Nikolowski, K.; Ehrenberg, H. Understanding structural changes in NMC Li-ion cells by in situ neutron diffraction. J. Power Sources 2014, 255, 197–203. [Google Scholar] [CrossRef]
  63. Li, J.; Petibon, R.; Glazier, S.; Sharma, N.; Pang, W.K.; Peterson, V.K.; Dahn, J.R. In-situ Neutron Diffraction Study of a High Voltage Li(Ni0.42Mn0.42Co0.16)O2/Graphite Pouch Cell. Electrochim. Acta 2015, 180, 234–240. [Google Scholar] [CrossRef]
  64. Wang, X.L.; An, K.; Cai, L.; Feng, Z.; Nagler, S.E.; Daniel, C.; Rhodes, K.J.; Stoica, A.D.; Skorpenske, H.D.; Liang, C.; et al. Visualizing the chemistry and structure dynamics in lithium-ion batteries by in-situ neutron diffraction. Sci. Rep. 2012, 2, 747. [Google Scholar] [CrossRef] [PubMed] [Green Version]
  65. Bobrikova, I.A.; Hub, C.W.; Lee, C.H.; Chenb, T.Y.; Deleg, S.; Balagurova, D.A. Structural evolution in LiFePO4-based battery materials: In-situ and ex-situ time-of-flight neutron diffraction study. J. Power Sources 2014, 258, 356–364. [Google Scholar] [CrossRef]
  66. Sottmann, J.; DiMichiel, M.; Fjellvåg, H.; Malavasi, L.; Margadonna, S.; Vajeeston, P.; Vaughan, G.B.M.; Wragg, D.S. Chemical Structures of Specific Sodium Ion Battery Components Determined by Operando Pair Distribution Function and X-ray Diffraction Computed Tomography. Angew. Chem. Int. Edit. 2017, 56, 11385–11389. [Google Scholar] [CrossRef] [PubMed] [Green Version]
  67. Wang, J.; Chen-Wiegart, Y.-C.K.; Wang, J. In operando tracking phase transformation evolution of lithium iron phosphate with hard X-ray microscopy. Nat. Commun. 2014, 5, 4570. [Google Scholar] [CrossRef] [PubMed] [Green Version]
  68. Chan, H.-W.; Duh, J.-G.; Lee, J.-F. Valence change by in situ XAS in surface modified LiMn2O4 for Li-ion battery. Electrochem. Commun. 2006, 8, 1731–1736. [Google Scholar] [CrossRef]
  69. Dominko, R.; Arčon, I.; Kodre, A.; Hanžel, D.; Gaberšček, M. In-situ XAS study on Li2MnSiO4 and Li2FeSiO4 cathode materials. J. Power Sources 2009, 189, 51–58. [Google Scholar] [CrossRef]
  70. Fehse, M.; Monconduit, L.; Fischer, F.; Tessier, C.; Stievano, L. Study of the insertion mechanism of lithium into anatase by operando X-ray diffraction and absorption spectroscopy. Solid State Ion. 2014, 268, 252–255. [Google Scholar] [CrossRef]
  71. Giorgetti, M. A Review on the Structural Studies of Batteries and Host Materials by X-ray Absorption Spectroscopy. ISRN Mater. Sci. 2013, 2013, 1–22. [Google Scholar] [CrossRef]
  72. Giuliana, A.; Marco, G.; Robert, D.; Lorenzo, S.; Iztok, A.; Nicola, N.; Luca, O. Operando characterization of batteries using X-ray absorption spectroscopy: Advances at the beamline XAFS at synchrotron Elettra. J. Phys. D Appl. Phys. 2017, 50, 074001. [Google Scholar] [CrossRef]
  73. Menzel, M.; Schlifke, A.; Falk, M.; Janek, J.; Fröba, M.; Fittschen, U.E.A. Surface and in-depth characterization of lithium-ion battery cathodes at different cycle states using confocal micro-X-ray fluorescence-X-ray absorption near edge structure analysis. Spectrochim. Acta B 2013, 85, 62–70. [Google Scholar] [CrossRef]
  74. Dokko, K.; Mohamedi, M.; Anzue, N.; Itoh, T.; Uchida, I. In situ Raman spectroscopic studies of LiNixMn2−xO4thin film cathode materials for lithium ion secondary batteries. J. Mater. Chem. 2002, 12, 3688–3693. [Google Scholar] [CrossRef]
  75. Hardwick, L.J.; Ruch, P.W.; Hahn, M.; Scheifele, W.; Kötz, R.; Novák, P. In situ Raman spectroscopy of insertion electrodes for lithium-ion batteries and supercapacitors: First cycle effects. J. Phys. Chem. Solids 2008, 69, 1232–1237. [Google Scholar] [CrossRef]
  76. Wu, J.; Dathar, G.K.; Sun, C.; Theivanayagam, M.G.; Applestone, D.; Dylla, A.G.; Manthiram, A.; Henkelman, G.; Goodenough, J.B.; Stevenson, K.J. In situ Raman spectroscopy of LiFePO4: size and morphology dependence during charge and self-discharge. Nanotechnology 2013, 24, 9. [Google Scholar] [CrossRef] [PubMed]
  77. Membreno, N.; Xiao, P.; Park, K.S.; Goodenough, J.B.; Henkelman, G.; Stevenso, K.J. In Situ Raman Study of Phase Stability of α-Li3V2(PO4)3 upon Thermal and Laser Heating. J. Phys. Chem. C 2013, 117, 11994–12002. [Google Scholar] [CrossRef]
  78. Stancovski, V.; Badilescu, S. In situ Raman spectroscopic–electrochemical studies of lithium-ion battery materials: a historical overview. J. Appl. Electrochem. 2014, 44, 23–43. [Google Scholar] [CrossRef]
  79. Aurbach, D.; Chusid, O. The use of in situ Fourier-transform infrared spectroscopy for the study of surface phenomena on electrodes in selected lithium battery electrolyte solutions. J. Power Sources 1997, 68, 463–470. [Google Scholar] [CrossRef]
  80. Cheng, H.; Zhu, C.B.; Lu, M.; Yang, Y. In situ micro-FTIR study of the solid–solid interface between lithium electrode and polymer electrolytes. J. Power Sources 2007, 174, 1027–1031. [Google Scholar] [CrossRef]
  81. Chusid, O.; Gofer, Y.; Aurbach, D.; Watanabe, M.; Momma, T.; Osaka, T. Studies of the interface between lithium electrodes and polymeric electrolyte systems using in situ FTIR spectroscopy. J. Power Sources 2001, 97–98, 632–636. [Google Scholar] [CrossRef]
  82. Ye, J.-Y.; Jiang, Y.-X.; Sheng, T.; Sun, S.-G. In-situ FTIR spectroscopic studies of electrocatalytic reactions and processes. Nano Energy 2016, 29, 414–427. [Google Scholar] [CrossRef]
  83. Hovington, P.; Dontigny, M.; Guerfi, A.; Trottier, J.; Lagacé, M.; Mauger, A.; Julien, C.M.; Zaghib, K. In situ Scanning electron microscope study and microstructural evolution of nano silicon anode for high energy Li-ion batteries. J. Power Sources 2014, 248, 457–464. [Google Scholar] [CrossRef]
  84. Marceau, H.; Kim, C.-S.; Paolella, A.; Ladouceur, S.; Lagacé, M.; Chaker, M.; Vijh, A.; Guerfi, A.; Julien, C.M.; Mauger, A.; et al. In operando scanning electron microscopy and ultraviolet–visible spectroscopy studies of lithium/sulfur cells using all solid-state polymer electrolyte. J. Power Sources 2016, 319, 247–254. [Google Scholar] [CrossRef]
  85. Miller, D.J.; Proff, C.; Wen, J.G.; Abraham, D.P.; Bareño, J. Observation of Microstructural Evolution in Li Battery Cathode Oxide Particles by In Situ Electron Microscopy. Adv. Energy Mater. 2013, 3, 1098–1103. [Google Scholar] [CrossRef]
  86. Liu, S.; Xie, J.; Su, Q.; Du, G.; Zhang, S.; Cao, G.; Zhu, T.; Zhao, X. Understanding Li-storage mechanism and performance of MnFe2O4 by in situ TEM observation on its electrochemical process in nano lithium battery. Nano Energy 2014, 8, 84–94. [Google Scholar] [CrossRef]
  87. Chen, K.; Cao, K.; Xing, C.; Hu, Y.; Liu, J.; He, Y.; Wang, J.; Li, A.; Qin, H. In-situ TEM study of the lithiation and delithiation of FeS nanosheets. J. Alloy. Compd. 2016, 688, 946–952. [Google Scholar] [CrossRef]
  88. Janish, M.T.; Carter, C.B. In situ TEM observations of the lithiation of molybdenum disulfide. Scr. Mater. 2015, 107, 22–25. [Google Scholar] [CrossRef] [Green Version]
  89. Wang, C.M. In situ transmission electron microscopy and spectroscopy studies of rechargeable batteries under dynamic operating conditions: A retrospective and perspective view. J. Mater. Res. 2015, 30, 326–339. [Google Scholar] [CrossRef]
  90. Xu, Z.-L.; Cao, K.; Abouali, S.; Akbari Garakani, M.; Huang, J.; Huang, J.-Q.; Kamali Heidari, E.; Wang, H.; Kim, J.-K. Study of lithiation mechanisms of high performance carbon-coated Si anodes by in-situ microscopy. Energy Storage Mater. 2016, 3, 45–54. [Google Scholar] [CrossRef]
  91. Zhu, Y.; Wang, J.W.; Liu, Y.; Liu, X.; Kushima, A.; Liu, Y.; Xu, Y.; Mao, S.X.; Li, J.; Wang, C.; et al. In Situ Atomic-Scale Imaging of Phase Boundary Migration in FePO4 Microparticles During Electrochemical Lithiation. Adv. Mater. 2013, 25, 5461–5466. [Google Scholar] [CrossRef] [PubMed]
  92. Orikasa, Y.; Maeda, T.; Koyama, Y.; Murayama, H.; Fukuda, K.; Tanida, H.; Arai, H.; Matsubara, E.; Uchimoto, Y.; Ogumi, Z. Direct Observation of a Metastable Crystal Phase of LixFePO4 under Electrochemical Phase Transition. J. Am. Chem. Soc. 2013, 135, 5497–5500. [Google Scholar] [CrossRef] [PubMed]
  93. Bak, S.-M.; Hu, E.; Zhou, Y.; Yu, X.; Senanayake, S.D.; Cho, S.-J.; Kim, K.-B.; Chung, K.Y.; Yang, X.-Q.; Nam, K.-W. Structural Changes and Thermal Stability of Charged LiNixMnyCozO2 Cathode Materials Studied by Combined In Situ Time-Resolved XRD and Mass Spectroscopy. ACS Appl. Mater. Interfaces 2014, 6, 22594–22601. [Google Scholar] [CrossRef] [PubMed]
  94. Li, J.; Shunmugasundaram, R.; Doig, R.; Dahn, J.R. In Situ X-ray Diffraction Study of Layered Li–Ni–Mn–Co Oxides: Effect of Particle Size and Structural Stability of Core–Shell Materials. Chem. Mater. 2016, 28, 162–171. [Google Scholar] [CrossRef]
  95. Kim, H.; Hong, J.; Yoon, G.; Kim, H.; Park, K.-Y.; Park, M.-S.; Yoon, W.-S.; Kang, K. Sodium intercalation chemistry in graphite. Energy Environ. Sci. 2015, 8, 2963–2969. [Google Scholar] [CrossRef]
  96. Wang, P.-F.; Yao, H.-R.; Liu, X.-Y.; Yin, Y.-X.; Zhang, J.-N.; Wen, Y.; Yu, X.; Gu, L.; Guo, Y.-G. Na+/vacancy disordering promises high-rate Na-ion batteries. Sci. Adv. 2018, 4, eaar6018. [Google Scholar] [CrossRef] [PubMed]
  97. Qiu, S.; Xiao, L.; Sushko, M.L.; Han, K.S.; Shao, Y.; Yan, M.; Liang, X.; Mai, L.; Feng, F.; Cao, Y.; et al. Manipulating Adsorption–Insertion Mechanisms in Nanostructured Carbon Materials for High-Efficiency Sodium Ion Storage. Adv. Energy Mater. 2017, 7, 1700403. [Google Scholar] [CrossRef]
  98. Bock, D.C.; Pelliccione, C.J.; Zhang, W.; Timoshenko, J.; Knehr, K.W.; West, A.C.; Wang, F.; Li, Y.; Frenkel, A.I.; Takeuchi, E.S.; et al. Size dependent behavior of Fe3O4 crystals during electrochemical (de)lithiation: An in situ X-ray diffraction, ex situ X-ray absorption spectroscopy, transmission electron microscopy and theoretical investigation. Phys. Chem. Chem. Phys. 2017, 19, 20867–20880. [Google Scholar] [CrossRef] [PubMed]
  99. Yu, X.; Pan, H.; Wan, W.; Ma, M.; Bai, J.; Meng, Q.; Ehrlich, S.N.; Hu, Y.S.; Yang, X.Q. A Size-Dependent Sodium Storage Mechanism in Li4Ti5O12 Investigated by a Novel Characterization Technique Combining in Situ X-ray Diffraction and Chemical Sodiation. Nano Lett. 2013, 13, 4721–4727. [Google Scholar] [CrossRef] [PubMed]
  100. Orikasa, Y.; Maeda, T.; Koyama, Y.; Murayama, H.; Fukuda, K.; Tanida, H.; Arai, H.; Matsubara, E.; Uchimoto, Y.; Ogumi, Z. Transient Phase Change in Two Phase Reaction between LiFePO4 and FePO4 under Battery Operation. Chem. Mater. 2013, 25, 1032–1039. [Google Scholar] [CrossRef]
  101. Fell, C.R.; Chi, M.; Meng, Y.S.; Jones, J.L. In situ X-ray diffraction study of the lithium excess layered oxide compound Li[Li0.2Ni0.2Mn0.6]O2 during electrochemical cycling. Solid State Ion. 2012, 207, 44–49. [Google Scholar] [CrossRef]
  102. Muhammad, S.; Lee, S.; Kim, H.; Yoon, J.; Jang, D.; Yoon, J.; Park, J.-H.; Yoon, W.-S. Deciphering the thermal behavior of lithium rich cathode material by in situ X-ray diffraction technique. J. Power Sources 2015, 285, 156–160. [Google Scholar] [CrossRef]
  103. Yao, K.P.C.; Kwabi, D.G.; Quinlan, R.A.; Mansour, A.N.; Grimaud, A.; Lee, Y.-L.; Lu, Y.-C.; Shao-Horn, Y. Thermal Stability of Li2O2 and Li2O for Li-Air Batteries: In Situ XRD and XPS Studies. J. Electrochem. Soc. 2013, 160, A824–A831. [Google Scholar] [CrossRef]
  104. Cañas, N.A.; Einsiedel, P.; Freitag, O.T.; Heim, C.; Steinhauer, M.; Park, D.-W.; Friedrich, K.A. Operando X-ray diffraction during battery cycling at elevated temperatures: A quantitative analysis of lithium-graphite intercalation compounds. Carbon 2017, 116, 255–263. [Google Scholar] [CrossRef]
  105. Kim, U.-H.; Myung, S.-T.; Yoon, C.S.; Sun, Y.-K. Extending the Battery Life Using an Al-Doped Li[Ni0.76Co0.09Mn0.15]O2 Cathode with Concentration Gradients for Lithium Ion Batteries. ACS Energy Lett. 2017, 2, 1848–1854. [Google Scholar] [CrossRef]
  106. Ma, H.; Su, H.; Amine, K.; Liu, X.; Jaffer, S.; Shang, T.; Gu, L.; Yu, H. Triphase electrode performance adjustment for rechargeable ion batteries. Nano Energy 2018, 43, 1–10. [Google Scholar] [CrossRef]
  107. Krumeich, F.; Waser, O.; Pratsinis, S.E. Thermal annealing dynamics of carbon-coated LiFePO4 nanoparticles studied by in-situ analysis. J. Solid State Chem. 2016, 242, 96–102. [Google Scholar] [CrossRef]
  108. Bleith, P.; Kaiser, H.; Novák, P.; Villevieille, C. In situ X-ray diffraction characterisation of Fe0.5TiOPO4 and Cu0.5TiOPO4 as electrode material for sodium-ion batteries. Electrochim. Acta 2015, 176, 18–21. [Google Scholar] [CrossRef]
  109. Zhu, W.; Liu, D.; Trottier, J.; Gagnon, C.; Mauger, A.; Julien, C.M.; Zaghib, K. In-situ X-ray diffraction study of the phase evolution in undoped and Cr-doped LixMn1.5Ni0.5O4 (0.1 < x < 1.0) 5-V cathode materials. J. Power Sources 2013, 242, 236–243. [Google Scholar] [CrossRef]
  110. Roberts, M.R.; Madsen, A.; Nicklin, C.; Rawle, J.; Palmer, M.G.; Owen, J.R.; Hector, A.L. Direct Observation of Active Material Concentration Gradients and Crystallinity Breakdown in LiFePO4 Electrodes During Charge/Discharge Cycling of Lithium Batteries. J. Phys. Chem. C 2014, 118, 6548–6557. [Google Scholar] [CrossRef] [PubMed]
  111. Li, W.; Reimers, J.N.; Dahn, J.R. In situ X-ray diffraction and electrochemical studies of Li1-xNiO2. Solid State Ion. 1993, 67, 123–130. [Google Scholar] [CrossRef]
  112. Leriche, J.B.; Hamelet, S.; Shu, J.; Morcrette, M.; Masquelier, C.; Ouvrard, G.; Zerrouki, M.; Soudan, P.; Belin, S.; Elkaïm, E.; et al. An Electrochemical Cell for Operando Study of Lithium Batteries Using Synchrotron Radiation. J. Electrochem. Soc. 2010, 157, A606. [Google Scholar] [CrossRef]
  113. Lowe, M.A.; Gao, J.; Abruña, H.D. Mechanistic insights into operational lithium–sulfur batteries by in situ X-ray diffraction and absorption spectroscopy. RSC Adv. 2014, 4, 18347. [Google Scholar] [CrossRef]
  114. Sasaki, T.; Villevieill, C.; Takeuchi, Y.; Novák, P. Understanding Inhomogeneous Reactions in Li-Ion Batteries: Operando Synchrotron X-ray Diffraction on Two-Layer Electrodes. Adv. Sci. 2015, 1500083. [Google Scholar] [CrossRef] [PubMed]
  115. Ma, R.; Shao, L.; Wu, K.; Shui, M.; Wang, D.; Pan, J.; Long, N.; Ren, Y.; Shu, J. Comparison of LiVPO4F to Li4Ti5O12 as anode materials for lithium-ion batteries. ACS Appl. Mater. Interfaces 2013, 5, 8615–8627. [Google Scholar] [CrossRef] [PubMed]
  116. Zhou, H.; Einarsrud, M.-A.; Vullum-Bruer, F. In situ X-ray diffraction and electrochemical impedance spectroscopy of a nanoporous Li2FeSiO4/C cathode during the initial charge/discharge cycle of a Li-ion battery. J. Power Sources 2013, 238, 478–484. [Google Scholar] [CrossRef]
  117. Mohanty, D.; Kalnaus, S.; Meisner, R.A.; Rhodes, K.J.; Li, J.; Payzant, E.A.; Wood, D.L.; Daniel, C. Structural transformation of a lithium-rich Li1.2Co0.1Mn0.55Ni0.15O2 cathode during high voltage cycling resolved by in situ X-ray diffraction. J. Power Sources 2013, 229, 239–248. [Google Scholar] [CrossRef]
  118. Morcrette, M.; Chabre, Y.; Vaughan, G.; Amatucci, G.; Leriche, J.B.; Patoux, S.; Masquelier, C.; Tarascon, J.M. In situ X-ray diffraction techniques as a powerful tool to study battery electrode materials. Electrochim. Acta 2002, 47, 3137–3149. [Google Scholar] [CrossRef]
  119. He, H.; Huang, C.; Luo, C.-W.; Liu, J.-J.; Chao, Z.-S. Dynamic study of Li intercalation into graphite by in situ high energy synchrotron XRD. Electrochim. Acta 2013, 92, 148–152. [Google Scholar] [CrossRef]
  120. Harks, P.P.R.M.L.; Mulder, F.M.; Notten, P.H.L. In situ methods for Li-ion battery research: A review of recent developments. J. Power Sources 2015, 288, 92–105. [Google Scholar] [CrossRef] [Green Version]
  121. Xu, F.; He, H.; Liu, Y.; Dun, C.; Ren, Y.; Liu, Q.; Wang, M.-X.; Xie, J. Failure Investigation of LiFePO4 Cells under Overcharge Conditions. J. Electrochem. Soc. 2012, 159, A678–A687. [Google Scholar] [CrossRef]
  122. Liu, Q.; Liu, Y.; Yang, F.; He, H.; Xiao, X.; Ren, Y.; Lu, W.; Stach, E.; Xie, J. Capacity Fading Mechanism of the Commercial 18650 LiFePO4-Based Lithium-Ion Batteries: An in Situ Time-Resolved High-Energy Synchrotron XRD Study. ACS Appl. Mater. Interfaces 2018, 10, 4622–4629. [Google Scholar] [CrossRef] [PubMed]
  123. Sarkar, S.; Mitra, S. Carbon Coated Submicron sized-LiFePO4: Improved High Rate Performance Lithium Battery Cathode. Energy Procedia 2014, 54, 718–724. [Google Scholar] [CrossRef]
  124. Zhao, N.; Li, Y.; Zhi, X.; Wang, L.; Zhao, X.; Wang, Y.; Liang, G. Effect of Ce3+ doping on the properties of LiFePO4 cathode material. J. Rare Earths 2016, 34, 174–180. [Google Scholar] [CrossRef]
  125. MacNeil, D.D.; Lu, Z.; Chen, Z.; Dahn, J.R. A comparison of the electrode/electrolyte reaction at elevated temperatures for various Li-ion battery cathodes. J. Power Sources 2002, 108, 8–14. [Google Scholar] [CrossRef]
  126. Islam, M.S.; Driscoll, D.J.; Fisher, C.A.J.; Slater, P.R. Atomic-Scale Investigation of Defects, Dopants, and Lithium Transport in the LiFePO4 Olivine-Type Battery Material. Chem. Mater. 2005, 17, 5085–5092. [Google Scholar] [CrossRef]
  127. Allen, J.L.; Jow, T.R.; Wolfenstine, J. Kinetic Study of the Electrochemical FePO4 to LiFePO4 Phase Transition. Chem. Mater. 2007, 19, 2108–2111. [Google Scholar] [CrossRef]
  128. Yamada, A.; Koizumi, H.; Sonoyama, N.; Kanno, R. Phase Change in LixFePO4. Electrochem. Solid-State Lett. 2005, 8, A409–A413. [Google Scholar] [CrossRef]
  129. Sharma, N.; Guo, X.; Du, G.; Guo, Z.; Wang, J.; Wang, Z.; Peterson, V.K. Direct Evidence of Concurrent Solid-Solution and Two-Phase Reactions and the Nonequilibrium Structural Evolution of LiFePO4. J. Am. Chem. Soc. 2012, 134, 7867–7873. [Google Scholar] [CrossRef] [PubMed]
  130. Yamada, A.; Koizumi, H.; Nishimura, S.-I.; Sonoyama, N.; Kanno, R.; Yonemura, M.; Nakamura, T.; Kobayashi, Y. Room-temperature miscibility gap in LixFePO4. Nat. Mater. 2006, 5, 357. [Google Scholar] [CrossRef] [PubMed]
  131. Chen, G.; Song, X.; Richardson, T.J. Electron Microscopy Study of the LiFePO4 to FePO4 Phase Transition. Electrochem. Solid-State Lett. 2006, 9, A295–A298. [Google Scholar] [CrossRef]
  132. Laffont, L.; Delacourt, C.; Gibot, P.; Wu, M.Y.; Kooyman, P.; Masquelier, C.; Tarascon, J.M. Study of the LiFePO4/FePO4 Two-Phase System by High-Resolution Electron Energy Loss Spectroscopy. Chem. Mater. 2006, 18, 5520–5529. [Google Scholar] [CrossRef]
  133. Andersson, A.S.; Kalska, B.; Häggström, L.; Thomas, J.O. Lithium extraction/insertion in LiFePO4: An X-ray diffraction and Mössbauer spectroscopy study. Solid State Ion. 2000, 130, 41–52. [Google Scholar] [CrossRef]
  134. Shin, H.C.; Chung, K.Y.; Min, W.S.; Byun, D.J.; Jang, H.; Cho, B.W. Asymmetry between charge and discharge during high rate cycling in LiFePO4—In Situ X-ray diffraction study. Electrochem. Commun. 2008, 10, 536–540. [Google Scholar] [CrossRef]
  135. Tan, H.J.; Dodd, J.L.; Fultz, B. Thermodynamic and Kinetic Stability of the Solid Solution Phase in Nanocrystalline LixFePO4. J. Phys. Chem. C 2009, 113, 20527–20530. [Google Scholar] [CrossRef]
  136. Li, D.; Zhou, H. Two-phase transition of Li-intercalation compounds in Li-ion batteries. Mater. Today 2014, 17, 451–463. [Google Scholar] [CrossRef]
  137. Li, Z.; Yang, J.; Li, C.; Wang, S.; Zhang, L.; Zhu, K.; Wang, X. Orientation-Dependent Lithium Miscibility Gap in LiFePO4. Chem. Mater. 2018, 30, 874–878. [Google Scholar] [CrossRef]
  138. Wagemaker, M.; Singh, D.P.; Borghols, W.J.H.; Lafont, U.; Haverkate, L.; Peterson, V.K.; Mulder, F.M. Dynamic Solubility Limits in Nanosized Olivine LiFePO4. J. Am. Chem. Soc. 2011, 133, 10222–10228. [Google Scholar] [CrossRef] [PubMed]
  139. Kobayashi, G.; Nishimura, S.-I.; Park, M.-S.; Kanno, R.; Yashima, M.; Ida, T.; Yamada, A. Isolation of Solid Solution Phases in Size-Controlled LixFePO4 at Room Temperature. Adv. Funct. Mater. 2008, 19, 395–403. [Google Scholar] [CrossRef]
  140. Takahashi, I.; Mori, T.; Yoshinari, T.; Orikasa, Y.; Koyama, Y.; Murayama, H.; Fukuda, K.; Hatano, M.; Arai, H.; Uchimoto, Y.; et al. Irreversible phase transition between LiFePO4 and FePO4 during high-rate charge-discharge reaction by operando X-ray diffraction. J. Power Sources 2016, 309, 122–126. [Google Scholar] [CrossRef]
  141. Liu, H.; Strobridge, F.C.; Borkiewicz, O.J.; Wiaderek, K.M.; Chapman, K.W.; Chupas, P.J.; Grey, C.P. Capturing metastable structures during high-rate cycling of LiFePO4 nanoparticle electrodes. Science 2014, 344, 1252817. [Google Scholar] [CrossRef] [PubMed]
  142. Cogswell, D.A.; Bazant, M.Z. Coherency Strain and the Kinetics of Phase Separation in LiFePO4 Nanoparticles. ACS Nano 2012, 6, 2215–2225. [Google Scholar] [CrossRef] [PubMed]
  143. Van der Ven, A.; Garikipati, K.; Kim, S.; Wagemaker, M. The Role of Coherency Strains on Phase Stability in LixFePO4: Needle Crystallites Minimize Coherency Strain and Overpotential. J. Electrochem. Soc. 2009, 156, A949–A957. [Google Scholar] [CrossRef]
  144. Meethong, N.; Huang, H.-Y.S.; Carter, W.C.; Chiang, Y.-M. Size-Dependent Lithium Miscibility Gap in Nanoscale Li1−x FePO4. Electrochem. Solid-State Lett. 2007, 10, A134–A138. [Google Scholar] [CrossRef]
  145. Bai, P.; Cogswell, D.A.; Bazant, M.Z. Suppression of Phase Separation in LiFePO4 Nanoparticles During Battery Discharge. Nano Lett. 2011, 11, 4890–4896. [Google Scholar] [CrossRef] [PubMed]
  146. Malik, R.; Zhou, F.; Ceder, G. Kinetics of non-equilibrium lithium incorporation in LiFePO4. Nat. Mater. 2011, 10, 587. [Google Scholar] [CrossRef] [PubMed]
  147. Yan, M.; Zhang, G.; Wei, Q.; Tian, X.; Zhao, K.; An, Q.; Zhou, L.; Zhao, Y.; Niu, C.; Ren, W.; et al. In operando observation of temperature-dependent phase evolution in lithium-incorporation olivine cathode. Nano Energy 2016, 22, 406–413. [Google Scholar] [CrossRef]
  148. Galceran, M.; Saurel, D.; Acebedo, B.; Roddatis, V.V.; Martin, E.; Rojo, T.; Casas-Cabanas, M. The mechanism of NaFePO4 (de)sodiation determined by in situ X-ray diffraction. Phys. Chem. Chem. Phys. 2014, 16, 8837–8842. [Google Scholar] [CrossRef] [PubMed]
  149. Moreau, P.; Guyomard, D.; Gaubicher, J.; Boucher, F. Structure and Stability of Sodium Intercalated Phases in Olivine FePO4. Chem. Mater. 2010, 22, 4126–4128. [Google Scholar] [CrossRef]
  150. Lu, J.; Chung, S.C.; Nishimura, S.-I.; Yamada, A. Phase Diagram of Olivine NaxFePO4 (0 < x < 1). Chem. Mater. 2013, 25, 4557–4565. [Google Scholar] [CrossRef]
  151. Chung, K.Y.; Yoon, W.-S.; Lee, H.S.; McBreen, J.; Yang, X.-Q.; Oh, S.H.; Ryu, W.H.; Lee, J.L.; Cho, W.I.; Cho, B.W. In situ XRD studies of the structural changes of ZrO2-coated LiCoO2 during cycling and their effects on capacity retention in lithium batteries. J. Power Sources 2006, 163, 185–190. [Google Scholar] [CrossRef]
  152. Chung, K.Y.; Yoon, W.-S.; McBreen, J.; Yang, X.Q.; Oh, S.Y.; Shin, H.C.; Cho, W.I.; Cho, B.W. In situ X-ray diffraction studies on the mechanism of capacity retention improvement by coating at the surface of LiCoO2. J. Power Sources 2007, 174, 619–623. [Google Scholar] [CrossRef]
  153. Sun, X.; Yang, X.Q.; McBreen, J.; Gao, Y.; Yakovleva, M.V.; Xing, X.K.; Daroux, M.L. New phases and phase transitions observed in over-charged states of LiCoO2-based cathode materials. J. Power Sources 2001, 97–98, 274–276. [Google Scholar] [CrossRef]
  154. Chen, Z.; Dahn, J.R. Methods to obtain excellent capacity retention in LiCoO2 cycled to 4.5 V. Electrochim. Acta 2004, 49, 1079–1090. [Google Scholar] [CrossRef]
  155. Ohzuku, T.; Ueda, A. Solid-State Redox Reactions of LiCoO (R3m) for 4 Volt Secondary Lithium Cells. J. Electrochem. Soc. 1994, 141, 2972–2977. [Google Scholar] [CrossRef]
  156. Wang, P.-F.; You, Y.; Yin, Y.-X.; Guo, Y.-G. Layered Oxide Cathodes for Sodium-Ion Batteries: Phase Transition, Air Stability, and Performance. Adv. Energy Mater. 2018, 8, 1701912. [Google Scholar] [CrossRef]
  157. Delmas, C.; Fouassier, C.; Hagenmuller, P. Structural classification and properties of the layered oxides. Physica B+C 1980, 99, 81–85. [Google Scholar] [CrossRef]
  158. Yabuuchi, N.; Komaba, S. Recent research progress on iron- and manganese-based positive electrode materials for rechargeable sodium batteries. Sci. Technol. Adv. Mater. 2014, 15, 043501. [Google Scholar] [CrossRef] [PubMed] [Green Version]
  159. Zhang, X.; Chen, Z.; Schwarz, B.; Sigel, F.; Ehrenberg, H.; An, K.; Zhang, Z.; Zhang, Q.; Li, Y.; Li, J. Kinetic characteristics up to 4.8 V of layered LiNi1/3Co1/3Mn1/3O2 cathode materials for high voltage lithium-ion batteries. Electrochim. Acta 2017, 227, 152–161. [Google Scholar] [CrossRef]
  160. Yoon, W.-S.; Chung, K.Y.; McBreen, J.; Yang, X.-Q. A comparative study on structural changes of LiCo1/3Ni1/3Mn1/3O2 and LiNi0.8Co0.15Al0.05O2 during first charge using in situ XRD. Electrochem. Commun. 2006, 8, 1257–1262. [Google Scholar] [CrossRef]
  161. Godbole, V.A.; Colin, J.-F.; Novak, P. Study of Overcharge Behavior of Li1+x(Ni1/3Mn1/3Co1/3)1−xO2 Using In Situ and Ex Situ X-ray Synchrotron Diffraction. J. Electrochem. Soc. 2011, 158, A1005–A1010. [Google Scholar] [CrossRef]
  162. Zhou, Y.-N.; Ma, J.; Hu, E.; Yu, X.; Gu, L.; Nam, K.-W.; Chen, L.; Wang, Z.; Yang, X.-Q. Tuning charge–discharge induced unit cell breathing in layer-structured cathode materials for lithium-ion batteries. Nat. Commun. 2014, 5, 5381. [Google Scholar] [CrossRef] [PubMed] [Green Version]
  163. Sathiya, M.; Rousse, G.; Ramesha, K.; Laisa, C.P.; Vezin, H.; Sougrati, M.T.; Doublet, M.L.; Foix, D.; Gonbeau, D.; Walker, W.; et al. Reversible anionic redox chemistry in high-capacity layered-oxide electrodes. Nat. Mater. 2013, 12, 827. [Google Scholar] [CrossRef] [PubMed]
  164. James, A.C.W.P.; Goodenough, J.B. Structure and bonding in Li2MoO3 and Li2−xMoO3 (0 ≤ x ≤ 1.7). J. Solid State Chem. 1988, 76, 87–96. [Google Scholar] [CrossRef]
  165. Lu, Z.; Dahn, J.R. Can All the Lithium be Removed from  T2  Li2 / 3[ Ni1 / 3Mn2 / 3 ] O 2 ? J. Electrochem. Soc. 2001, 148, A710–A715. [Google Scholar] [CrossRef]
  166. Berthelot, R.; Carlier, D.; Delmas, C. Electrochemical investigation of the P2–NaxCoO2 phase diagram. Nat. Mater. 2011, 10, 74. [Google Scholar] [CrossRef] [PubMed]
  167. Lu, Z.; Dahn, J.R. In Situ X-ray Diffraction Study of  P2  Na2 / 3[ Ni1 / 3Mn2 / 3 ] O2. J. Electrochem. Soc. 2001, 148, A1225–A1229. [Google Scholar] [CrossRef]
  168. Wang, P.-F.; You, Y.; Yin, Y.-X.; Wang, Y.-S.; Wan, L.-J.; Gu, L.; Guo, Y.-G. Suppressing the P2–O2 Phase Transition of Na0.67Mn0.67Ni0.33O2 by Magnesium Substitution for Improved Sodium-Ion Batteries. Angew. Chem. Int. Ed. 2016, 55, 7445–7449. [Google Scholar] [CrossRef] [PubMed]
  169. Han, M.H.; Gonzalo, E.; Sharma, N.; López del Amo, J.M.; Armand, M.; Avdeev, M.; Saiz Garitaonandia, J.J.; Rojo, T. High-Performance P2-Phase Na2/3Mn0.8Fe0.1Ti0.1O2 Cathode Material for Ambient-Temperature Sodium-Ion Batteries. Chem. Mater. 2016, 28, 106–116. [Google Scholar] [CrossRef]
  170. Xu, J.; Lee, D.H.; Clément, R.J.; Yu, X.; Leskes, M.; Pell, A.J.; Pintacuda, G.; Yang, X.Q.; Grey, C.P.; Meng, Y.S. Identifying the Critical Role of Li Substitution in P2− Nax[LiyNizMn1−y−z]O2 (0 < x, y, z < 1) Intercalation Cathode Materials for High-Energy Na-Ion Batteries. Chem. Mater. 2014, 26, 1260–1269. [Google Scholar] [CrossRef]
  171. Lu, Z.; Dahn, J.R. Effects of Stacking Fault Defects on the X-ray Diffraction Patterns of T2, O2, and O6 Structure Li2/3[CoxNi1/3−xMn2/3]O2. Chem. Mater. 2001, 13, 2078–2083. [Google Scholar] [CrossRef]
  172. Singh, G.; Tapia-Ruiz, N.; Lopez del Amo, J.M.; Maitra, U.; Somerville, J.W.; Armstrong, A.R.; Martinez de Ilarduya, J.; Rojo, T.; Bruce, P.G. High Voltage Mg-Doped Na0.67Ni0.3–xMgxMn0.7O2 (x = 0.05, 0.1) Na-Ion Cathodes with Enhanced Stability and Rate Capability. Chem. Mater. 2016, 28, 5087–5094. [Google Scholar] [CrossRef]
  173. Billaud, J.; Singh, G.; Armstrong, A.R.; Gonzalo, E.; Roddatis, V.; Armand, M.; Rojo, T.; Bruce, P.G. Na0.67Mn1−xMgxO2 (0 ≤ x ≤ 0.2): A high capacity cathode for sodium-ion batteries. Energy Environ. Sci. 2014, 7, 1387–1391. [Google Scholar] [CrossRef]
  174. Boehm, R.C.; Banerjee, A. Theoretical study of lithium intercalated graphite. J. Chem. Phys. 1992, 96, 1150–1157. [Google Scholar] [CrossRef]
  175. Ge, H.; Li, N.; Li, D.; Dai, C.; Wang, D. Study on the Theoretical Capacity of Spinel Lithium Titanate Induced by Low-Potential Intercalation. J. Phys. Chem. C 2009, 113, 6324–6326. [Google Scholar] [CrossRef]
  176. Ge, H.; Li, N.; Li, D.; Dai, C.; Wang, D. Electrochemical characteristics of spinel Li4Ti5O12 discharged to 0.01 V. Electrochem. Commun. 2008, 10, 719–722. [Google Scholar] [CrossRef]
  177. Venkateswarlu, M.; Chen, C.H.; Do, J.S.; Lin, C.W.; Chou, T.C.; Hwang, B.J. Electrochemical properties of nano-sized Li4Ti5O12 powders synthesized by a sol–gel process and characterized by X-ray absorption spectroscopy. J. Power Sources 2005, 146, 204–208. [Google Scholar] [CrossRef]
  178. Shu, J. Electrochemical behavior and stability of Li4Ti5O12 in a broad voltage window. J. Solid State Electrochem. 2009, 13, 1535–1539. [Google Scholar] [CrossRef]
  179. Zhao, L.; Pan, H.-L.; Hu, Y.-S.; Li, H.; Chen, L.-Q. Spinel lithium titanate (Li4Ti5O12) as novel anode material for room-temperature sodium-ion battery. Chin. Phys. B 2012, 21, 028201. [Google Scholar] [CrossRef]
  180. Yang, L.Y.; Li, H.Z.; Liu, J.; Tang, S.S.; Lu, Y.K.; Li, S.T.; Min, J.; Yan, N.; Lei, M. Li4Ti5O12 nanosheets as high-rate and long-life anode materials for sodium-ion batteries. J. Mater. Chem. A 2015, 3, 24446–24452. [Google Scholar] [CrossRef]
  181. Kitta, M.; Akita, T.; Tanaka, S.; Kohyama, M. Two-phase separation in a lithiated spinel Li4Ti5O12 crystal as confirmed by electron energy-loss spectroscopy. J. Power Sources 2014, 257, 120–125. [Google Scholar] [CrossRef]
  182. Kitta, M.; Kuratani, K.; Tabuchi, M.; Takeichi, N.; Akita, T.; Kiyobayashi, T.; Kohyama, M. Irreversible structural change of a spinel Li4Ti5O12 particle via Na insertion-extraction cycles of a sodium-ion battery. Electrochim. Acta 2014, 148, 175–179. [Google Scholar] [CrossRef]
  183. Li, W.; Dahn, J.R.; Wainwright, D.S. Rechargeable Lithium Batteries with Aqueous Electrolytes. Science 1994, 264, 1115–1118. [Google Scholar] [CrossRef] [PubMed]
  184. Pasta, M.; Wessells, C.D.; Huggins, R.A.; Cui, Y. A high-rate and long cycle life aqueous electrolyte battery for grid-scale energy storage. Nat. Commun. 2012, 3, 1149. [Google Scholar] [CrossRef] [PubMed] [Green Version]
  185. Liu, J.; Xu, C.; Chen, Z.; Ni, S.; Shen, Z.X. Progress in aqueous rechargeable batteries. Green Energy Environ. 2018, 3, 20–41. [Google Scholar] [CrossRef]
  186. Wang, Y.; Liu, J.; Lee, B.; Qiao, R.; Yang, Z.; Xu, S.; Yu, X.; Gu, L.; Hu, Y.-S.; Yang, W.; et al. Ti-substituted tunnel-type Na0.44MnO2 oxide as a negative electrode for aqueous sodium-ion batteries. Nat. Commun. 2015, 6, 6401. [Google Scholar] [CrossRef] [PubMed]
  187. Wang, Y.; Yu, X.; Xu, S.; Bai, J.; Xiao, R.; Hu, Y.-S.; Li, H.; Yang, X.-Q.; Chen, L.; Huang, X. A zero-strain layered metal oxide as the negative electrode for long-life sodium-ion batteries. Nat. Commun. 2013, 4, 2365. [Google Scholar] [CrossRef] [PubMed] [Green Version]
  188. Köhler, J.; Makihara, H.; Uegaito, H.; Inoue, H.; Toki, M. LiV3O8: Characterization as anode material for an aqueous rechargeable Li-ion battery system. Electrochim. Acta 2000, 46, 59–65. [Google Scholar] [CrossRef]
  189. Wu, J.; Gao, X.; Yu, H.; Ding, T.; Yan, Y.; Yao, B.; Yao, X.; Chen, D.; Liu, M.; Huang, L. A Scalable Free-Standing V2O5/CNT Film Electrode for Supercapacitors with a Wide Operation Voltage (1.6 V) in an Aqueous Electrolyte. Adv. Funct. Mater. 2016, 26, 6114–6120. [Google Scholar] [CrossRef]
  190. Yamada, Y.; Usui, K.; Sodeyama, K.; Ko, S.; Tateyama, Y.; Yamada, A. Hydrate-melt electrolytes for high-energy-density aqueous batteries. Nat. Energy 2016, 1, 16129. [Google Scholar] [CrossRef]
  191. Wang, H.; Huang, K.; Zeng, Y.; Yang, S.; Chen, L. Electrochemical properties of TiP2O7 and LiTi2(PO4)3 as anode material for lithium ion battery with aqueous solution electrolyte. Electrochim. Acta 2007, 52, 3280–3285. [Google Scholar] [CrossRef]
  192. Wu, M.-S.; Wang, M.-J.; Jow, J.-J.; Yang, W.-D.; Hsieh, C.-Y.; Tsai, H.-M. Electrochemical fabrication of anatase TiO2 nanostructure as an anode material for aqueous lithium-ion batteries. J. Power Sources 2008, 185, 1420–1424. [Google Scholar] [CrossRef]
  193. Wang, Y.; Yang, S.-Z.; You, Y.; Feng, Z.; Zhu, W.; Gariépy, V.; Xia, J.; Commarieu, B.; Darwiche, A.; Guerfi, A.; Zaghib, K. High-Capacity and Long-Cycle Life Aqueous Rechargeable Lithium-Ion Battery with the FePO4 Anode. ACS Appl. Mater. Interfaces 2018, 10, 7061–7068. [Google Scholar] [CrossRef] [PubMed]
  194. Dai, H.; Yang, C.; Ou, X.; Liang, X.; Xue, H.; Wang, W.; Xu, G. Unravelling the electrochemical properties and thermal behavior of NaNi2/3Sb1/3O2 cathode for sodium-ion batteries by in situ X-ray diffraction investigation. Electrochim. Acta 2017, 257, 146–154. [Google Scholar] [CrossRef]
  195. Same, A.; Park, J.W.; Battaglia, V.; Tang, H.Y. In situ neutron radiography analysis of graphite/NCA lithium-ion battery during overcharge. J. Appl. Electrochem. 2012, 42, 1–9. [Google Scholar] [CrossRef]
  196. Lu, W.; López, C.M.; Liu, N.; Vaughey, J.T.; Jansen, A.; Dennis, W.D. Overcharge Effect on Morphology and Structure of Carbon Electrodes for Lithium-Ion Batteries. J. Electrochem. Soc. 2012, 159, A566–A570. [Google Scholar] [CrossRef]
  197. Makimura, Y.; Sasaki, T.; Oka, H.; Okuda, C.; Nonaka, T.; Nishimura, Y.F.; Kawauchi, S.; Takeuchi, Y. Studying the Charging Process of a Lithium-Ion Battery toward 10 V by In Situ X-ray Absorption and Diffraction: Lithium Insertion/Extraction with Side Reactions at Positive and Negative Electrodes. J. Electrochem. Soc. 2016, 163, A1450–A1456. [Google Scholar] [CrossRef]
  198. Patterson, A.L. The Scherrer Formula for X-ray Particle Size Determination. Phys. Rev. 1939, 56, 978–982. [Google Scholar] [CrossRef]
  199. Ziolkowska, D.A.; Jasinski, J.B.; Hamankiewicz, B.; Korona, K.P.; Wu, S.-H.; Czerwinski, A. In Situ XRD and TEM Studies of Sol-Gel-Based Synthesis of LiFePO4. Cryst. Growth Des. 2016, 16, 5006–5013. [Google Scholar] [CrossRef]
Figure 1. (a) XRD spectra collected during the first galvanostatic cycle between 4.0 and 2.9 V. T:LiFePO4; H:FePO4; *: cell package [133]. (b) HRTEM image of phase boundary (marked by red arrows) between FP and LFP along the [010] direction during lithiation; time = 0 s. (c) At 176 s, the thickness of the LFP layer increased. (d) Inverse fast Fourier transform (IFFT) image of (b), showing the distribution of dislocations near the phase boundary [91]. (a) with permission from Elsevier; (bd) with permission from the author.
Energies 11 02963 g001
Figure 2. (a) Charge/discharge galvanostatic data at 0.2C with the time-points of collecting XRD spectra; (b) Operando XRD patterns of coin cells with the 12 nm [100]-LFP, MA-LFP (26 nm), and thick [100]-LFP (46 nm) as cathode materials. For the 12 nm [100]-LFP, a continuous shift of peak1(~34.7°) happens implying a single-phase transformation, whereas the other two have peak2 and peak3, indicating formation of FP with nearly constant composition, which is consistent with the two-phase reaction [137]; with permission from the ACS.
Energies 11 02963 g002
Figure 3. (ac) Image plots of operando XRD patterns of LFP collected at 2nd cycle at rates of 5, 10, and 20C. (d) Image plots of XRD spectra collected at 10C rate for 5 cycles; (e) Selected diffraction patterns during the first two cycles. The corresponding cycling curves are at right of the spectra [141]; with permission from AAAS.
Energies 11 02963 g003
Figure 4. Image plots (ac) and corresponding XRD spectra (df) of cells cycled at 1.4, 2.8, and 4.2 mV/s at 20 °C. Image plots (gi) and corresponding XRD spectra (jl) of cells cycled at 1.4, 2.8, and 4.2 mV/s at 0 °C [147]; with permission from Elsevier.
Energies 11 02963 g004
Figure 5. (a) Voltage and Na+ content versus time. (b) 2θ versus time plot of the XRD patterns of a full charge-discharge cycle. The grey level is proportional to the relative intensity. Horizontal bars at the right indicate the position of the Bragg peaks for each of the phases. (c) Sum of the integrated intensity of the (020) and (211) reflections for each of the phases versus time. (df) The evolution of the cell parameters of NaxFePO4 during cycling. The dotted horizontal lines indicate the cell parameters of the chemically synthesized Na2/3FePO4. The solid vertical line indicates end of charge, the two dashed vertical lines separate regions with different mechanisms [148]; with permission from RSC publishing.
Energies 11 02963 g005
Figure 6. Schematic of the crystal structures for layered NaxMO2: (a) O3-type; (b) P3-type; (c) O2- type; (d) P2-type. Li/Na: yellow; transition metal: blue; O: red [158], with permission from IOP Publishing.
Energies 11 02963 g006
Figure 7. In-situ XRD of Li2MoO3 during the first charge. (a) The XRD pattern of the Li2-xMoO3 electrode right after charging to 4.8 V; the peak at 38.5° is from Al collector. (b) Contour plot of the evolution of (003), (101), (104), (107), (108) and (110) peaks during charge. (c) The XRD pattern of the Li2MoO3 electrode before charging; (d) Charge curve at a current density of 10 mA g−1 to 4.8 V. (e) Lattice parameter changes of Li2MoO3 during the first charge. (f,g) STEM lattice images of Li2−xMoO3 and Li2MoO3, respectively; where black: Mo, white: Li and yellow: O [162]; with permission from Springer Nature.
Energies 11 02963 g007
Figure 8. XRD pattern of P2-Na2/3Ni1/3Mn2/3O2 cell: (a) during first charge; (b) before cycling; (c) after first discharge; (d) during first discharge; Al, Be, BeO are contributions from cell components [167]; with permission from JES.
Energies 11 02963 g008
Figure 9. (a) In-situ XRD on Na0.80[Li0.12Ni0.22Mn0.66]O2 during the first charge (Al collector is labelled as “*”) and the corresponding charge curve. (b) Evolution of the a and c lattice parameters during the first charge obtained from Rietveld refinement (solid symbols represent a and c values in the pristine state). (c) XRD patterns obtained by simulating different amounts of O2-type stacking fault in P2 structure [170]; with permission from ACS.
Energies 11 02963 g009
Figure 10. (a) Galvanostatic first charge-discharge curves. (b) In-situ X-ray diffraction of Na0.67Ni0.2Mg0.1Mn0.7O2 showing the reversible evolution of P2 to OP4 phase transition at the end of charge and beginning of discharge. ■: Be window; ●:Al current collector [172]; with permission from ACS.
Energies 11 02963 g010
Figure 11. (a) Contour plot of XRD patterns and discharge curve from the Li/graphite cell discharged from 1.53 to 0.001 V at 1/3 C. (b) XRD patterns at 2θ between 1.6 and 1.9° showing the shift and split of graphite (002) peak as a function of x in LixC6 [119], with permission from Elsevier.
Energies 11 02963 g011
Figure 12. Operando synchrotron X-ray diffraction analysis of the structural evolution of the ternary Na-ether-graphite system observed during electrochemical solvated-Na-ion intercalation and de-intercalation of graphite in Na | 1 M NaPF6 in a DEGDME | graphite cell [95]; with permission from RSC Publishing.
Energies 11 02963 g012
Figure 13. (ac) Evolution of (111), (311) and (400) diffractions of Li4Ti5O12 during the first discharge/charge between 3.0 and 0 V and their image plots (gi). (df) Highlighted spectra with corresponding compositions [115]; with permission from ACS.
Energies 11 02963 g013
Figure 14. (a) In-situ synchrotron XRD patterns of the Li4Ti5O12 electrode in a sodium-ion battery collected during the first cycle. For the Li4Ti5O12/Li7Ti5O12 phases, the main peaks correspond to (111), (311) and (400) reflections, highlighted at the right and peaks of the Na6LiTi5O12 phase are marked by black dotted lines. (b) An annular-bright-field STEM image showing a three-phase area from a partially electrochemically sodiated Li4Ti5O12 nano-particle, Scale bar, 2 nm [60]; with permission from Springer Nature.
Energies 11 02963 g014
Figure 15. (a) Operando XRD patterns collected during the first charge-discharge of a Na/Na0.44[Mn0.44Ti0.56]O2 cell at C/10 rate between 1.5 and 3.9 V. (b) Charge-discharge curve. (c) Lattice parameter variations correspond to (a). (d) General structure view along c-axis showing five crystallographic sites for manganese and three sites for sodium. (e) HAADF-STEM image for as-prepared Na0.44[Mn0.44Ti0.56]O2 along [001] zone axis. (f) The EELS image of Na0.44[Mn0.44Ti0.56]O2. Scale bar, 1 nm, [186]; with permission from Springer Nature.
Energies 11 02963 g015
Figure 16. Evolution of XRD patterns of (a) olivine FePO4 and (b) LiMn2O4 upon cycling [194], with permission from ACS.
Energies 11 02963 g016
Figure 17. XRD patterns between 2θ = 1.0 and 2.8° from discharge at 1C rate as a function of DOD during the (a) 1st and (b) 2500th cycles [122]; with permission from ACS.
Energies 11 02963 g017
Figure 18. (a) Image plots of HTXRD spectra of charged NaxNi2/3Sb1/3O2 heated from 100 to 500 °C. (b) The corresponding selected diffraction patterns, peaks labelled pink is P3 phase, and black is O3 [194]; with permission from Elsevier.
Energies 11 02963 g018
Figure 19. Image plots of XRD patterns at the selected 2θ range for the charged (a) NMC433, (b) NMC532, (c) NMC622 and (d) NMC811. (e) Schematic illustration depicting the phase stability map of the charged NMC cathode during heating [93]; with permission from ACS.
Energies 11 02963 g019
Figure 20. X-ray diffraction patterns for NCA-Mg and graphite during (over-)charging at (a) 30 and (b) 50 °C. The SOC at 0 and 100% of the lithium-ion cells are shown in blue and red, respectively. (c) Voltage profile of NCA/Mg-graphite cells cycled to 10 V at 2C-rate at 30 or 50 °C. The state of charge (SOC) at 100% is defined as 4.1 V terminal cell voltage, and the SOCs at 30 °C are displayed in the figure [197]; with permission of JES.
Energies 11 02963 g020
Figure 21. In-situ XRD of LiFePO4 heated under inert atmosphere. (a) 435–700 °C. (b) From RT to 900 °C and then cooling to RT. (c) In-situ TEM of a LiFePO4 particle heated between 400 and 800 °C. The first two columns show TEM images of the same grain; the third and fourth show HRTEM images, the fifth shows SAED patterns in the same region. Notice a slight grain rotation at 800 °C compared with 700 °C and lower temperatures, which resulted in a change of the zone axis, a different SAED pattern, and different planes visible in HRTEM images [199]; with permission of the ACS.
Energies 11 02963 g021aEnergies 11 02963 g021b
Figure 22. In-situ X-ray diffraction patterns of the Li-Mn-Fe-PO4/GO precursor prepared using the metal chlorides heated from 100 to 650 °C in an inert atmosphere [18], with permission from Springer Nature.
Energies 11 02963 g022
Table 1. Phase transformation temperatures obtained from operando HTXRD and the peak temperature of oxygen release from MS.
Pristine
Cathode
LiNi0.4Mn0.3Co0.3O2
(NMC433)
LiNi0.5Mn0.3Co0.2O2
(NMC532)
LiNi0.6Mn0.2Co0.2O2
(NMC622)
LiNi0.8Mn0.1Co0.1O2
(NMC811)
After chargeLi = 0.34Li = 0.29Li = 0.27Li = 0.22
Phase at 25 °CRRRR
T0–Tf (°C)245–325235–315185–245T0 = 135
NMC→S1ΔT = 80 °CΔT = 80 °CΔT = 60 °C
T0/Tf (°C)T0 = 450T0 = 400T0 = 310Tf = 155
S1→S2
T0/Tf (°C)no RS up to 600 °Cno RS up to 600 °CT0 = 550Tf = 365
S2→RS
Phases at 600 o CS1 + S2S2RSRS + Ni (minor)
Tpeak, O2 (°C) ~230~150
(from MS)
Peak shapeBroad/low
~ 220–320 °C
Broad/low
~ 220–320 °C
Broad/medium
~ 170–340 °C
sharp/high
~ 130–260 °C
R: LiαNixMnyCozO2 (x + y + z = 1), layered structure, S.G. = R 3 ¯ m; S1:LiNixMnyCozO4 (x + y + z = 2), spinel structure, S.G. = Fd 3 ¯ m; S2: LiαNixMnyCozO4 (α + x + y + z) = 3, spinel structure, S.G. = Fd 3 ¯ m; RS: LiαNixMnyCozO (α + x + y + z = 1), rock salt structure, S.G. = Fm 3 ¯ m; T0 and Tf are the starting and ending temperatures for a phase transformation, respectively.

