Study on Vibration Transmission among Units in Underground Powerhouse of a Hydropower Station

1
State Key Laboratory of Hydraulic Engineering Simulation and Safety, Tianjin University, Tianjin 300072, China
2
School of Civil Engineering, Tianjin University, Tianjin 300072, China
*
Author to whom correspondence should be addressed.
Energies 2018, 11(11), 3015; https://doi.org/10.3390/en11113015
Submission received: 16 October 2018
/
Revised: 26 October 2018
/
Accepted: 29 October 2018
/
Published: 2 November 2018
(This article belongs to the Special Issue Structural Prognostics and Health Management in Power & Energy Systems)
Abstract
:Research on the safety of powerhouse in a hydropower station is mostly concentrated on the vibration of machinery structure and concrete structure within a single unit. However, few studies have been focused on the vibration transmission among units. Due to the integrity of the powerhouse and the interaction, it is necessary to study the vibration transmission mechanism of powerhouse structure among units. In this paper, field structural vibration tests are conducted in an underground powerhouse of a hydropower station on Yalong River. Additionally, the simplified mechanical models are established to explain the transmission mechanism theoretically. Moreover, a complementary finite element (FE) model is built to replicate the testing conditions for comprehensive analysis. The field tests results show that: (1) the transmission of lateral-river vibration is greater than those of longitude-river vibration and vertical vibration; (2) the vibration transmission of the vibrations that is caused by the low frequency tail fluctuation is basically equal to that of the vibrations caused by rotation of hydraulic generator. The transmission mechanism is demonstrated by the simplified mechanical models and is verified by the FE results. This study can provide guidance for further research on the vibration of underground powerhouse structure.
1. Introduction
Vibration is a common phenomenon in energy infrastructure structures. Severe vibration can lead to safety problems in rotating machineries and support structures [1,2,3], such as electrical machines, towers of the wind turbine generators, and parabolic reflective surfaces in the concentrated solar power systems. As a combination of rotating mechanical structures and concrete structures, the powerhouses in hydropower stations usually work under complex hydraulic, electromagnetic, and mechanical loads. Therefore, the safety problems are prone to occur. In recent years, hydropower industry has developed rapidly in China. According to the National Energy Administer (NEA), the installed capacity of hydropower has reached 341 million kW in 2017, accounting for 19.2% of the total installed capacity of electricity in China. The annual hydropower generation has reached 1.19 × 10¹² kWh, accounting for 18.5% of the total electricity generation in China. Hydropower has made great contributions to economic development and reduction of carbon emissions. With the development of hydropower, a group of high-head, large-capacity hydroelectric generators has been commonly used in large-scale hydropower stations. Various powerhouse safety problems that are caused by vibration of units happened in hydropower stations correspondingly. For example, hydropower stations, such as XiaoLangDi, ErTan, and YanTan in China have experienced powerhouse safety problems some extent [4,5]. The most serious safety problem of powerhouse occurred in Russia, the unit #2 of the Sayano-Shushenskaya hydropower station in Yenisei River experienced severe vibration after overload operation, leading to fatigue damage to the cap fixed bolts, and resulting in great casualties and property loss [6,7].
At present, the research on vibration safety of the powerhouse is mostly focused on the vibration of machinery structure [8,9]. For the coupling vibration of unit shaft system, Ma, Song and Zhi, et al. built the FE models of bearing support to analyze the coupling relationship of the foundation and the shafting system [10,11,12,13]. Zhou et al. investigate the vibration of the stator frame under the action of electromagnetic forces based on field tests and FE models [14]. Zhang and Wang et al. built the FE models of powerhouse and pumping station to study the vibration under pressure pulsations [15,16]. On the other hand, Lian and He et al. studied the influence of unit on the vibration of the powerhouse structure. The complicated linear and nonlinear coupling vibration rules between the unit and powerhouse structure have been summarized, based on field tests of unit and powerhouse structure of multiple hydropower stations and the FE method [17,18,19,20,21]. Zhang and Mao analyzed the correlation between the vibration response of unit and powerhouse structure [22,23]. The coupling relationship between the unit and the powerhouse structure were discussed based on relevant theories and field tests data.
For the influence and transmission of vibration of powerhouse, Wang and Bai et al. investigated the transmission rules of adjacent units by field tests of a hydropower station [24]. Wei et al. studied the vibration transmission ways between main powerhouse and auxiliary powerhouse by FE method [25]. Ameen et al. studied the effect on dams caused by vibration of powerhouse by ANSYS-CFX model [26]. As for the vibration in underground structure, Gupta et al. investigated the influence of tunnel and soil parameters on vibrations from underground railways [27]. Chen and Xia et al. studied the vibration transmissions that are caused by blasting in underground powerhouse and excavation [28,29]. Kuo et al. studied the effect of a twin tunnel on the propagation of ground-borne vibration from an underground railway theoretically [30]. However, due to the difficulty of field test and complexity of structure, it is hard to explain the mechanism of vibration transmission in underground powerhouse, so the theoretical research is rare.
According to the complexity of powerhouse structure and vibration source mechanism, this paper focuses on two basic problems for vibration transmission among units. The first one is the effect of vibration directions on the vibration transmission ratios, and the second one is the effect of frequency of the vibration source on the vibration transmission ratios. To solve these problems intuitively and accurately, field test, theoretical research, and numerical simulation are employed with appropriate and reasonable simplification.
In this paper, field structural vibration tests of an underground powerhouse in a hydropower station on Yalong River were conducted to investigate the vibration rules. Then, the simplified mechanical vibration models are established to explain the mechanism of the vibration theoretically. Finally, the testing powerhouse structure is simulated and calculated by FE method, the corresponding vibration transmission ratios among units are extracted and compared with the field test results to verify the theoretical analysis. The technology route of this paper is shown in Figure 1. This paper studied the mechanism of the vibration transmission among units systematically. It can provide guidance for further research on the safety of underground powerhouse structure.
2. Field Structural Vibration Test
In order to investigate the vibration transmission among units, a series of field structure vibration tests were conducted based on an underground powerhouse in a large hydropower station on Yalong River.
2.1. Field Tests Overview
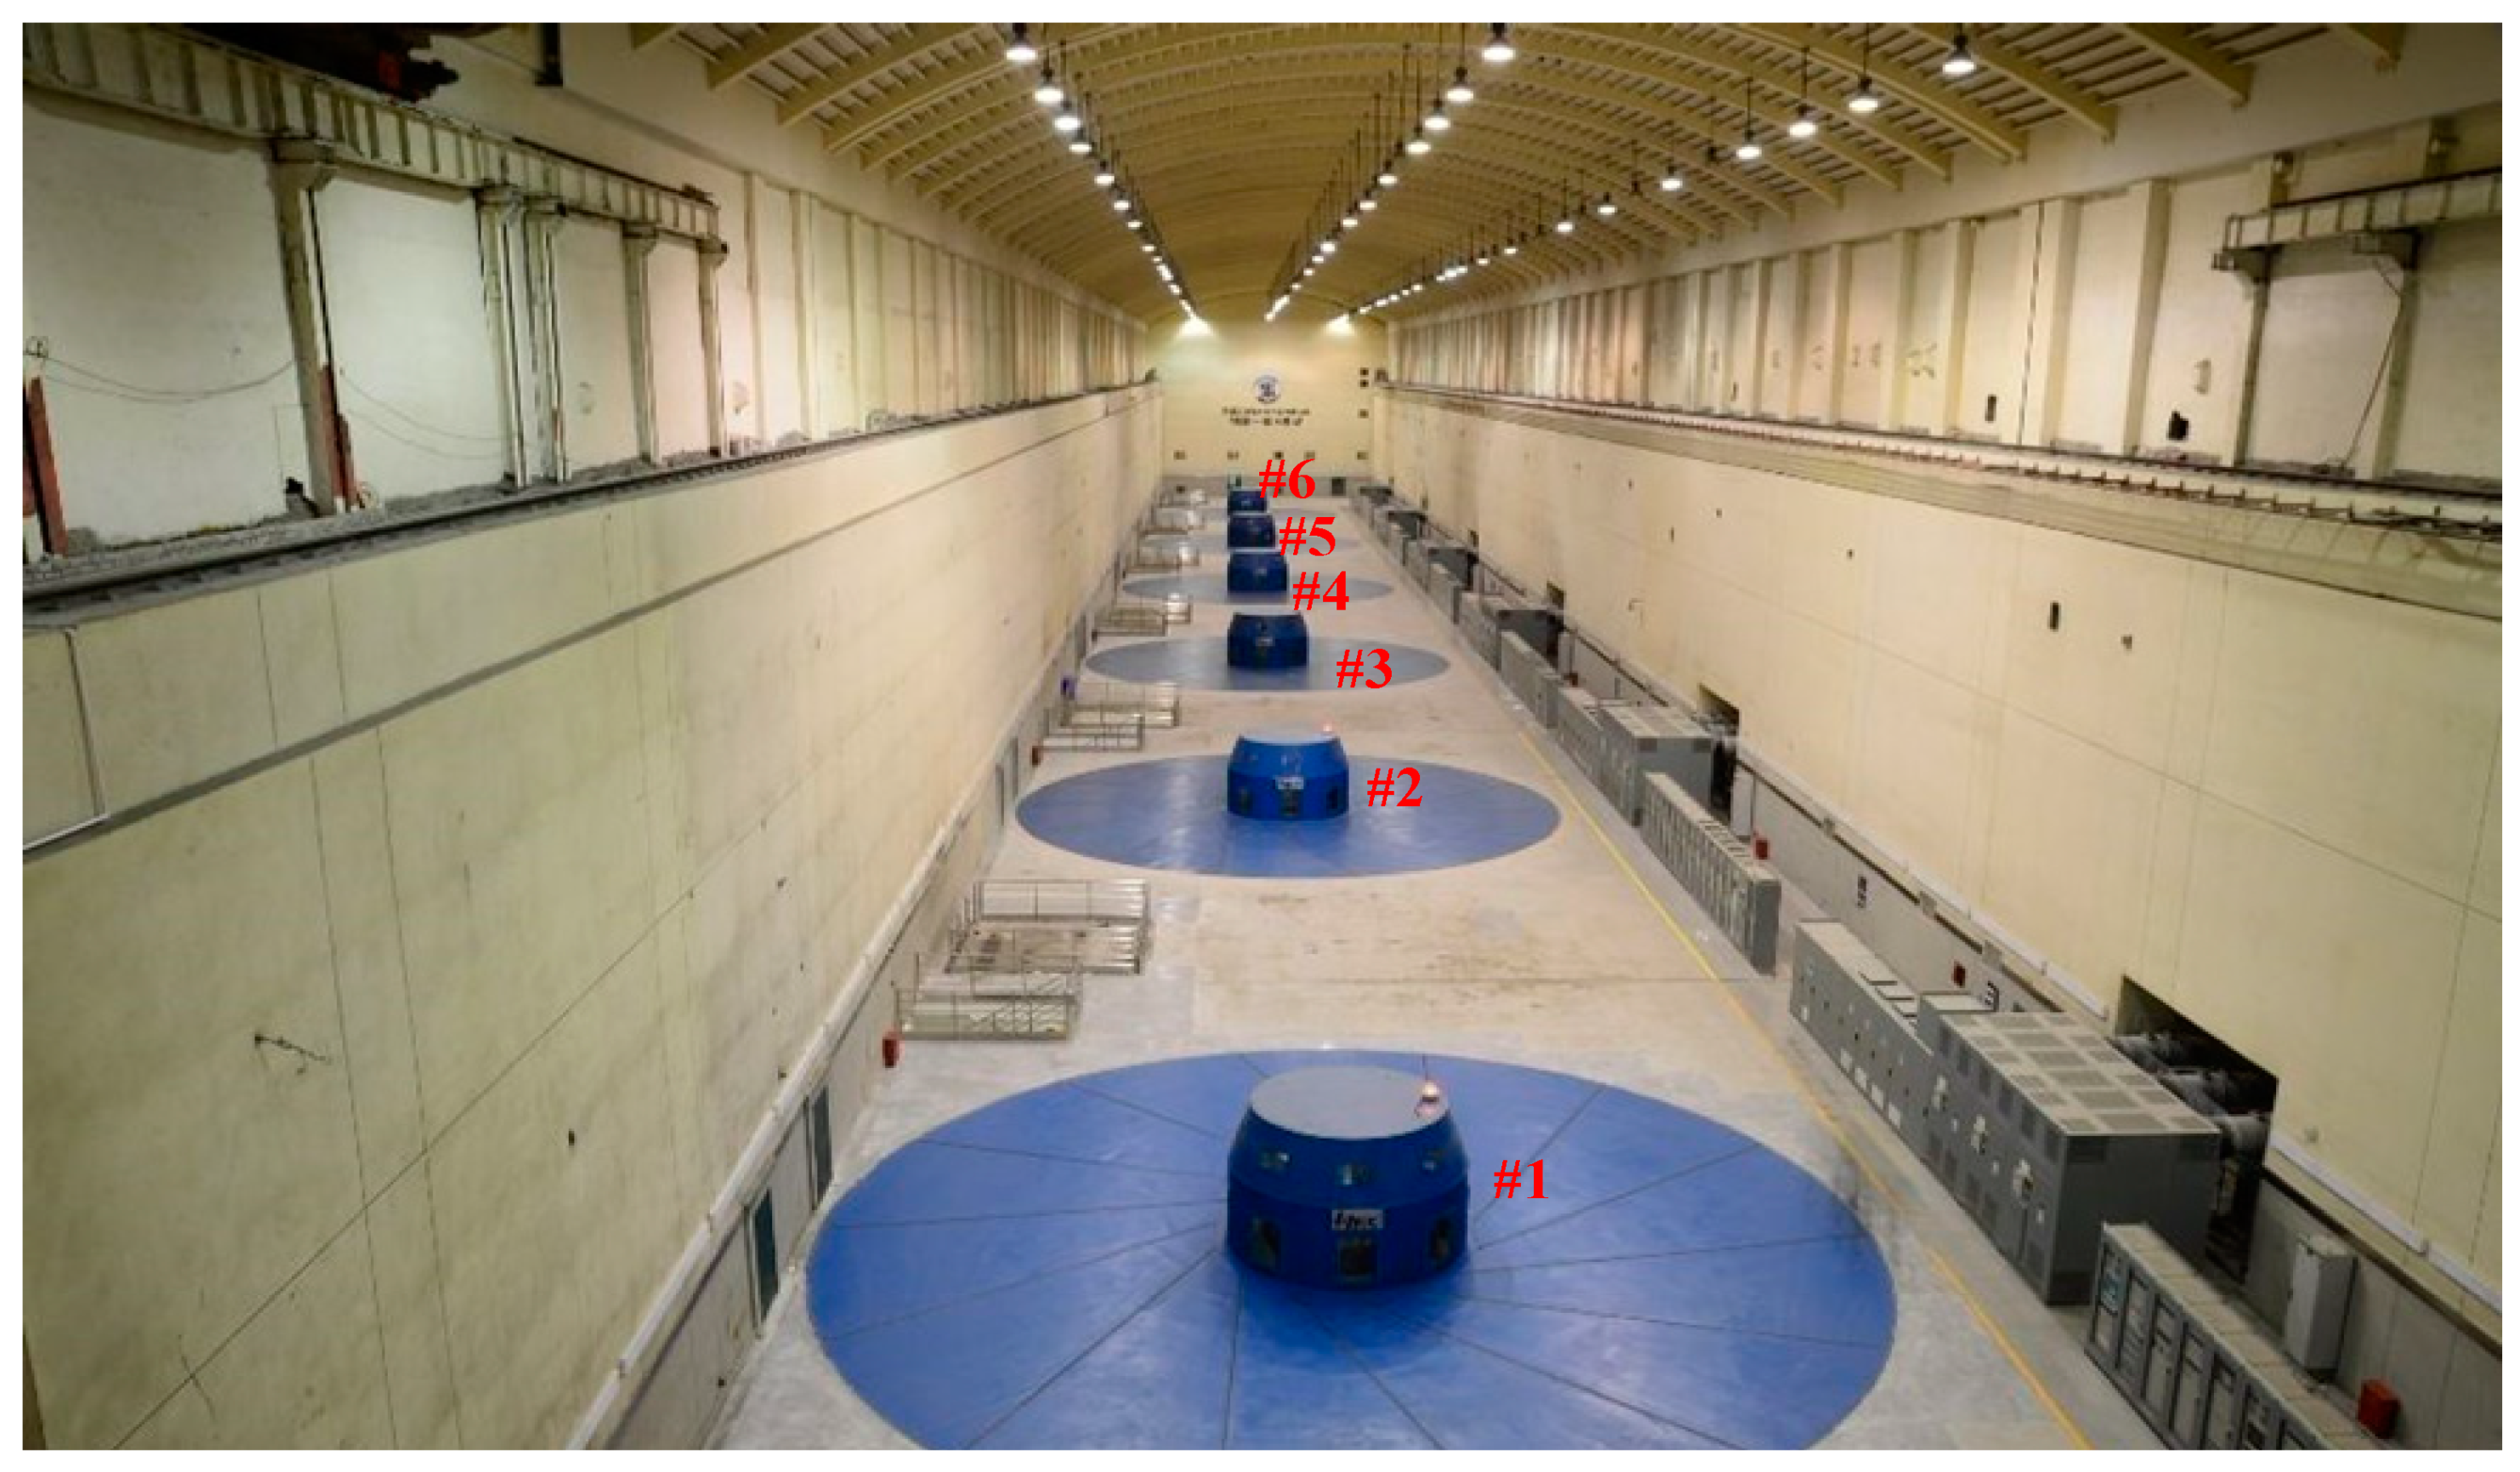
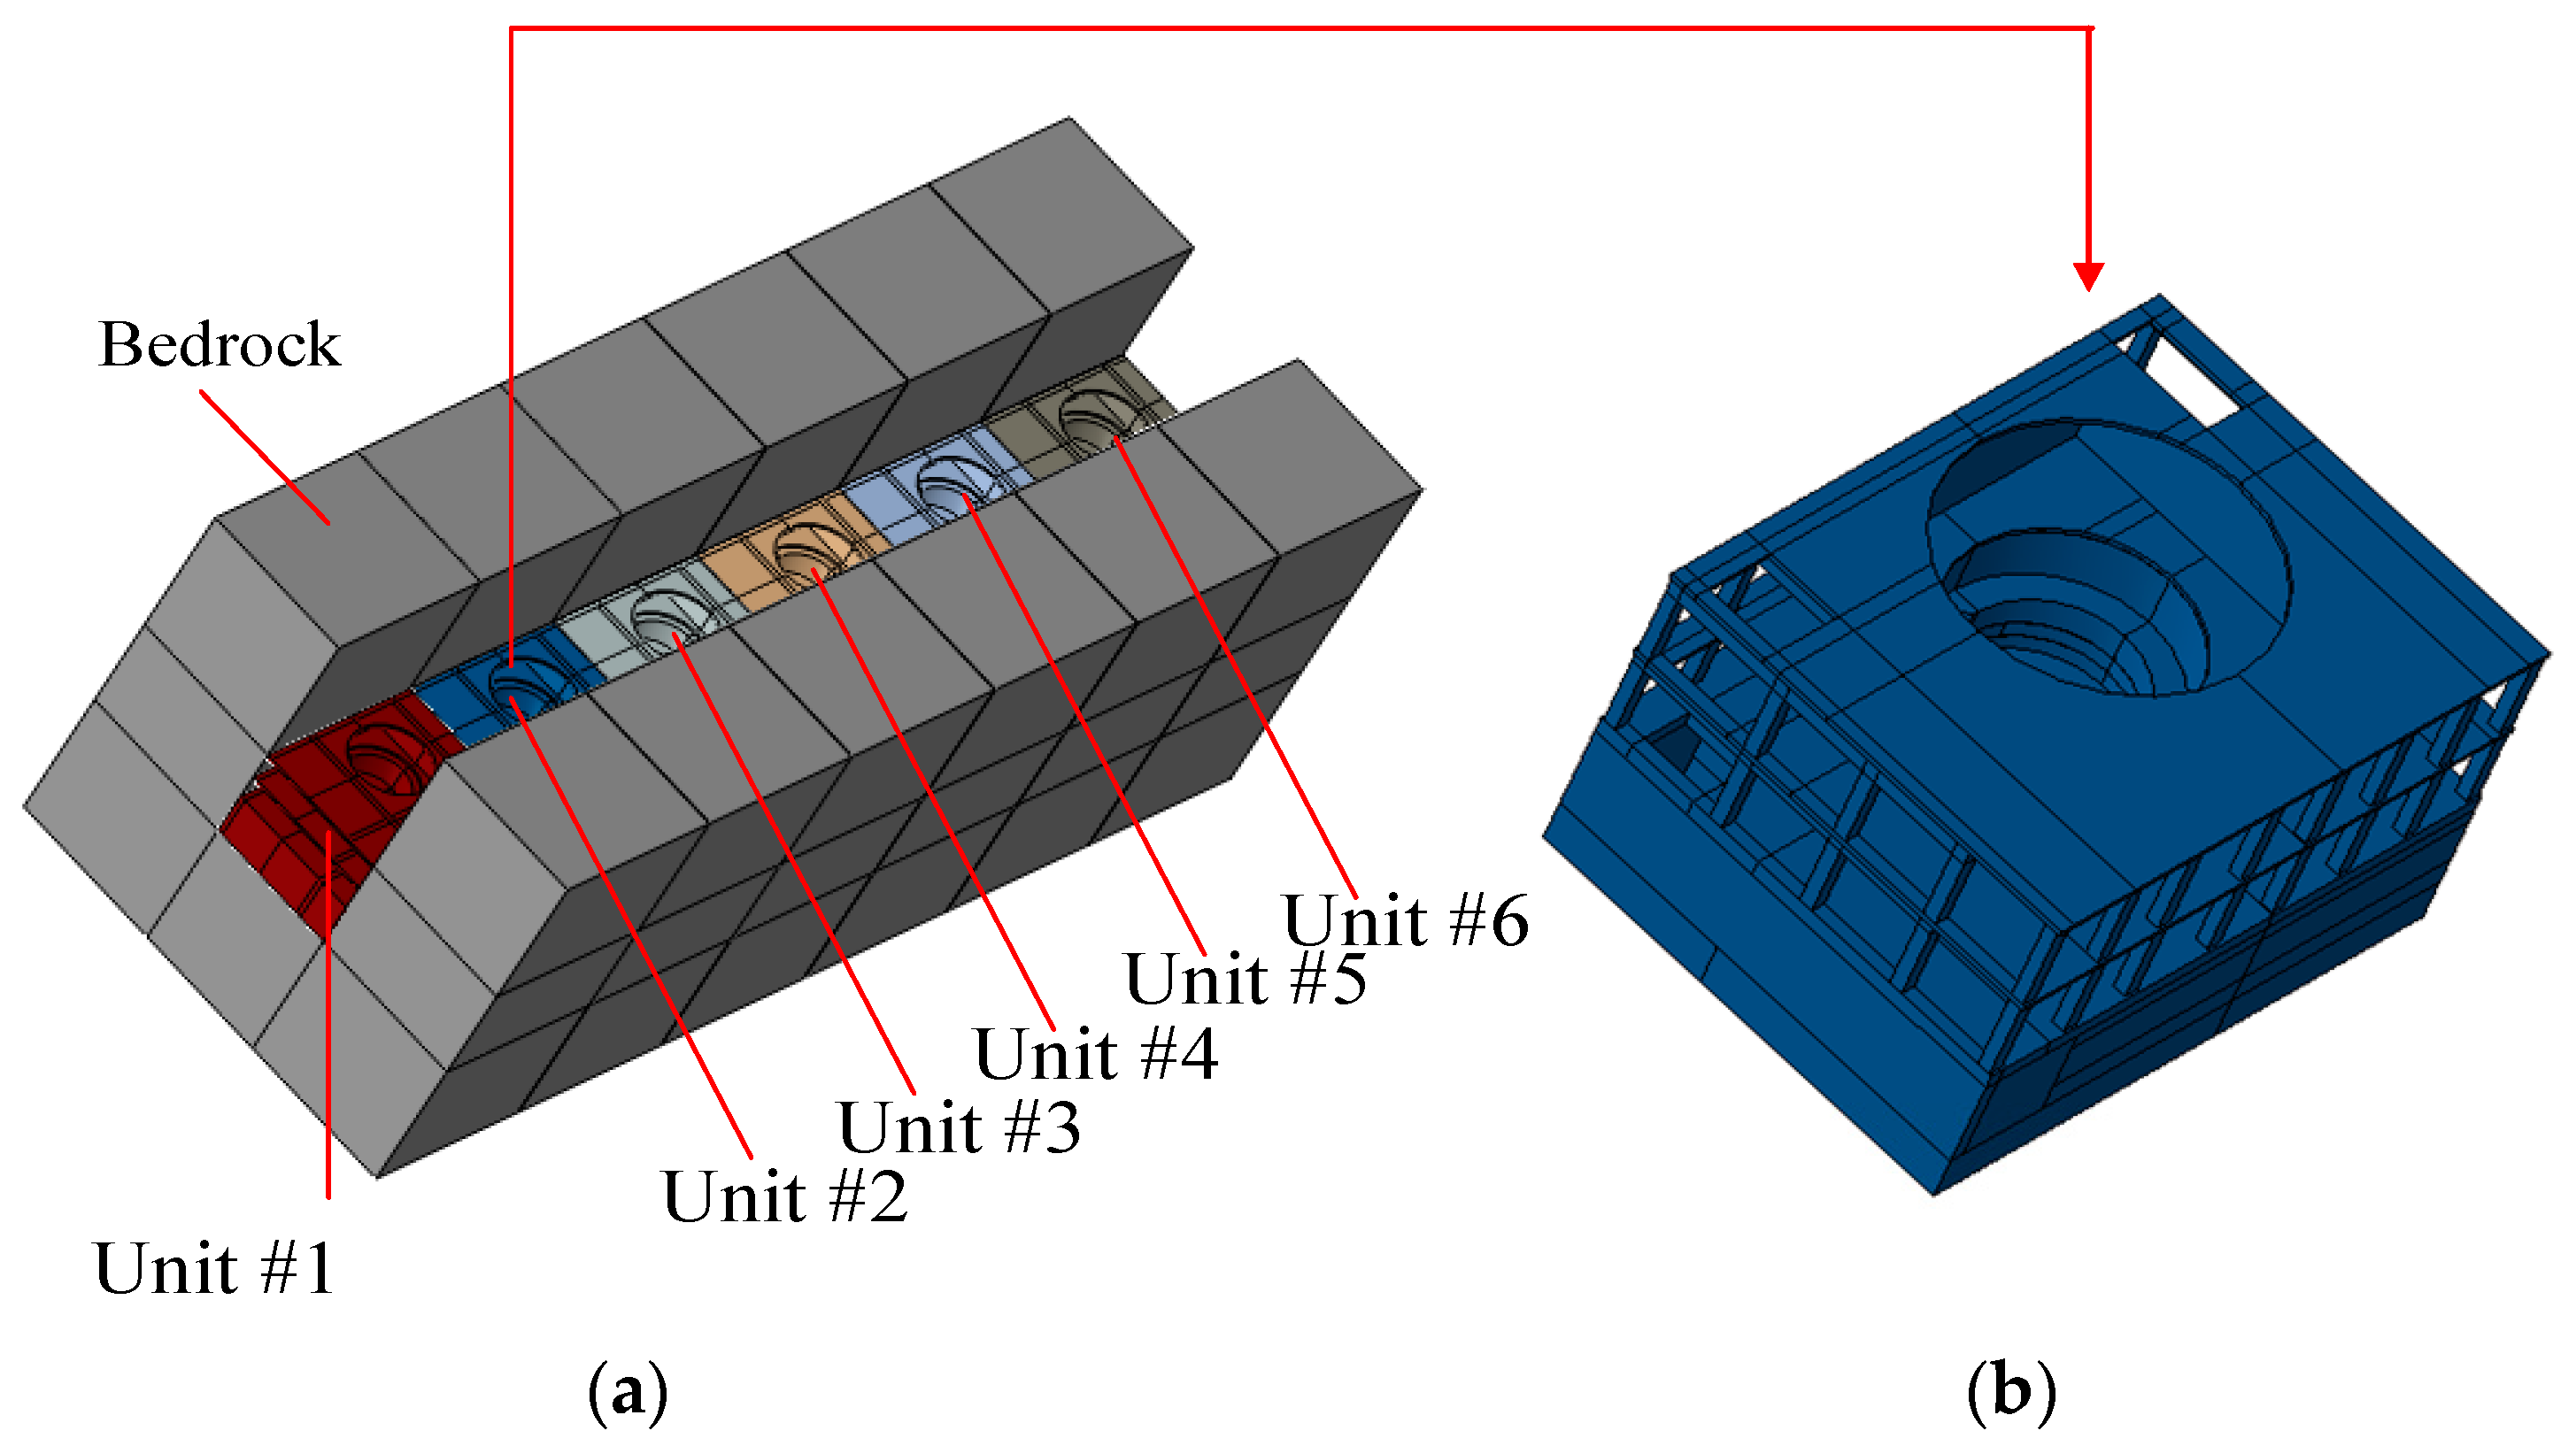
The hydropower station is located in the main stream of Yalong River at the junction of Yanyuan County and Muli County in Sichuan Province of China. It is the first stage of the five-order hydropower development project in the middle and lower reaches of Yalong River, where the hydropower resources are most concentrated. The hydropower station mainly aims at power generation, and it also has functions of flood control and sand interception. The normal water storage level of the reservoir is 1880 m, the total storage capacity is 7.76 billion m3, and the adjusted storage capacity is 4.91 billion m3. The installed capacity of the power station is 3600 MW, the annual utilization hour is 4616 h, and the annual power generation is 166.20 billion kWh. All the units are lined up in the main powerhouse from #1 to #6, and the rated capacity of single unit is 600 MW. Total length of the main powerhouse is 204.52 m, the excavation height is 68.80 m, and the width of the main powerhouse along river is 25.90 m. The main powerhouse is shown as Figure 2.
To study the vibration transmission rules of powerhouse structure among units, vibration displacement sensors were installed in unit #1 of powerhouse, considering the actual condition. Ds-Net acquisition system and DP type seismic low frequency vibration displacement sensor were used in the field tests.
Ds-Net acquisition system was used as data acquisition instrument. This system includes multi-channel signal acquisition module and instrument fault signal identification module. Data can be acquired and stored in this system simultaneously. The system can eliminate structural background noise and Characteristic parameters of signals, such as maximum, minimum, variance, deviation coefficient, and kurtosis coefficient can be calculated immediately. It also has an intelligent multi-channel display interface during test. This system performs well in low frequency signal, and it is suitable for large-scale structural vibration tests, such as the powerhouse, in this paper. The sampling frequency of field tests is 400 Hz, and each data length is 1 min. In order to minimize the influence of end effect in the data processing, the middle 50 s data was intercepted in the analysis. The data acquisition instrument is shown as Figure 3.
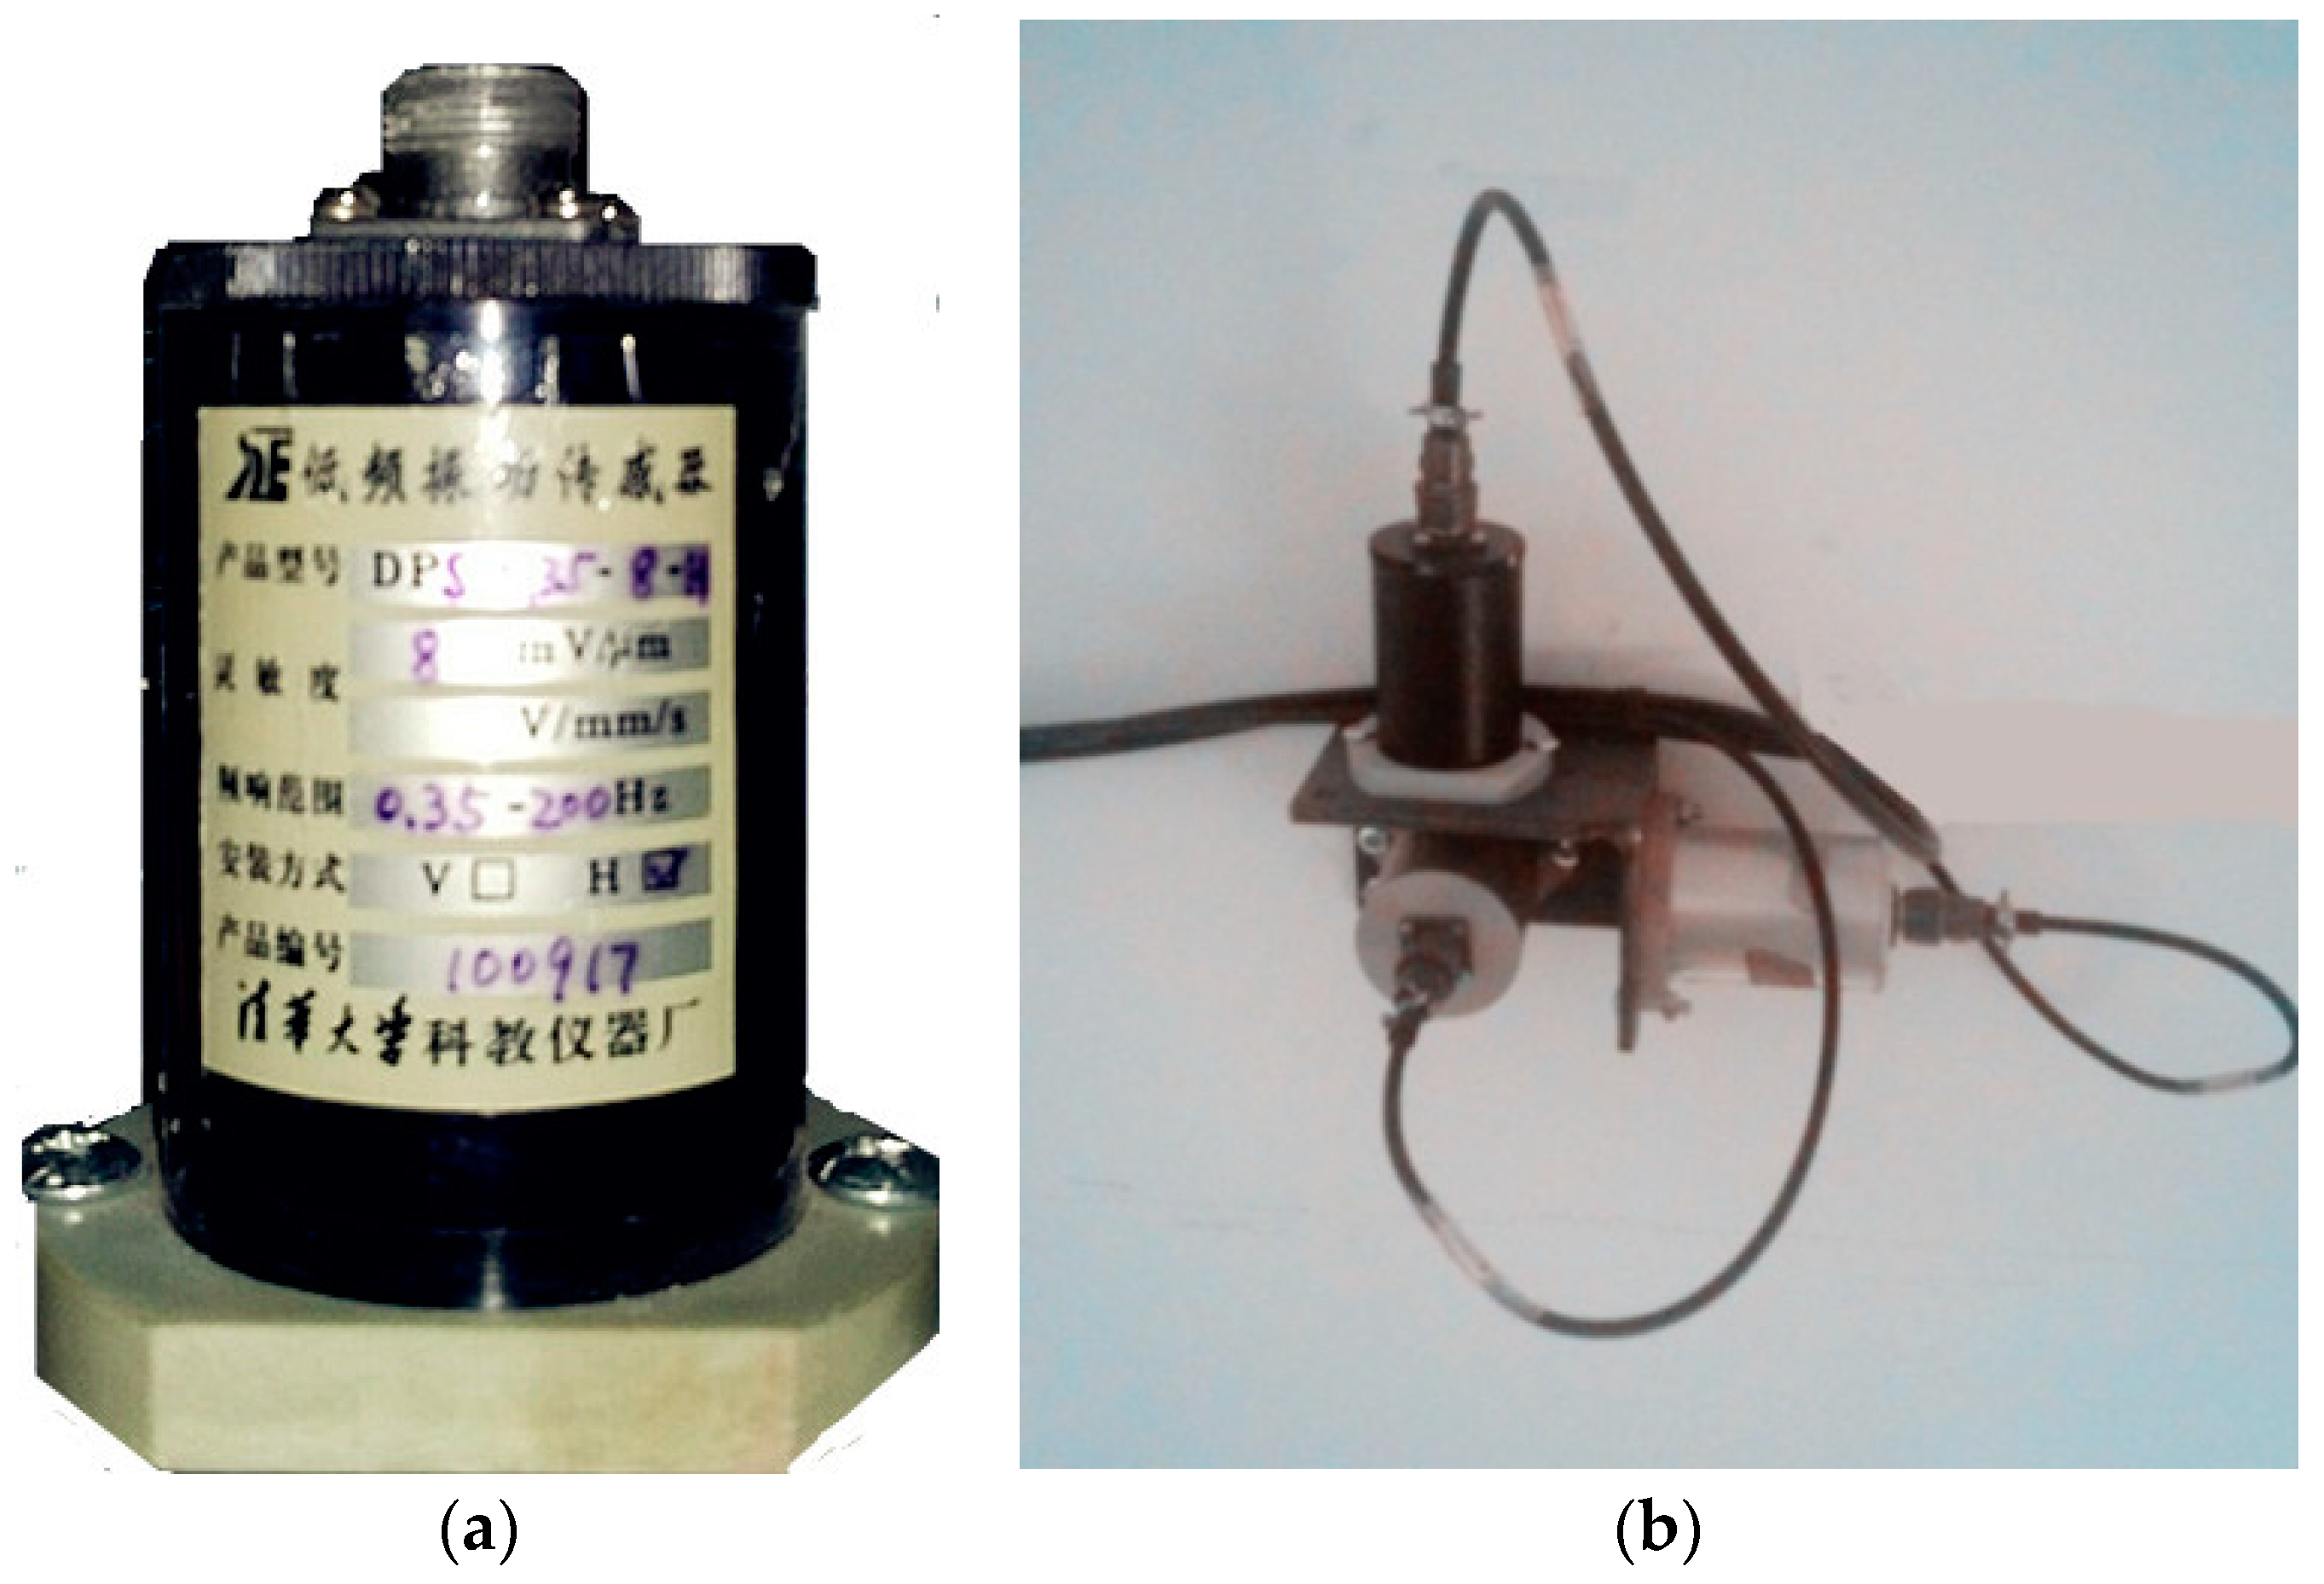
DP type seismic low frequency vibration displacement sensor was used in the field tests. A set of low frequency expansion circuits is employed to the seismic detector, in order to reduce the natural frequency of the output characteristics to 1/20–1/100 of the original detector. The sensor has properties of shock resistance, high stability, and good characteristics of low frequency output. The sensitivity of the sensor is high to measure micrometer vibration displacements. Therefore, the sensor is suitable for vibration measurement of large structures, such as powerhouse structure. Frequency response of the sensor that was used in this paper is in the range of 0.35–200 Hz with a sensitivity of 8 mV/μm. The vibration displacement sensors are shown as Figure 4.
The vibration displacement sensors were installed in the middle of the main beam on the left side of hydraulic turbine floor of unit #1, as shown in Figure 5. Three sensors were fixed by bolts after drilling to test vibrations in the lateral-river direction, the longitude-river direction and the vertical direction. For the convenience of the following description, the lateral-river direction, as well as the direction of axis of main powerhouse is defined as the X direction. The longitude-river direction is defined as the Y direction, and the vertical direction is defined as the Z direction. As shown in Figure 6.
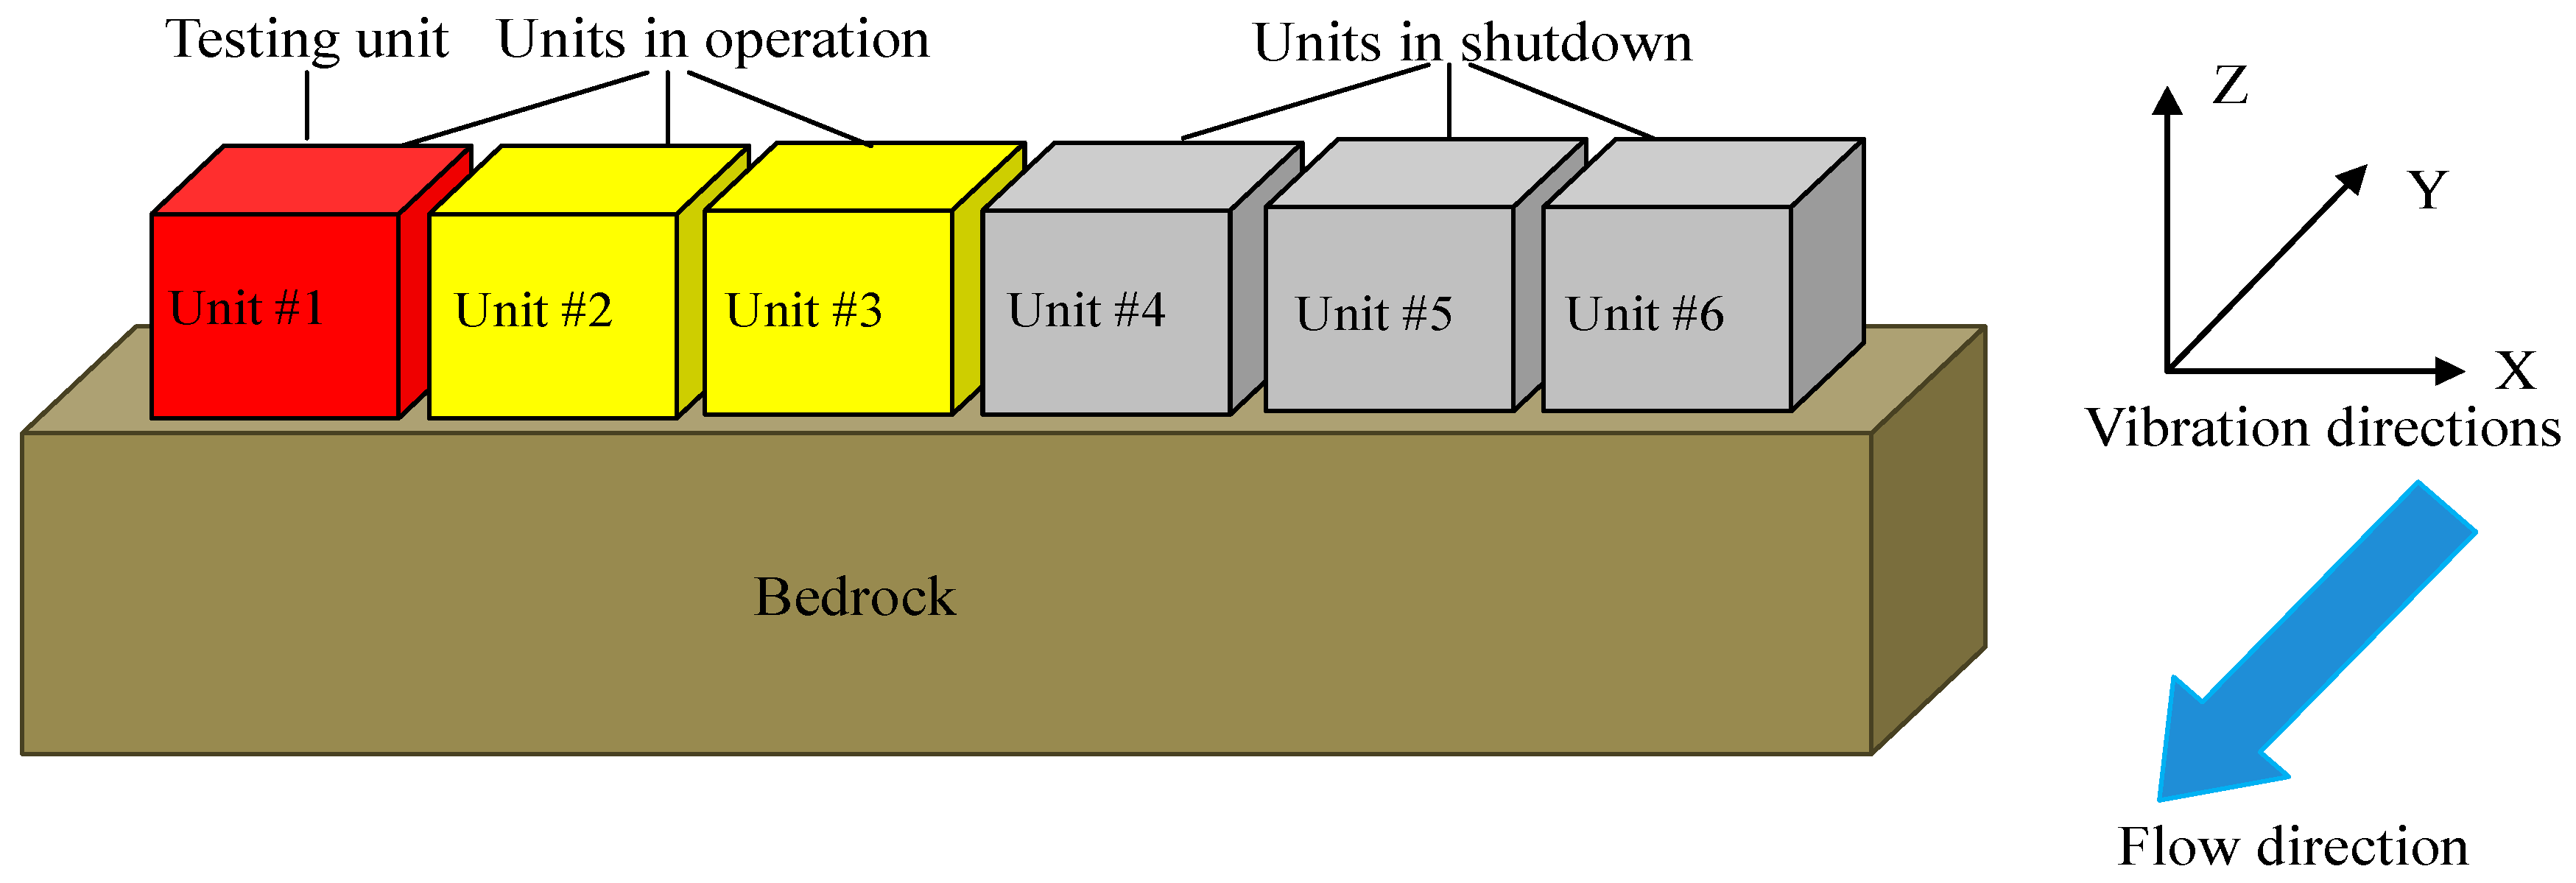
The investigations were concentrated on unit #2 and unit #3, since they were closed to the sensors in unit #1. In order to study the effects of unit#2 and unit #3 on the vibration of sensors in unit #1, it is necessary to adopt the variables control method. Therefore, when testing the effect of unit #2 on the sensors, unit #2 was in operation, both unit #1 and unit #3 should be in shutdown; the same settings were applied when testing the effects of unit #2 and unit #3. Because the units were connected to the power grid during tests, their operating conditions must meet the needs of power grid, and cannot be controlled as the tests required. Therefore, in the actual tests, a large number of data was acquired. Then, the data in the time period when the unit #4, unit #5, and unit #6 were in shutdown was selected after the tests, as shown in Figure 6. Test results for unit #1, unit #2, and unit #3 in various operating conditions were obtained to investigate the vibration transmission.
2.2. Preliminary Tests Results
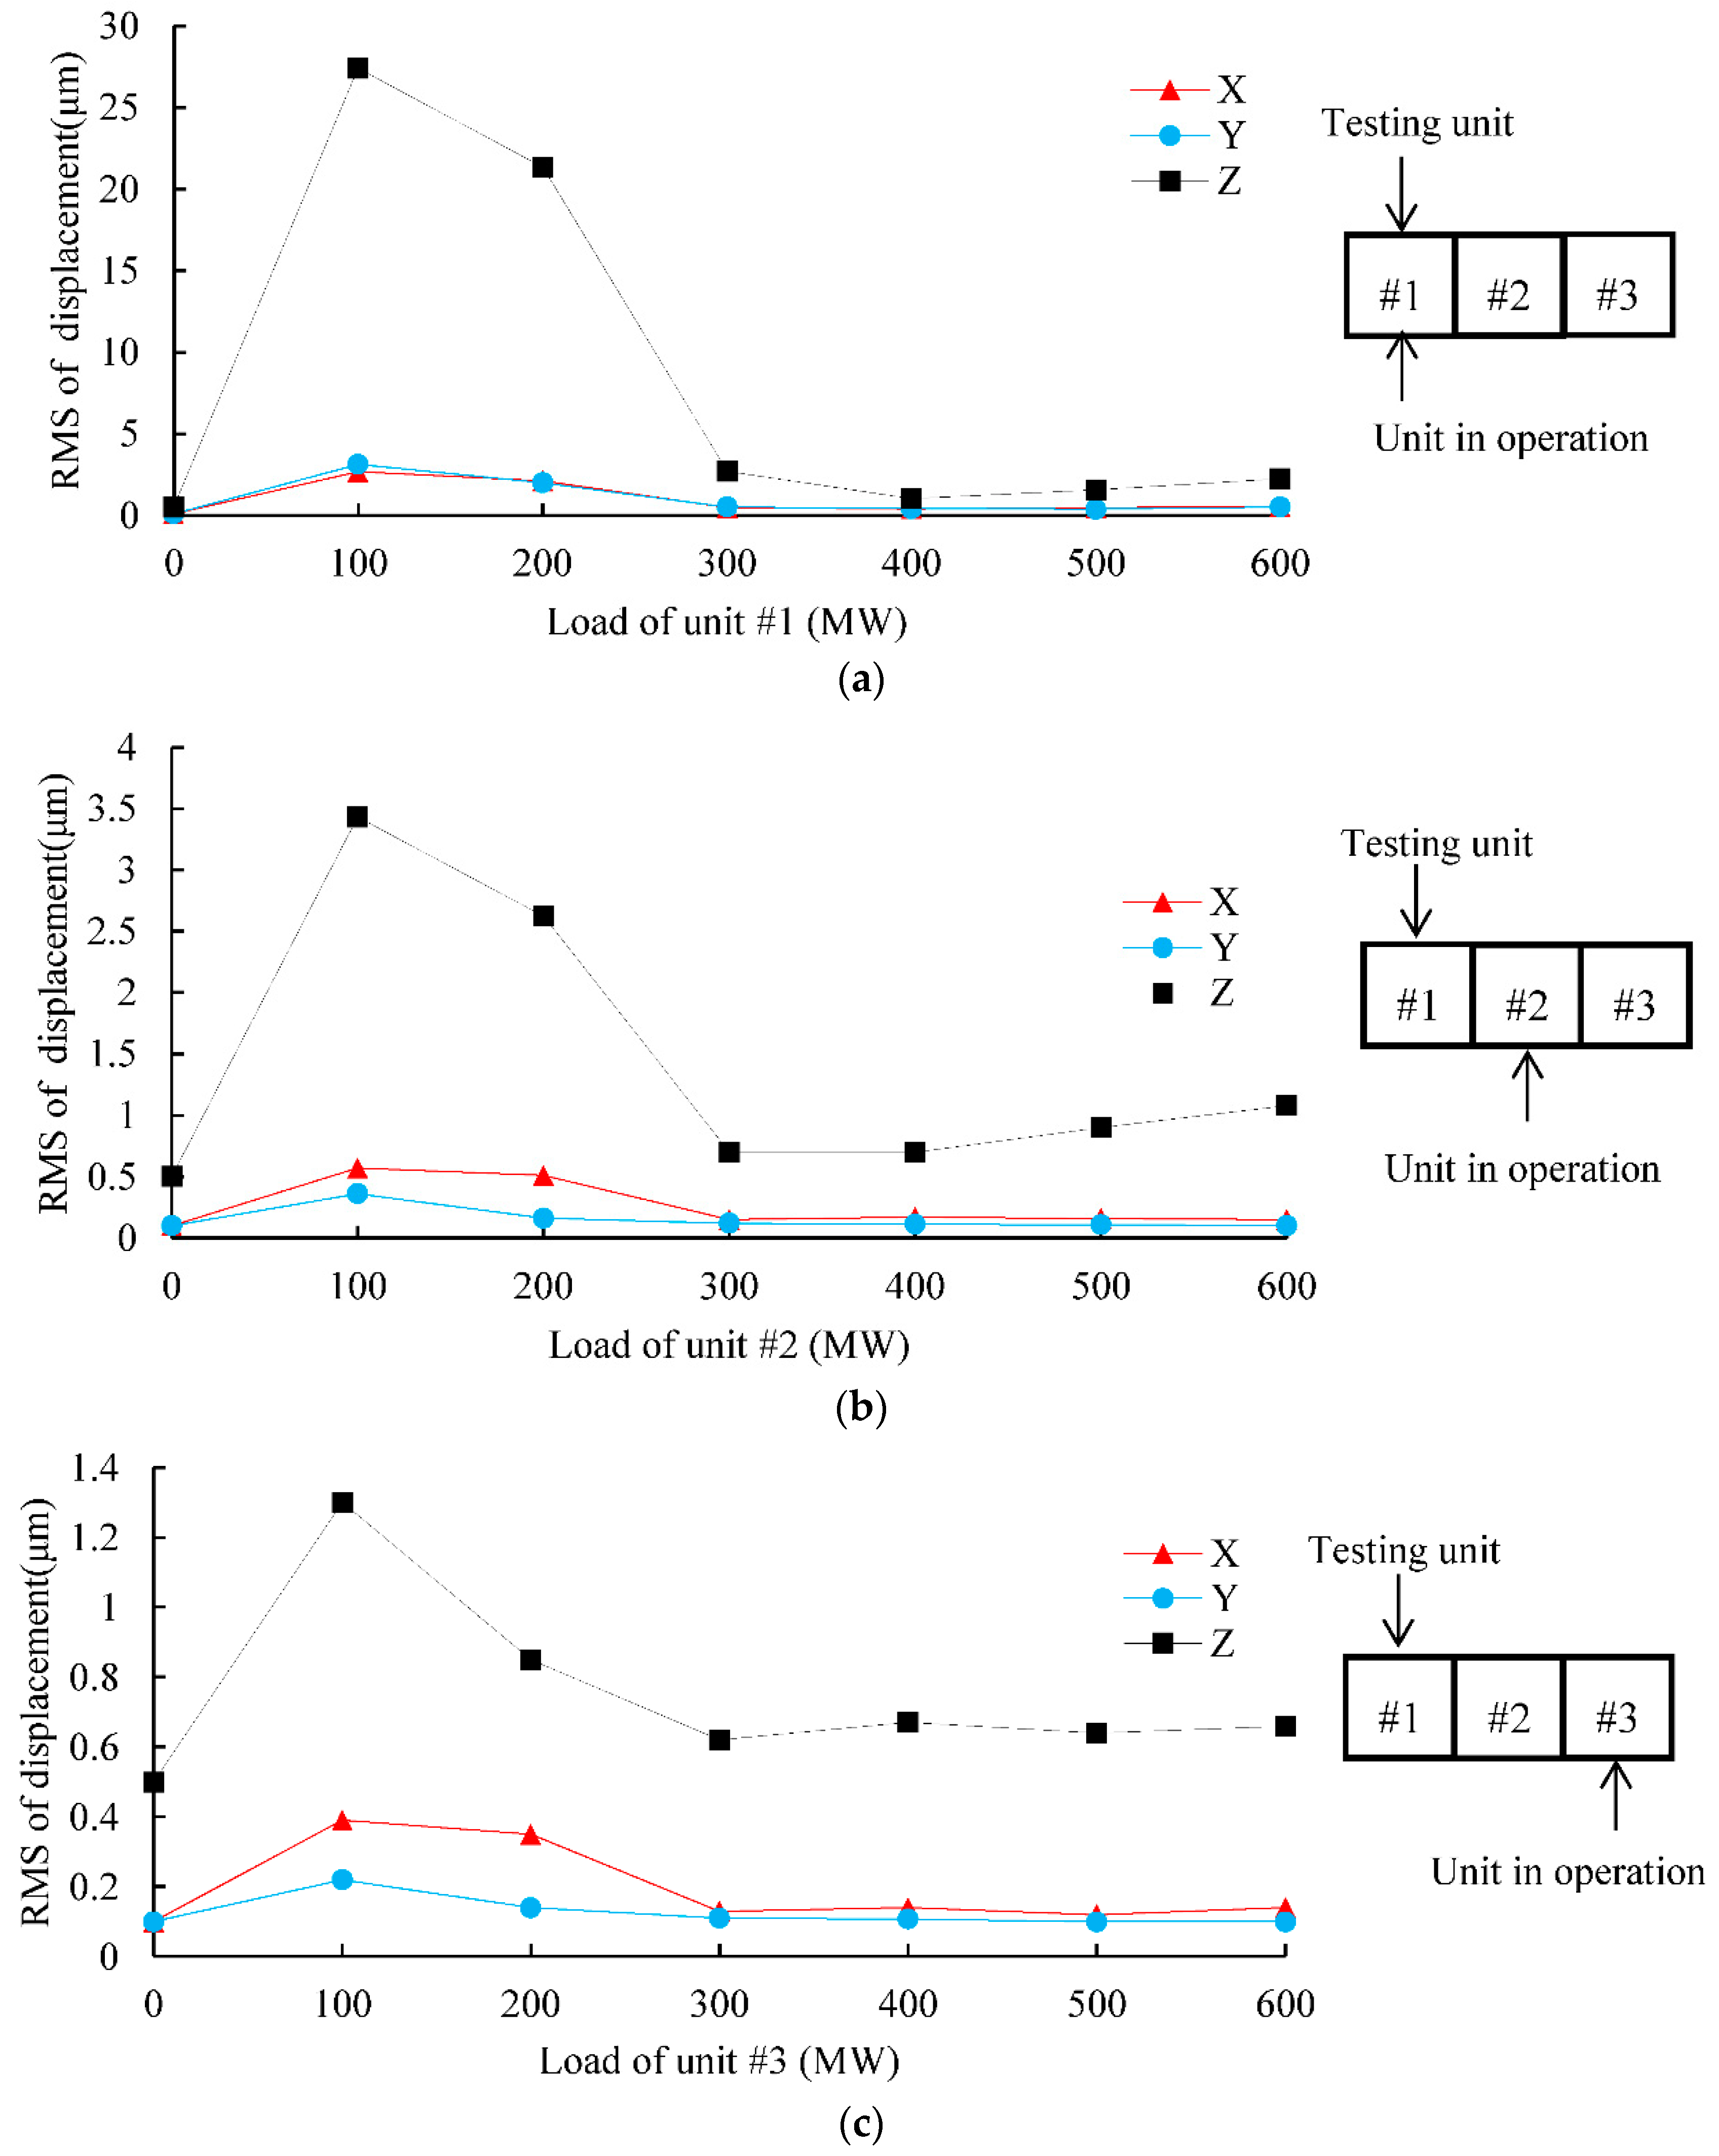
With the change of operating conditions of unit #1, unit #2, and unit #3, the root mean square (RMS) of vibration displacement of the sensors in unit #1 varies, as shown in Figure 7.
It can be seen from the Figure 7 that the vibration in Z direction is most severe. When the vibration source (unit #1, unit #2, or unit #3) is at 100 MW operating condition, vibrations of structure in X, Y, and Z direction achieve the maximum simultaneously. Therefore, the 100 MW operating condition is the most unfavorable condition in the field tests of powerhouse. This is consistent with the previous tests and research results [17,21]. When the Francis Type Water Turbine-Generator Unit is fewer than 40% of rated load conditions, the tail water vortex belt would be decomposed and split. A large number of irregular small vortexes will replace the spiral vortex belt, and the signal exhibits a noise-like broadband characteristic, which can be seen in the spectrum analysis of tested signal in the following section [31]. Samanta and Vinuesa et al. also studied the characterizations of the flow field through numerical simulations and experiments [32,33,34]. In the other hand, the preliminary tests results also prove the consistency of each unit as vibration source. Next, all the following data analysis is based on 100 MW operating conditions.
2.3. Vibration Transmission Rules of Tests
According to the two problems raised in the introduction, the variation of vibration intensity in three directions was calculated to study the effect of vibration directions; the signal component was analyzed to study the effect of vibration frequency.
2.3.1. Vibration Intensity
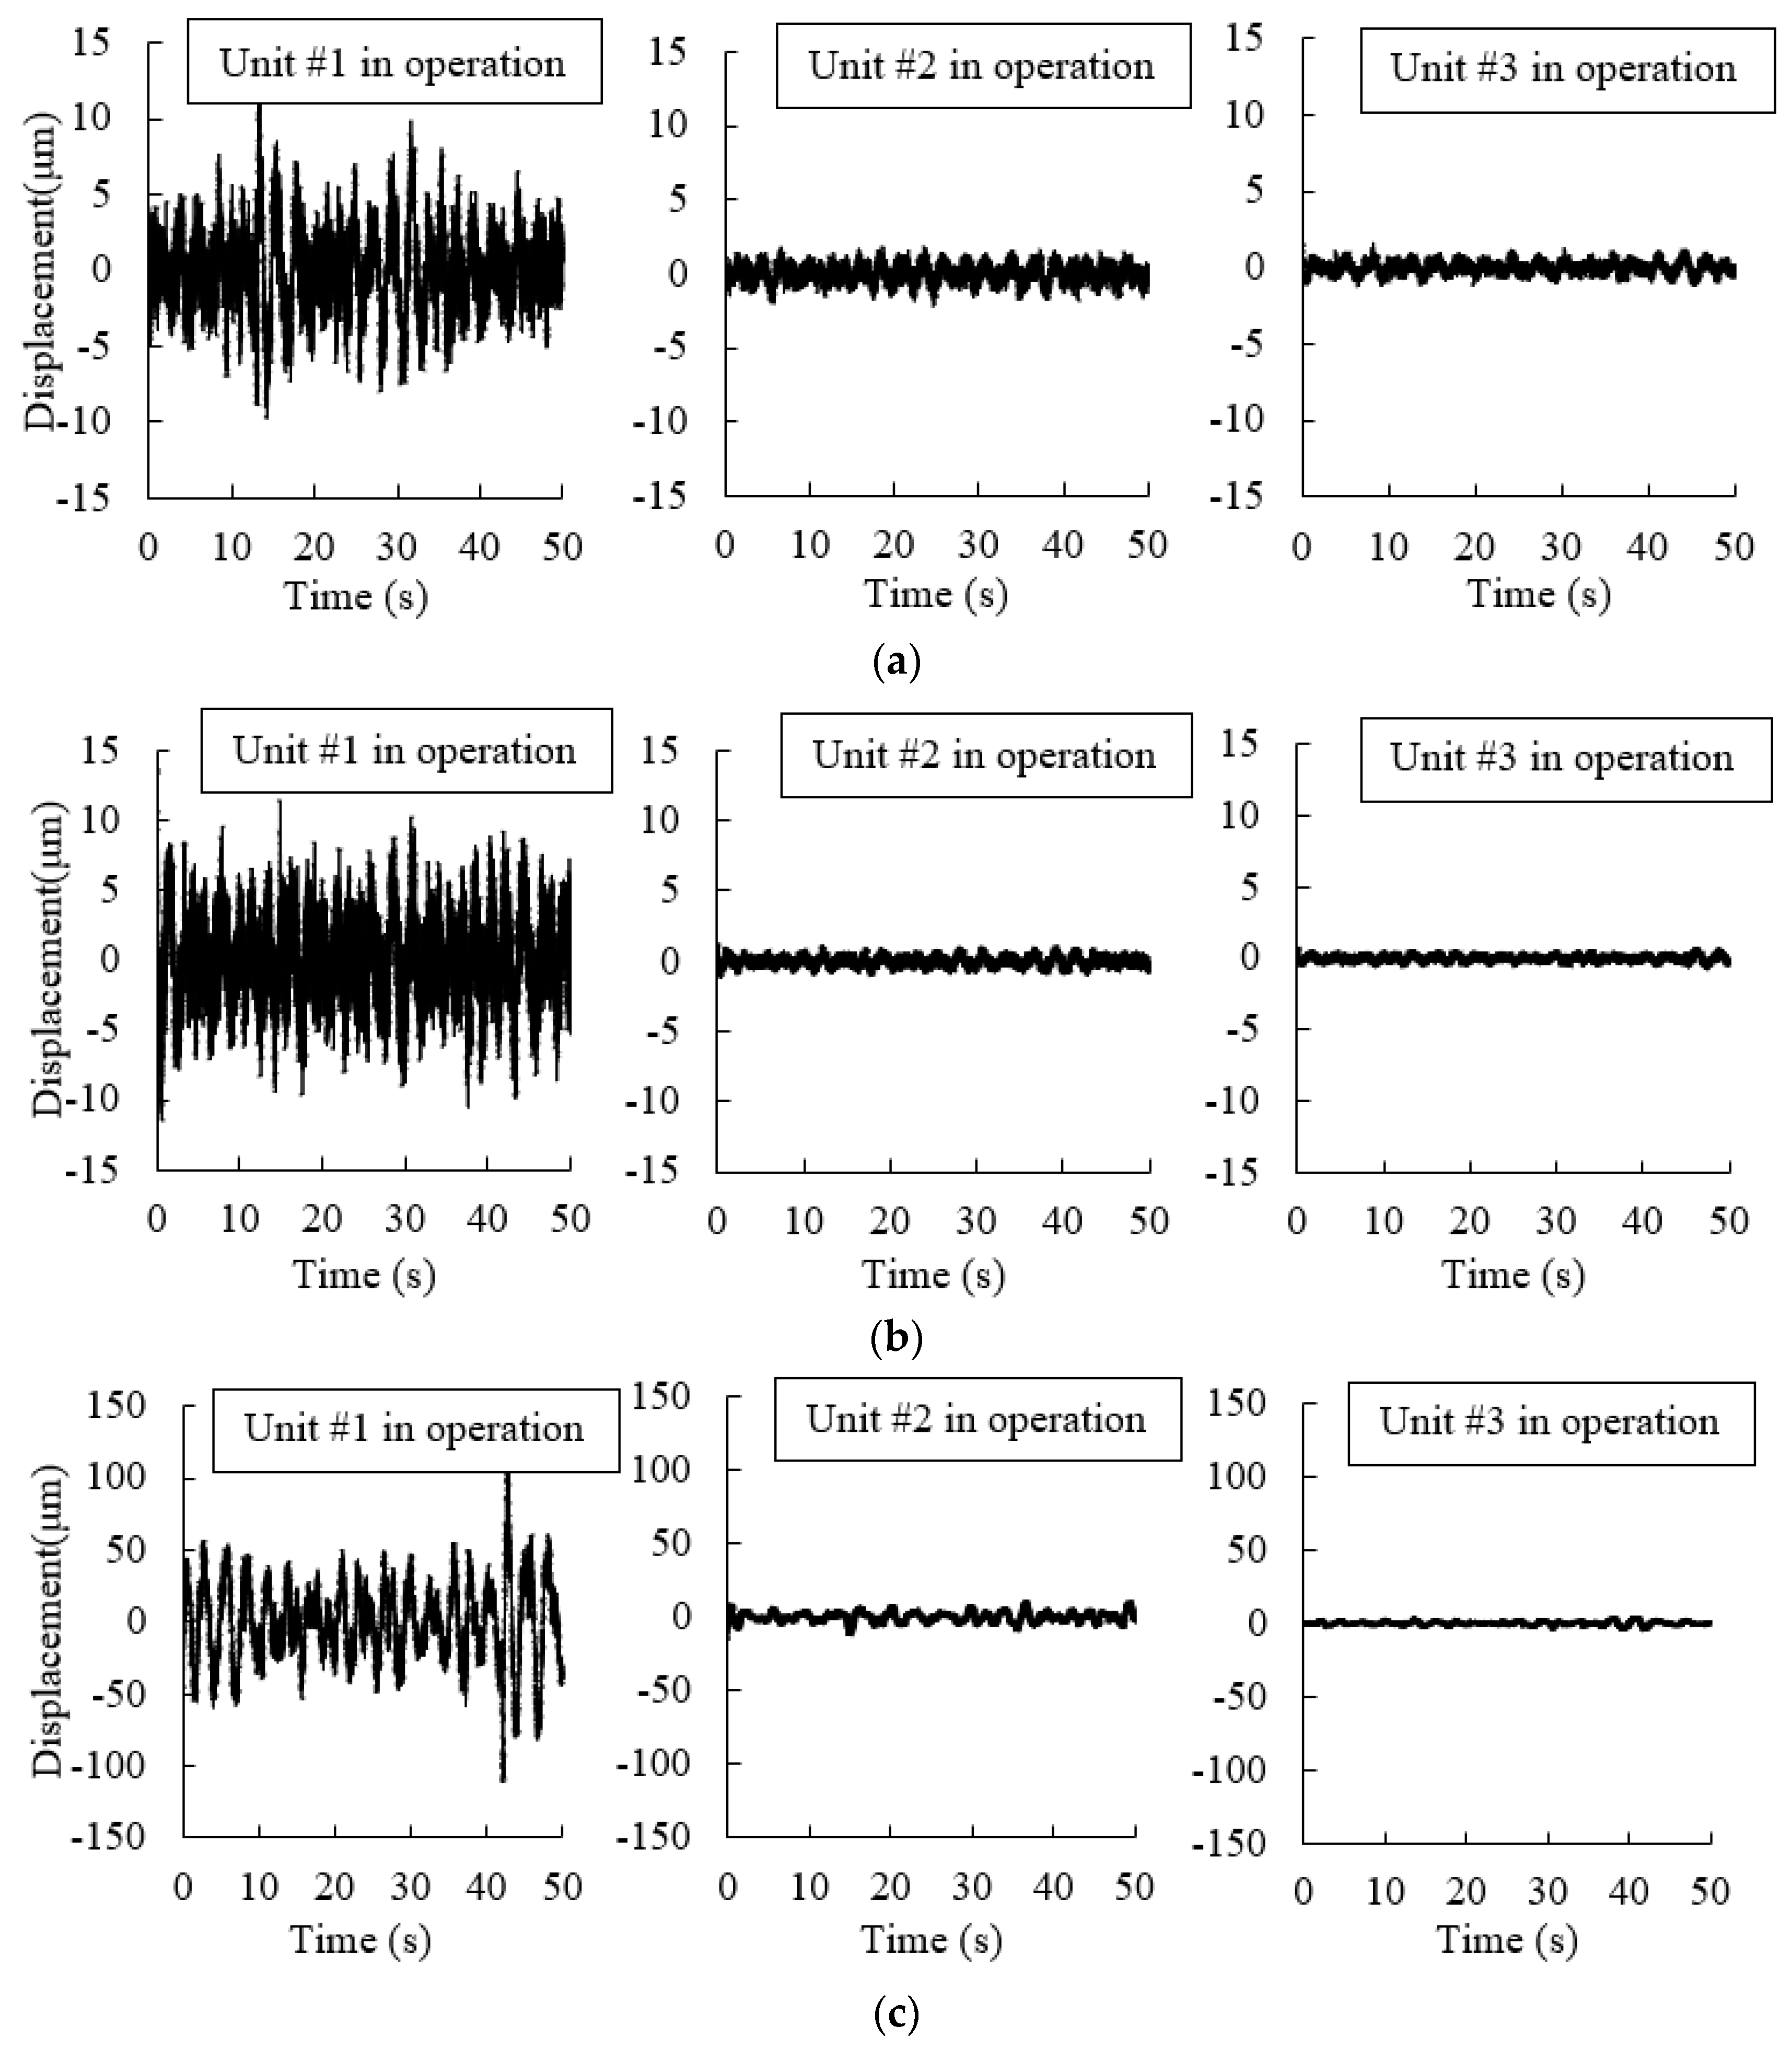
In order to study the rules of vibrations in X, Y, and Z direction with different units, typical time histories of vibration displacements in three directions are shown in Figure 8, when the unit #1, unit #2, or unit #3 is operated as vibration source, respectively.
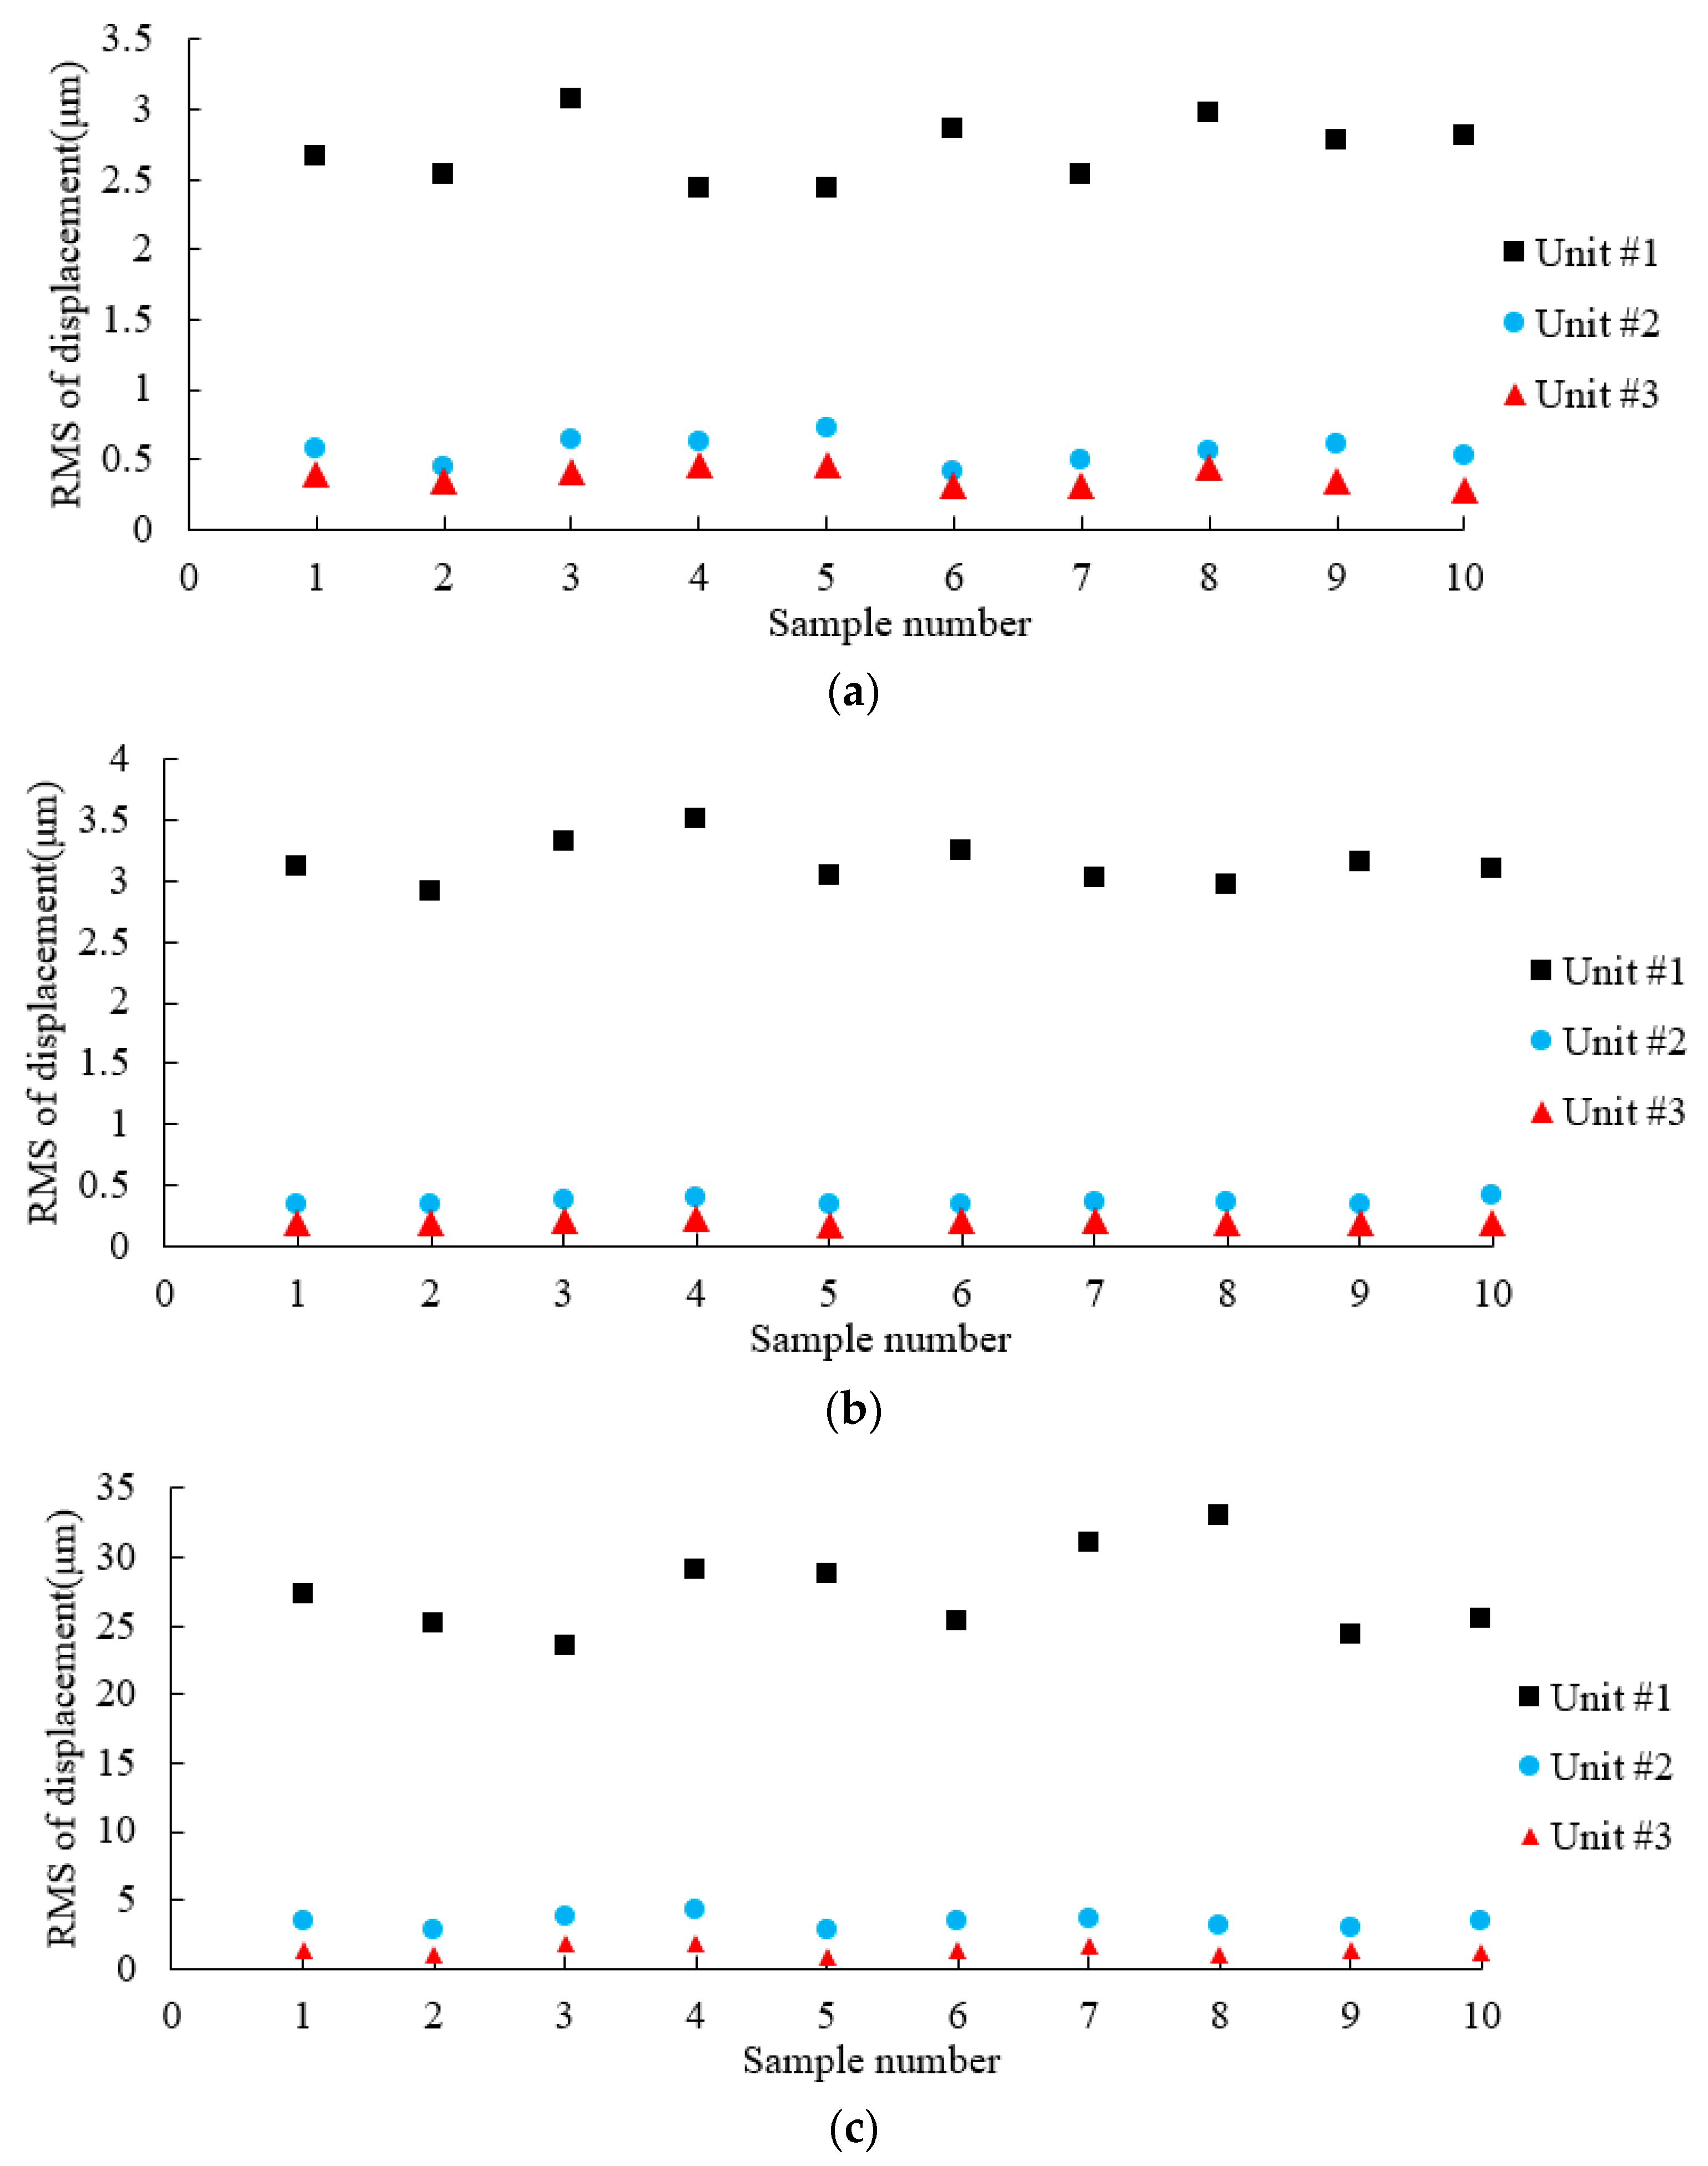
Due to the uncertainty in field vibration tests, it is necessary to minimize the influence of random factors. Therefore, multiple groups of samples were selected in 100 MW operating conditions. Ten groups of typical data were extracted for analysis, and the RMS values of vibration displacement were calculated. A scatter plot of the RMS of vibrations in X, Y, and Z directions is shown in Figure 9.
Figure 9 show that the vibrations in three directions of X, Y and Z all present a tendency of decrease with the increase of the distance from the vibration source. The mean values of the ten samples in three directions of X, Y, and Z are calculated respectively. Taking the RMS of vibration displacement caused by unit #1 as reference, the ratios of RMS of vibration displacement caused by different units are attained respectively, as shown in Equation (1).
The ratios are defined as vibration effect ratios by each unit, as shown in Figure 10. For vibration in X direction, the effect ratio of unit #2 is approximately 17.69%, while the ratio of unit #3 is about 10.69%, compared with the vibrations caused by unit #1 as 100%. For vibration in Y direction, the effect ratio of unit #2 is approximately 9.53%, while the ratio of unit #3 is only 3.31%. For vibration in Z direction, the effect ratio of unit #2 is approximately 10.74%, while the ratio of unit #3 is about 3.2%. When considering of the consistency of each unit as vibration source, the vibration effect ratios can also be regarded as vibration transmission ratio.
It can be conducted that the vibrations in X direction caused by adjacent units are greater, and the vibration transmission ratios are bigger, as compared with the vibration in Y and Z directions.
2.3.2. Signal Component
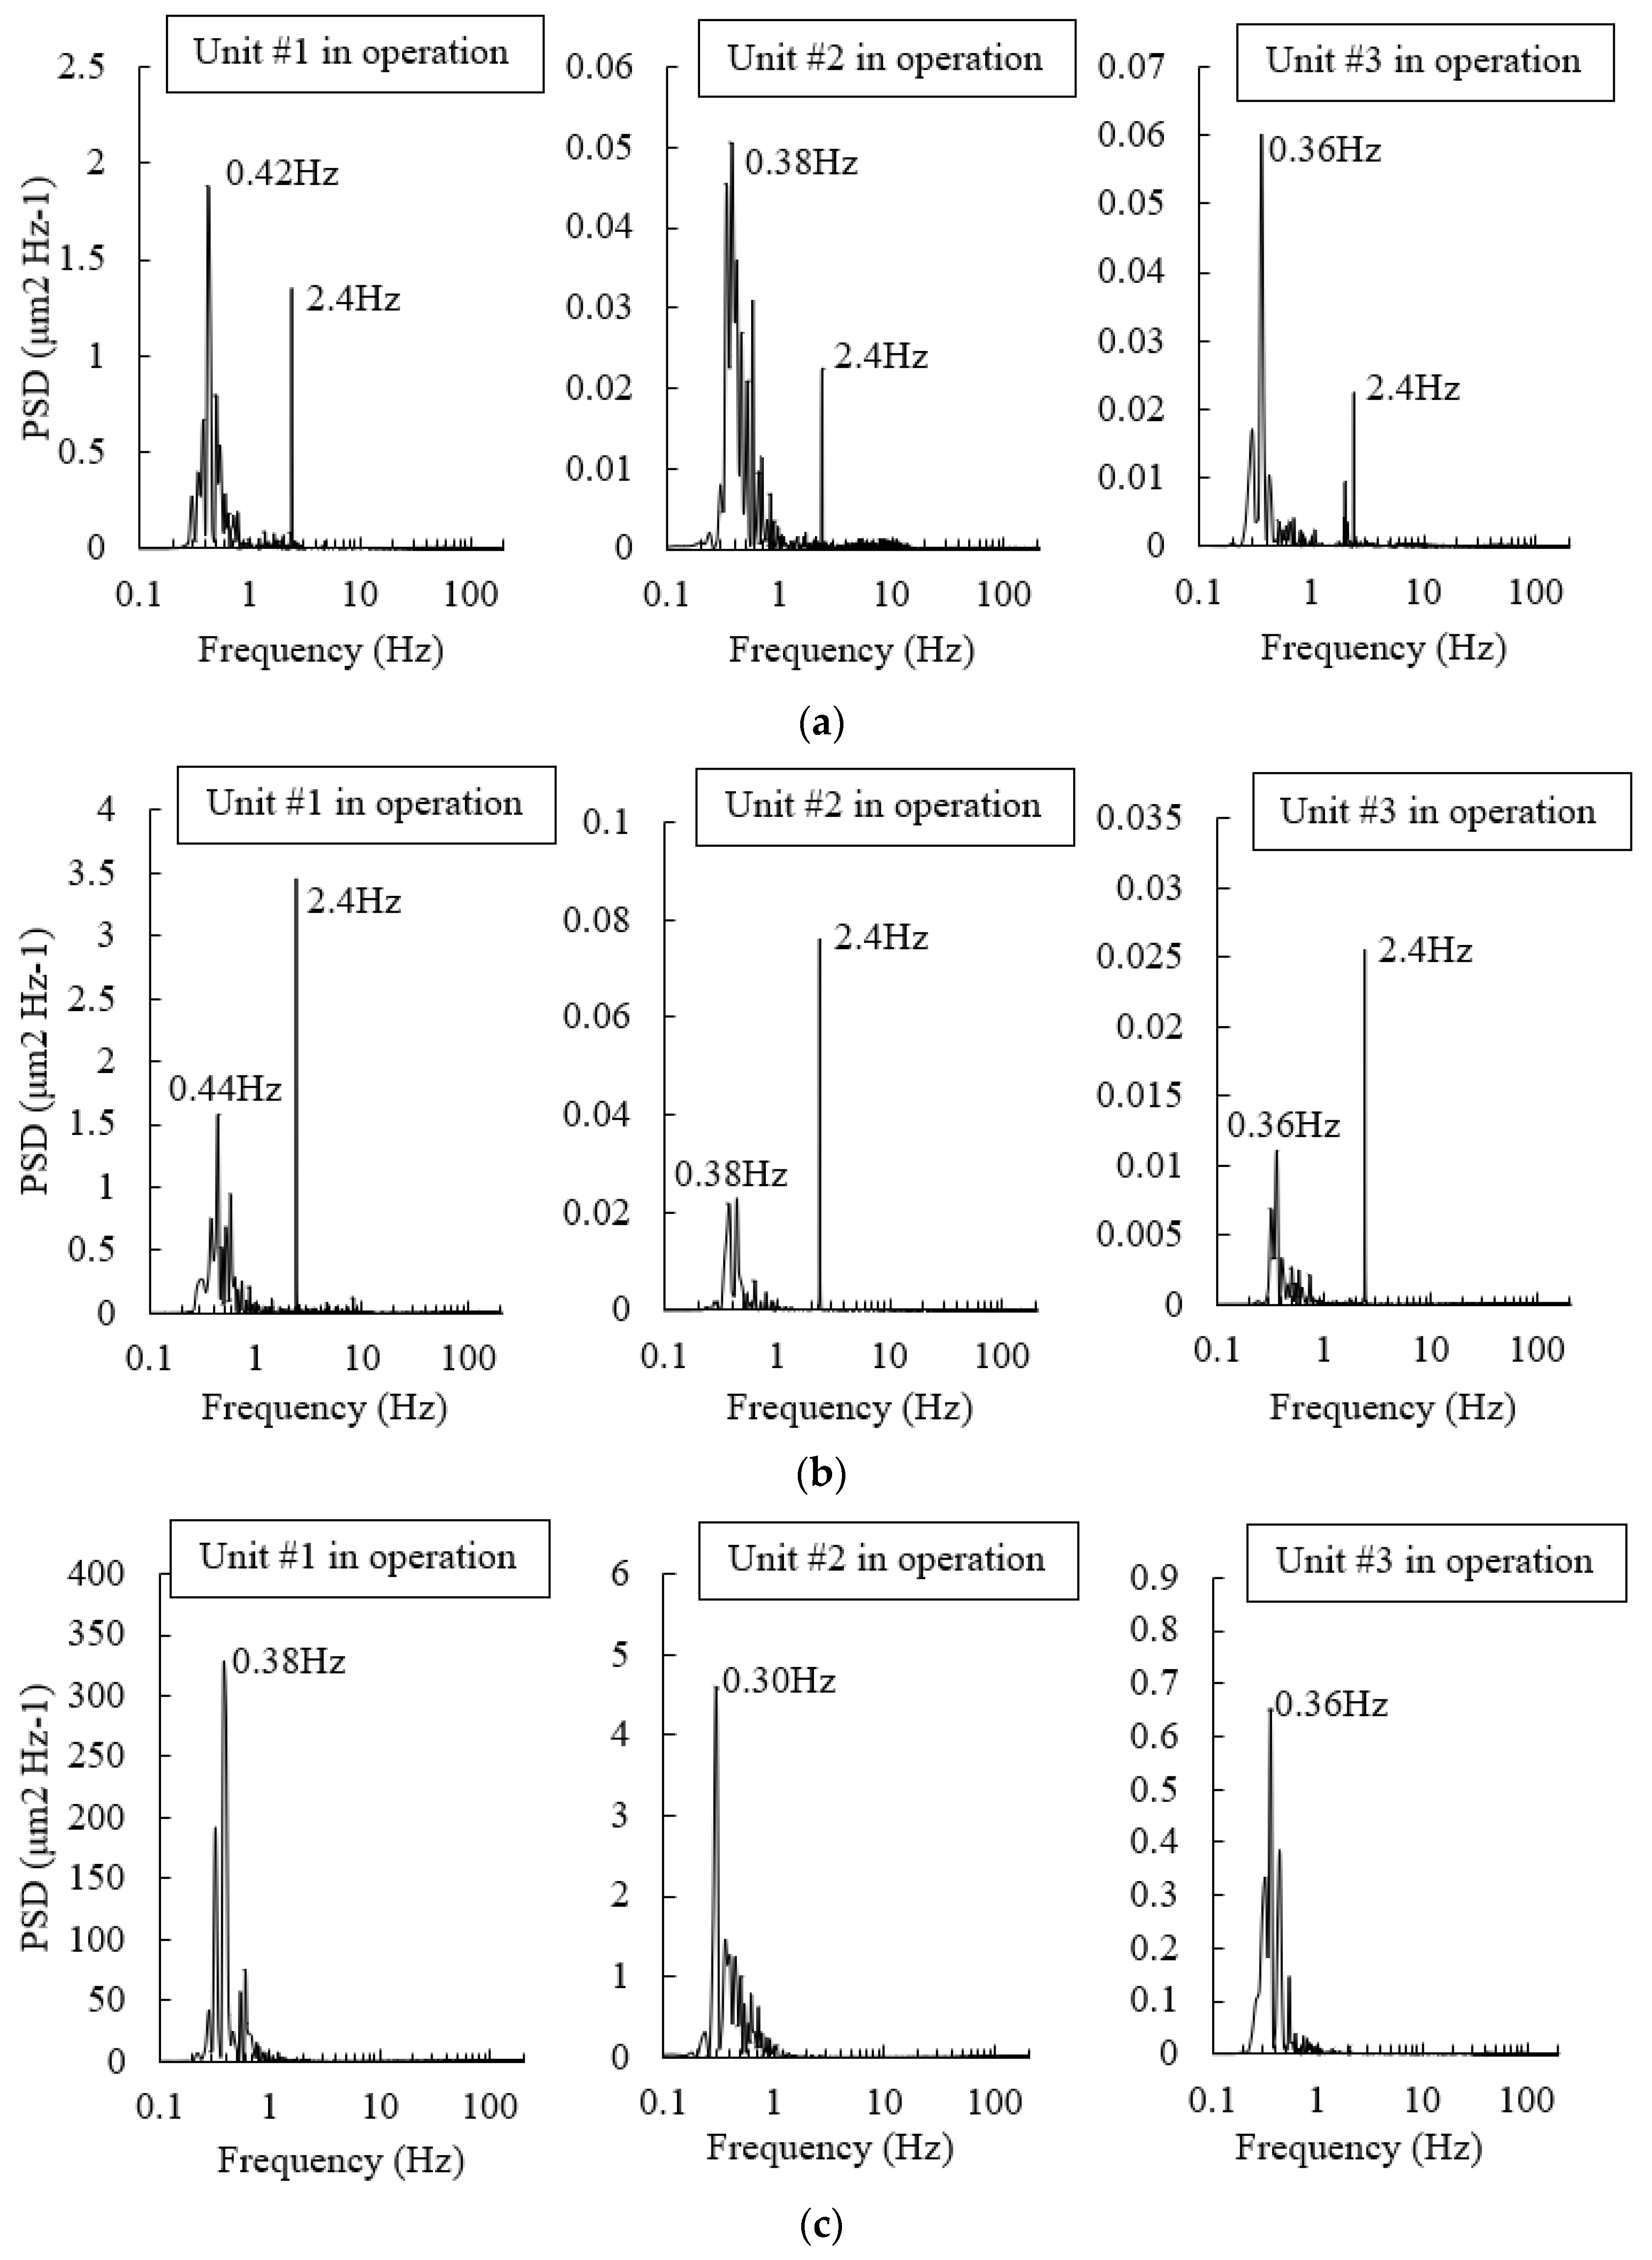
In order to study the variation of signal components in the process of vibration transmission, spectral analysis is performed based on the vibration signals in Figure 8. Power spectral density (PSD) is obtained and shown in Figure 11.
According to the PSD shown in Figure 11, all the signals can be divided into three components: (1) Component A, with frequency between 0.2 and 1.5 Hz; (2) Component B, with frequency of 2.4 Hz; and, (3) Component C, with frequency higher than 5 Hz. For vibration in X direction, the Component A is the main part. Meanwhile, the energy of Component B is less than Component A. For vibration in Y direction, Component A and Component B are two main parts. Energies of the two are basically equal, while the Component A is wider and the peak value of the Component B is larger. For vibration in Z direction, the Component A is the only main part. The Component B is unobvious. For vibrations in all three directions, the Component C is not obvious. The proportions of the three components do not show apparent difference among vibrations caused by unit #1, unit #2 and unit #3.
The components of signals are related to the corresponding vibration sources. Combining previous studies [13,14,16,35], vibration sources of powerhouse structure mainly consist of the following parts: (1) Rotation of hydraulic generator, according to the unit parameters, the rotational frequency of hydraulic generator is 2.4 Hz; (2) Low frequency tail fluctuation, when the unit is in the medium and low load state, severe low frequency tail fluctuation occurs in the draft tube. It is often the main source of vibration for units and powerhouse structure. Its frequency is less than 0.6 times that of rotation frequency; (3) The other medium and high frequency vibration sources, such as volute uneven flow. Combining above, the Component A can be considered to be caused by low frequency tail fluctuation; the Component B can be considered to be caused by the rotation of hydraulic generator; the Component C can be considered to be caused by the other medium and high frequency vibration sources.
In order to further quantify the components, the wavelet analysis method was used to component analysis of vibration signals. Wavelet analysis is a local transformation method based on time, space and frequency. It uses horizontal movement and expansion to perform function multi-scale operation, which can realize frequency domain decomposition of data signals. Multi-Resolution Analysis (MRA) was applied in this article. The db3 wavelet was used as the mother wavelet. Firstly, the vibration signals were decomposed by seven-level wavelet transform. Then signals corresponding to different vibration sources were reconstructed from different frequency bands. Finally energies of vibration signals corresponding to different vibration sources were calculated. The frequency range of each frequency band after wavelet decomposition of vibration signals are shown in Table 1.
Signal corresponding to a7 was reconstructed as the Component A. Signal corresponding to d7 was reconstructed as the Component B. Signals corresponding to d6, d5, d4, d3, d2, and d1 were constructed as the Component C. Variances of the reconstructed signals are calculated to obtain the energy proportions of different vibration components, as shown in Figure 12. It can be shown that energy proportions of Component A and Component B barely change in the progress of vibration transmission among units.
According to the above, it can be concluded: (1) Low frequency tail fluctuation and rotation of hydraulic generator are the two main vibration sources of the vibration of the powerhouse structure; and, (2) They have almost the same transmission ratios among units.
3. Study of Vibration Transmission Mechanism
The simplified mechanical vibration models are established to investigate the vibration transmission mechanism of powerhouse structure among units.
3.1. Simplication of Powerhouse Structure
The vibration transmission of underground powerhouse structure among units is essentially a kind of mechanical wave. Its transmission direction is the direction of axis of the main powerhouse (from unit #1 to unit #n), that is the X direction according to the previous definition. When the vibration is in X direction, its direction is consistent with the transmission direction. So, this transmission can be regarded as compression vibration. When the vibration is in Y or Z direction (perpendicular to the direction of transmission), the transmission can be regarded as the shear vibration, as shown in Figure 13. These two different vibration transmissions in powerhouse will be studied in the following section.
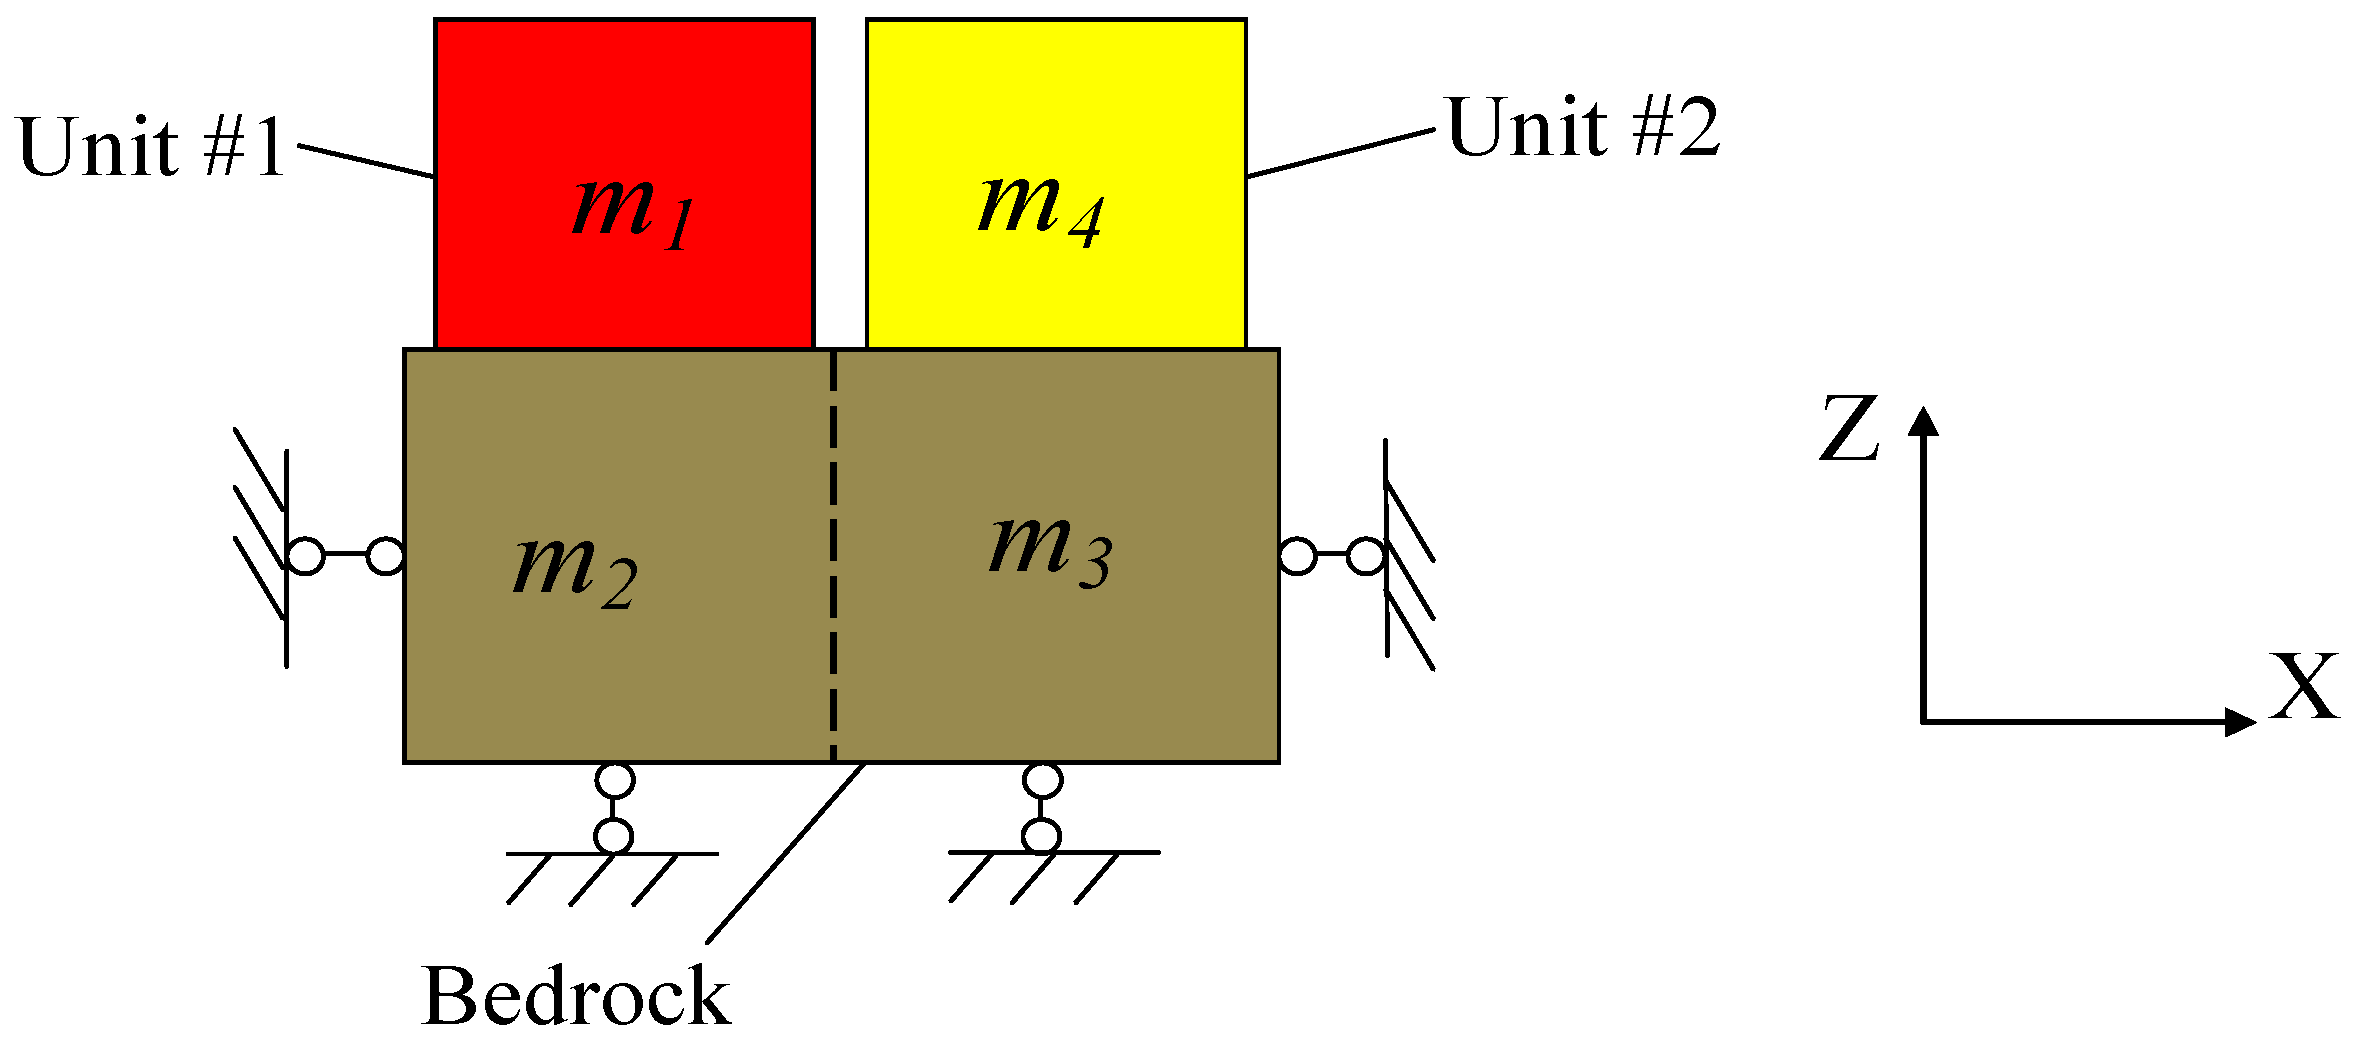
According to the structural characteristics of underground powerhouse of the hydropower station, it is known that the main structure of powerhouse is mainly the mass concrete. Therefore the powerhouse structure of each power unit can be regarded as a homogeneous block and fixed on the bedrock. Units are separated by the split seam. Assuming that the effect of split seams on vibration transmission among units is negligible. Only the vibration transmission through the bedrock is considered. When considering the condition of two adjacent units, the main powerhouse structure can be simplified, as shown in Figure 14.
As shown in the Figure 14, two units and the bedrocks are plotted in the two-dimensional (2-D) plane. Two adjacent units are represented by two lumped masses m1 and m4. The bedrocks below m1 and m4 are represented by two homogeneous elastic blocks m2 and m3, respectively. The bottom and the lateral sides of bedrocks m2 and m3 are restrained by normal constraints. It is easy to know m1 = m4, let m1 = m4 = m; similarly, m2 = m3 = M.
3.2. Establishment of Vibration Models
According to different modes of transmission, two vibration models are established.
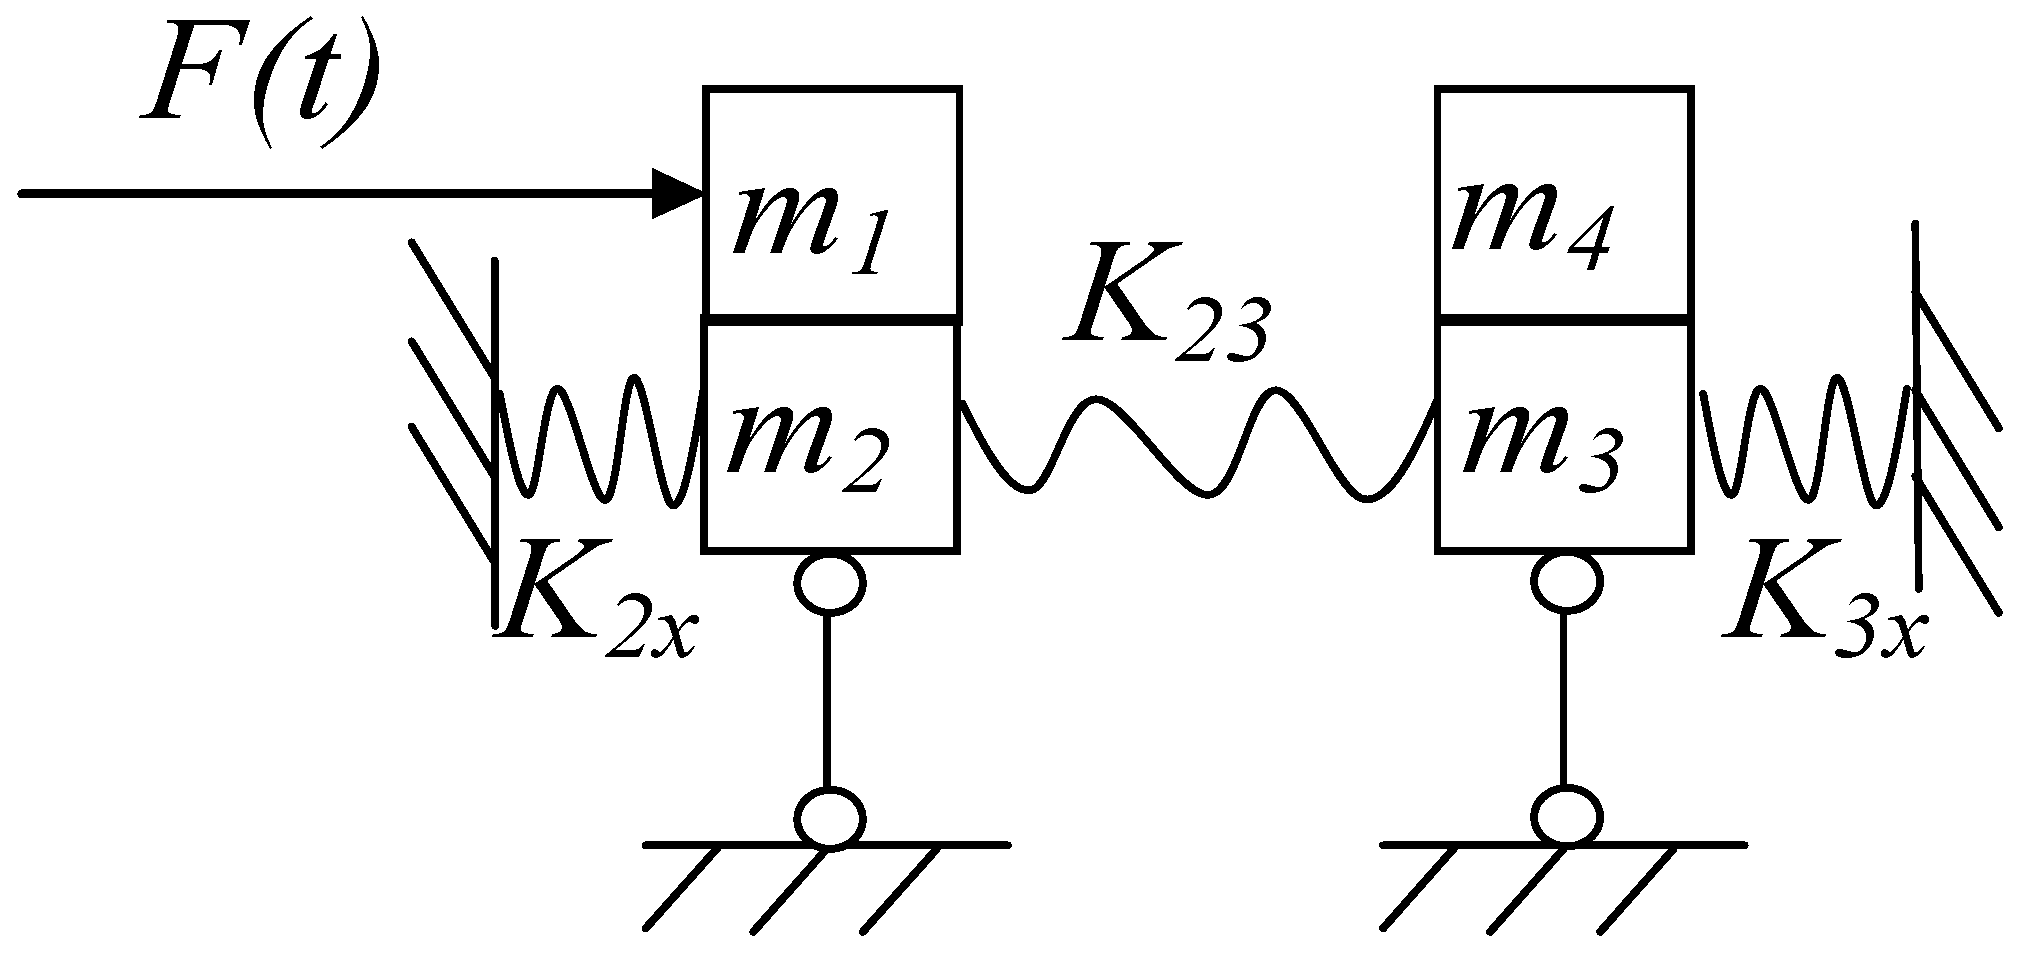
Firstly, a horizontal vibration model has been established to study the compression vibration, as shown in Figure 15.
By the concentrated mass method, the masses of bedrocks are concentrated at their centroids, and regarded as two lumped mass, m2 and m3. They are connected to the left and right boundary by springs; Deformation of the bedrock between m2 and m3 is represented by the stretching and compression of a spring to simulate the interaction of axial force. Load F(t) is applied on the lumped mass m1. x1, x2, x3 and x4 denote displacements of m1, m2, m3, and m4, respectively. Considering dynamic load only, equations of motion for the four lumped masses are listed in Equation (2).
Q12 refers to the shear force between m1 and m2; Q34 refers to the shear force between m3 and m4. K2x refers to the compression stiffness between m2 and left boundary; K3x refers to the compression stiffness between m3 and right boundary; K23 refers to the compression stiffness between m2 and m3. For homogeneous elastic structure, the compression stiffness can be calculated according to K = EA/l, then the compression stiffness of horizontal vibration model is obtained as K2x = K3x = 2Eh/l, K23 = Eh/l. l refers to the length of a single unit, h refers to the depth of bedrock considered, and E refers to the elastic modulus of bedrock. Let Kx = Eh/l, then K2x = K3x = 2Kx, K23 = Kx. According to the kinematic relationship between units and surrounding rocks, x1 = x2 and x3 = x4 can be drawn. After simplification of Equation (2) according to the above formula, Equation (3) is derived.
Assuming a simple harmonic load F(t) = Asin(ωt), then the expressions of x1 and x4 should also be in the simple harmonics form. Let x4 = Psin(ωt), substitute it into the Equation (3). Equation (4) can be derived.
The ratio is defined as the vibration transmission ratio of horizontal vibration from x1 to x4, to describe the influence on m4 caused by vibration of m1 in X direction.
Next, the vertical vibration model is established to study the shear vibration, as shown in Figure 16.
Similar simplified method is used for the vertical vibration model. The masses of bedrocks are concentrated at their centroids, and regarded as lumped masses m2 and m3. They are connected to the bottom boundary and above masses m1 and m4 by springs. Interaction between bedrocks and units are represented by shear force Q23. Load F(t) is applied on m1. Considering dynamic loads only, equations of motion for the four lumped masses are listed in Equation (5).
K12 refers to the compression stiffness between m1 and m2; K2z refers to the compression stiffness between m2 and the bottom boundary; K34 refers to the compression stiffness between m3 and m4; K3z refers to the compression stiffness between m3 and the bottom boundary. According to K = EA/l, then the compression stiffness of vertical vibration model is obtained as K12 = K2z = K34 = K3z = 2El/h. Let Kz = El/h, then K12 = K2z = K34 = K3z = 2Kz. In addition, shear force should be calculated as Q = K′GA(∂z/∂x) based on mechanics of materials. For this model, Q23 = K′Gh(z2 − z3)/l = Gz(z2 − z3). Let Gz = K′Gh/l, then Q23 = Gz(z2 − z3). K′ refers to the section shape coefficient and G refers to the shear modulus of bedrock. According to actual condition, the units and the bedrocks are always in contact. The relationship between z1 and z2 can be derived as z1 = 2z2, as well as z4 = 2z3. After simplification of Equation (5), Equation (6) is derived.
Then, the ratio is obtained as Equation (7).
The ratio is defined as the vibration transmission ratio of vertical vibration from z1 to z4, to describe the influence on m4 that is caused by the vibration of m1 in Z direction.
3.3. Rules of Vibration Transmission Ratios
Based on the vibration transmission models above, the transmission ratios of two units in horizontal vibration and vertical vibration are obtained, respectively, as shown in Equation (3) and Equation (6). In the equations, parameters included unit mass m, bedrock mass M, horizontal compression stiffness of bedrock Kx, vertical compression stiffness of bedrock Kz, shear stiffness Gz, and frequency of vibration source load ω. Vibration transmission ratios among units are determined by these parameters in the simplified model.
In order to quantitatively analyze the vibration transmission of horizontal and vertical vibration and study the influence of the vibration frequency on transmission ratio, the parameters are further simplified and calculated. According to previous research experience [25], the depth of the bedrock h is taken as unit length l, then Kx = Kz = E is derived. For the rectangular section, the section shape coefficient is 1.2, then Gz = 1.2G = 1.2E/[2(1 + μ)]. After the simplification, Equation (4) and Equation (7) are simplified as two expressions of elastic modulus E, Poisson ratio μ, mass m, and M, and frequency ω. As shown in Equations (8) and (9).
For material of bedrock, the Poisson ratio μ is mostly between 0.23–0.27; and, the elastic modulus changes in the range of 20–30 GPa. The masses of unit and bedrock depend on the size of the powerhouse unit and are calculated to be on the order of 106 to 107 kg for large hydroelectric unit. According to the previous research and load characteristics of the powerhouse, low frequency tail fluctuation and rotation of hydraulic generator are the main vibration sources of powerhouse structural vibration. Their frequencies are within 0–5 Hz, especially in the case of severe vibration. Substituting above data into Equations (8) and (9), it can be found that both (m + M)ω2 and (2m + M)ω2 are 1 to 2 orders of magnitude smaller than 3Kx and (2Kz + Gz) for low frequency loads. Consequently, the transmission ratio of horizontal vibration in Equation (8) can be approximated, as Equation (10).
The transmission ratio of vertical vibration in Equation (9) can be approximated as Equation (11) (μ = 0.25).
When compared with field tests, vibration energy of all six units comes from unit #1, as shown in Figure 17. Assuming the same vibration transmission ratio between adjacent units, all the ratios between adjacent units are q. It is calculated that qx = 0.25 for horizontal vibration, and qz = 0.16 for vertical vibration. It can be conclude that, for the vibration transmission among units, the vibration transmission ratio of lateral-river vibration is significantly larger than that of longitude-river vibration and vertical vibration. This is in coincidence with the results obtained from the field tests in Figure 10.
In the theoretical analysis, it is found that the influence of frequency of vibration source ω is negligible as compared with other parameters. This explains why the vibration transmission ratios of the vibration caused by low frequency tail fluctuation and rotation of hydraulic generator in the field tests are basically equal.
4. Numerical Simulation
4.1. Establishment of Finite Element Model
The field structure vibration tests are limited by the number and location of sensors, the tests data is rare. In order to further demonstrate the vibration transmission among units, finite element simulations are conducted by commercial software ABAQUS.
A model of single unit is established based on the specific dimensions of the powerhouse structure, as shown in Figure 18. Structures in powerhouse, such as generator pier, floors, beams, and pillars are simulated exactly. The mechanical part is simulated as lumped masses. The bedrock is simulated based on previous research experience and trial calculation. The depth of bedrock is equal to unit length [25]. Material properties are assigned actual values. The units are arranged in an array on the bedrock, and the adjacent units are separated by split seams of 0.2 m width. Normal constraints are applied to the bedrock as boundary conditions to simulate the interactions of rocks.
According to the previous study, the numerical studies are focused on the two parts: (1) The transmission rules among units of vibration in three directions; and, (2) The transmission rules among units caused by low frequency tail fluctuation and rotation of hydraulic generator, respectively.
4.2. Results of Numerical Simulation
4.2.1. Transmission Rules among Units of Vibration in Three Directions
A harmonic body force is applied to unit #1 of the model as vibration source. According to the characteristics of the vibration signal of field tests, the expression of body force is constructed as Equation (12).
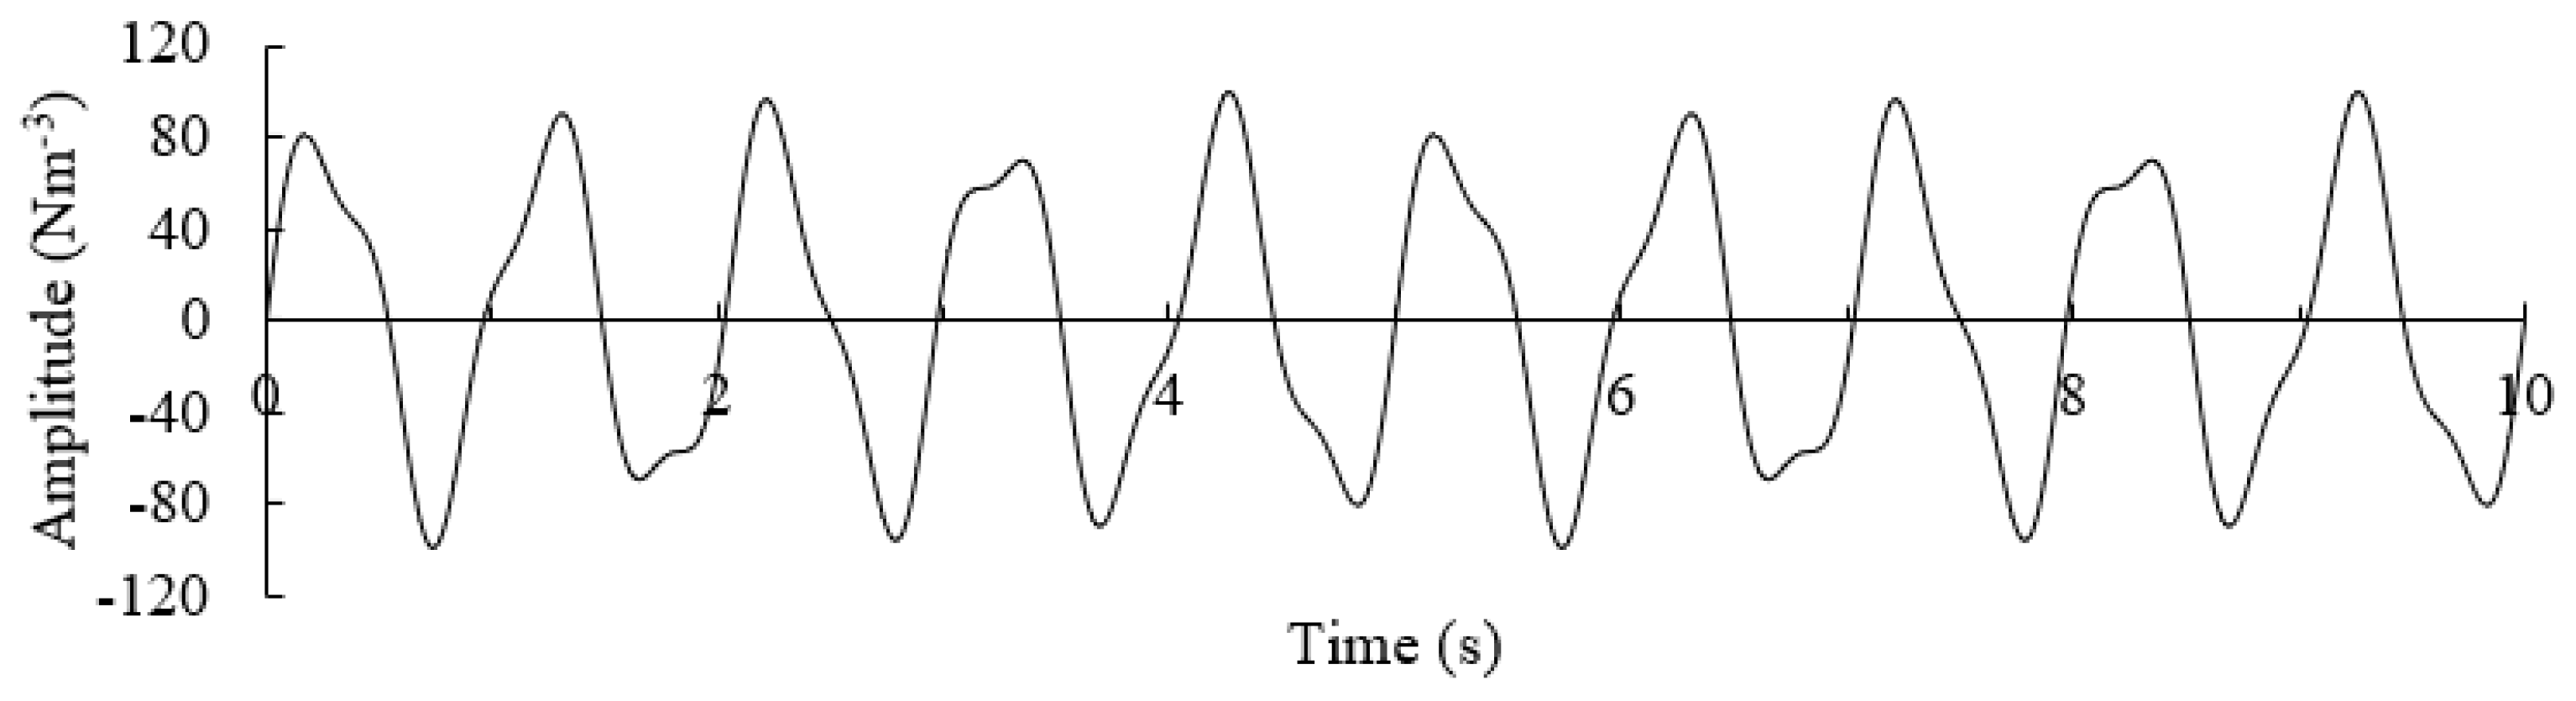
A refers to amplitude of load. ω1 refers to the frequency of low frequency tail fluctuation with a value between 0.167 and 0.6 times rotational frequency, according to the previous research results and experience [9,31]; it is set as 1 Hz based on the frequency spectrum analysis of field tests in this paper. ω2 refers to the rotational frequency, set as 2.4 Hz. a and b represent the proportion of two vibration sources, and set as 0.8 and 0.2, respectively, according to the analysis of field tests. Time history of load is shown in Figure 19.
Load shown as Figure 19 is applied to unit #1 in three directions, respectively. Vibration displacements of the nodes corresponding to the location of sensors are extracted after analysis, RMS values are calculated. For intuitive expression, the RMS of vibration displacements of unit #1 is taken as a reference value to normalize the vibration displacements of different units. These ratios are considered as the vibration transmission ratios, as shown in the Table 2.
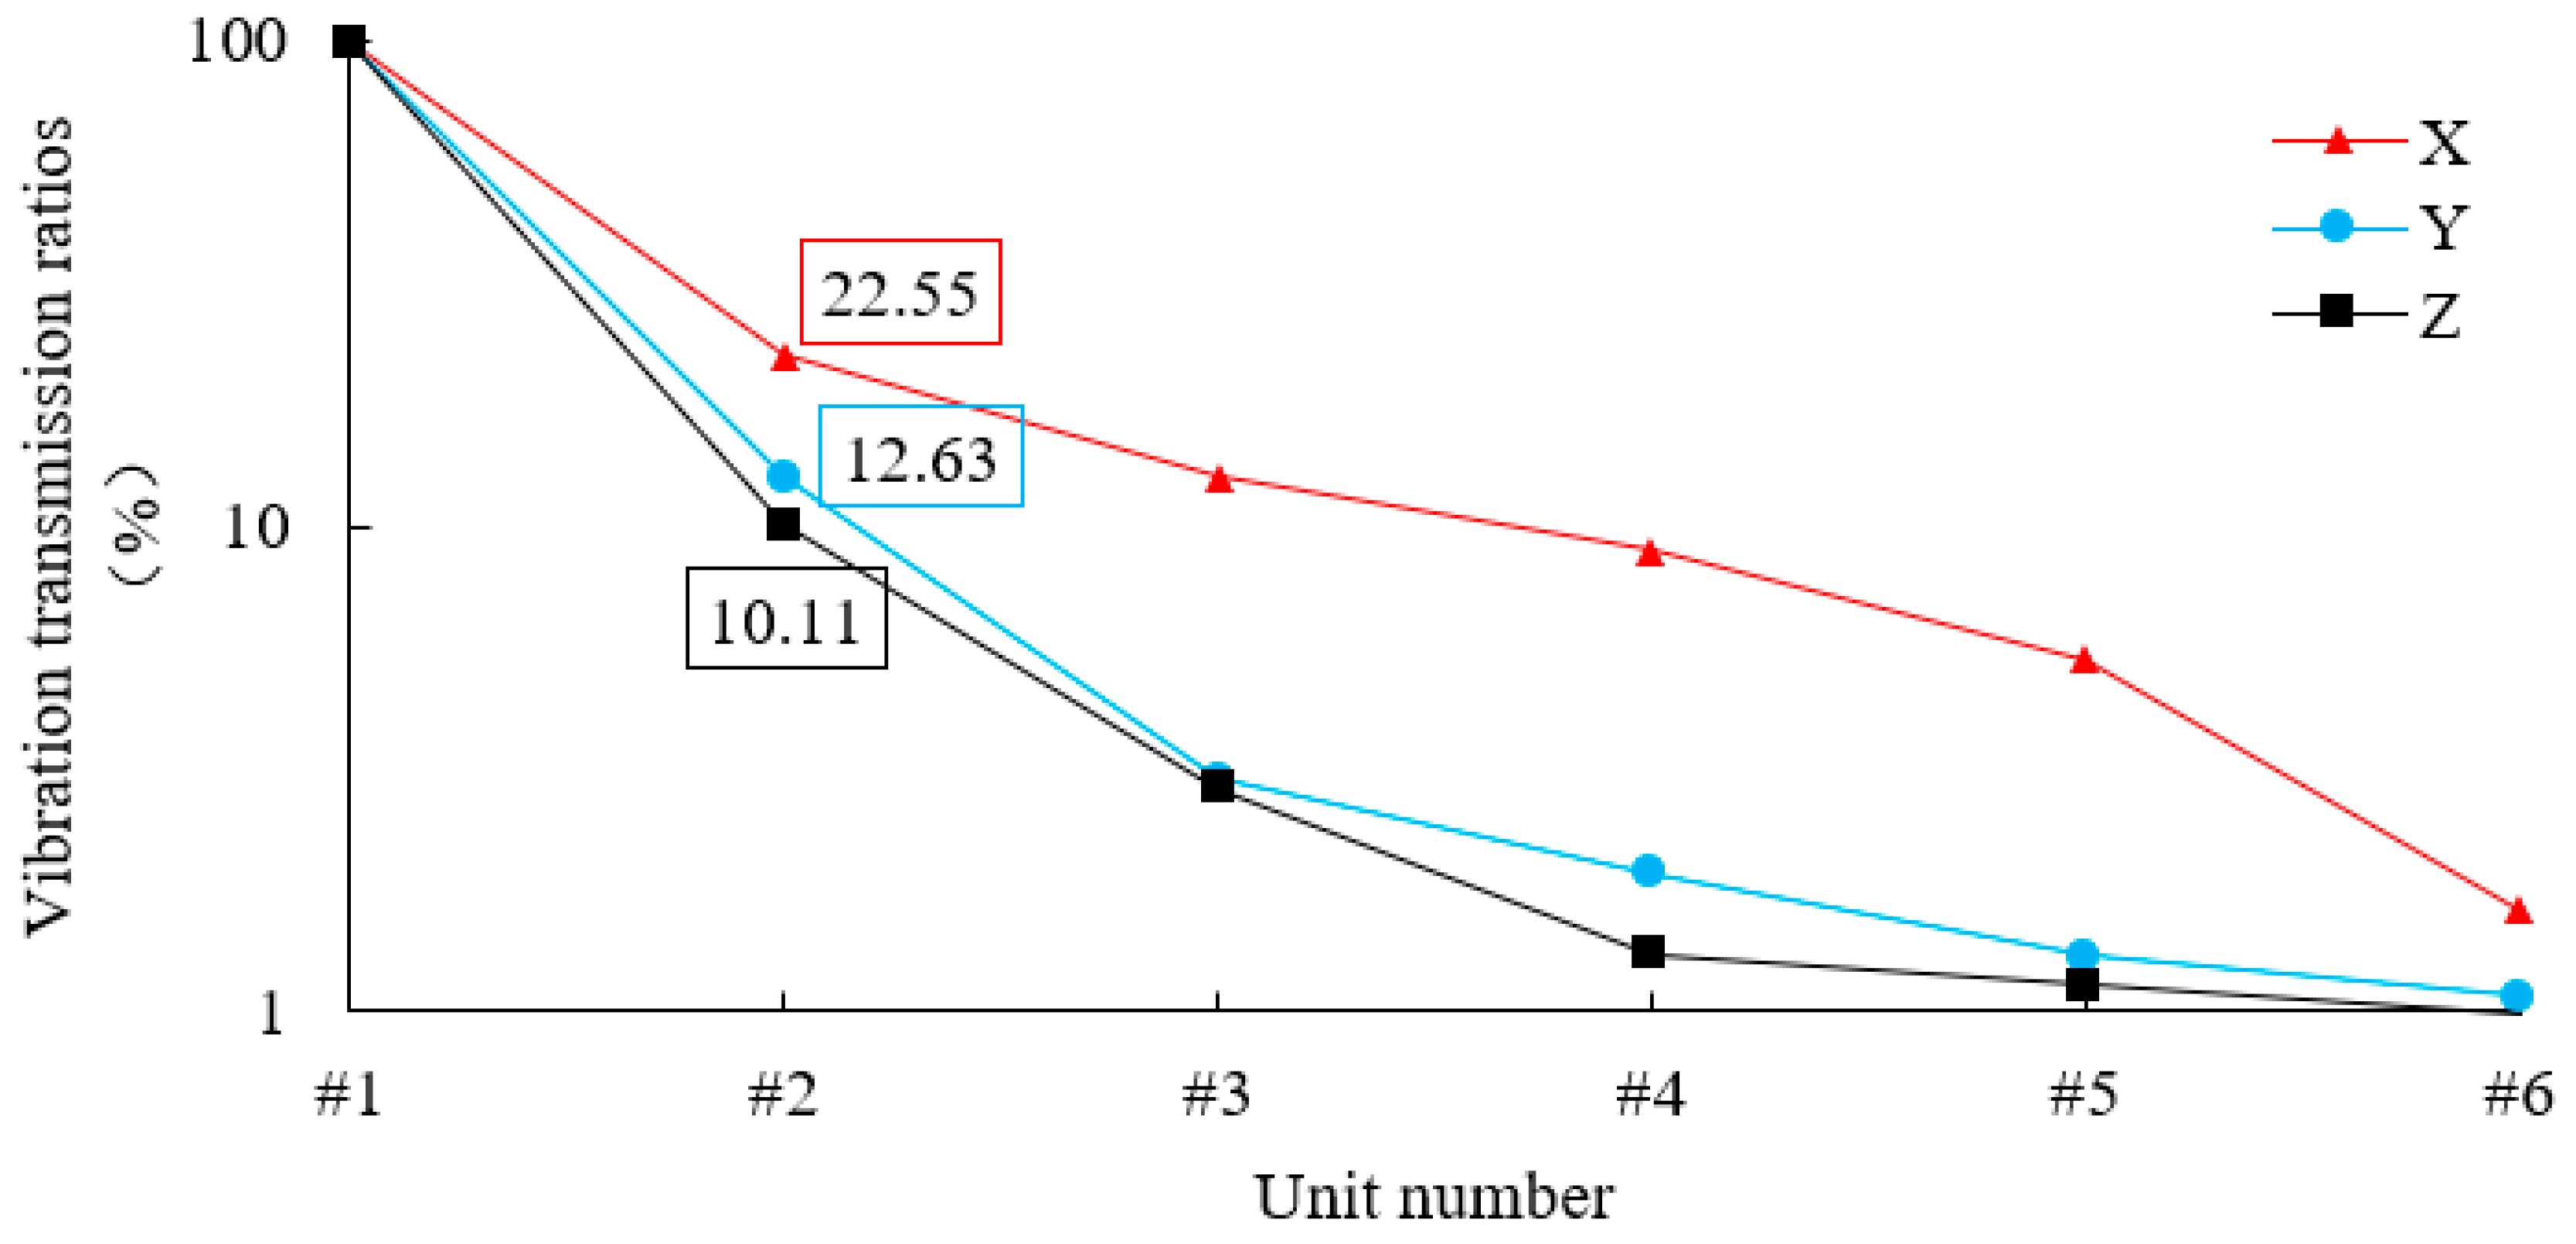
It can be seen in Table 2 that the transmission ratios of vibration in X direction are the most significant. The RMS of adjacent unit #2 in X direction reaches 22.55% of that of unit #1. While the RMS of unit #2 in Y and Z directions are only 12.63% and 10.11% of that of unit #1. The comparison is depicted in Figure 20.
4.2.2. Transmission Rules under Different Vibration Sources
According to the results of field test, two harmonic body forces in the X direction with different frequencies are applied to unit #1 in the model as vibration sources, respectively. The force frequencies ω1 and ω2 are set as 1 Hz and 2.4 Hz, which are the typical frequency of low frequency tail fluctuation and rotation of hydraulic generator. After calculation, the vibration displacements of the nodes corresponding to the location of sensors are extracted. The RMS of vibration displacements of unit #1 are taken as reference values. Results of normalized displacements are shown in Table 3.
It can be obtained obviously that the vibration transmission ratios under loads with two low frequencies among units are basically identical. Therefore, the vibration transmission ratios of the vibration caused by low frequency tail fluctuation and rotation of hydraulic generator, respectively, are basically equal. The mechanism that is obtained from simplified model is verified.
5. Discussion
As is well known, the vibration of the unit will influence other adjacent units in the powerhouse. Some researchers have studied the degree of influence, and draw some conclusions [24,25]. But, there are very few studies that are more in-depth. Two influencing factors were raised in this paper: (1) Vibration direction; and, (2) Vibration frequency. The related studies were conducted, which have never been published.
Based on the first factor, all the transmission ratios between two adjacent units derived from simplified model, field test and numerical simulation are shown and compared in Table 4. The results from the numerical simulation basically match with the field test results, indicating that the numerical simulation is capable of simulating this problem.
It is obvious that the transmission ratio of vibration in X direction is larger than that of vibration in Y and Z directions. All of the results derived from three methods proved this conclusion. The transmission ratios obtained from simplified model are slightly larger than those by field test and numerical simulation. This is mainly due to that the features such as damping and rock integrity are not taken into consideration in the simplified model.
As for the second factor, the formula of vibration transmission ratio derived from the simplified model directly explains that the effect of frequency is very small, especially for the load with low frequency. In the other hand, according to previous studies [17,18,24], the first order of the modal frequency of most powerhouse is 20–25 Hz. So, both the frequencies of low frequency tail fluctuation and rotation of hydraulic generator are far from the dangerous frequency. Formula for the power amplification factor is shown, as Equation (13).
The power amplification factors β are 1.002 and 1.009, respectively, which are basically equivalent. Therefore, the vibrations transmission ratios of the two main loads with low frequencies are basically equal, the difference can be ignored.
6. Conclusions
This paper studies the vibration transmission among units in underground powerhouse of a hydropower station through field tests, theoretical analysis, and finite element simulation.
Firstly, the field structural vibration tests in the underground powerhouse of a large-scale hydropower station were designed and conducted, and two preliminary conclusions were raised.
Secondly, based on structural dynamics, the simplified mechanical vibration models were established for the vibration transmission problem among units. The vibration transmission mechanism is elaborated to explain and prove the preliminary conclusions from the theoretical perspective. The previous conclusions can be derived and explained in the model, indicating that the model and assumptions are reasonable.
At last, a complementary FE model for the tested underground powerhouse is established to replicate the tested underground powerhouse. The numerical simulation results verify the previous results.
Through the above work, the following two conclusions of the vibration transmission among units are obtained.
- (a)
- Vibration transmission ratio of lateral-river vibration is significantly larger than those of longitude-river vibration and vertical vibration. The transmission ratio between adjacent units of lateral-river vibration is about 15–25%, while those of longitude-river vibration and vertical vibration are about 10–15%.
- (b)
- Low frequency tail fluctuation and the rotation of hydraulic generator are the main vibration sources of powerhouse structural vibration. Vibration transmission ratios of the vibration caused by the two sources are basically equal.
In general, the vibration transmission among units is widespread exists in underground powerhouse of the hydropower station. It is difficult to completely limit the transmission. However, the research results put forward higher requirements for the monitoring of the structural safety of powerhouse. More attention should be paid to the mutual influence of vibration between units while vibration monitoring. This study has guiding significance for the safe operation of underground powerhouse.
Author Contributions
J.L. and H.W. (Hongzhen Wang) put forward research ideas; H.W. (Haijun Wang) and H.W. (Hongzhen Wang) designed and performed the field tests; H.W. (Hongzhen Wang) built and wrote the majority of the manuscript text; all authors reviewed the manuscript.
Funding
This research was funded by the project of National Key Research and Development Program of China (Grant No. 2016YFC0401905).
Acknowledgments
This work was supported by the project of National Key Research and Development Program of China (Grant No. 2016YFC0401905). All workers from the State Key Laboratory of Hydraulic Engineering Simulation and Safety of Tianjin University are acknowledged. The authors are also grateful for the assistance of the anonymous reviewers.
Conflicts of Interest
The authors declare no conflict of interest.
Abbreviations
| A | Amplitude of load |
| E | Elastic modulus of bedrock |
| F(t) | Load applied on the unit |
| G | Shear modulus of bedrock |
| h | Depth of bedrock considered |
| K′ | Section shape coefficient |
| K2x | Compression stiffness between m2 and left boundary |
| K3x | Compression stiffness between m3 and right boundary |
| K23 | Compression stiffness between m2 and m3 |
| K12 | Compression stiffness between m1 and m2 |
| K2z | Compression stiffness between m2 and the bottom boundary |
| K34 | Compression stiffness between m3 and m4 |
| K3z | Compression stiffness between m3 and the bottom boundary |
| l | Length of a single unit |
| m | Mass of the unit |
| m1 | Lumped Mass of the unit #1 |
| m2 | Lumped Mass of the bedrock under the unit #1 |
| m3 | Lumped Mass of the bedrock under the unit #2 |
| m4 | Lumped Mass of the unit #2 |
| M | Mass of the bedrock |
| Q12 | Shear force between m1 and m2 |
| Q34 | Shear force between m3 and m4 |
| x1, x2, x3, x4 | Vibration displacement of m1, m2, m3, m4 in X direction |
| , , , | Vibration acceleration of m1, m2, m3, m4 in X direction |
| z1, z2, z3, z4 | Vibration displacement of m1, m2, m3, m4 in Z direction |
| , | Vibration acceleration of m1, m2, m3, m4 in Z direction |
| β | Power amplification factor |
| θ | Frequency of the modal frequency |
| μ | Poisson ratio |
| ω | Frequency of vibration source load |
| FE | Finite element |
| MRA | Multi-Resolution Analysis |
| PSD | Power spectral density |
| RMS | Root mean square |
References
- Xu, X.P.; Han, Q.K.; Chu, F.L. Review of electromagnetic vibration in electrical machines. Energies 2018, 11, 1779. [Google Scholar] [CrossRef]
- Mollasalehi, E.; Wood, D.; Sun, Q. Indicative fault diagnosis of wind turbine generator bearings using tower sound and vibration. Energies 2017, 10, 1853. [Google Scholar] [CrossRef]
- Cachafeiroa, H.; Arevaloa, L.F.; Vinuesaa, R.; Goikoetxeab, J.; Barrigab, J. Impact of solar selective coating ageing on energy cost. Energy Procedia 2015, 69, 299–309. [Google Scholar] [CrossRef]
- Liu, X.; Luo, Y.Y.; Wang, Z.W. A review on fatigue damage mechanism in hydro turbines. Renew. Sustain. Energy Rev. 2016, 54, 1–14. [Google Scholar] [CrossRef]
- Shen, K.; Zhang, Z.Q.; Liang, Z. Hydraulic Vibration Calculation of Yantan Hydropower House. Water Resour. Power 2003, 1, 73–75. [Google Scholar] [CrossRef]
- Kurzin, V.B.; Seleznev, V.S. Mechanism of emergence of intense vibrations of turbines on the Sayano-Shushensk hydro power plant. J. Appl. Mech. Tech. Phys. 2010, 4, 590–597. [Google Scholar] [CrossRef]
- Yang, J.D.; Zhao, K.; Li, L.; Wu, P. Analysis on the causes of units 7 and 9 accidents at Sayano-Shushenskaya hydropower station. J. Hydroelectr. Eng. 2011, 4, 226–234. (In Chinese) [Google Scholar]
- Dorji, U.; Ghomashchi, R. Hydro turbine failure mechanisms: An overview. Eng. Fail. Anal. 2014, 44, 136–147. [Google Scholar] [CrossRef]
- Mohanta, R.K.; Chelliah, T.R.; Allamsetty, S.; Akula, A.; Ghosh, R. Sources of vibration and their treatment in hydro power stations—A review. Eng. Sci. Technol. Int. J. 2017, 20, 637–648. [Google Scholar] [CrossRef]
- Zhi, B.P.; Ma, Z.Y. Disturbance analysis of hydropower station vertical vibration dynamic characteristics: The effect of dual disturbances. Struct. Eng. Mech. 2015, 2, 297–309. [Google Scholar] [CrossRef]
- Ma, Z.Y.; Dong, Y.X. Dynamic response of hydroelectric set by hydraulic lateral force on turbine runner. J. Hydroelectr. Eng. 1990, 2, 31–39. (In Chinese) [Google Scholar]
- Song, Z.Q. Research on Coupling Vibration Characteristics of Generator Set and Hydropower House. Ph.D. Thesis, Dalian University of Technology, Dalian, China, 2009. (In Chinese). [Google Scholar]
- Zhi, B.P. Study of Vibration Transmission Path about Hydropower Station Units and Powerhouse with Complex Disturbance. Ph.D. Thesis, Dalian University of Technology, Dalian, China, 2014. (In Chinese). [Google Scholar]
- Zhou, J.Z.; Peng, X.L.; Li, R.H.; Xu, Y.H.; Liu, H.; Chen, D.Y. Experimental and finite element analysis to investigate the vibration of Oblique-Stud stator frame in a large hydropower generator unit. Energies 2017, 10, 2175. [Google Scholar] [CrossRef]
- Zhang, C.H.; Zhang, Y.L. Nonlinear dynamic analysis of the Three Gorge Project powerhouse excited by pressure fluctuation. J. Zhejiang Univ. Sci. A 2009, 9, 1231–1240. [Google Scholar] [CrossRef]
- Wang, X.; Li, T.C.; Zhao, L.H. Vibration analysis of large bulb tubular pump house under pressure pulsations. Water Sci. Eng. 2009, 1, 86–94. [Google Scholar] [CrossRef]
- Lian, J.J.; Qin, L.; He, C.L. Structure vibration of hydropower house based on prototype observation. J. Tianjin Univ. 2006, 2, 176–180. (In Chinese) [Google Scholar]
- Lian, J.J.; Qin, L.; Wang, R.X.; Hu, Z.G.; Wang, H.J. Study on the dynamic characteristics of the power house structure of two-row placed units. J. Hydroelectr. Eng. 2004, 2, 55–60. (In Chinese) [Google Scholar]
- Lian, J.J.; Zhang, Y.; Liu, F.; Yu, X.H. Vibration source characteristics of a roof overflow hydropower station. J. Vib. Shock 2013, 18, 8–14. [Google Scholar] [CrossRef]
- He, L.J.; Lian, J.J.; Ma, B. Intelligent damage identification method for large structures based on strain modal parameters. J. Vib. Control 2014, 12, 1783–1795. [Google Scholar] [CrossRef]
- He, L.J. Study on Coupled Vibration Characteristics and Response Prediction of Underground Powerhouse. Ph.D. Thesis, Tianjin University, Tianjin, China, 2010. (In Chinese). [Google Scholar]
- Zhang, Y. Vibration Characteristics of the Overflow Powerhouse with Bulb Tubular Unit. Ph.D. Thesis, Tianjin University, Tianjin, China, 2012. (In Chinese). [Google Scholar]
- Mao, L.D.; Wang, H.J. Research on load feedback of structure vibration of underground house of hydropower station. J. Water Resour. Water Eng. 2014, 3, 79–82. [Google Scholar] [CrossRef]
- Wang, H.J.; Bai, B.; Li, K. Research on vibration propagation regular of adjacent unit-blocks for hydropower house. J. Water Resour. Water Eng. 2016, 1, 141–146. [Google Scholar] [CrossRef]
- Wei, Y.B.; Chen, J.; Ma, Z.Y. Vibrational travel and behavior of pumped storage power station underground powerhouse. J. Water Resour. Arch. Eng. 2017, 4, 101–106. [Google Scholar] [CrossRef]
- Ameen, M.S.A.; Ibrahim, Z.; Othman, F.; Al-Ansari, N.; Yaseen, Z.M. Minimizing the principle stresses of powerhoused Rock-Fill dams using control turbine running units: Application of Finite Element Method. Water-SUI 2018, 10, 1138. [Google Scholar] [CrossRef]
- Gupta, S.; Stanus, Y.; Lombaert, G.; Degrande, G. Influence of tunnel and soil parameters on vibrations from underground railways. J. Sound Vib. 2009, 327, 70–91. [Google Scholar] [CrossRef]
- Chen, M.; Lu, W.B.; Yi, C.P. Blasting vibration criterion for a rock-anchored beam in an underground powerhouse. Tunn. Undergr. Space Technol. 2007, 22, 69–79. [Google Scholar] [CrossRef]
- Xia, X.; Li, H.B.; Li, J.C.; Liu, B.; Yu, C. A case study on rock damage prediction and control method for underground tunnels subjected to adjacent excavation blasting. Tunn. Undergr. Space Technol. 2013, 35, 1–7. [Google Scholar] [CrossRef]
- Kuo, K.A.; Hunt, H.E.M.; Hussein, M.F.M. The effect of a twin tunnel on the propagation of ground-borne vibration from an underground railway. J. Sound Vib. 2011, 330, 6203–6222. [Google Scholar] [CrossRef]
- Dörfler, P.; Sick, M.; Coutu, A. Flow-Induced Pulsation and Vibration in Hydroelectric Machinery, 1st ed.; Springer: London, UK, 2013; pp. 31–60. ISBN 978-7-5684-0070-1. [Google Scholar]
- Samanta, A.; Vinuesa, R.; Lashgari, I.; Schlatter, P.; Brandt, L. Enhanced secondary motion of the turbulent flow through a porous square duct. J. Fluid Mech. 2015, 784, 681–693. [Google Scholar] [CrossRef]
- Vinuesa, R.; Bartrons, E.; Chiu, D.; Dressler, K.M.; Rüedi, J.D.; Suzuki, Y.; Nagib, H.M. New insight into flow development and two dimensionality of turbulent channel flows. Exp. Fluids 2017, 55, 1759. [Google Scholar] [CrossRef]
- Vinuesa, R.; Schlatter, P.; Nagib, H.M. Role of data uncertainties in identifying the logarithmic region of turbulent boundary layers. Exp. Fluids 2017, 55, 1751. [Google Scholar] [CrossRef]
- Wang, H.J. Research on Composite Structural Analysis and Dynamic Identification of Hydropower House. Ph.D. Thesis, Tianjin University, Tianjin, China, 2005. (In Chinese). [Google Scholar]
Figure 1.
Schematic diagram of technology route.
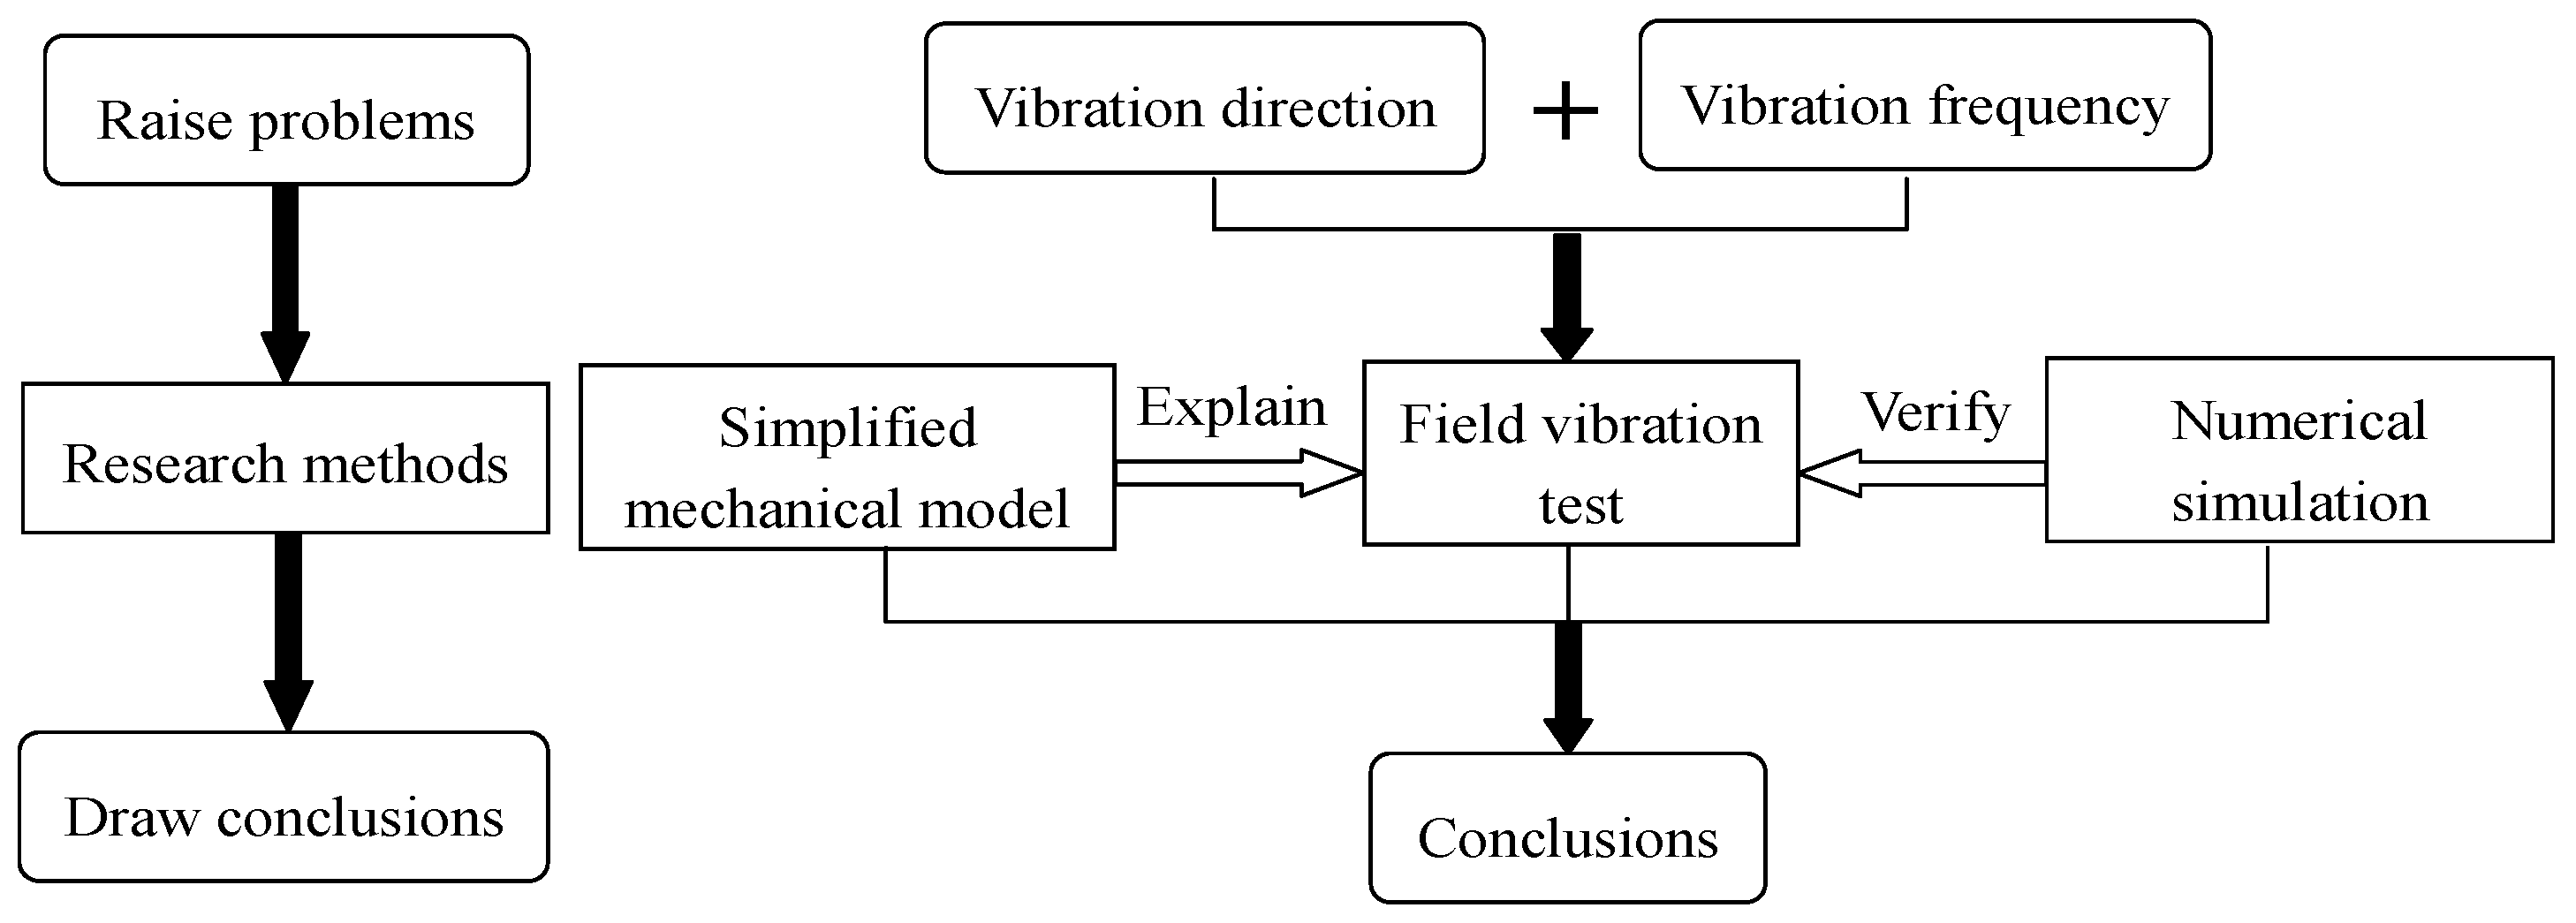
Figure 2.
Main powerhouse of the hydropower station in Yalong River.

Figure 3.
Data acquisition instrument: (a) Schematic; and, (b) Field tests photo.
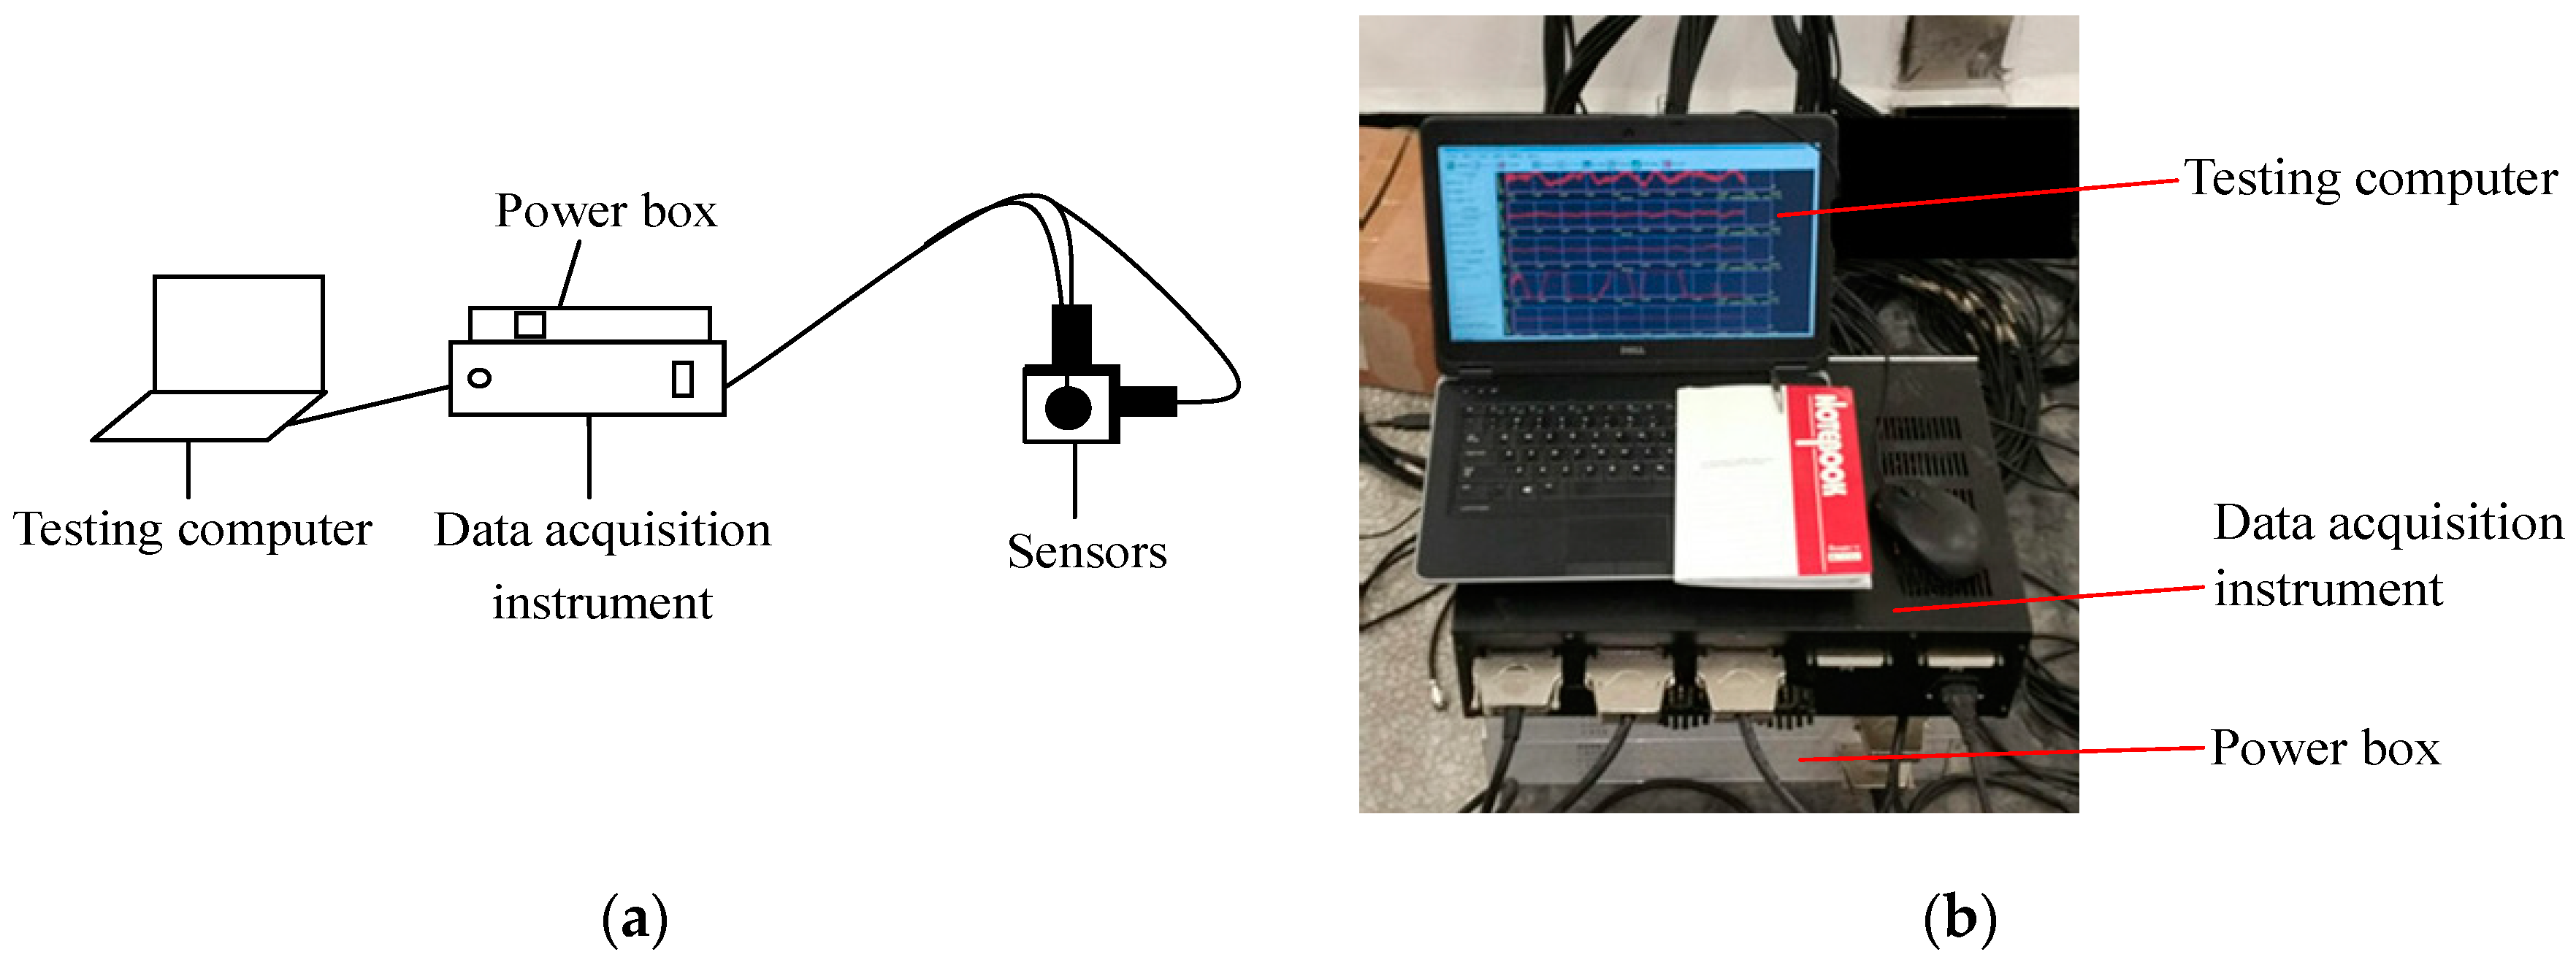
Figure 4.
Vibration displacement sensors used in field tests: (a) Close-up; and (b) Field installation photo.
Figure 4.
Vibration displacement sensors used in field tests: (a) Close-up; and (b) Field installation photo.

Figure 5.
Powerhouse structure and location of sensors.
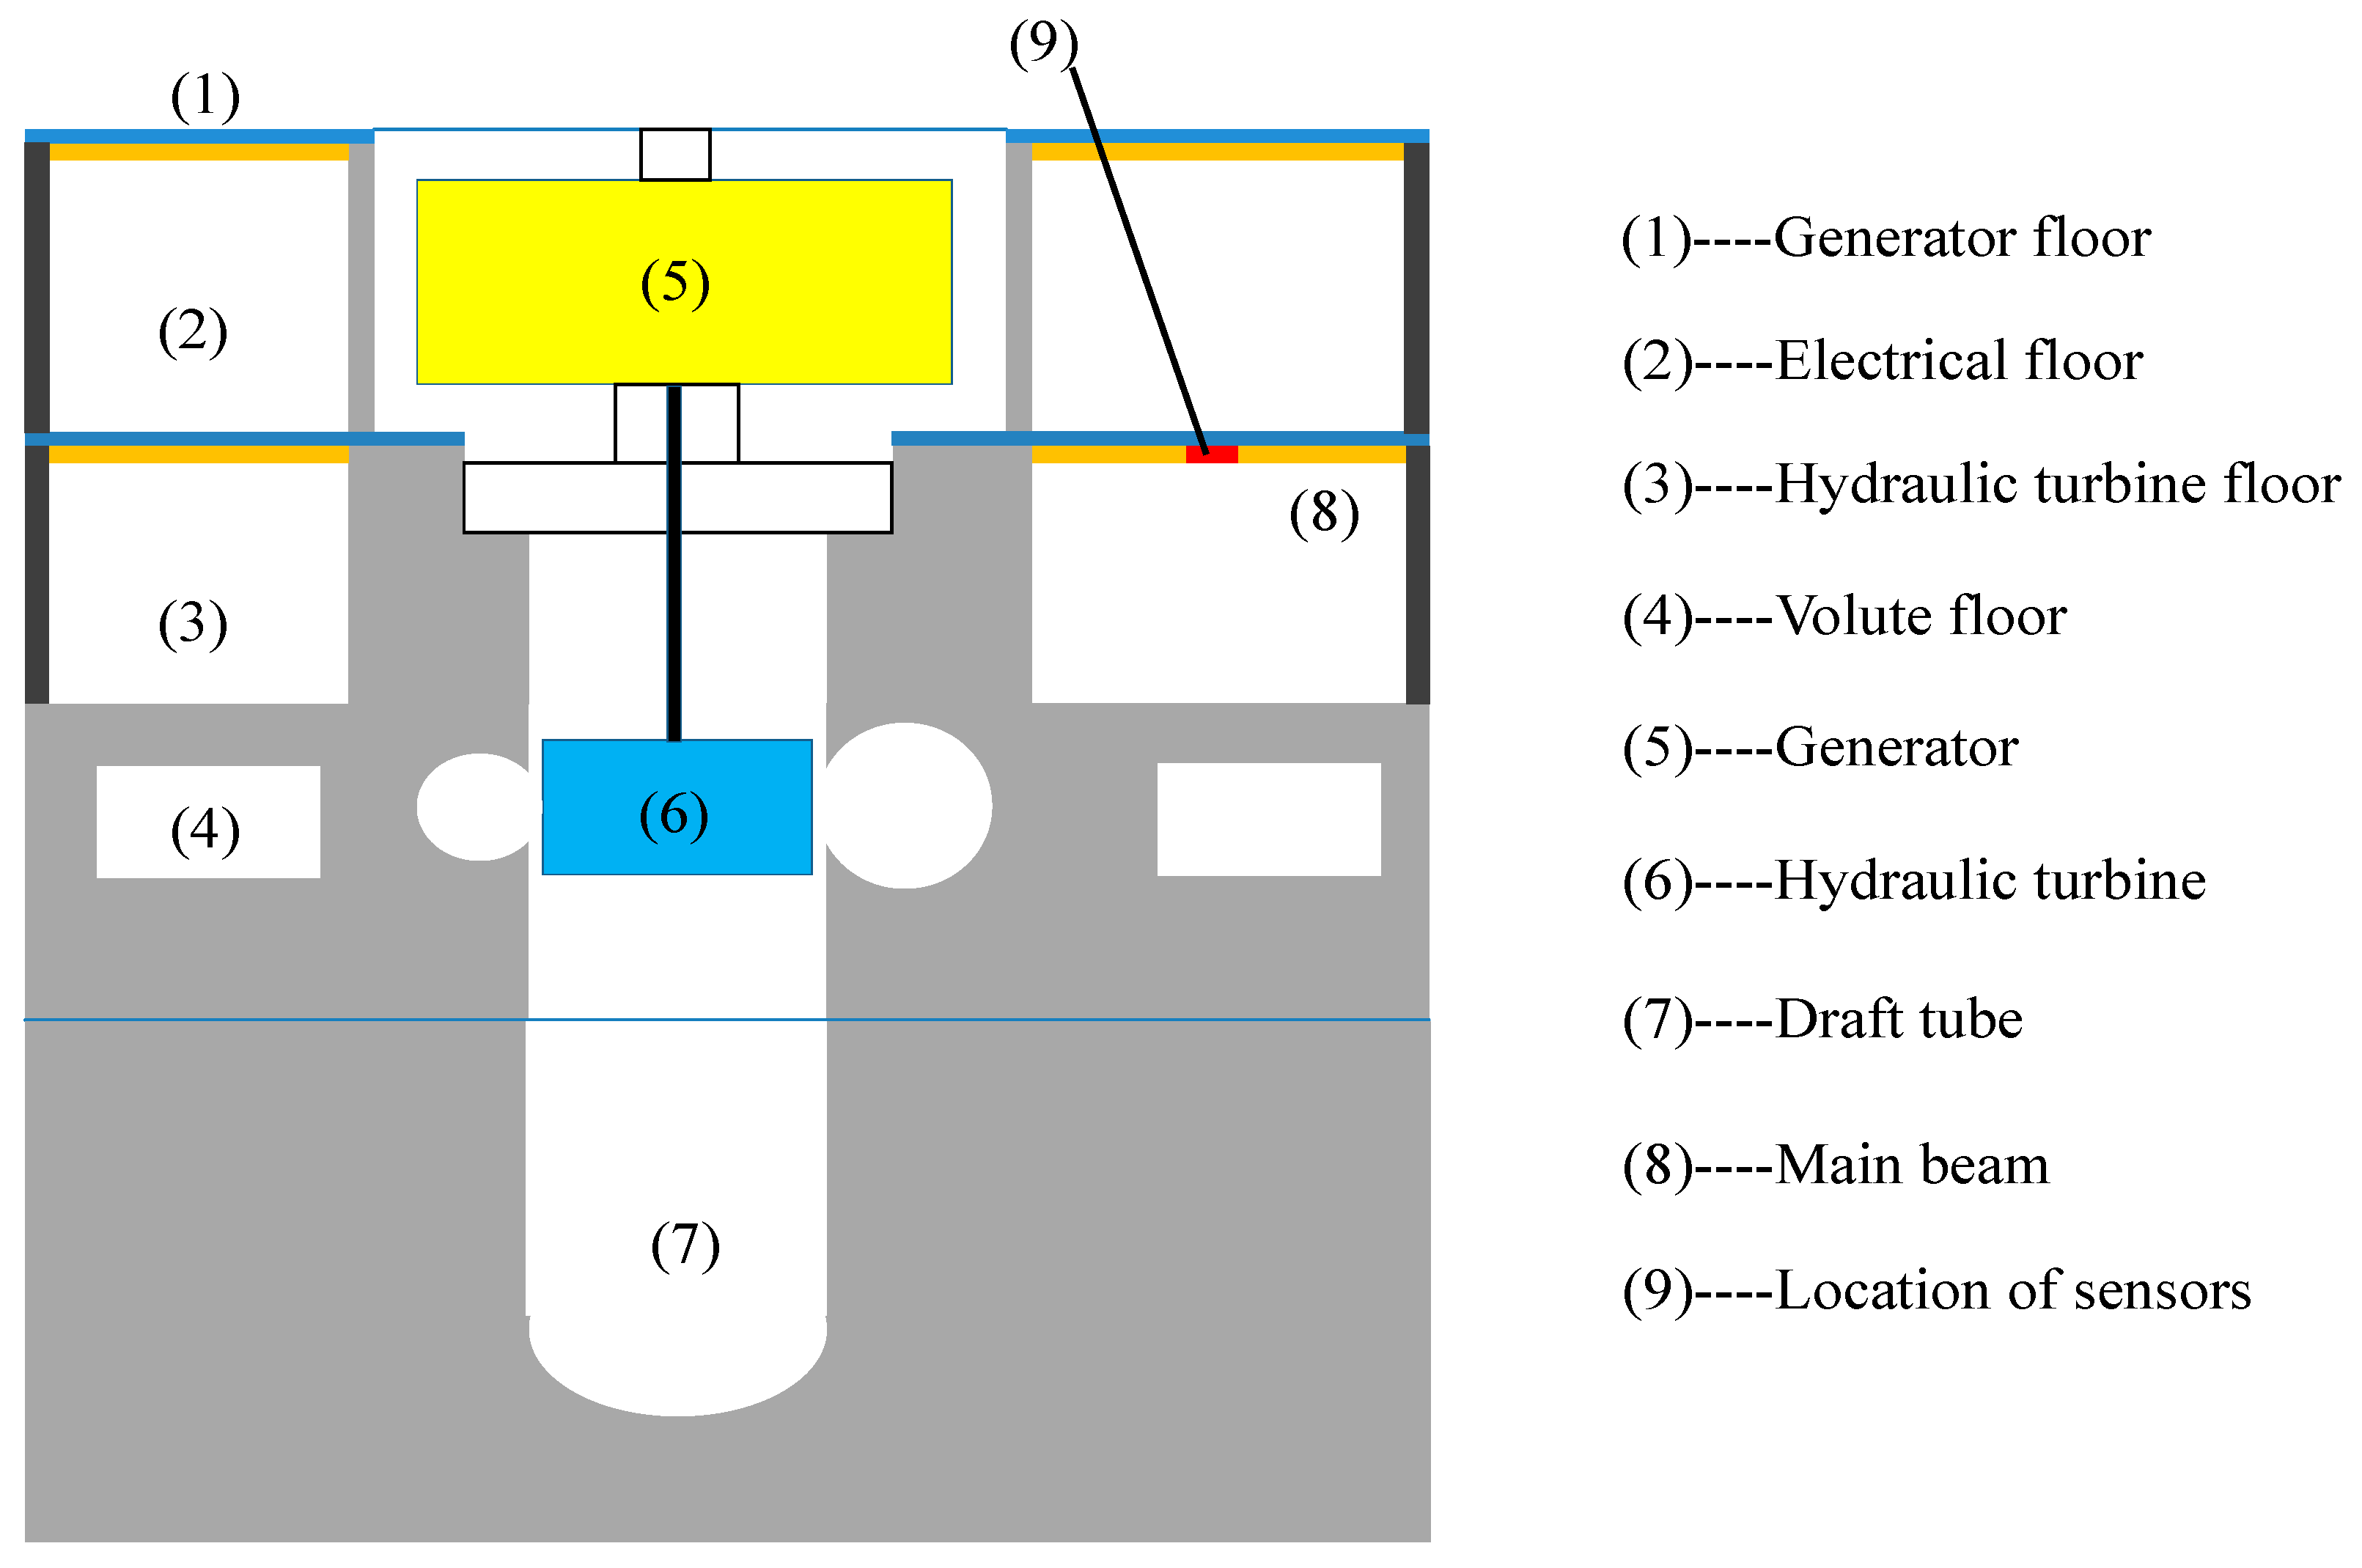
Figure 6.
Distribution of units in the main powerhouse and definition of vibration directions.

Figure 7.
Variation of root mean square (RMS) of displacement with unit #1, unit #2 and unit #3 in operation respectively: (a) Unit #1 in operation; (b) Unit #2 in operation; and, (c) Unit #3 in operation.
Figure 7.
Variation of root mean square (RMS) of displacement with unit #1, unit #2 and unit #3 in operation respectively: (a) Unit #1 in operation; (b) Unit #2 in operation; and, (c) Unit #3 in operation.

Figure 8.
Time histories of vibration displacements in three directions: (a) X direction; (b) Y direction; and, (c) Z direction.
Figure 8.
Time histories of vibration displacements in three directions: (a) X direction; (b) Y direction; and, (c) Z direction.

Figure 9.
RMS of vibration displacements with different units in three directions: (a) X direction; (b) Y direction; (c) Z direction.
Figure 9.
RMS of vibration displacements with different units in three directions: (a) X direction; (b) Y direction; (c) Z direction.

Figure 10.
Vibration effect ratios by each unit.
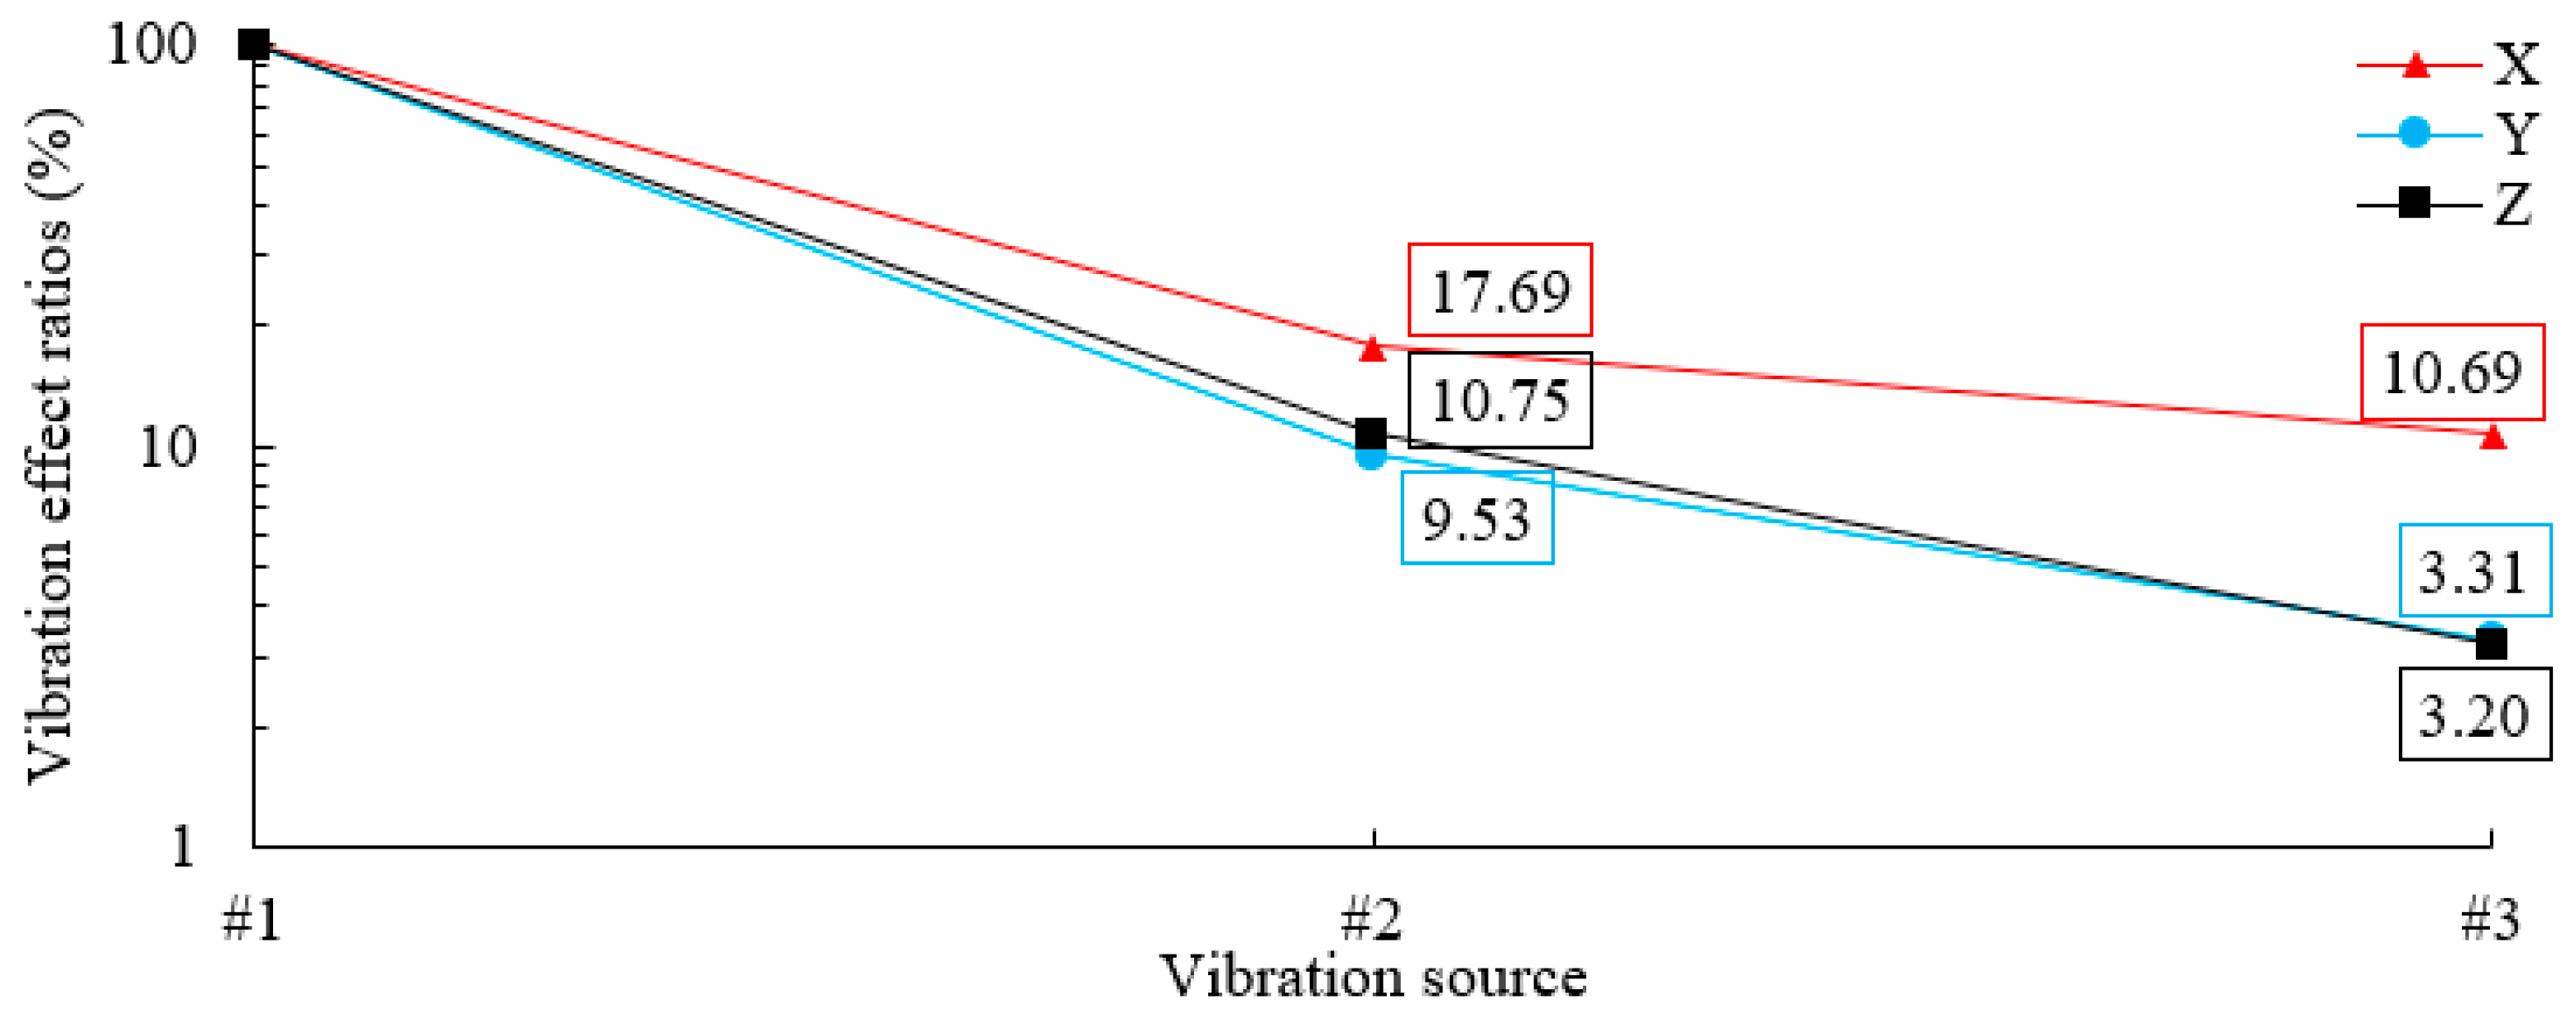
Figure 11.
Spectrums of vibration displacements in three directions: (a) X direction; (b) Y direction; and, (c) Z direction.
Figure 11.
Spectrums of vibration displacements in three directions: (a) X direction; (b) Y direction; and, (c) Z direction.

Figure 12.
Energy proportions of vibrations in three directions: (a) X direction; (b) Y direction; and (c) Z direction.
Figure 12.
Energy proportions of vibrations in three directions: (a) X direction; (b) Y direction; and (c) Z direction.
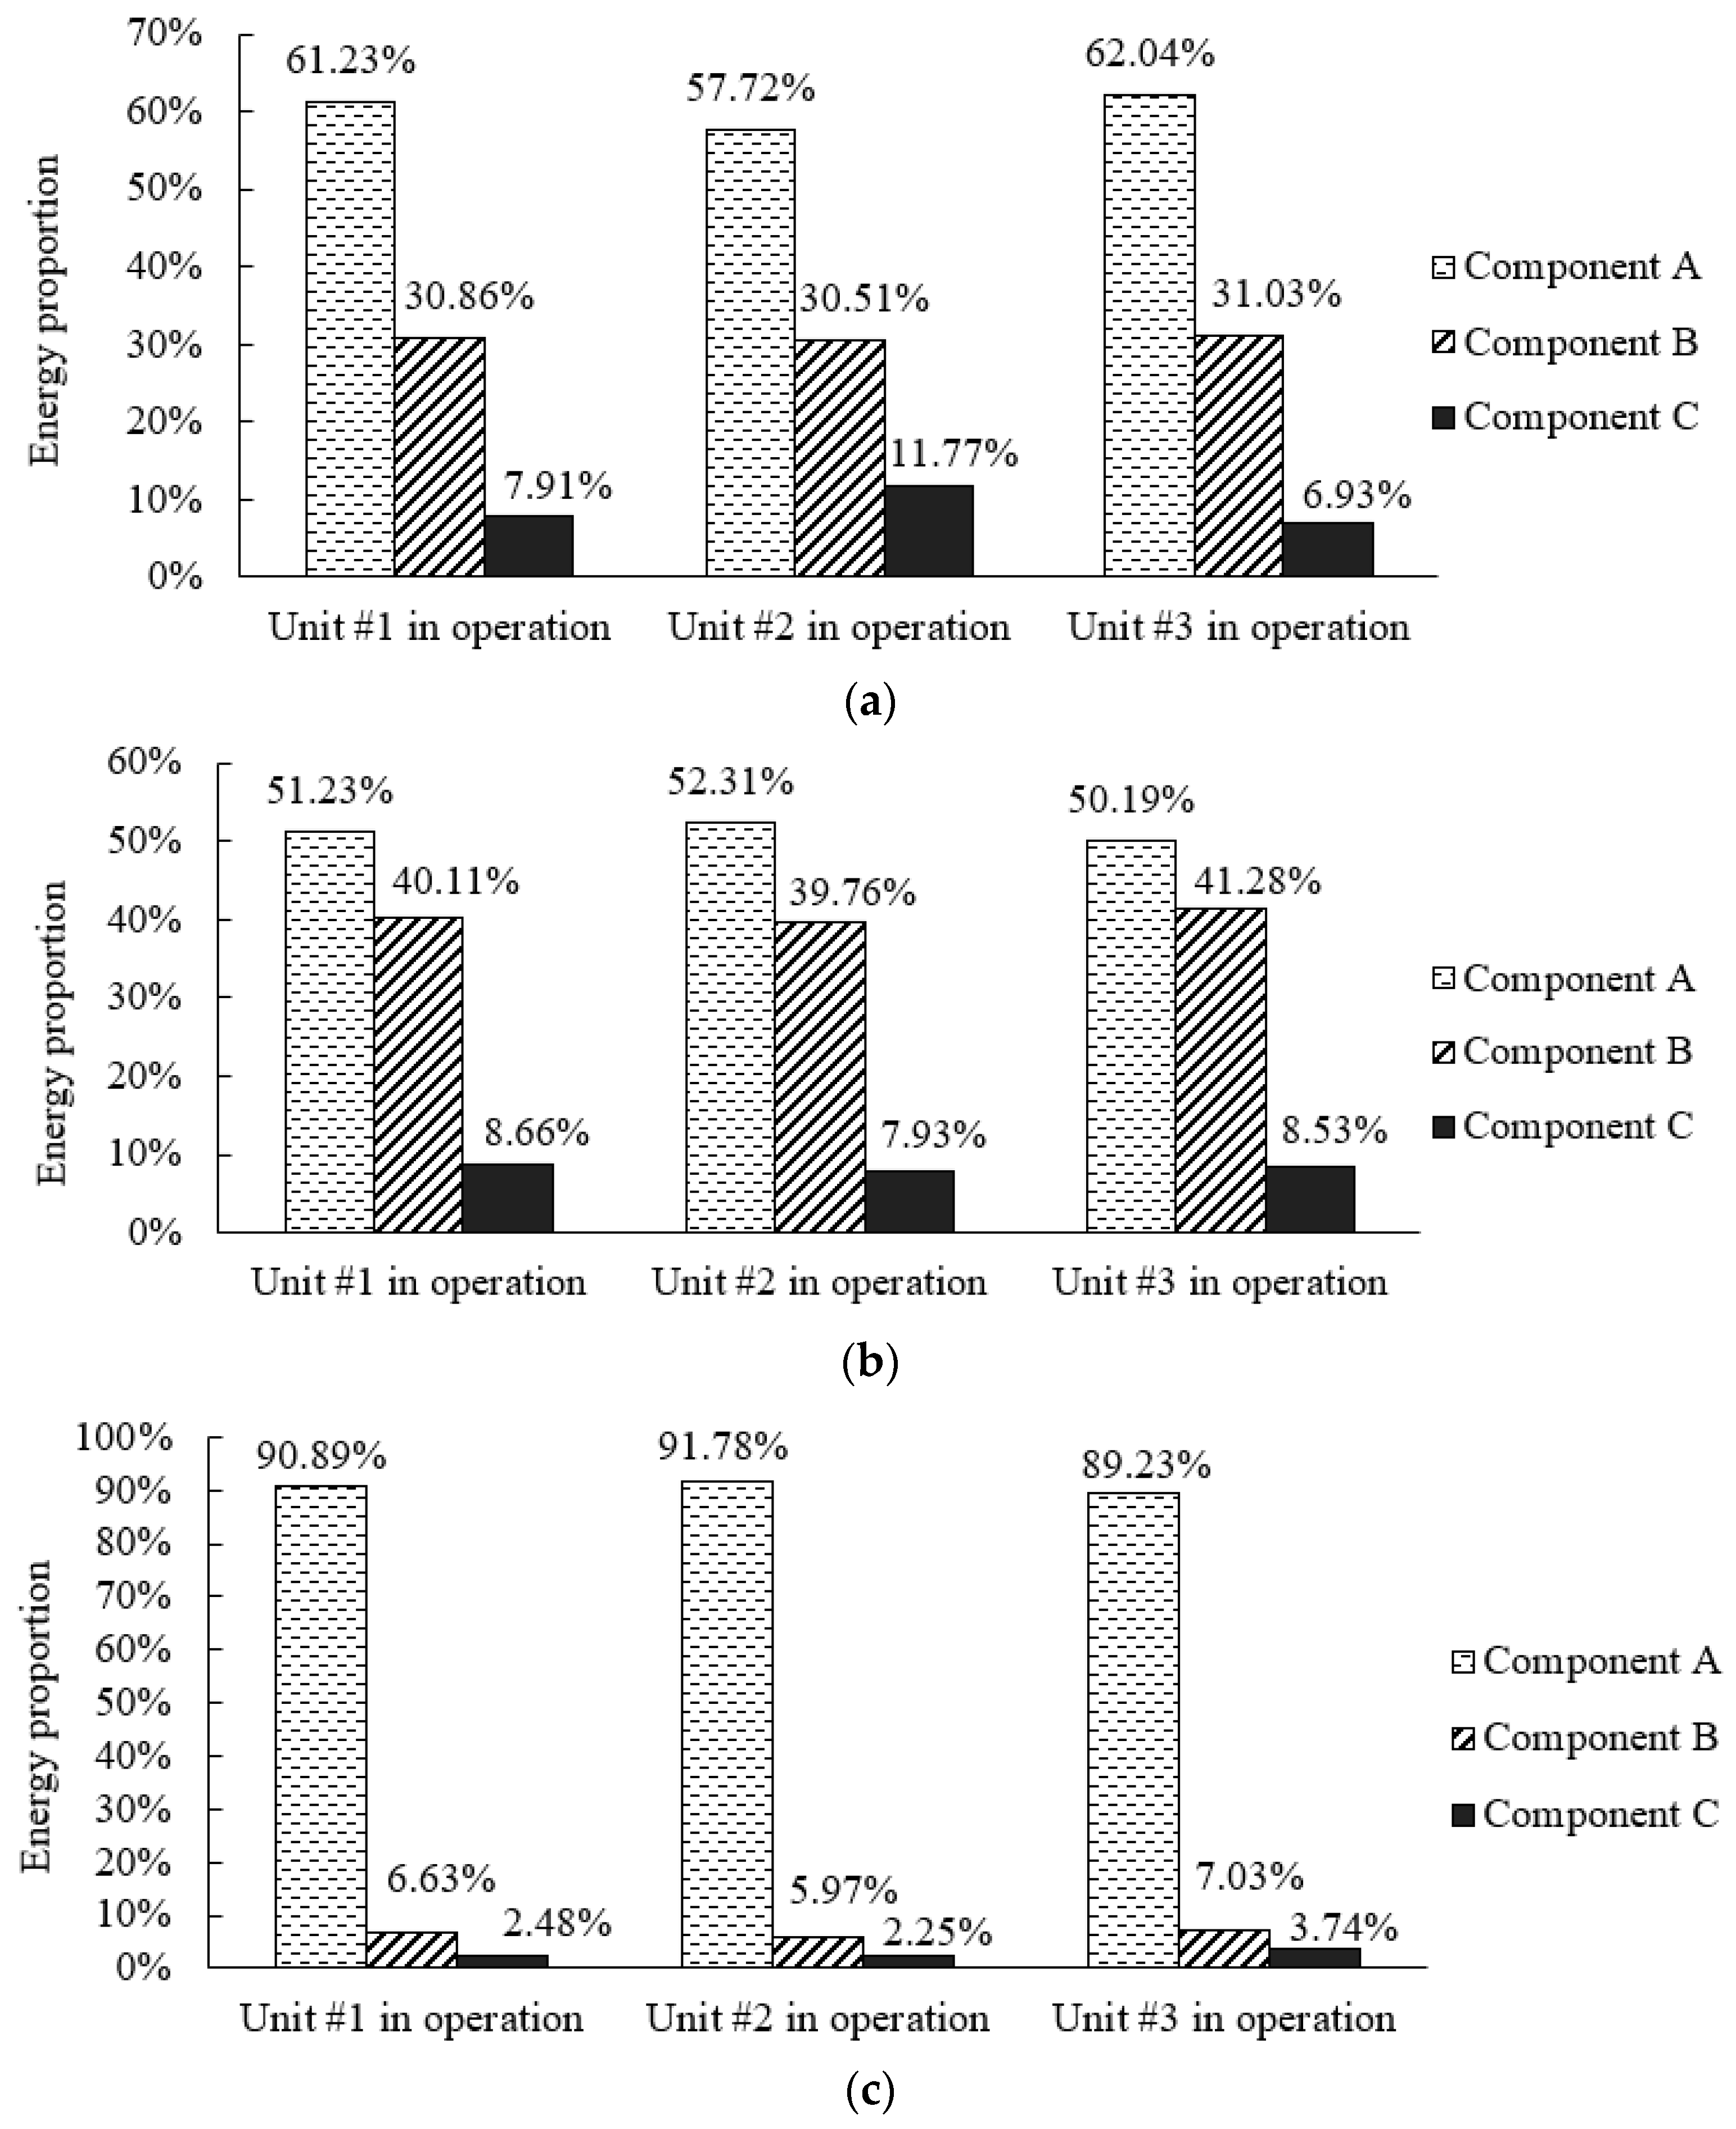
Figure 13.
Transmission of vibration in different directions.
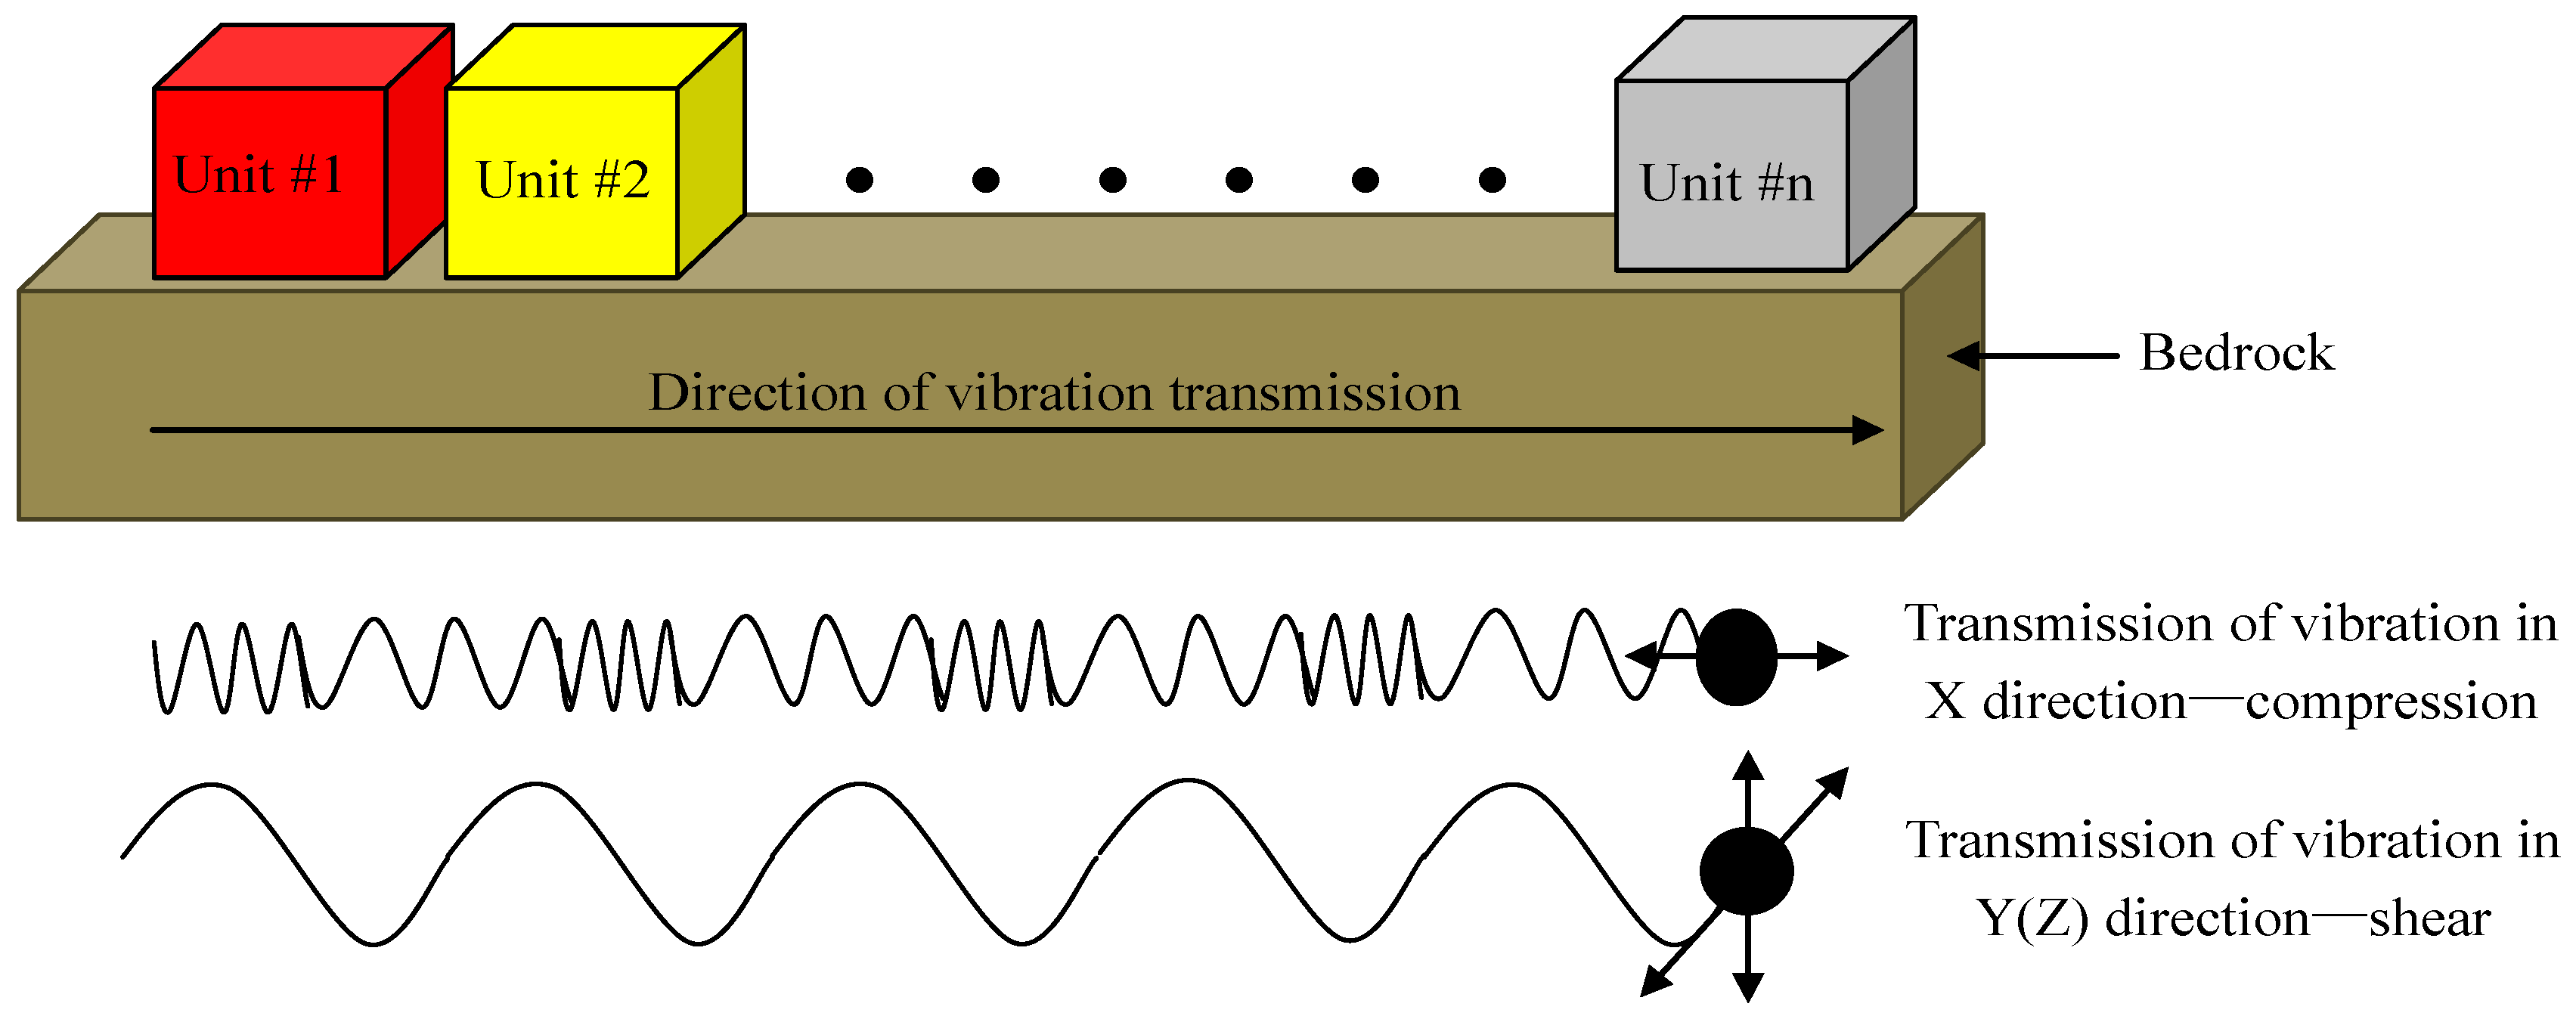
Figure 14.
Simplified model of vibration transmission.

Figure 15.
Horizontal vibration model.

Figure 16.
Vertical vibration model.
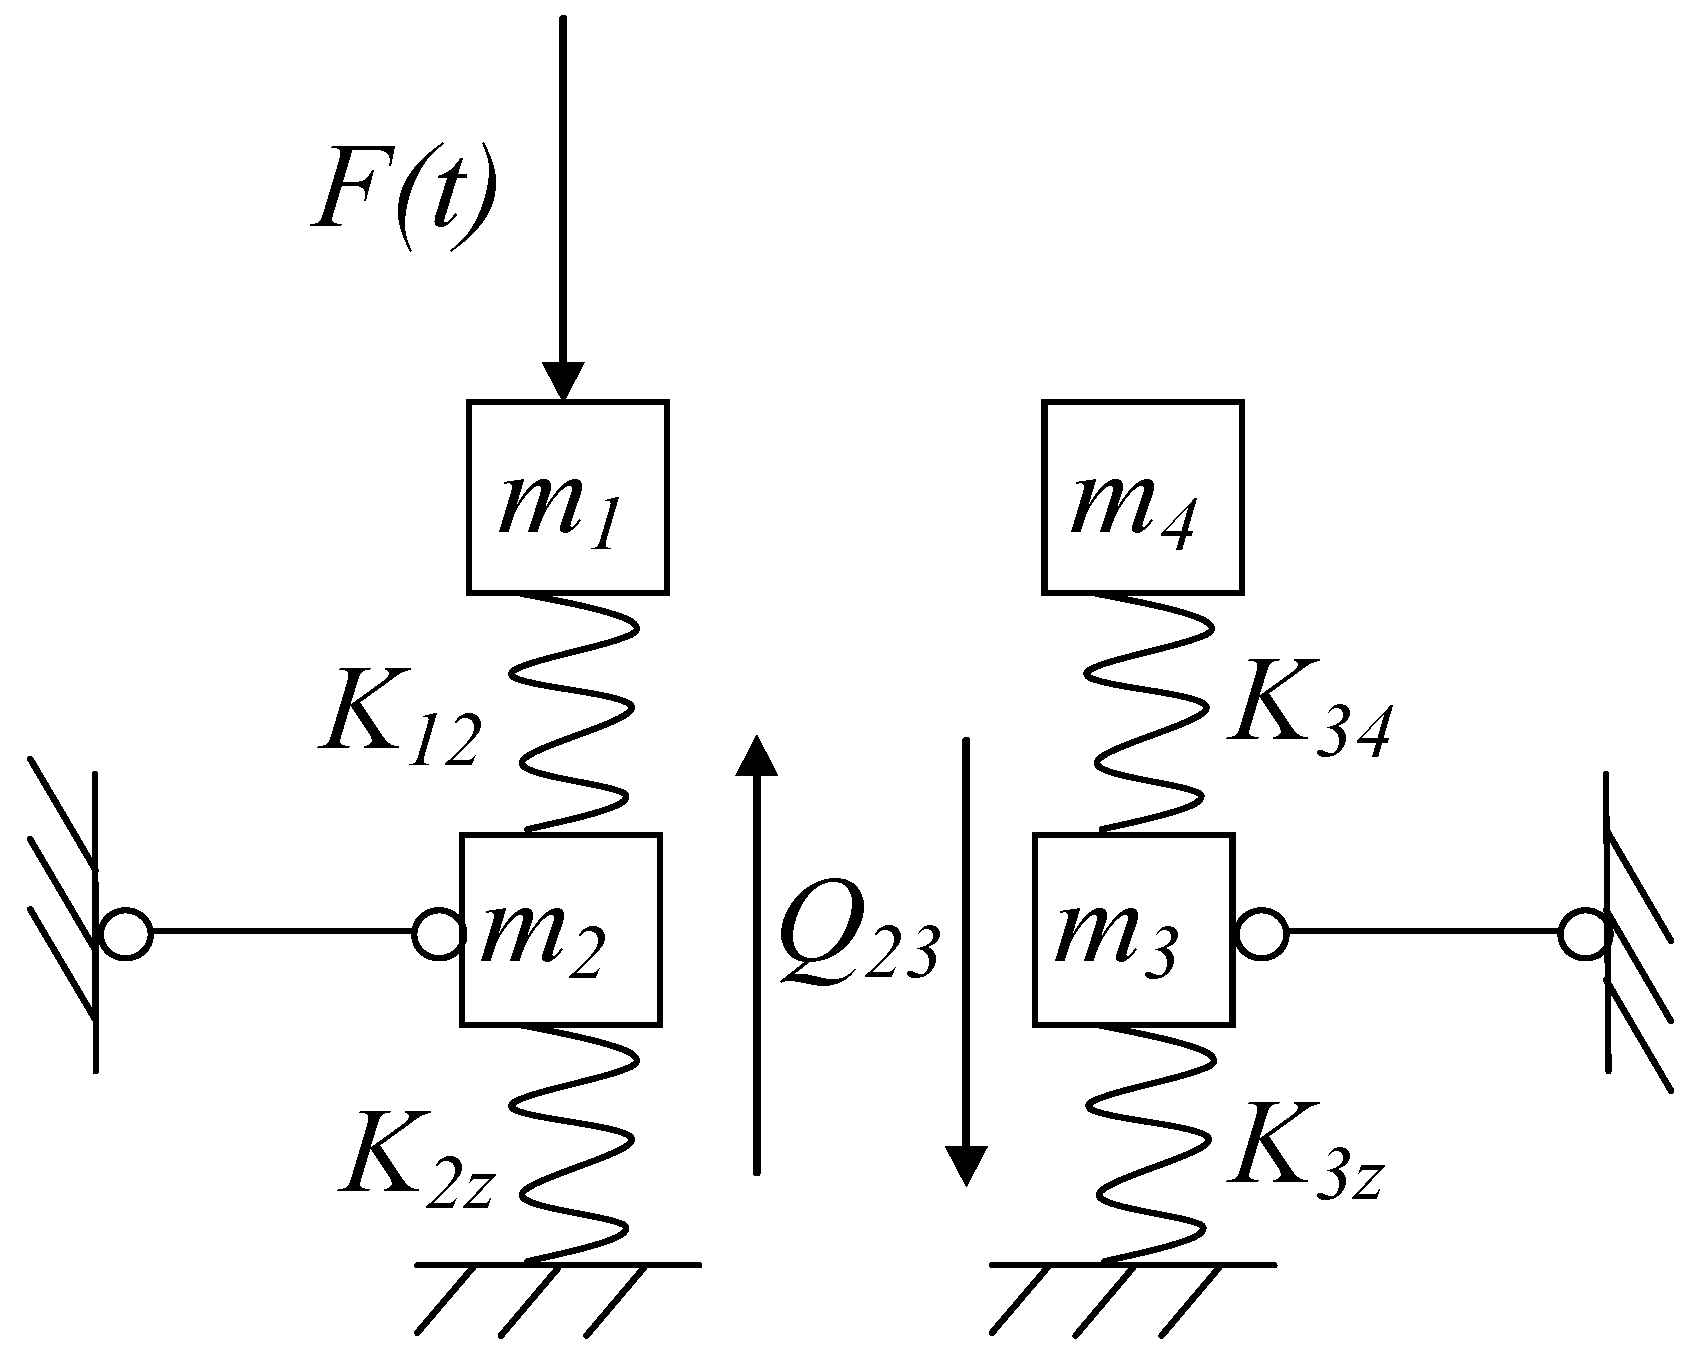
Figure 17.
Diagram of simplified models of six units: (a) Horizontal vibration; and, (b) Vertical vibration.
Figure 17.
Diagram of simplified models of six units: (a) Horizontal vibration; and, (b) Vertical vibration.
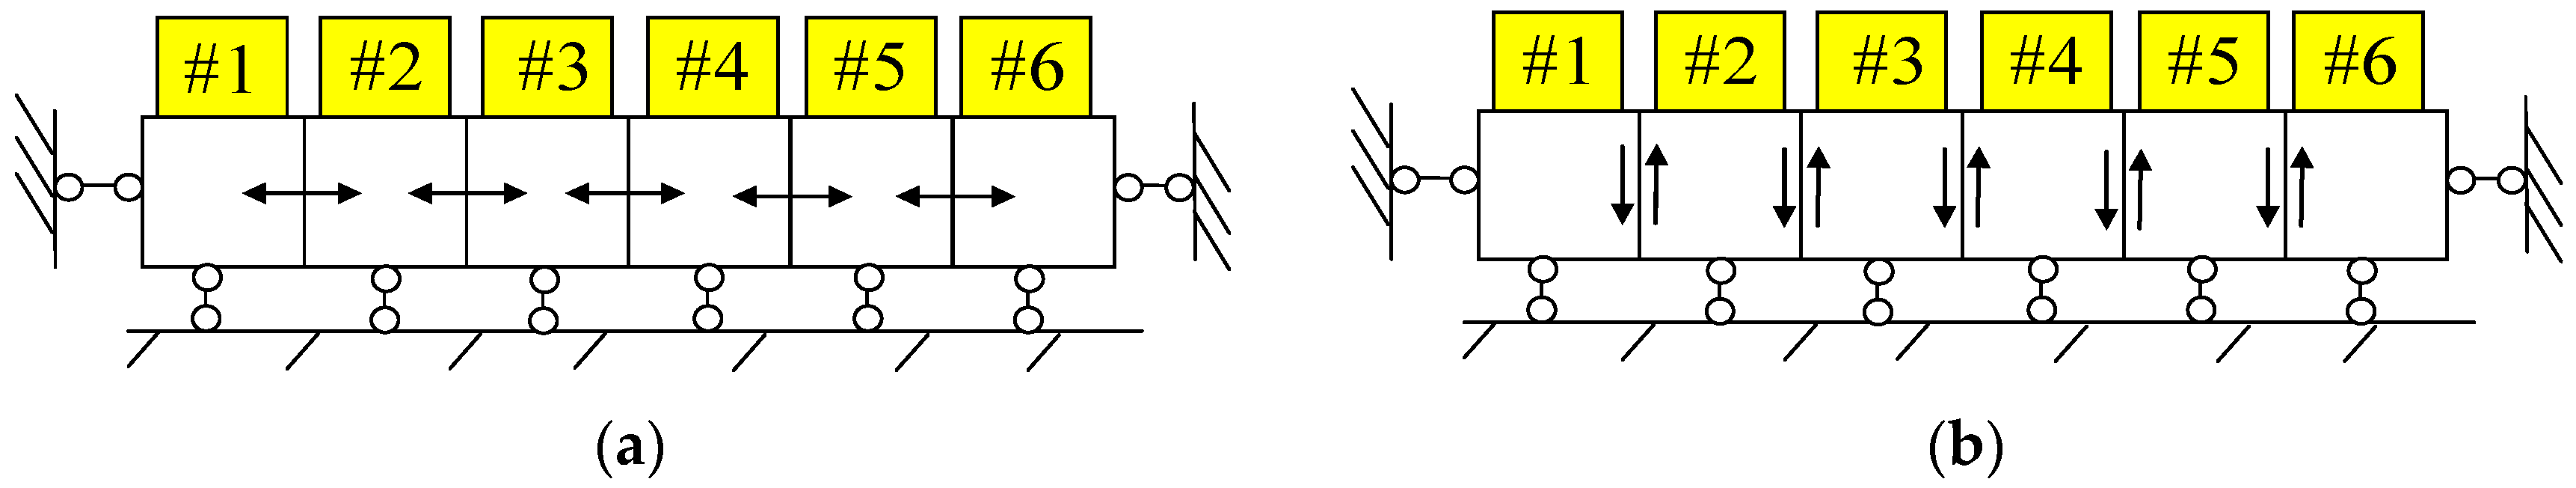
Figure 18.
Finite element model: (a) Model of whole powerhouse; (b) Model of single unit.

Figure 19.
Time history of load.

Figure 20.
Transmission ratios of vibration in three directions.


Table 1.
Wavelet decomposition of vibration signals.
| Signal Decomposed | a7 | d7 | d6 | d5 | d4 | d3 | d2 | d1 |
| Frequency Range (Hz) | 0–1.56 | 1.56–3.13 | 3.13–6.25 | 6.25–12.5 | 12.5–25 | 25–50 | 50–100 | 100–200 |
Table 2.
Ratios of vibration displacements of different units in three directions (%).
| Direction | #1 | #2 | #3 | #4 | #5 | #6 |
|---|---|---|---|---|---|---|
| X | 100 | 22.55 | 12.69 | 8.89 | 5.33 | 1.62 |
| Y | 100 | 12.63 | 3.02 | 1.93 | 1.31 | 1.08 |
| Z | 100 | 10.11 | 2.89 | 1.32 | 1.13 | 0.99 |
# is used for describing the unit number.
Table 3.
Ratios of vibration displacements under different frequencies loads (%).
| Frequency (Hz) | #1 | #2 | #3 | #4 | #5 | #6 |
|---|---|---|---|---|---|---|
| 1 | 100 | 22.55 | 12.69 | 8.89 | 5.33 | 1.62 |
| 2.4 | 100 | 22.57 | 12.69 | 8.90 | 5.33 | 1.61 |
# is used for describing the unit number.
Table 4.
Vibration transmission ratios between two adjacent units derived from three methods (%).
| Direction | Simplified Model | Field Test | Numerical Simulation |
|---|---|---|---|
| X | 25 | 17.69 | 22.55 |
| Y | 16 | 10.69 | 12.63 |
| Z | 16 | 10.74 | 10.11 |
© 2018 by the authors. Licensee MDPI, Basel, Switzerland. This article is an open access article distributed under the terms and conditions of the Creative Commons Attribution (CC BY) license (http://creativecommons.org/licenses/by/4.0/).
Share and Cite
MDPI and ACS Style
Lian, J.; Wang, H.; Wang, H. Study on Vibration Transmission among Units in Underground Powerhouse of a Hydropower Station. Energies 2018, 11, 3015. https://doi.org/10.3390/en11113015
AMA Style
Lian J, Wang H, Wang H. Study on Vibration Transmission among Units in Underground Powerhouse of a Hydropower Station. Energies. 2018; 11(11):3015. https://doi.org/10.3390/en11113015
Chicago/Turabian StyleLian, Jijian, Hongzhen Wang, and Haijun Wang. 2018. "Study on Vibration Transmission among Units in Underground Powerhouse of a Hydropower Station" Energies 11, no. 11: 3015. https://doi.org/10.3390/en11113015
Note that from the first issue of 2016, this journal uses article numbers instead of page numbers. See further details here.