High Gas Hydrate and Free Gas Concentrations: An Explanation for Seeps Offshore South Mocha Island


1
Facultad de Ingeniería, Universidad Andres Bello (UNAB), 2531015 Viña del Mar, Chile
2
Istituto Nazionale di Oceanografia e di Geofisica Sperimentale (OGS), 34010 Trieste, Italy
3
Helmholtz Centre for Ocean Research (GEOMAR), 24148 Kiel, Germany
4
Escuela de Ciencias del Mar, Pontificia Universidad Católica de Valparaíso, 2360007 Valparaíso, Chile
*
Author to whom correspondence should be addressed.
Energies 2018, 11(11), 3062; https://doi.org/10.3390/en11113062
Submission received: 8 August 2018
/
Revised: 28 August 2018
/
Accepted: 31 August 2018
/
Published: 7 November 2018
(This article belongs to the Section L: Energy Sources)
Abstract
:Recent studies have reported cold seeps offshore of Mocha Island. Gas hydrate occurrences along the Chilean margin could explain seeps presence. Gas-phase (gas hydrate and free gas) and geothermal gradients were estimated analysing two seismic sections. Close to Mocha Island (up to 20 km) were detected high (up to 1900 m/s) and low (1260 m/s) velocities associated with high gas hydrate (up to 20% of total volume) and free gas (up to 1.1% of total volume) concentrations, respectively. A variable and high geothermal gradient (65–110 °C/km) was obtained. These results are related to high supply of deep fluids canalised by faults and fractures. Faraway from Mocha Island (>60 km), free gas concentrations decrease to 0.3% of total volume and low geothermal gradient (from 35 to 60 °C/km) are associated with low fluids supply. Finally, we propose gas hydrate dissociation processes as the main supply source for seeps in the vicinity of Mocha Island. These processes can be caused by: (a) active faults and seismic activity; and (b) warm fluid expulsion from deeper zones altering hydrate stability conditions. In both cases, gas hydrate dissociation could generate slope instability and landslides, as occurred in the past in this region and reported in the literature.
1. Introduction
The studies regarding gas hydrate occurrences worldwide are important for three main reasons: (a) energy resource; (b) submarine geohazard; and (c) global climate change [1]. Gas hydrate distribution in Chile has been mapped mostly by using indirect measurements [2,3,4,5,6,7,8,9,10,11,12,13]. Moreover, several studies along the Chilean margin have reported gas-phase concentrations modelling seismic velocity [2,3,6,7,8,9,10,11,12,13,14,15,16,17,18] covering almost 10% of the entire margin. From multichannel seismic data, it is possible to detect the principal indicator of gas hydrate presence known as bottom simulating reflector (BSR). The worldwide distribution of BSR occurs mainly in marine sediments along the active continental margins (predominantly in the circum-Pacific belt) and in permafrost regions (Antarctic and Arctic) (e.g., [1,19,20,21,22,23,24]).
The interest for gas hydrate occurrences plays an important role due to the high seismicity that characterises the entire region and the global warming effect on the methane trapped in the shallow marine sediments. In the first case, several scientific studies have reported gas hydrate dissociation triggered by earthquakes, e.g., Great Sumatra, Japan and Norwegian margins [14,15,16,17,18]. The BSR along the Chilean margin is recognised in the continental slope, covering a wide extension close to 3000 km (from 33° S until 56° S). In the second case, some authors have modelled possible scenarios for gas hydrate dissociation in shallow water (from 150 to 600 m water depth) considering the increasing temperature due to the global warming and the consequent potential methane release into the atmosphere. They concluded that the gas hydrate dissociation processes are induced just by a slight increment of temperature [25,26,27,28,29,30,31]. In this context, gas hydrate estimates contribute to evaluate submarine geohazards, global warming contribution related to gas hydrate dissociation and the potential methane reservoir. Moreover, estimates of methane stored in marine sediments as gas hydrate and free gas phases can be used to model more realistic scenarios associated with gas hydrates dissociation and its effects as a greenhouse gas.
Relationships between gas hydrates and cold seeps have been documented in active and passive margins [5,31,32,33,34,35,36], in which chemosynthetic communities, authigenic carbonate nodules, enrichment stable isotopes in pore water, and faults and fractures, connected with BSR and detected in seismic profiles, can be related to gas hydrate presence.
The present study adds new information regarding gas-phase concentrations of the southern Chilean margin by using seismic and theoretical velocity models (Figure 1). Mocha Island is characterised by active seismicity and constitutes an emerged block uplifted during the Quaternary in the Arauco peninsula [37,38]. Further, Mocha Island is known for intertidal and subtidal gas seepage system [39,40] and deeper seeps at 1400 water depth [41], whose presence probably is related to gas hydrates dissociation. In this context, gas-phase estimates contribute to map and understand its role in fluid escapes supply.
A procedure already tested in previous studies is performed to quantify gas phases [7,8,10,11,13,42]. The method includes: (a) obtaining seismic velocity model by using Kirchhoff Pre-Stack Depth Migration (PSDM); (b) velocity anomalies evaluation; (c) gas-phase estimates by fitting seismic velocity with theoretical velocity; and (d) geothermal gradient calculation by using seafloor, BSR depths and water bottom temperature.
2. Materials and Methods
2.1. Seismic Data
RC2901–731 and SO161–35 seismic lines were analysed. Seismic data were acquired during 1988 and 2001 in the framework of ODP (Mid-Ocean Spreading Ridge, Chile Ridge; RC2901–731 seismic line) and SPOC (Subduction Processes off Chile; SO161–35 seismic line) projects, respectively. Seismic acquisition parameters are detailed in Table 1. Open-source Seismic Unix [43] software was used to perform the seismic processing.
2.2. Inversion Modelling
Once the BSR along the seismic lines was identified, two sections of approximately 20 km-long were chosen. The seismic analysis uses pre-stack data to perform Kirchhoff depth migration to model migration velocity by using an iterative algorithm [44]. The seismic migration analysis builds iteratively the velocity model by using a layer stripping approach [45], in which each layer is modelled in depth. The velocity model is built by selecting continuous reflectors. In our case, the seafloor (SF), the horizon 1 (H1), the BSR and the Base of Gas Reflector (BGR) were selected. The grid was defined considering a vertical and horizontal spacing equal to 10 and 25 m for RC2901–731 and SO161–35 seismic sections, respectively. The migration velocity analysis uses the output of PSDM to evaluate the reliability of velocity by measuring the flatness in Common Image Gathers (CIGs). At each iteration, the migration velocity analysis is corrected to flatten the events in the CIGs; when the events become flat, the velocity layer is fixed and a new horizon is analysed. The number of iterations of each layer necessary to flatten the events are detailed in Table 2:
A velocity gradient was introduced below the BGR and the final velocity models were smoothed to improve the stacked depth migrated image. The stacking of the CIGs was performed by using a maximum offset of 2500 m to attenuate stretching effects. Finally, a mixing and band-pass filter was applied; the final sections are shown in Figure 2.
2.3. BSR-Derived Geothermal Gradient
The geothermal gradient (dT/dZ) was calculated using the BSR information reported in the literature [10,11]. The main parameters to consider are: (1) BSR depth (ZBSR); (2) seafloor depth (ZSEA); (3) BSR temperature (TBSR); and (4) seafloor temperature (TSEA). Thus, the geothermal gradient can be obtained using the following relationship:
where TSEA was obtained from ODP information and reported studies in Central Chile [46,47]. The TBSR is based on gas hydrate stability curves reported by Dickens and Quinby-Hunt [48]. Finally, ZBSR and ZSEA were taken from seismic data analysis.
dT/dZ = (TBSR − TSEA)/(ZBSR − ZSEA)
2.4. Gas-Phase Concentrations
Gas-phase (gas hydrates and free gas) concentrations were estimated using a simplified method [49,50,51] of the Biot theory [50]. The velocity anomalies (i.e., the difference between the background and seismic velocities) were evaluated considering the geological context to associate positive velocity anomalies with gas hydrate concentrations as well as negative velocity anomalies with free gas concentrations. A qualitative estimate can be obtained by comparing theoretical velocity curves in absence of gas (i.e., the background velocity [52,53]) with our seismic velocity curves obtained as described in the Section 2.2. The method calculates the free gas concentration in the pore space by considering uniform (gas and water in pore space) and patchy (all gas in patches without water) distributions. In our case, a uniform distribution was considered [50]. Theoretical velocity was modelled by supposing a porosity at the seafloor of 65%, as measured during ODP leg 202 and reported in [46].
3. Results
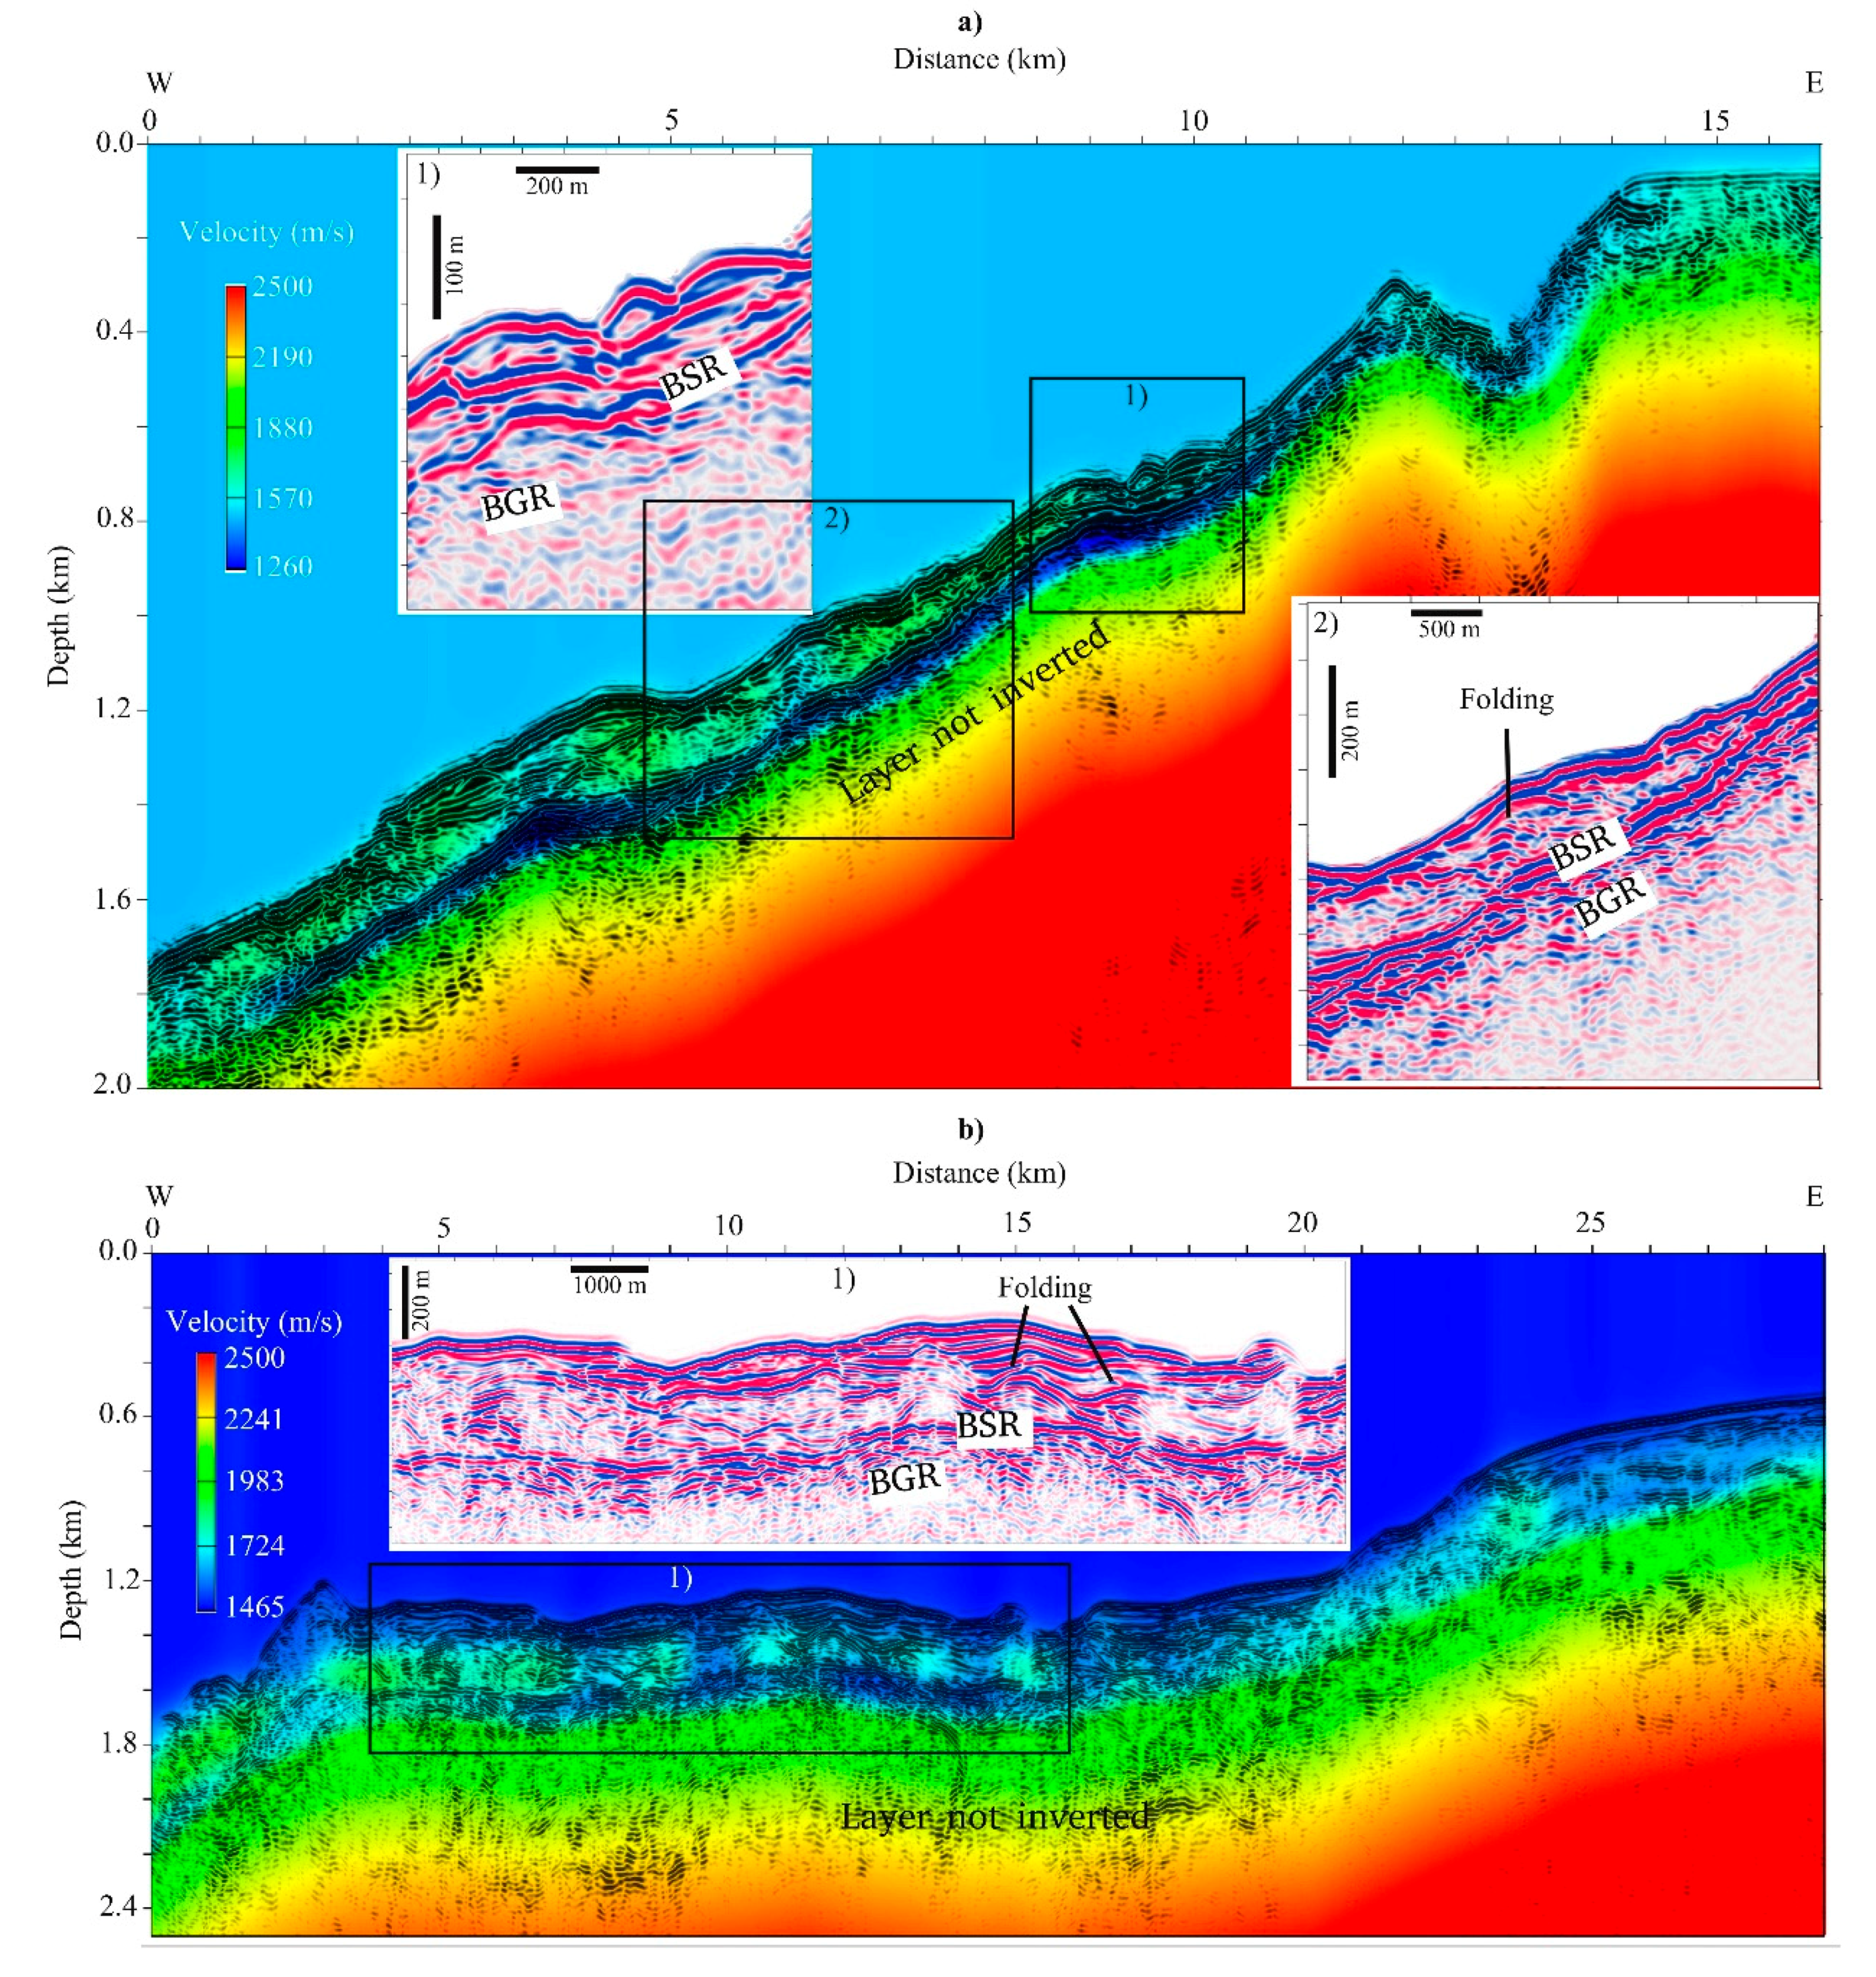
BSRs were recognised in both seismic sections. Along the entire SO161–35 seismic section, the BSR is continuous, strong and shows a variable depth, reaching a maximum thickness in deepest areas up to 200 m below seafloor (mbsf) (see from 0 to 6 km of distance in Figure 2), while minimum thicknesses are located in shallowest areas (~80 mbsf). On the contrary, RC2901–731 seismic profile shows discontinuous and locally strong BSR, while a constant BSR depth of about 250 mbsf is evidenced from 4 to 16 km of distance (Figure 2). Note that in the same section from 16 to 25 km of distance, the BSR is weak or disappear. In both sections, the BGR is detected and it is characterised by an average thickness of about 70 m (see blow-up in Figure 2).
The velocity distribution across SO161–35 and RC2901–731 sections shows strong vertical and lateral variations. The vertical velocity distribution across SO161–35 and RC2901–731 profiles shows a drop below the BSR, reaching minimum values of 1260 and 1465 m/s, respectively, which can be associated to the free gas presence (see Figure 2). Regarding lateral velocity variations, high velocity values (ranging from 1700 to 1900 m/s) were recognised above the BSRs (Figure 2). In both sections, faults and fractures with small slips affecting the seafloor were identified in correspondence to low velocity values (Figure 2 and Figure 3). Moreover, in the eastern part of the SO161–35 profile, a submarine canyon was identified (Figure 2 and Figure 3) and a normal fault that configures a lower and upper sector of the RC2901–731 line (see bottom panel of Figure 3f at 22 km of distance). Finally, in both sections, locally dipping reflections were associated to folding (see blow-ups in Figure 2).
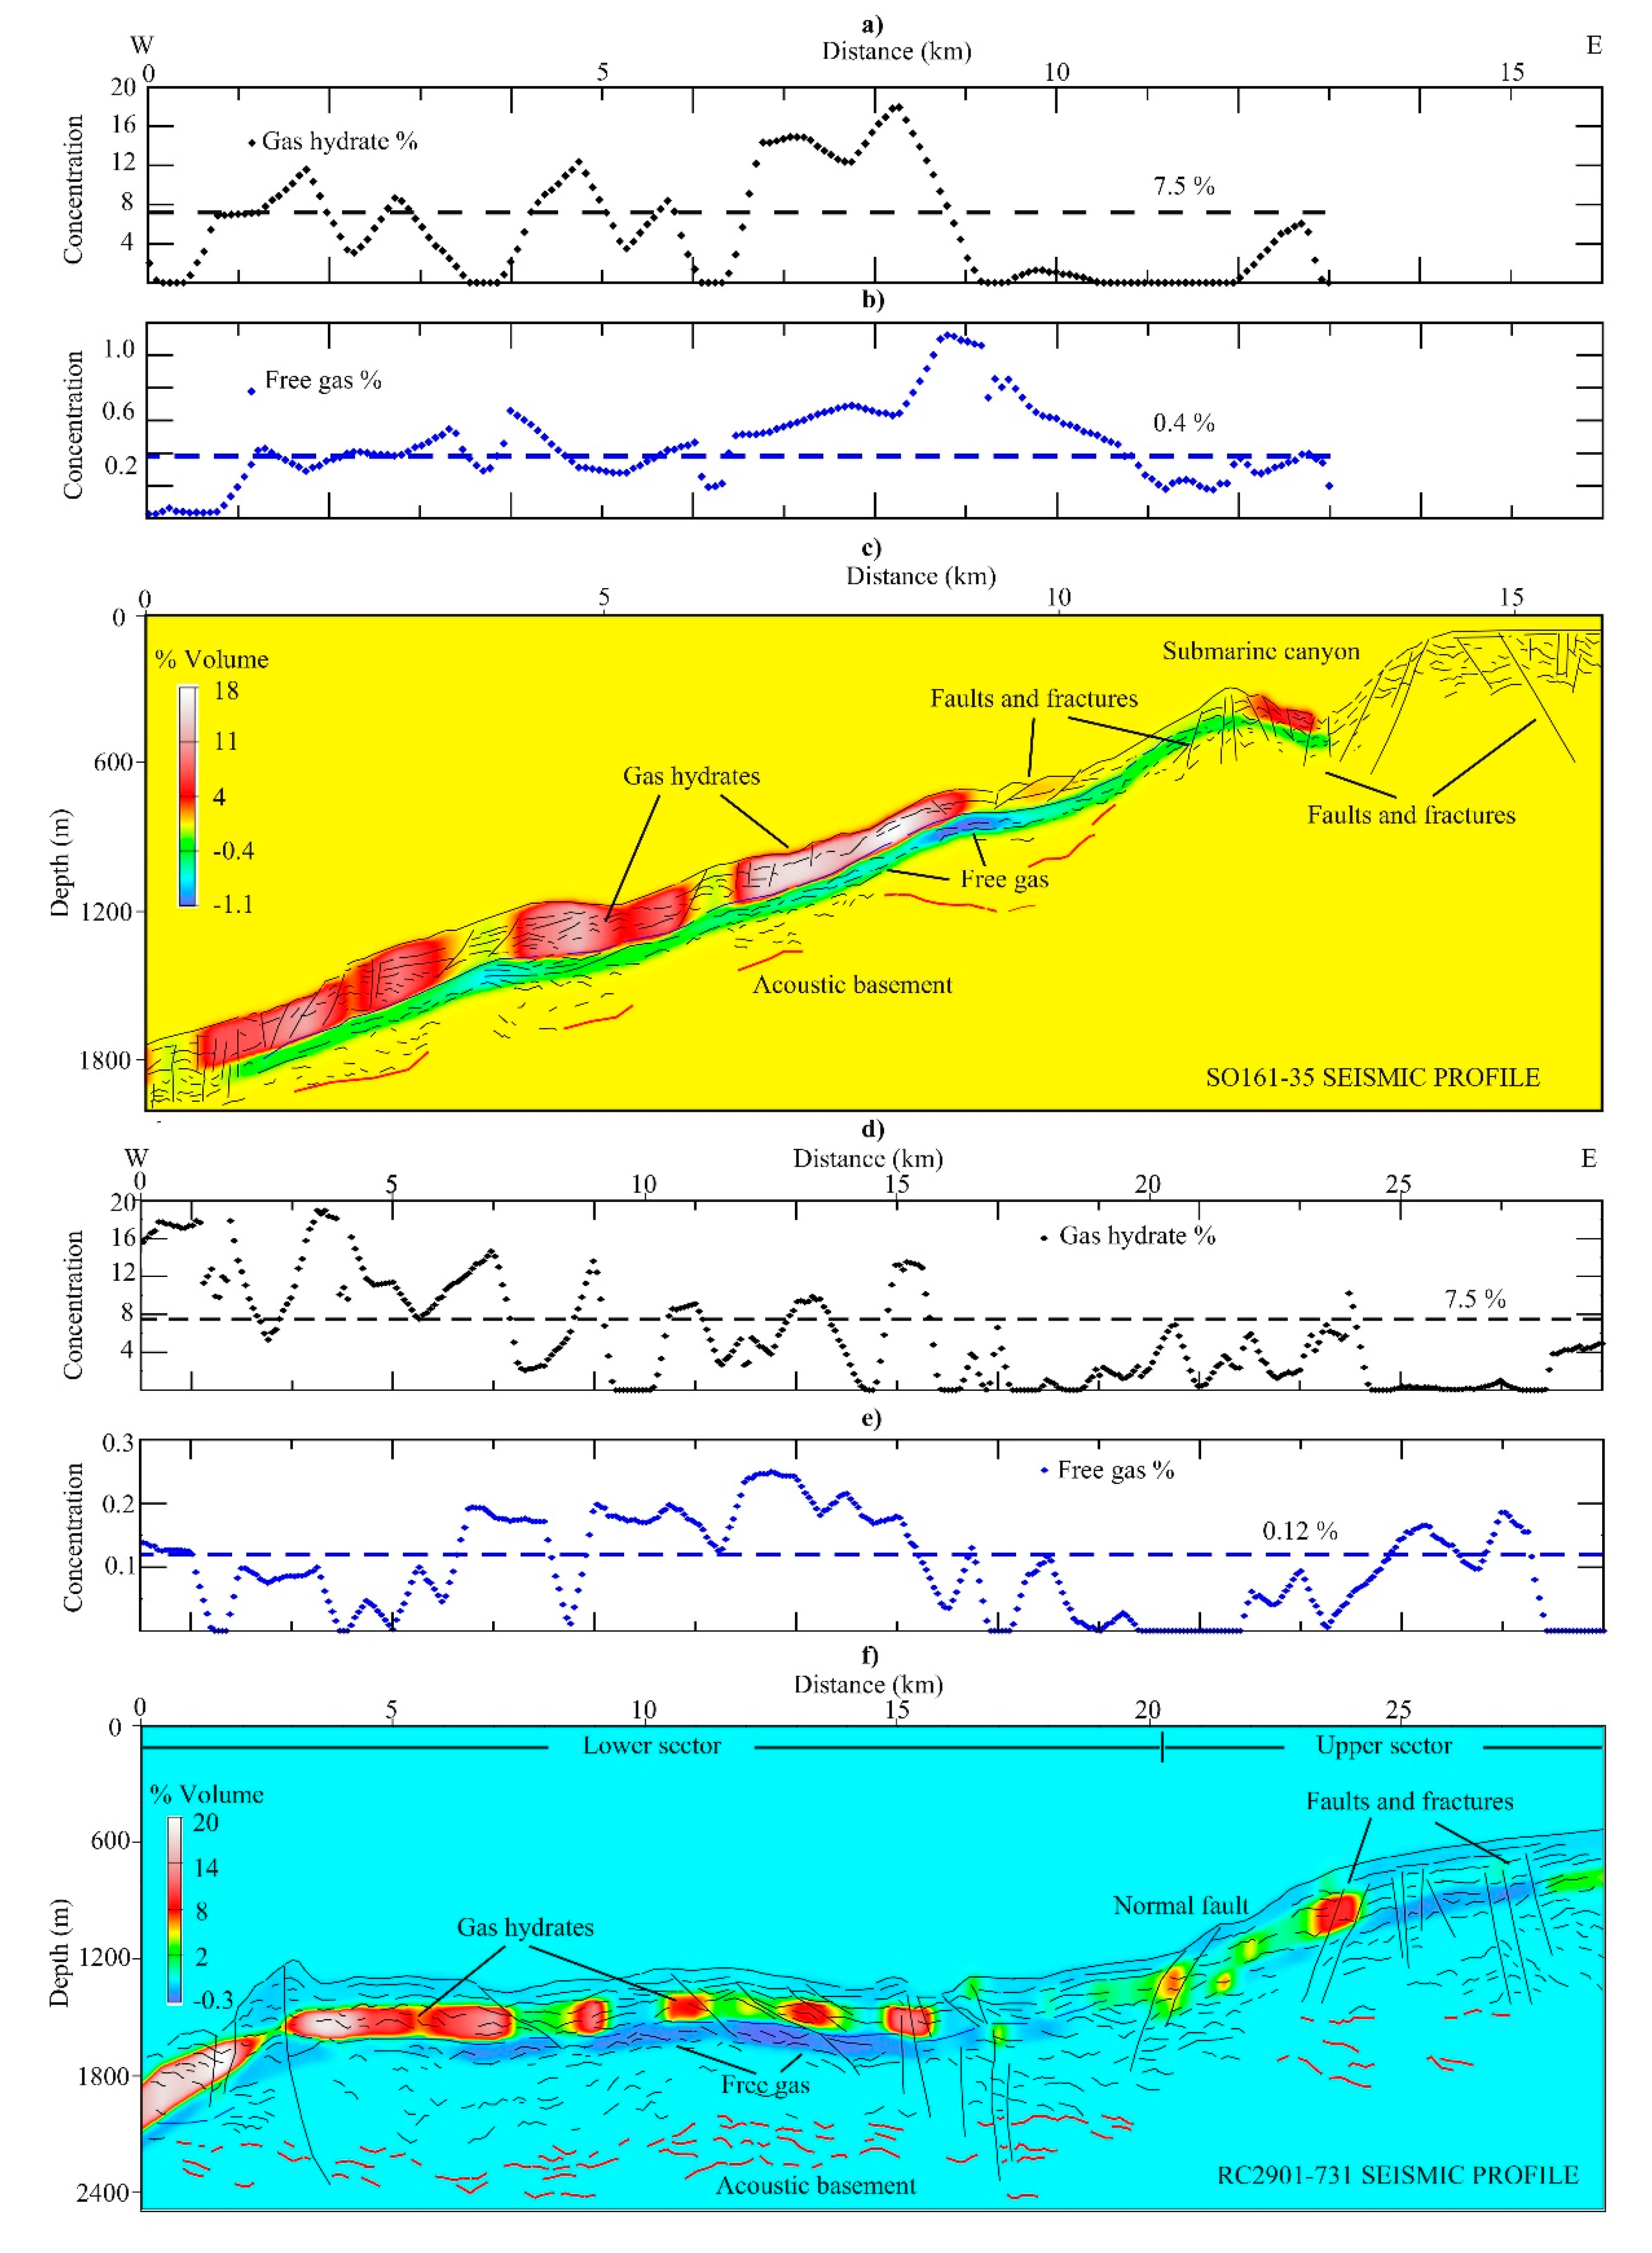
Variable gas hydrate and free gas concentrations were identified in both seismic profiles. Regarding gas hydrate, average concentrations are equal to 7.5% of total volume in both sections. On the contrary, the free gas average concentrations are different, equal to 0.4% and 0.12% of total volume in the SO161–35 and RC2901–731 sections, respectively. An opposite gas-phase concentration trend was locally observed, in which high gas hydrate concentrations (ranging from 12% to 20% of total volume) overlies low free gas concentrations (<0.4% of total volume for RC2901–731 section and <0.1% of total volume for SO161–35 section). In the same way, low gas hydrate concentrations (<4% of total volume in both sections) are locally in correspondence with high free gas concentrations (up to 1.1% of total volume for SO161–35 and up to 0.3% of total volume for RC2901–731 sections; see Figure 3). Besides, a normal trend was locally observed, in which high gas hydrate concentration was recognised in correspondence with high free gas concentration and, on the contrary, low gas hydrate concentration was recognised in correspondence with low free gas concentration (Figure 3).
A variable geothermal gradient across both sections was obtained and reported in Figure 4. However, a recognisable higher geothermal gradient was identified across the SO161–35 profile (ranging from 60 to 110 °C/km; Figure 4a), while a lower geothermal gradient across the RC2901–731 profile was observed (ranging from 35 to 65 °C/km; Figure 4b). The seismic and line drawing sections (Figure 2 and Figure 3) underline that the lowest geothermal values are located upwards in correspondence with the submarine canyon for SO161–35 section (see Figure 3 (top) at 12 km of distance) and the normal fault for RC2901–731 section (see Figure 2 (bottom) at 22 km of distance).
4. Discussion
Faults, fractures and folding affecting the shallow sediments in both sections are related to an active domain. In fact, Mocha Island is characterised by high seismicity and the uplifting process started during the Quaternary [37]. The SO161–35 seismic profile is located approximately 12 km south of Mocha Island and shows a strong and continuous BSR, while SO161–731 seismic profile, which is approximately 60 km south of Mocha Island, evidences a discontinuous and locally strong BSR. Moreover, a laterally variable BSR depth close to Mocha Island (SO161–35 section) was identified, while along RC2901–731 only a slight variation in the BSR depth was recognisable. The BSR seismic character and its depth variability can be related to the gas-phase concentrations, the water depth and the geothermal gradient distribution across the seismic profile. Regarding BSR seismic character, several studies argue that strong and continuous BSRs are related to significative free gas concentrations and strong vertical velocity variations [7,54,55]. In our case, across SO161–35 seismic profile, the highest free gas concentrations up to 1.1% of total volume (associated to the lowest velocity equal to 1260 m/s) are related to strong vertical velocity variation of 640 m/s, which is the velocity difference between gas hydrate and free gas velocity layers. On the other hand, faraway from Mocha Island (RC2901–731 seismic profile), the lowest velocity below BSR increases to 1450 m/s and the difference between gas hydrate and free gas velocities decreases to 400 m/s with respect to the seismic velocity determined in proximity of the Mocha Island. The variability of the BSR depth along the SO161–35 section can be explained by a variable geothermal gradient (ranging from 60 to 110 °C/km; Figure 4a). Thus, the gas hydrate stability field shifts upwards due to the high geothermal gradient. In the same way, a constant BSR depth along the RC2901–731 section could be associated to slight geothermal gradient variability (ranging from 35 to 65 °C/km; Figure 4b). Along the RC2901–731 line, the discontinuous and locally strong seismic character of the BSR can be related to small deformation presence, in which the gas hydrate and the free gas appear trapped across faults and fractures. In fact, along this profile, sectors are characterised by high/low velocity above/below the BSR in correspondence to deformation areas and faults (see RC2901–731 seismic profile in Figure 2 and Figure 3). Our result is in agreement with several authors who reported slight folding structures as structural traps for fluid storing associated to gas hydrate occurrences [7,56,57,58].
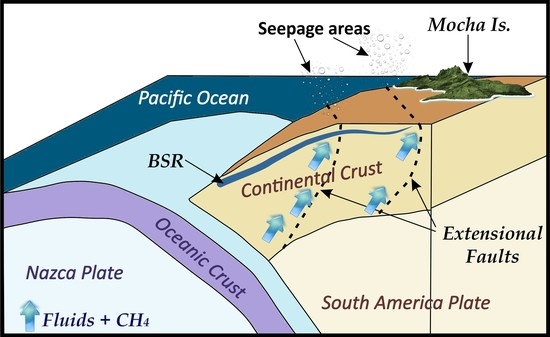
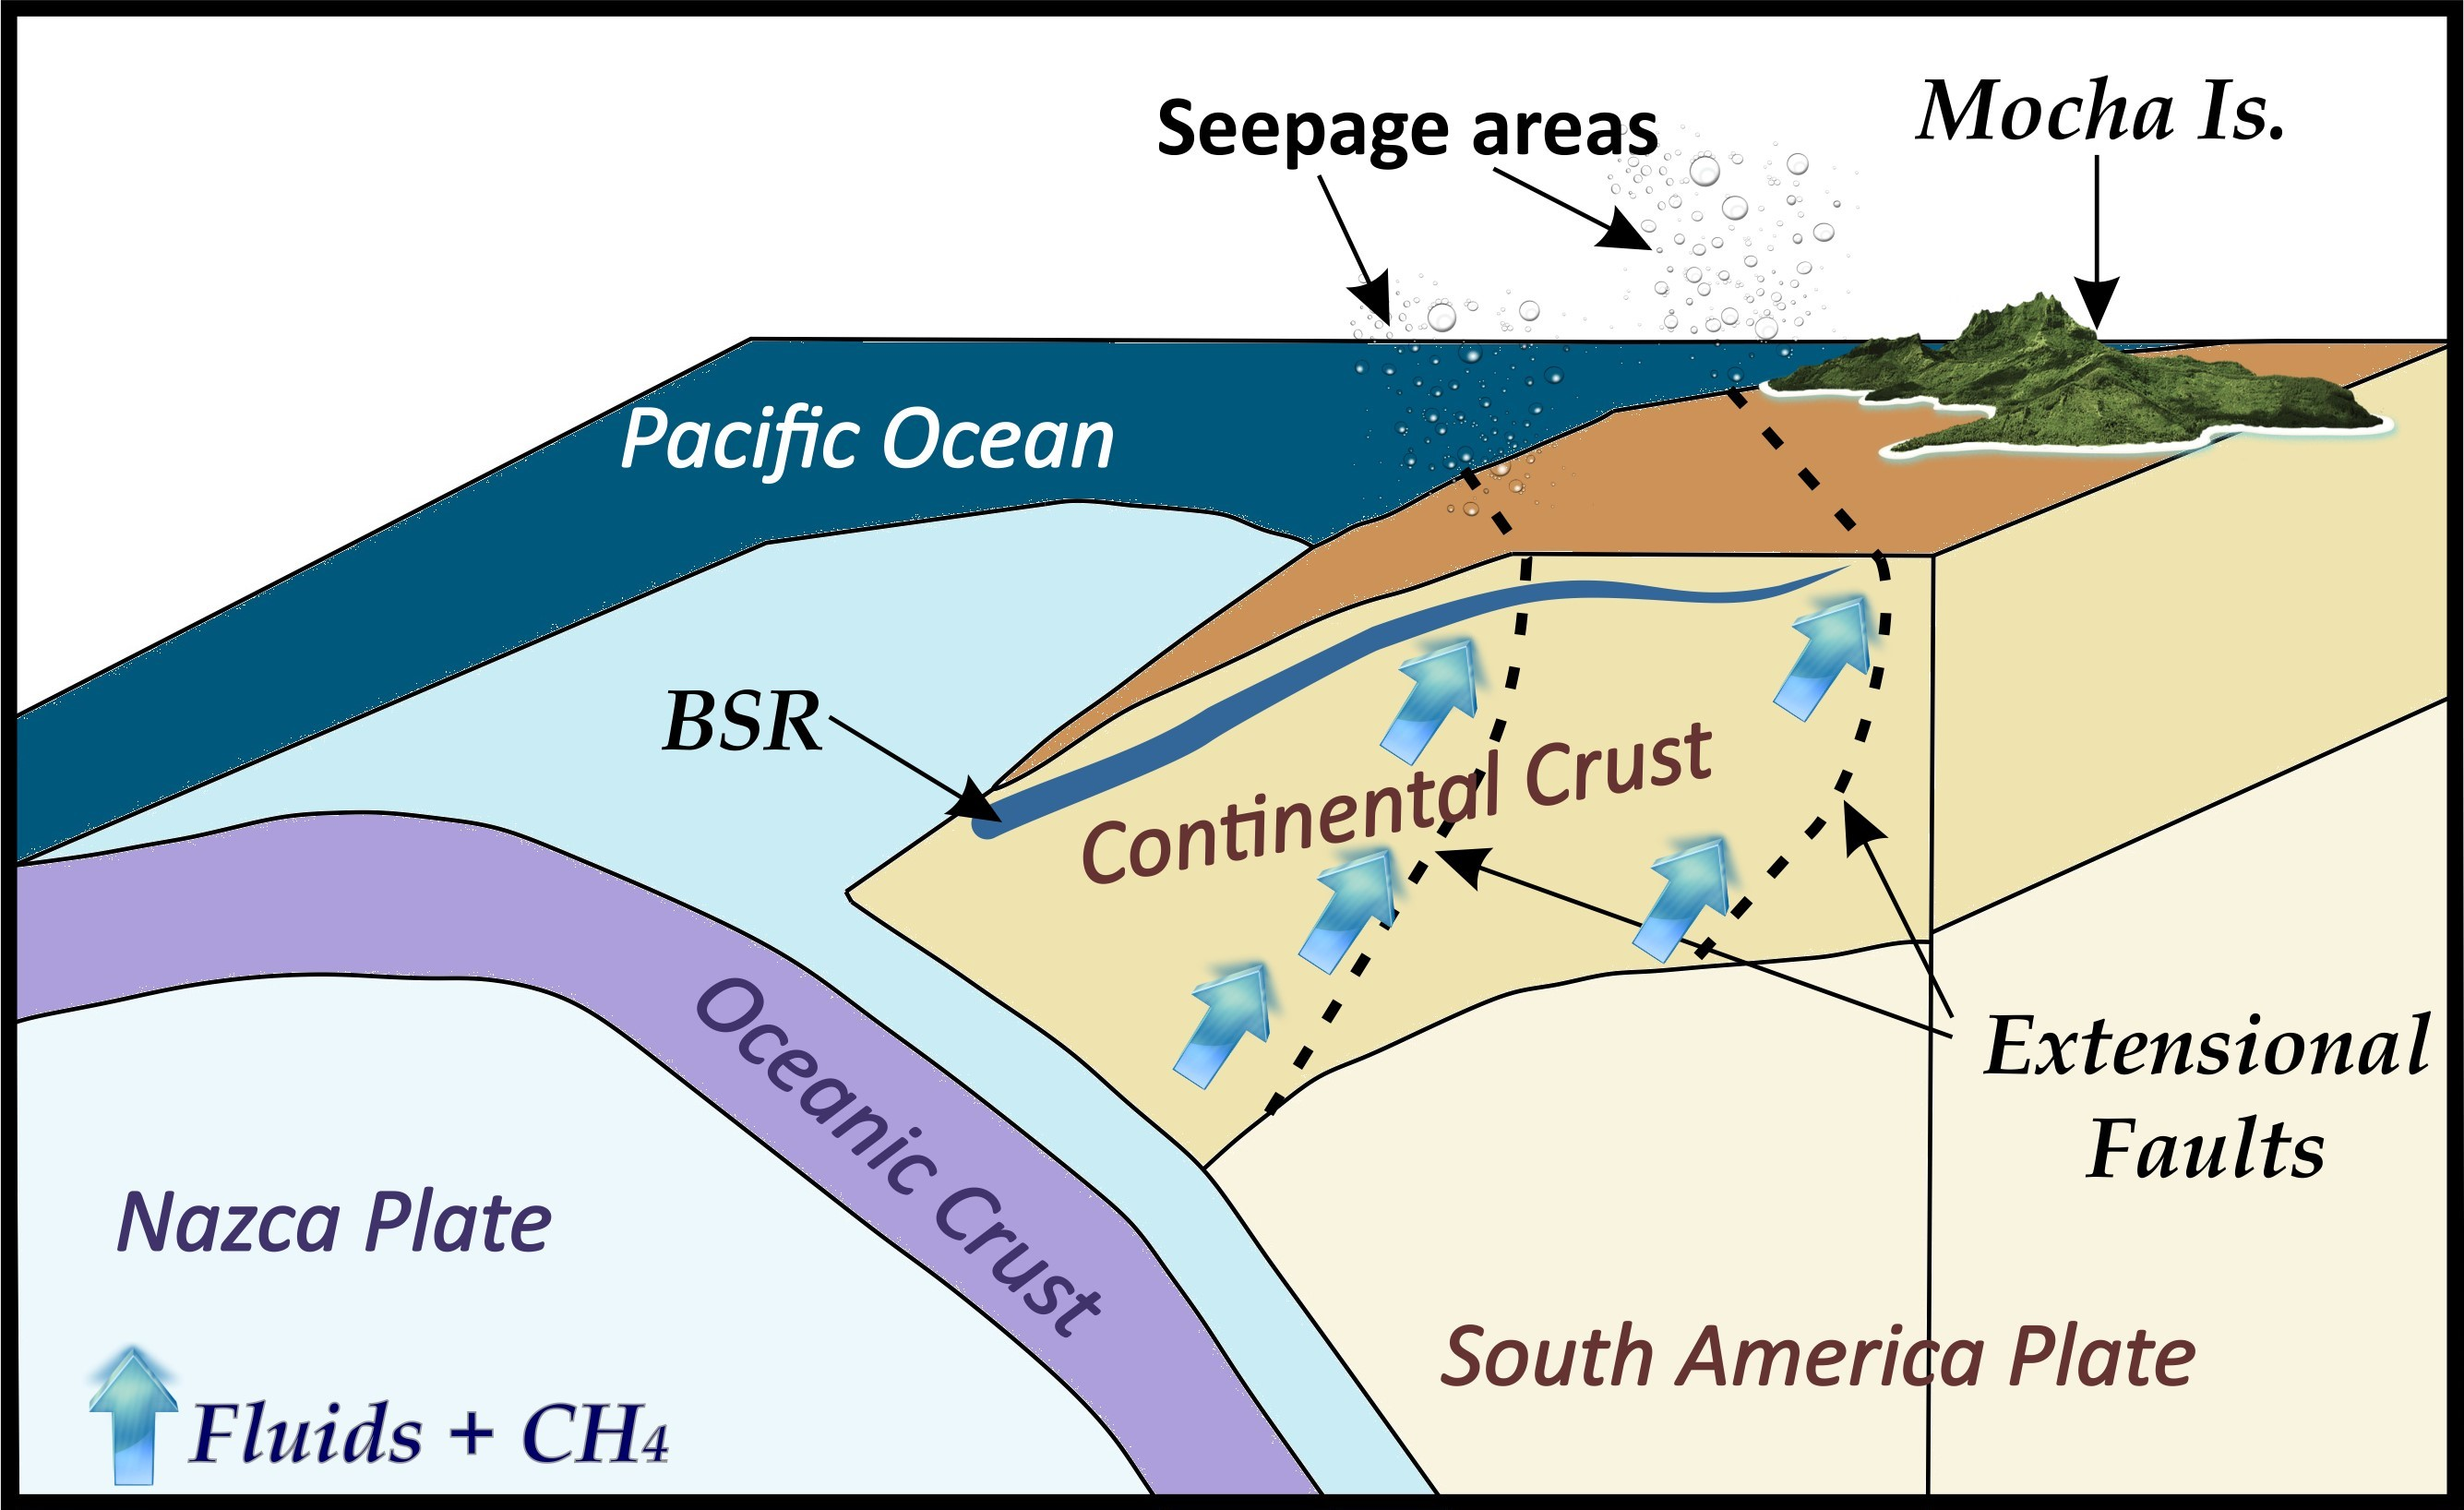
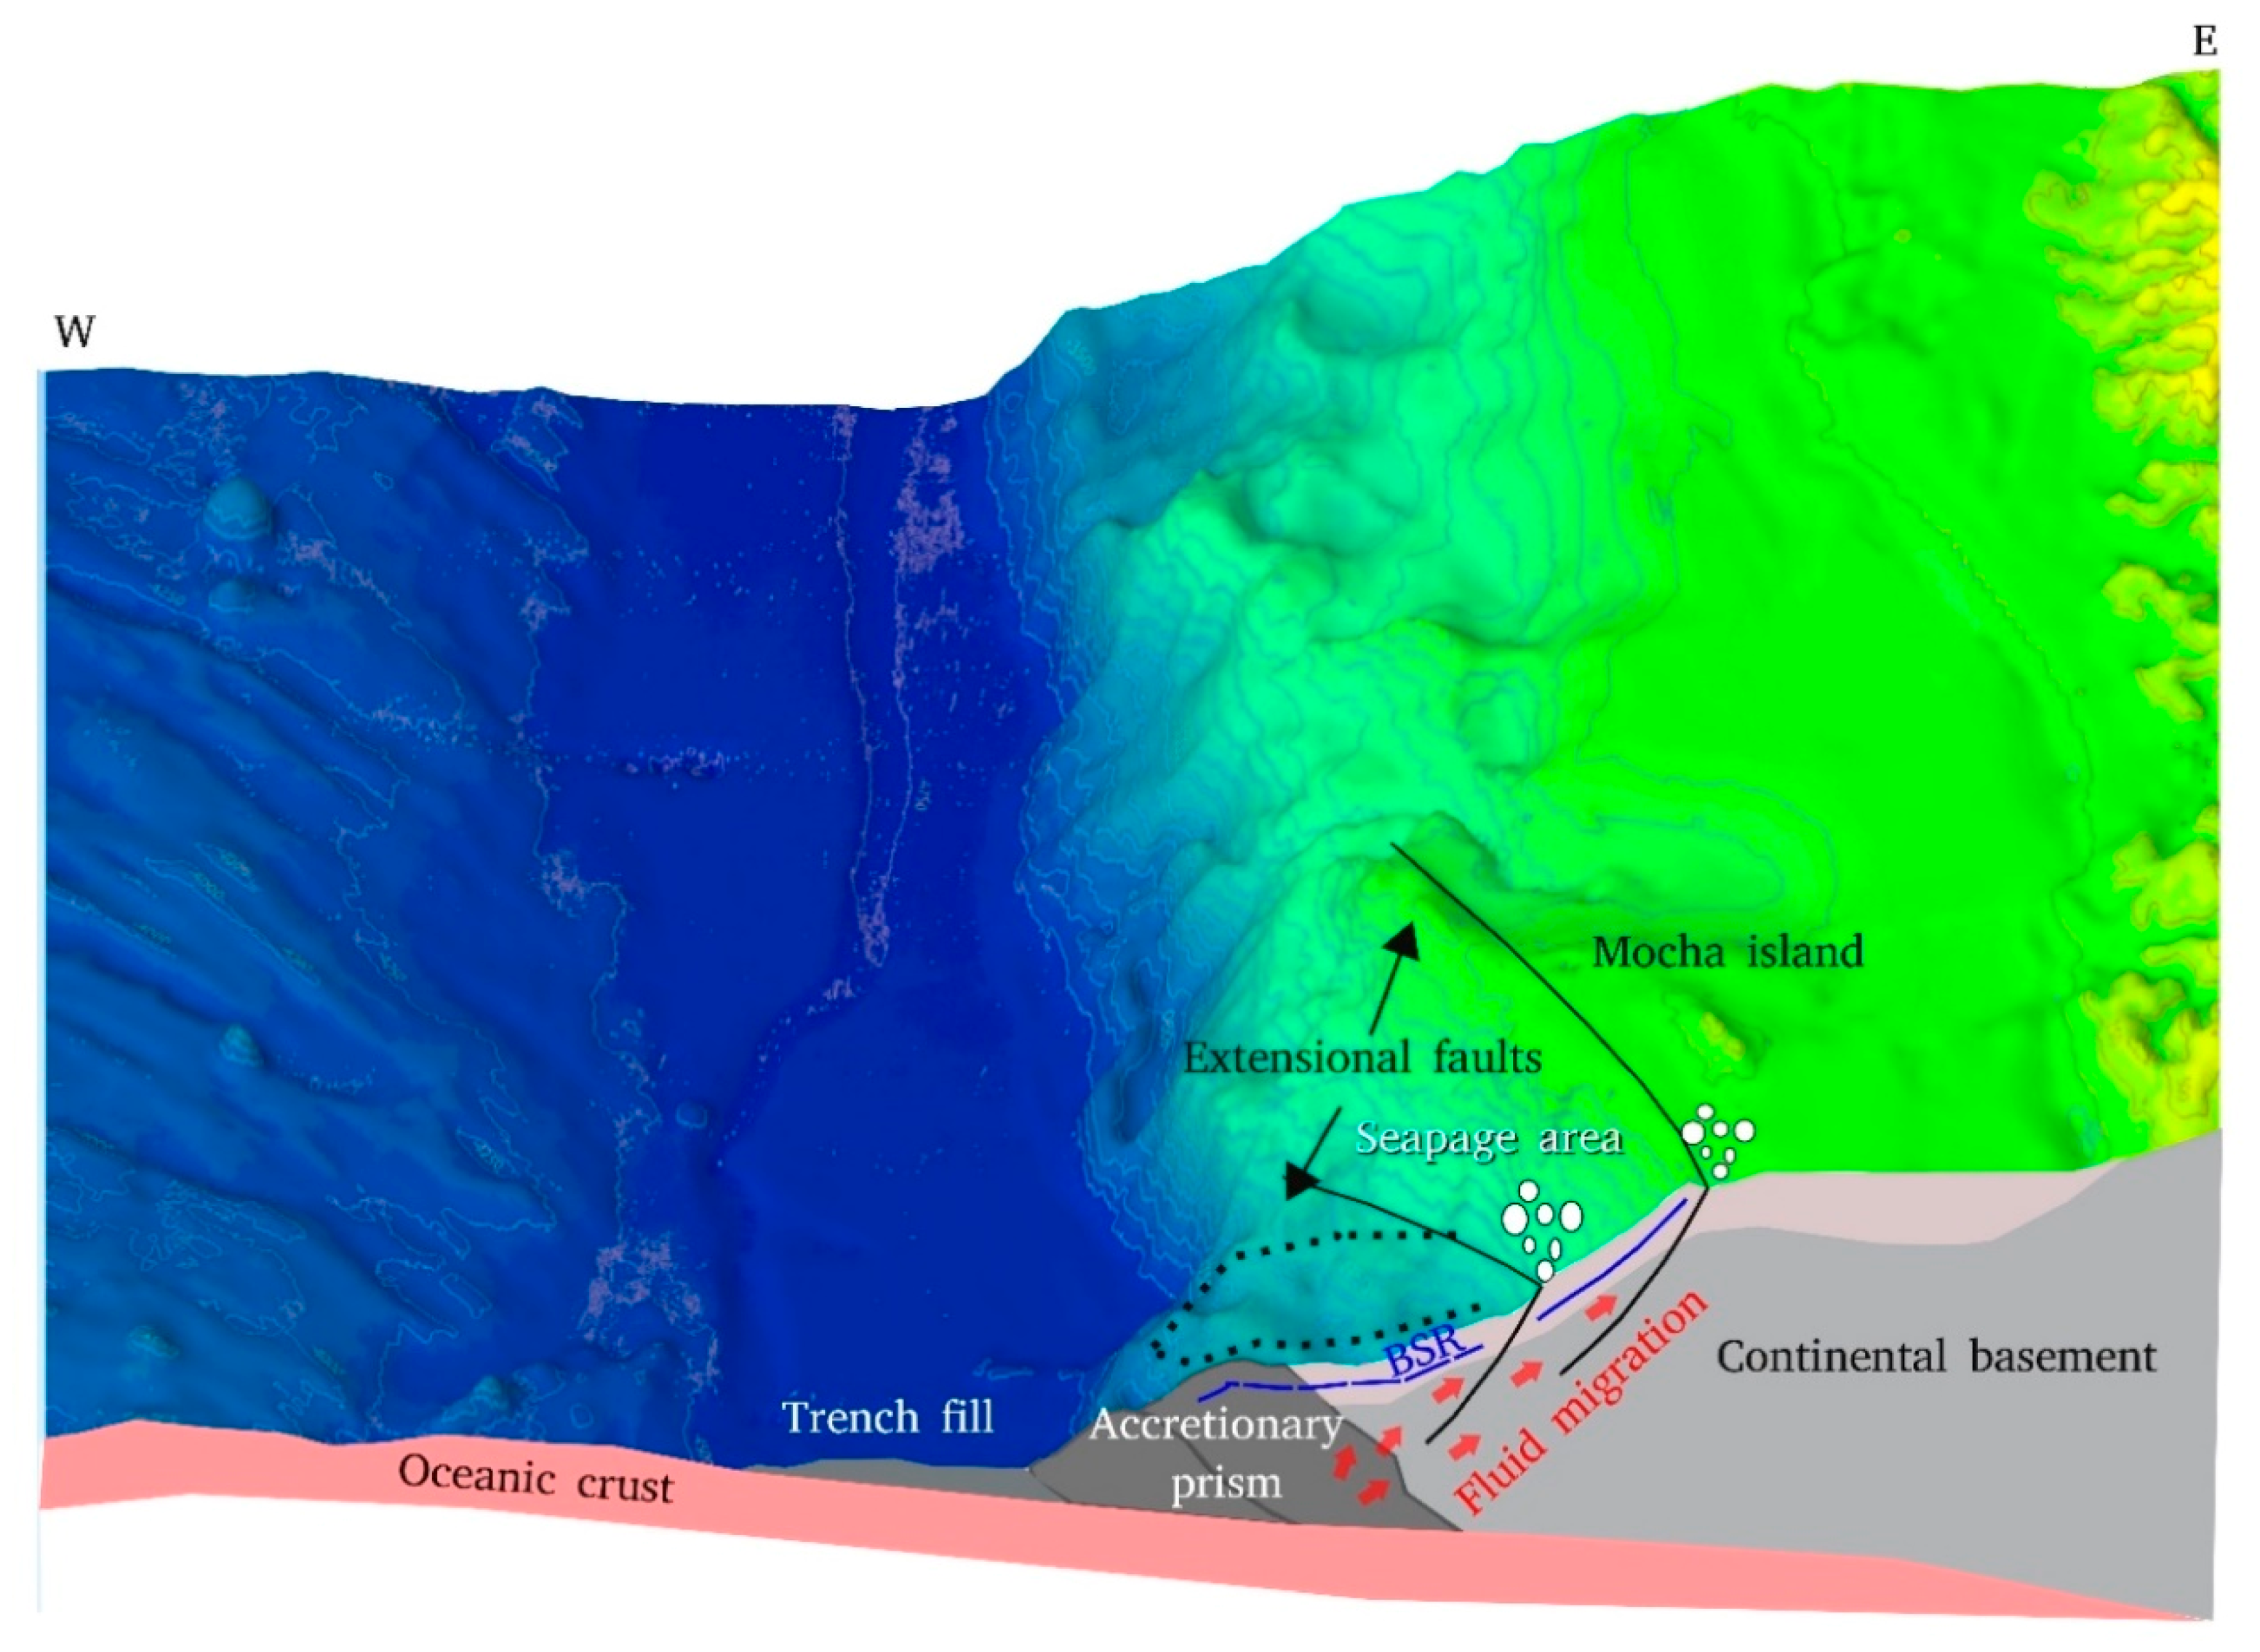
Higher geothermal gradient values were obtained close to Mocha Island, with average value equal to 85 °C/km. In contrast, lower geothermal gradient values were found distant from Mocha Island, with average value equal to 50 °C/km. These results are in agreement with anomalous heat flows reported by Villar-Muñoz et al. [12] in the same area. The former authors argue that the high heat flow variability would be related to ancient sliding processes, in which the headwall slide constitutes a fluid advection zone altering the geothermal gradient at the present. In addition, some authors proposed this area as a hydrated and/or fluid saturated forearc region [59]. In this context, the warm-fluid supply from deeper sectors (transporting methane) can be canalised by faults and fractures (Figure 5) and reaches the hydrate stability zone altering the thermal state, giving place to high geothermal gradients as reported in this study. Decreased geothermal gradient faraway from Mocha Island is associated with the regional geothermal gradient, where typical values above subduction zones of oceanic crust are older than 10 Ma [12,13,46,47].
High gas hydrate concentrations up to 20% of total volume are reported in both sections, but the highest free gas concentrations up to 1.1% of total volume are located near Mocha Island (SO161–35 seismic profile), while the lowest free gas concentrations up to 0.3% of total volume are found faraway from Mocha Island (across RC2901–731 section). In both sections, the highest gas hydrate concentration can be explained as follows: (a) high fluid supply from deeper zones that can favour gas hydrate formation, as suggested by several authors [7,51]; and (b) overestimating the compaction due to deformation processes. On the other hand, the highest free gas concentration located near Mocha Island would be related to the gas hydrate dissociation associated to past sliding processes reported by Geersen et al. [60] or free gas stored below an impermeable gas hydrate layer (see Figure 5), while the lowest free gas concentrations across RC2901–731 seismic profile can be explained by lower fluid supply from deep zones and high fluid escape rates preventing free gas storing. These fluid escapes are canalised by faults and fractures affecting seafloor and releasing gas as seeps. In both sections, an opposite gas-phase concentration trend was locally recognised, in which low gas hydrate concentration overlies high free gas concentration. In this case, we argue that the gas hydrate dissociation occurs or the free gas is stored below an impermeable gas hydrate layer. The contrary case, i.e., high gas hydrate concentration overlying low free gas concentration, can be associated to gas hydrate formation. This trend is in agreement with results reported by Vargas-Cordero et al. [7] in the southernmost region. Besides, we locally observed high/low gas hydrate concentration overlying high/low free gas concentration; this phenomenon is located mainly upwards eastern part of our sections. In this case, lateral fluid flow seems to be stored concentrating both gas hydrate and free gas in shallow water areas (see Figure 3). Even though gas hydrate dissociation can occur due to temperature increase (global warming) in the seabed on the upper slopes, we suggest that the dissociation processes occurring at both analysed seismic sections are mainly originated by tectonic forced extensional faults and fluids expulsion associated with hydrated and/or fluid saturated forearc region, as documented by [59] (see Figure 5). In fact, in this part of the Chilean margin, high magnitude and recurrent seismicity are reported [37,61,62,63] Besides, cold seeps documented and extensional faults interpreted in this study are connected in deep with BSR presence, reaching the seabed at 500 m water depth (see SO161–35 profile in Figure 2 and Figure 3). These faults can be related to Mocha Villarica Fault Zone (MVFZ) reported in the literature by [38] and can play a role in the transport of deep fluids upwards until to reach the shallow seabed zone.
Finally, considering high gas hydrate (average 7.5% of total volume) and free gas concentrations (0.4% of total volume) reported in this study, we conclude that close to Mocha Island gas hydrate dissociation processes occurring in the past and, potentially, in the present can constitute the main seepage supply source along this part of the Chilean margin.
5. Conclusions
The results of this research regarding gas-phase concentrations (gas hydrate and free gas) in the Chilean margin close to Mocha Island lead us to conclude that:
- (a)
- The BSR was recognised in both seismic sections analysed. Near Mocha Island (SO161–35 seismic profile), the BSR is continuous, strong and shows a variable depth. On the contrary, the RC2901–731 seismic profile reveals a discontinuous and locally strong BSR, while a constant BSR depth (~250 mbsf) is evidenced.
- (b)
- Variation on the geothermal gradient is the main cause of BSR depth variability close to the Mocha Island, where values ranging from 65 to 110 °C/km were obtained. These values are related to fluids advection canalised by faults and fractures present in the area.
- (c)
- High gas hydrate concentrations up to 20% of total volume (average 7.5%) were found in both sections. On the contrary, the free gas average concentrations are different and equal to 0.4% and 0.12% of total volume in SO161–35 and RC2901–731 seismic profiles, respectively.
- (d)
- The highest free gas concentration was observed close to Mocha Island (up to 1.1% of total volume) and would be related to gas hydrate dissociation associated to past sliding processes or free gas stored below an impermeable gas hydrate layer.
- (e)
- The highest gas hydrate concentration close to Mocha Island can be explained as due to high fluid supply from deeper zones, which can favour gas hydrate formation.
- (f)
- Gas hydrate dissociation processes, caused by active faults, seismic activity and/or by warm fluids expulsion from deeper zones, can constitute the main seepage supply source along this part of the Chilean margin. In both cases, these processes could generate slope instability and landslides.
Author Contributions
All authors were involved in the data processing and preparation process. All authors were involved in the discussion and revision process with section leads as follows: I.V.-C., Section 1, Section 2, Section 3 and Section 4; U.T., Section 2, Section 3 and Section 4; L.V.-M. and J.P.B., Section 3 and Section 4.
Funding
This research was partially funded by Conicyt, Chile (Fondecyt program), project number 11140216.
Acknowledgments
The authors are very grateful to Joyce Alsop for the seismic data provided at Lamont Doherty Earth Laboratory, USA (LDEO) and V. Damm for the seismic data provided at Federal Institute for Geosciences and Natural Resources, Germany (BGR). We are grateful to CONICYT (Fondecyt de Iniciación N°11140216), which partially supported this work.
Conflicts of Interest
The authors declare no conflict of interest.
References
- Kvenvolden, K.A. Gas hydrates-geological perspective and global change. Rev. Geophys. 1993, 31, 173–187. [Google Scholar] [CrossRef]
- Bangs, N.L.; Sawyer, D.S.; Golovchenko, X. Free gas at the base of the gas hydrate zone in the vicinity of the Chile triple junction. Geology 1993, 21, 905–908. [Google Scholar] [CrossRef]
- Brown, K.M.; Bangs, N.L.; Froelich, P.N.; Kvenvolden, K.A. The nature, distribution, and origin of gas hydrate in the Chile Triple Junction region. Earth Planet. Sci. Lett. 1996, 139, 471–483. [Google Scholar] [CrossRef]
- Diaz–Naveas, J. Sediment Subduction and Accretion at the CHILEAN Convergent Margin between 35° and 40°S. Ph.D. Thesis, University of Kiel, Kiel, Germany, 1999; pp. 1–130. [Google Scholar]
- Coffin, R.; Pohlman, J.; Gardner, J.; Downer, R.; Wood, W.; Hamdan, L.; Walker, S.; Plummerg, R.; Gettrus, J.; Diaz, J. Methane hydrate exploration on the mid Chilean coast: A geochemical and geophysical survey. J. Petrol. Sci. Eng. 2007, 56, 32–41. [Google Scholar] [CrossRef]
- Rodrigo, C.; González-Fernández, A.; Vera, E. Variability of the bottom-simulating reflector (BSR) and its association with tectonic structures in the Chilean margin between Arauco Gulf (37°S) and Valdivia (40°S). Mar. Geophys. Res. 2009, 30, 1–19. [Google Scholar] [CrossRef]
- Vargas-Cordero, I.; Tinivella, U.; Accaino, F.; Loreto, M.F.; Fanucci, F. Thermal state and concentration of gas hydrate and free gas of Coyhaique, Chilean Margin (44°30′ S). Mar. Petrol. Geol. 2010, 27, 1148–1156. [Google Scholar] [CrossRef]
- Vargas-Cordero, I.; Tinivella, U.; Accaino, F.; Loreto, M.F.; Fanucci, F.; Reichert, C. Analyses of bottom simulating reflections offshore Arauco and Coyhaique (Chile). Geo-Mar. Lett. 2010, 30, 271–281. [Google Scholar] [CrossRef]
- Vargas-Cordero, I.; Tinivella, U.; Accaino, F.; Fanucci, F.; Loreto, M.F.; Lascano, M.E.; Reichert, C. Basal and Frontal Accretion Processes versus BSR Characteristics along the Chilean Margin. J. Geophys. Res. 2011, 2011, 846101. [Google Scholar] [CrossRef]
- Vargas-Cordero, I.; Tinivella, U.; Villar-Muñoz, L.; Giustiniani, M. Gas hydrate and free gas estimation from seismic analysis offshore Chiloé island (Chile). Andean Geol. 2016, 43, 263–274. [Google Scholar] [CrossRef]
- Vargas-Cordero, I.; Umberta, T.; Villar-Muñoz, L. Gas Hydrate and Free Gas Concentrations in Two Sites inside the Chilean Margin (Itata and Valdivia Offshores). Energies 2017, 10, 2154. [Google Scholar] [CrossRef]
- Villar-Muñoz, L.; Behrmann, J.H.; Diaz-Naveas, J.; Klaeschen, D.; Karstens, J. Heat flow in the southern Chile forearc controlled by large-scale tectonic processes. Geo-Mar. Lett. 2014, 34, 185–198. [Google Scholar] [CrossRef]
- Villar-Muñoz, L.; Bento, J.P.; Klaeschen, D.; Tinivella, U.; Vargas-Cordero, I.; Behrmann, J.H. A first estimation of gas hydrates offshore Patagonia (Chile). Mar. Petrol. Geol. 2018, 96, 232–239. [Google Scholar] [CrossRef]
- Bouriak, S.; Vanneste, M.; Saoutkine, A. Inferred gas hydrates and clay diapirs near the Storegga Slide on the southern edge of the Vøring Plateau, offshore Norway. Mar. Geol. 2000, 163, 125–148. [Google Scholar] [CrossRef]
- Bünz, S.; Mienert, J.; Berndt, C. Geological controls on the Storegga gas-hydrate system of the mid-Norwegian continental margin. Earth Planet. Sci. Lett. 2003, 209, 291–307. [Google Scholar] [CrossRef] [Green Version]
- Sultan, N.; Cochonat, P.; Canals, M.; Cattaneo, A.; Dennielou, B.; Haflidason, H.; Urgeles, R. Triggering mechanisms of slope instability processes and sediment failures on continental margins: A geotechnical approach. Mar. Geol. 2004, 213, 291–321. [Google Scholar] [CrossRef]
- Berndt, C.; Mienert, J.; Vanneste, M.; Bünz, S. Gas hydrate dissociation and sea-floor collapse in the wake of the Storegga Slide, Norway. Norw. Petrol. Soc. Spec. Publ. 2005, 12, 285–292. [Google Scholar]
- Horozal, S.; Bahk, J.J.; Urgeles, R.; Kim, G.Y.; Cukur, D.; Kim, S.P.; Kim, J.H. Mapping gas hydrate and fluid flow indicators and modelling gas hydrate stability zone (GHSZ) in the Ulleung Basin, East (Japan) Sea: Potential linkage between the occurrence of mass failures and gas hydrate dissociation. Mar. Petrol. Geol. 2017, 80, 171–191. [Google Scholar] [CrossRef]
- Pearson, C.F.; Halleck, P.M.; McGuire, P.L.; Hermes, R.; Mathews, M. Natural gas hydrate deposits: A review of in situ properties. J. Phys. Chem. 1983, 87, 4180–4185. [Google Scholar] [CrossRef]
- Hyndman, R.D.; Spence, G.D.; Chapman, R.; Riedel, M.; Edwards, R.N. Geophysical studies of marine gas hydrate in northern Cascadia. Nat. Gas Hydrates. Occur. Distrib. Detect. 2001, 124, 273–295. [Google Scholar]
- Kvenvolden, K.A. Natural gas hydrate: Background and history of discovery. In Natural Gas Hydrate in Oceanic and Permafrost Environments; Max, M.D., Ed.; Springer: Dordrecht, The Netherlands, 2000; pp. 9–16. ISBN 978-94-011-4387-5. [Google Scholar]
- Max, M.D. Natural Gas Hydrate in Oceanic and Permafrost Environments; Springer: Dordrecht, The Netherlands, 2003. [Google Scholar]
- Collett, T.S.; Dallimore, S.R. Permafrost-associated gas hydrate. In Natural Gas Hydrate in Oceanic and Permafrost Environments; Max, M.D., Ed.; Springer: Dordrecht, The Netherlands, 2000; pp. 43–60. [Google Scholar]
- Collett, T.S.; Lee, M.W.; Agena, W.F.; Miller, J.J.; Lewis, K.A.; Zyrianova, M.V.; Inks, T.L. Permafrost-associated natural gas hydrate occurrences on the Alaska North Slope. Mar. Petrol. Geol. 2011, 28, 279–294. [Google Scholar] [CrossRef]
- Mienert, J.; Vanneste, M.; Bünz, S.; Andreassen, K.; Haflidason, H.; Sejrup, H.P. Ocean warming and gas hydrate stability on the mid-Norwegian margin at the Storegga Slide. Mar. Petrol. Geol. 2005, 22, 233–244. [Google Scholar] [CrossRef]
- Westbrook, G.K.; Thatcher, K.E.; Rohling, E.J.; Piotrowski, A.M.; Pälike, H.; Osborne, A.H.; Hühnerbach, V. Escape of methane gas from the seabed along the West Spitsbergen continental margin. Geophys. Res. Lett. 2009, 36. [Google Scholar] [CrossRef] [Green Version]
- Plaza-Faverola, A.; Bünz, S.; Mienert, J. Fluid distributions inferred from P-wave velocity and reflection seismic amplitude anomalies beneath the Nyegga pockmark field of the mid-Norwegian margin. Mar. Petrol. Geol. 2010, 27, 46–60. [Google Scholar] [CrossRef]
- Tinivella, U.; Giustiniani, M.; Accettella, D. BSR versus climate change and slides. J. Geol. Res. 2011. [Google Scholar] [CrossRef]
- Thatcher, K.E.; Westbrook, G.K.; Sarkar, S.; Minshull, T.A. Methane release from warming-induced hydrate dissociation in the West Svalbard continental margin: Timing, rates, and geological controls. J. Geophys. Res. Solid Earth 2013, 118, 22–38. [Google Scholar] [CrossRef] [Green Version]
- Kretschmer, K.; Biastoch, A.; Rüpke, L.; Burwicz, E. Modeling the fate of methane hydrates under global warming. Glob. Biogeochem. Cycles 2015, 29, 610–625. [Google Scholar] [CrossRef] [Green Version]
- Hong, W.L.; Torres, M.E.; Carroll, J.; Crémière, A.; Panieri, G.; Yao, H.; Serov, P. Seepage from an arctic shallow marine gas hydrate reservoir is insensitive to momentary ocean warming. Nat. Commun. 2017, 8, 15745. [Google Scholar] [CrossRef] [PubMed] [Green Version]
- Olu, K.; Lance, S.; Sibuet, M.; Henry, P.; Fiala-Médioni, A.; Dinet, A. Cold seep communities as indicators of fluid expulsion patterns through mud volcanoes seaward of the Barbados accretionary prism. Deep Sea Res. Part I Oceanogr. Res. Pap. 1997, 44, 811–841. [Google Scholar] [CrossRef]
- Milkov, A.V. Worldwide distribution of submarine mud volcanoes and associated gas hydrates. Mar. Geol. 2000, 167, 29–42. [Google Scholar] [CrossRef]
- Boetius, A.; Suess, E. Hydrate Ridge: A natural laboratory for the study of microbial life fueled by methane from near-surface gas hydrates. Chem. Geol. 2004, 205, 291–310. [Google Scholar] [CrossRef]
- Heeschen, K.U.; Collier, R.W.; de Angelis, M.A.; Suess, E.; Rehder, G.; Linke, P.; Klinkhammer, G.P. Methane sources, distributions, and fluxes from cold vent sites at Hydrate Ridge, Cascadia. Margin. Glob. Biogeochem. Cycles 2005, 19, GB2016. [Google Scholar] [CrossRef]
- Scalabrin, C.; Dupré, S. Water Column Acoustics: Remote Detection of Gas Seeps. In Gas Hydrates 2: Geoscience Issues and Potential Industrial Applications; Ruffine, L., Broseta, D., Desmedt, A., Eds.; Wiley-ISTE: London, UK, 2018; pp. 11–20. [Google Scholar]
- Melnick, D.; Echtler, H.P. Inversion of forearc basins in south central Chile caused by rapid glacial age trench fill. Geology 2006, 34, 709–712. [Google Scholar] [CrossRef]
- Melnick, D.; Bookhagen, B.; Echtler, H.; Strecker, M. Coastal deformation and great subduction earthquakes, Isla Santa Maria, Chile (37°S). Geol. Soc. Am. Bull. 2006, 118, 1463–1480. [Google Scholar] [CrossRef]
- Jessen, G.L.; Pantoja, S.; Gutierrez, M.A.; Quinones, R.A.; Gonzalez, R.R.; Sellanes, J.; Hinrichs, K.U. Methane in shallow cold seeps at Mocha Island off central Chile. Cont. Shelf Res. 2011, 31, 574–581. [Google Scholar] [CrossRef]
- Sellanes, J.; Zapata-Hernández, G.; Pantoja, S.; Jessen, G.L. Chemosynthetic trophic support for the benthic community at an intertidal cold seep site at Mocha Island off central Chile. Estuar. Coast. Shelf Sci. 2011, 95, 431–439. [Google Scholar] [CrossRef]
- Stuardo, J.; Valdovinos, C. A new bathyal Calyptogena from the coast of central Chile (Bivalvia: Vesicomyidae). Venus 1988, 47, 241–250. [Google Scholar]
- Tinivella, U.; Loreto, M.F.; Accaino, F. Regional versus detailed velocity analysis to quantify hydrate and free gas in marine sediments: The South Shetland Margin case study. Geol. Soc. London Spec. Publ. 2009, 319, 103–119. [Google Scholar] [CrossRef]
- Cohen, J.K.; Stockwell, J.W. CWP/SU: Seismic Unix Release 4.0: A Free Package for Seismic Research and Processing; Center for Wave Phenomena, Colorado School of Mines: Golden, CO, USA, 2008; pp. 1–153. [Google Scholar]
- Liu, Z.; Bleistein, N. Migration velocity analysis: Theory and an iterative algorithm. Geophysics 1995, 60, 142–153. [Google Scholar] [CrossRef]
- Yilmaz, Ö. Seismic Data Analysis: Processing, Inversion and Interpretation of Seismic Data, 2nd ed.; Society of Exploration Geophysicists: Oklahoma, OK, USA, 2001; p. 2027. [Google Scholar]
- Grevemeyer, I.; Diaz–Naveaz, J.L.; Ranero, C.R.; Villenger, H.W. Ocean Drilling Program Scientific Party. Heat Flow over the descending Nazca plate in Central Chile, 32° S to 41° S: Observations from ODP Leg 202 and the occurrence of natural gas hydrates. Earth Planet. Sci. Lett. 2003, 213, 285–298. [Google Scholar] [CrossRef]
- Grevemeyer, I.; Villinger, H. Gas hydrate stability and the assessment of heat flow through continental margins. Geophys. J. Int. 2001, 145, 647–660. [Google Scholar] [CrossRef] [Green Version]
- Dickens, G.R.; Quinby-Hunt, M.S. Methane hydrate stability in seawater. Geophys. Res. Lett. 1994, 21, 2115–2118. [Google Scholar] [CrossRef]
- Chand, S.; Minshull, T.A.; Gei, D.; Carcione, J.M. Elastic velocity models for gas hydrate bearing sediments a comparison. Geophys. J. Int. 2004, 159, 573–590. [Google Scholar] [CrossRef]
- Tinivella, U. The seismic response to overpressure versus gas 638 hydrate and free gas concentration. J. Seism. Explor. 2002, 11, 283–305. [Google Scholar]
- Tinivella, U.; Carcione, J.M. Estimation of gas hydrate concentration and free gas saturation from log and seismic data. Lead. Edge 2001, 20, 200–203. [Google Scholar] [CrossRef]
- Hamilton, E.L. Sound velocity gradients in marine sediments. J. Acoust. Soc. Am. 1979, 65, 909–922. [Google Scholar] [CrossRef]
- Tinivella, U. A method for estimating gas hydrate and free gas concentrations in marine sediments. Boll. Geofis. Teor. Appl. 1999, 40, 19–30. [Google Scholar]
- Hyndman, R.D.; Spence, G.D. A seismic study of methane hydrate marine bottom simulating reflectors. J. Geophys. Res. 1992, 97, 6683–6698. [Google Scholar] [CrossRef]
- Hovland, M.; Gallagher, J.W.; Clennell, M.B.; Lekvam, K. Gas hydrate and free gas volumes in marine sediments: Example from the Niger Delta front. Mar. Petrol. Geol. 1997, 14, 245–255. [Google Scholar] [CrossRef]
- Inks, T.L.; Lee, M.W.; Agena, W.F.; Taylor, D.J.; Collett, T.S.; Hunter, T.; Zyrianova, M.V.; Hunter, R.B. Seismic prospecting for gas hydrate and associated free gas prospects in the Milne Point area of northern Alaska. In Natural Gas Hydrates—Energy Resource Potential and Associated Hazards; Collett, T., Johnson, A., Knapp, C., Boswell, R., Eds.; AAPG Memoir: Tulsa, OK, USA, 2009; Volume 89. [Google Scholar]
- Loreto, M.F.; Tinivella, U. Gas hydrate versus geological features: The South Shetland case study. Mar. Pet. Geol. 2012, 36, 164–171. [Google Scholar] [CrossRef]
- Boswell, R.; Rose, K.; Collett, T.S.; Lee, M.; Winters, W.; Lewis, K.A.; Agena, W. Geologic controls on gas hydrate occurrence in the Mount Elbert prospect, Alaska North Slope. Mar. Petrol. Geol. 2011, 28, 589–607. [Google Scholar] [CrossRef] [Green Version]
- Haberland, C.; Rietbrock, A.; Lange, D.; Bataille, K.; Dahm, T. Structure of the seismogenic zone of the south central Chilean margin revealed by local earthquake traveltime tomography. J. Geophys. Res. Solid Earth 2009, 114. [Google Scholar] [CrossRef]
- Geersen, J.; Voelker, D.; Behrmann, J.H.; Reichert, C.; Krastel, S. Pleistocene giant slope failures offshore Arauco Peninsula, Southern Chile. J. Geol. Soc. 2011, 168, 1237–1248. [Google Scholar] [CrossRef]
- Contreras-Reyes, E.; Carrizo, D. Control of high oceanic features and subduction channel on earthquake ruptures along the Chile–Peru subduction zone. Phys. Earth Planet. Inter. 2011, 186, 49–58. [Google Scholar] [CrossRef]
- Lin, Y.N.N.; Sladen, A.; Ortega-Culaciati, F.; Simons, M.; Avouac, J.P.; Fielding, E.J.; Vigny, C. Coseismic and postseismic slip associated with the 2010 Maule Earthquake, Chile: Characterizing the Arauco Peninsula barrier effect. J. Geophys. Res. Solid Earth 2013, 118, 3142–3159. [Google Scholar] [CrossRef] [Green Version]
- Ruiz, S.; Madariaga, R. Historical and recent large megathrust earthquakes in Chile. Tectonophysics 2018, 733, 37–56. [Google Scholar] [CrossRef]
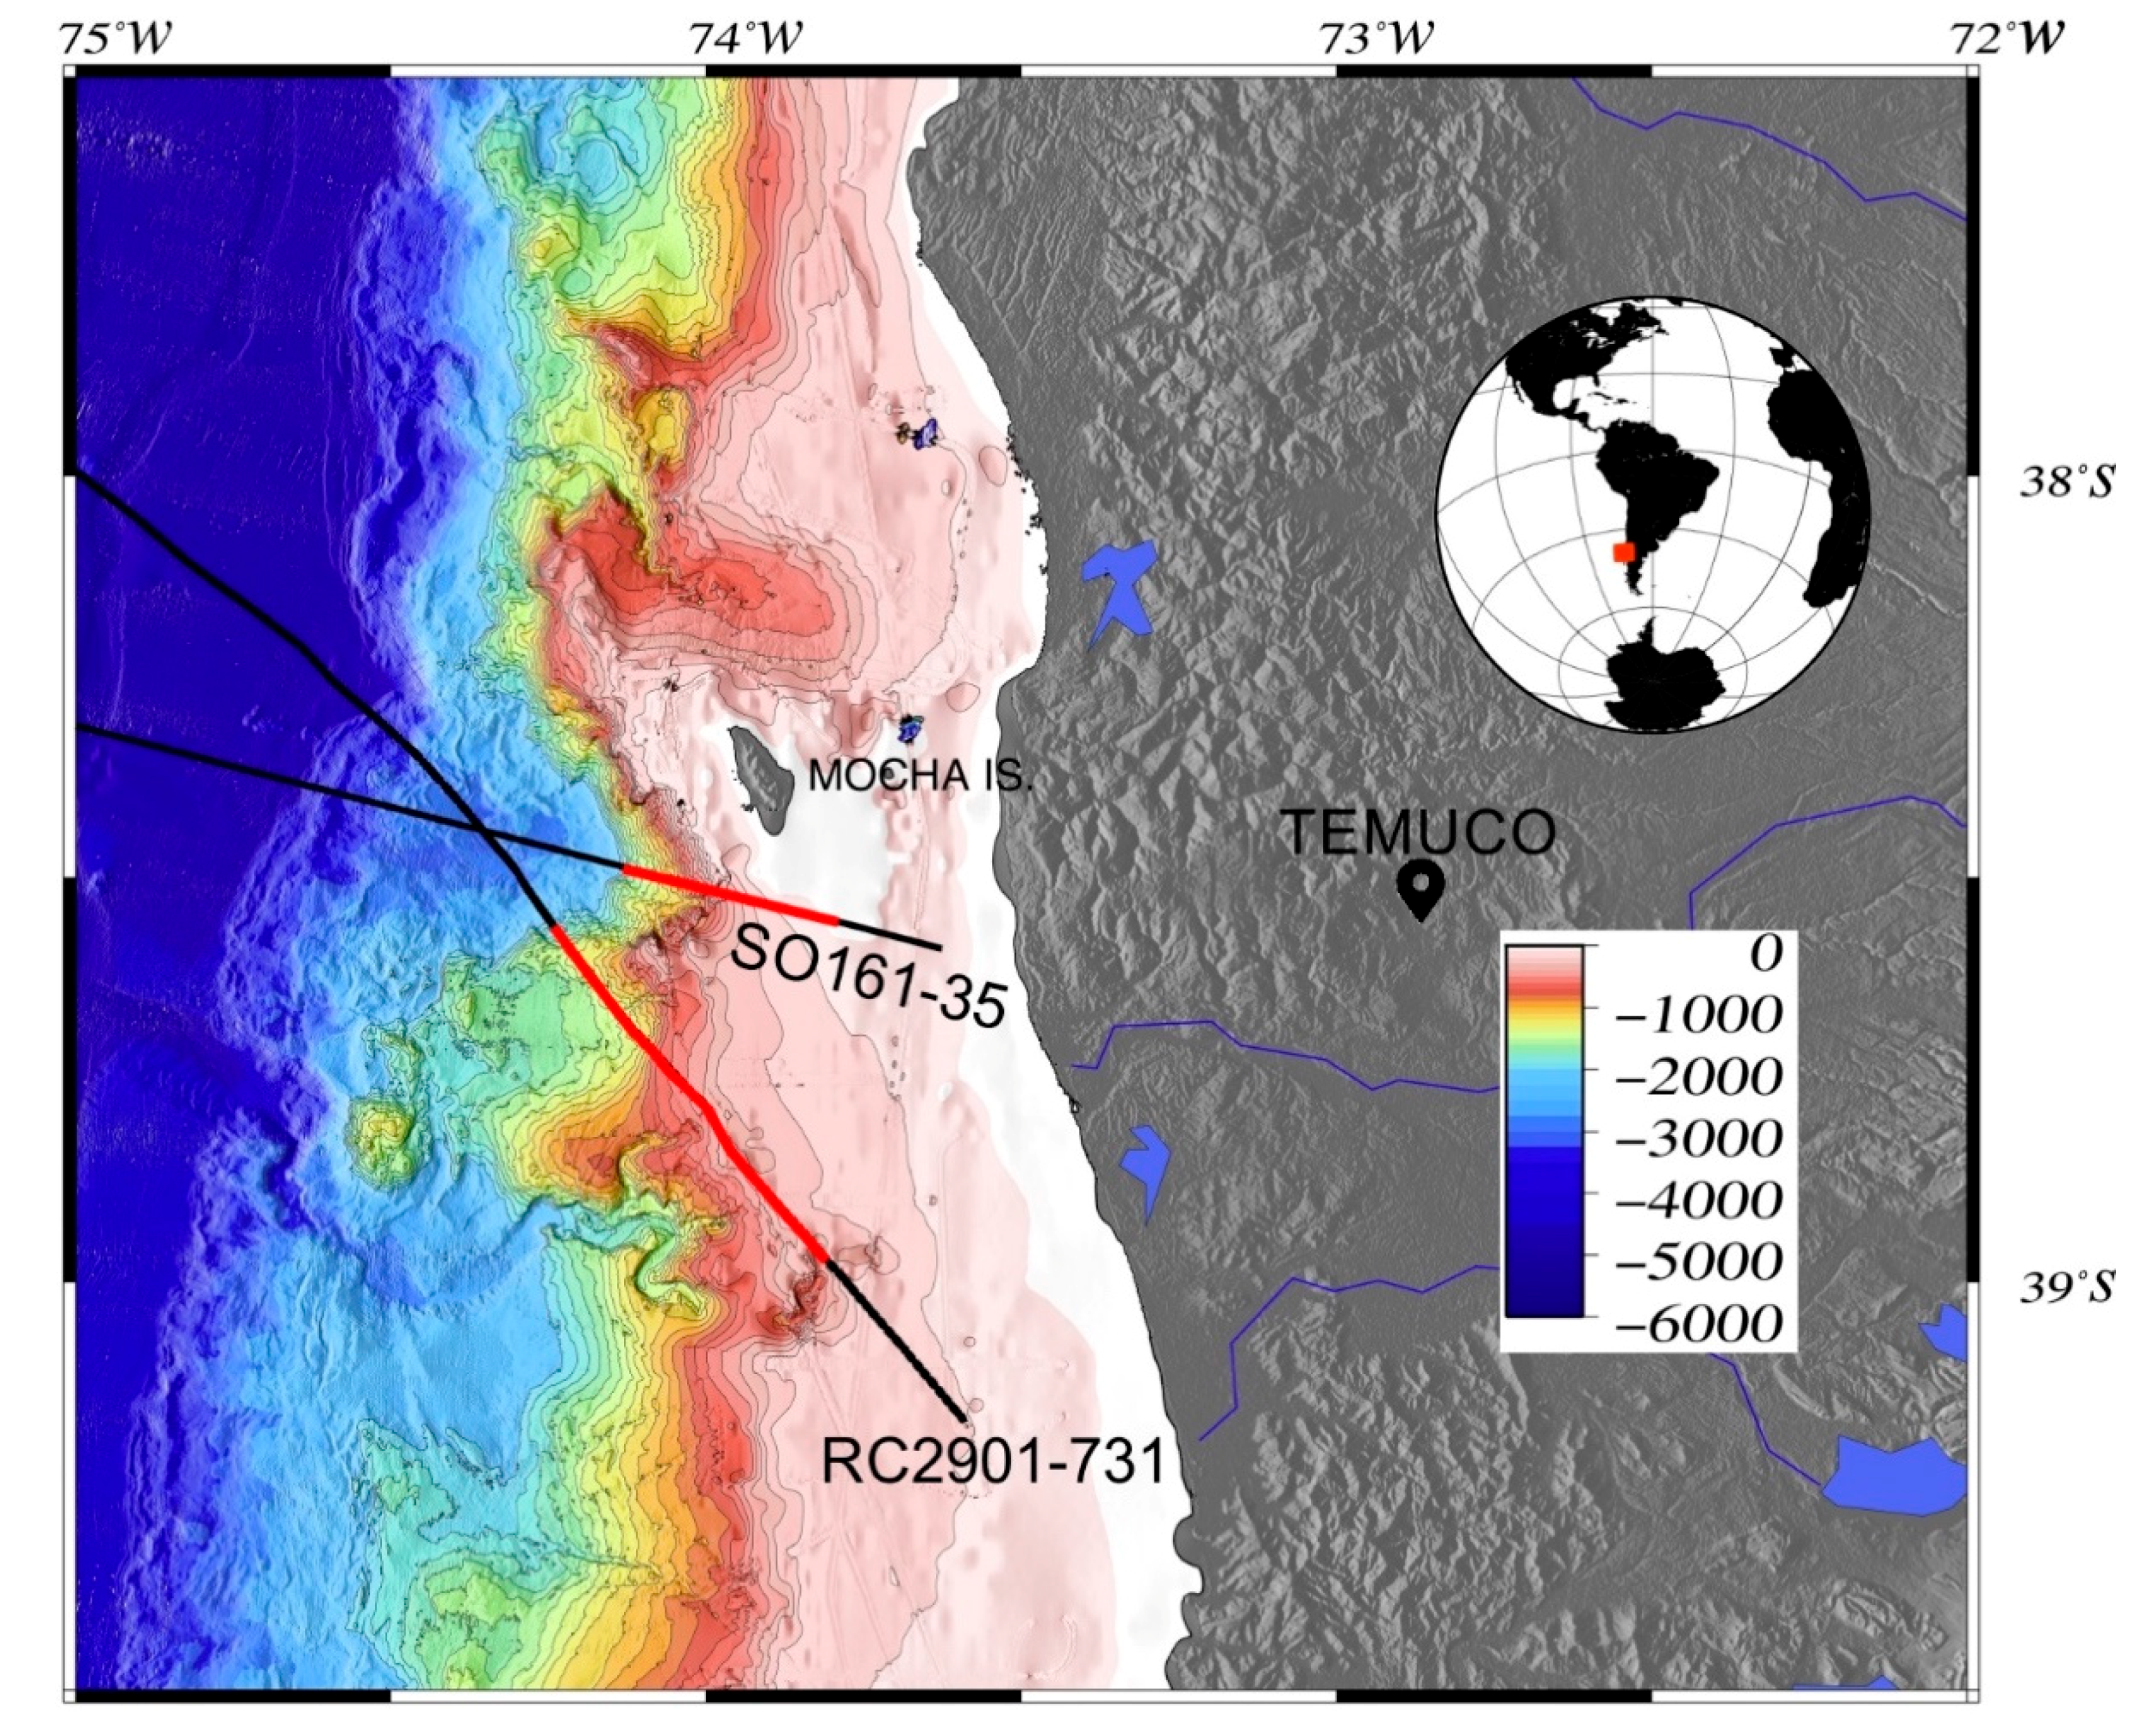
Figure 1.
Location map. Red lines indicate the parts of the seismic sections analysed in this study.
Figure 1.
Location map. Red lines indicate the parts of the seismic sections analysed in this study.

Figure 2.
Pre-stack depth sections with superimposed velocity models. In (a) SO161–35 seismic section; and (b) RC2901–731 seismic section. Black boxes indicated with numbers show the blow-ups.
Figure 2.
Pre-stack depth sections with superimposed velocity models. In (a) SO161–35 seismic section; and (b) RC2901–731 seismic section. Black boxes indicated with numbers show the blow-ups.

Figure 3.
Line drawing sections with superimposed gas-phase (gas hydrate and free gas) concentration models. In (a) gas hydrate and (b) free gas concentration profiles for SO161-35 seismic profile, (c) SO161-35 gas-phase concentration model with superimposed line drawing, (d) gas hydrate and (e) free gas concentration profiles for RC2901–731 seismic profile, (f) RC2901-731 gas-phase concentration model with superimposed line drawing. Above all sections are reported gas hydrate (black diamonds) and free gas (blue diamonds) concentration values. Dashed black and blue lines show average values.

Figure 4.
Estimated geothermal gradients. In (a) geothermal gradient for SO161–35 seismic profile; and (b) geothermal gradient for RC2901–731 seismic profile.
Figure 4.
Estimated geothermal gradients. In (a) geothermal gradient for SO161–35 seismic profile; and (b) geothermal gradient for RC2901–731 seismic profile.
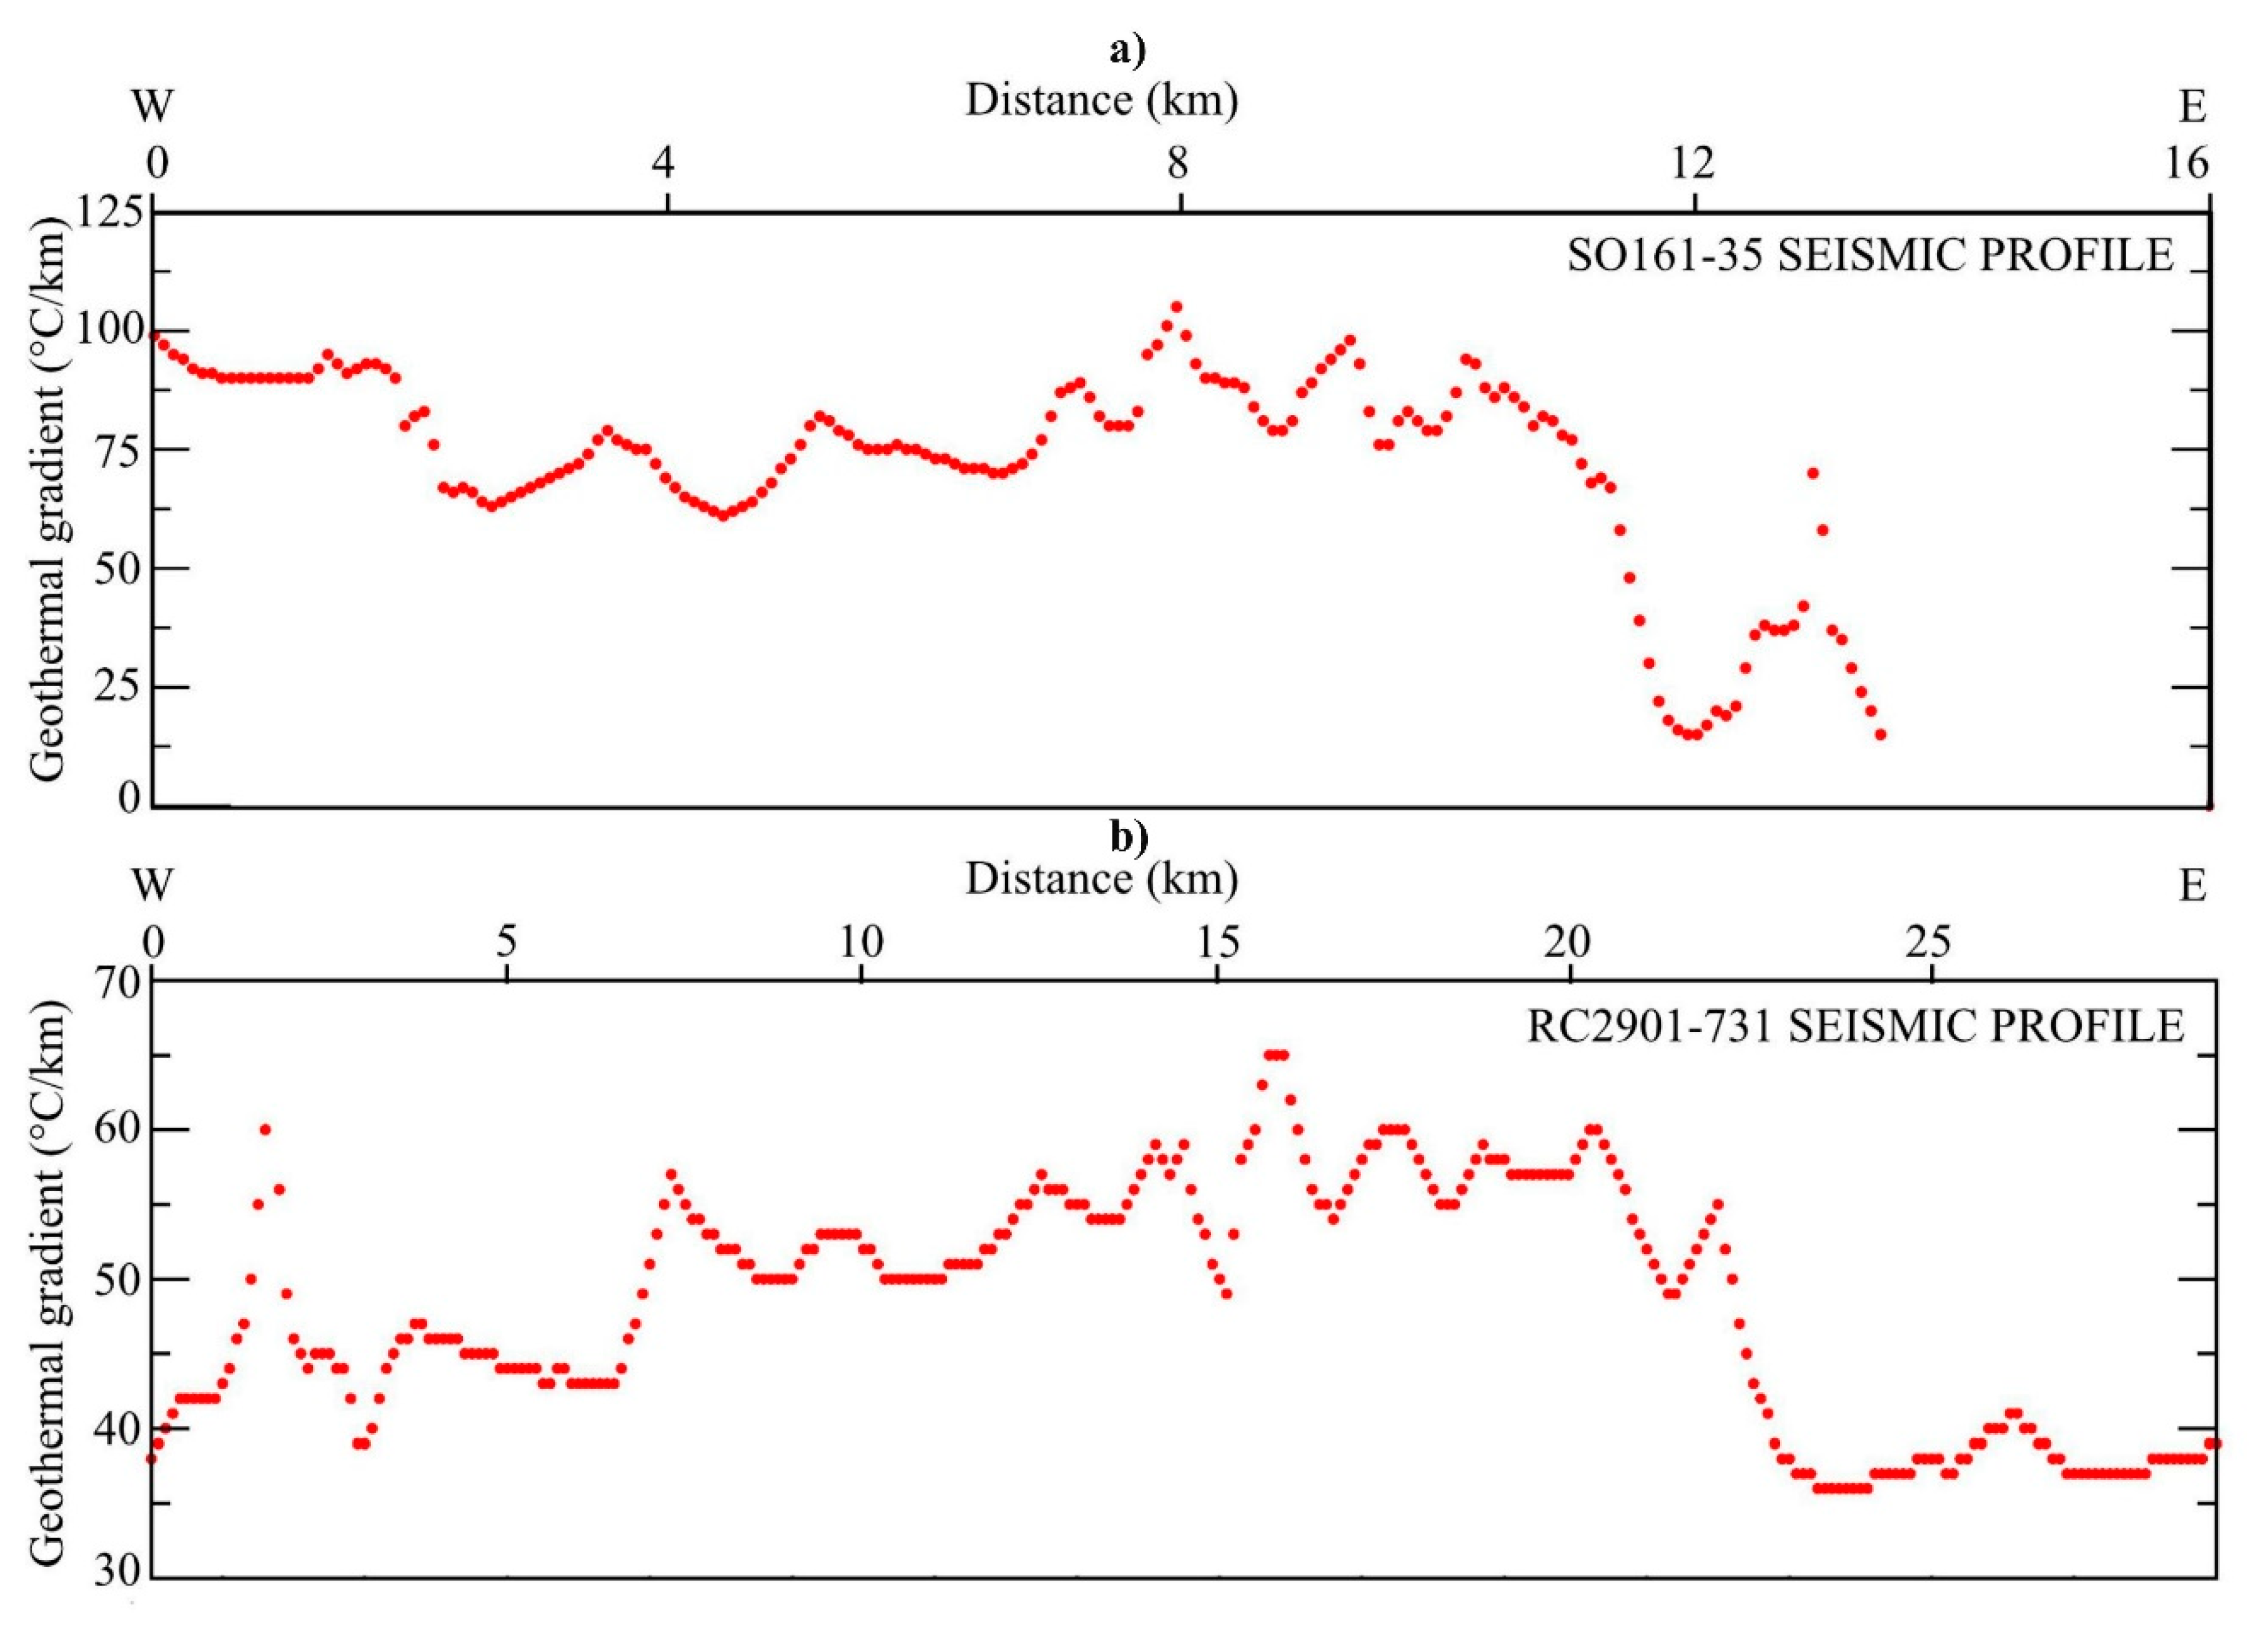
Figure 5.
Schematic diagram of SO161–35 seismic profile located close to 38°30′ S (see Figure 1), explaining fluid migration processes close to the Mocha Island. Faults are reported by Berndt et al. [17], Horozal et al. [18]. Dashed line shows part of the ancient sliding reported by Geersen et al. [60].


Table 1.
Seismic acquisition parameters.
| Seismic Lines | Research Vessel | Long Streamer | Channels | Intertrace | Shot Spacing | Airguns/Total Volume |
|---|---|---|---|---|---|---|
| RC2901–731 | RV/Conrad | 3000 m | 240 | 12.5 m | 50 m | 10/61.3 L |
| SO161–35 | RV/Sonne | 3000 m | 25 108 | 12.5 m 25 m | 50 m | 20/54.1 L |
Table 2.
Layer iteration numbers.
| RC2901–731 Seismic Section | SO161–35 Seismic Section | ||
|---|---|---|---|
| Layers | Iterations | Layers | Iterations |
| Seawater | 3 | Seawater | 4 |
| From SF to H1 | 5 | From SF to BSR | 15 |
| From H1 to BSR | 18 | Free gas | 10 |
| Free gas | 4 | - | - |
© 2018 by the authors. Licensee MDPI, Basel, Switzerland. This article is an open access article distributed under the terms and conditions of the Creative Commons Attribution (CC BY) license (http://creativecommons.org/licenses/by/4.0/).
Share and Cite
MDPI and ACS Style
Vargas-Cordero, I.; Tinivella, U.; Villar-Muñoz, L.; Bento, J.P. High Gas Hydrate and Free Gas Concentrations: An Explanation for Seeps Offshore South Mocha Island. Energies 2018, 11, 3062. https://doi.org/10.3390/en11113062
AMA Style
Vargas-Cordero I, Tinivella U, Villar-Muñoz L, Bento JP. High Gas Hydrate and Free Gas Concentrations: An Explanation for Seeps Offshore South Mocha Island. Energies. 2018; 11(11):3062. https://doi.org/10.3390/en11113062
Chicago/Turabian StyleVargas-Cordero, Iván, Umberta Tinivella, Lucía Villar-Muñoz, and Joaquim P. Bento. 2018. "High Gas Hydrate and Free Gas Concentrations: An Explanation for Seeps Offshore South Mocha Island" Energies 11, no. 11: 3062. https://doi.org/10.3390/en11113062
Note that from the first issue of 2016, this journal uses article numbers instead of page numbers. See further details here.