Distribution System Operation with Electric Vehicle Charging Schedules and Renewable Energy Resources
by
 , , and
Gerardo J. Osório
1 ,
,
Miadreza Shafie-khah
2,
Pedro D. L. Coimbra
3,
Mohamed Lotfi
2,3 and
and
João P. S. Catalão
1,2,3,4,* 1
C-MAST, University of Beira Interior, 6201-001 Covilhã, Portugal
2
INESC TEC, 4200-465 Porto, Portugal
3
Faculty of Engineering, University of Porto, 4200-465 Porto, Portugal
4
INESC-ID, Instituto Superior Técnico, University of Lisbon, 1049-001 Lisbon, Portugal
*
Author to whom correspondence should be addressed.
Energies 2018, 11(11), 3117; https://doi.org/10.3390/en11113117
Submission received: 26 October 2018
/
Revised: 4 November 2018
/
Accepted: 5 November 2018
/
Published: 11 November 2018
(This article belongs to the Special Issue Distribution System Operation and Control)
Abstract
:Electric vehicles (EVs) promote many advantages for distribution systems such as increasing efficiency and reliability, decreasing dependence on non-endogenous resources, and reducing pollutant emissions. Due to increased proliferation of EVs and their integration in power systems, management and operation of distribution systems (ODS) is becoming more important. Recent studies have shown that EV can increase power grid flexibility since EV owners do not use them for 93–96% of the daytime. Therefore, it is important to exploit parking time, during which EVs can act either as a load or distributed storage device, to maximize the benefit for the power system. Following a survey of the current state-of-the-art, this work studies the impact of EV charging on the load profile. Since renewable energy resources (RES) play a critical role in future distribution systems the current case study considered the presence of RES and their stochastic nature has been modeled. The study proceeds with analyzing EV owners’ driving habits, enabling prediction of the network load profile. The impact of: EV charging modes (i.e., controlled and uncontrolled charging), magnitude of wind and photovoltaic (PV) generation, number of EVs (penetration), and driving patterns on the ODS is analyzed.
1. Introduction
Renewable energy resources (RES) have attracted special attention with their proliferation in distribution networks due to political, economic, and environmental aspects. Some are related to policies to reduce pollutant gas emissions which contribute to climate change, awareness of limited fossil fuel reserves, and the inexhaustible nature of RES such as the sun or wind.
An example of global efforts is the European Union setting targets for 2020 and for the period of 2020–2030, with the aim of increasing energy efficiency and promoting the use of RES to up to 20% of total energy consumption. This leads to an impact on the global energy mix due to the replacement (or discontinuation) of conventional systems by less polluting ones, promoting sustainability [1].
In-line with this perspective, and contrary to the early pessimistic analysis of the impact of electric vehicles (EVs) on grid integration, EVs have great advantages compared to conventional vehicles. That is because, as with integration of RES in electrical networks, EVs guarantee a reduced environmental impact through the diminished dependence on non-endogenous resources and are an appealing solution in systems with a high level of RES penetration [2].
EVs connected to the grid improve electrical system stability due to their capability of providing a regulation service, or power reserve, by charging their batteries when wind power production is excessive, resulting in a consequent balance between production and consumption. In the future, when a large number of EVs is connected to the electrical grid, a mass charging schedule can be developed to load EVs during the hours with large wind power production [3].
EVs can also offer ancillary services, which include primary and secondary frequency control and voltage regulation. Primary control reduces frequency deviation while secondary control helps balance supply and demand in electrical power systems. The latter is very important in systems with high penetration of wind power. Voltage regulation can be performed through EV chargers [4,5].
Traditionally, distribution systems have been designed for radial and unidirectional energy flow, with voltage protection and regulation strategies developed accordingly. Regulators were designed assuming the flow of energy from high to low voltage. However, with the introduction of intermittent RES, the unidirectional distribution system changes to a bidirectional one which necessitates a change in the regulation process [6].
Integration of EVs in the electrical grids requires regulation and scheduling in order to manage daily load consumption profiles. A sudden bulk of unscheduled, unregulated, EV charging processes can have negative impacts on the power system by causing transmission congestion, and thus, increasing losses and decreasing quality of electricity supply. This deteriorates both grid services and EV batteries. Thus, proper management and prediction of EV charging scheduling processes should be carried out as an important element of smart grids [7,8].
Due to the features of EVs (and their owners’ behavior), they can operate as distributed generation elements with energy storage capabilities, providing more benefits to power systems. However, due to the limited capacity of EV batteries in comparison with the power system demand, EVs should be grouped into fleets to accumulate individual EV batteries as an aggregation with a larger storage capacity. In this way, the impacts on the electrical grid are minimized and the amount of noise in the system is reduced [9,10].
Traditionally, operation of electrical grids is performed with the use of deterministic models which have the advantages of easy application and evaluation. However, deterministic models do not explicitly analyze the underlying uncertainties (especially in low voltage networks), which can result in network augmented load prediction errors and disproportionate estimates for investments to be made. Hence, probabilistic models evaluate in more detail the foreseen investments in the grid, being more appropriate when the power system has a strong component of uncertainty due to energy resources such as EV which increase the load profile during peak hours [11].
Smart grids are the modern paradigm for sustainable use of energy in response to different components which have been introduced into distribution networks: RES, EV, energy storage systems and dispersed generation. One of the biggest advantages of smart grids is reduced peak demand, which can be achieved through incentives, new regulation mechanisms, and shifting of controllable loads. Within a smart grid (SG), the smart house concept enables users to manage energy consumption to follow variable electricity prices in order to minimize their energy costs. Users can also control their RES and storage systems, reducing some of the impacts resulting from EV and RES integration [12].
In recent years, several studies have been carried out on smart grids with EV integration, proposing several energy management systems which consider different types of EV charging and the charging time from the distribution system operator (DSO) point-of-view. Intelligent charging and vehicle-to-grid (V2G) charging are necessary to minimize electrical network costs when EVs are parked. Intelligent charging is a flexible charging mode which controls EV charging according to demand in order to avoid network failures, especially during rush and peak hours [13].
A model demonstrating the stochastic nature of an individual EV battery charging starting time and initial State-of-Charge (SoC) was developed in by the authors of [14]. Four scenarios of domestic charging were developed: uncontrolled, late-hour, smart, and controlled charging. The four scenarios take into account electricity market tariffs, demonstrating that smart charging is beneficial to both the DSO and the EV owner.
Another study [15] considered a real-life EV recharging area on a university campus. The performance of batteries versus local PV generation has been compared. The study took into consideration schedules of EV owners’ journeys and thereby the SoC upon returning to the recharge area. Locally generated electricity was shown to have a positive impact in terms of both CO2 emissions and grid peak load. In addition, the study shows the importance of considering the schedules and habits of EV users and their impact on the load profile.
In reference [16], a study was presented which addresses a set of infrastructures or network reinforcement solutions to reduce the impact of charging a large number of EVs into low-voltage (LV) networks. In order to solve problems related to violation of voltage level and equipment overload, a solution was proposed in which the network is divided in two and a new distribution transformer is installed and connected to the problematic part of the LV network. In this way, the transformers share the loads causing a positive impact on the magnitude of the voltage and on the minimization of the overload of the equipment involved, due to the lower current circulation. However, this solution is not always attractive depending on feeder topology. Also, it is still necessary to consider associated costs.
In reference [17], a structure for stochastic compensation of the electricity market in the presence of EVs (taking into account uncertainties and synchronous generators) was suggested. The energy market considered involves two steps. In the first, Monte Carlo simulation creates a set of random scenarios. In the second, stochastic market compensation is implemented as a series of deterministic optimization problems (scenarios), including the non-contingent scenario and different post-contingency states. The objective function was the total network cost, minimized for each scenario. In [18], an intelligent domestic operation was proposed that considers the bidirectional capacity of EVs and demand response (DR) strategies based on real-time pricing (RTP). Different tests were performed using a mixed integer linear programming (MILP) model to minimize the cost. Moreover, in [19], a local control charging (LCC) strategy was proposed to provide the maximum amount of power for EVs while keeping the electrical network within acceptable operating limits. The local control method allows for the charging of EVs to be programmed individually based on network conditions and EV SoC. The results were then compared with those of a central control charging (CCC) method in which a single controller manages the charging of all connected EVs simultaneously.
In reference [20] a prediction and analysis study of the different scenarios of EVs charging was carried out based on usage data (e.g., SoC, parking duration, parking type, and drivetrain). First, a deterministic simulation was performed considering EV driving time history, parking standards, daily distances traveled, and arrival/departure time from home. Then, the results were compared with three different stochastic methods that differ from one to the other in the type of treatment that was performed with respect to driving habits and type of charging. In reference [2], the intention was to investigate potential technical and benefits and environmental aspects of using a PV with a storage system located on the roof of a house in Ottawa, Canada, in the context of electric mobility. The residential PV system was combined with an EV charging system. Different scenarios were analyzed with different EV models and different SoCs. The studies had shown that PV systems are an efficient solution to power EVs and reduce pollutant emissions.
As stated in reference [21], many studies in the last year have addressed the advantages of microgrids, such as: the increasing flexibility, reliability, and efficiency of the system and helping to improve the quality of the power supplied.
Following the extensive state-of-the-art review, this work attempts to analyze the impact of un/controlled charging of EVs on the load profile. An analysis of EV owners’ driving habits is performed, enabling the prediction of the network load profile. Moreover, the effect of different factors on the functioning of the operation of distribution systems (ODS) is studied: (1) EV charging modes (i.e., controlled vs. uncontrolled), (2) wind speed, solar radiation, and PV size, and (3) number of functioning EVs (penetration). To perform those analyses, a stochastic objective problem is formulated in order to minimize the DSO operation cost considering a grid with conventional generation, together with wind, PV, and EVs. Due to the stochastic nature of RES, all stochastic parameters were modeled through a scenario consideration process.
2. Mathematical Formulation
In this section the proposed mathematical formulation to model the distribution grid is presented. Since the model is stochastic, problem constraints are differentiated into first and second stage equations. In the second stage, ten different scenarios of wind and PV production are considered, whereas in the first there is only one scenario of renewable production corresponding to the average of the ten scenarios. Moreover, a small network is considered including conventional generators, renewable production (wind and PV), and EVs (which only act as a load).
Wind and PV production, due to their stochastic nature, are modeled on scenarios that consider the uncertainties of wind flow and solar radiation. The goal is to minimize daily the network operational cost from the DSO perspective. The operational cost may vary according to policies and regulations that differ from one network to another. All subsequent mathematical formulations and constraints are represented in normalized, per unit (p.u.), values.
2.1. Objective Function
Equation (1) represents the objective function which is divided into two terms. In the first term, which corresponds to the first stage, the cost varies according to the price of production units as a function of time , the market compensation price , and the cost of regulation for the day-ahead market .
In the second term, corresponding to the second stage, the scenarios are considered which are a function of on an occurrence probability and the corresponding regulation prices from the real-time pricing .
2.2. First-Step Restrictions Stage
This section presents first stage constraints which are related to the day-ahead market rather than the renewable production scenarios which are not yet considered. The active power balance of the system is shown in Equation (2).
On the production side, PV , wind , and conventional units are included. On the consumption side, the load required to charge EVs is presented.
In Equation (3) the balance of the reactive power of the system is presented, including again the PV, wind, and non-renewable production, , , and , respectively.
Equations (4) and (5) represent network nodes voltage considering technical limits of the system.
Equations (6) and (7) represent active and reactive power linearization, respectively. Equations (8) and (9) represent the grid constraints.
Constraint Equation (10) represents the limits of active power for the whole system and constraints Equations (11) and (12) represent the reactive power limits. Moreover, Equation (13) limits the minimum and maximum power values of conventional generators and RES.
Equations (14) and (15) limit the minimum and maximum values of the squared voltage of the system, while Equation (16) expresses the network constraint in relation to the apparent power.
Equations (17)–(21) describe the SoC of the EV. In detail, Equation (17) refers to the percentage of EV charge when it arrives at the residence , after the battery has discharged throughout the day. The represents the maximum value of the SoC, is the distance traveled by EV in km, is the electric conduction efficiency in km/kWh a, and is the capacity of the battery in kWh.
Equation (18) corresponds to the percentage of EV charge when it leaves the residence after charging. To obtain this, the amount of energy that was transferred to the EV battery is added to the value of the previous hour SoC . The charge depends on the charging efficiency , in percent, of the charging power , in kW. The charging power is limited by the battery capacity of the EV and by the capacity of the power system.
When the EV arrives at the residence , the EV SoC corresponds to , as described in Equation (19), where corresponds to the arrival time.
Equations (20) and (21) limit the minimum and maximum values of the EV battery SoC on arrival and departure .
2.3. Second-Step Restrictions Stage
This section presents the second stage constraints in which the different RES scenarios are considered and are related to the real-time pricing market. Equation (22) represents the power flow equation related to the active power balance of the second stage which depends on: the regulation of the real-time market ; the flow of the active power upstream and downstream in the first and second stages, respectively; the wind and PV power generated, for the corresponding scenario, , and , respectively. This balance constraint must be satisfied in order to guarantee production, dispatch in each scenario, and the system security.
Similarly, Equation (23) represents the reactive power balance in the second stage , which depends on: the first and second stage of the reactive power flow shown in the upstream and downstream directions and , respectively; the wind and PV power generated, for the corresponding scenario, and , respectively.
In Equations (24) and (25) the node voltages for the second stage are represented.
The linearization expressions for the second stage are shown for the active power (Equation (26)) and reactive power (Equation (27)).
Equations (28) and (29) represent the network constraints.
Constraint Equation (30) represents the active power limits in the second stage for the whole system, and constraint Equations (31) and (32) represent the limits of the reactive power in the second stage.
Equation (33) limits the minimum and maximum values of the squared voltage of the system in the second stage.
3. Numerical Study and Results
3.1. Numerical Study
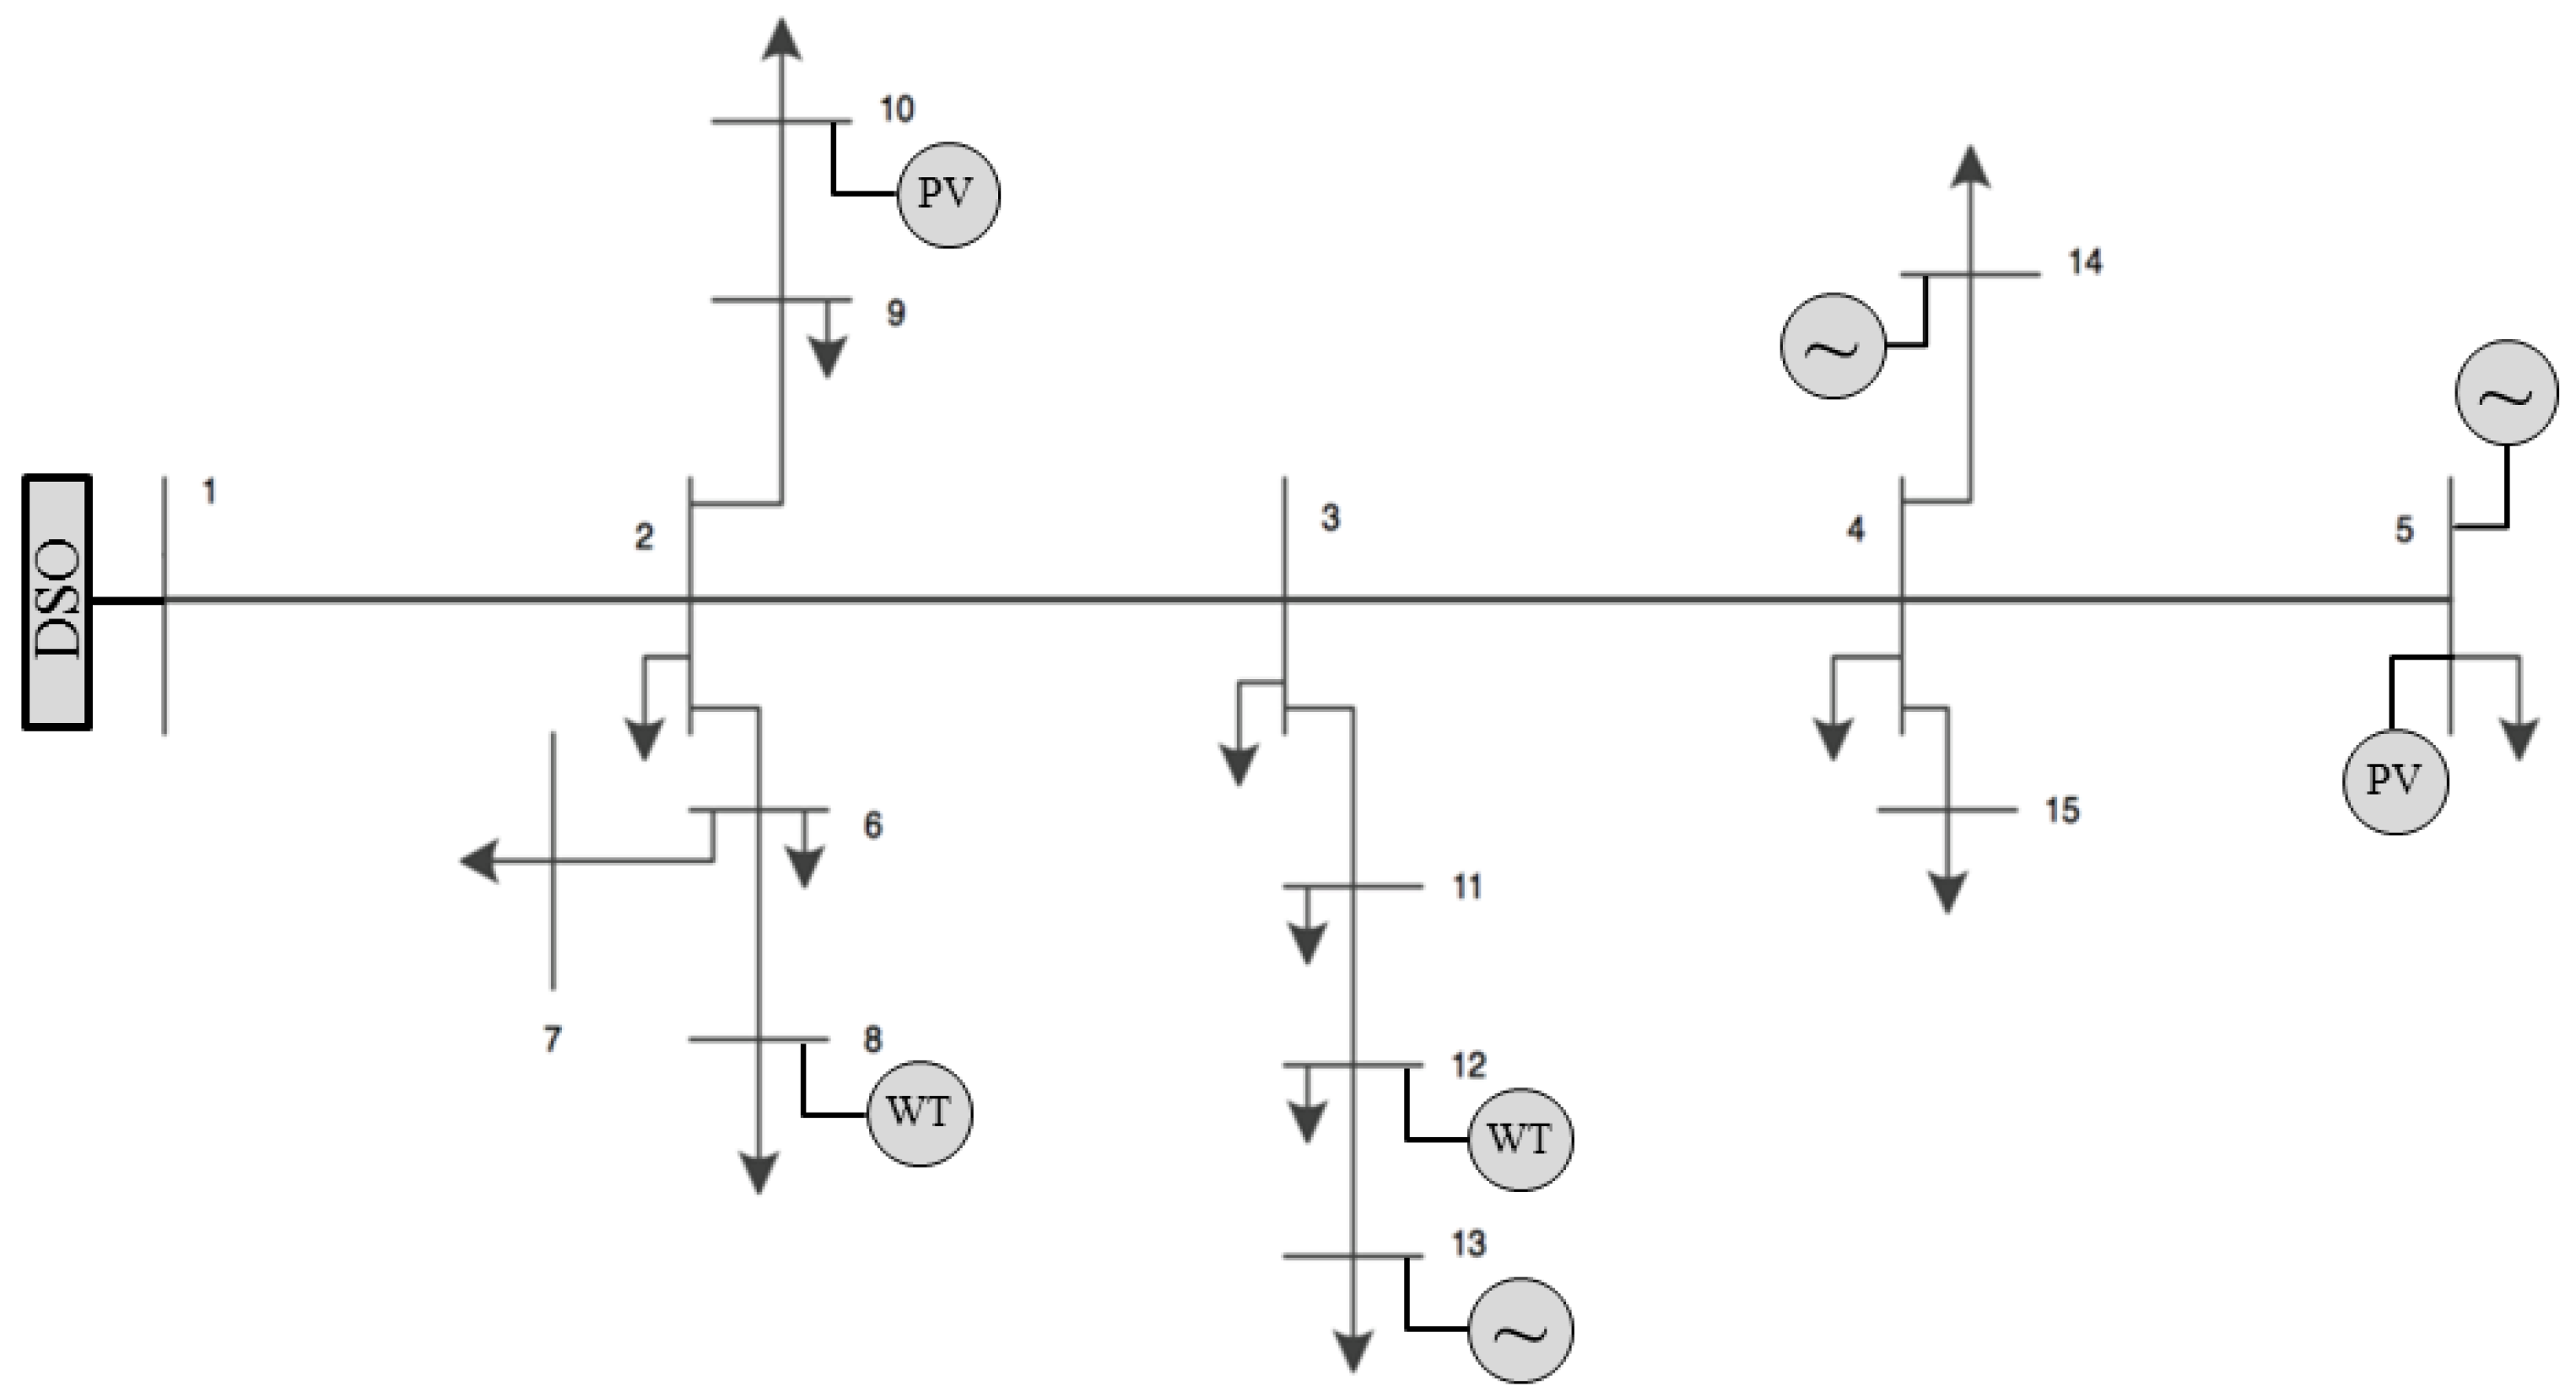
The proposed model was implemented in the General Algebraic Modeling System (GAMS) [22], using the CPLEX MILP solver. The network used for this analysis (shown in Figure 1) is composed of 15 buses and includes renewable and non-renewable production. Buses 5, 13, and 14 are each connected to conventional generators and their minimum and maximum values are presented in Table 1.
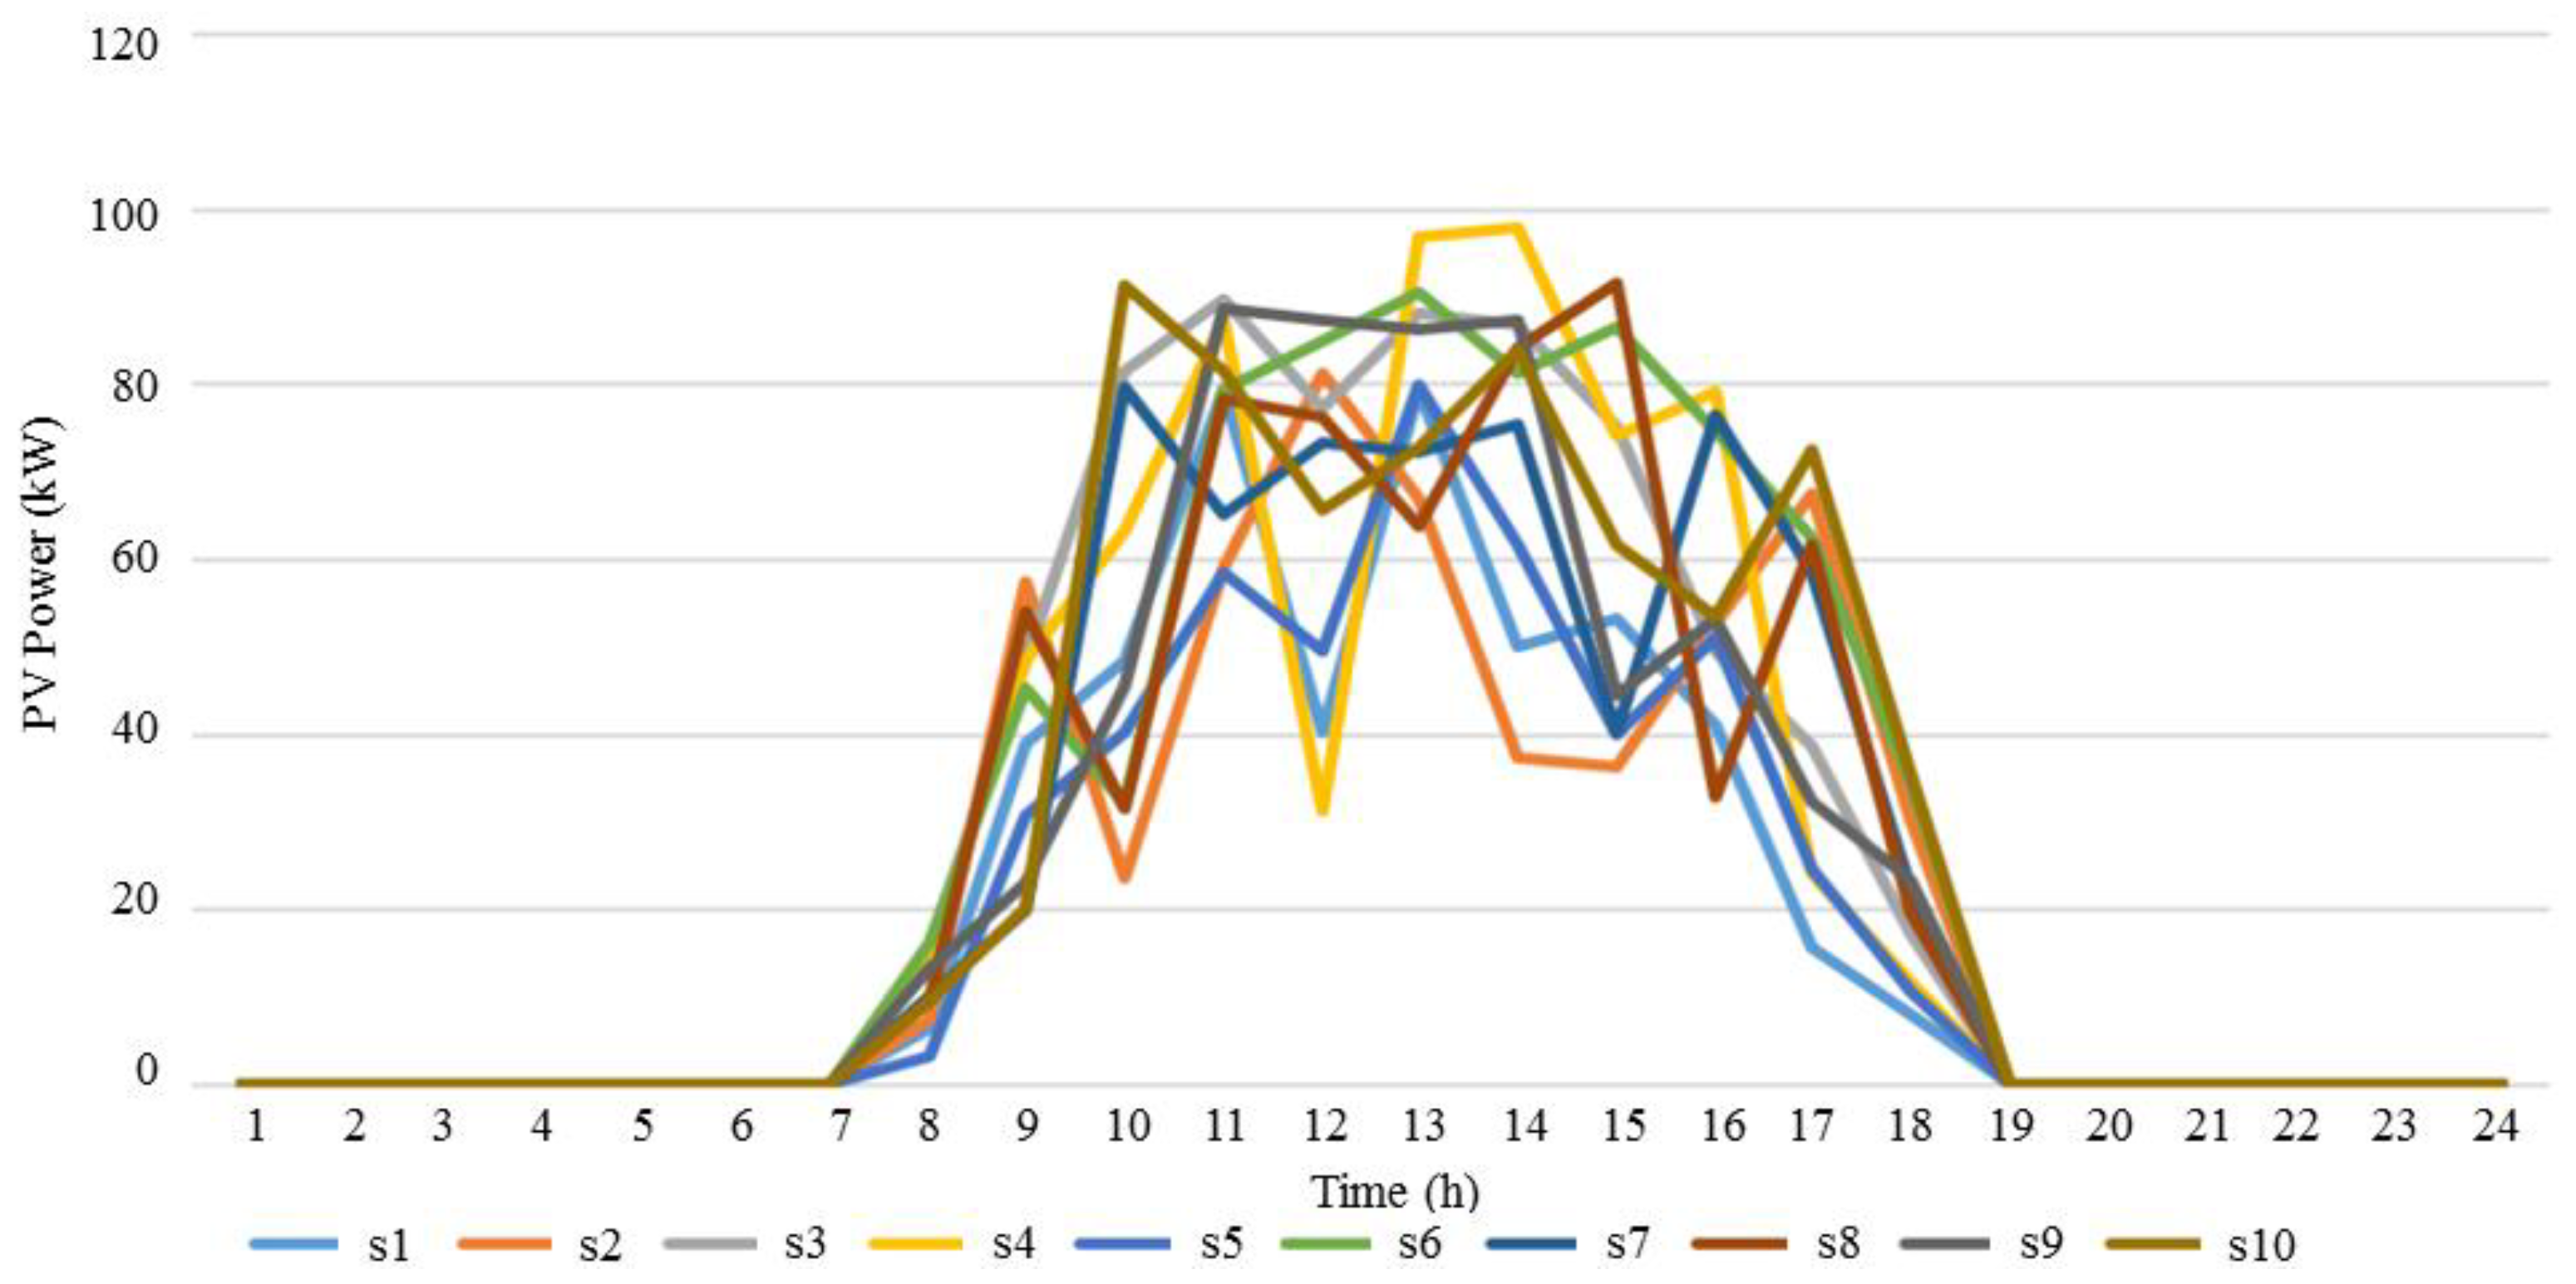
Two wind farms are connected to buses 8 and 12 and two PV units to buses 5 and 10. In order to model wind production, a Weibull distribution for the wind speed was assumed in order to obtain the corresponding wind power through which 10 different scenarios were extracted corresponding to production on different days. Similarly, 10 different PV production scenarios were defined in order to have a more realistic model. Wind and PV production scenarios are detailed in Figure 2 and Figure 3, respectively.
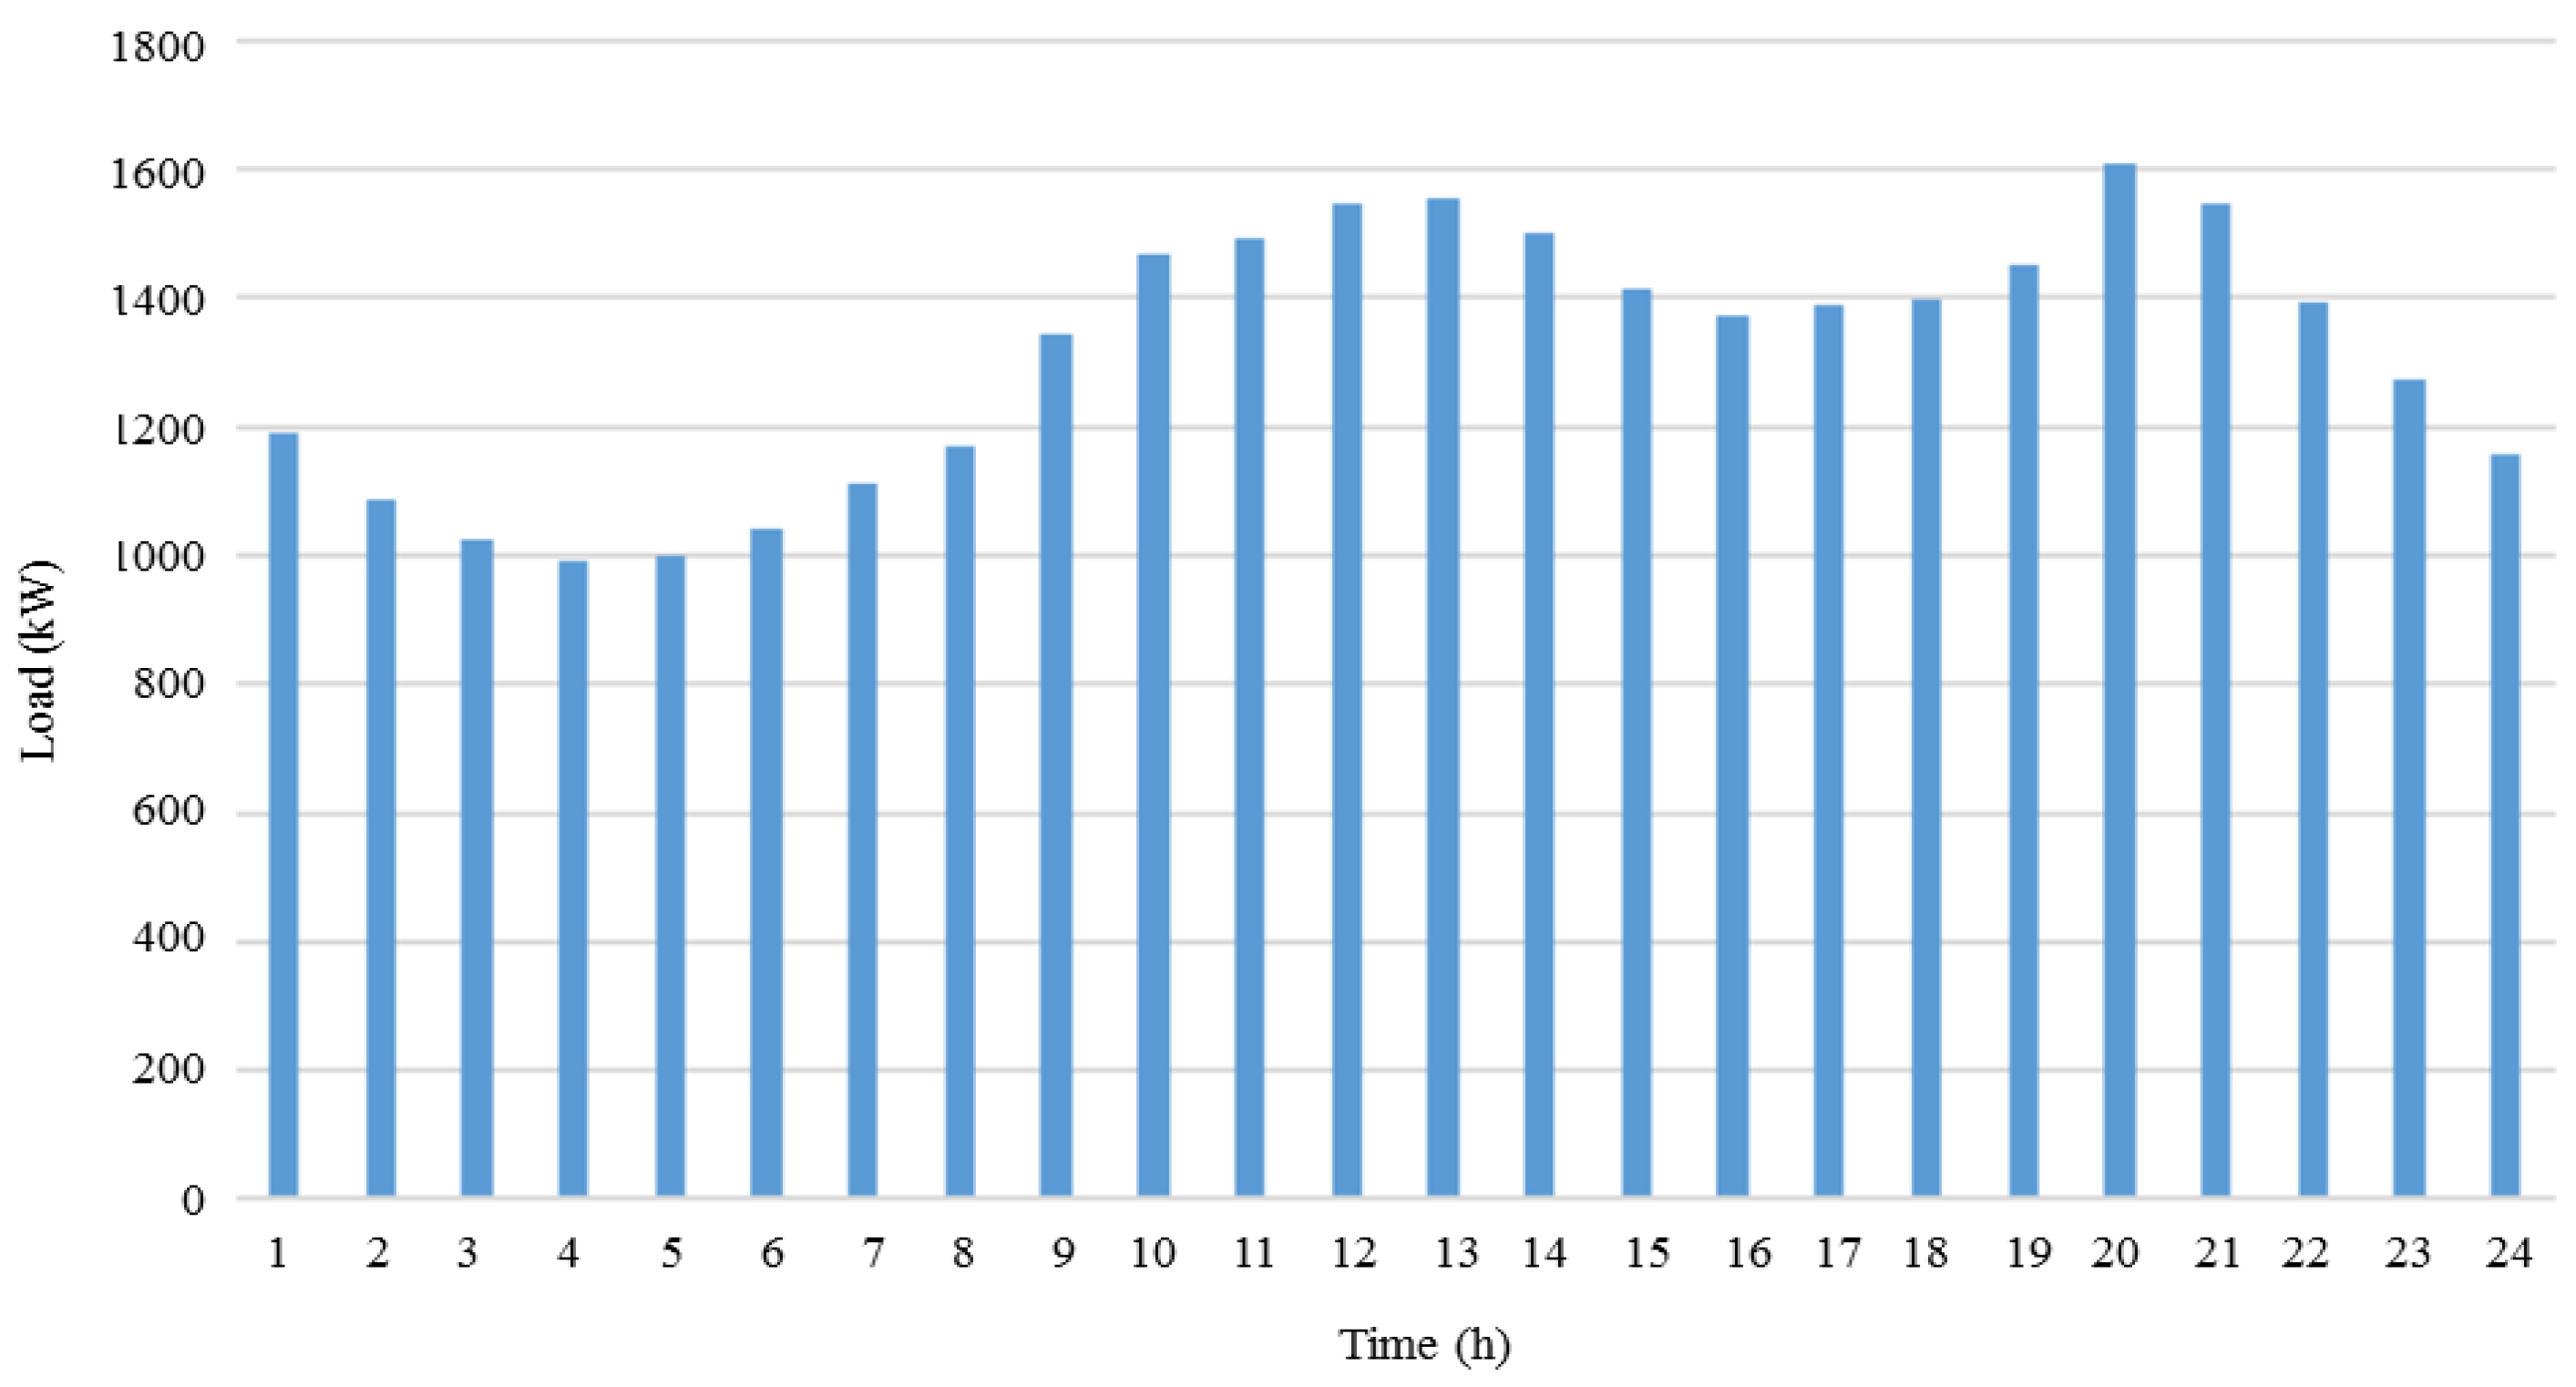
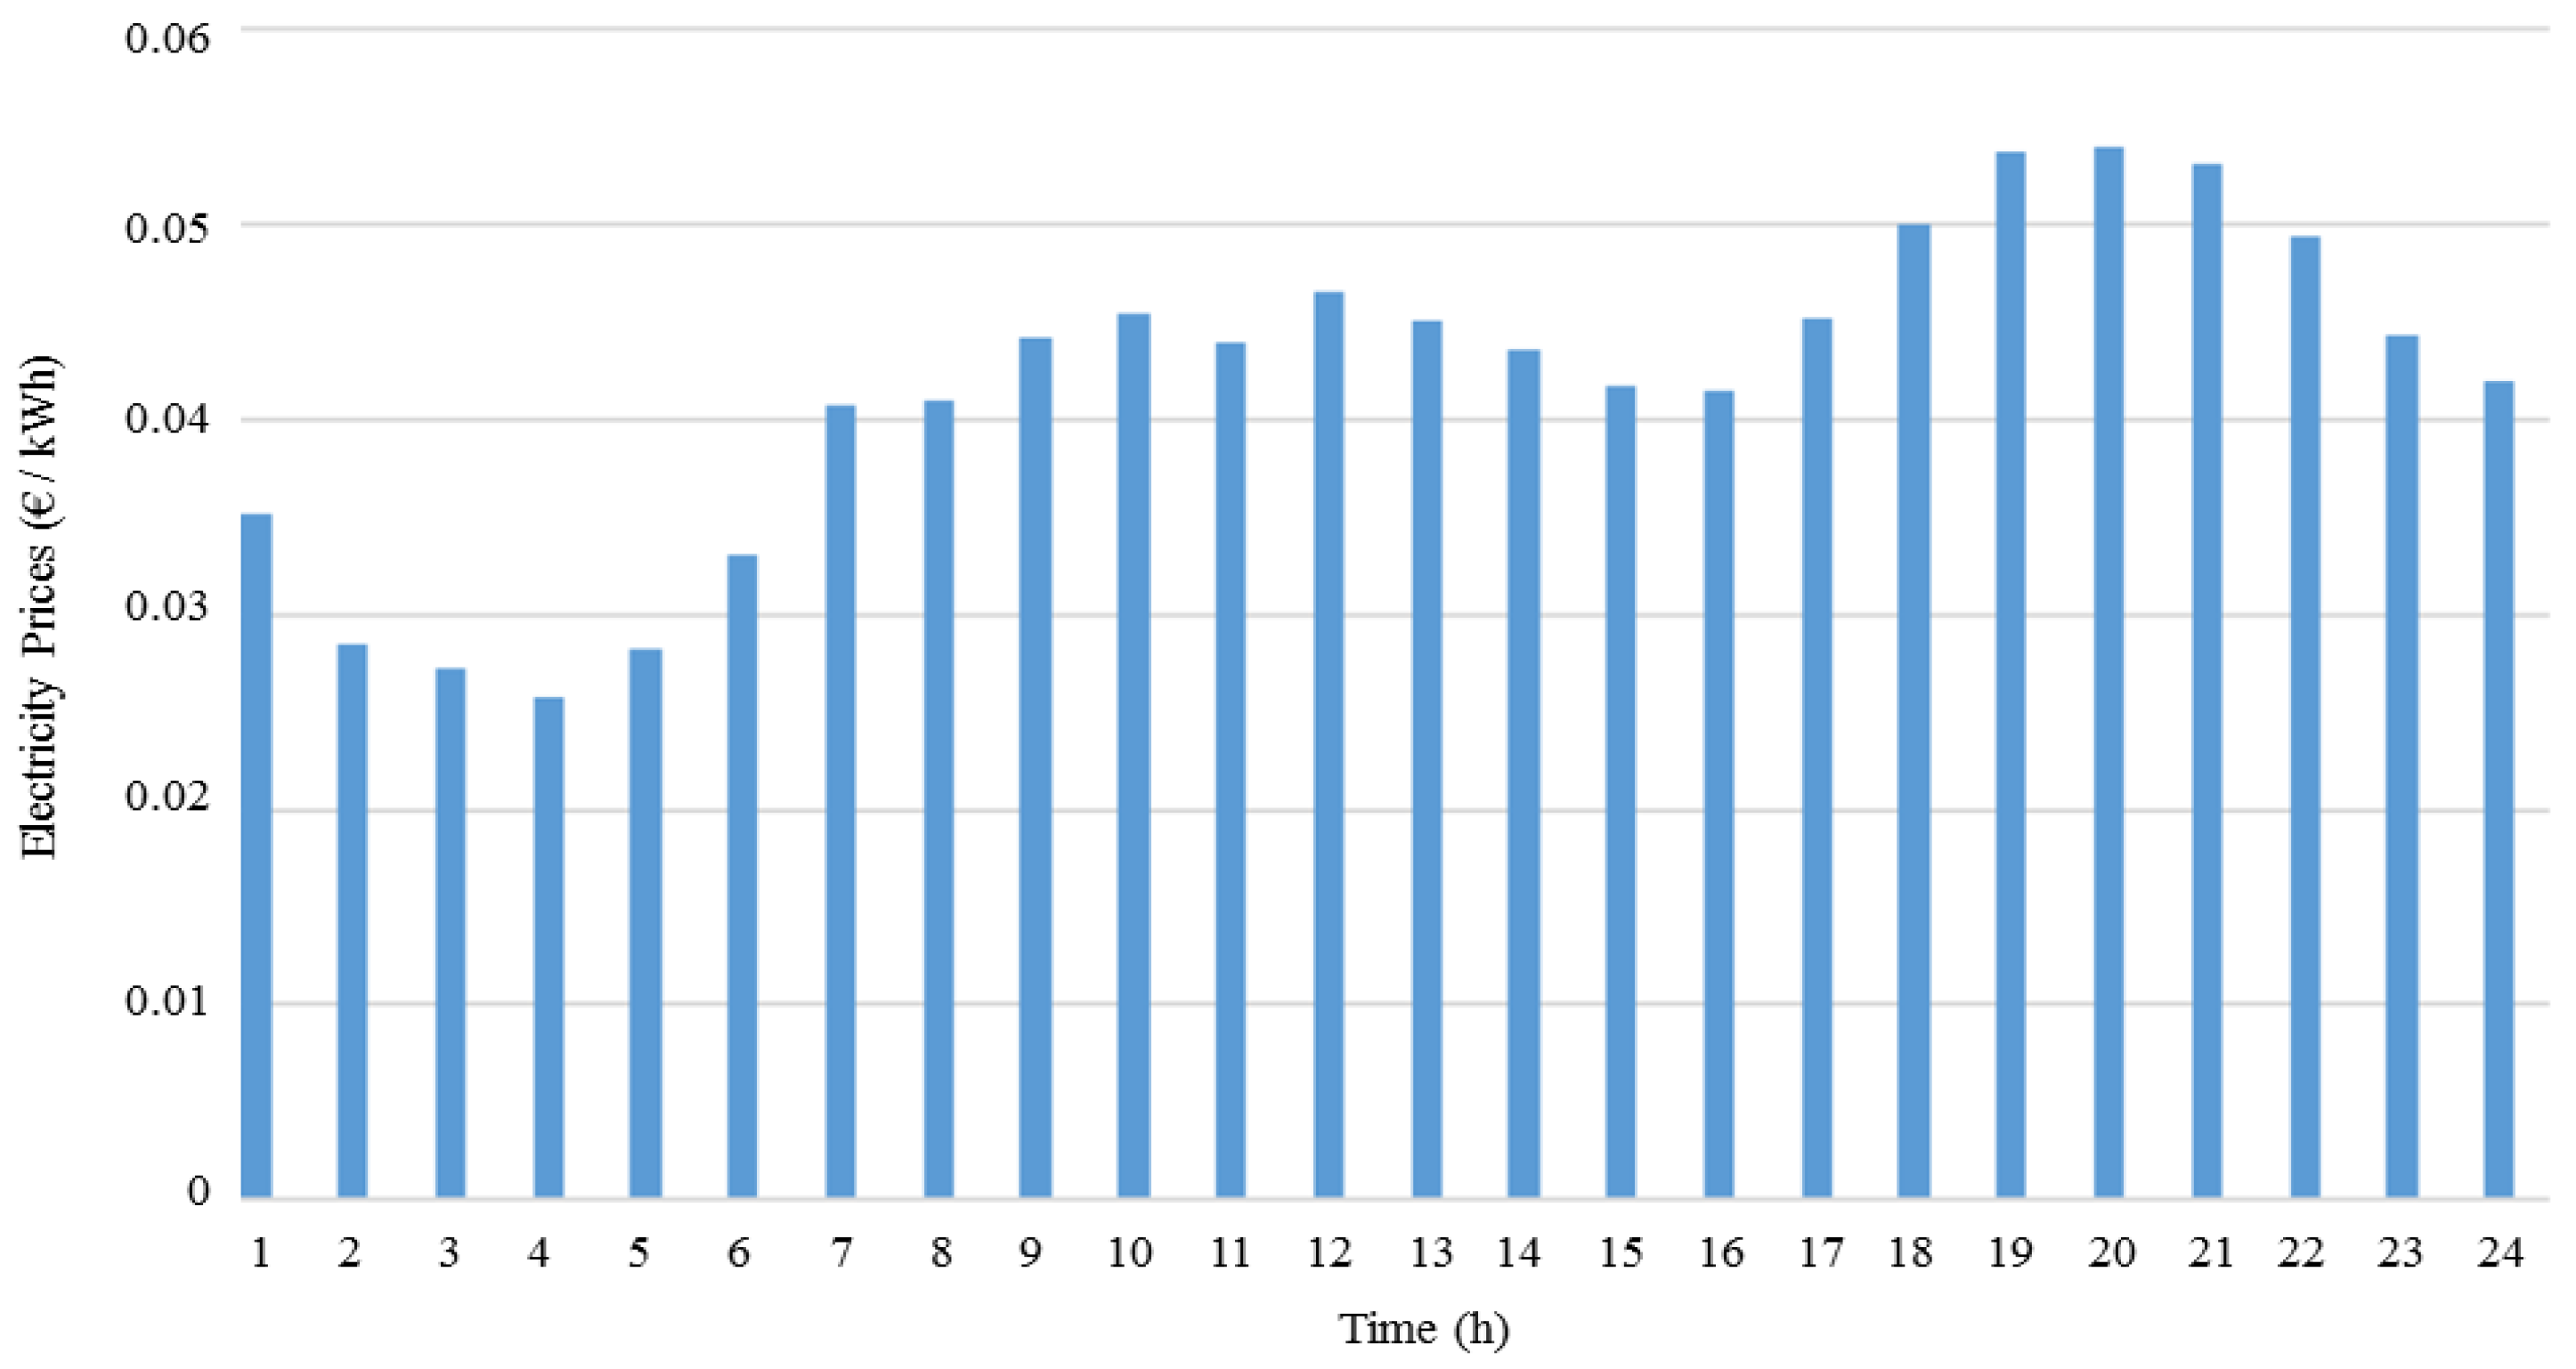
The load curve (shown in Figure 4) can be divided by considering the electric demand and classifying three different time periods: (1) the valley period from 02:00 a.m. to 08:00 a.m., (2) the load period from 04:00 p.m. to 06:00 p.m. and from 11:00 p.m. to 01:00 a.m., and finally (3) the peak period from 09:00 a.m. to 03:00 p.m. and from 07:00 p.m. to 10:00 p.m.. The variation of the electricity price can be found in Figure 5. In the network under study there are 50 EVs distributed over 15 buses. As previously stated, the objective is to analyze the impact of driving patterns, (departure time, arrival time, daily distance and charging time), on the network load profile.
Five EV models (Chevrolet Volt [23], Nissan Leaf [24], BMW i3 [25], Tesla S [26] and Renault Zoe [27]) with different features (namely battery capacity, driving efficiency, and charging power) were considered, and whose characteristics are listed in Table 2. It is also possible to check the specific model of each of the 50 EVs used in the study.
The time of departure and/or arrival and daily distance traveled by each EV were randomly selected, based on temporal distribution models considering actual driving habits for different possible trips and different days.
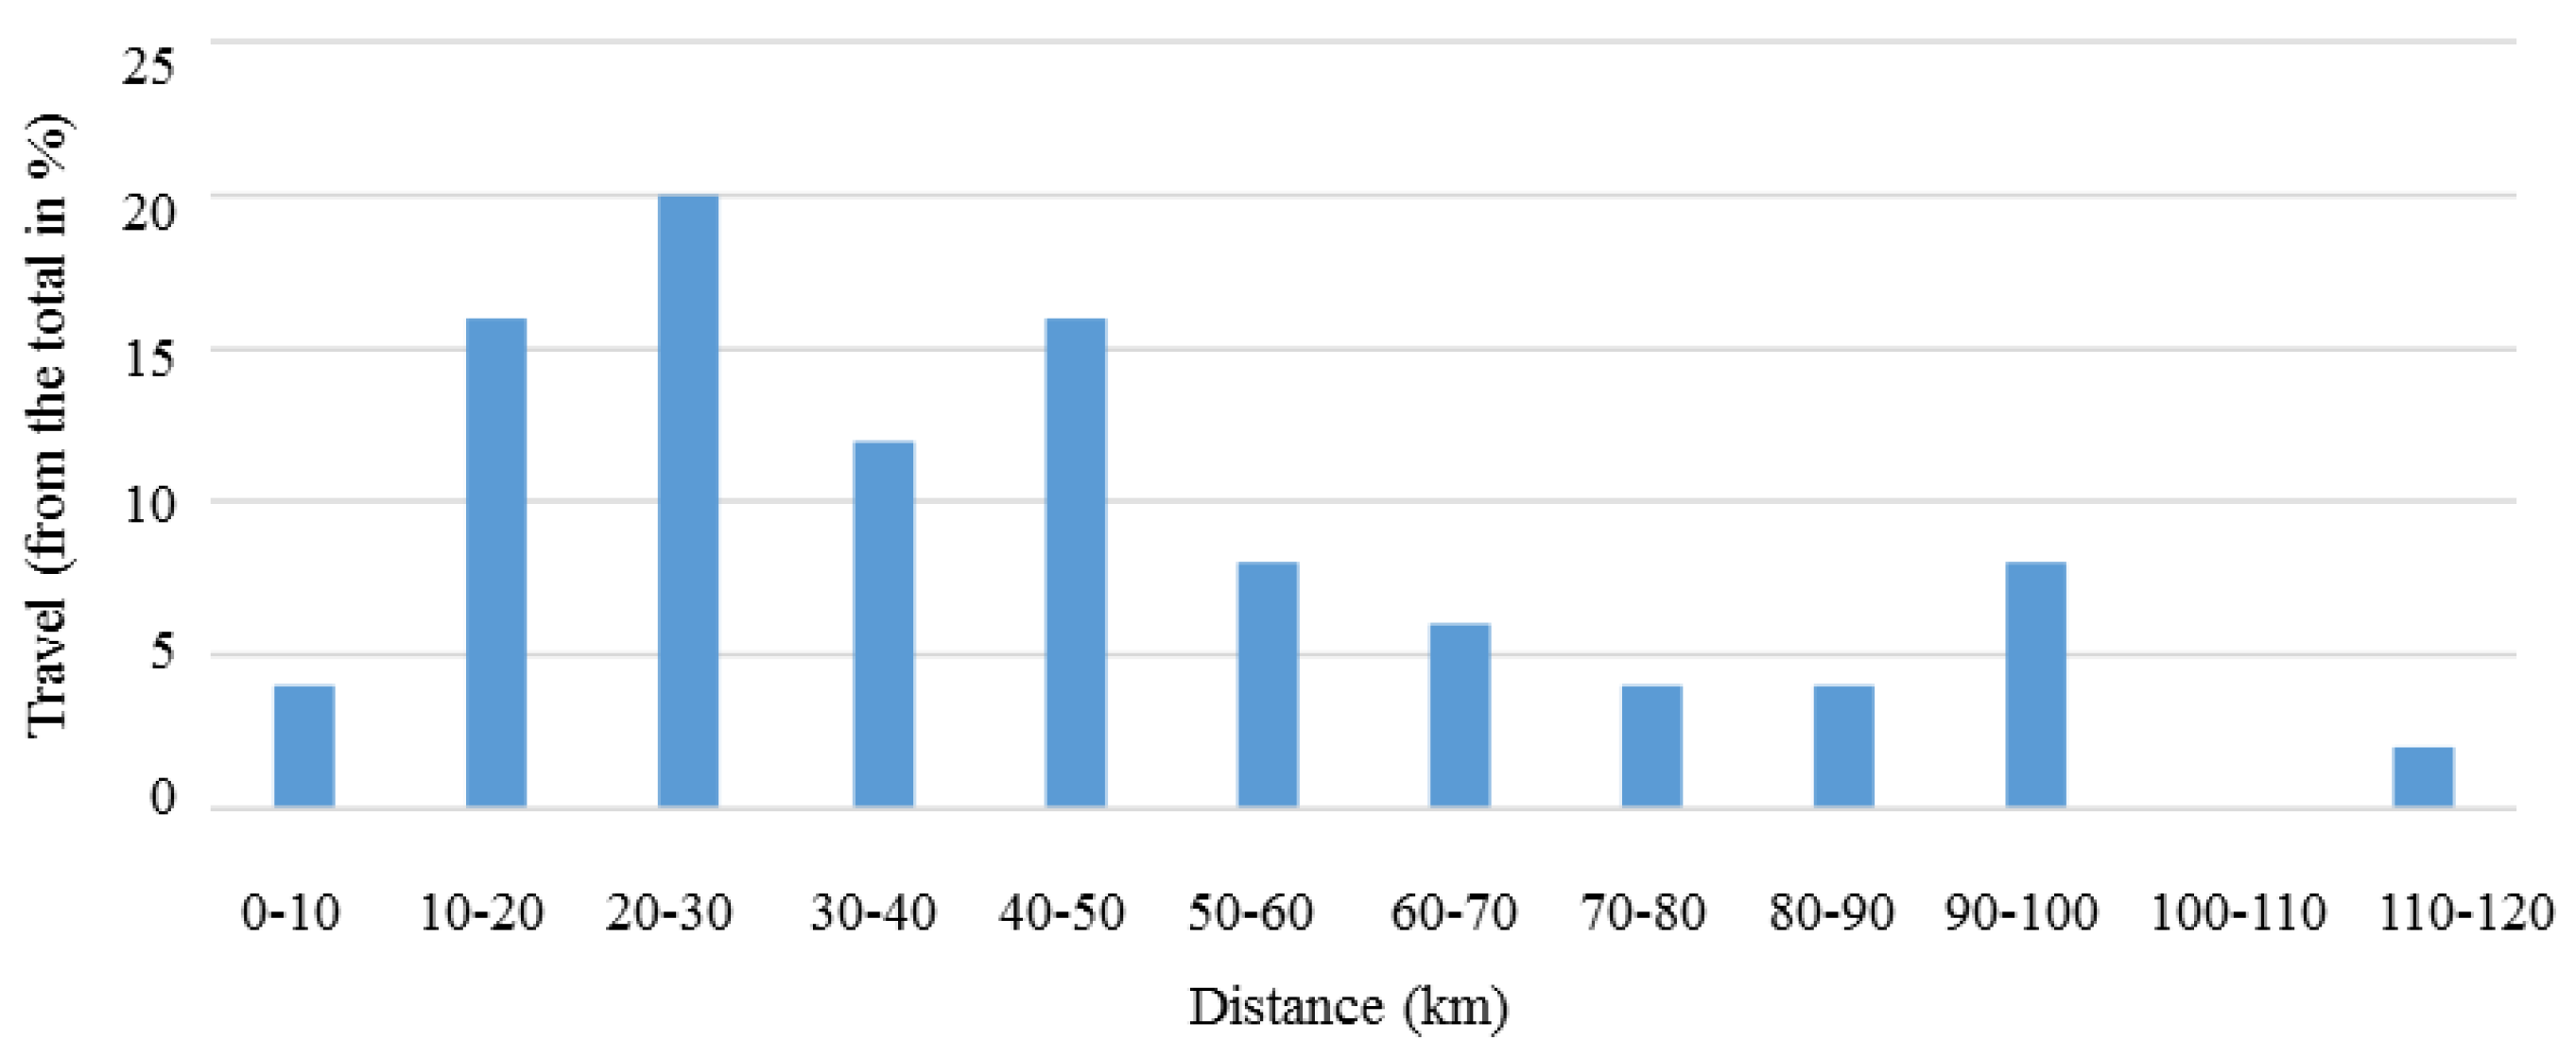
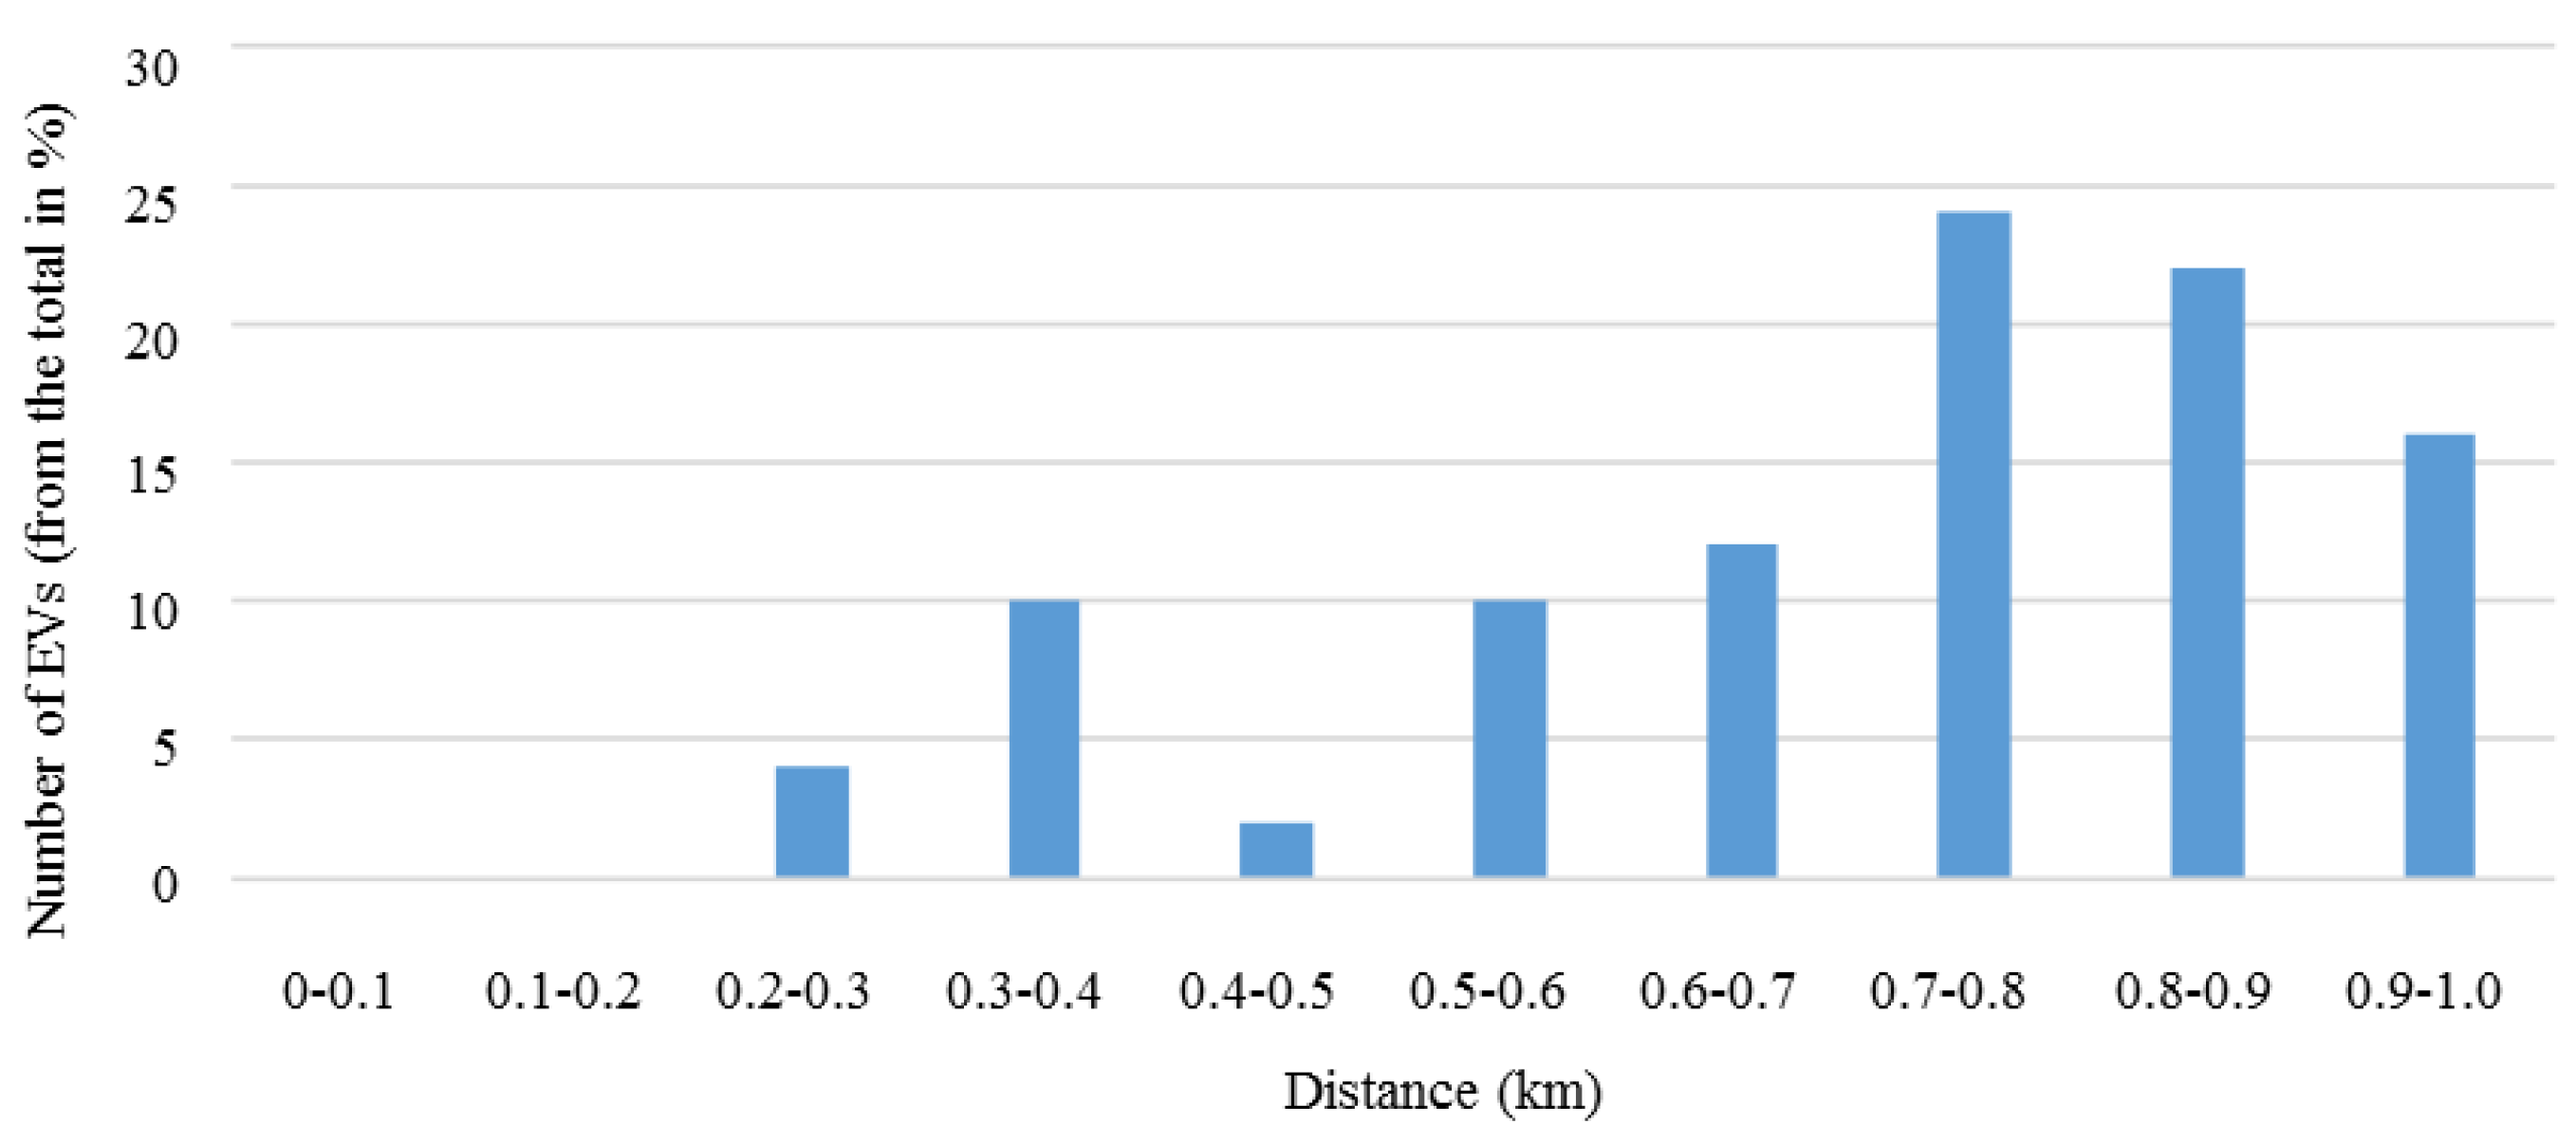
Table 3 shows the location of each EV in the network and indicates the time at which each one leaves and returns to its respective residence. The index corresponds to departure and to the arrival. Figure 6 shows the traveled distance distribution and Figure 7 shows the distribution of the EV SoC at the time of arrival at the residence, which varies according to the distance covered by each EV. Afterwards, the EVs are connected to the network for charging, which can be carried out either immediately upon arrival at the respective residence, or at a time when the load profile is reduced. The following assumptions were made with regards to EV charging:
- Charging efficiency is 85% for all EVs.
- Minimum and maximum SoC is 0.2 and 1, respectively.
- The bidirectional capability of EVs (V2G), to inject power to the network has not been considered. EV charging can only be carried out at the owner's residence.
- The BMW i3 and Tesla S vehicles include the BMW i wallbox and Tesla wall connectors, respectively, which increase charge power capacity.
- The EVs are loaded to their maximum SoC.
Charging time of different models is considered as the time taken from a state of total battery discharge. Note that the Chevrolet Volt takes 5 h, the Tesla S 6 h, the Nissan Leaf and the Renault Zoe 7 h, and the BMW i3 about 2 h. Hence, EVs with higher battery capacity take a longer time to charge and the higher the charging power, the faster the EV reaches the desired SoC.
3.2. Case Study and Results
In this section the simulation results are presented. The charging model is based on the driving patterns and preferences of the charging times of the EVs. A total of 7 different cases studies were defined, with different levels of EV penetration and charging modes, as listed in Table 4. A 24-h period was simulated for each case study. Case 1 was set as a reference/base case with no EV integration, for which the GAMS code execution time was less than 5 s and the objective function value was 1014.30€. In Case 2, only EVs 1 to 15 were present in the network. Case 3 considers EVs 1 to 30 and Case 4 considers all EVs (50) present. In Cases 2, 3 and 4, the charging is uncontrolled, i.e., it is carried out as soon as the EVs owners arrive at their homes continuously until the battery is fully charged (maximum SoC).
In uncontrolled charging, the priority is the comfort and needs of the customers, since the time of departure differs according to the customer. This type of charging causes an increase in peak load. In Cases 5, 6 and 7, charging is controlled and is carried out at a time when the load profile is lower: from 2:00 a.m. to 8:00 a.m. (Figure 4). This type of charging allows the peak load reduction and minimizes the DSO disruption. In Case 5, the first 15 EVs are considered, in 6 the first 30, and in 7 all 50 EVs are considered. The charging duration of each EV varies between 1 to 6 h depending on the SoC value on arrival, the respective charging power, and the battery capacity.
3.2.1. Base Case Study Comparison with Cases 2, 3, and 4
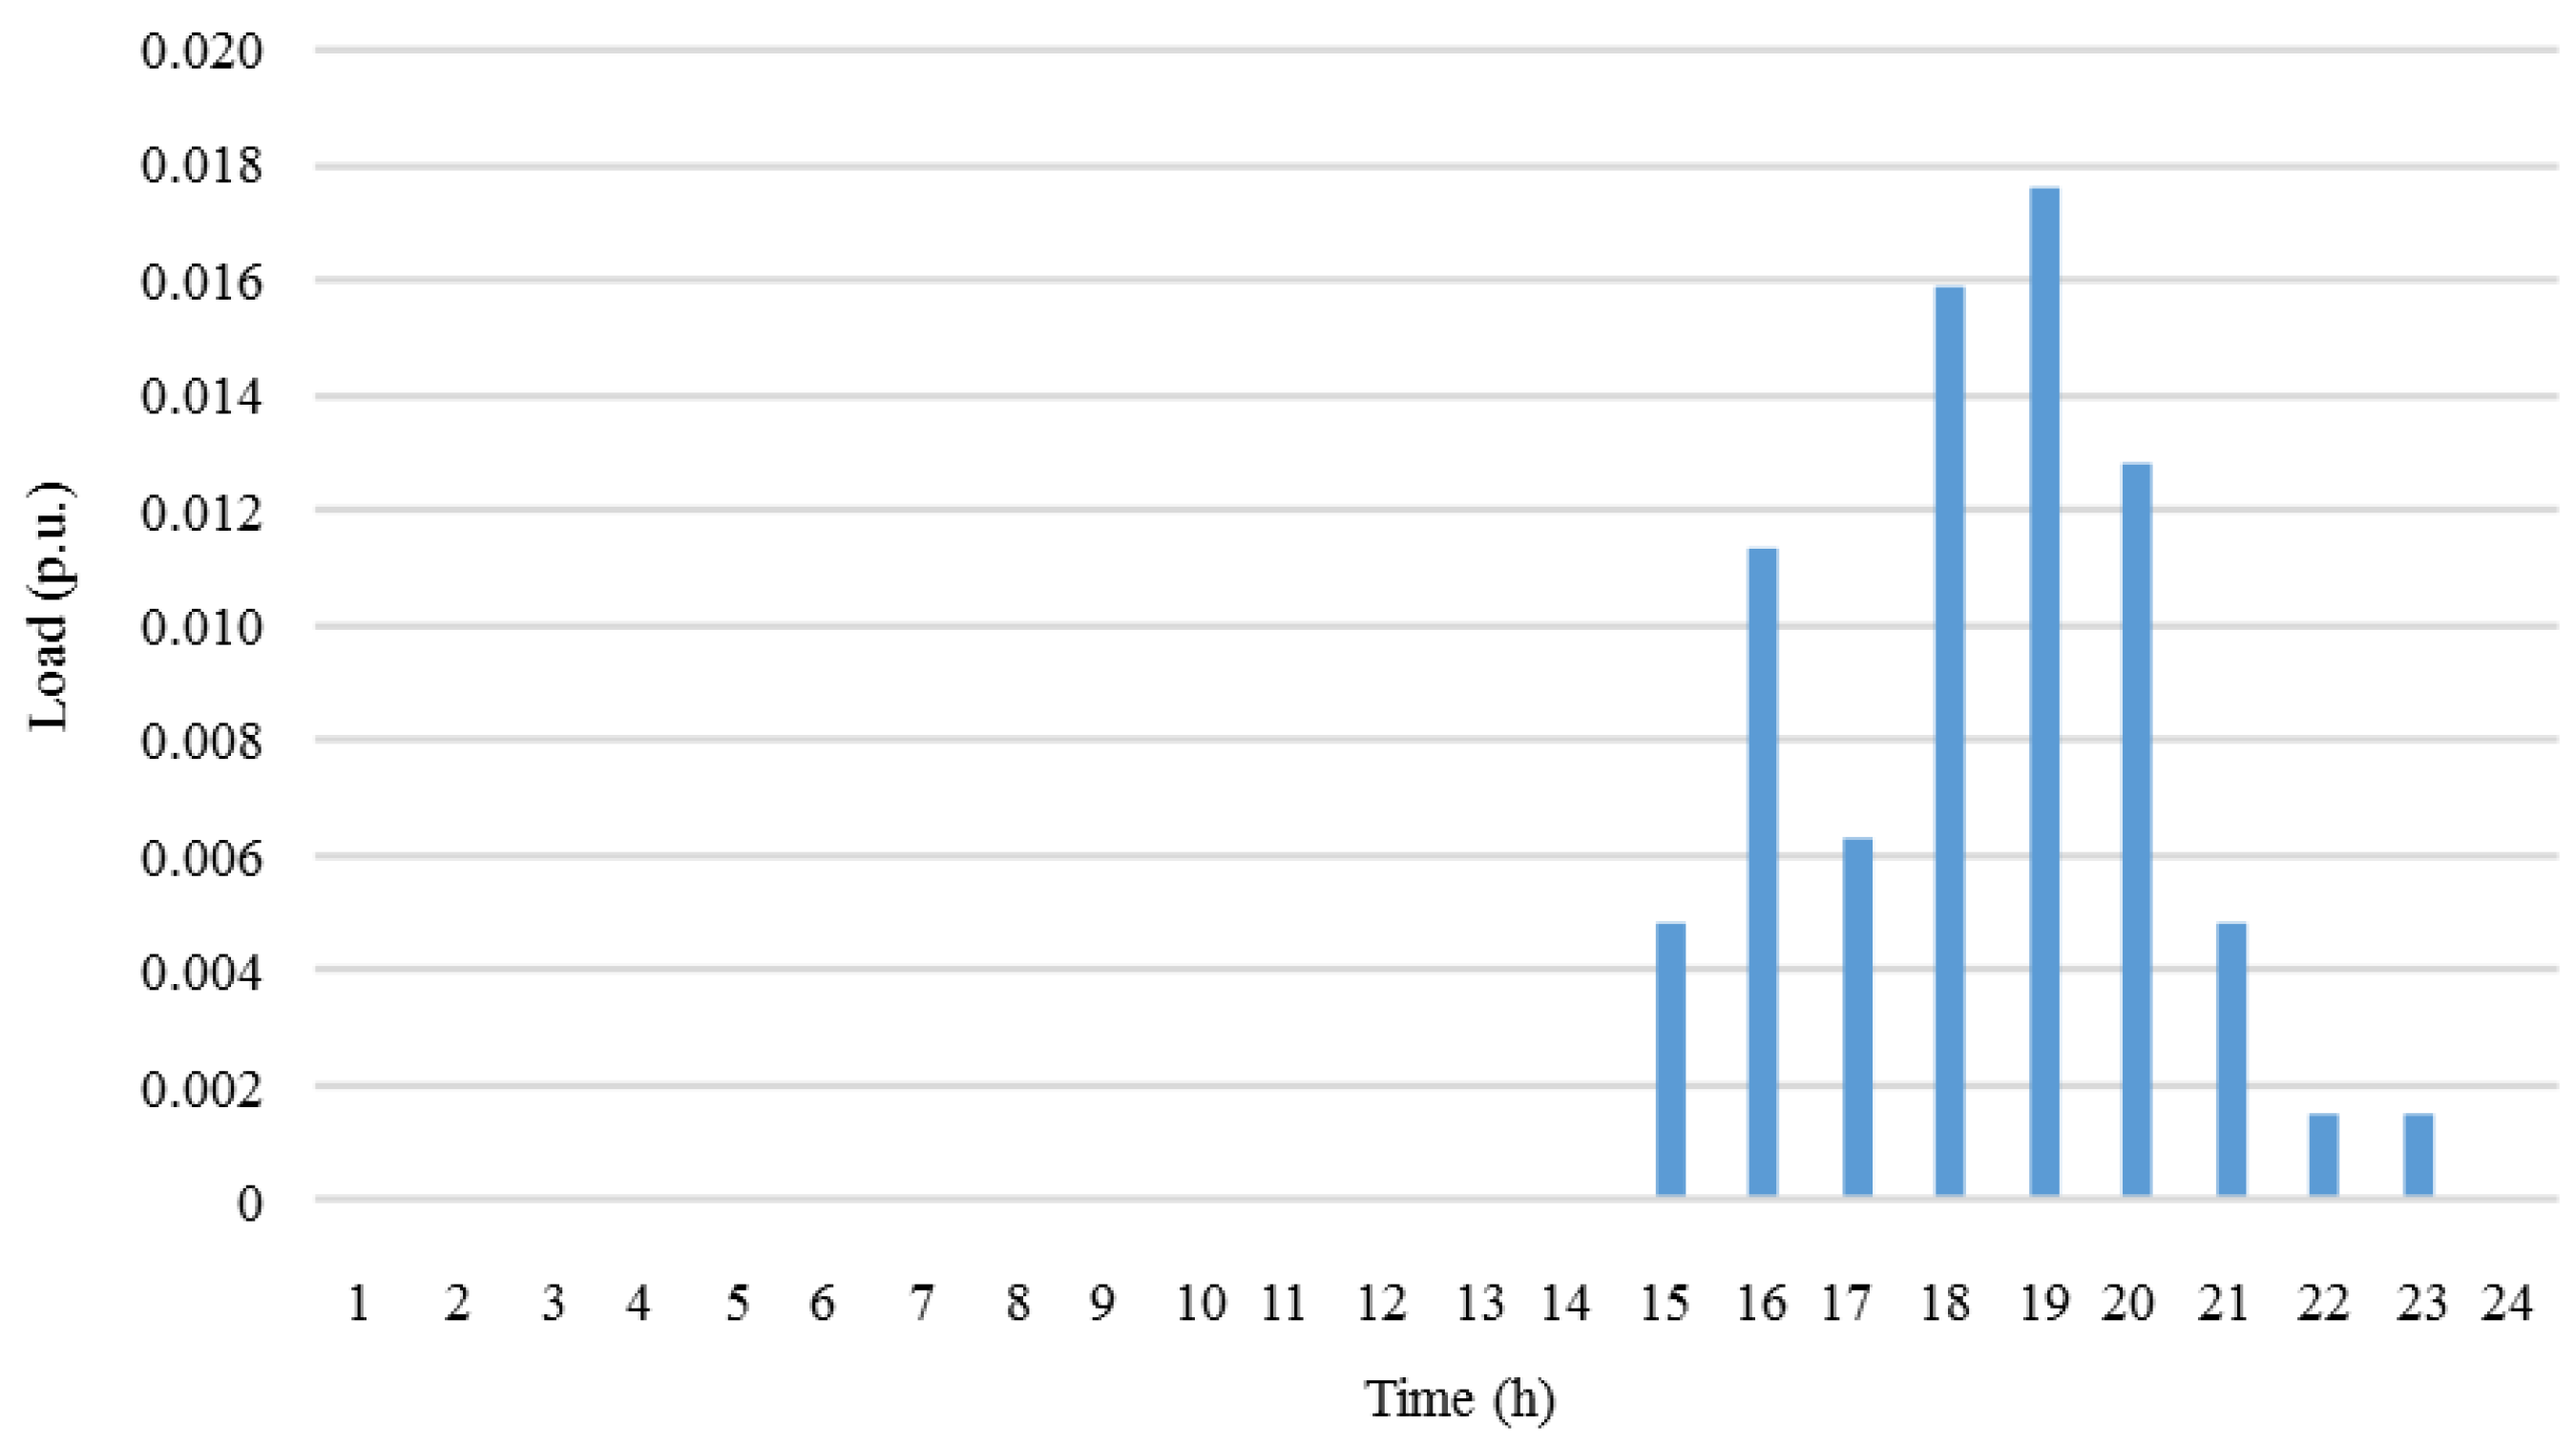
In this section the network load profile of the base case (without EVs) is compared with the uncontrolled charging Cases (2, 3 and 4). The results of the simulation of Case 2 (15 EVs, uncontrolled charging) are shown in Figure 8 and Figure 9. Figure 8 shows that from 06:00 p.m. to 08:00 p.m. there is a period of high energy demand for charging. These values persist for all cases under study as a result of the driving patterns considered in Table 3.
Figure 9 shows that the highest load demand of EVs is at 07:00 p.m. and is approximately 0.018 p.u. At 06:00 p.m. the total demand is 0.594 p.u., 2.75% higher than the base case without EVs. At 07:00 p.m. the demand is 0.618 p.u., 2.93% higher, and the demand for the peak time, 08:00 p.m., is 0.677 p.u., 1.93% higher than the base case. However, the results show that a penetration of 15 EVs does not cause significant changes to the load profile.
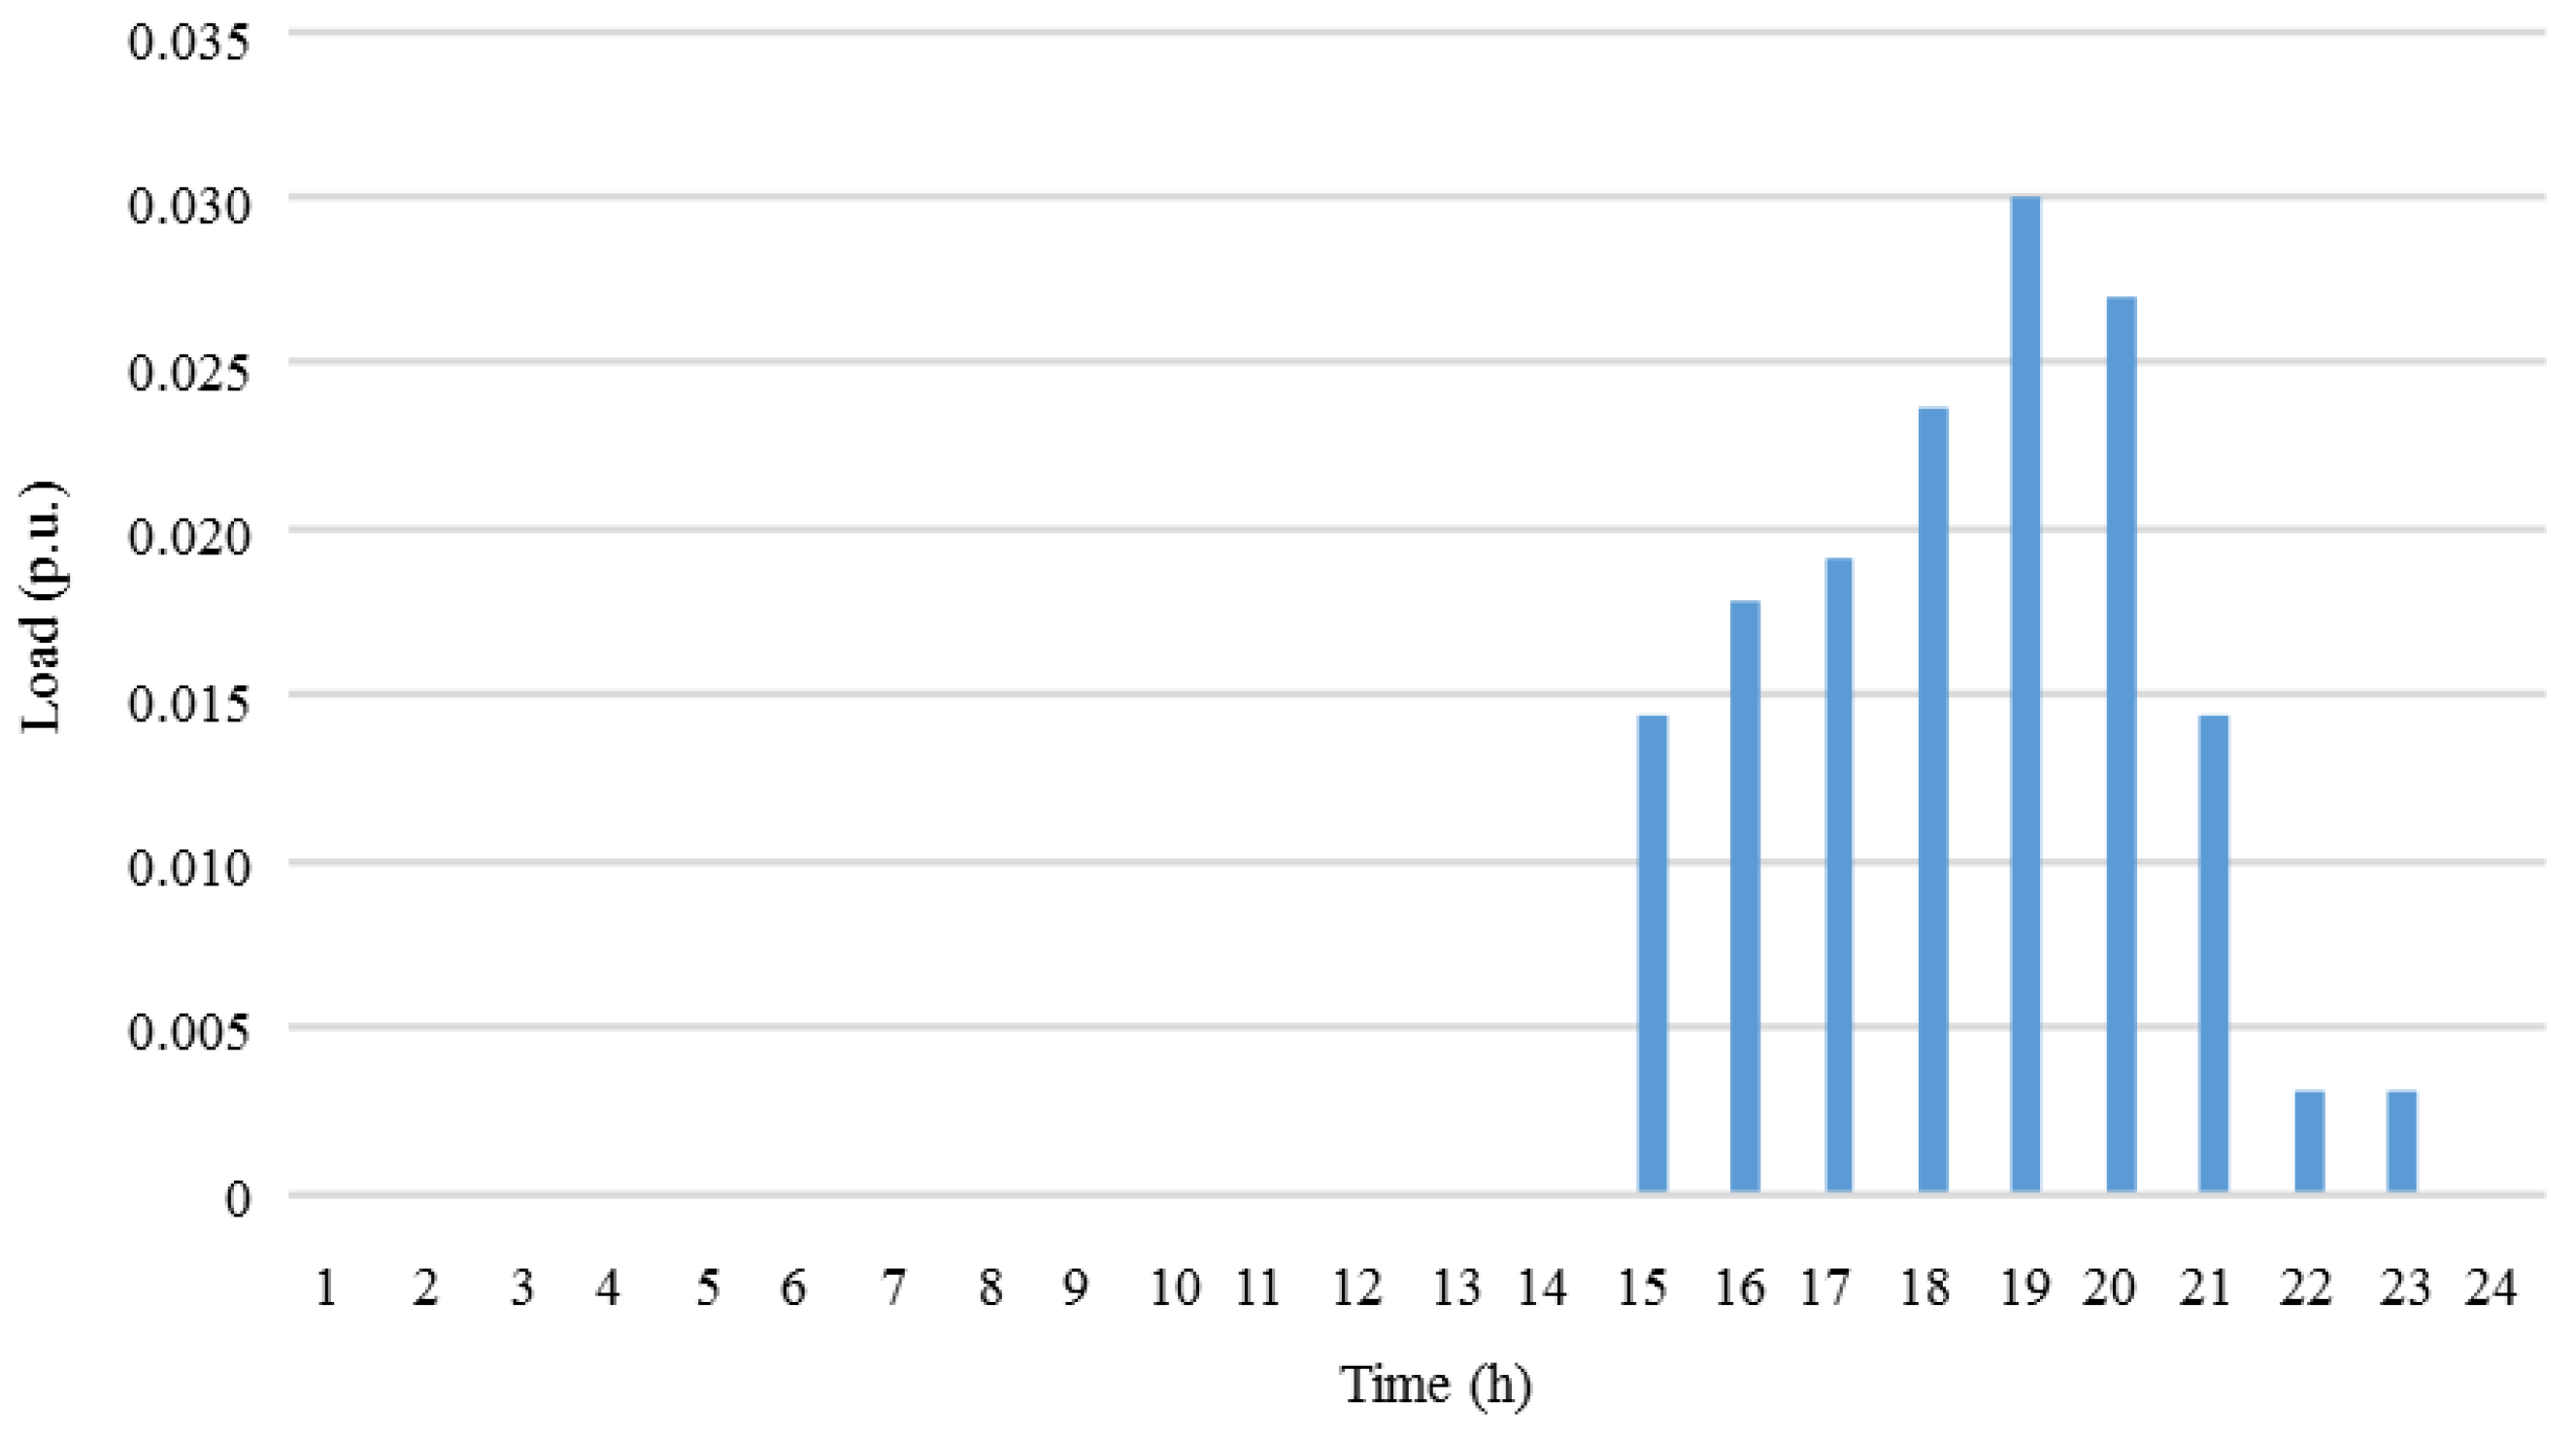
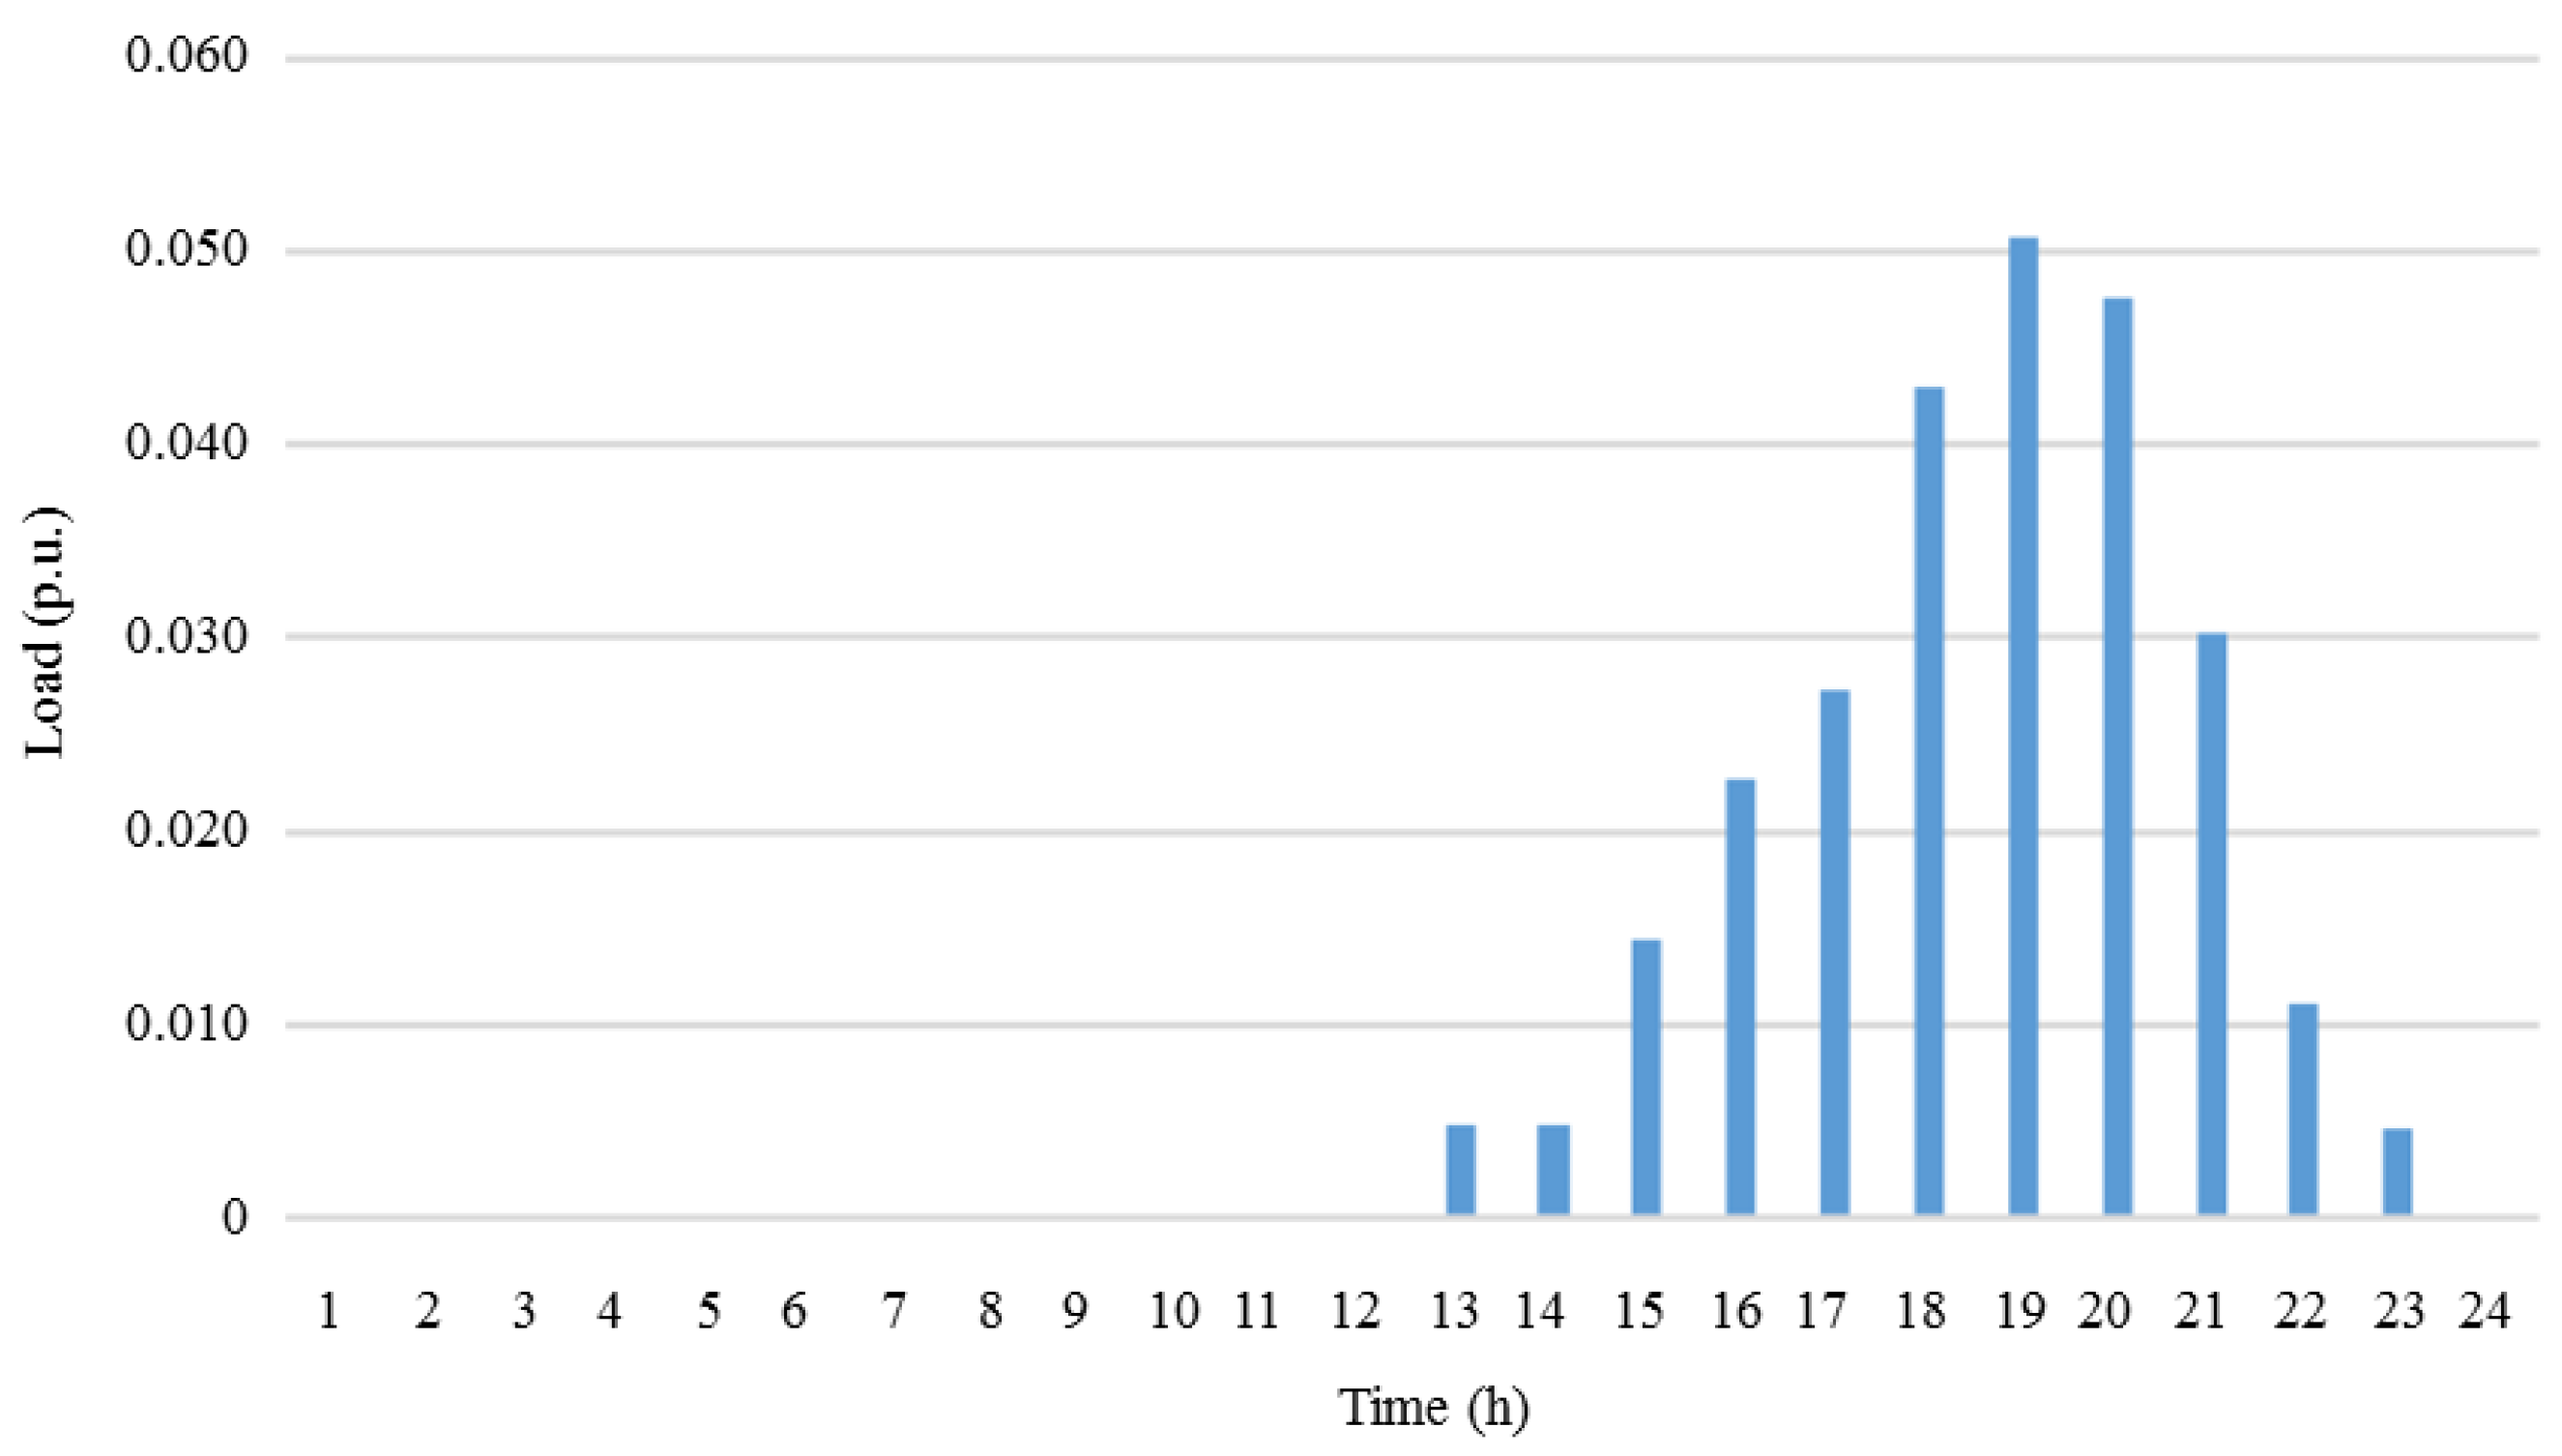
In Case 3 (30 EVs, uncontrolled charging), the period of highest demand remains from 06:00 p.m. to 08:00 p.m., as shown in Figure 10. Figure 11 shows a comparison of the load profile with the base case. The highest load demand occurs at 07:00 p.m. at approximately 0.03 p.u. At 06:00 p.m., the total demand is 0.602 p.u., 4.1% higher than the base case without EVs. At 07:00 p.m., the demand is 0.63 p.u., 5% higher, and at 08:00 p.m. it is 0.692 p.u., 4.06% higher than the base case. In Case 4 (50 EVs, uncontrolled charging) the time of highest demand remains unchanged from 6:00 p.m. to 8:00 p.m., as can be seen in Figure 12.
Figure 13 shows the comparison of the load profile with the base case. A higher demand for charging occurs at 07:00 p.m. at approximately 0.05 p.u. At 06:00 p.m. the total demand is 0.621 p.u., 7.45% higher than the base case, at 07:00 p.m., it is 0.651 p.u., 8.44% higher, and at 08:00 p.m. it is 0.712 p.u., 7.16% higher than the base case. From the results obtained, the last two cases (30 and 50 EVs) show a significant increase in the load profile in peak hours. The increase in the number of EVs implies an increase in demand that can cause problems for the DSO with higher EV penetration.
3.2.2. Base Case Study Comparison with Cases 5, 6 and 7
In this section the network load profile of the base case is compared with Cases 5, 6 and 7, which consider the controlled charging. In all three cases, the EV charging process takes place after 02:00 a.m. and is carried out respecting the flexibility of the EV owner to postpone the charging time due to the expected departure time of each EV, as described in Table 3.
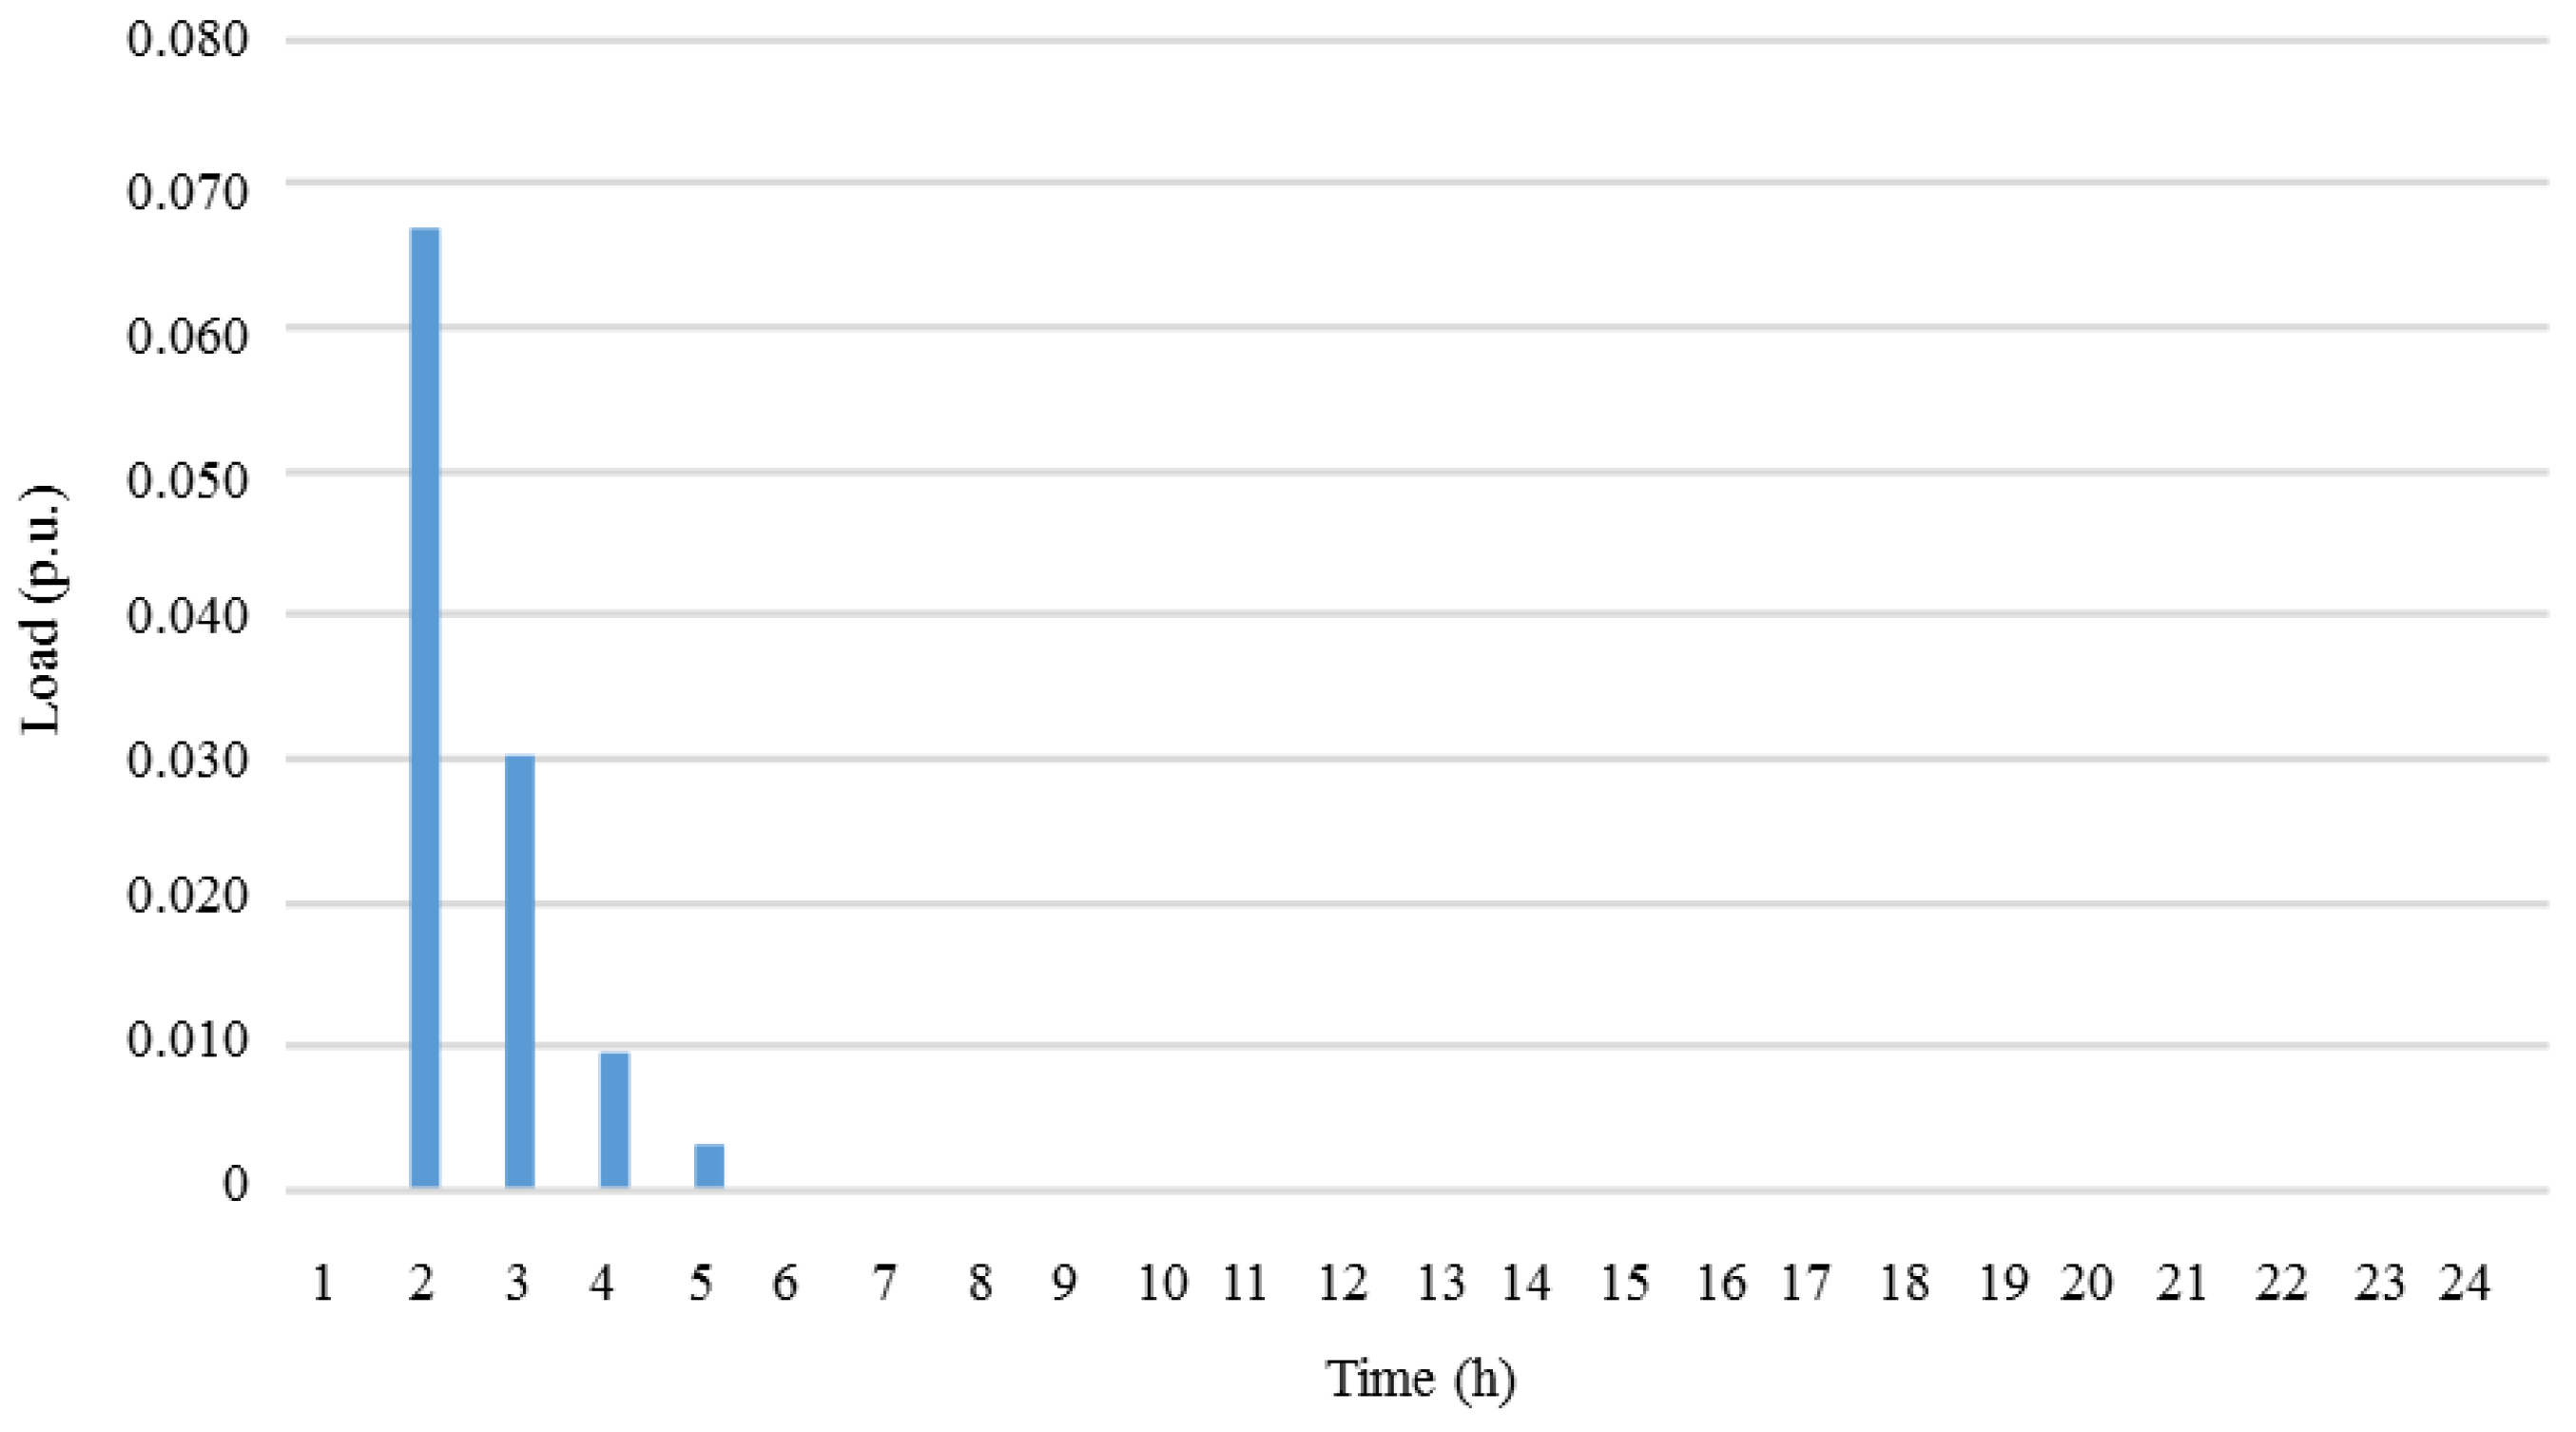
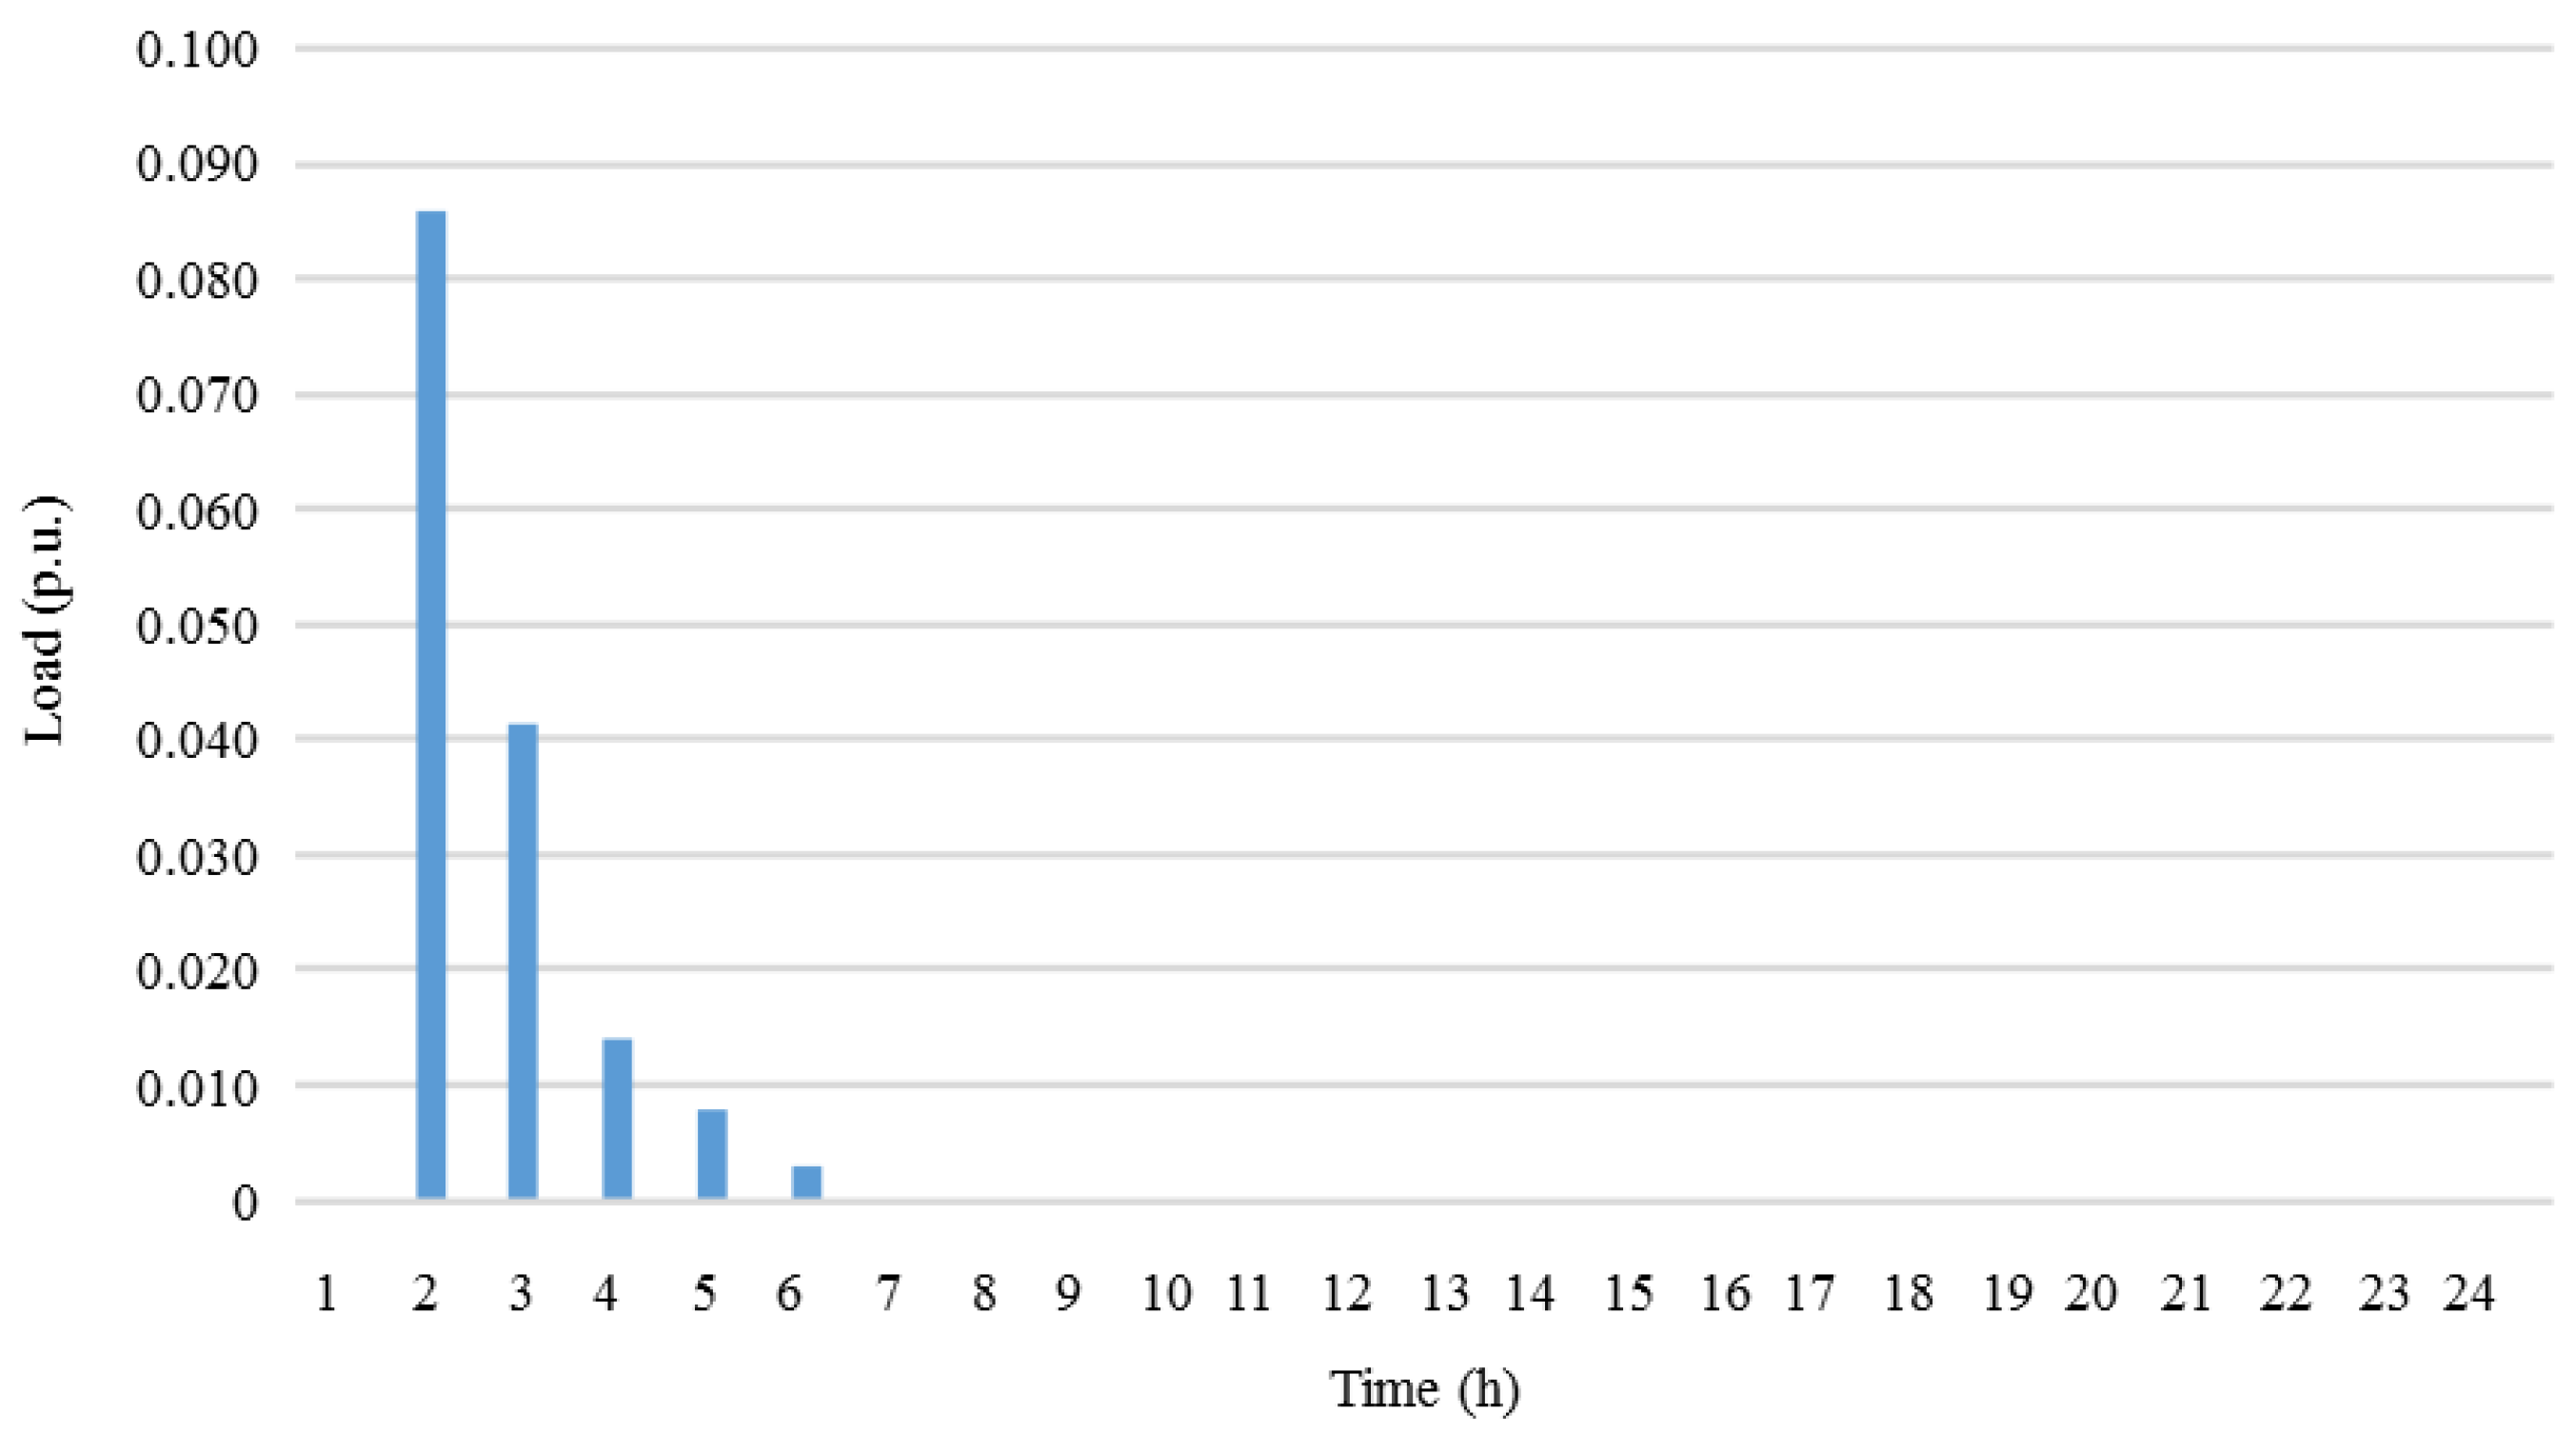
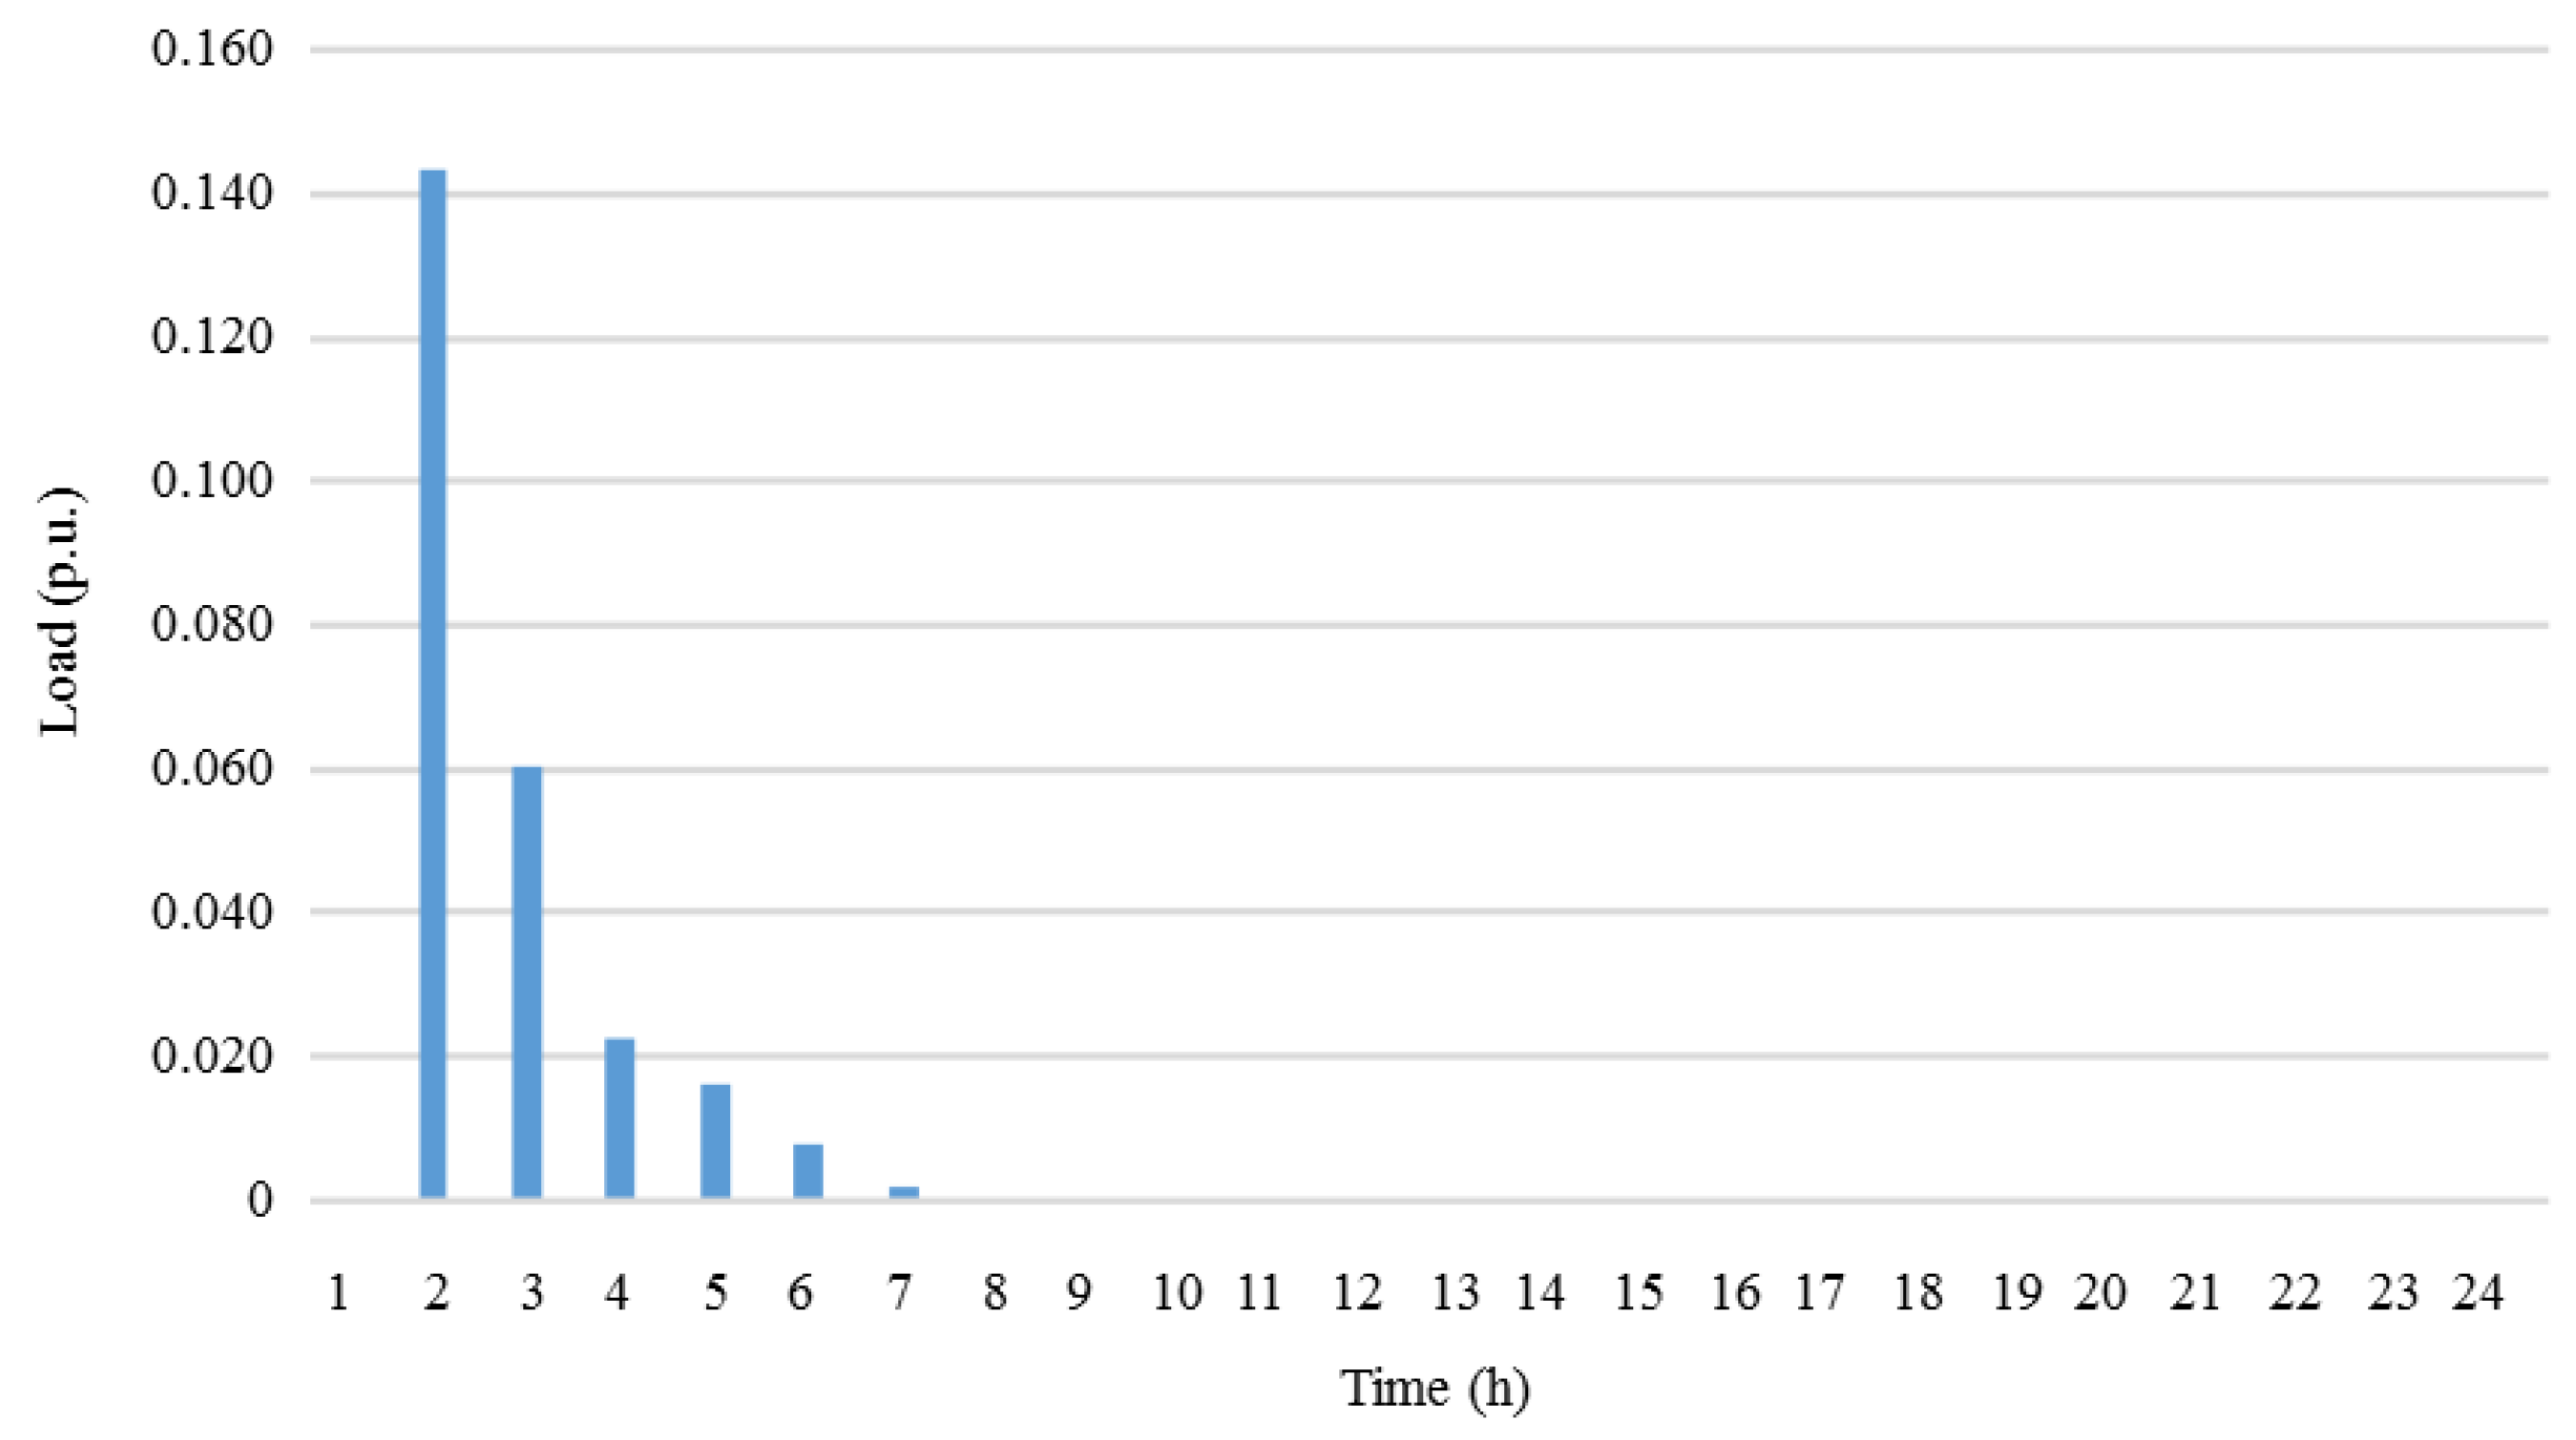
Figure 14, Figure 15 and Figure 16 show the EVs controlled charging demand considering the penetration of 15, 30 and 50 EVs in the network, respectively. It can be observed that at 02:00 a.m. there will be a significant increase in the load profile since all EVs are scheduled to begin charging at that time. However, charging will be faster compared to uncontrolled charging, since the EVs will have higher charging power or higher SoC on arrival; EVs will charge in about 1 or 2 h.
Figure 17 shows the comparison of the network load profile between the base case and controlled charging with 15 EVs (Case 5). The highest charging demand occurs at 02:00 a.m. and is approximately 0.04 p.u. Thus, at 02:00 a.m. the total demand is 0.493 p.u., 9.57% higher than the base case; at 03:00 a.m. the demand is 0.477 p.u., 5.65% higher; and at 04:00 a.m. the total demand is 0.417 p.u., 1.54% higher than the base case.
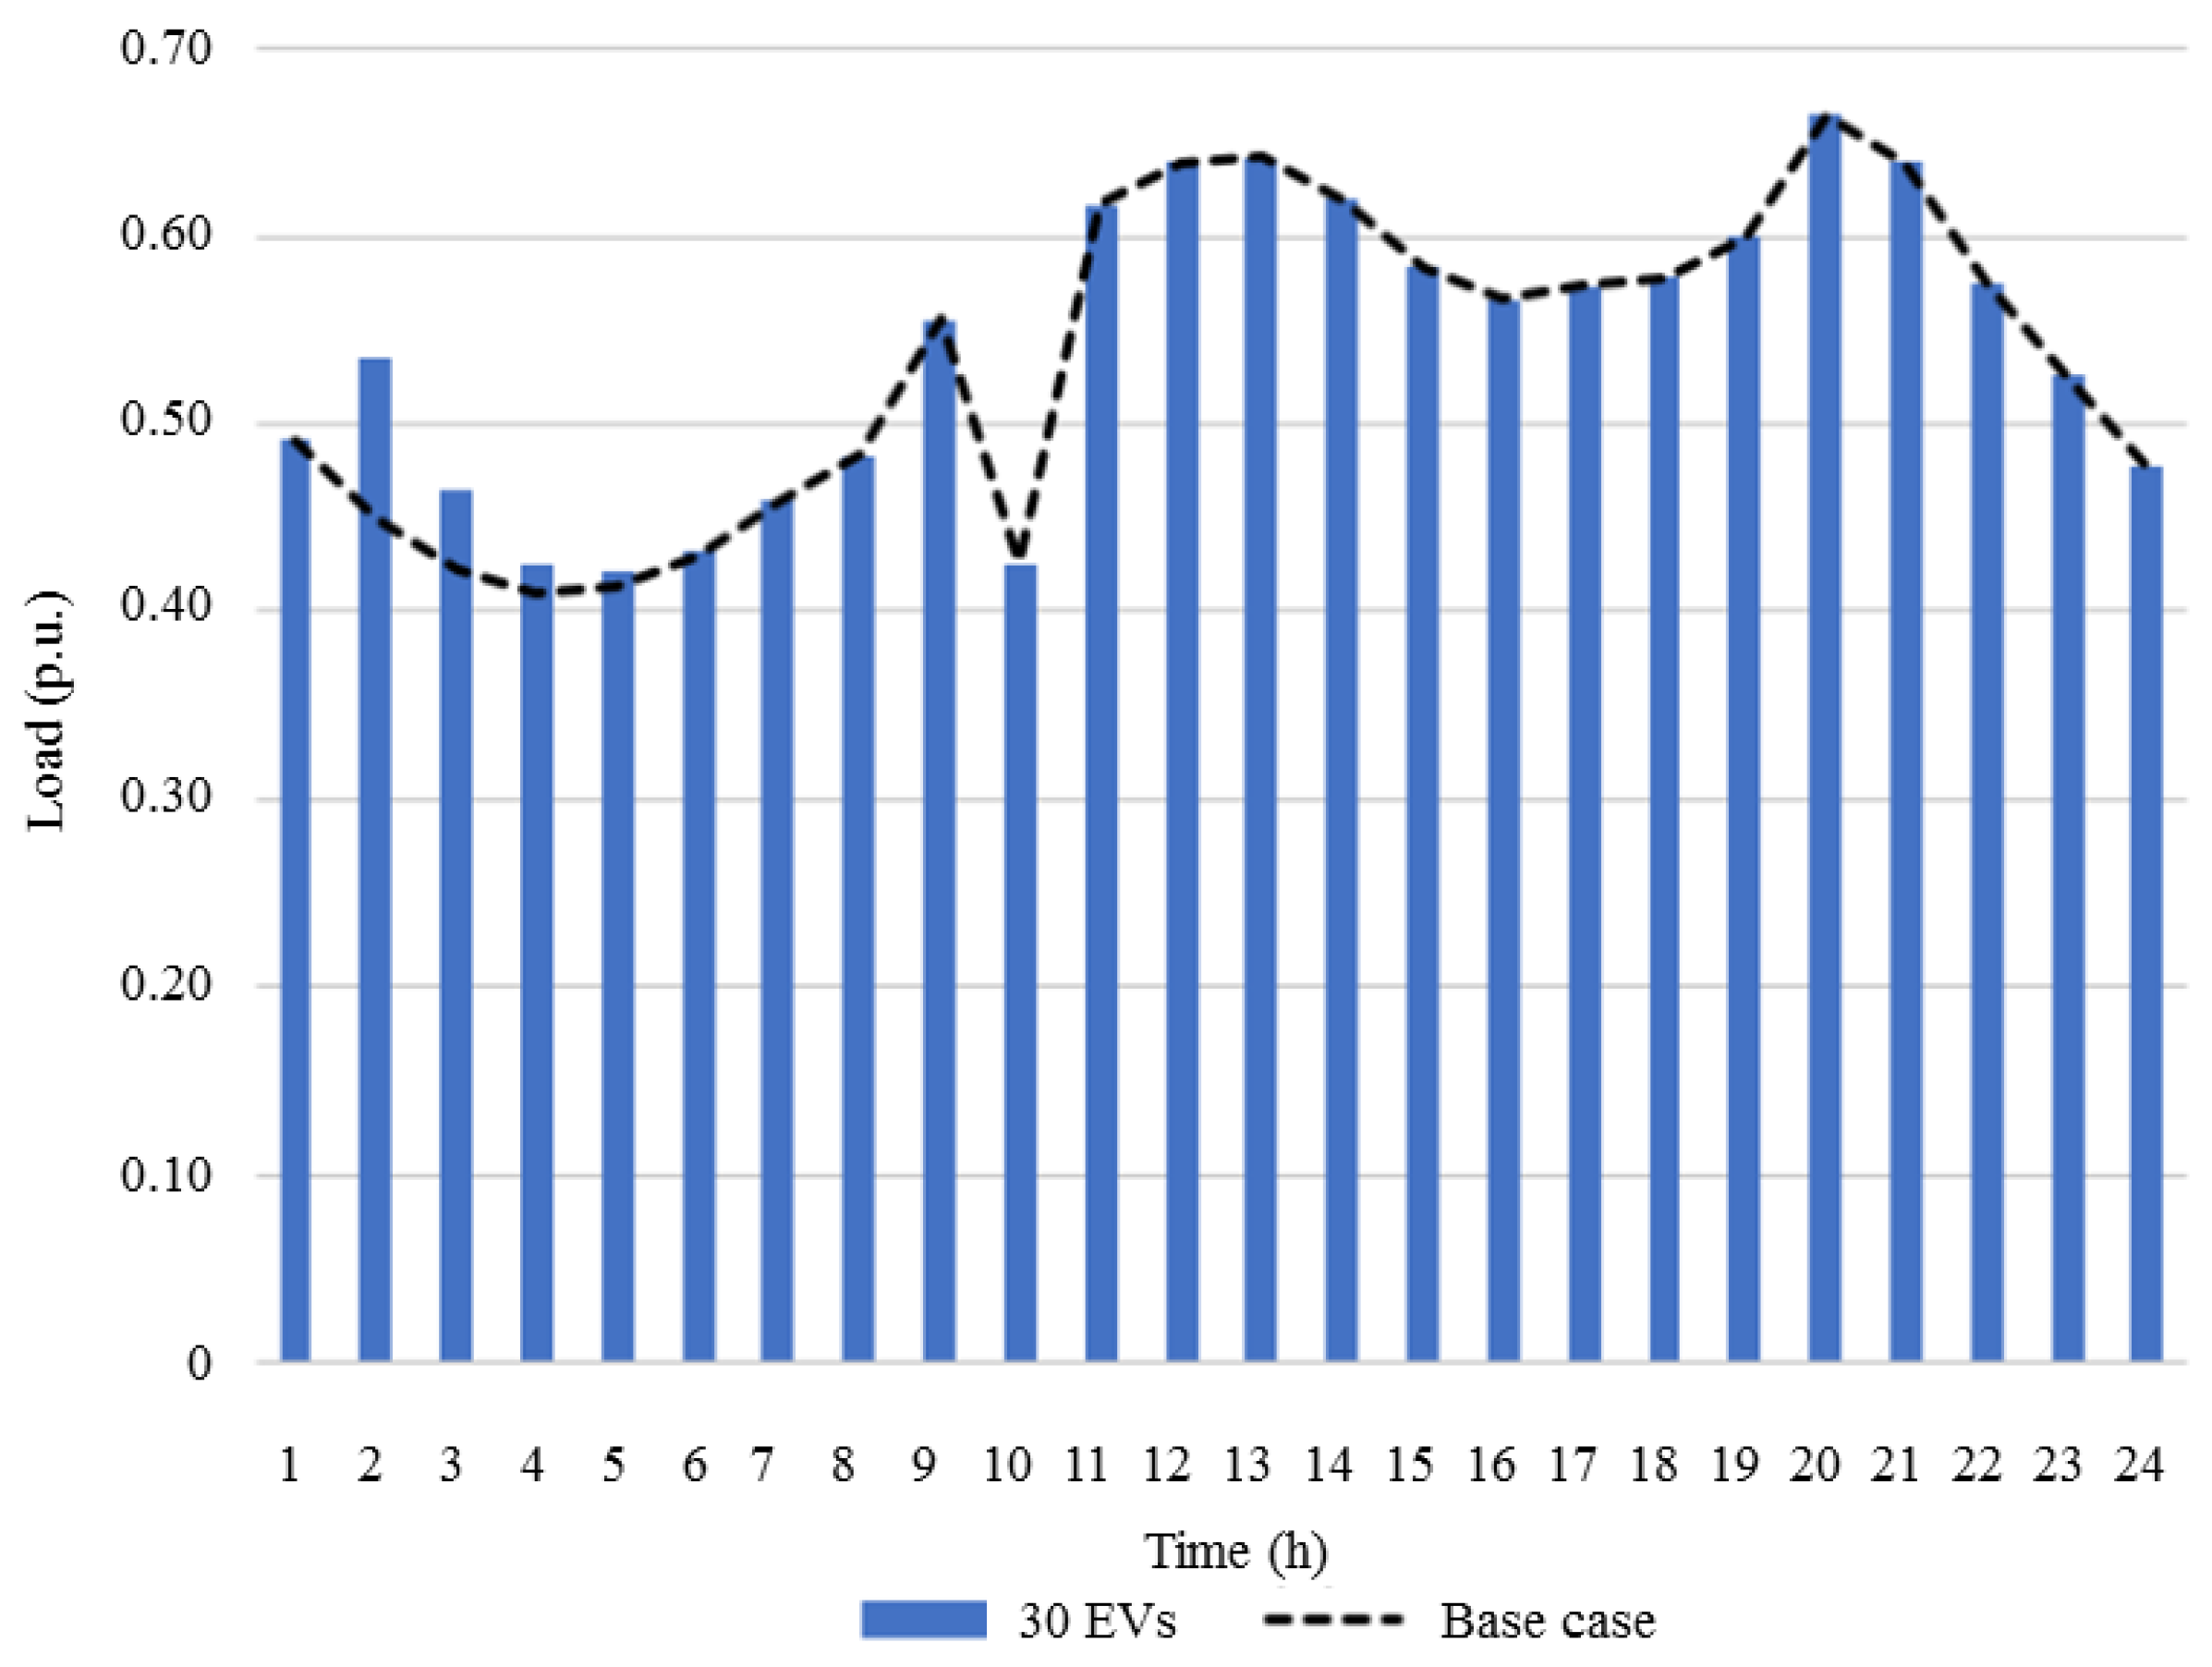
Figure 18 shows the comparison of the network load profile between the base case and controlled charging with 30 EVs (Case 6). Again, the highest charging demand occurs at 02:00 a.m. and is approximately 0.09 p.u. At 02:00 a.m. the total demand is 0.536 p.u., 19.15% higher, at 03:00 a.m. the demand is 0.46 p.u., 9.76% higher, and at 04:00 a.m. it is 0.425 p.u., 3.44% higher than the base case.
Figure 19 shows the comparison of the network load profile between the base case and controlled charging with 50 EVs (Case 6). At 02:00 a.m. there is a charging demand of approximately 0.14 which results in a total demand of 0.593 p.u., i.e., a value 31.91% higher than the base case. At 03:00 a.m. the total demand is 0.483 p.u., 14.29% higher, and at 04:00 a.m. the total demand is 0.433 p.u., 5.40% higher than the base case.
By analyzing the last three Cases (5, 6, and 7) it is possible to observe that controlled charging and scheduling it for a period of lower network load has the advantage of not increasing the peak-load of the network. However, it has the disadvantage of increasing the load at off-peak periods. It can also be observed that the penetration of EVs in the network, the higher the load will be. This can be verified the respective results of increasing from 15 to 30 EVs, followed by 30 to 50 EVs.
4. Conclusions
In this work, a model was developed to analyze the impact of integrating different levels of penetration of EVs into a power distribution system. Seven case studies with different levels of EV penetration and two charging modes were formulated. The network under study includes conventional, wind, and PV generation.
To model uncertainties, ten possible generation scenarios were considered for each RES. In order to make the model more realistic, five different commercial EV model were considered, each with different characteristics such as battery capacity, charging efficiency, and charging power.
The results have shown that EV charging had a significant impact on the system load profile and therefore, measures were needed to guarantee sustainable network planning. The introduction of 15 EVs increased the load by 2%; 30 EVs increased the load by around 4%; and 50 EV's increased it by around 7%. Thus, it has been identified that higher levels of EV penetration can significantly change the load profile of a distribution network and consequently increase peak load, especially when charging is uncontrolled and/or unscheduled. The increasing penetration of EVs in distribution systems presents new challenges for the DSO. Controlled charging prevents the increase in the peak-load since charging is scheduled at hours of low demand as opposed to uncontrolled charging which only considers each owner’s needs.
The analysis of driving patterns of EVs owners (namely the relationship between the departure/arrival times of the owner and the distance traveled by the EV), can make it possible to predict when demand will occur. This can provide the necessary data for the tools to analyze the impacts of EV on the distribution network and can be used to design the incentives to develop strategic charging solutions which are compatible with the network.
In this way, all network players can exploit the full potential of EVs. Therefore, correct integration of EVs in the distribution network provides advantages for EV owners and for the DSO. In addition, it can have environmental benefits as it results in the reduction of pollutant emissions, either by increasing the flexibility of the network through the distributed storage concept, or through mitigation of the transportation sector impact. In the future, this work can be extended to consider more detailed factors (e.g., distribution network failure rate, or extreme weather conditions which will drastically affect the number of people using their EVs, and the ageing of EV batteries), and a comparison with other published results.
Author Contributions
Conceptualization, M.S.-k. and G.J.O.; methodology, P.D.L.C.; validation, M.S.-k. and J.P.S.C.; writing, M.L., P.D.L.C. and G.J.O.; supervision, J.P.S.C.
Funding
This research was funded by Portuguese funds through FCT (under grant PD/BD/142810/2018), FEDER funds through COMPETE 2020 and Portuguese funds through FCT (under Projects SAICT-PAC/0004/2015-POCI-01-0145-FEDER-016434, POCI-01-0145-FEDER-006961, UID/EEA/50014/2013, UID/CEC/50021/2013, UID/EMS/00151/2013, and 02/SAICT/2017-POCI-01-0145-FEDER-029803).
Acknowledgments
M.L. would like to acknowledge the support of the MIT Portugal Program (in Sustainable Energy Systems) by Portuguese funds through FCT, under grant PD/BD/142810/2018. Moreover, J.P.S.C. acknowledges the support by FEDER funds through COMPETE 2020 and by Portuguese funds through FCT, under Projects SAICT-PAC/0004/2015-POCI-01-0145-FEDER-016434, POCI-01-0145-FEDER-006961, UID/EEA/50014/2013, UID/CEC/50021/2013, UID/EMS/00151/2013, and 02/SAICT/2017-POCI-01-0145-FEDER-029803.
Conflicts of Interest
The authors declare no conflict of interest.
Nomenclature
| Distributed generation index | |
| Electrical vehicle index | |
| Node index | |
| Connection point index with the upstream network | |
| Photovoltaic farm index | |
| Scenario index | |
| Time (in hours) index | |
| Arrival time index | |
| Linear partitions index in the linearization process | |
| Power Index () | |
| Wind farm index | |
| Unit generation cost | |
| EV battery charging efficiency (%) | |
| EV battery capacity (kW) | |
| Regulation cost in the day-ahead and real-time markets | |
| Daily distance traveled by EV (km) | |
| Upper limit in quadratic flow discretization (kVA) | |
| EV driving efficiency (km/kWh) | |
| Maximum current capacity in the line | |
| Planned active and reactive power, respectively | |
| Market compensation price | |
| EV power charging (kW) | |
| Probability of each scenario | |
| Maximum power capacity of each | |
| Day-ahead, and real-time markets regulation, respectively | |
| Distribution line resistance and inductance, respectively | |
| Maximum, minimum and nominal voltage, respectively | |
| Current flow, and quadratic current flow, for the day-ahead and real-time markets, respectively (A) | |
| Active and reactive power that flows in upstream direction in the day-ahead and real-time markets, respectively (kW) | |
| Active power in the day-ahead and real-time markets, respectively | |
| Active and reactive power that flows in downstream direction in the day-ahead and real-time markets, respectively (kW) | |
| Reactive power in the day-ahead and real-time markets, respectively | |
| EV state-of-charge | |
| Power factor | |
| Voltage, and quadratic voltage, for the day-ahead and real-time markets, respectively (V) |
References
- Llamas, J.; Bullejos, D.; Barranco, V.; de Adana, M.R. Regulation Issues for Renewable Energy Integration into Electrical Markets. In Proceedings of the 2017 IEEE International Conference on Environment and Electrical Engineering and 2017 IEEE Industrial and Commercial Power Systems Europe (EEEIC/I&CPS Europe), Milan, Italy, 6–9 June 2017. [Google Scholar] [CrossRef]
- Longo, M.; Yaici, W.; Foiadelli, F. Electric Vehicles Charged with Residential’s Roof Solar Photovoltaic System: A Case Study in Ottawa. In Proceedings of the 2017 IEEE 6th International Conference on Renewable Energy Research and Applications (ICRERA), San Diego, CA, USA, 5–8 November 2017. [Google Scholar] [CrossRef]
- Ekman, C.K. On the Synergy between Large Electric Vehicle Fleet and High Wind Penetration—An Analysis of the Danish Case. Renew. Energy 2011, 36, 546–553. [Google Scholar] [CrossRef]
- Mouli, G.R.C.; Venugopal, P.; Bauer, P. Future of Electric Vehicle Charging. In Proceedings of the 2017 International Symposium on Power Electronics (Ee), Novi Sad, Serbia, 19–21 October 2017. [Google Scholar] [CrossRef]
- Hu, W.; Su, C.; Chen, Z.; Bak-Jensen, B. Optimal Operation of Plug-In Electric Vehicles in Power Systems with High Wind Power Penetrations. IEEE Trans. Sustain. Energy 2013, 4, 577–585. [Google Scholar]
- Mortazavi, H.; Mehrjerdi, H.; Saad, M.; Lefebvre, S.; Asber, D.; Lenoir, L. A Monitoring Technique for Reversed Power Flow Detection with High PV Penetration Level. IEEE Trans. Smart Grid 2015, 6, 2221–2232. [Google Scholar] [CrossRef]
- Liu, Y.; Gao, S.; Zhao, X.; Han, S.; Wang, H.; Zhang, Q. Demand Response Capability of V2G Based Electric Vehicles in Distribution Networks. In Proceedings of the 2017 IEEE PES Innovative Smart Grid Technologies Conference Europe (ISGT-Europe), Torino, Italy, 26–29 September 2017. [Google Scholar] [CrossRef]
- Kavousi-Fard, A.; Niknam, T.; Fotuhi-Firuzabad, M. Stochastic Reconfiguration and Optimal Coordination of V2G Plug-in Electric Vehicles Considering Correlated Wind Power Generation. IEEE Trans. Sustain. Energy 2015, 6, 822–830. [Google Scholar] [CrossRef]
- Khalid, M.W.; Al -Awami, A.T.; Sortomme, E. Stochastic-Programming-Based Bidding Strategy for V2G Services. In Proceedings of the IEEE PES ISGT Europe 2013, Lyngby, Denmark, 6–9 October 2013. [Google Scholar] [CrossRef]
- Moradijoz, M.; Parsa Moghaddam, M.; Haghifam, M.R.; Alishahi, E. A Multi-Objective Optimization Problem for Allocating Parking Lots in a Distribution Network. Int. J. Electr. Power Energy Syst. 2013, 46, 115–122. [Google Scholar] [CrossRef]
- Venayagamoorthy, G. Dynamic, Stochastic, Computational, and Scalable Technologies for Smart Grids. IEEE Comput. Intell. Mag. 2011, 6, 22–35. [Google Scholar] [CrossRef]
- Tan, J.; Wang, L. Integration of Plug-in Hybrid Electric Vehicles into Residential Distribution Grid Based on Two-Layer Intelligent Optimization. IEEE Trans. Smart Grid 2014, 5, 1774–1784. [Google Scholar] [CrossRef]
- Laureri, F.; Puliga, L.; Robba, M.; Delfino, F.; Bulto, G.O. An Optimization Model for the Integration of Electric Vehicles and Smart Grids: Problem Definition and Experimental Validation. In Proceedings of the 2016 IEEE International Smart Cities Conference (ISC2), Trento, Italy, 12–15 September 2016. [Google Scholar] [CrossRef]
- Qian, K.; Zhou, C.; Allan, M.; Yuan, Y. Modeling of Load Demand Due to EV Battery Charging in Distribution Systems. IEEE Trans. Power Syst. 2011, 26, 802–810. [Google Scholar] [CrossRef]
- Miceli, R.; Viola, F. Designing a Sustainable University Recharge Area for Electric Vehicles: Technical and Economic Analysis. Energies 2017, 10, 1604. [Google Scholar] [CrossRef]
- Pinto, Y.G.; Trindade, F.C.L.; Cebrian, J.C.; Teixeira, W.W. Investigation of Infrastructural Solutions to Mitigate the Impacts of EV Recharging at LV Networks. In Proceedings of the 2017 IEEE PES Innovative Smart Grid Technologies Conference—Latin America (ISGT Latin America), Quito, Ecuador, 20–22 September 2017. [Google Scholar] [CrossRef]
- Khodakarami, A.; Farahani, H.F.; Aghaei, J. Stochastic Characterization of Electricity Energy Markets Including Plug-in Electric Vehicles. Renew. Sustain. Energy Rev. 2017, 69, 112–122. [Google Scholar] [CrossRef]
- Erdinc, O.; Paterakis, N.G.; Mendes, T.D.P.; Bakirtzis, A.G.; Catalao, P.S.J. Smart Household Operation Considering Bi-Directional EV and ESS Utilization by Real-Time Pricing-Based DR. IEEE Trans. Smart Grid 2015, 6, 1281–1291. [Google Scholar] [CrossRef]
- Richardson, P.; Flynn, D.; Keane, A. Local Versus Centralized Charging Strategies for Electric Vehicles in Low Voltage Distribution Systems. IEEE Trans. Smart Grid 2012, 3, 1020–1028. [Google Scholar] [CrossRef] [Green Version]
- Ashtari, A.; Bibeau, E.; Shahidinejad, S.; Molinski, T. PEV Charging Profile Prediction and Analysis Based on Vehicle Usage Data. IEEE Trans. Smart Grid 2012, 3, 341–350. [Google Scholar] [CrossRef]
- Scalfati, A.; Iannuzzi, D.; Fantauzzi, M.; Roscia, M. Optimal Sizing of Distributed Energy Resources in Smart Microgrids: A Mixed Integer Linear Programming Formulation. In Proceedings of the 2017 IEEE 6th International Conference on Renewable Energy Research and Applications (ICRERA), San Diego, CA, USA, 5–8 November 2017. [Google Scholar] [CrossRef]
- GAMS Development Corp.; GAMS Software GmbH. General Algebraic Modeling System (GAMS) —Cutting Edge Modeling. Available online: https://www.gams.com/ (accessed on 2 November 2018).
- GM-Volt.com LLC. Chevy Volt Specs—GM-VOLT: Chevy Volt Electric Car Site GM-VOLT: Chevy Volt Electric Car Site. Available online: https://gm-volt.com/full-specifications/ (accessed on 9 April 2018).
- Sustainable Enterprises Media Inc. 2018 Nissan Leaf Specs. Available online: https://evobsession.com/2018-nissan-leaf-specs/ (accessed on 9 April 2018).
- BMW of North America. BMW i3-Features & Specifications—BMW USA. Available online: https://www.bmwusa.com/vehicles/bmwi/bmw-i3/bmw-i3-features-and-specs.html (accessed on 9 April 2018).
- Tesla. Model S Specifications | Tesla. Available online: https://www.tesla.com/support/model-s-specifications (accessed on 9 April 2018).
- SoftNews NET. RENAULT ZOE Specs & Photos—2013, 2014, 2015, 2016, 2017, 2018—Autoevolution. Available online: https://www.autoevolution.com/cars/renault-zoe-2013.html#aeng_renault-zoe-2013-65kw-88-hp (accessed on 9 April 2018).
Figure 1.
Grid under analysis.

Figure 2.
Wind power scenarios considered.
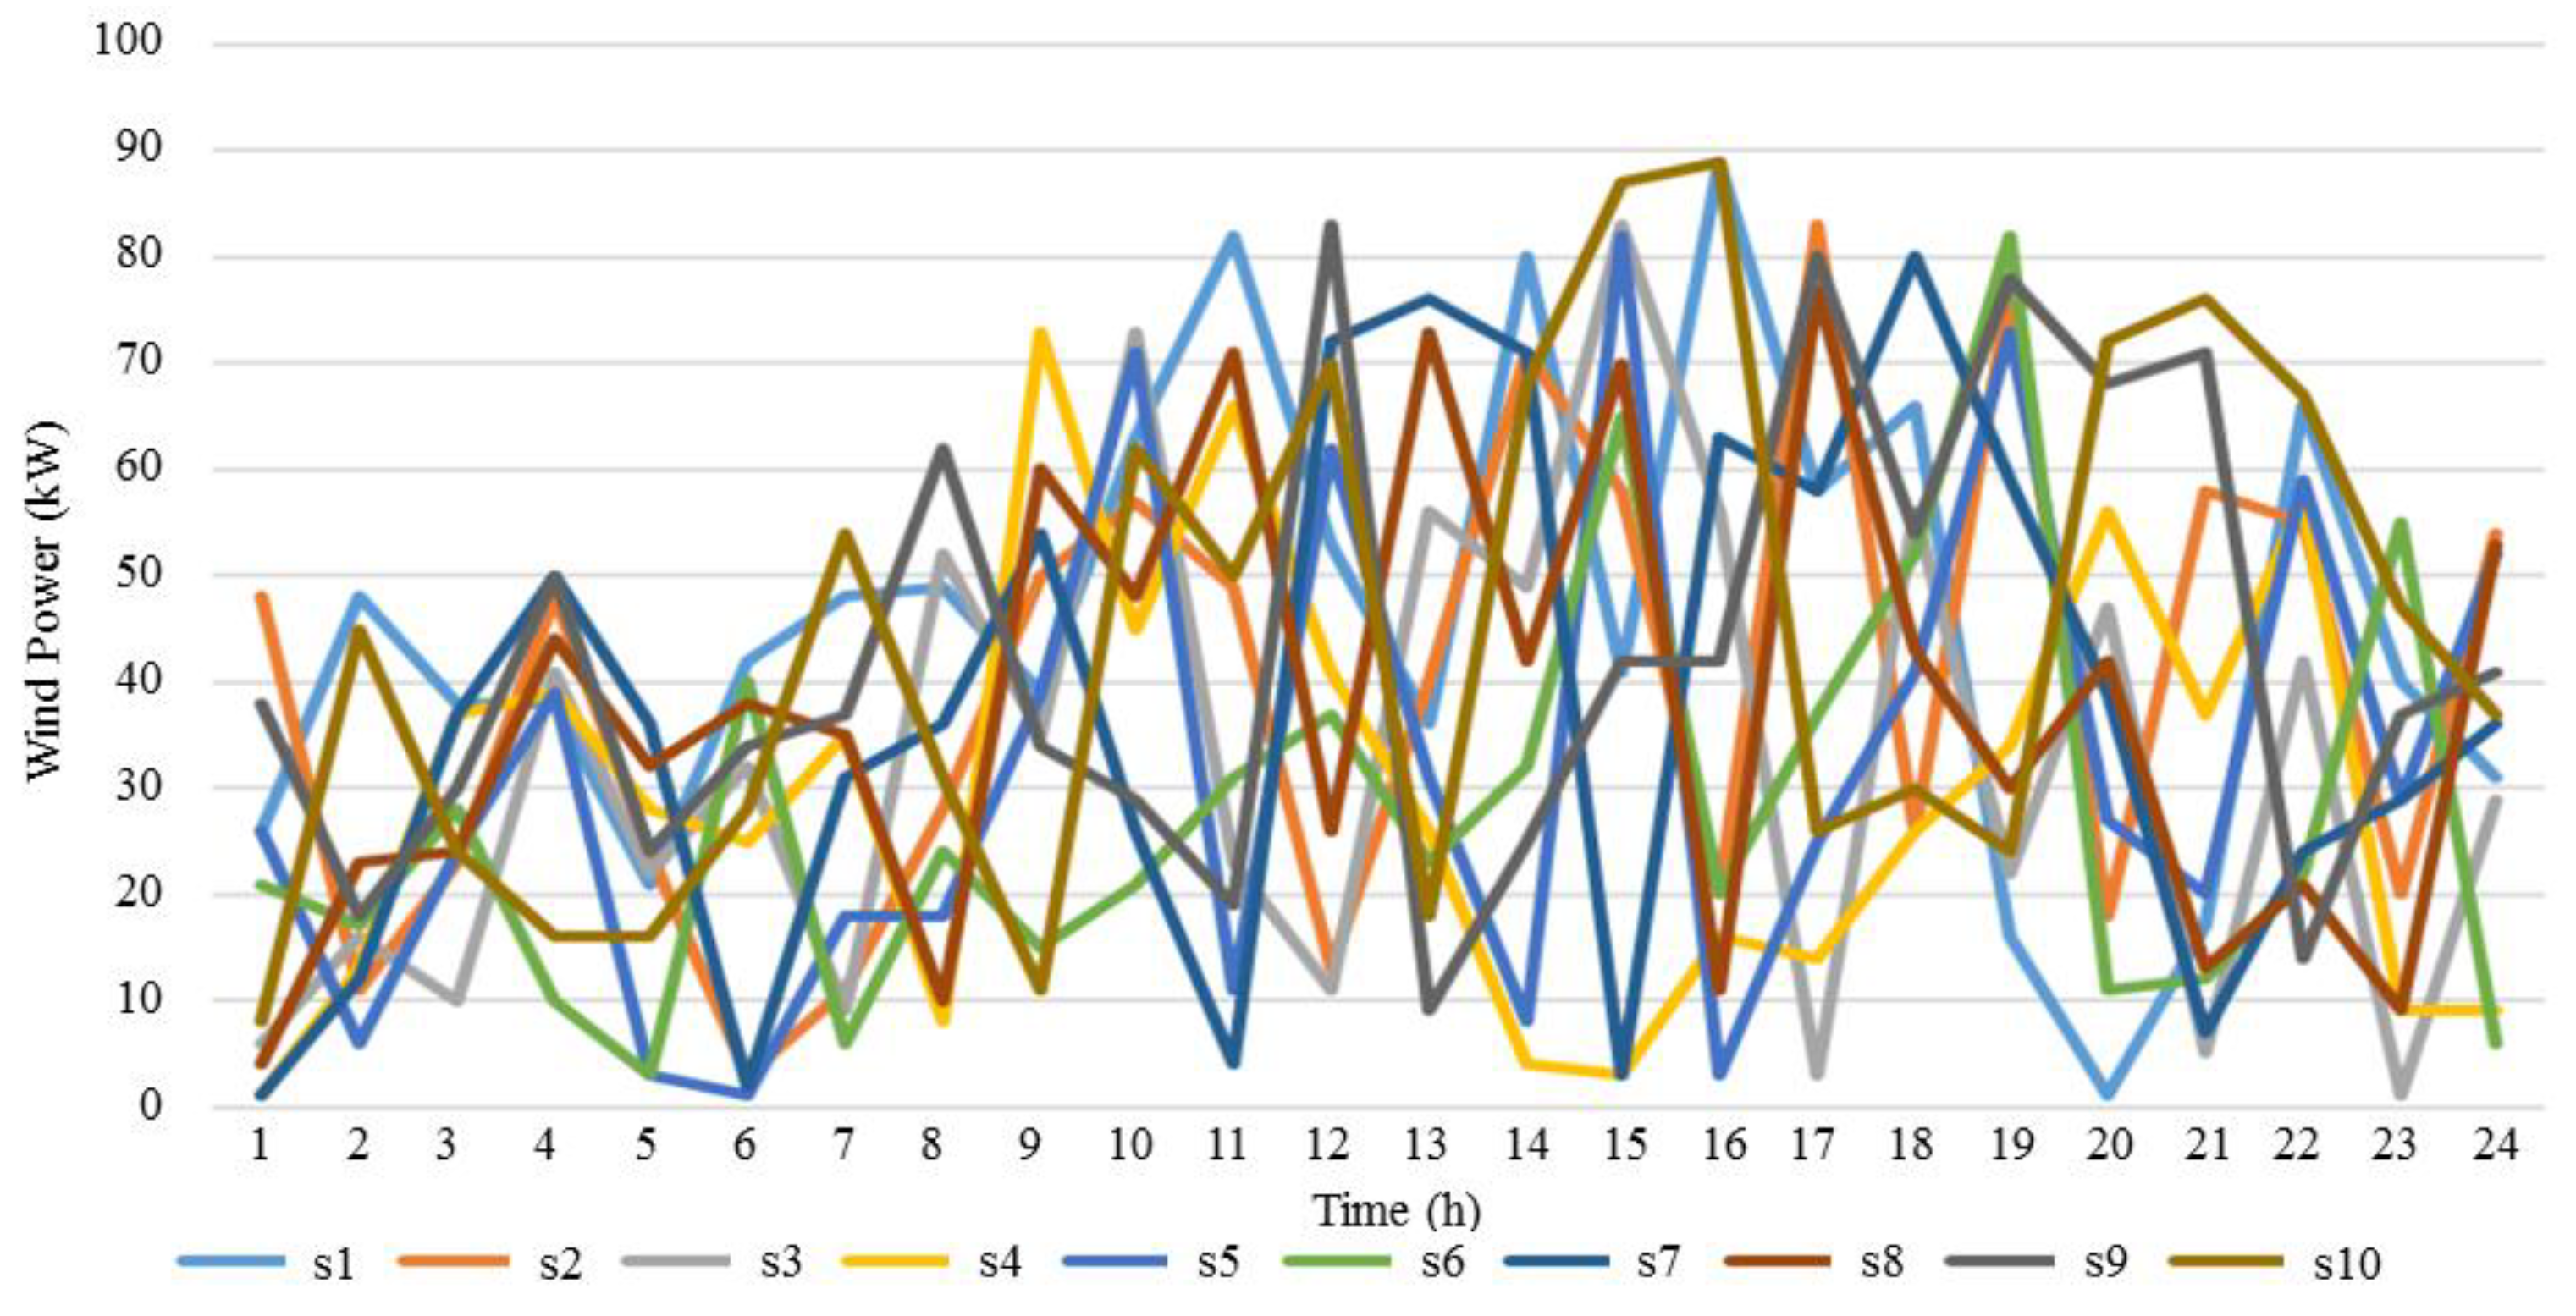
Figure 3.
Photovoltaic (PV) power scenarios considered.

Figure 4.
Hourly load curve considered.

Figure 5.
Hourly electricity prices.

Figure 6.
Distribution of distance traveled by EVs.

Figure 7.
Distribution of EVs State-of-Charge (SoC) on arrival at the residence.

Figure 8.
Load demand profile for Case 2 (15 EVs, uncontrolled charging).

Figure 9.
Load demand comparison between the base case and Case 2 (15 EVs, uncontrolled charging).

Figure 10.
Load demand profile for Case 3 (30 EVs, uncontrolled charging).

Figure 11.
Load demand comparison between the base case and Case 3 (30 EVs, uncontrolled charging).

Figure 12.
Load demand profile for Case 4 (50 EVs, uncontrolled charging).

Figure 13.
Load demand comparison between the base case and Case 4 (50 EVs, uncontrolled charging).
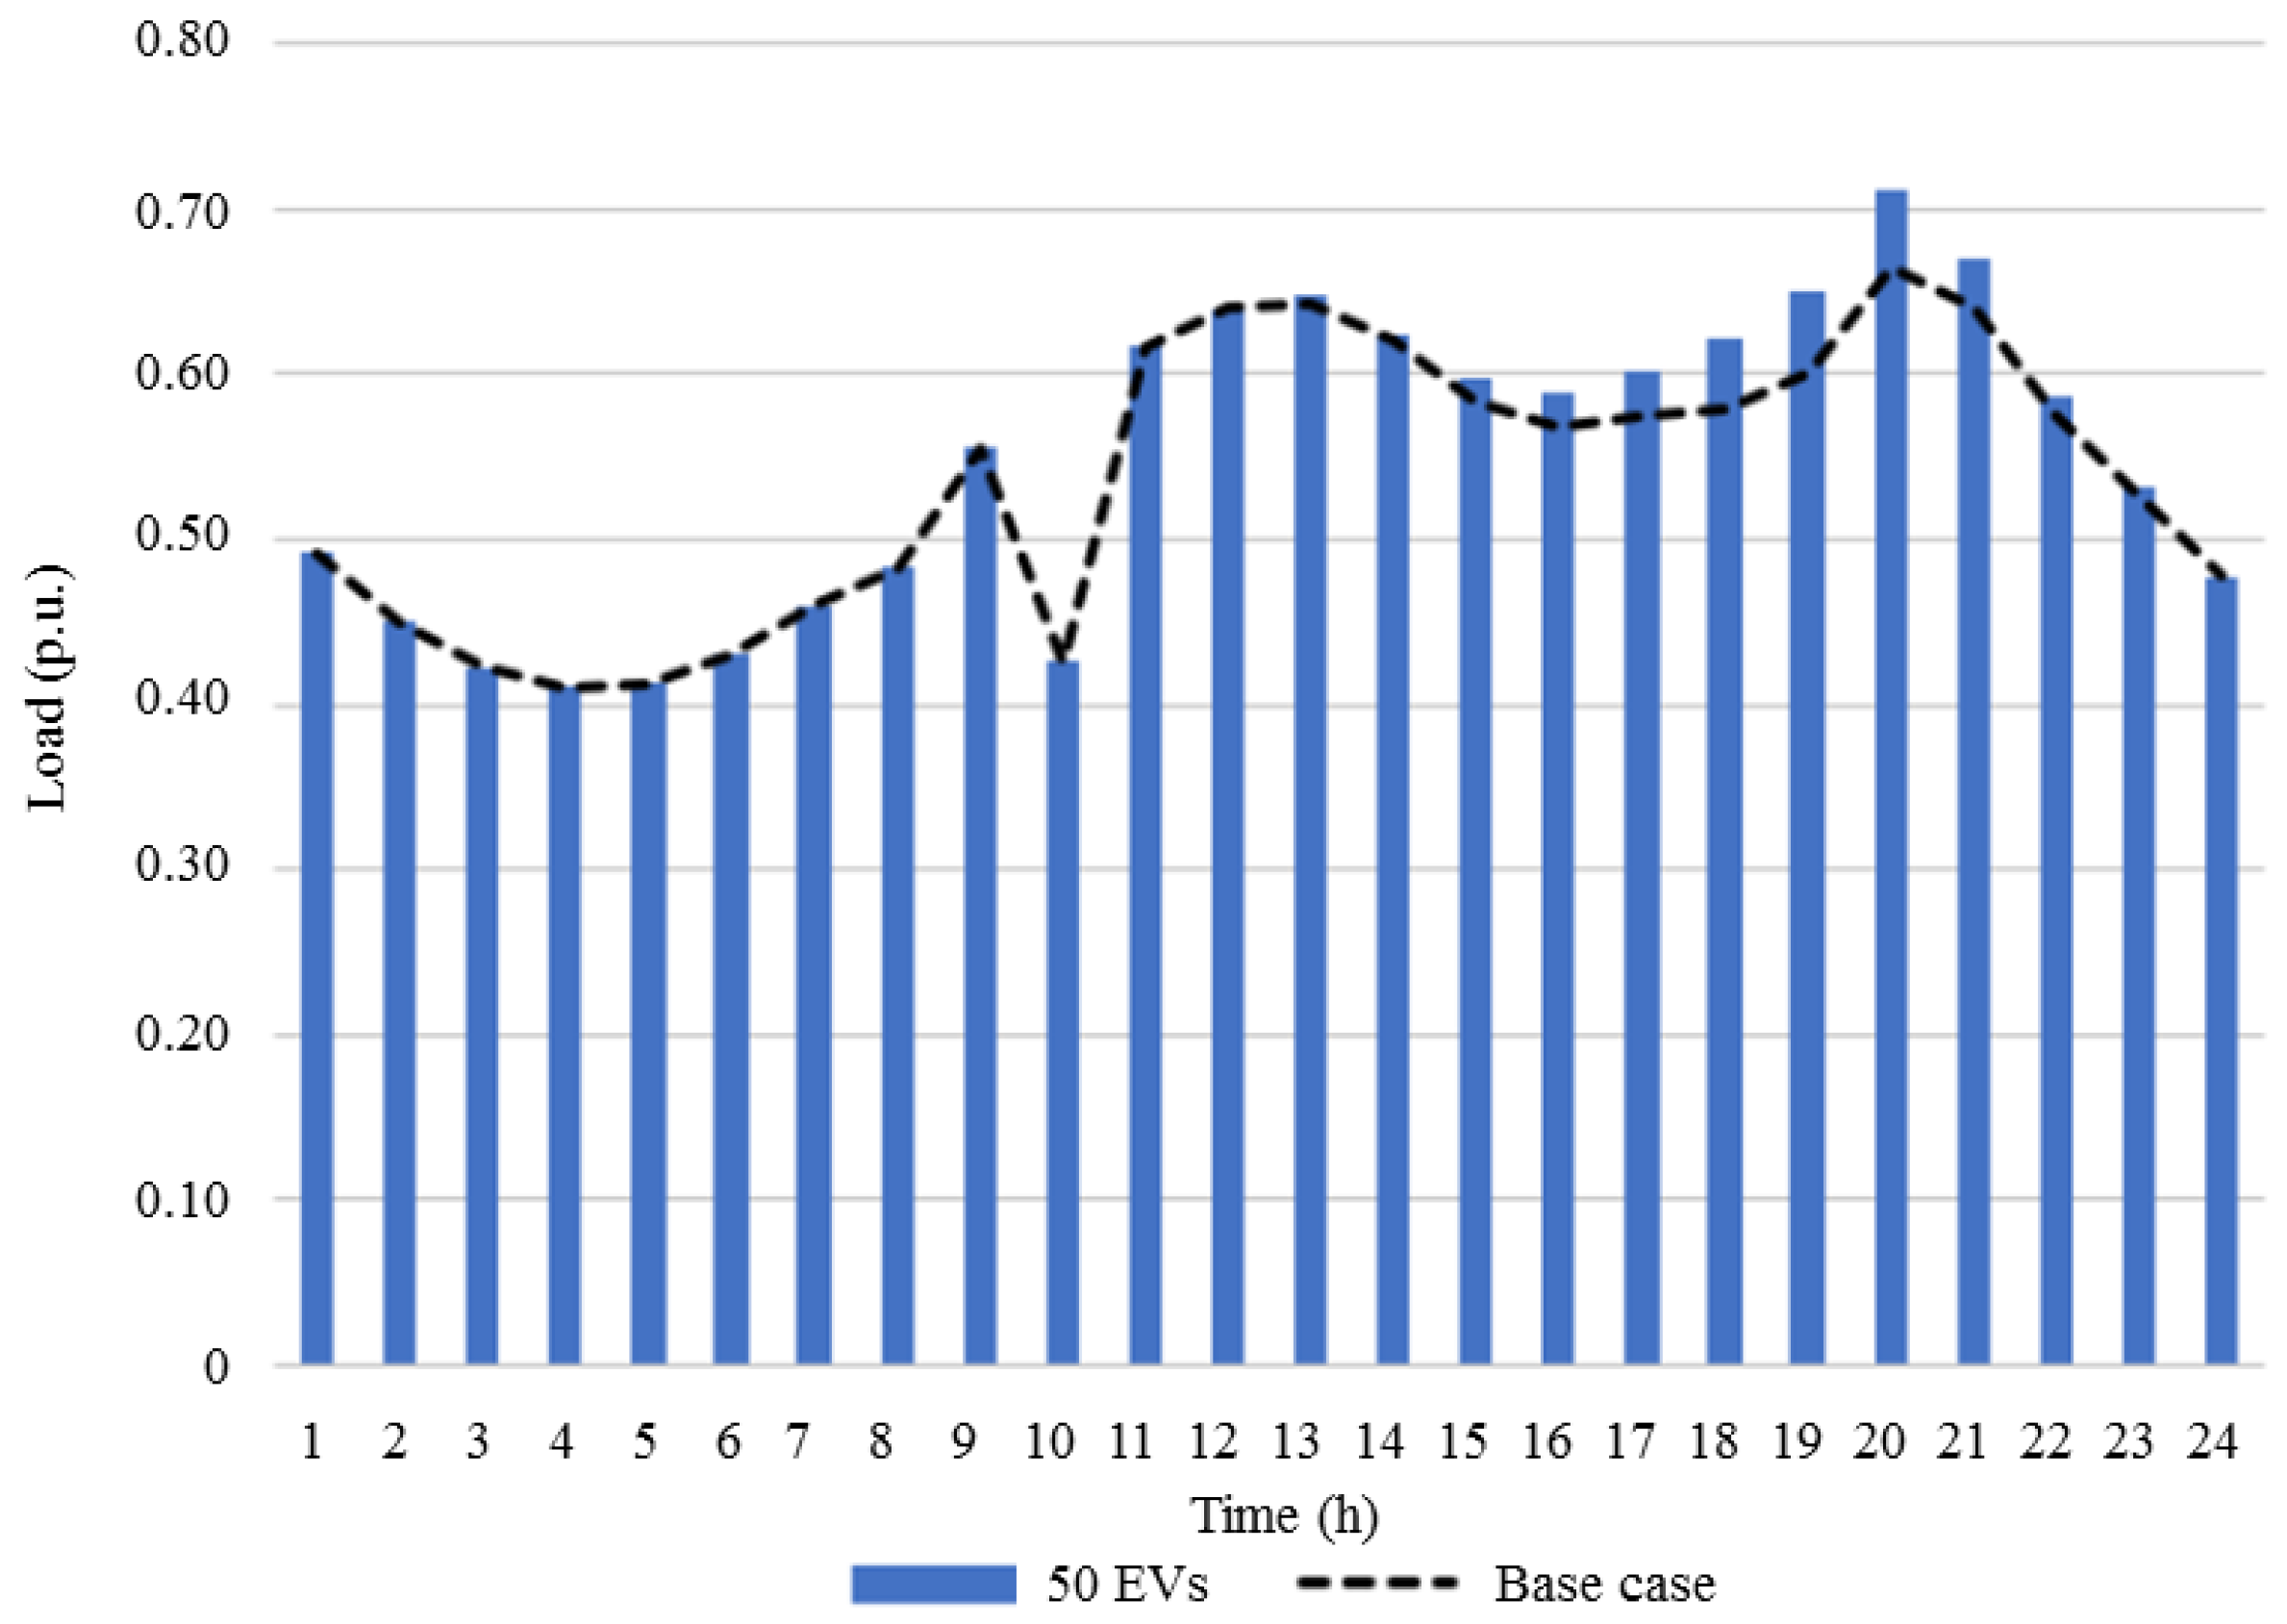
Figure 14.
Load demand profile for Case 5 (15 EVs, controlled charging).

Figure 15.
Load demand profile for Case 6 (30 EVs, controlled charging).

Figure 16.
Load demand profile for Case 7 (50 EVs, controlled charging).

Figure 17.
Load demand comparison between the base case and Case 5 (15 EVs, controlled charging).
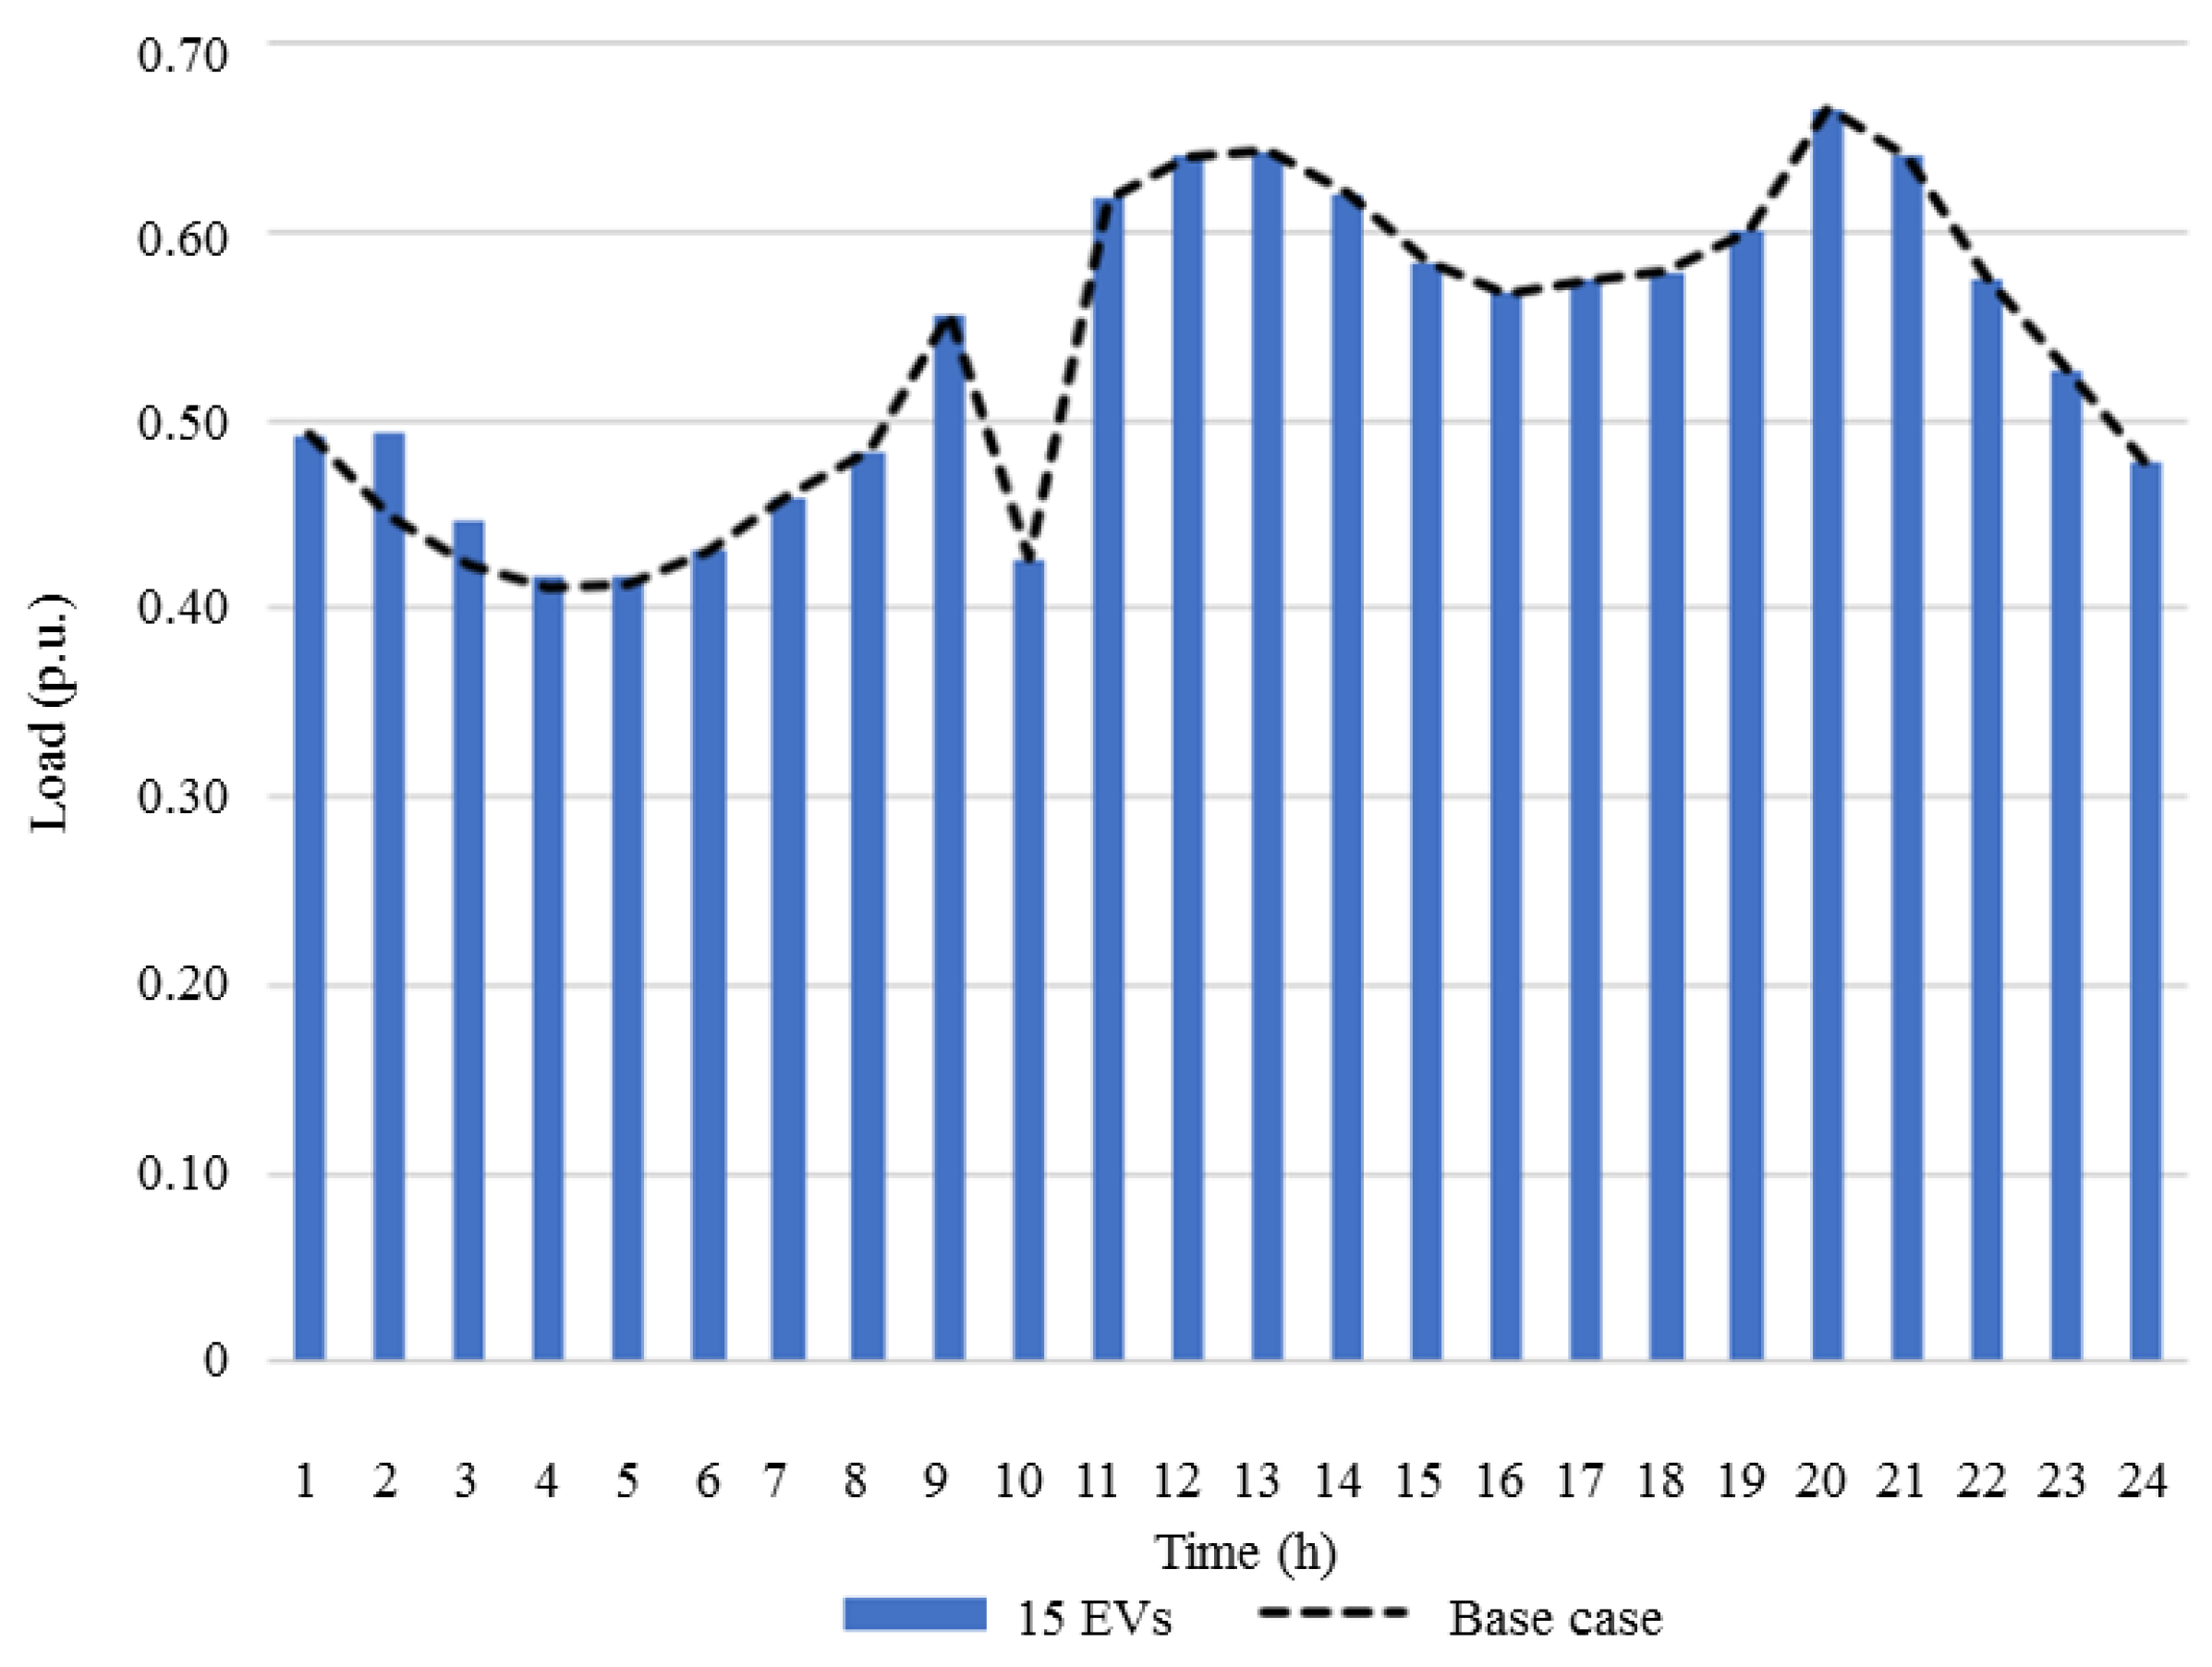
Figure 18.
Load demand comparison between the base case and Case 6 (30 EVs, controlled charging).

Figure 19.
Load demand comparison between the base case and Case 6 (50 EVs, controlled charging).


Table 1.
Conventional generation features.
| Generator | Power (kW) | |
|---|---|---|
| 1 (Bus 05) | 23.00 | 230.00 |
| 2 (Bus 13) | 69.00 | 690.00 |
| 3 (Bus 14) | 46.00 | 460.00 |
Table 2.
Electric Vehicle (EV) features under analysis.
| EV Model | Battery Capacity (kWh) | Charging Power (kW) | Electrical Driving Efficiency (km/kWh) | EV number |
|---|---|---|---|---|
| Chevrolet Volt | 16.00 | 3.50 | 3.75 | 01; 06; 11; 16; 21; 26; 31; 36; 41; 46 |
| Nissan Leaf | 24.00 | 4.00 | 6.70 | 02; 07; 12; 17; 22; 27; 32 37; 42; 47 |
| BMW i3 | 22.00 | 11.00 | 7.20 | 03; 08; 13; 18; 23; 28; 33; 38; 43; 48 |
| Tesla S | 60.00 | 11.00 | 6.70 | 04; 09; 14; 19; 24; 29; 34; 39; 44; 49 |
| Renault Zoe | 22.00 | 3.50 | 6.70 | 05; 10; 15; 20; 25; 30; 35; 40; 45; 50 |
Table 3.
EVs () departure ()/arrival () time considered.
| Time (h) | BUS | |||||||||||||
|---|---|---|---|---|---|---|---|---|---|---|---|---|---|---|
| 2 | 3 | 4 | 5 | 6 | 7 | 8 | 9 | 10 | 11 | 12 | 13 | 14 | 15 | |
| 06:00 a.m. | - | - | - | - | - | - | - | - | - | - | - | - | ||
| 07:00 | - | - | - | - | - | - | - | - | ||||||
| 08:00 | - | - | ||||||||||||
| 09:00 | - | - | - | - | - | - | ||||||||
| 10:00 | - | - | - | - | - | - | - | - | ||||||
| 11:00 | - | - | - | - | - | - | - | - | - | - | - | - | ||
| 12:00 a.m. | - | - | - | - | - | - | - | - | - | - | - | - | - | |
| 01:00 p.m. | - | - | - | - | - | - | - | - | - | - | - | - | - | |
| 02:00 | - | - | - | - | - | - | - | - | - | - | - | - | ||
| 03:00 | - | - | - | - | - | - | - | - | - | - | - | |||
| 04:00 | - | - | - | - | - | - | - | - | - | - | ||||
| 05:00 | - | - | - | - | ||||||||||
| 06:00 | - | - | - | - | - | - | - | |||||||
| 07:00 | - | - | - | - | - | - | - | - | - | |||||
| 08:00 | - | - | - | - | - | - | - | - | ||||||
| 09:00 p.m. | - | - | - | - | - | - | - | - | - | - | - | |||
Table 4.
Cases studies description.
| Case | Penetration (# of EVs) | Controlled/Uncontrolled |
|---|---|---|
| 1 (base case) | 0 | - |
| 2 | 15 | uncontrolled |
| 3 | 30 | uncontrolled |
| 4 | 50 | uncontrolled |
| 5 | 15 | controlled |
| 6 | 30 | controlled |
| 7 | 50 | controlled |
© 2018 by the authors. Licensee MDPI, Basel, Switzerland. This article is an open access article distributed under the terms and conditions of the Creative Commons Attribution (CC BY) license (http://creativecommons.org/licenses/by/4.0/).
Share and Cite
MDPI and ACS Style
Osório, G.J.; Shafie-khah, M.; Coimbra, P.D.L.; Lotfi, M.; Catalão, J.P.S. Distribution System Operation with Electric Vehicle Charging Schedules and Renewable Energy Resources. Energies 2018, 11, 3117. https://doi.org/10.3390/en11113117
AMA Style
Osório GJ, Shafie-khah M, Coimbra PDL, Lotfi M, Catalão JPS. Distribution System Operation with Electric Vehicle Charging Schedules and Renewable Energy Resources. Energies. 2018; 11(11):3117. https://doi.org/10.3390/en11113117
Chicago/Turabian StyleOsório, Gerardo J., Miadreza Shafie-khah, Pedro D. L. Coimbra, Mohamed Lotfi, and João P. S. Catalão. 2018. "Distribution System Operation with Electric Vehicle Charging Schedules and Renewable Energy Resources" Energies 11, no. 11: 3117. https://doi.org/10.3390/en11113117
Note that from the first issue of 2016, this journal uses article numbers instead of page numbers. See further details here.