Suppression of Electron Avalanches in Ultra-Dilute SF6-N2 Mixtures Subjected to Time-Invariant Crossed Fields


1
Department of Electrical and Electronic Engineering, Near East University, Nicosia 99138, Cyprus
2
Department of Electrical-Electronic Engineering, Gazi University, Ankara 06570, Turkey
*
Author to whom correspondence should be addressed.
Energies 2018, 11(12), 3247; https://doi.org/10.3390/en11123247
Submission received: 13 October 2018
/
Revised: 18 November 2018
/
Accepted: 20 November 2018
/
Published: 22 November 2018
(This article belongs to the Special Issue Selected Papers from EEEIC 2018—18th International Conference on Environment and Electrical Engineering)
Abstract
:Ultra-dilute SF6 + N2 mixtures are subjected to crossed fields with the applied magnetic field normal to the electric field in order to investigate critical magnetic field values for suppression of electron avalanche growth resulting in increased dielectric strength. Electron avalanche growth inhibition together with the related electron mean energy variation and electron energy distribution functions are reported in the binary mixtures subjected to the combined fields. Even if a very small amount of greenhouse gas (SF6) is used, high dielectric strength can be achieved in the binary mixtures with 0.25%, 0.50%, 0.75%, 3%, and 7% SF6 contents subjected to the evaluated combined fields. The magnitude of the crossed magnetic field, which results in avalanche growth inhibition, decreases as the electronegativity of the mixture is increased.
1. Introduction
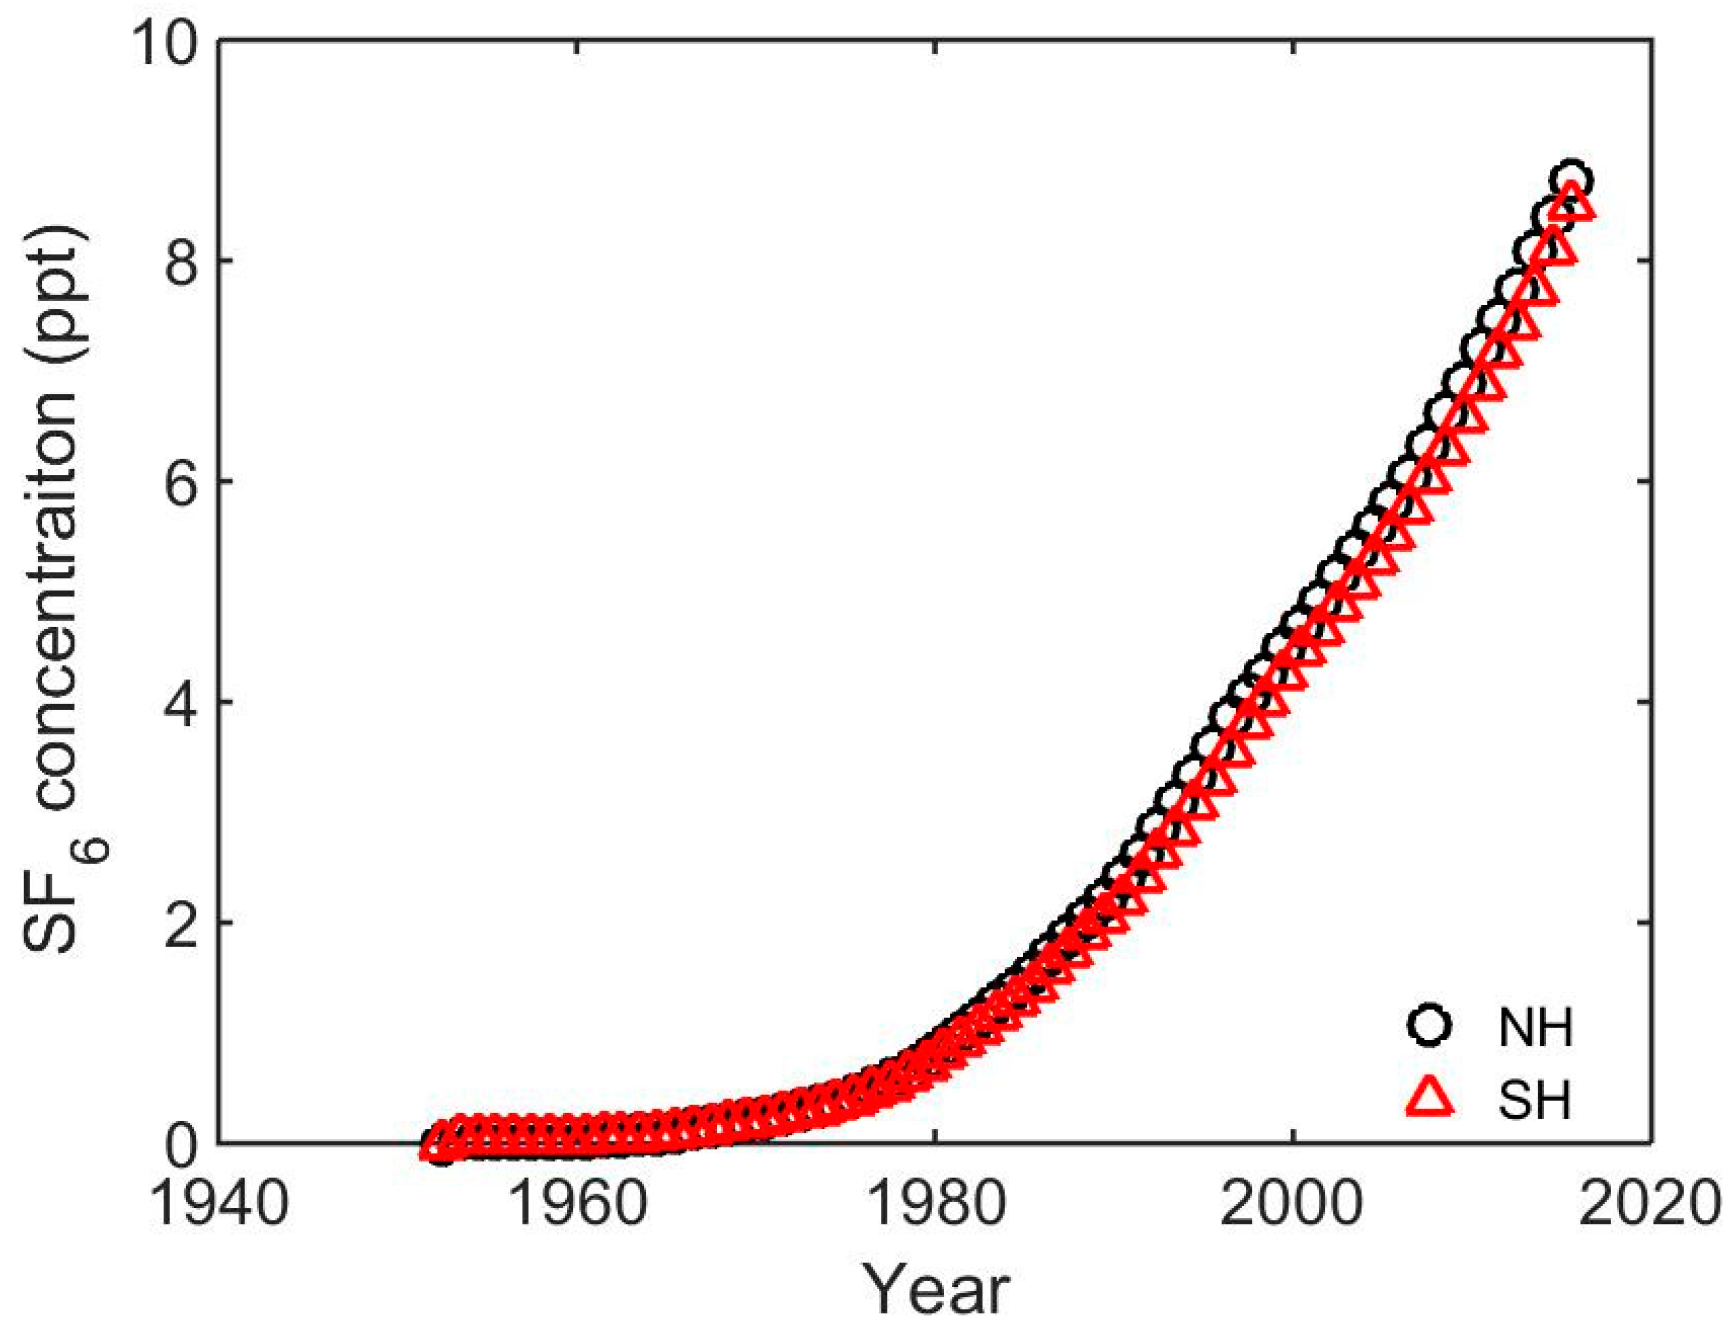
Sulfur hexafluoride (SF6) is widely used in electrical power applications due to its high breakdown voltage, good thermal property, and inertness [1]. However, SF6 is a fluorinated greenhouse gas, which has the high global warming potential of 23,900 for 100 years and a lifetime of 3200 years [2]. Because of its global warming potential, the usage of SF6 is restricted by the Kyoto Protocol [3]. However, the average concentrations of atmospheric greenhouse gases are continuing to increase and this trend shows in Table 1. The annual average concentration of greenhouse gases increased to 0.887, 2.13, and 2.95 parts per million in CO2 equivalents (ppm CO2 eq.) in 1950, 1990, and 2015, respectively [4]. This greenhouse gas concentration level is more than three times as compared to 1950, when human-produced gases, such as SF6, began to be used in industry.
The use of greenhouse gases under the Montreal protocol has declined considerably due to damage to the ozone layer. However, the Kyoto protocol, which restricts the use of perfluorocarbon (PFC), hydrofluorocarbon (HFC), and SF6 gases, cannot be implemented sufficiently. Figure 1 shows the change in the concentration of the SF6 gas, which continues to be widely used in the electrical industry and other industrial production in the northern and southern hemispheres.
One of the best solutions for SF6 replacement is a gas mixture of SF6 with various buffer gases, such as nitrogen (N2) [3,7], carbon dioxide (CO2) [8], helium (He) [9], and argon (Ar) [10,11]. N2 and SF6 binary mixtures have been investigated for a few decades.
The mixtures of SF6 and N2 are very promising for applications in gas-insulated equipment due to their high dielectric strength, and nitrogen is inexpensive and harmless for the environment. In addition, mixing nitrogen with SF6 increases the range of the operating temperature of the gas-insulated equipment for colder climate applications [12]. Nitrogen constitutes almost 80% of the composition of the Earth’s atmosphere, and its physical and environmental characteristics are very similar to that of dry air. Some physical, chemical, and environmental characteristics of SF6, N2, and dry air are shown in Table 2.
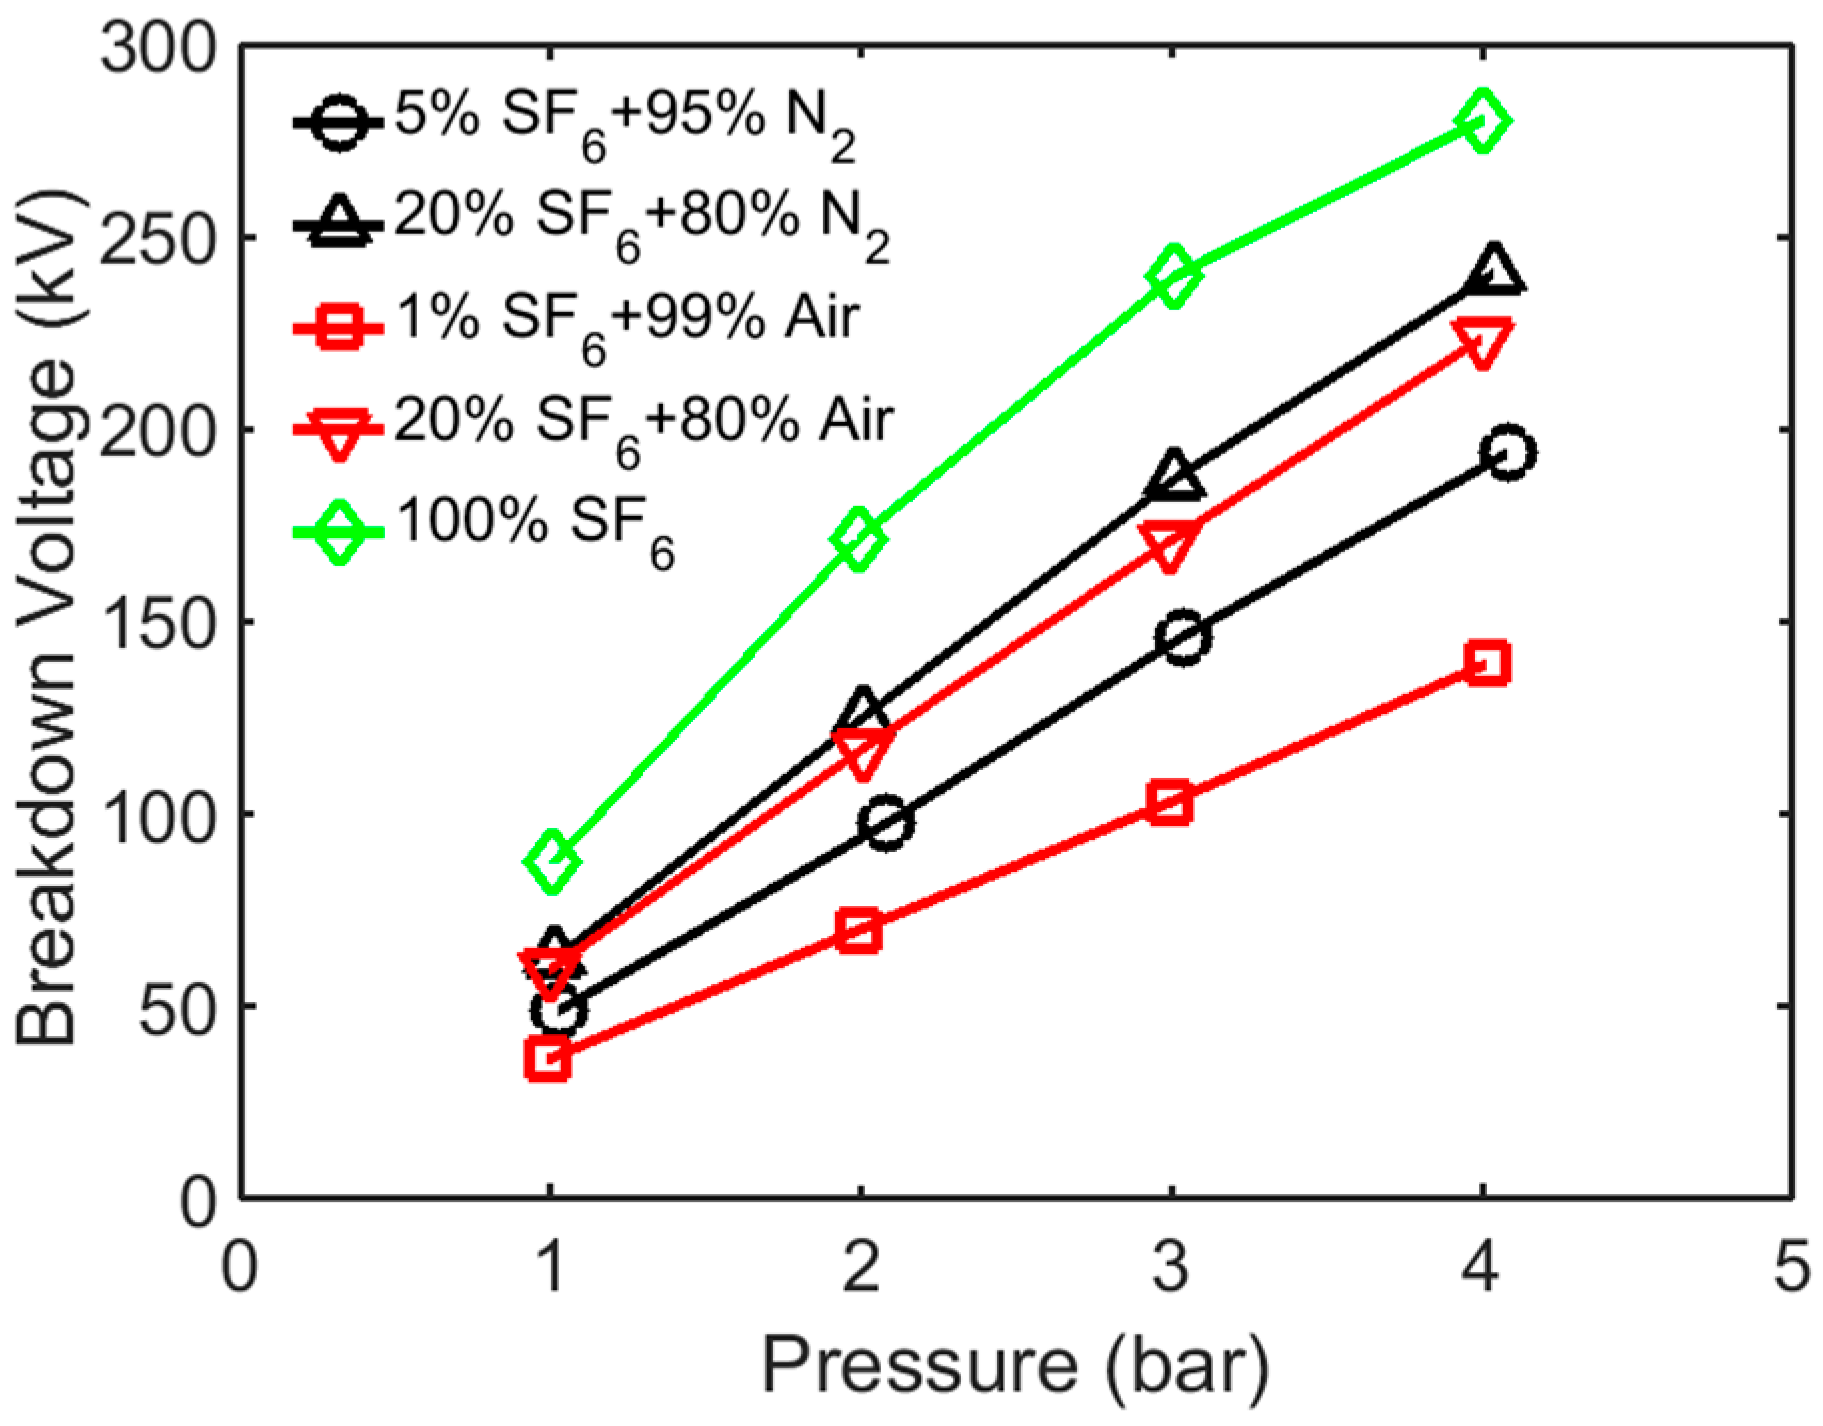
Figure 2 gives measured breakdown voltages in binary mixtures of SF6 with N2 and Air as a function of gas pressure in a uniform field gap [17]. For a given binary mixture, the breakdown voltage increases with increasing pressure as expected. Furthermore, it can be seen from Figure 2 that, at a given pressure, the breakdown voltage increases with the addition of the SF6 component in the binary mixtures. The related data in the literature for an SF6 + N2 mixture also confirm the dielectric performance in non-uniform fields compared to that of SF6 since an SF6 + N2 mixture is not prone to surface imperfections [18].
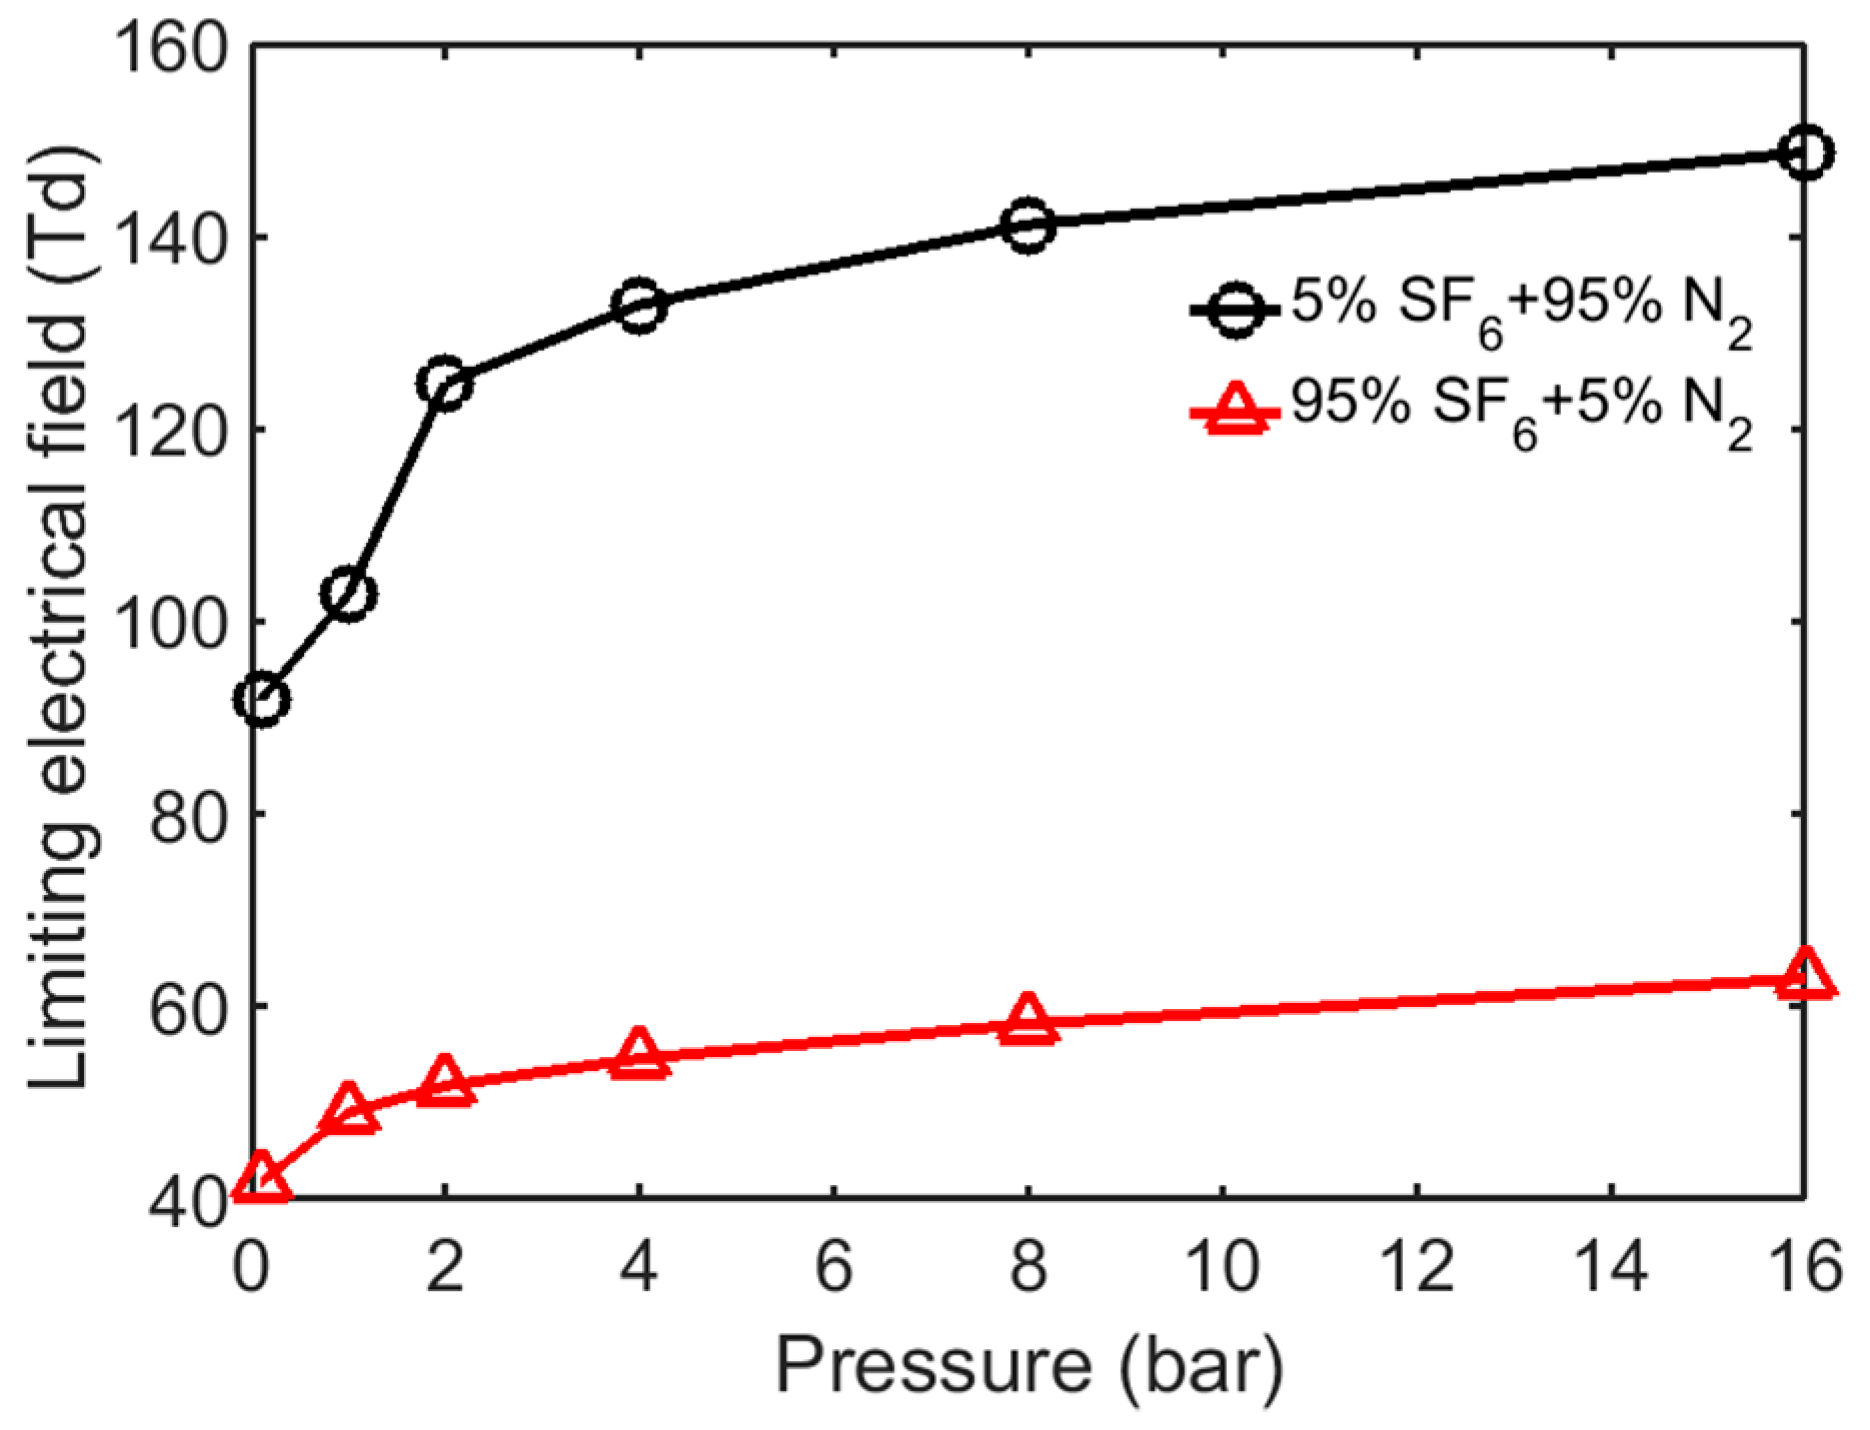
At high temperatures above 1000 Kelvin (K), the results of Zhao et al. [19] yielding the limiting electric field at the threshold of the breakdown voltage in SF6 + N2 mixtures should be mentioned. Most SF6 molecules decompose above 2000 K, forming other molecules or atoms. However, a nitrogen molecule does not experience the same fate and does not decompose at similar temperatures. As can be seen from Figure 3, at 3000 K, a 5% SF6 binary mixture has a higher dielectric strength compared to that of a 95% SF6 binary mixture since most of the molecules in the 95% binary mixture are decomposed.
In the present study, ultra-dilute SF6 + N2 mixtures are subjected to crossed fields with the applied magnetic field being perpendicular to the electric field in order to investigate critical magnetic field values for the suppression of electron avalanche growth resulting in increased dielectric strength. Even if a very small amount of greenhouse gas (SF6) is used, high dielectric strength can be achieved by applying the magnetic field perpendicular to the electric field.
The electron swarm is significantly influenced in combined fields where the magnetic field is normal to the electric field. This fact is crucial in switch design and gas-insulated system applications where the main objective is to have sufficient dielectric strength and interrupt the electric arc as rapidly as possible. The information on the response of ultra-dilute SF6 + N2 mixtures under combined fields is limited in the literature [15]. Therefore, the aim of present study is to investigate swarm development in ultra-dilute SF6 + N2 mixtures subjected to combined fields. Combined fields with specific magnetic field values are calculated in Townsend discharges of ultra-dilute SF6 + N2 mixtures for the specific cases in which the ionization processes are balanced by attachment processes. A direct Monte Carlo simulation technique is employed. The simulation technique and the model adopted have been described before by Dincer et al. in detail [20,21].
2. Materials and Methods
Uniform time-invariant electric and magnetic fields are applied along the –z and –y directions, respectively. The movement of an electron with velocity v between collisions is expressed by the Lorentz force equation as given by [15]
where is the electric field and is the magnetic field, and e and m are the charge and mass of an electron, respectively.
The technique is based on a free-flight time approach. The mean free-flight time is defined as
in which the number density of gas molecules is N, the electron velocity is v, and the total collision cross section of the mixture is defined as QTMX.
E/N and B/N are the density normalized electric and magnetic fields, respectively. In the following sections of this study, the terms electric and magnetic field are used instead of density normalized electric field and density normalized magnetic field. The units of these normalized electrical and magnetic fields are, respectively, Td (Townsend) and Tcm3 (or Tm3). These units are widely used in plasma engineering and gaseous discharge studies. The use of the term B to express the magnetic field is also common in physics [22,23,24]. Technically, B is the magnetic flux density measured in Newton-meters per ampere (Nm/A), also called Tesla (T), and the magnetic field strength is defined as H measured in ampere per meter (A/m).
In the present paper, we use the widely accepted term B/N for the number density normalized magnetic field. However, we also report the corresponding magnetic field strength H at the given number density in A/m, which can be visualized and understood practically for possible switching applications.
The energy-dependent total cross section of the mixture with ultra-dilute SF6 content is described in Equation (3), where QTSF6 and QTN2 are the total cross section of SF6 and N2 evaluated from the momentum transfer and inelastic collision cross sections, respectively, and c is the fractional content of the SF6 component in the mixture.
In the present study, the collision cross section sets employed for nitrogen and SF6 are by Phelps and Pitchford [25] and Itoh et al. [26,27], respectively.
The motions of an electron along the respective directions are calculated with a time step Δt in such a way that the energy change during Δt is limited to less than 3% [15]. In the time step Δt, the collision probability is defined as
which is tested by comparing Pcol with a uniformly distributed random number between 0 and 1.
Since there is no acceleration along the magnetic field direction, the electron displacement positions, with the velocity component −vz along the applied field direction and −vy normal to the electric field, are given as
where the superscripts “1” and “2” correspond to the first and last positions of an electron during a time step Δt, respectively. At the end of each time step, the electron energies and positions are updated.
If there is a collision, the type of the molecule that collided is decided on by the scheme in Figure 4.
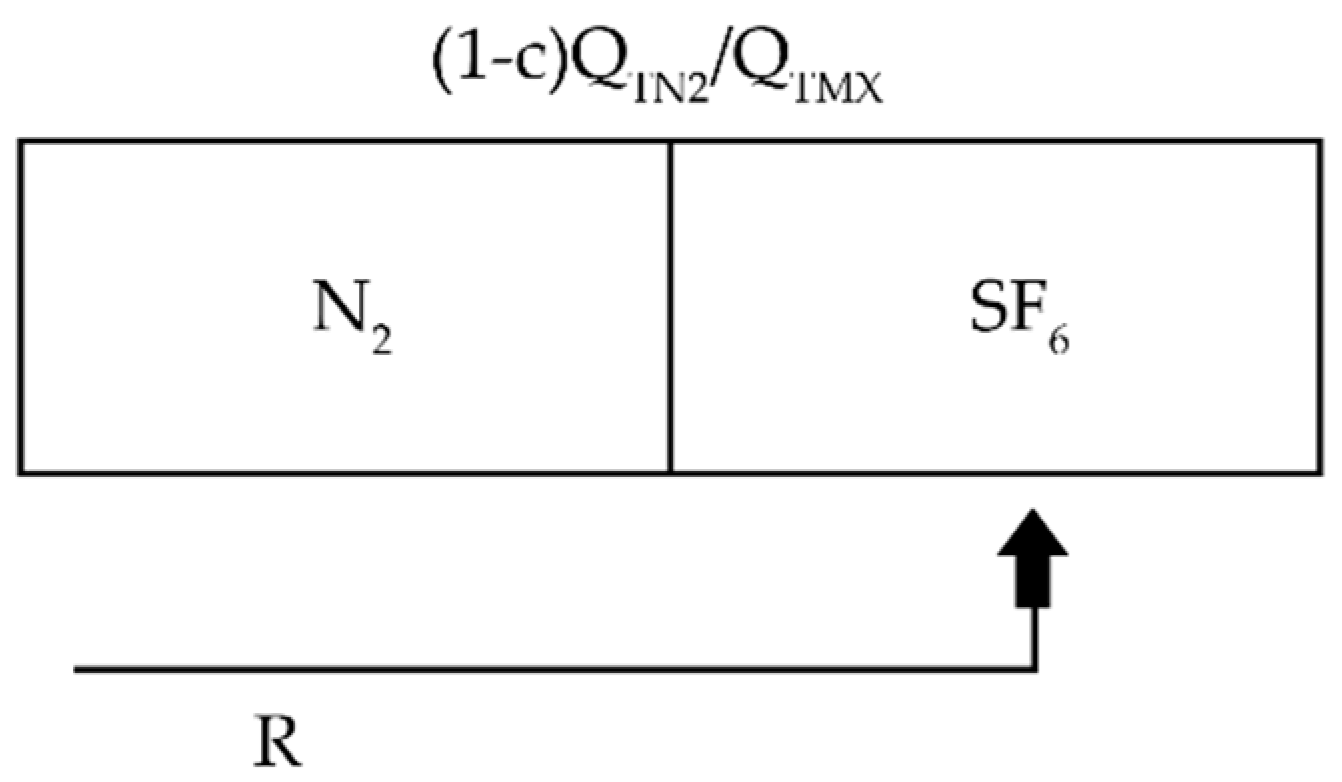
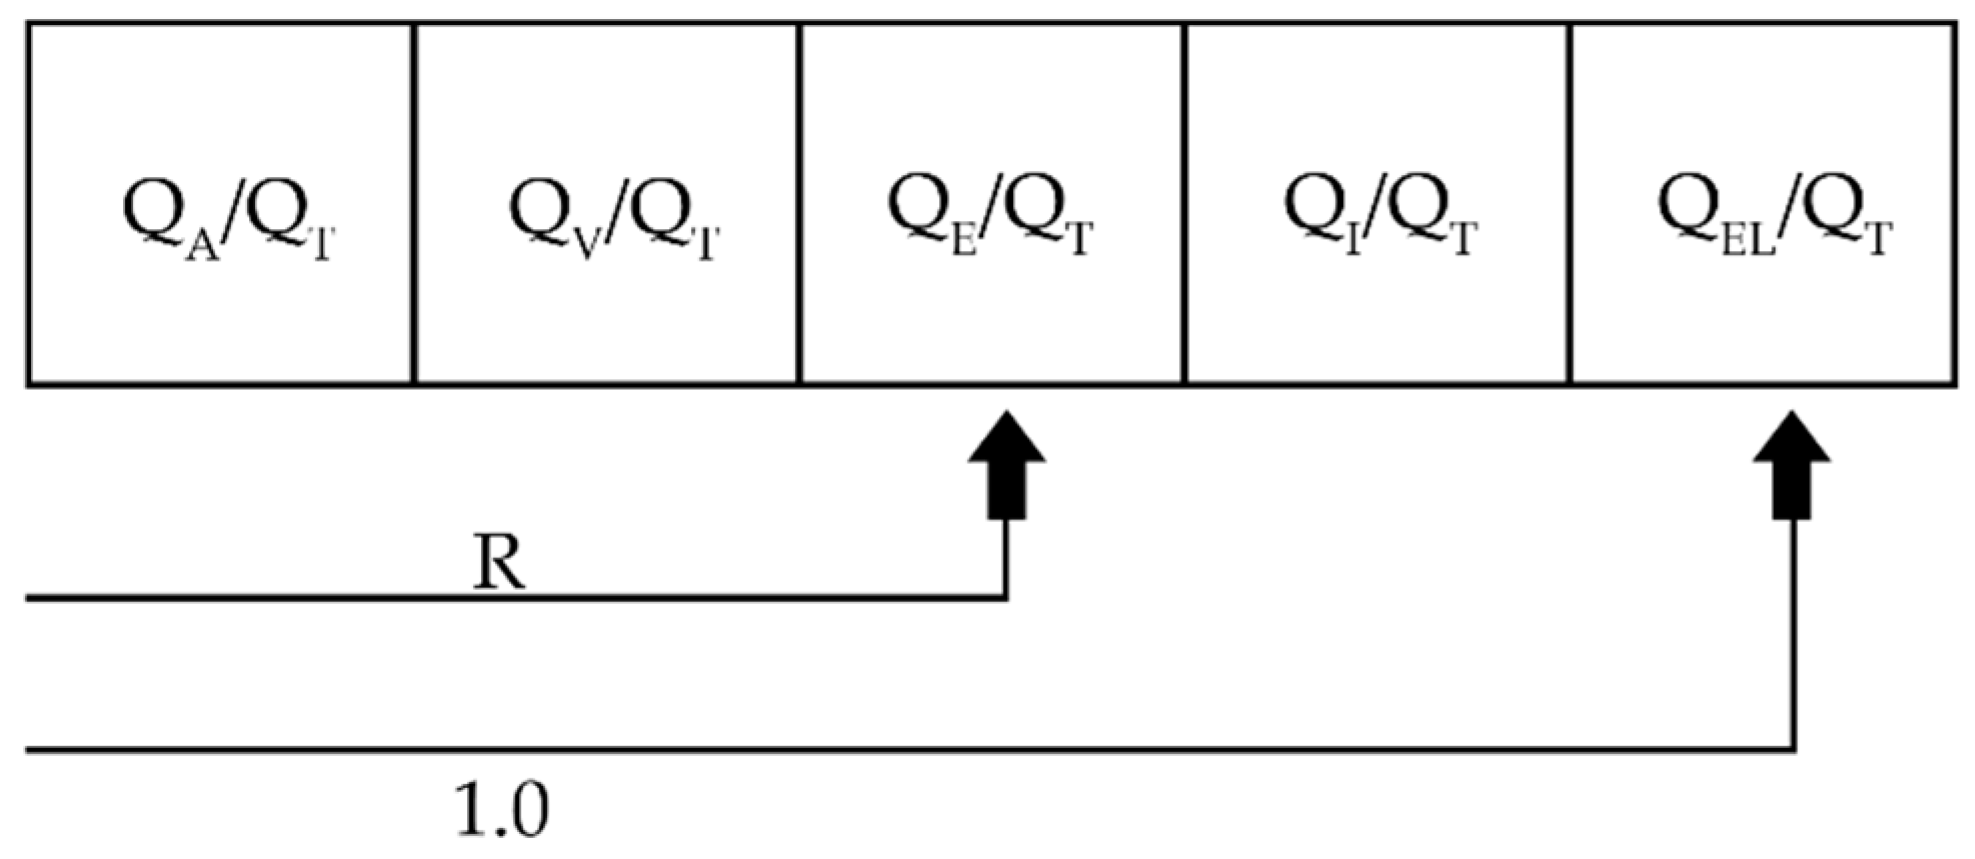
In the collision event with a certain molecule, the nature of the collision is decided on as illustrated in Figure 5, where each box is the probability of the incoming inelastic collision process and the arrow shows the type of collision with R being a random number uniformly generated between 0 and 1.
In Figure 5, QT represents the total cross sections QTN2 or QTSF6 depending on the type of the collided molecule, which is N2 or SF6. QA represents the attachment collision cross sections, QV represents the vibrational collision cross sections, QE represents the excitation collision cross sections, and QI represents the ionization collision cross sections. QEL is the momentum transfer cross section for elastic collisions, which again depends on the type of the collided molecule. Hence, at a given electron energy for the decided type of molecule, probabilities of inelastic collisions are calculated employing the related electron–molecule collision cross section set of the molecule, and the nature of the collision is decided as given in the scheme of Figure 5. If the tests for inelastic collisions fail, the collision is elastic. Isotropic collision is considered, and coulomb interactions are neglected in the simulation.
The share of energy between initial and new electrons is equal in an ionizing collision. In an inelastic collision process, the loss of electron energy corresponds to the appropriate threshold energy. However, in the case of attachment, the life of the free electron is terminated in the swarm. The termination time of the simulations is selected in such a way that the electron swarms will achieve equilibrium after the relaxation time is elapsed. All of the electrons are traced until the termination, or reach to the cathode by the effect of back diffusion or become lost due to the attachment process, which is for electronegative gases only. The states of the electrons with position and energy in the swarm are sampled with 2.5 ns time intervals and pulsed Townsend mean energies are evaluated from Equation (7).
3. Results and Discussions
The limiting electrical field for an electronegative gas is defined as the E/N value in which the ionization coefficient is equal to the attachment coefficient; or, in other words, the E/N in which the ionization collision frequency is balanced by the attachment collision frequency. Hence, for applied fields lower than the limiting field value, avalanche development is not possible since the attachment collision frequency is higher than the ionization collision frequency.
In the scope of the simulation, with sampling time intervals of 2.5 ns, the swarm development is observed, and when the net number of electrons at the sampling times remains constant within a range of 2%, the applied E/N is considered as the limiting electric field. The limiting electric field value of SF6 is in the vicinity of 360 Td (1 Td = 10−21 Vm2, N = 3.32 × 10²² m−3) [28,29].
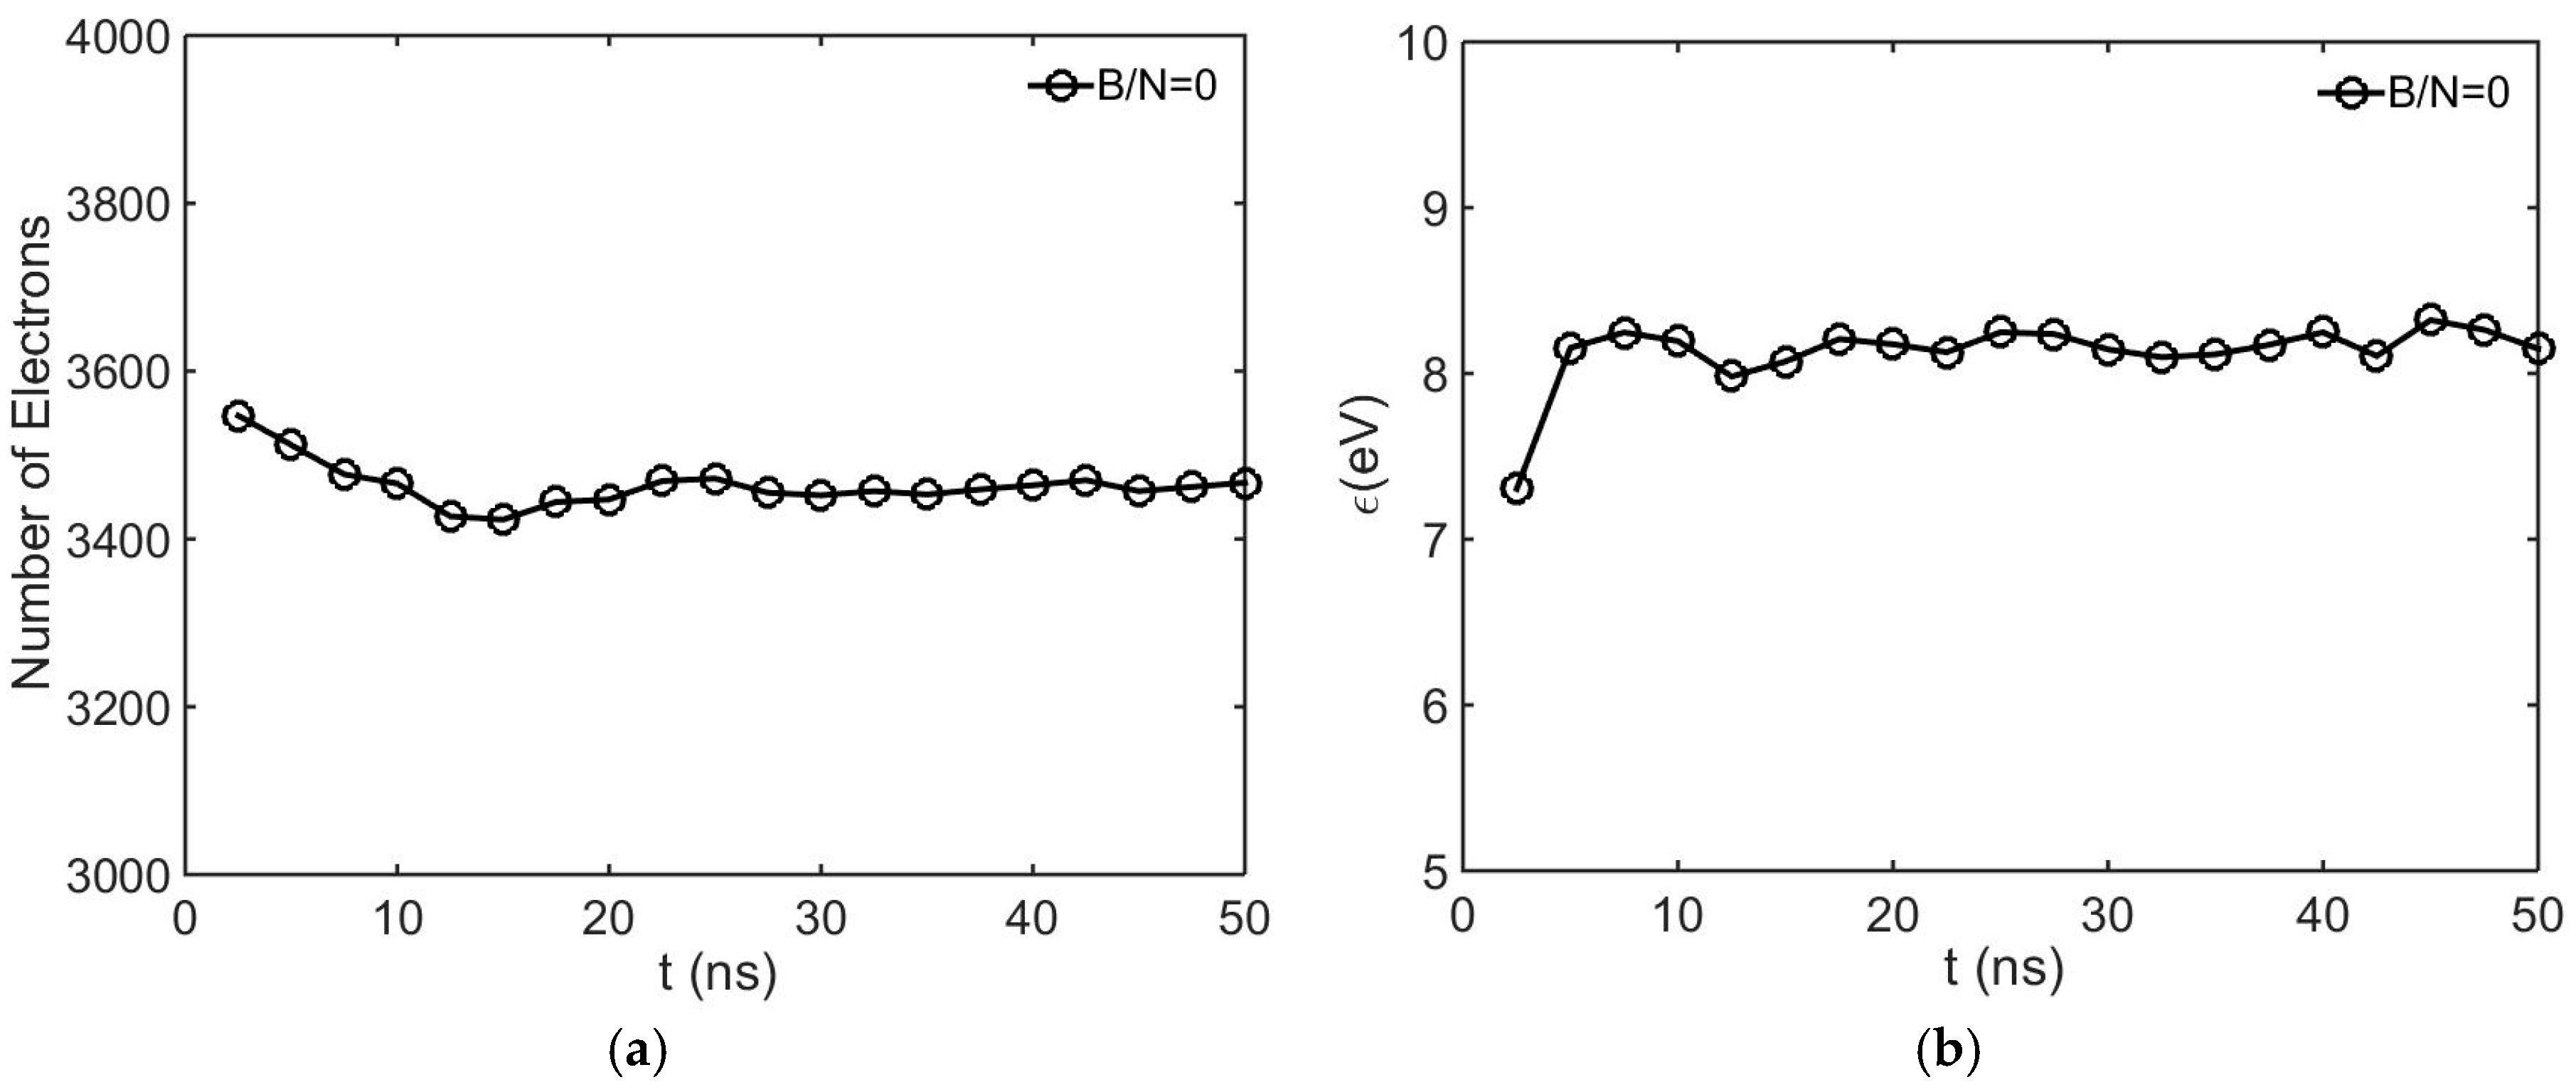
In order to test the simulation, without the crossed magnetic field, the variation of the net number of electrons in the equilibrium region after the relaxation period is investigated in SF6 at the number density reduced field E/N = 360 Td. Figure 6 displays the variation of the net number of free electrons in the swarm at the limiting field. As shown in this figure, after 20 ns, the number of electrons in the swarm is relatively constant and displays a plateau region. Similarly, it can be observed from the pulsed Townsend mean energies that the swarm is in equilibrium after a relaxation time of about 20 ns. Therefore, in the plateau variation, the effective ionization coefficient is almost zero and this condition defines the well-known critical limiting condition for an electronegative gas or gas mixtures with electronegative components.
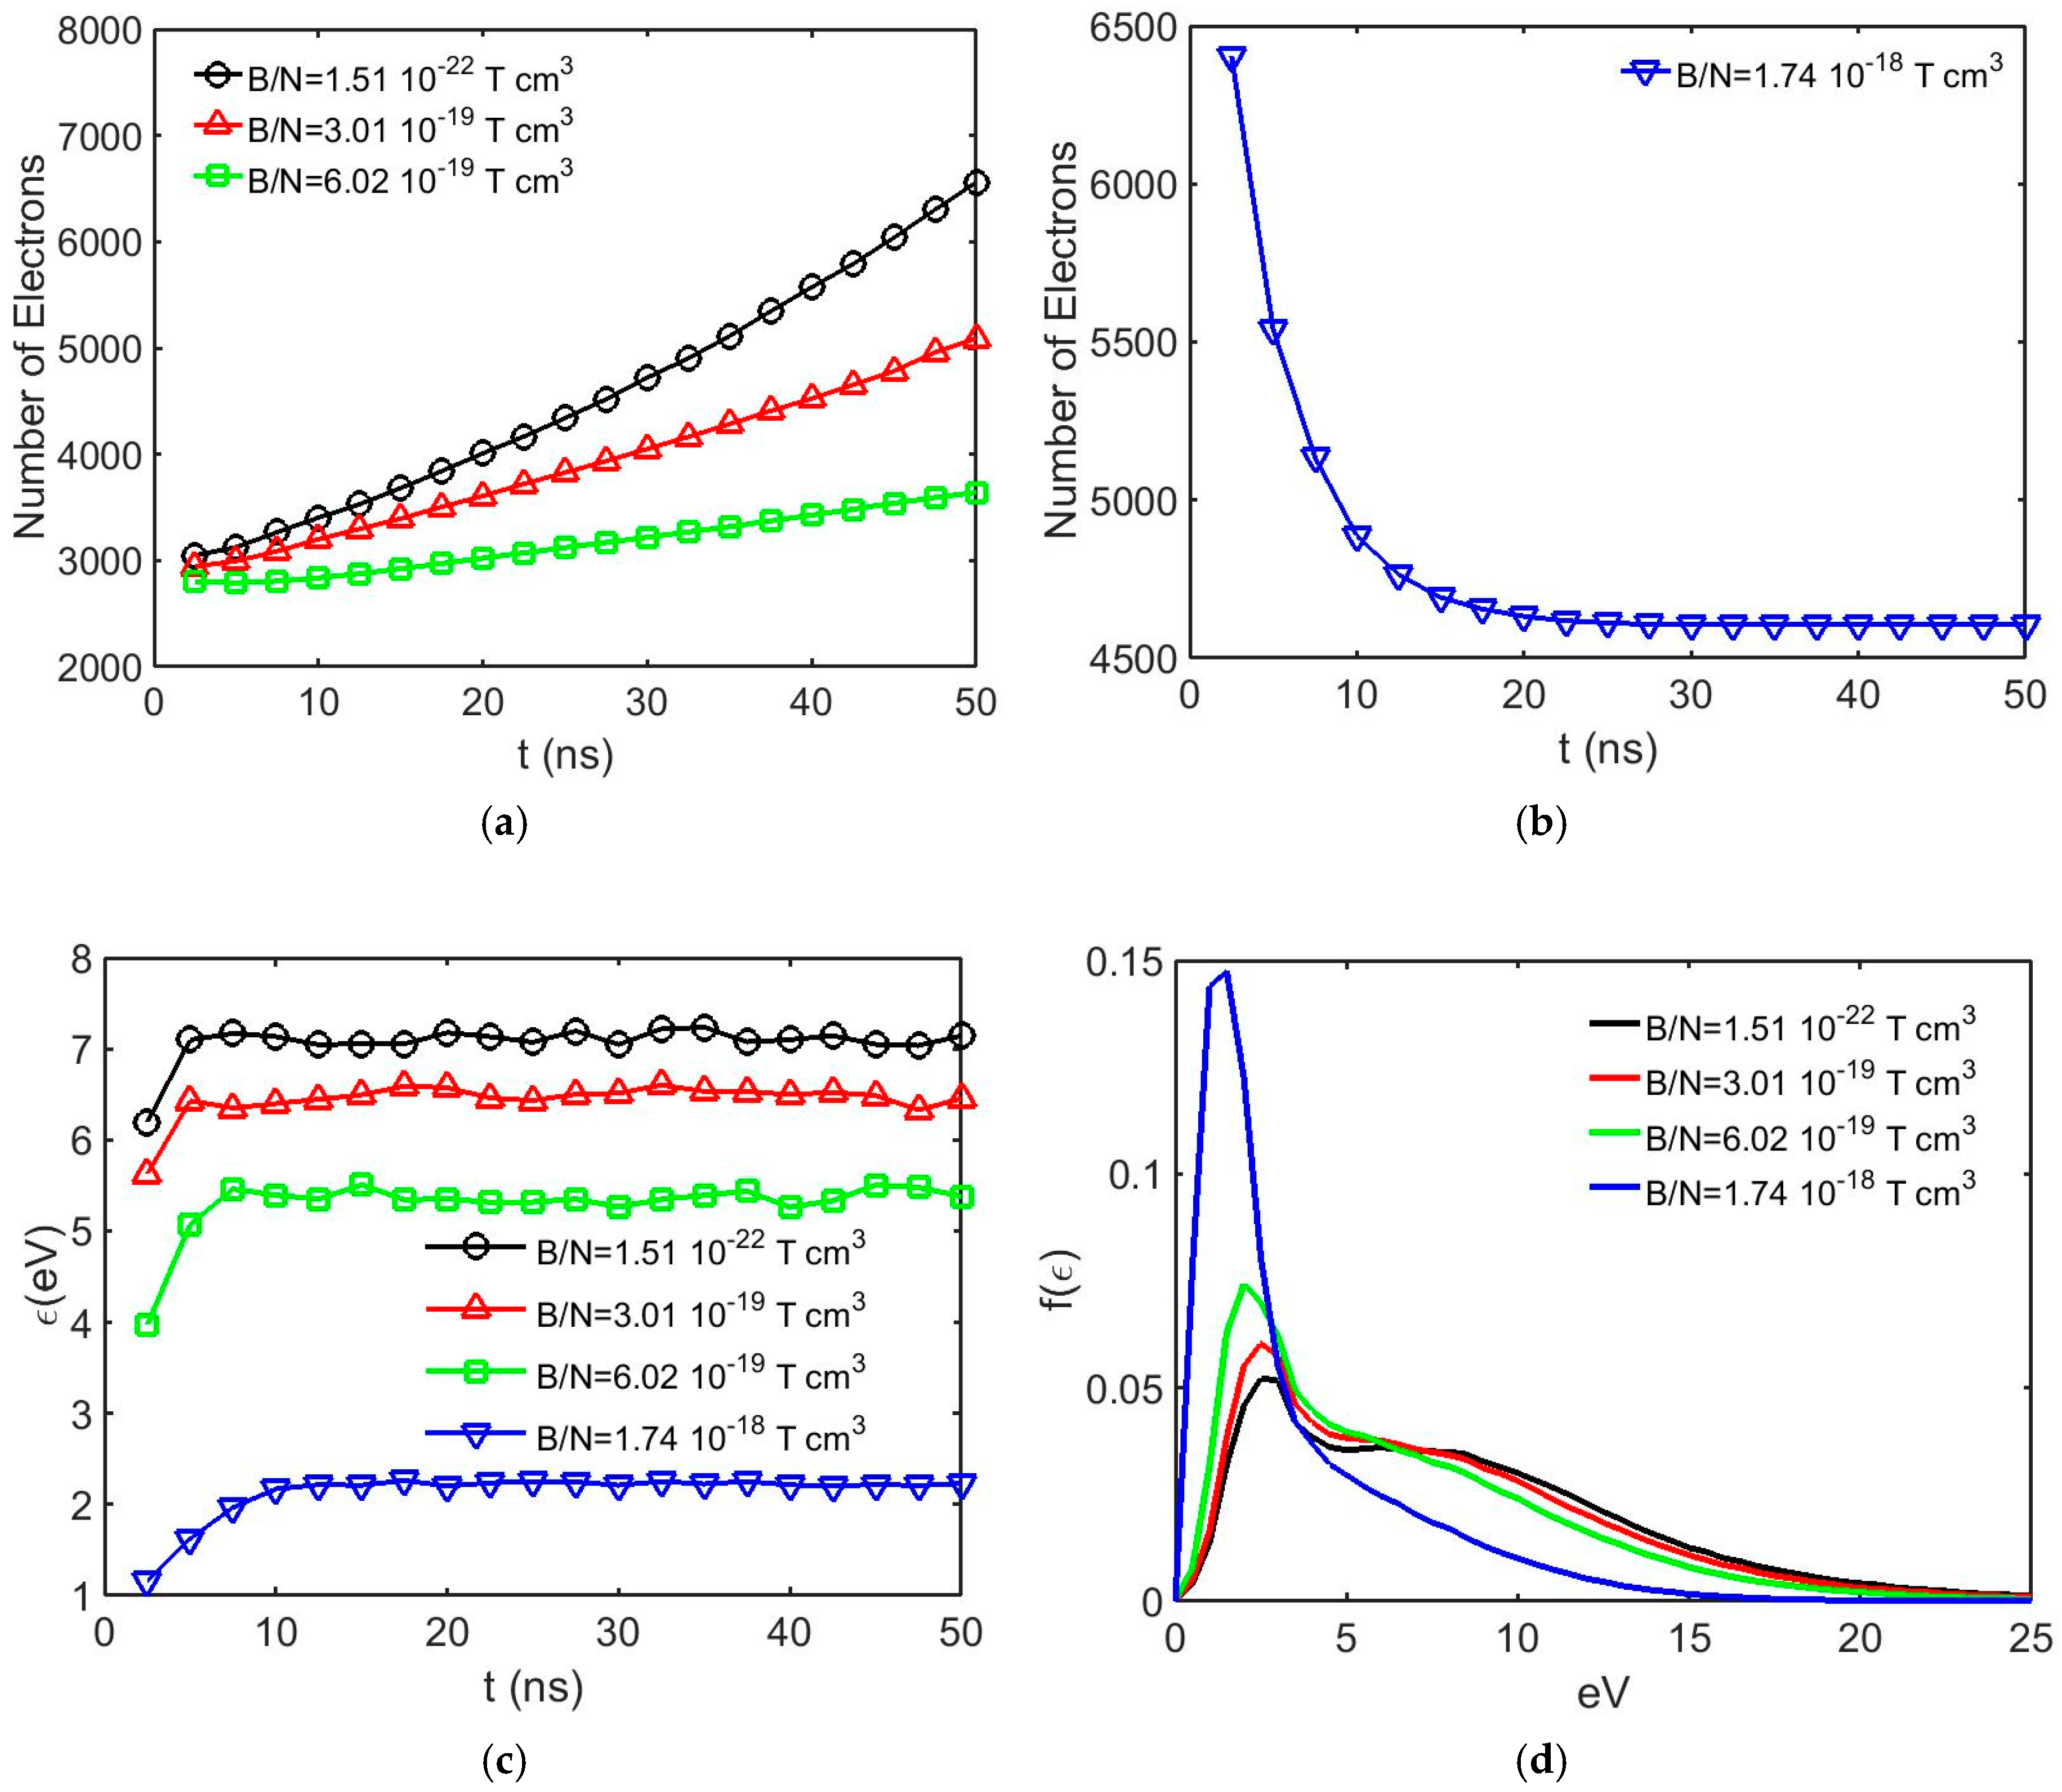
Figure 7 displays the electron avalanche development in the combined fields at E/N = 300 Td in the nitrogen mixture with a 0.25% SF6 component. The applied crossed magnetic fields have various magnitudes in order to observe the effect that the magnetic field has on the swarm development at a given E/N.
In Figure 7a, variation of the number of free electrons in crossed fields is shown at sampling times of 2.5 ns until 50 ns of simulation termination. It can be observed from this figure that the amplification in the swarm decreases as the magnetic field increases. Figure 7b shows the case in which the magnetic field is increased to a specific magnitude, resulting in inhibition of the electron avalanche. The initial loss of free electrons is basically a result of back diffusion as presented by Dincer et al. [10,24,30], and attachment collisions in the non-equilibrium region are also possible until a certain time interval, termed the relaxation time, for the electron swarm energy to be in equilibrium is reached. The relaxation time is also observed in Figure 7c from the variation of electron mean energies in the electron swarms. In Figure 7b, after 25 ns, plateau variation is observed, indicating that ionization collisions are balanced with attaching collisions in the equilibrium region. Therefore, in the plateau variation, the effective ionization coefficient is almost zero and this condition indicates that the electron avalanche is inhibited at B/N = 1.74 × 10⁻¹⁸ Tcm3.
From Figure 7c, it can also be observed that the mean energy of the swarm with a higher magnitude of crossed magnetic field is lower than that of the case with a lower magnitude of magnetic field at a given E/N. The electron energy distributions corresponding to the respective magnitude of crossed magnetic fields displayed in Figure 7d show that, with the increased magnetic fields applied, the peak of the distribution increases and shifts towards the low-energy range, indicating the increased number of slow electrons in the swarm as the magnetic field increases.
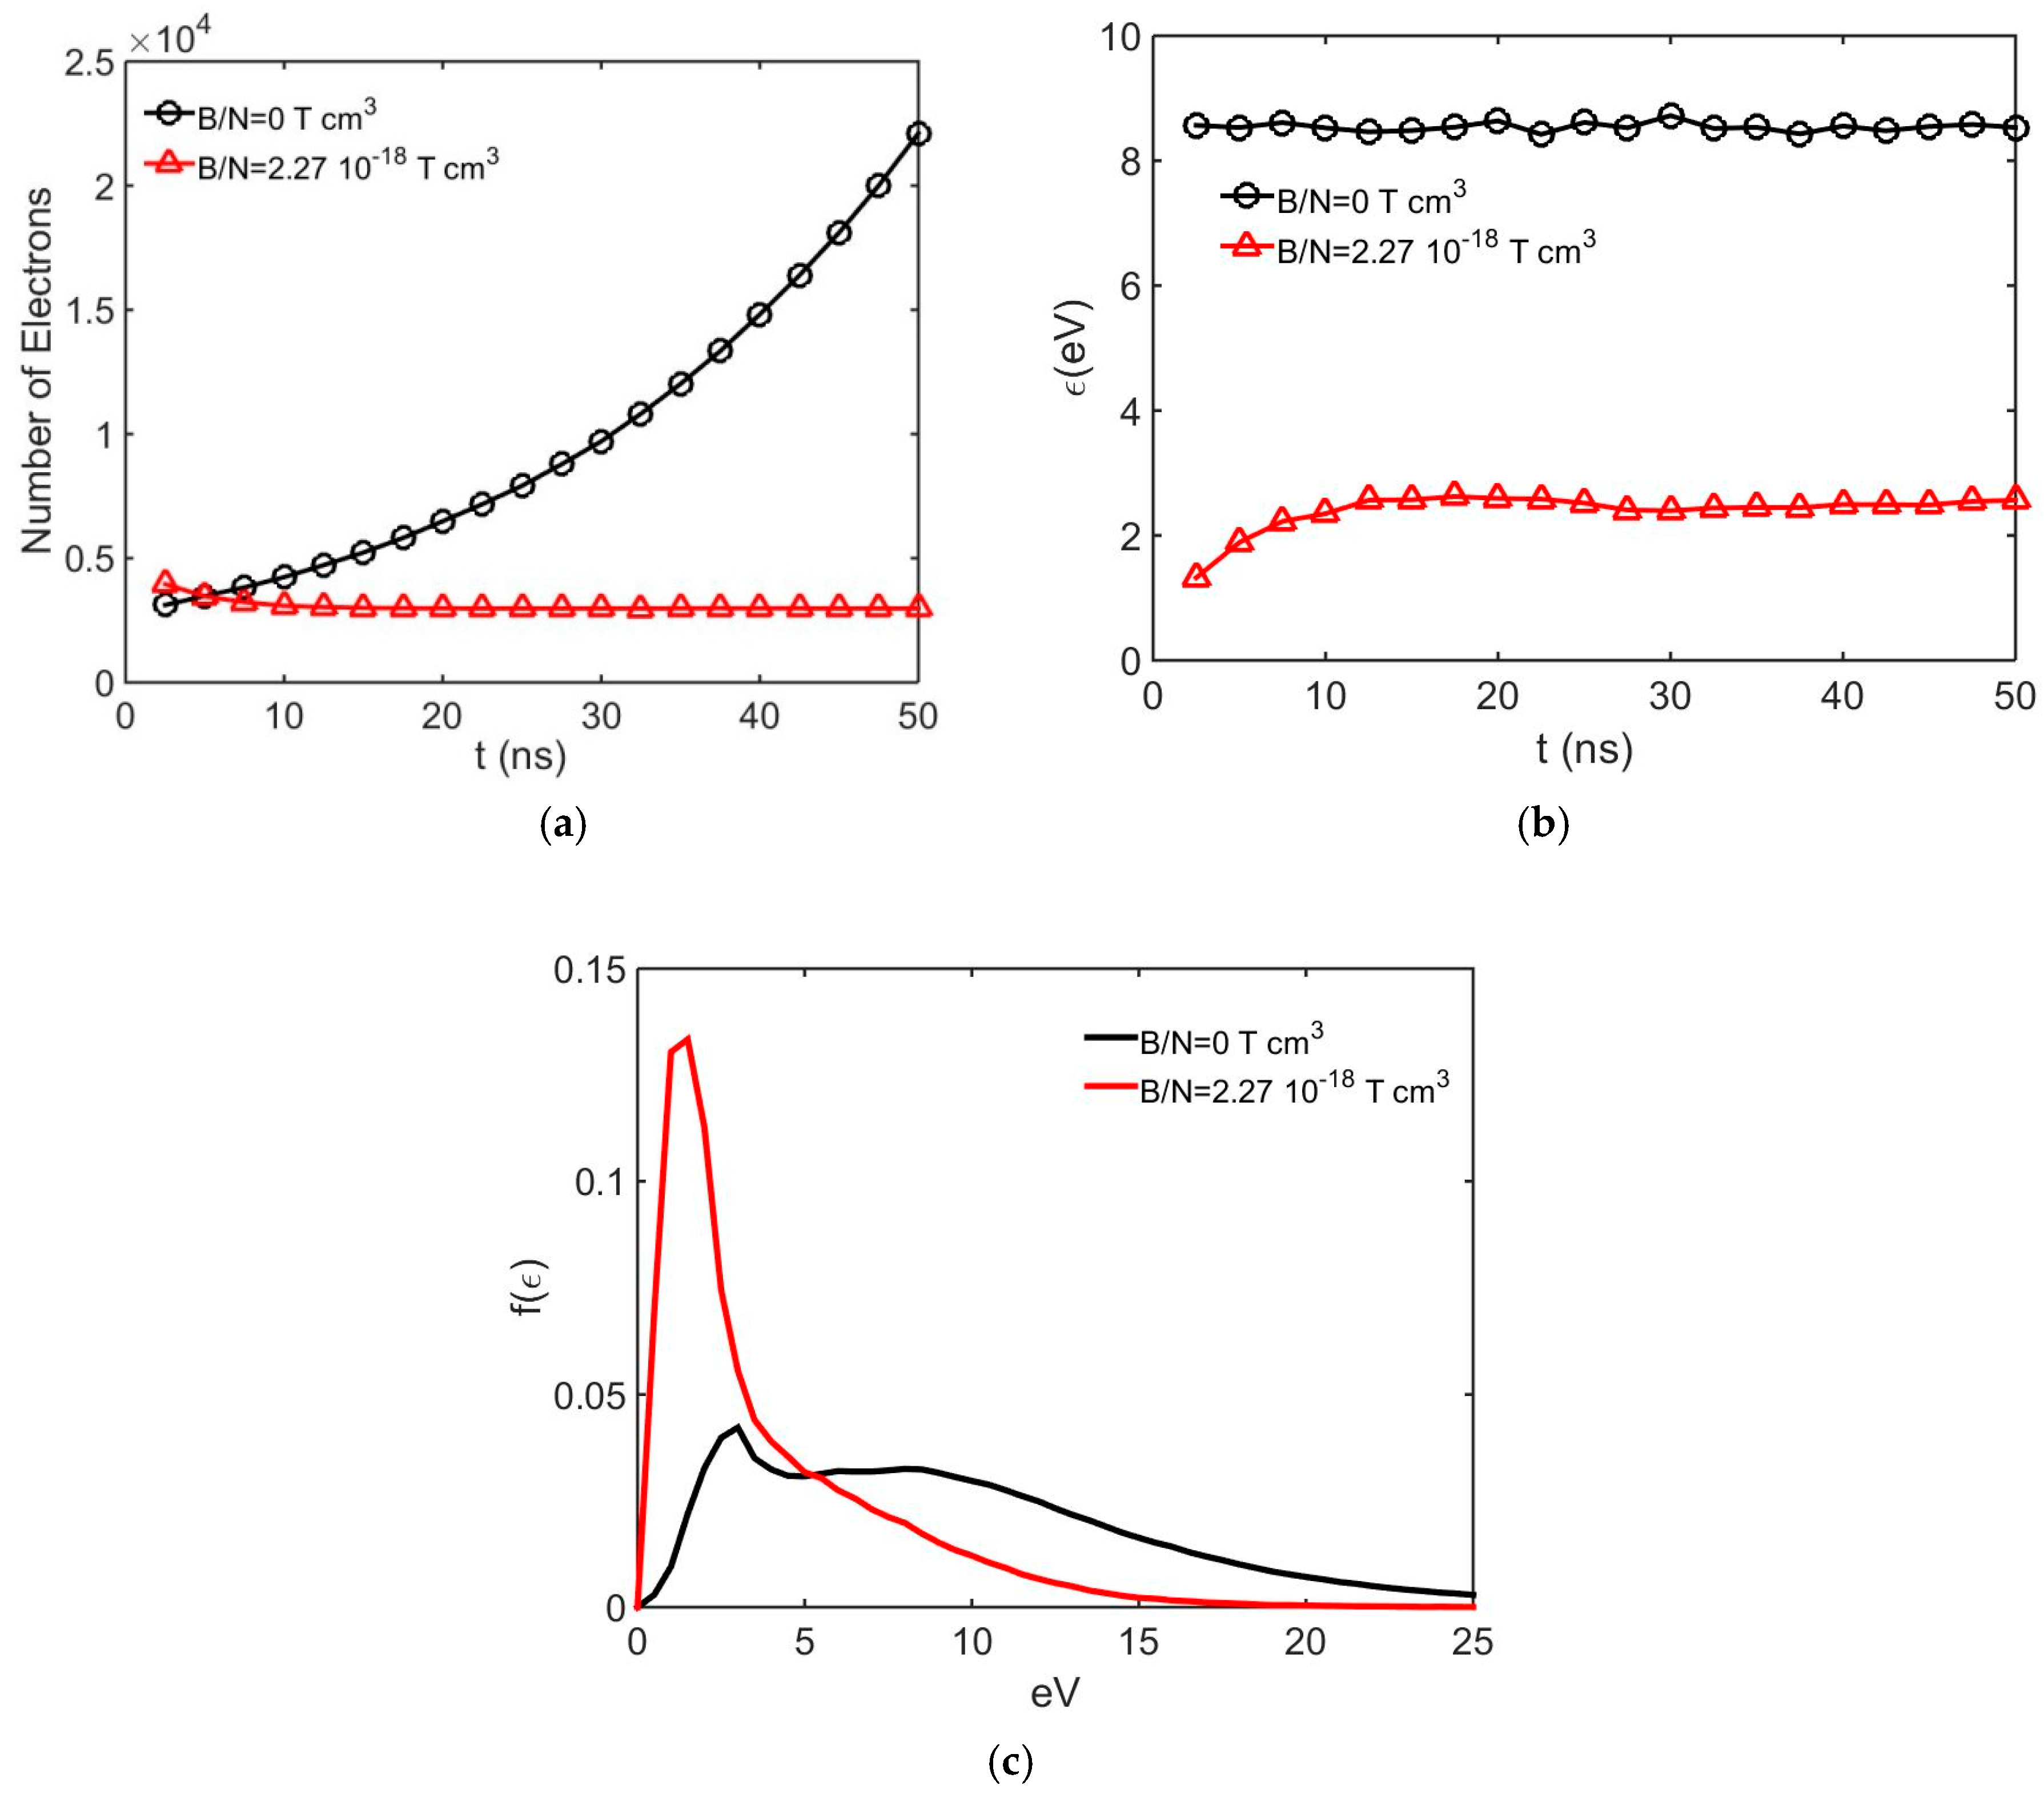
Figure 8 gives the swarm development in a Nitrogen mixture with 0.25% SF6 content at the applied E/N of 400 Td. With the magnetic field removed, variation of the number of electrons in the swarm indicates a significant amplification in the avalanche. However, avalanche growth is inhibited when a magnetic field of 2.27 × 10⁻¹⁸ Tcm3 is applied as can be observed from the plateau variation in the equilibrium region after the relaxation time with respect to the sampling times in Figure 8a. Figure 8b gives the respective mean energies. It can be observed that the mean electron energy in the combined field is reduced significantly compared to that of the case when the magnetic field is removed. The electron energy distributions displayed in Figure 8c also show that, with the application of the magnetic field, the magnitude of the peak increases while shifting to the lower energy range in the combined field, resulting in avalanche suppression.
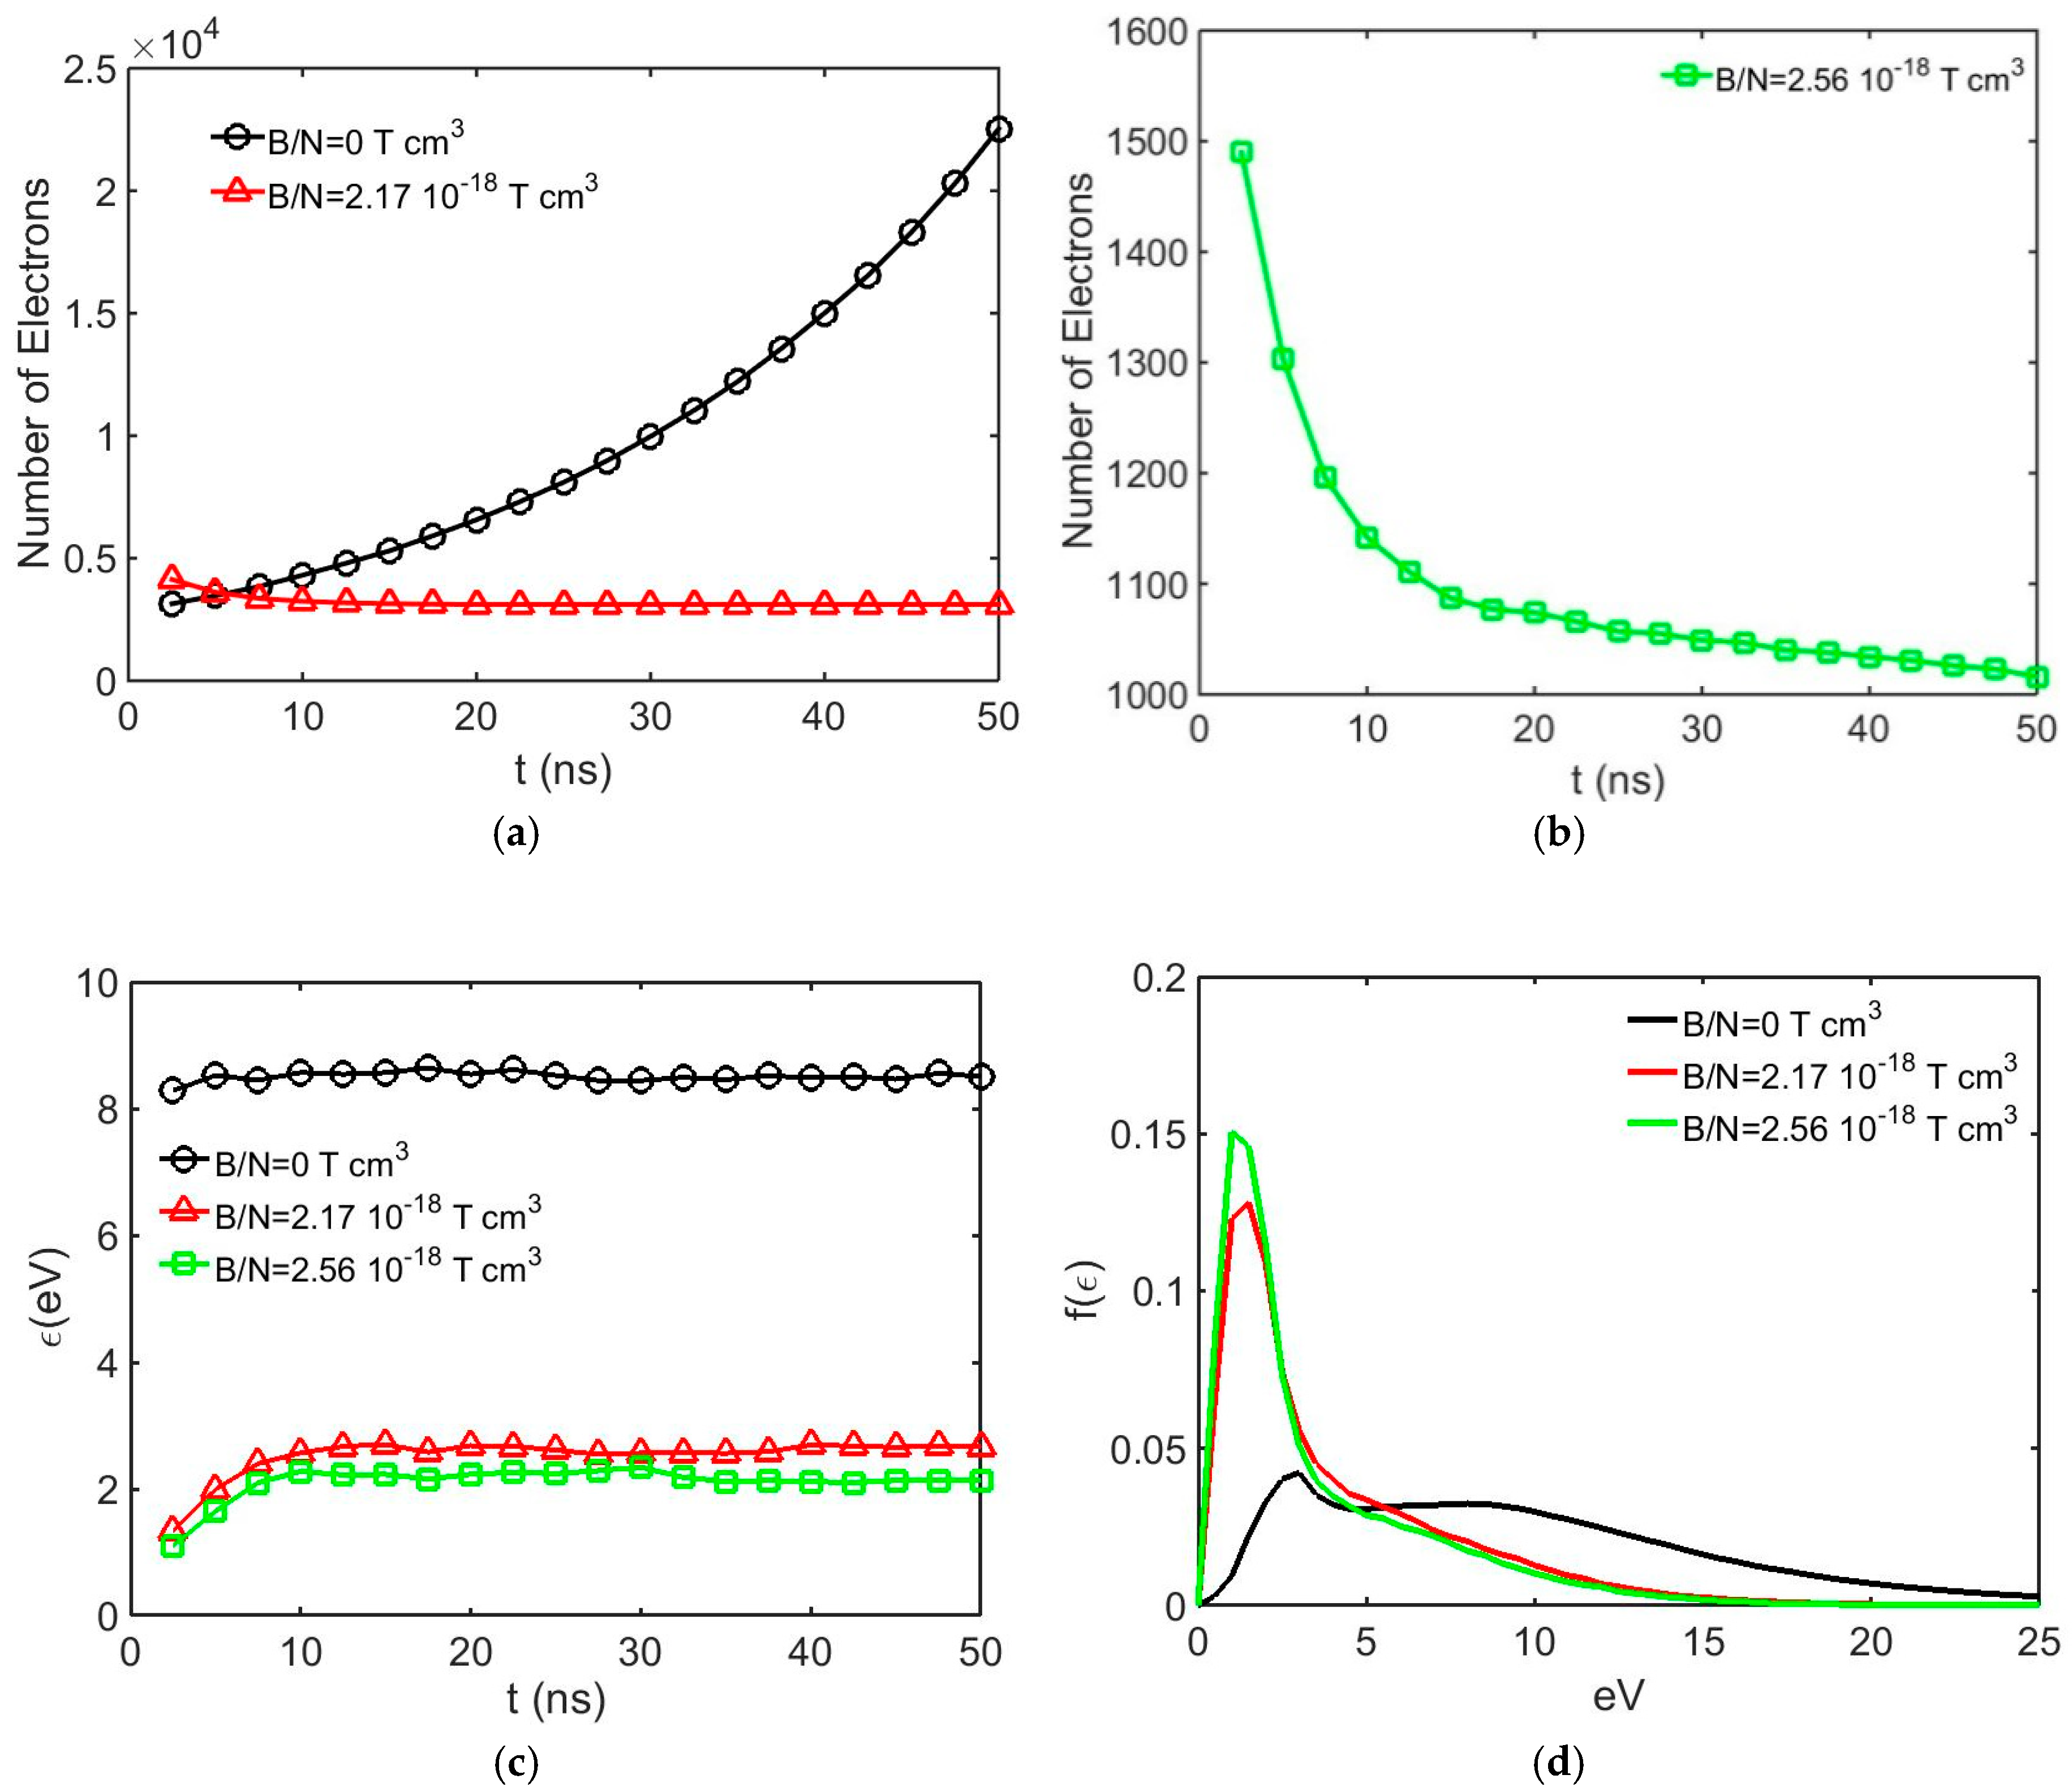
Figure 9 shows the electron avalanche development in the combined fields with various crossed magnetic fields in a 0.50% SF6 + 99.50% N2 mixture at 400 Td. As can be observed from Figure 9a, with the magnetic field removed, electron avalanche growth with a significant amplification is present, and the application of a magnetic field inhibits the growth. In Figure 9a, at B/N = 2.17 × 10⁻¹⁸ Tcm3, after 20 ns, plateau variation is observed, indicating that ionization collisions are balanced with attaching collisions in the equilibrium region. In Figure 9b, the B/N = 2.56 × 10⁻¹⁸ Tcm3 curve shows a similar trend, although the decay in the number of free electrons is still present, indicating that the attachment collision rate is higher than the ionization collision rate, defining the case to be slightly lower than the critical limiting condition. From Figure 9c, it can also be observed that the mean energy of the swarm in crossed fields is lower than that of the case without the magnetic field at a given E/N. The electron energy distributions displayed in Figure 9d also indicate the effect of the magnetic field as the peak of the distribution increases with an increasing magnetic field and shifts towards lower energy.
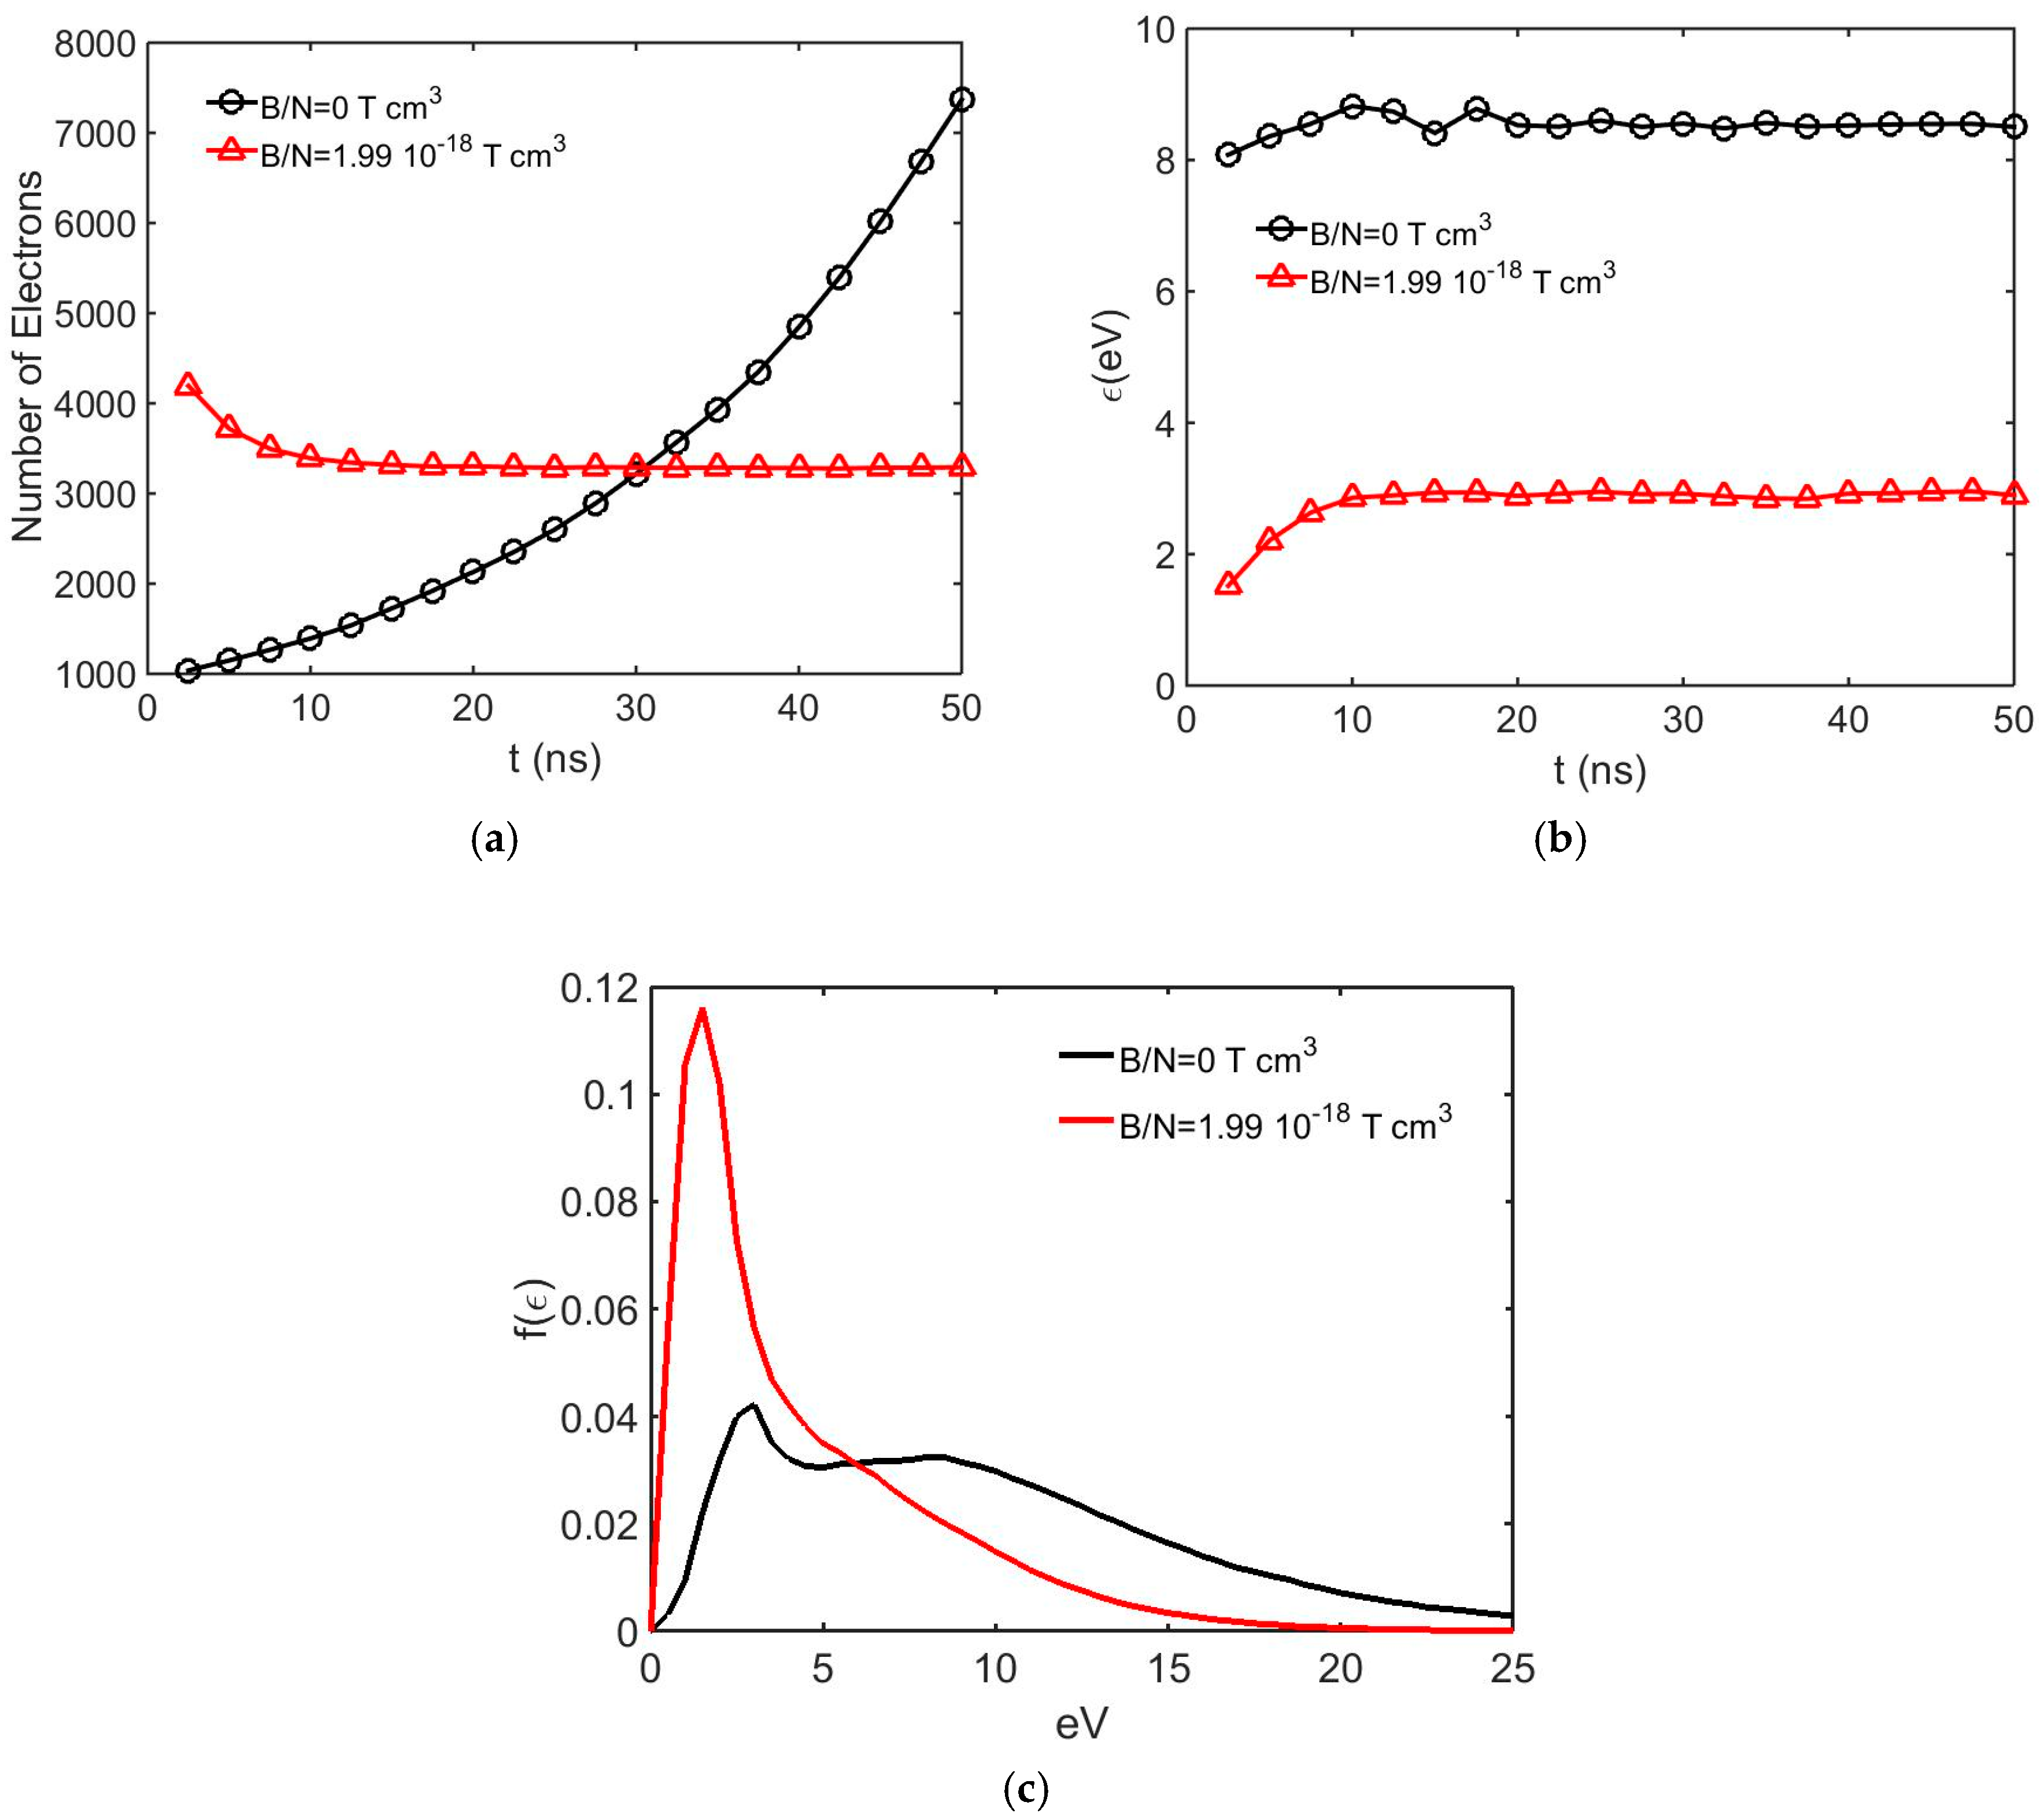
In Figure 10, the SF6 percentage is increased to 0.75%, increasing the electronegativity in the ultra-dilute mixture. In Figure 10a, the B/N = 1.99 × 10⁻¹⁸ Tcm3 curve indicates a loss of free electrons, mainly as a result of back diffusion initially. However, after 30 ns ionization, collisions are balanced by attachment collisions, defining the critical limiting case for electronegative gases. After 30 ns, the electron swarm is in equilibrium as displayed in Figure 10b, which shows the variation of mean energies in the mixture at B/N = 1.9 × 10⁻¹⁸ Tcm3. When the magnetic field is removed, the B/N = 0 curve in Figure 10a displays the amplification in the electron swarm since the ionization collisions are dominant. Figure 10c gives the electron energy distributions. When B/N = 1.99 × 10⁻¹⁸ Tcm3 resulting in avalanche inhibition, the corresponding distribution function has an increased peak magnitude at the lower electron energies compared to that of the B/N = 0 curve.
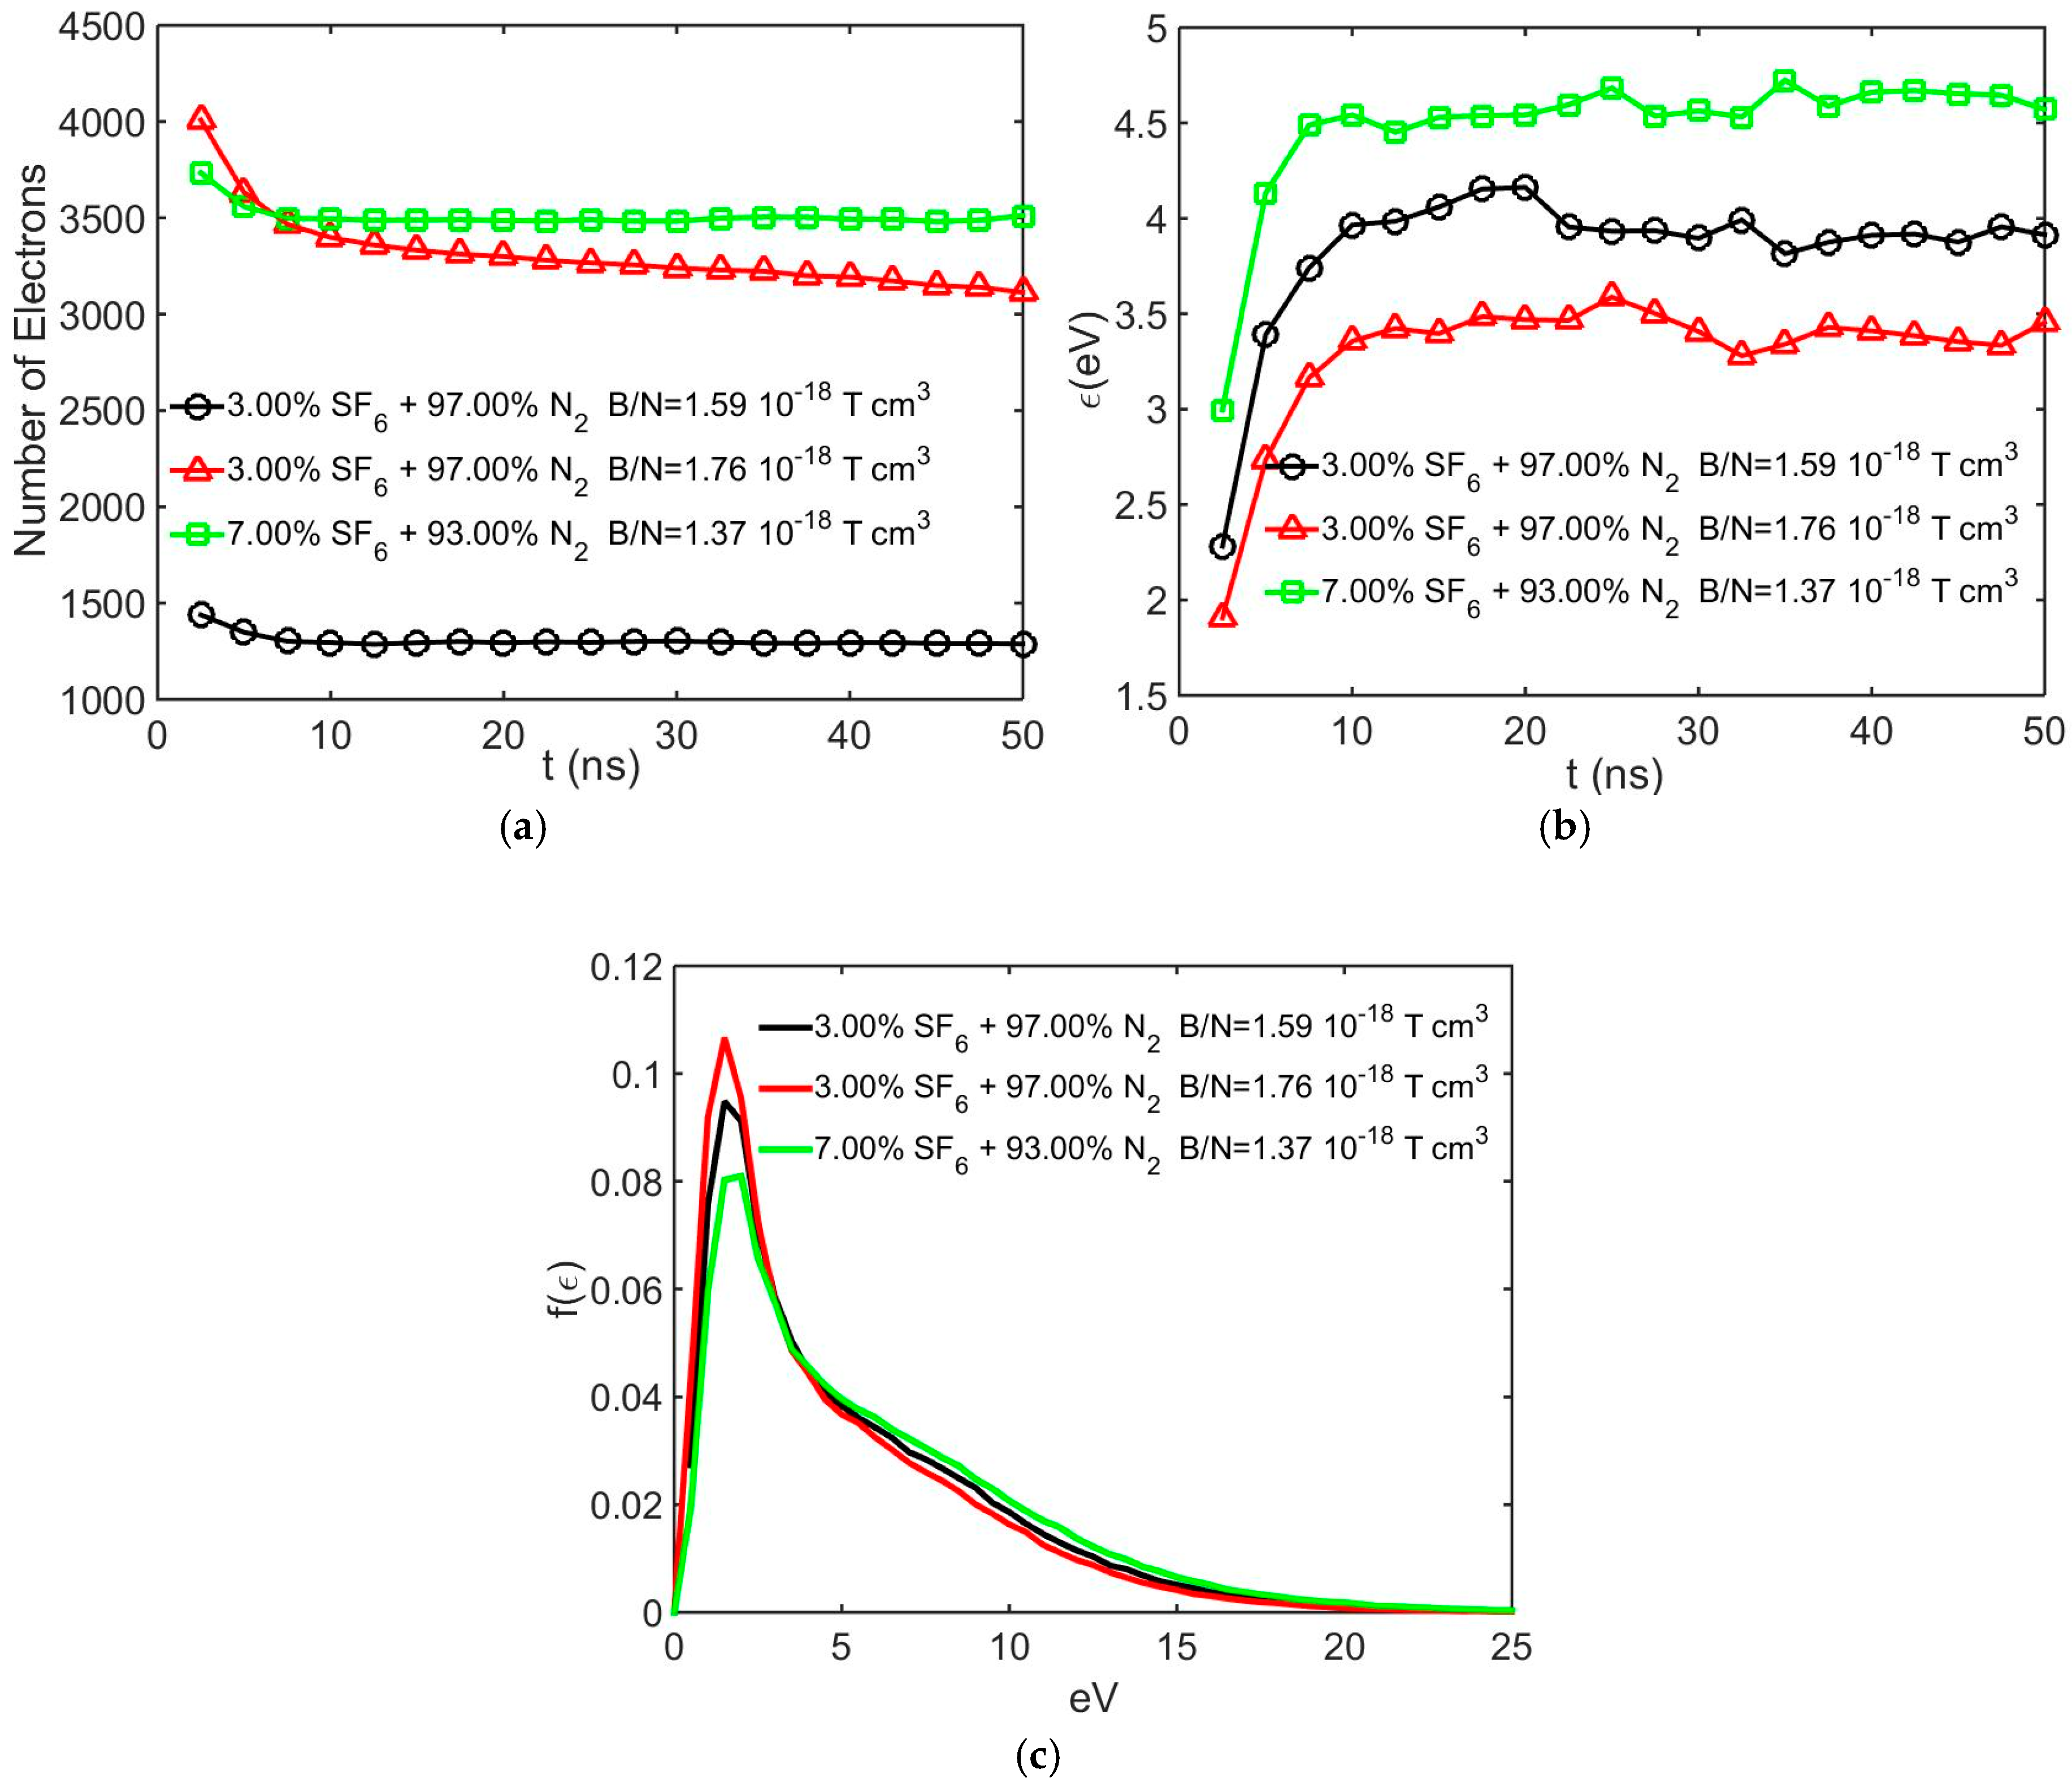
In Figure 11, swarm development in the combined fields in 3% SF6 + 97% N2 and 7% SF6 + 93% N2 mixtures are presented at E/N = 400 Td. Figure 11a displays the number of free electrons sampled at 2.5 ns intervals during the simulation time. From this figure, it is seen that, for the 3% SF6 component in the mixture, the avalanche growth is inhibited at B/N = 1.59 × 10⁻¹⁸ Tcm3 in the equilibrium region where the ionization collisions are balanced by attachment collisions. If the magnetic field is increased to 1.76 × 10⁻¹⁸ Tcm3, decay in the number of electrons is still present after 25 ns, although the swarm is in equilibrium, indicating that the attachment collision is higher than the ionization collisions. In the mixture with the 7% SF6 component, suppression of the avalanche at B/N = 1.37 × 10⁻¹⁸ Tcm3 is observed. The corresponding mean energies and energy distribution functions are presented in Figure 11b,c.
Considering the evaluated electron energy distribution functions, the response of the swarm subjected to combined fields can be explained through the collisional processes present in the binary mixture at the microscopic level. In Figure 7d, the black line energy distribution function curve corresponds to the case of negligible B/N (B/N = 1.51 × 10⁻²² Tcm3) and, through Figure 8, Figure 9 and Figure 10, the black line curves in the energy distribution function plots correspond to the energy distribution function at B/N = 0. The dip observed in the energy distribution profile is due to the vibrational excitation of nitrogen molecules in the black line curves at electron energies of 4–5 eV. The formation of the dip is the result of consumption of electrons in the energy range making vibrational excitation collisions. Similar dips in nitrogen plasma discharges have been observed before [31,32].
Application of the magnetic field in the combined fields reduces the energy gain of free electrons along the electric field direction and, as can be observed from Figure 7d, the number of slow electrons in the swarm increases with increasing B/N while the peak of the distribution increases accordingly. In the vicinity of 2 eV, the vibrational collision cross section of nitrogen has a large magnitude and acts as a barrier of energy, slowing down the electrons. In the low-energy range, since the radiative and dissociative attachment collision processes of SF6 are significantly operative, the slow electrons are captured by attachment collisions forming stable negative ions and the ionization collisions are balanced by attachment collisions as can be seen from Figure 7b in the equilibrium region resulting in an inhibition of electron avalanche growth. The depression of the electron energy distribution in the high-energy range with increasing magnetic field also reduces the ionization collision frequency, resulting in a decreased amplification of the electron swarm as demonstrated in Figure 7a. A similar response of the swarm is present in the combined fields of Figure 8, Figure 9, Figure 10 and Figure 11.
In Figure 11, the SF6 content of the mixture is increased, resulting in increased attachment collisions, and it is possible to suppress the electron avalanche in the combined fields with lower B/N values. It is interesting to observe that the electron mean energy of the swarm increases with an increasing component of SF6 as can be seen in Figure 11b when the black line curve and the green line curve corresponding to avalanche inhibition are compared. Compared to SF6, the efficiency of deceleration of electrons in nitrogen is higher, and a reduction in the nitrogen component in the mixture results in increased mean energies.
The authors’ recent work discusses magnetic insulation in nitrogen [33]. The present paper investigates the response of an ultra-dilute SF6 component in the binary mixture with the nitrogen gas acting as the buffer gas slowing down the electrons effectively under the crossed fields. With the application of the magnetic field, it is possible to remove the slowed-down electrons with increased attachment processes of the ultra-dilute SF6 component, resulting in avalanche inhibition at lower B/N values compared to the case of pure nitrogen only.
At an E/N value of 400 Td, the B/N resulting in avalanche inhibition in nitrogen is 2.56 × 10⁻¹⁸ Tcm3 [33]. However, in the present paper, the required B/N for avalanche inhibition is reduced to 2.17 × 10⁻¹⁸ Tcm3 at 0.50% SF6 concentration and to 1.99 × 10⁻¹⁸ Tcm3 at 0.75% SF6 content. If the SF6 content is increased, in the mixture with 3% SF6 content, B/N = 1.59 × 10⁻¹⁸ Tcm3 is sufficient for avalanche inhibition, while a further increase of SF6 content to 7% yields a value of B/N = 1.37 × 10⁻¹⁸ Tcm3 for the avalanche inhibition. Therefore, there is a marked reduction in the required magnetic field for avalanche inhibition in the binary mixtures. Even with 0.75% SF6 content, a reduction of about 22.3% in the B/N is possible and a reduction in the magnitude of the magnetic field reaches a value of about 46.5% in the 7% SF6 binary mixture.
The design of the field winding that produces the crossed magnetic field will be easier in terms of the coil current and the number of turns in practice with the reduction of the magnetic field. Rotary arc load break switch and interrupter designs with increased dielectric strength due to a crossed magnetic field against transient recovery voltages are available in the literature [34,35,36].
4. Conclusions
In combined fields, the values of magnetic field applied normal to the electric field direction are evaluated in order to suppress electron avalanche growth in nitrogen mixtures with ultra-dilute SF6 contents. The particular magnetic field values calculated in the crossed fields at constant E/N values inhibit electron avalanche growth in nitrogen mixed with an ultra-dilute SF6 component, resulting in increased dielectric strengths. It is possible to achieve high dielectric strengths depending on the electronegativity and magnitude of the crossed magnetic field. The required magnetic field magnitude at a given E/N for suppression of the avalanche growth decreases as the electronegativity of the mixture is increased by increasing the ultra-dilute SF6 component.
The recent work of Zhao et al. [19] in hot SF6 + N2 mixtures at 3000 K with a 5% SF6 component yielding a higher dielectric strength compared to that of 95% SF6 content in the mixture indicates the importance of ultra-dilute SF6 + N2 mixtures. It would be interesting to investigate a hot gas analysis under the crossed fields, since, in switch design, the main objective is to have sufficient dielectric strength in the hot gas region after current zero in order to interrupt the electric arc as rapidly as possible.
Author Contributions
Conceptualization, M.S.D.; Data curation, S.S.T. and H.D.; Formal analysis, M.S.D.; Investigation, H.D.; Methodology, M.S.D.; Software, M.S.D.; Supervision, M.S.D.; Validation, S.S.T.; Visualization, S.S.T.; Writing–original draft, S.S.T. and H.D.; Writing–review & editing, H.D.
Funding
This research received no external funding.
Conflicts of Interest
The authors declare no conflict of interest.
References
- Tezcan, S.S.; Duzkaya, H.; Dincer, M.S.; Hiziroglu, H.R. Assessment of electron swarm parameters and limiting electric fields in SF6 + CF4 + Ar gas mixtures. IEEE Trans. Dielectr. Electr. Insul. 2016, 23, 1996–2005. [Google Scholar] [CrossRef]
- Li, X.; Zhao, H.; Murphy, A.B. SF6-alternative gases for application in gas-insulated switchgear. J. Phys. D Appl. Phys. 2018, 51, 153001. [Google Scholar] [CrossRef]
- Omori, T.; Shimizu, D.; Matsumoto, T.; Izawa, Y.; Nishijima, K. Electron swarm parameters in gas mixtures of CF3I, SF6, CO2 with N2 at atmospheric pressure. In Proceedings of the IEEE Conference on Electrical Insulation and Dielectric Phenomena (CEIDP), Des Moines, IA, USA, 19–22 October 2014. [Google Scholar]
- European Environmental Agency: Atmospheric Greenhouse Gas Concentrations. Available online: https://www.eea.europa.eu/data-and-maps/indicators/atmospheric-greenhouse-gas-concentration-10/as-sessment (accessed on 29 September 2018).
- Australian Government Department of the Environment and Energy. Montreal Protocol on Substances that Deplete the Ozone Layer; United Nations Treaty Series: Montreal QU, Canada, 1987.
- Bullister, J.L. Atmospheric Histories (1765–2015) for CFC-11, CFC-12, CFC-113, CCl4, SF6 and N2O (NCEI Accession 0164584). NOAA Natl. Cent. Environ. Inf. 2015. [CrossRef]
- Christophorou, L.G.; Van Brunt, R.J. SF6/N2 mixtures: Basic and HV insulation properties. IEEE Trans. Dielectr. Electr. Insul. 1995, 2, 952–1003. [Google Scholar] [CrossRef]
- Pinheiro, M.J.; Loureiro, J. Effective ionization coefficients and electron drift velocities in gas mixtures of SF6 with He, Xe, CO2 and N2 from Boltzmann analysis. J. Phys. D Appl. Phys. 2002, 35, 3077–3084. [Google Scholar] [CrossRef]
- Xiao, D.M.; Zhu, L.L.; Chen, Y.Z. Electron swarm parameters in SF6 and helium gas mixtures. J. Phys. D Appl. Phys. 1999, 32, L18–L19. [Google Scholar] [CrossRef]
- Jovanovic, J.V.; Basurto, E.; Sasic, O.; Hernandez-Avila, J.L.; Petrovic, Z.L.; Urquijo, J.D. Electron impact ionization and transport in nitrogen–argon mixtures. J. Phys. D Appl. Phys. 2009, 42, 045202. [Google Scholar] [CrossRef]
- Haefliger, P.; Franck, C.M. Detailed precision and accuracy analysis of swarm parameters from a pulsed Townsend experiment. Rev. Sci. Instrum. 2018, 89, 023114. [Google Scholar] [CrossRef] [PubMed] [Green Version]
- Christophorou, L.G.; Olthoff, J.K.; Van Brunt, R.J. Sulfur hexafluoride and the electric power industry. IEEE Electr. Insul. Mag. 1997, 13, 20–24. [Google Scholar] [CrossRef]
- Beroual, A.; Haddad, A. Recent advances in the quest for a new insulation gas with a low impact on the environment to replace sulfur hexafluoride (SF6) gas in high-voltage power network applications. Energies 2017, 10, 1216. [Google Scholar] [CrossRef]
- 14. Ehhalt, F.; Prather, M.; Dentener, F.; Derwent, R.; Dlugokencky, E.; Holland, E.; Isaksen, I.; Katima, J.; Kirchhoff, V.; Matson, P.; Midgley, P.; Wang, M. Atmospheric Chemistry and Greenhouse Gases. In: Climate Change 2001: The Scientific Basis. Contribution of Working Group I to the Third Assessment Report of the Intergovernmental Panel on Climate Change; Houghton, J.T., Ding, Y., Griggs, D.J., Noguer, M., Van der Linden, P.J., Dai, X., Maskell, K., Johnson, C.A.E., Eds.; Cambridge University Press: Cambridge, UK; New York, NY, USA, 2001; pp. 241–287. ISBN 0521 01495 6. [Google Scholar]
- Dincer, M.S.; Hiziroglu, H.R.; Bektas, S. The behavior of N2 + SF6 gas mixtures subjected to orthogonal electric and magnetic fields. IEEE Trans. Dielectr. Electr. Insul. 2006, 13, 257–263. [Google Scholar] [CrossRef]
- Jones, F.E. The air density equation and the transfer of the mass unit. J. Res. Natl. Bur. Stand. 1978, 83, 419–428. [Google Scholar] [CrossRef]
- Malik, N.H.; Qureshi, A.H. Breakdown gradients in SF6-N2, SF6-air and SF6-CO2 mixtures. IEEE Trans. Electr. Insul. 1980, EI–15, 413–418. [Google Scholar] [CrossRef]
- Pedersen, A. Evaluation of the effect of surface defects on breakdown in strongly electronegative gases or gas mixtures. In Proceedings of the Second International Symposium on Gaseous Dielectrics, Knoxville, TN, USA, 9–13 March 1980; Christophorou, L.G., Ed.; Pergamon Press: New York, NY, USA, 1980; pp. 201–208. [Google Scholar]
- Zhao, H.; Li, X.; Jia, S.; Murphy, A.B. Dielectric breakdown properties of SF6-N2 mixtures at 0.01–1.6 MPa and 300–3000 K. J. Appl. Phys. 2013, 113, 143301. [Google Scholar] [CrossRef]
- Dincer, M.S. Simulation of Electron Swarms in SF6 in Uniform EXB Fields. J. Phys. D Appl. Phys. 1993, 26, 1427–1432. [Google Scholar] [CrossRef]
- Dincer, M.S.; Tezcan, S.S.; Duzkaya, H. Avalanche inhibition in ultra-dilute SF6-N2 mixtures subjected to crossed fields. In Proceedings of the 2018 IEEE International Conference on Environment and Electrical Engineering and 2018 IEEE Industrial and Commercial Power Systems Europe (EEEIC/I&CPS Europe), Palermo, Italy, 12–15 June 2018. [Google Scholar] [CrossRef]
- Gottlieb, M.A.; Pfeiffer, R. The Feynman Lectures on Physics New Millennium Edition; California Institute of Technology: California, CA, USA, 2001. [Google Scholar]
- Dujko, S.; White, R.D. A multi term Boltzmann equation analysis of non-conservative electron transport in time-dependent electric and magnetic fields. J. Phys. Conf. Ser. 2008, 133, 012005. [Google Scholar] [CrossRef] [Green Version]
- Nakamura, H.; Ventzek, P.L.G.; Kitamori, K. Monte Carlo simulation study of the scaling of electron transport parameters in crossed dc electric and magnetic fields. J. Appl. Phys. 1999, 85, 2534–2539. [Google Scholar] [CrossRef]
- Phelps, A.V.; Pitchford, L.C. Anisotropic scattering of electrons by N2 and its effect on electron transport. Phys. Rev. 1985, 31, 2932–2949. [Google Scholar] [CrossRef]
- Itoh, H.; Miura, Y.; Ikuta, N.; Nakao, Y.; Tagashira, H. Electron swarm development in SF6: I. Boltzmann equation analysis. J. Phys. D Appl. Phys. 1988, 21, 922–930. [Google Scholar] [CrossRef]
- Itoh, H.; Matsumura, T.; Satoh, K.; Date, H.; Nakao, Y.; Tagashira, H. Electron transport coefficients in SF6. J. Phys. D Appl. Phys. 1993, 26, 1975–1979. [Google Scholar] [CrossRef]
- De Urquijo, J.; Mitrani, A.; Ruiz-Vargas, G.; Basurto, E. Limiting field strength and electron swarm coefficients of the CF3I–SF6 gas mixture. J. Phys. D Appl. Phys. 2011, 44, 342001. [Google Scholar] [CrossRef]
- Aschwanden, T.H. Swarm parameters in SF6 and SF6/N2 mixtures determined from a time resolved discharge study. In Proceedings of the 4th International Symposium on Gaseous Dielectrics; Christophorou, L.G., Pace, M.O., Eds.; Pergamon Press: New York, NY, USA, 1984; pp. 24–33. [Google Scholar]
- Dincer, M.S.; Biricik, S.; Tezcan, S.S.; Bektas, S. Back diffusion of electrons in argon subjected to uniform time invariant orthogonal electric and magnetic fields. Phys. Plasmas 2017, 24, 063507. [Google Scholar] [CrossRef]
- Itoh, H.; Ohmori, Y.; Kawaguchi, M.; Miura, Y.; Nakao, Y.; Tagashira, H. Electron energy distribution and transport coefficients of electron swarms in SF6 and nitrogen mixtures. J. Phys. D Appl. Phys. 1990, 23, 415–421. [Google Scholar] [CrossRef]
- Guerra, V.; Dias, F.M.; Loureiro, J.; Sa, P.A.; Supiot, P.; Dupret, C.; Popov, T. Time-dependence of the electron energy distribution function in the nitrogen afterglow. IEEE T. Plasma Sci. 2003, 31, 542–552. [Google Scholar] [CrossRef] [Green Version]
- Dincer, M.S.; Tezcan, S.S.; Duzkaya, H. Magnetic insulation in nitrogen subjected to crossed fields. AIP Adv. 2018, 8, 095026. [Google Scholar] [CrossRef]
- Hall, W.B.; Lopez-Roldan, J. Application of rotating arc SF6 interrupter design to the highest distribution voltage levels. In Proceedings of the Fifth International Conference on Trends in Distribution Switchgear: 400 V–145 kV for Utilities and Private Networks, London, UK, 10–12 Novmber 1998. [Google Scholar] [CrossRef]
- Yokomizu, Y.; Matsumoto, S.; Hirata, S.; Matsumura, T.; Ishikawa, A.; Furuhata, T.; Mitsukuchi, K. Arc behavior in rotary-arc type of load-break switch and its current-interrupting capability for different environmentally benign gases and electrode materials. IEEJ Trans. PE 2005, 125, 1070–1076. [Google Scholar] [CrossRef]
- Matsumura, T.; Yokomizu, Y.; Kanda, D.; Kumazawa, T.; Furuhata, T.; Mitsukuchi, K. Effect of magnetic field strength and admixture gas on current interrupting capability of a CO2 rotary-arc load-break switch. Electr. Eng. Jpn. 2009, 167, 21–27. [Google Scholar] [CrossRef]
Figure 1.
Mean mid-year tropospheric SF6 concentrations in the northern (NH) and southern (SH) hemispheres for the period 1952.5 to 2015.5 [6].
Figure 1.
Mean mid-year tropospheric SF6 concentrations in the northern (NH) and southern (SH) hemispheres for the period 1952.5 to 2015.5 [6].

Figure 2.
Measured Direct Current breakdown voltages in SF6 + N2 and SF6 + Air mixtures as a function of gas pressure for a uniform electrode gap of 10 mm [17].
Figure 2.
Measured Direct Current breakdown voltages in SF6 + N2 and SF6 + Air mixtures as a function of gas pressure for a uniform electrode gap of 10 mm [17].

Figure 3.
Limit electrical field in SF6 + N2 at 3000 K [19].
Figure 3.
Limit electrical field in SF6 + N2 at 3000 K [19].

Figure 4.
The type of molecule decision scheme.

Figure 5.
Selecting the nature of the collision.

Figure 6.
SF6 at 360 Td without the crossed magnetic field: (a) number of electrons; (b) electron mean energies.
Figure 6.
SF6 at 360 Td without the crossed magnetic field: (a) number of electrons; (b) electron mean energies.

Figure 7.
A 0.25% SF6 + 99.75% N2 mixture at 300 Td with different magnitudes of crossed magnetic field: (a,b) number of electrons; (c) electron mean energies; (d) electron energy distribution functions (Corresponding magnetic field strength; Black line: H = 3.99 A/m, Red line: H = 7.95 × 10³ A/m, Green line: H = 1.59 × 10⁴ A/m, Blue line: H = 4.60 × 10⁴ A/m).

Figure 8.
A 0.25% SF6 + 99.75% N2 mixture at 400 Td with different magnitudes of crossed magnetic field: (a) number of electrons; (b) electron mean energies; (c) electron energy distribution functions (Corresponding magnetic field strength; Black line: H = 0 A/m, Red line: H = 6.00 × 10⁴ A/m).
Figure 8.
A 0.25% SF6 + 99.75% N2 mixture at 400 Td with different magnitudes of crossed magnetic field: (a) number of electrons; (b) electron mean energies; (c) electron energy distribution functions (Corresponding magnetic field strength; Black line: H = 0 A/m, Red line: H = 6.00 × 10⁴ A/m).

Figure 9.
A 0.50% SF6 + 99.50% N2 mixture at 400 Td with different magnitudes of crossed magnetic field: (a,b) number of electrons; (c) electron mean energies; (d) electron energy distribution functions (Corresponding magnetic field strength; Black line: H = 0 A/m, Red line: H = 5.73 × 10⁴ A/m, Green line: H = 6.76 × 10⁴ A/m).

Figure 10.
A 0.75% SF6 + 99.25% N2 mixture at 400 Td with different magnitudes of crossed magnetic field: (a) number of electrons; (b) electron mean energies; (c) electron energy distribution functions (Corresponding magnetic field strength; Black line: H = 0 A/m, Red line: H = 5.26 × 10⁴ A/m).
Figure 10.
A 0.75% SF6 + 99.25% N2 mixture at 400 Td with different magnitudes of crossed magnetic field: (a) number of electrons; (b) electron mean energies; (c) electron energy distribution functions (Corresponding magnetic field strength; Black line: H = 0 A/m, Red line: H = 5.26 × 10⁴ A/m).

Figure 11.
The 3% SF6 + 97% N2 and 7% SF6 + 93% N2 mixtures at 400 Td with different magnitudes of crossed magnetic field: (a) number of electrons; (b) electron mean energies; (c) electron energy distribution functions (Corresponding magnetic field strength; Black line: H = 4.20 × 10⁴ A/m, Red line: H = 4.65 × 10⁴ A/m, Green line: H = 3.62 × 10⁴ A/m).


Table 1.
Atmospheric greenhouse gas concentrations included in the Kyoto and Montreal protocol gases [4].
Table 1.
Atmospheric greenhouse gas concentrations included in the Kyoto and Montreal protocol gases [4].
| Gases | 1950 | 1990 | 2015 | |||
|---|---|---|---|---|---|---|
| Value 1 | (%) | Value 1 | (%) | Value 1 | (%) | |
| CO2 | 0.593 | 66.85 | 1.289 | 60.52 | 1.941 | 65.80 |
| CH4 | 0.230 | 25.93 | 0.459 | 21.55 | 0.506 | 17.15 |
| N2O | 0.064 | 7.22 | 0.129 | 6.06 | 0.189 | 6.41 |
| PFC, HFC, SF6 | 0.010 | 0.47 | 0.040 | 1.36 | ||
| Montreal Gases [5] | 0.243 | 11.41 | 0.274 | 9.29 | ||
1 ppm CO2 eq. PFC, perfluorocarbon; HFC, hydrofluorocarbon.
| Title | SF6 | N2 | Dry Air |
|---|---|---|---|
| Molecular weight (g/mol) | 146 | 28 | 28.97 |
| Density (g/L) | 6.12 | 1.25 | 1.20 |
| Boiling point (℃) | −64 | −196 | −194 |
| GWP for 100 year time horizon | 23.900 | ||
| Ozone Depletion Potential (ODP) | |||
| Atmospheric lifetime (years) | 3200 | 1.6 107 | |
| Flammability | Non-flammable | Non-flammable | Non-flammable |
| Toxicity | Non-toxic | Non-toxic | Non-toxic |
| Breakdown Voltage (kV/cm.bar) | 89.0 | 32.9 | 34.3 |
GWP, global warming potential.
© 2018 by the authors. Licensee MDPI, Basel, Switzerland. This article is an open access article distributed under the terms and conditions of the Creative Commons Attribution (CC BY) license (http://creativecommons.org/licenses/by/4.0/).
Share and Cite
MDPI and ACS Style
Dincer, M.S.; Tezcan, S.S.; Duzkaya, H. Suppression of Electron Avalanches in Ultra-Dilute SF6-N2 Mixtures Subjected to Time-Invariant Crossed Fields. Energies 2018, 11, 3247. https://doi.org/10.3390/en11123247
AMA Style
Dincer MS, Tezcan SS, Duzkaya H. Suppression of Electron Avalanches in Ultra-Dilute SF6-N2 Mixtures Subjected to Time-Invariant Crossed Fields. Energies. 2018; 11(12):3247. https://doi.org/10.3390/en11123247
Chicago/Turabian StyleDincer, Mustafa Sezai, Suleyman Sungur Tezcan, and Hidir Duzkaya. 2018. "Suppression of Electron Avalanches in Ultra-Dilute SF6-N2 Mixtures Subjected to Time-Invariant Crossed Fields" Energies 11, no. 12: 3247. https://doi.org/10.3390/en11123247
Note that from the first issue of 2016, this journal uses article numbers instead of page numbers. See further details here.