A Novel Approach Based on Crow Search Algorithm for Solving Reactive Power Dispatch Problem


Laboratory of Technologies of Information, Communication and Electrical Engineering (LaTICE), National Superior School of Engineers of Tunis (ENSIT), University of Tunis, Tunis 1002, Tunisia
*
Author to whom correspondence should be addressed.
Energies 2018, 11(12), 3321; https://doi.org/10.3390/en11123321
Submission received: 2 November 2018
/
Revised: 19 November 2018
/
Accepted: 23 November 2018
/
Published: 28 November 2018
(This article belongs to the Section F: Electrical Engineering)
Abstract
:This paper presents a novel meta-heuristic approach based on the crow search algorithm (CSA) for solving the optimal reactive power dispatch (ORPD) problem. The ORPD is formulated as a nonlinear optimization problem designed to minimize power losses while satisfying the required constraints. The CSA is a recent efficient approach that depends on the intelligent behavior of crows. Nowadays, it has been used to solve many complex engineering optimization problems where it has proven its power and effectiveness. Motivated by the high ability in solving complex optimization problems and faster convergence of CSA, this paper proposes a novel approach to solve the ORPD problem. Furthermore, the settings of control variables such as generator terminal voltage, tap changer positions, and capacitor banks are determined to achieve the minimum total power loss while satisfying a set of nonlinear constraints. The accuracy and the performance of the proposed algorithm were performed and compared to other meta-heuristic algorithms reported in the literature. Several tests are applied on two standard test systems, including IEEE 14-bus and IEEE 30-bus as well as on the large-scale Tunisian 86-bus system. In addition, a sensitivity analysis has been performed to valid the performance of the CSA in solving the ORPD problem. We demonstrate that the proposed CSA provides a supremacy results and statistically significant in solving ORPD problems (for IEEE-14 bus , for IEEE-30 bus , and for Tunisian 86-bus ).
1. Introduction
Optimal reactive power dispatch (ORPD) is one of the strategic problems in which inappropriate management can compromise the security and the reliability of the power systems [1,2]. ORPD represents a specific part of the more general OPF problem. It can be divided into two parts: the real and reactive power dispatch problems. The real power dispatch problem aims to minimize the total cost of real power generated by the different production plants [3,4]. On the other hand, the reactive power dispatch controls the power system stability, power quality and power losses. The main objectives of ORPD are to minimize real power losses and to increase voltage stability by enhancing the load bus voltage deviations while simultaneously satisfying a certain set of desired operating and security constraints [5,6,7]. Therefore, the ORPD is formulated as a complex optimization problem involving a nonlinear objective function with continuous and discrete control variables subject to nonlinear constraints [8,9,10]. The controlled variables of the ORPD problem are generator bus voltages, transformer tap-settings, shunt capacitors and output of static reactive power compensators. These variables must be set simultaneously to minimize power losses and to improve the voltage profile by satisfying the equality and inequality constraints [11,12,13].
Different trends in the literature are presented to solve the ORPD problem, where initial attempts have resorted to classical optimization methods such as the Newton–Raphson method [14], quadratic programming [15], interior point method [16] and linear programming [17]. Nevertheless, these methods cannot handle the complexity of the ORPD problem where they have difficulties dealing with nonlinear functions, discrete variables and converge to the local minima, and thus were ineffective to resolve the ORPD problem. To overcome these limitations, evolutionary and meta-heuristic algorithms are applied to solve the ORPD problem. Specifically, Genetic Algorithm (GA) is applied to solve the reactive power dispatch [18,19]. It is easy to use and has a good variety of solutions to avoid falling into the local optimum. However, its drawbacks are the slow convergence rate and there is no guarantee that GA will find a global optimum. In [20], Differential Evolution (DE) algorithm is employed to minimize power losses, improve the voltage profile, and enhance the voltage stability. However, this approach addresses the ORPD problem as a single objective optimization problem. Particle Swarm Optimization (PSO) is a widely used method for solving ORPD problem [10,11,21]. However, its major weaknesses are the large computational time and the premature convergence. Seeker Optimization Algorithm (SOA) is implemented to the ORPD problem to reduce the total power loss and increasing voltage stability [22]. Nevertheless, SOA may be stuck in local optimum for multimodal functions. Ant Colony Optimization (ACO) algorithm is used to minimize the losses as a single objective function [23]. This algorithm addresses each objective function separately as a single objective optimization problem which leads to slower convergence speed. Artificial Bee Colony (ABC) algorithm is implemented to solve the ORPD problem after supposing an already established real power system [24]. Simulation results show that ABC has poor exploitation characteristics, slower convergence speed and may get stuck in local optimum. Firefly Algorithm (FA) is executed to reduce the real power loss and the voltage deviations [25]. FA is often stuck into local optima and its parameters are fixed and they do not change with the time. On the other hand, Whale Optimization Algorithm (WOA) is proposed to solve the ORPD problem on the Algerian power system [13]. However, the WOA has low convergence precision and convergence rates in complex optimization problems. Antlion Optimizer (ALO) is used for solving the ORPD problem [12]. Application of ALO for ORPD demonstrates that ALO gives better results compared to the differential evolutionary PSO (DEEPSO) and mean variance mapping optimization (MVMO) [12]. Nevertheless, the phenomenon of local optimum and prematurity convergence may arise for ALO, especially in large-scale problems.
Recently, the Crow Search Algorithm (CSA) has emerged as a new meta-heuristic method for solving complex optimization problems [26]. CSA algorithm is based on the intelligent behavior of crows [26]. CSA contains fewer adjustable parameters than other methods such as PSO, GA, and ICA (Imperialist Competitive Algorithm), which make it superior and effective in solving complex problems compared to other state-of-the-art methods. Furthermore, this algorithm has demonstrated its effectiveness and ability to solve many complex engineering optimization problems, such as environmental dispatch [27], renewable energy [28], distribution networks [29], machine problems [30], image processing [31], water resources [32] and energy problems (induction motors and distribution networks) [33].
The easy implementation, simple structure, searching force, high ability to solve complex optimization problems, and faster convergence motivate the CSA to be proposed in solving one of the challenging optimization problems in power systems, i.e., the ORPD problem. Therefore, the main contributions of this paper are to propose and investigate the crow search algorithm (CSA) for solving the ORPD problem. Hence, two standards IEEE benchmark systems, IEEE 14-bus and IEEE 30-bus, as well as the real transmission Tunisian power system, 86-bus, were used to substantiate the effectiveness of CSA algorithm. The achieved results were compared with other optimization algorithms used in the literature (PSO, WOA, and ALO). We show that adequate control of reactive power production contributes to the reduction of real power losses, and thus ensure the voltage profile improvement of all buses in power systems. In addition, a sensitivity analysis was performed to confirm the performance of the proposed approach. Consequently, significant technical and economic merits are satisfied, which prove the robustness and the effectiveness of the proposed CSA approach, thus providing an alternative solution to the ORPD problem.
The paper is organized as follows: Section 2 presents the ORPD problem formulation. Section 3 introduces the crow search algorithm. Section 4 derives the proposed CSA for the ORPD problem. Simulation and comparison results are presented in Section 5. In Section 6, a sensitivity analysis to test the differences among CSA, PSO, WOA, and ALO is presented. The main findings and future work directions are summarized in Section 7.
2. Problem Formulation
The ORPD problem is formulated as a nonlinear and non-convex optimization problem. The objective function is to minimize the power losses of the transmission system, taking into account the equality and inequality constraints [12,13]. Mathematically:
where represents the objective function of power losses, is the equality constraints, is the inequality constraints, and x and u represent the vectors of control variables and state variables, respectively.
2.1. Variables
Control Variables
The control variables vector x consists of load bus voltages, transmission line loading and reactive power output of generators as follows:
where is the load bus voltages, is the number of load buses, is the reactive power of ith generator bus, denotes the number of generators, represents the transmission line loadings, and denotes the number of transmission lines.
State Variables
The state variables vector u includes discrete and continuous variables: voltages of PV bus (continuous variables), switching shunt capacitor banks (discrete variables), and transformer tap settings (discrete variables). It is expressed by:
where represents the generator voltages, is the reactive power of ith load bus, denotes the number of shunt VAR compensators, T is the transformer tap settings, and denotes the number of regulating transformers.
2.2. Constraints
The ORPD problem is subject to satisfy the required equality and inequality constraints [12].
Equality Constraints
The equality constraints represent the power balance of load flow equations. The difference between power generated and power demand is equal to power loss as follows:
Inequality Constraints
The inequality constraints are based on the operating limits that satisfy the normal operation of the system. The inequality constraints of control and state variables are given by:
- Generator voltages limits:
- Tap positions of transformers limits:
- Amount of reactive compensation limits:
- Load bus voltage constraints limits:
- Reactive power outputs limits of generators:
- The transmission lines loading are limited by upper values:
3. The Crow Search Algorithm (CSA)
Crow search algorithm (CSA) is a novel meta-heuristic optimization method recently proposed by Askarzadeh [26] to solve constrained engineering problems. This algorithm is modeled related to the intelligent behavior of the crows while saving their excess food in hiding places and retrieving it when the food is needed. Crows can remember the faces of other crows and warn each other when an unfriendly crow approaches as they have large brains relative to their bodies. In addition, they can use communication tools in sophisticated ways and remember the places where food is hidden for up to several months. Therefore, the main principles of crows is that they monitor the food locations of other birds and steal when there are no birds in that place. Moreover, if the crow has committed thievery, it will take extra precautions such as moving hiding places to avoid becoming a victim in the future.
Let us assume that d is a dimensional environment and N is the number of crows. The position of crows i at iteration is given by:
where and . is the maximum number of iterations.
Crows move in the environment and search for better sources of food (hiding places). Each crow has a memory capacity that can memorize the position of its food hiding places. One of the main activities of the crow is to follow crow j to get close to the hiding place of the food and hunt it. Therefore, two major cases may occur in CSA:
- Case 1: Crow j does not know that crow i is following it. Therefore, crow i will approach the hiding place of crow j and change its position to a new one as follows:where is a random number with uniform distribution (between 0 and 1), indicates the flight length of crow i at iteration (see Figure 1), and represents the best visited location by crow j at iteration .
- Case 2: Crow j detects that it is followed by crow i. Thus, to protect its cache from being pilfered, crow j will change the flight pass to mislead followers by moving to another position in the search space.
Therefore, the position of crow can be expressed as follows:
where indicates the awareness probability of each crow.
4. ORPD Problem Using Crow Search Algorithm
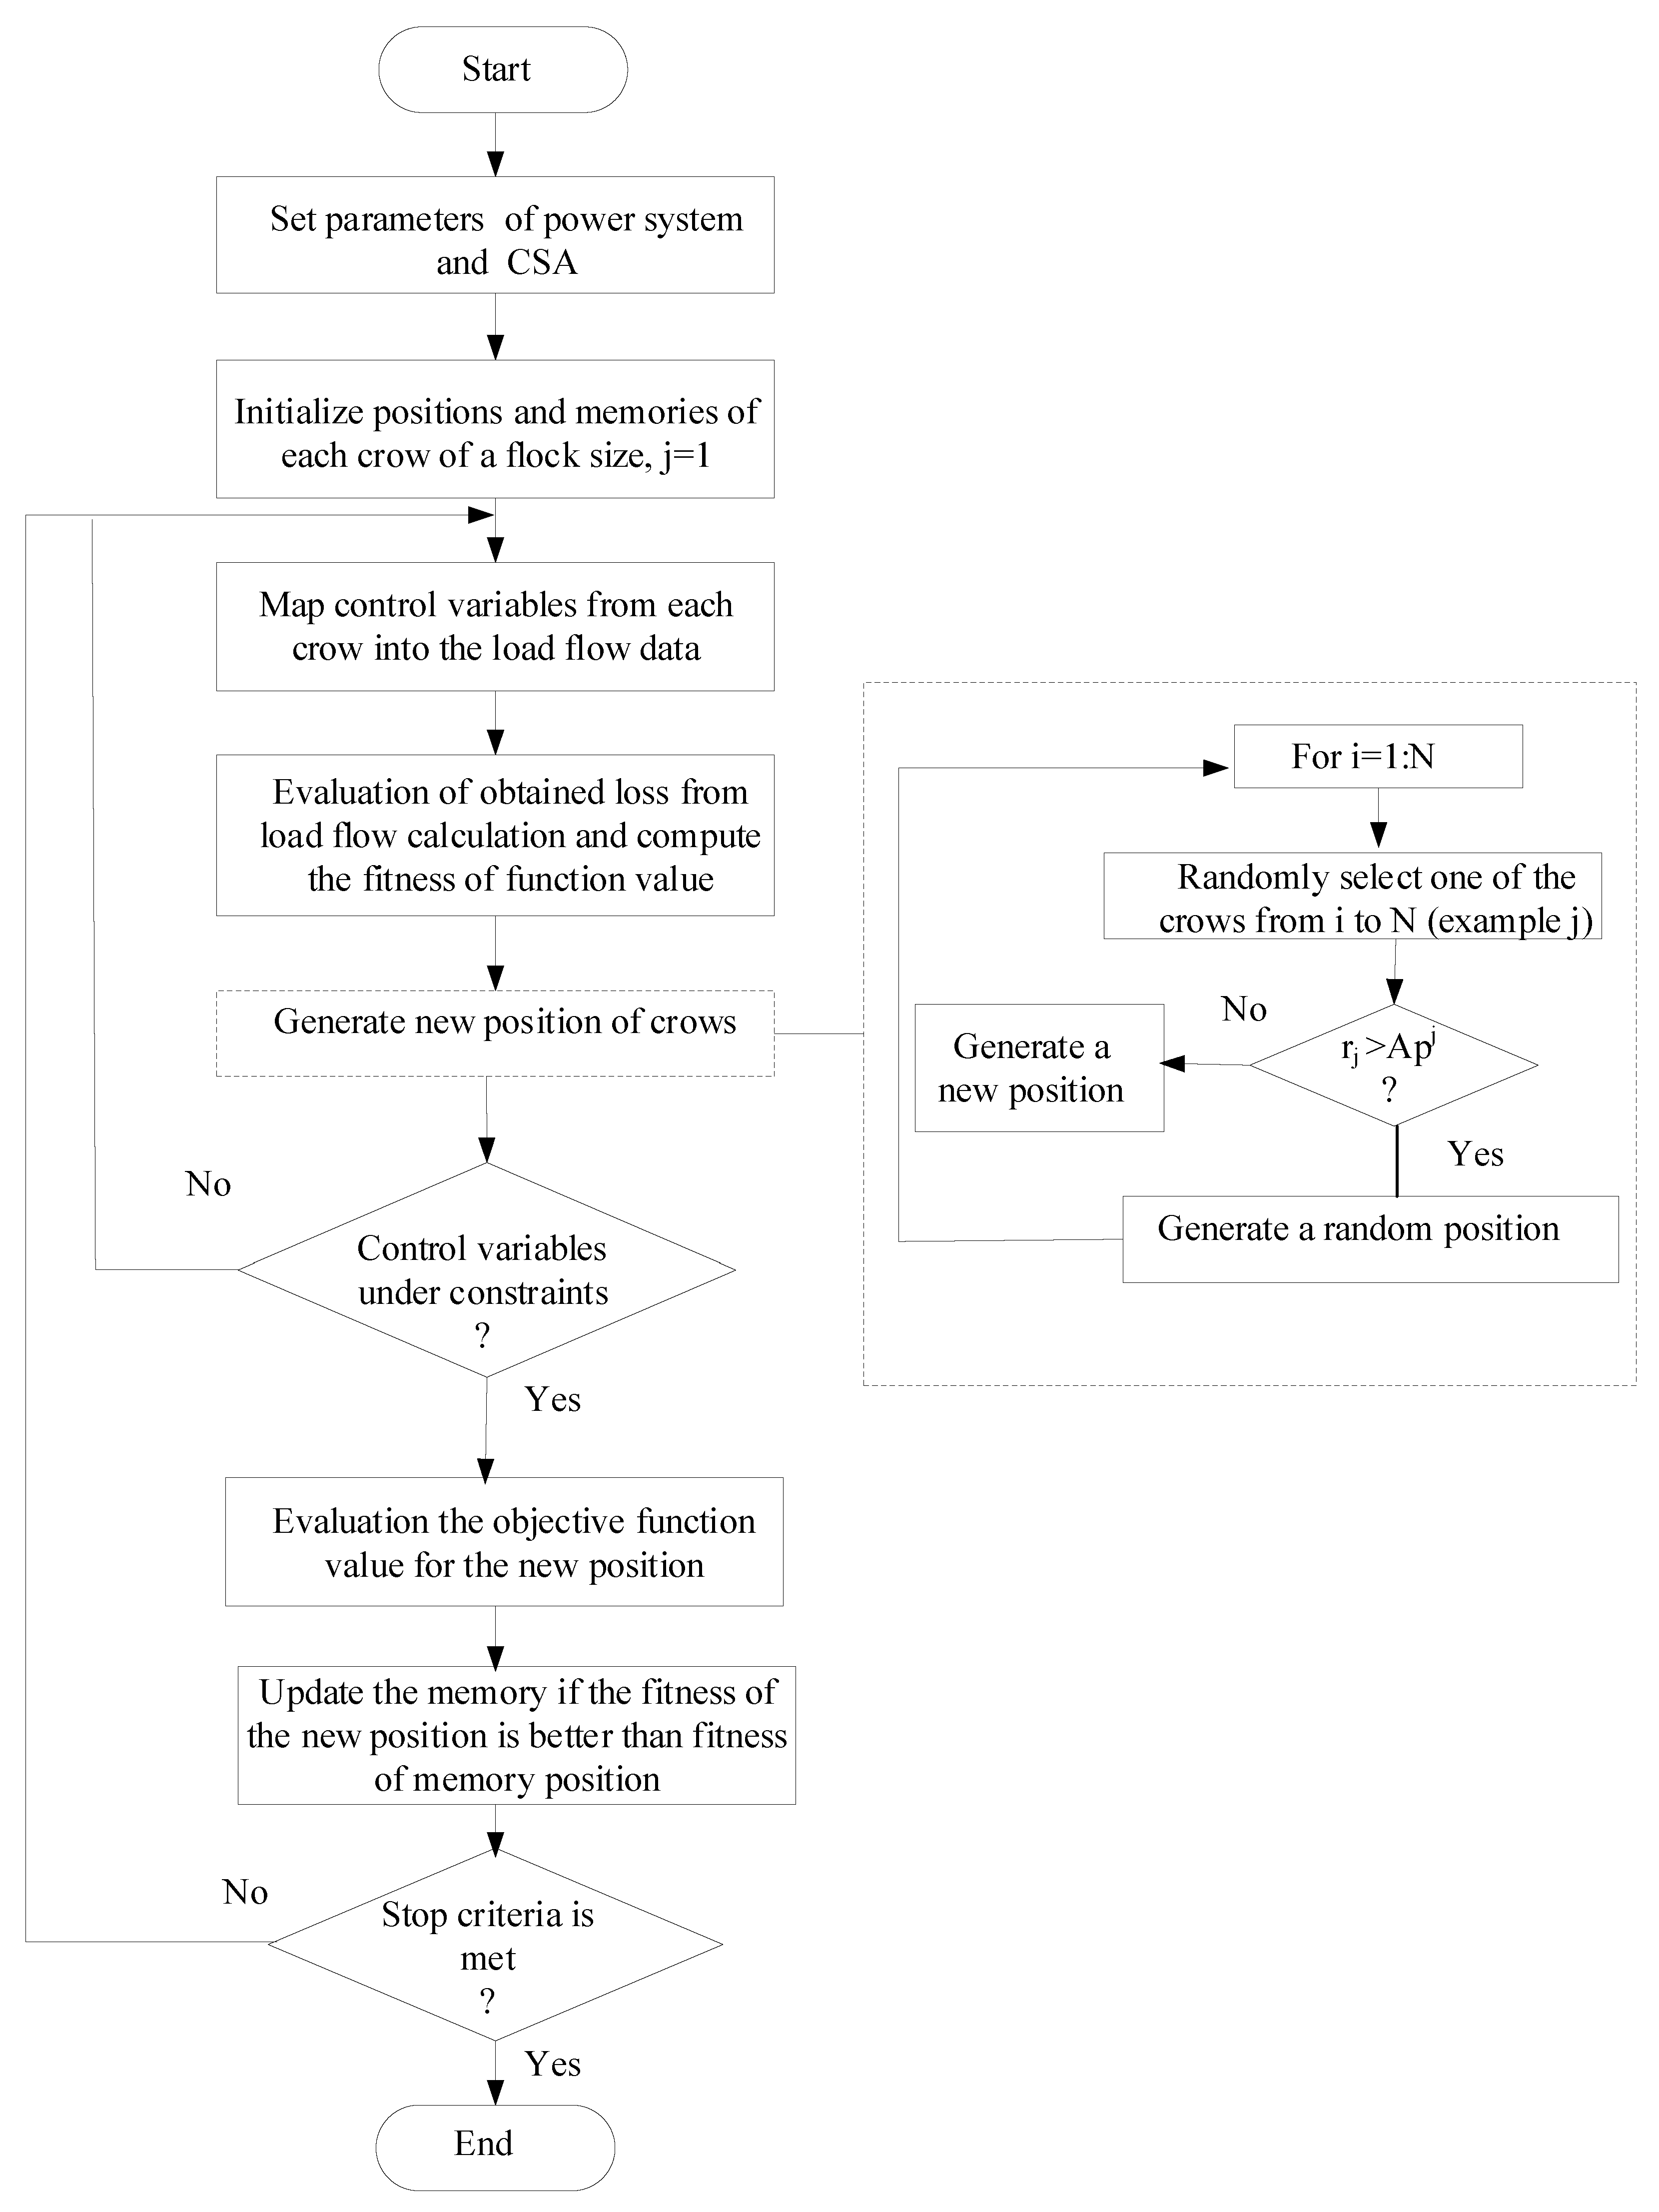
We propose the CSA approach to solve the ORPD problem. The main objective is to find the optimal solution of control variables to minimize the objective function while satisfying all the constraints imposed by the power system. The implementation of the CSA for the ORPD problem is achieved through by the following steps:
- Step 1: Initialization of algorithm parameters and constraintsInitialize the number of crows N, the maximum number of iterations , flight length and awareness probability . Determine the decision variables and constraints.
- Step 2: Initialize position and memory of crowsGenerate N crows randomly in the d-dimensional search space. Each crow presents an appropriate solution to the problem. Initially, crows have no experience; it is supposed that they have hidden their food in the initial positions.
- Step 3: Evaluate fitness functionFor each crow, the quality of its position is computed by adjusting the values of the control variable into the objective function.
- Step 4: Generate new positionThe crow i generates a new position as follows: It selects randomly one of the other crows and follows it to find the position of the hidden food. Thus, the new position of crow i is given by Equation (14). This procedure is repeated for all crows.
- Step 5: Check the feasibility of new positionsThe feasibility of the new position of each crow is examined. For the ORPD problem, all variables are checked for any violation for certain limits. If the new position of a crow is valid, the crow updates its position. Otherwise, it stays in its current position and does not move to the new position that was created.
- Step 6: Evaluate fitness function of new positionsFor each crow, the fitness function value of the new position is computed.
- Step 7: Update memoryIf the evaluation of the fitness function value of each crow is better than the memorized fitness function value, the crows update its memory as follows:where indicates the objective function value.
- Step 8: Check stop criterionRepeat Steps 4–7 until is reached. The solution of the ORPD problem is the best position of the memory corresponding to the best objective function value.
Figure 2 illustrates the flowchart of the proposed algorithm in order to solve the ORPD problem.
5. Application and Results
The proposed approach based on CSA for solving the ORPD problem was applied to the standard IEEE-14 and the IEEE-30 bus benchmark power systems as well as the Tunisian power system. It was implemented using MATLAB Platform on a Windows 10 Intel(R) Core(TM) i3-5010U CPU @ GHz 6 GB RAM. For all test systems, the base power was 100 MW. The results obtained with CSA were compared with three other meta-heuristic algorithms: Particle Swarm Optimization (PSO), Ant Lion Optimization (ALO), and Whale Optimization Algorithm (WOA).The features of all test systems and the limits of control variables are given in Table 1 and Table 2.
5.1. IEEE 14-Bus Test Power System
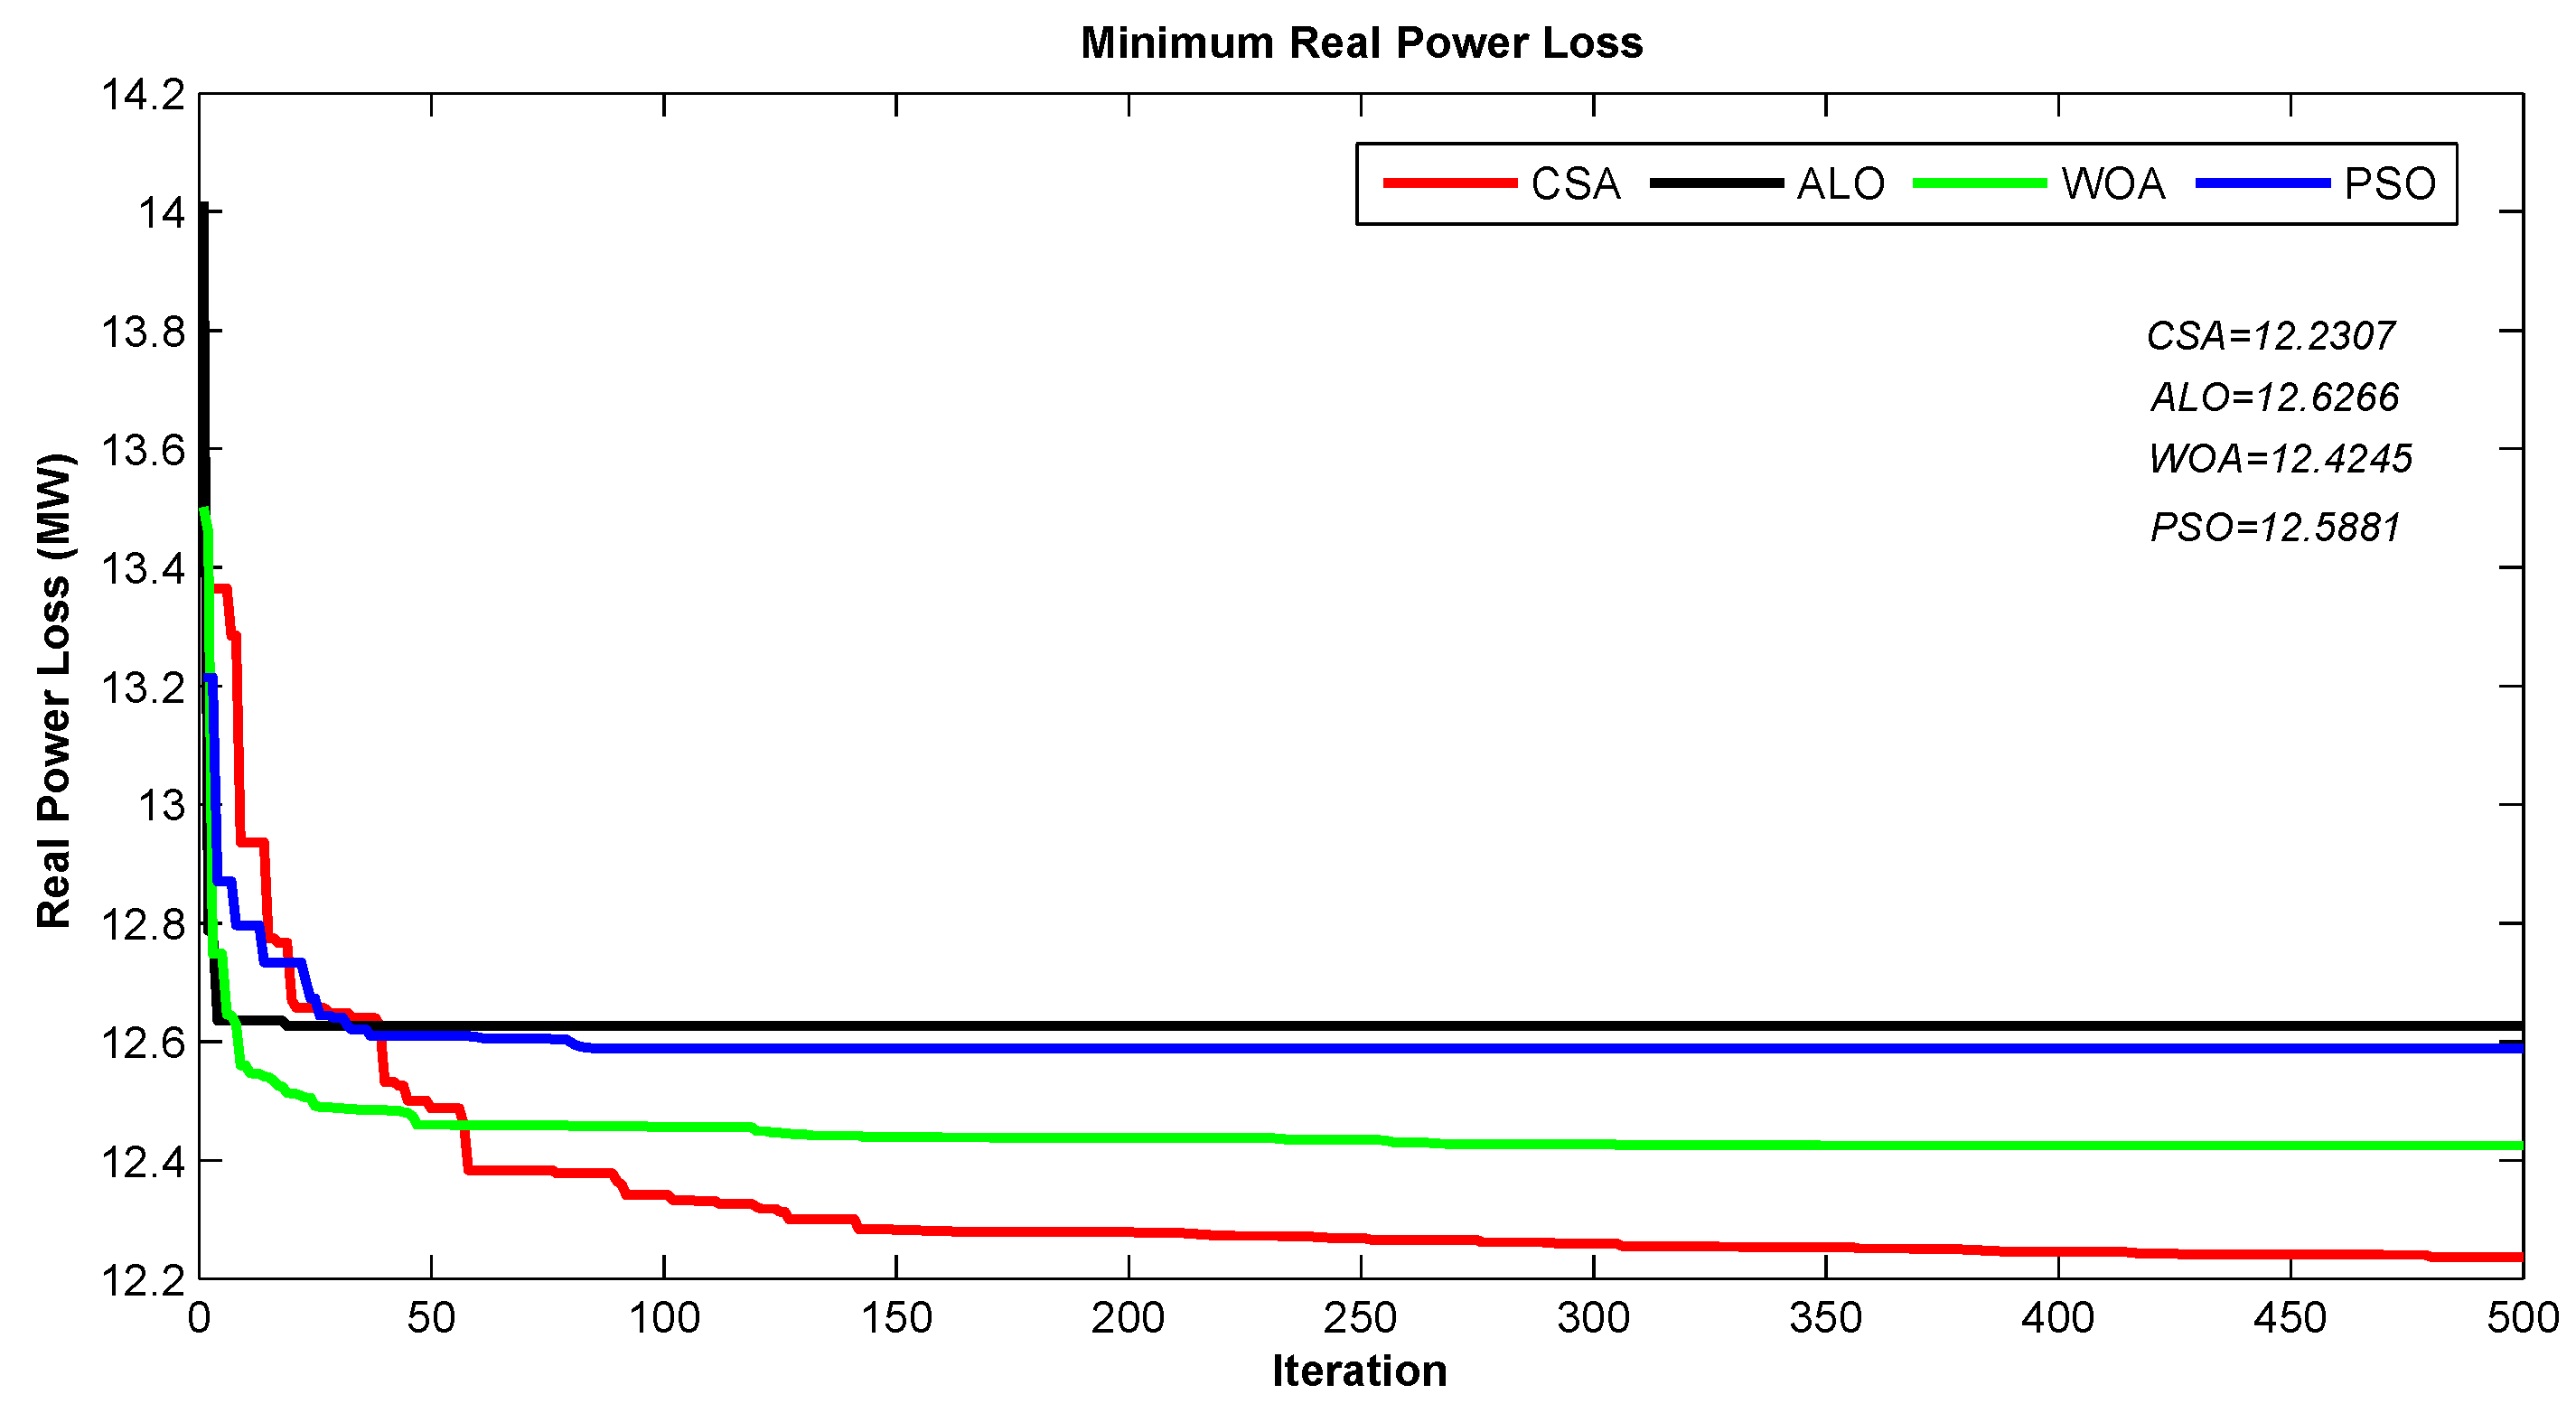
This test system includes five generators at the buses 1, 2, 3, 6 and 8, three tap-changing transformers located at Lines 4–7, 4–9 and 5–6 and two shunt reactive compensators connected to buses 9 and 14. All data of this test system are specified in [34]. CSA, PSO, ALO, and WOA were applied to minimize real power loss as the main objective function. Table 3 presents the results of the optimal settings using the four implemented algorithms. The optimal result was given by the proposed CSA where the active power loss is MW () compared to PSO MW (), ALO MW (), and WOA MW (). In addition, we noticed that the CSA is the fastest ( s) compared to PSO ( s), ALO ( s), and WOA ( s). Obviously, the computing time of CSA is less than the other algorithms. Figure 3 represents the performance loss convergence characteristics for the corresponding approaches: CSA is in red, PSO is in blue, WOA is in green and ALO is in black. Moreover, the CSA algorithm has a great ability to locate the optimal solutions and effectively deal the constraints of the optimization problem.
5.2. IEEE 30-Bus Test Power System
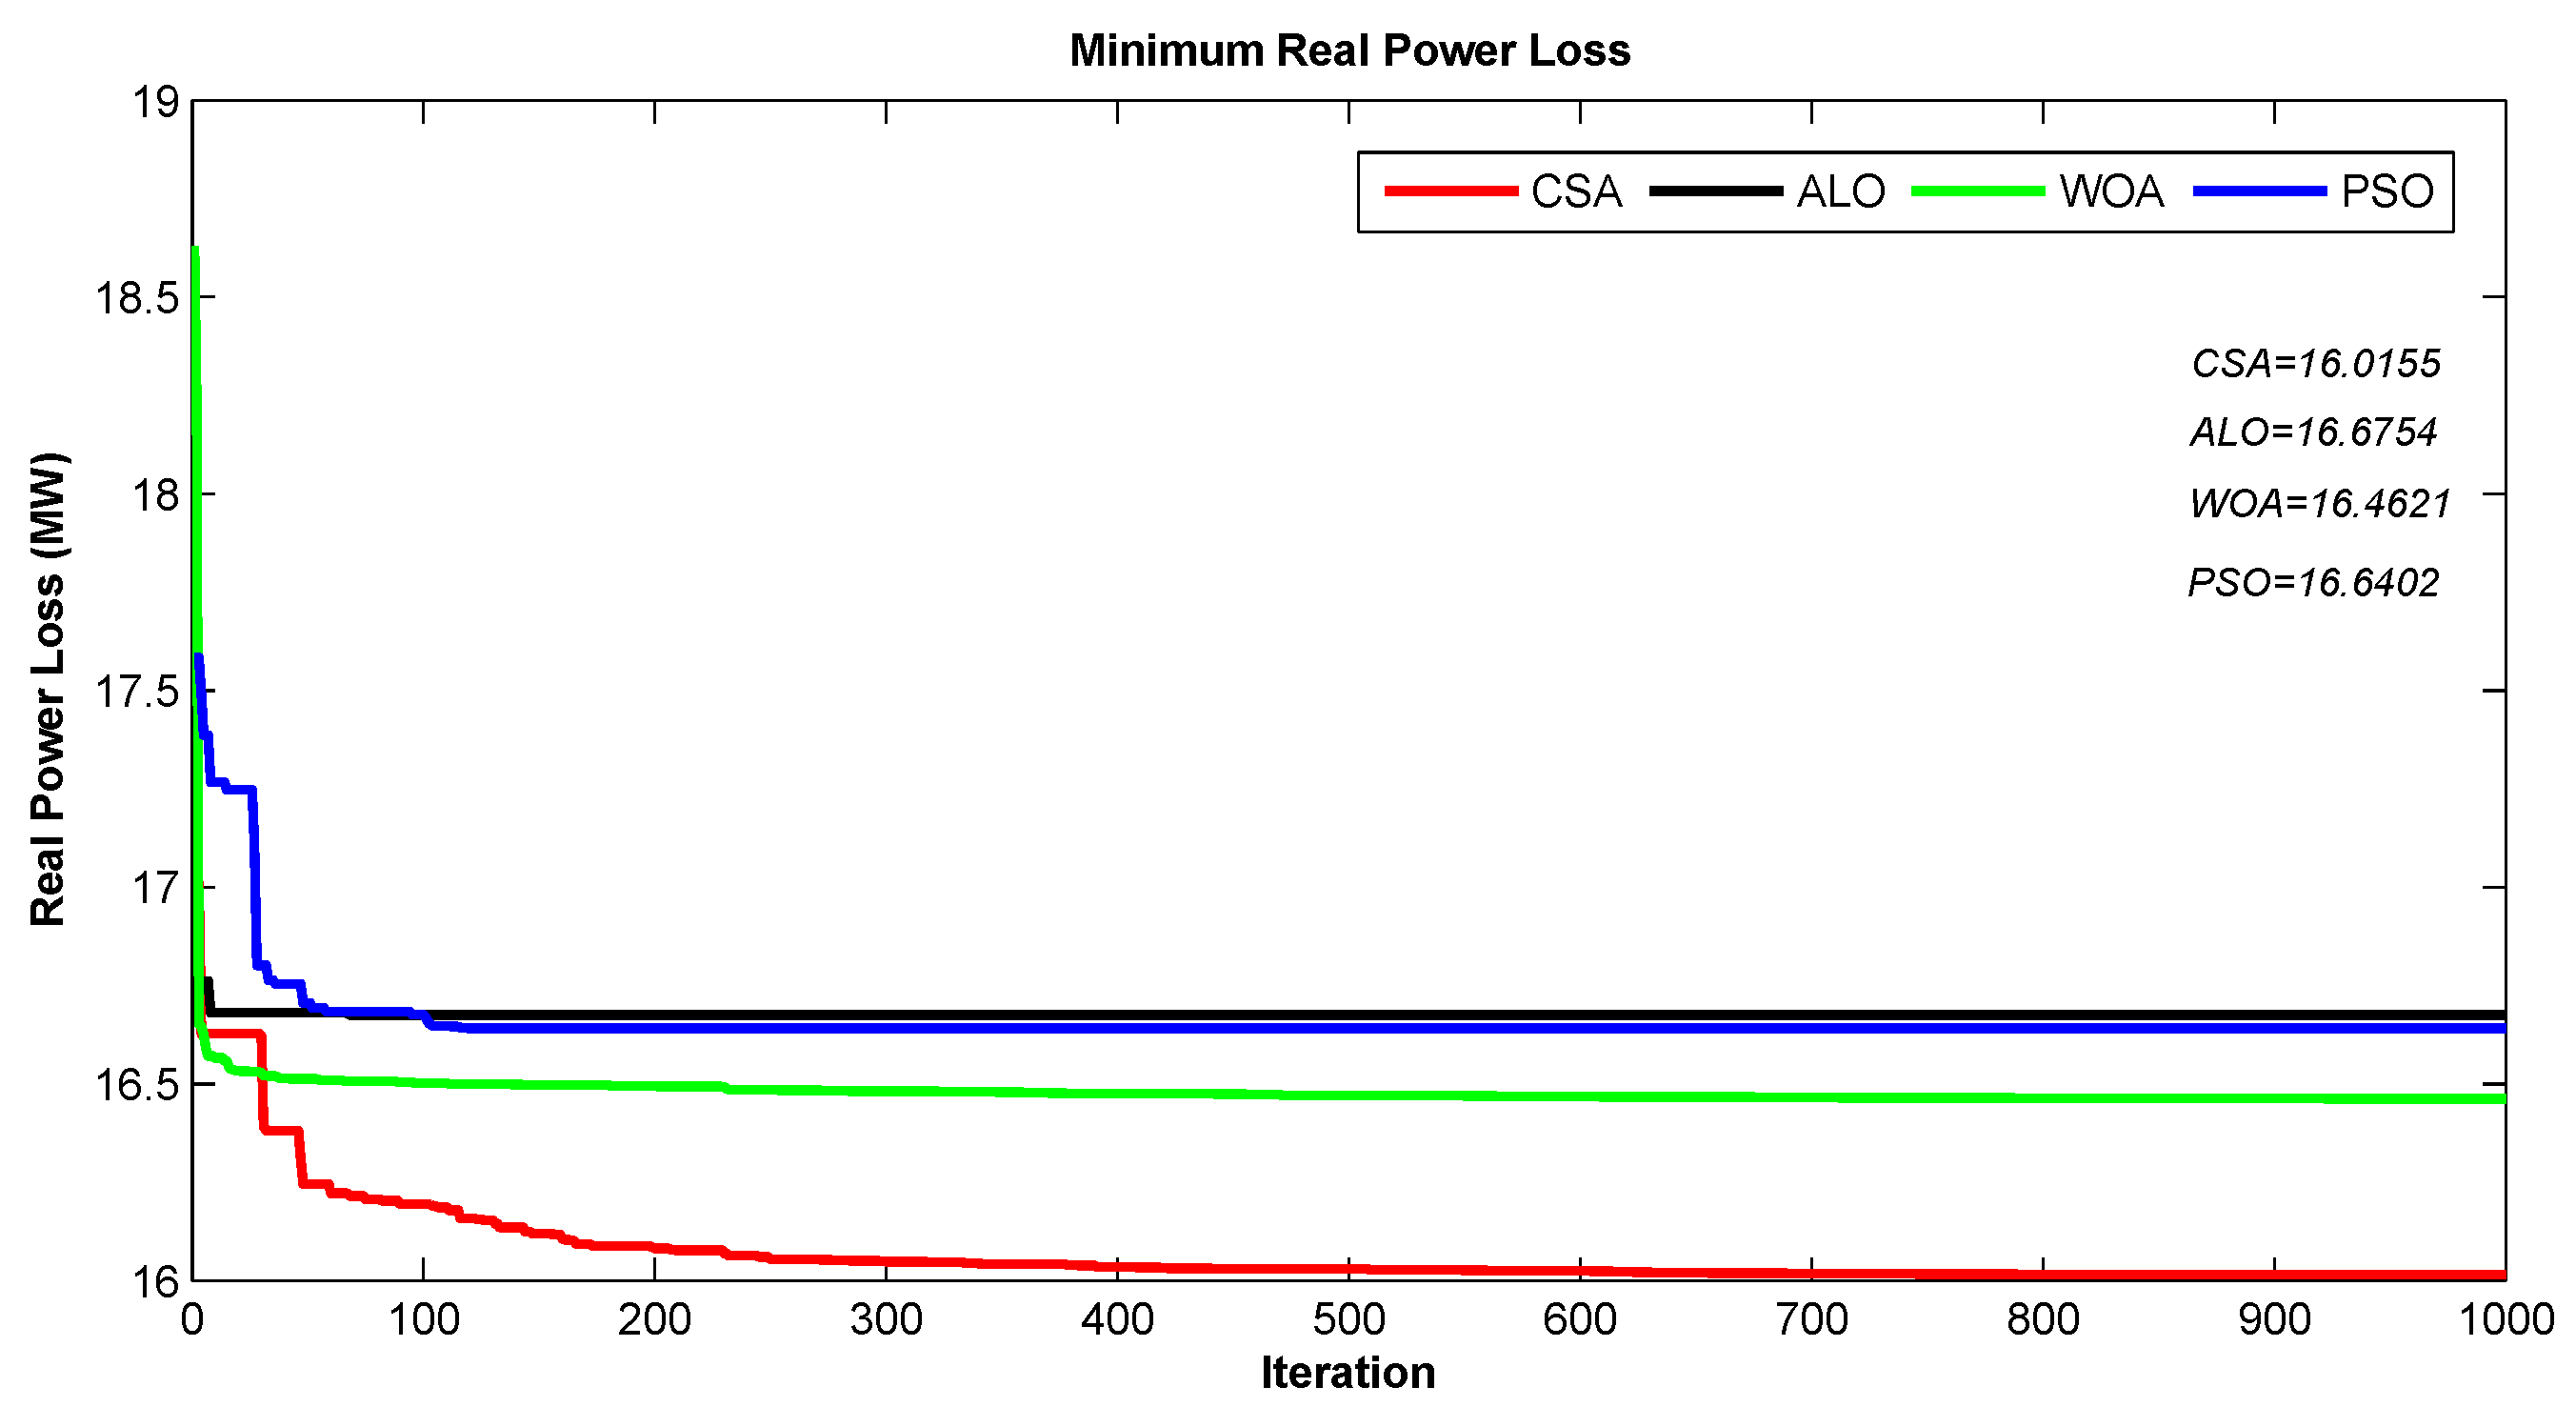
In this case study, the IEEE 30-bus test system includes six generators connected to buses 1, 2, 5, 8, 11 and 13. Four tap-changing transformers are located at lines 6–9, 4–12, 9–12 and 27–28. Nine shunt reactive power sources are connected to buses 10, 12, 15, 17, 20, 21, 23, 24 and 29. The system data are given in. To evaluate the efficacy and the superiority of the proposed algorithm to minimize the power losses of this test system, we tested PSO, ALO, WOA, and CSA. Table 4 summarizes the results of the optimal settings using CSA, PSO, ALO, and WOA. The performance real power loss convergence characteristics of the all mentioned approaches are shown in Figure 4. We note that the minimum real power loss obtained by the proposed CSA method is the best optimization values among all the compared algorithms: CSA MW (), PSO MW (), ALO MW (), and WOA MW (). In addition, CSA is the fastest algorithm ( s) compared to PSO ( s), ALO ( s), and WOA ( s). It is clear that the obtained outcomes verify also the accuracy and effectiveness of the proposed algorithm to minimize the real power losses.
5.3. A Real Case Study: Tunisian 86-Bus Power System
For the examination of the appropriateness of the proposed algorithm on the large-scale power system, we considered a large real power system: Tunisian -bus power system. It includes 22 generators, 120 lines, 21 tap-changing transformers, and 15 shunt reactive power sources (see Figure 5). Table 5 introduces the results of the optimal settings using the swarm approaches for this case. The optimal solution for the ORPD problem in Tunisian power system is given by the proposed CSA where the obtained minimum active power loss MW (), PSO MW (), ALO MW (), and WOA MW (). The convergence time with CSA is faster than the other methods, where CSA converged in s, PSO in s, ALO in s and WOA in s.
Figure 6 shows the performance loss convergence characteristics of the swarm approaches. We observed that the proposed CSA has good convergence characteristics compared to PSO, ALO and WOA. It is substantial to note that the CSA algorithm can solve the ORPD even for a large-scale power system.
6. Sensitivity Analysis
Sensitivity analysis (SA) is one of the methods that help to make decisions regarding with more than a solution to a problem. It provides a decent idea about how sensitive is the optimum solution chosen to any changes in the input values of one or more parameters. ANOVA is a model independent sensitivity analysis method that evaluates whether there is any statistically significant association between an output and one or more inputs [35]. Therefore, ANOVA uses the F-statistic ratio to determine whether a significant difference exists among mean responses for main effects or interactions between factors. The relative magnitude of F-values can be used to rank the factors in the sensitivity analysis [36]. The higher is the F-value, the more sensitive the response variable is to the factor. Therefore, factors with higher F-values are given higher rankings. The p-value indicates that differences between column means are significant. One-way ANOVA was used to compare the means between the results obtained by the proposed CSA algorithm and the other developed PSO, WOA, and ALO techniques.
Table 6, Table 7 and Table 8 summarize the statistical analysis of the proposed and the conventional methods for IEEE-14 and IEEE-30 bus benchmark power systems and the real Tunisian power system, respectively. Note that CSA always provides the competing performance over the other algorithms in terms of accuracy (Mean) and robustness (standard deviation).
Table 9 depicts the results of the one-way ANOVA test obtained for the different systems. We observed that the results of p-value are much lower than for all tests, which confirm that CSA is statistically significant from ALO, WOA, and PSO.
7. Conclusions
We addressed the problem of optimal reactive power dispatch (ORPD) using a recent meta-heuristic technique, called Crow Search Algorithm (CSA). The ORPD problem is formulated as a nonlinear constrained optimization problem to minimize power losses and enhance the voltage stability. The main advantages of the proposed CSA relay on the high ability to solve complex optimization problems and faster convergence. The proposed CSA has been successfully implemented and tested on benchmark test bus systems which are IEEE-14 and the IEEE-30 as well as on the real and large-scale Tunisian 86-bus system to solve the ORPD problem. Based on sensitivity analysis test, the proposed CSA has a superior performance (for IEEE-14 bus , for IEEE-30 bus , and for Tunisian 86-bus ) compared to ALO, WOA, and PSO. It provides the optimal and faster solution to minimize the real power loss. In our future work, we will improve the performance of CSA to minimize the number of iterations which leads to minimizing the convergence time and suggest this approach as a powerful solution for the Tunisian Company of Electricity and Gas.
Author Contributions
All the authors have contributed to this work including the production of the idea, the analysis and interpretation of the results and finally the writing and reviewing of the paper.
Funding
This research received no external funding.
Acknowledgments
We are grateful to the support of the Tunisian Company of Electricity and Gas and its contribution by providing real data.
Conflicts of Interest
The authors declare no conflict of interest.
References
- Rahmani-andebili, M. Reliability and economic-driven switchable capacitor placement in distribution network. IET Gener. Trans. Distrib. 2015, 9, 1572–1579. [Google Scholar] [CrossRef]
- Rahmani-andebili, M. Optimal power factor for optimally located and sized solar parking lots applying quantum annealing. IET Gener. Trans. Distrib. 2016, 10, 2538–2547. [Google Scholar] [CrossRef]
- Liu, X.; Wen, Y.; Li, Z. Multiple Solutions of Transmission Line Switching in Power Systems. IEEE Trans. Power Syst. 2018, 33, 1118–1120. [Google Scholar] [CrossRef]
- Sulaimana, M.H.; Mustaffa, Z.; Mohameda, M.R.; Alimana, O. Using the gray wolf optimizer for solving optimal reactive power dispatch problem. Appl. Soft Comput. 2015, 32, 286–292. [Google Scholar] [CrossRef]
- Rahmani-andebili, M. Effect of Load Models on Optimal Capacitor Allocation in Distribution Network. In Proceedings of the IEEE Electric Power Distribution Networks Conference (EPDC), Tehran, Iran, 2–3 May 2012. [Google Scholar]
- Rahmani-andebili, M. Simultaneous placement of DG and capacitor in distribution network. Electr. Power Syst. Res. 2016, 131, 1598–1606. [Google Scholar] [CrossRef]
- Rahmani-andebili, M. Economic and Network-Driven Distributed Generation Placement Modeling Feeder’s Failure Rate and Customer’s Load Type. IEEE Trans. Ind. Electron. 2016, 63, 1–10. [Google Scholar] [CrossRef]
- Shareef, S.M.; Srinivasa Rao, R. Optimal reactive power dispatch under unbalanced conditions using hybrid swarm intelligence. Comput. Electr. Eng. 2018, 69, 183–193. [Google Scholar] [CrossRef]
- Cui, S.; Wang, Y.; Lin, X.; Liu, X. Distributed auction optimization algorithm for the nonconvex economic dispatch problem based on the gossip communication mechanism. Int. J. Electr. Power Energy Syst. 2018, 95, 417–426. [Google Scholar] [CrossRef]
- Jangir, P.; Parmar, S.A.; Trivedi, I.N.; Bhesdadiya, R. A novel hybrid Particle Swarm Optimizer with multi verse optimizer for global numerical optimization and Optimal Reactive Power Dispatch problem. Eng. Sci. Technol. Int. J. 2017, 20, 570–586. [Google Scholar] [CrossRef]
- Singh, R.P.; Mukherjeeb, V.; Ghoshal, S. Optimal reactive power dispatch by particle swarm optimization with an aging leader and challengers. Appl. Soft Comput. 2015, 29, 298–309. [Google Scholar] [CrossRef]
- Mouassa, S.; Bouktir, T.; Salhi, A. Ant lion optimizer for solving optimal reactive power dispatch problem in power systems. Eng. Sci. Technol. Int. J. 2017, 20, 885–895. [Google Scholar] [CrossRef]
- Ben oualid Medani, K.; Sayaha, S.; Bekrar, A. Whale optimization algorithm based optimal reactive power dispatch: A case study of the Algerian power system. Electr. Power Syst. Res. 2017, 163, 696–705. [Google Scholar] [CrossRef]
- Jan, R.; Chen, N. Application of the fast Newton-Raphson economic dispatch and reactive power/voltage dispatch by sensitivity factors to optimal power flow. IEEE Trans. Energy Convers. 1995, 10, 293–301. [Google Scholar]
- Quintana, V.H.; Santos-Nieto, M. Reactive-power dispatch by successive quadratic programming. IEEE Trans. Energy Convers. 1989, 4, 425–435. [Google Scholar] [CrossRef]
- Granville, S. Optimal reactive dispatch through interior point methods. IEEE Trans. Power Syst. 1994, 9, 136–146. [Google Scholar] [CrossRef]
- Deeb, N.; Shahidehpour, S.M. Linear reactive power optimization in a large power network using the decomposition approach. IEEE Trans. Power Syst. 1990, 5, 428–438. [Google Scholar] [CrossRef]
- Pal, B.B.; Biswas, P.; Mukhopadhyay, A. GA based FGP approach for optimal reactive power dispatch. In Proceedings of the First International Conference on Computational Intelligence: Modeling Techniques and Applications (CIMTA), Kalyani, India, 27–28 September 2013; pp. 464–473. [Google Scholar]
- Villa-Acevedo, M.W.; López-Lezama, M.J.; Valencia-Velásquez, A.J. A Novel Constraint Handling Approach for the Optimal Reactive Power Dispatch Problem. Energies 2018, 11, 2352. [Google Scholar] [CrossRef]
- Abou ElElaa, A.A.; Abido, M.A.; Spea, S.R. Differential evolution algorithm for optimal reactive power dispatch. Electr. Power Syst. Res. 2011, 2, 458–464. [Google Scholar] [CrossRef]
- Sahli, Z.; Hamouda, A.; Bekrar, A.; Trentesaux, D. Reactive Power Dispatch Optimization with Voltage Profile Improvement Using an Efficient Hybrid Algorithm. Energies 2018, 11, 2134. [Google Scholar] [CrossRef]
- Dai, C.; Chen, W.; Zhu, Y.; Zhang, X. Seeker optimization algorithm for optimal reactive power dispatch. IEEE Trans. Power Syst. 2009, 3, 1218–1231. [Google Scholar]
- Abou ElElaa, A.A.; Kinawy, A.M.; El-Sehiemy, R.A.; Mouwafi, M.T. Optimal reactive power dispatch using ant colony optimization algorithm. Electr. Eng. 2011, 2, 103–116. [Google Scholar] [CrossRef]
- De, M.; Goswami, S. Optimal reactive power procurement with voltage stability consideration in deregulated power system. IEEE Trans. Power Syst. 2014, 5, 2078–2086. [Google Scholar] [CrossRef]
- Rajan, A.; Malakar, T. Optimal reactive power dispatch using hybrid Nelder–Mead simplex based firefly algorithm. Int. J. Electr. Power Energy Syst. 2015, 66, 9–24. [Google Scholar] [CrossRef]
- Askarzadeh, A. A novel metaheuristic method for solving constrained engineering optimization problems: Crow search algorithm. Comput. Struct. 2016, 169, 1–12. [Google Scholar] [CrossRef]
- Ela, A.A.A.E.; El-Sehiemy, R.A.; Shaheen, A.M.; Shalaby, A.S. Application of the Crow Search Algorithm for Economic Environmental Dispatch. In Proceedings of the Nineteenth International Middle East Power Systems Conference (MEPCON), Cairo, Egypt, 19–21 December 2017; pp. 78–83. [Google Scholar]
- Lalitha, M.P.; Babu, P.S.; Teja, K.S.K. Crow Search Algorithm for Optimal PV and Capacitor Placement for Loss Reduction in the Distribution Systems. Int. J. Control Theory Appl. 2017, 10, 411–417. [Google Scholar]
- Shaheen, A.M.; El-Sehiemy, R.A. Optimal allocation of capacitor devices on MV distribution networks using crow search algorithm. CIRED Open Access Proc. J. 2017, 10, 2453–2457. [Google Scholar] [CrossRef]
- Marichelvam, M.K.; Manivannan, K.; Geetha, M. Solving Single Machine Scheduling Problems using an Improved Crow Search Algorithm. Int. J. Eng. Technol. Sci. Res. 2016, 3, 8–14. [Google Scholar]
- Oliva, D.; Hinojosa, S.; Cuevas, E.; Pajares, G.; Avalos, O.; Gálvez, J. Cross entropy based thresholding for magnetic resonance brain images using Crow Search Algorithm. Expert Syst. Appl. 2017, 79, 164–180. [Google Scholar] [CrossRef]
- Liu, D.; Liu, C.; Fu, Q.; Li, T.; Imran, K.; Cui, S.; Abrar, F. ELM evaluation model of regional groundwater quality based on the crow search algorithm. Ecol. Indic. 2017, 81, 302–314. [Google Scholar] [CrossRef]
- Primitivo, D.; Pérez-Cisneros, M.; Cuevas, E.; Avalos, O.; Gálvez, J.; Hinojosa, S.; Zaldivar, D. An Improved Crow Search Algorithm Applied to Energy Problems. Energies 2018, 11, 571. [Google Scholar]
- Milano, F. Power System Modelling and Scripting; Springer: Cham, Switzerland, 2010. [Google Scholar]
- Pianosi, F.; Beven, K.; Freer, J.; Hall, J.W.; Rougier, J.; Stephenson, D.B.; Wagener, T. Sensitivity analysis of environmental models: A systematic review with practical workflow. Environ. Model. Softw. 2016, 79, 214–232. [Google Scholar] [CrossRef] [Green Version]
- Heiberger, R.M. One-Way ANOVA. In R Through Excel; Springer: New York, NY, USA, 2009; pp. 165–191. [Google Scholar]
Figure 1.
The characteristics of the crow flight length on search process.

Figure 2.
Flowchart of the proposed CSA algorithm for solving ORPD.

Figure 3.
Performance loss convergence characteristics for IEEE 14-bus test using PSO (blue), WOA (green), ALO (black) and CSA(red).
Figure 3.
Performance loss convergence characteristics for IEEE 14-bus test using PSO (blue), WOA (green), ALO (black) and CSA(red).

Figure 4.
Performance loss convergence characteristics for IEEE 30-bus test using PSO (blue), WOA (green), ALO (black) and CSA(red).
Figure 4.
Performance loss convergence characteristics for IEEE 30-bus test using PSO (blue), WOA (green), ALO (black) and CSA(red).

Figure 5.
Tunisian 86-bus real power system.

Figure 6.
Performance loss convergence characteristics for Tunisian 86-bus system using PSO (blue), WOA (green), ALO (black) and CSA (red).
Figure 6.
Performance loss convergence characteristics for Tunisian 86-bus system using PSO (blue), WOA (green), ALO (black) and CSA (red).


Table 1.
Description of test systems.
| Description | IEEE 14-Bus | IEEE 30-Bus | Tunisian 86-Bus |
|---|---|---|---|
| Number of buses | 14 | 30 | 86 |
| Number of lines | 20 | 41 | 120 |
| Number of control variables | 10 | 19 | 58 |
| Number of Generator | 5 | 6 | 22 |
| Number of Tap transformers | 3 | 4 | 21 |
| Number of | 2 | 9 | 15 |
| (MW) | |||
| (Mvar) | |||
| (MW) | 259 | ||
| (Mvar) | |||
| (MW) | |||
| (Mvar) |
Table 2.
Control variables limits for all power systems.
| Test System | Variables | Min (Pu) | Max (Pu) |
|---|---|---|---|
| IEEE 14-bus | and | ||
| T | |||
| 0 | |||
| IEEE 30-bus | and | ||
| T | |||
| 0 | |||
| Tunisian 86-bus | and | ||
| T | |||
| 0 |
Table 3.
Comparison of simulation results for IEEE 14-bus test using various approaches.
| Variables | Base Case | PSO | WOA | ALO | CSA |
|---|---|---|---|---|---|
| (MW) | |||||
| Reduction (%) | − | ||||
| CPU (s) | − |
Table 4.
Comparison of simulation results for IEEE 30-bus using various approaches.
| Variables | Base Case | PSO | WOA | ALO | CSA |
|---|---|---|---|---|---|
| 19 | |||||
| 0 | |||||
| 0 | |||||
| 0 | |||||
| 0 | |||||
| 0 | |||||
| 0 | |||||
| 0 | |||||
| 0 | |||||
| (MW) | |||||
| Reduction (%) | − | ||||
| CPU (s) | − |
Table 5.
Comparison of simulation results for Tunisian 86-bus system using various approaches.
| Variables | Base Case | PSO | WOA | ALO | CSA |
|---|---|---|---|---|---|
| 25 | |||||
| 15 | |||||
| 20 | |||||
| 15 | |||||
| 14 | |||||
| 15 | |||||
| 30 | |||||
| (MW) | |||||
| Reduction (%) | − | ||||
| CPU (s) | − |
Table 6.
Results of real power loss (MW) for IEEE 14-bus test.
| Analysis | PSO | WOA | ALO | CSA |
|---|---|---|---|---|
| Min | ||||
| Max | ||||
| Mean | ||||
| Standard deviation |
Table 7.
Results of real power loss (MW) for IEEE 30-bus test.
| Analysis | PSO | WOA | ALO | CSA |
|---|---|---|---|---|
| Min | ||||
| Max | ||||
| Mean | ||||
| Standard deviation |
Table 8.
Results of real power loss (MW) for Tunisian 86-bus system.
| Analysis | PSO | WOA | ALO | CSA |
|---|---|---|---|---|
| Min | ||||
| Max | ||||
| Mean | ||||
| Standard deviation |
Table 9.
Analysis report of the CSA, PSO, ALO and WOA for the different systems.
| Case Study | p-Value | F-Value |
|---|---|---|
| IEEE-14 | ||
| IEEE-30 | ||
| Tunisian 386 |
© 2018 by the authors. Licensee MDPI, Basel, Switzerland. This article is an open access article distributed under the terms and conditions of the Creative Commons Attribution (CC BY) license (http://creativecommons.org/licenses/by/4.0/).
Share and Cite
MDPI and ACS Style
Meddeb, A.; Amor, N.; Abbes, M.; Chebbi, S. A Novel Approach Based on Crow Search Algorithm for Solving Reactive Power Dispatch Problem. Energies 2018, 11, 3321. https://doi.org/10.3390/en11123321
AMA Style
Meddeb A, Amor N, Abbes M, Chebbi S. A Novel Approach Based on Crow Search Algorithm for Solving Reactive Power Dispatch Problem. Energies. 2018; 11(12):3321. https://doi.org/10.3390/en11123321
Chicago/Turabian StyleMeddeb, Asma, Nesrine Amor, Mohamed Abbes, and Souad Chebbi. 2018. "A Novel Approach Based on Crow Search Algorithm for Solving Reactive Power Dispatch Problem" Energies 11, no. 12: 3321. https://doi.org/10.3390/en11123321
Note that from the first issue of 2016, this journal uses article numbers instead of page numbers. See further details here.