Catalytic Hydrotreatment of Microalgae Biocrude from Continuous Hydrothermal Liquefaction: Heteroatom Removal and Their Distribution in Distillation Cuts


 , and
, and 
Abstract
1. Introduction
2. Materials and Methods
2.1. Materials
2.2. Experimental Methods
2.2.1. Design of Experiments
2.2.2. Experimental Set-Up
2.2.3. Fractional Distillation
2.3. Characterization and Analytical Techniques
3. Results and Discussion
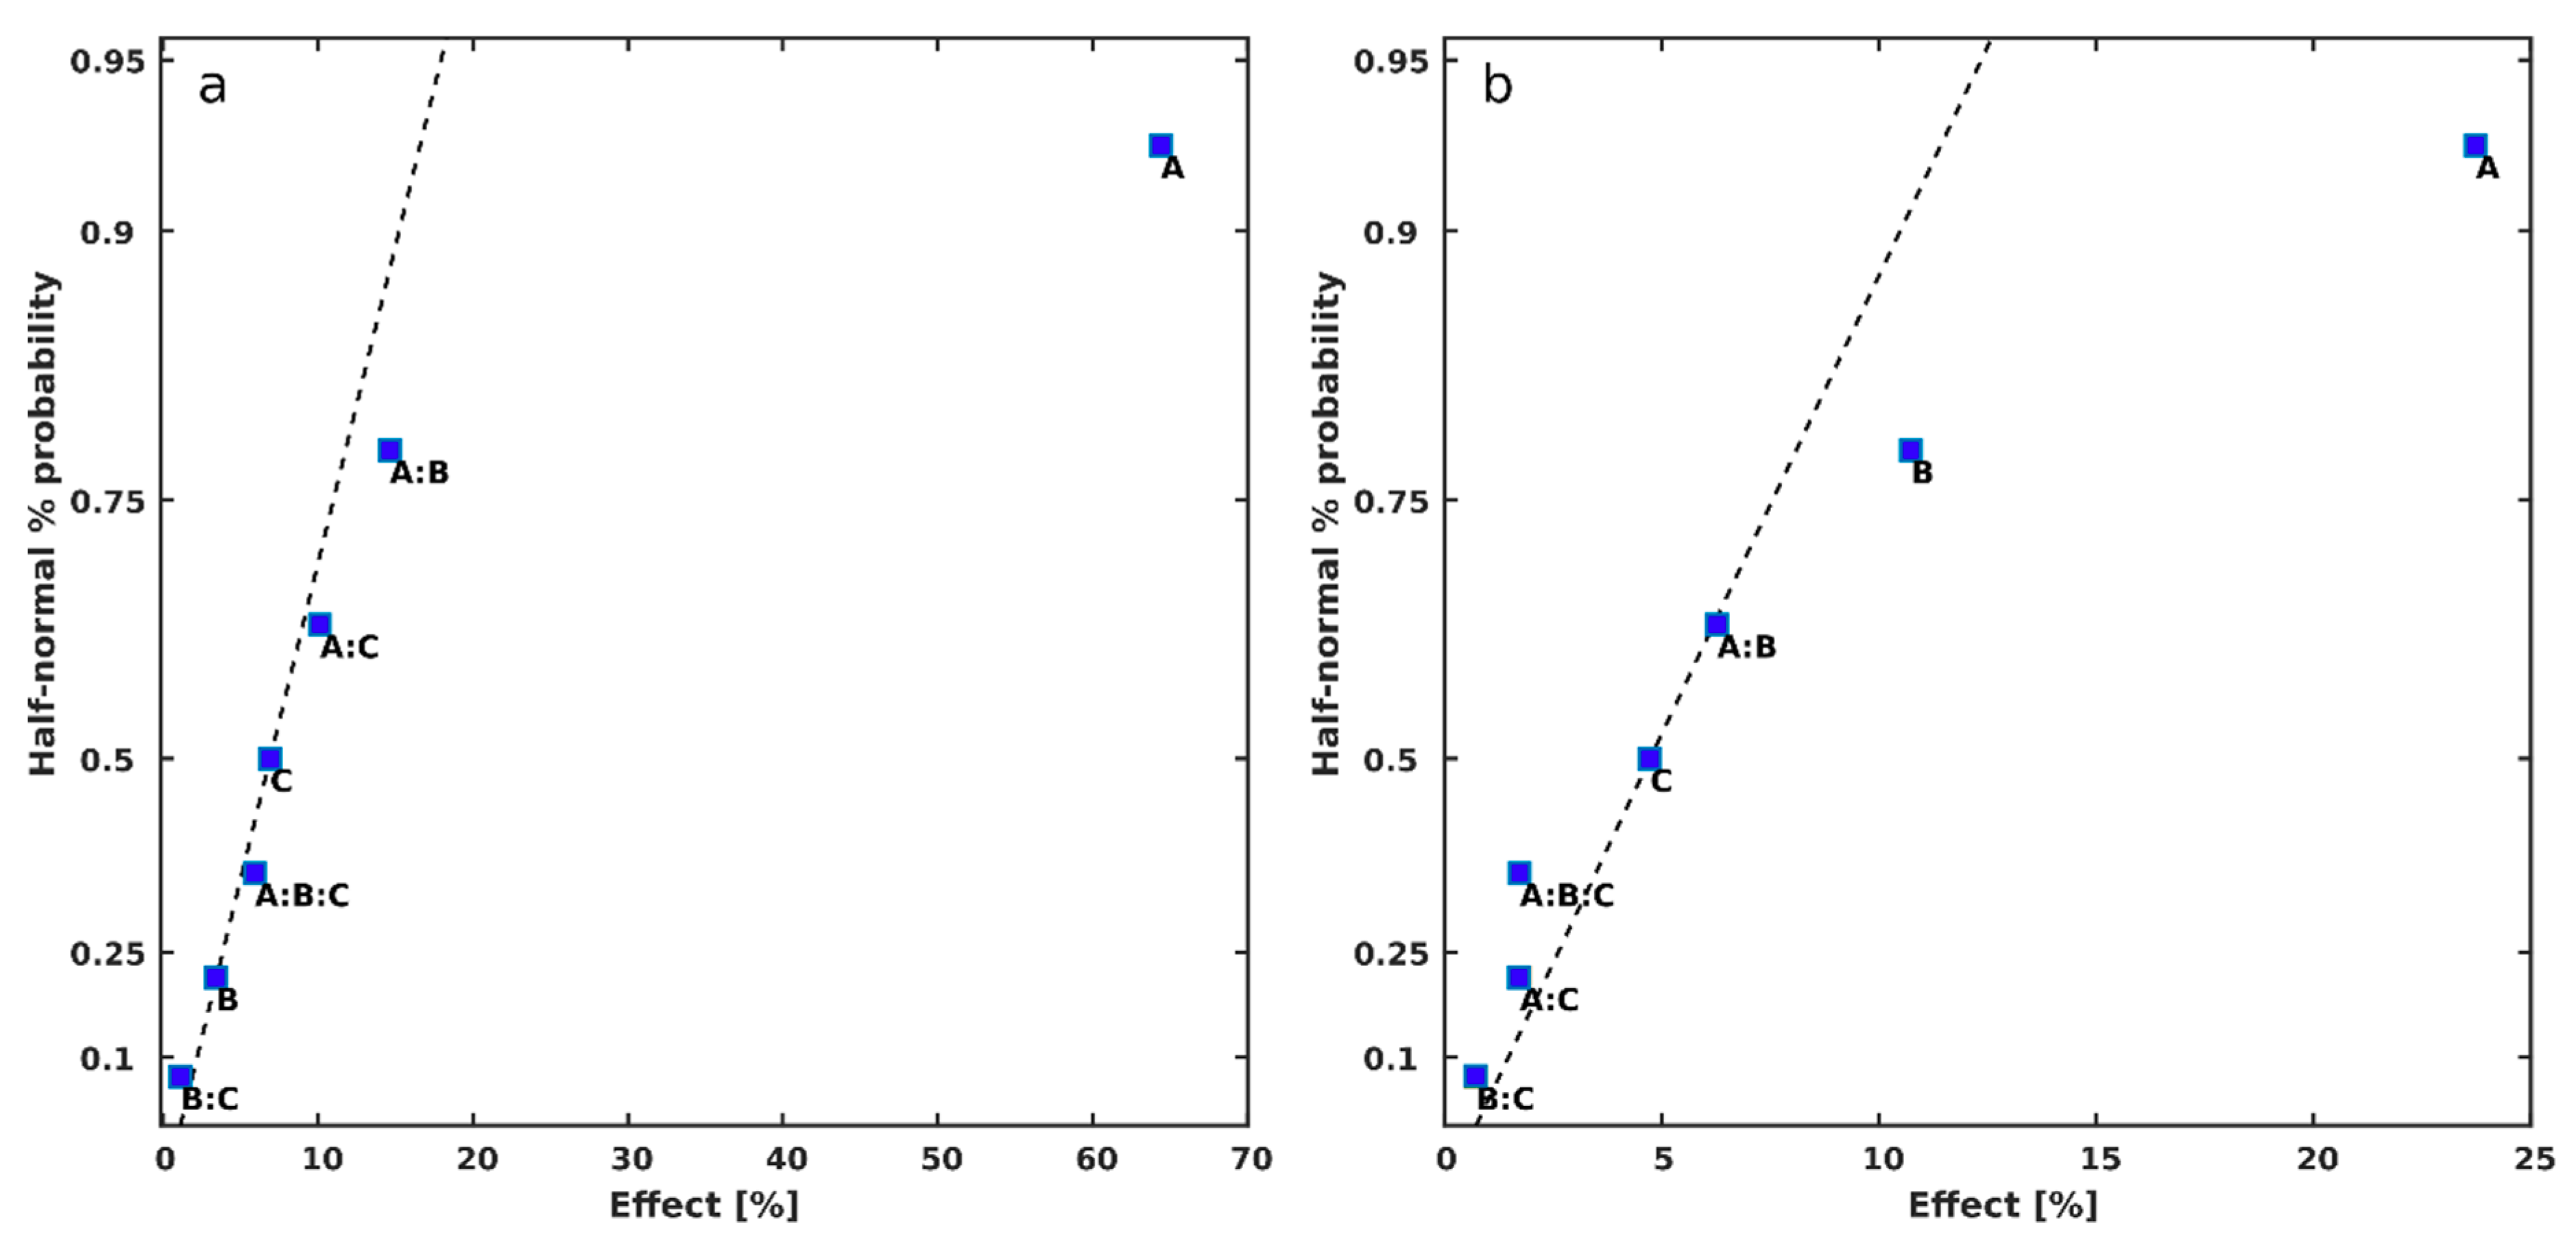
3.1. The Effect of the Process Parameters on Heteroatoms Removal
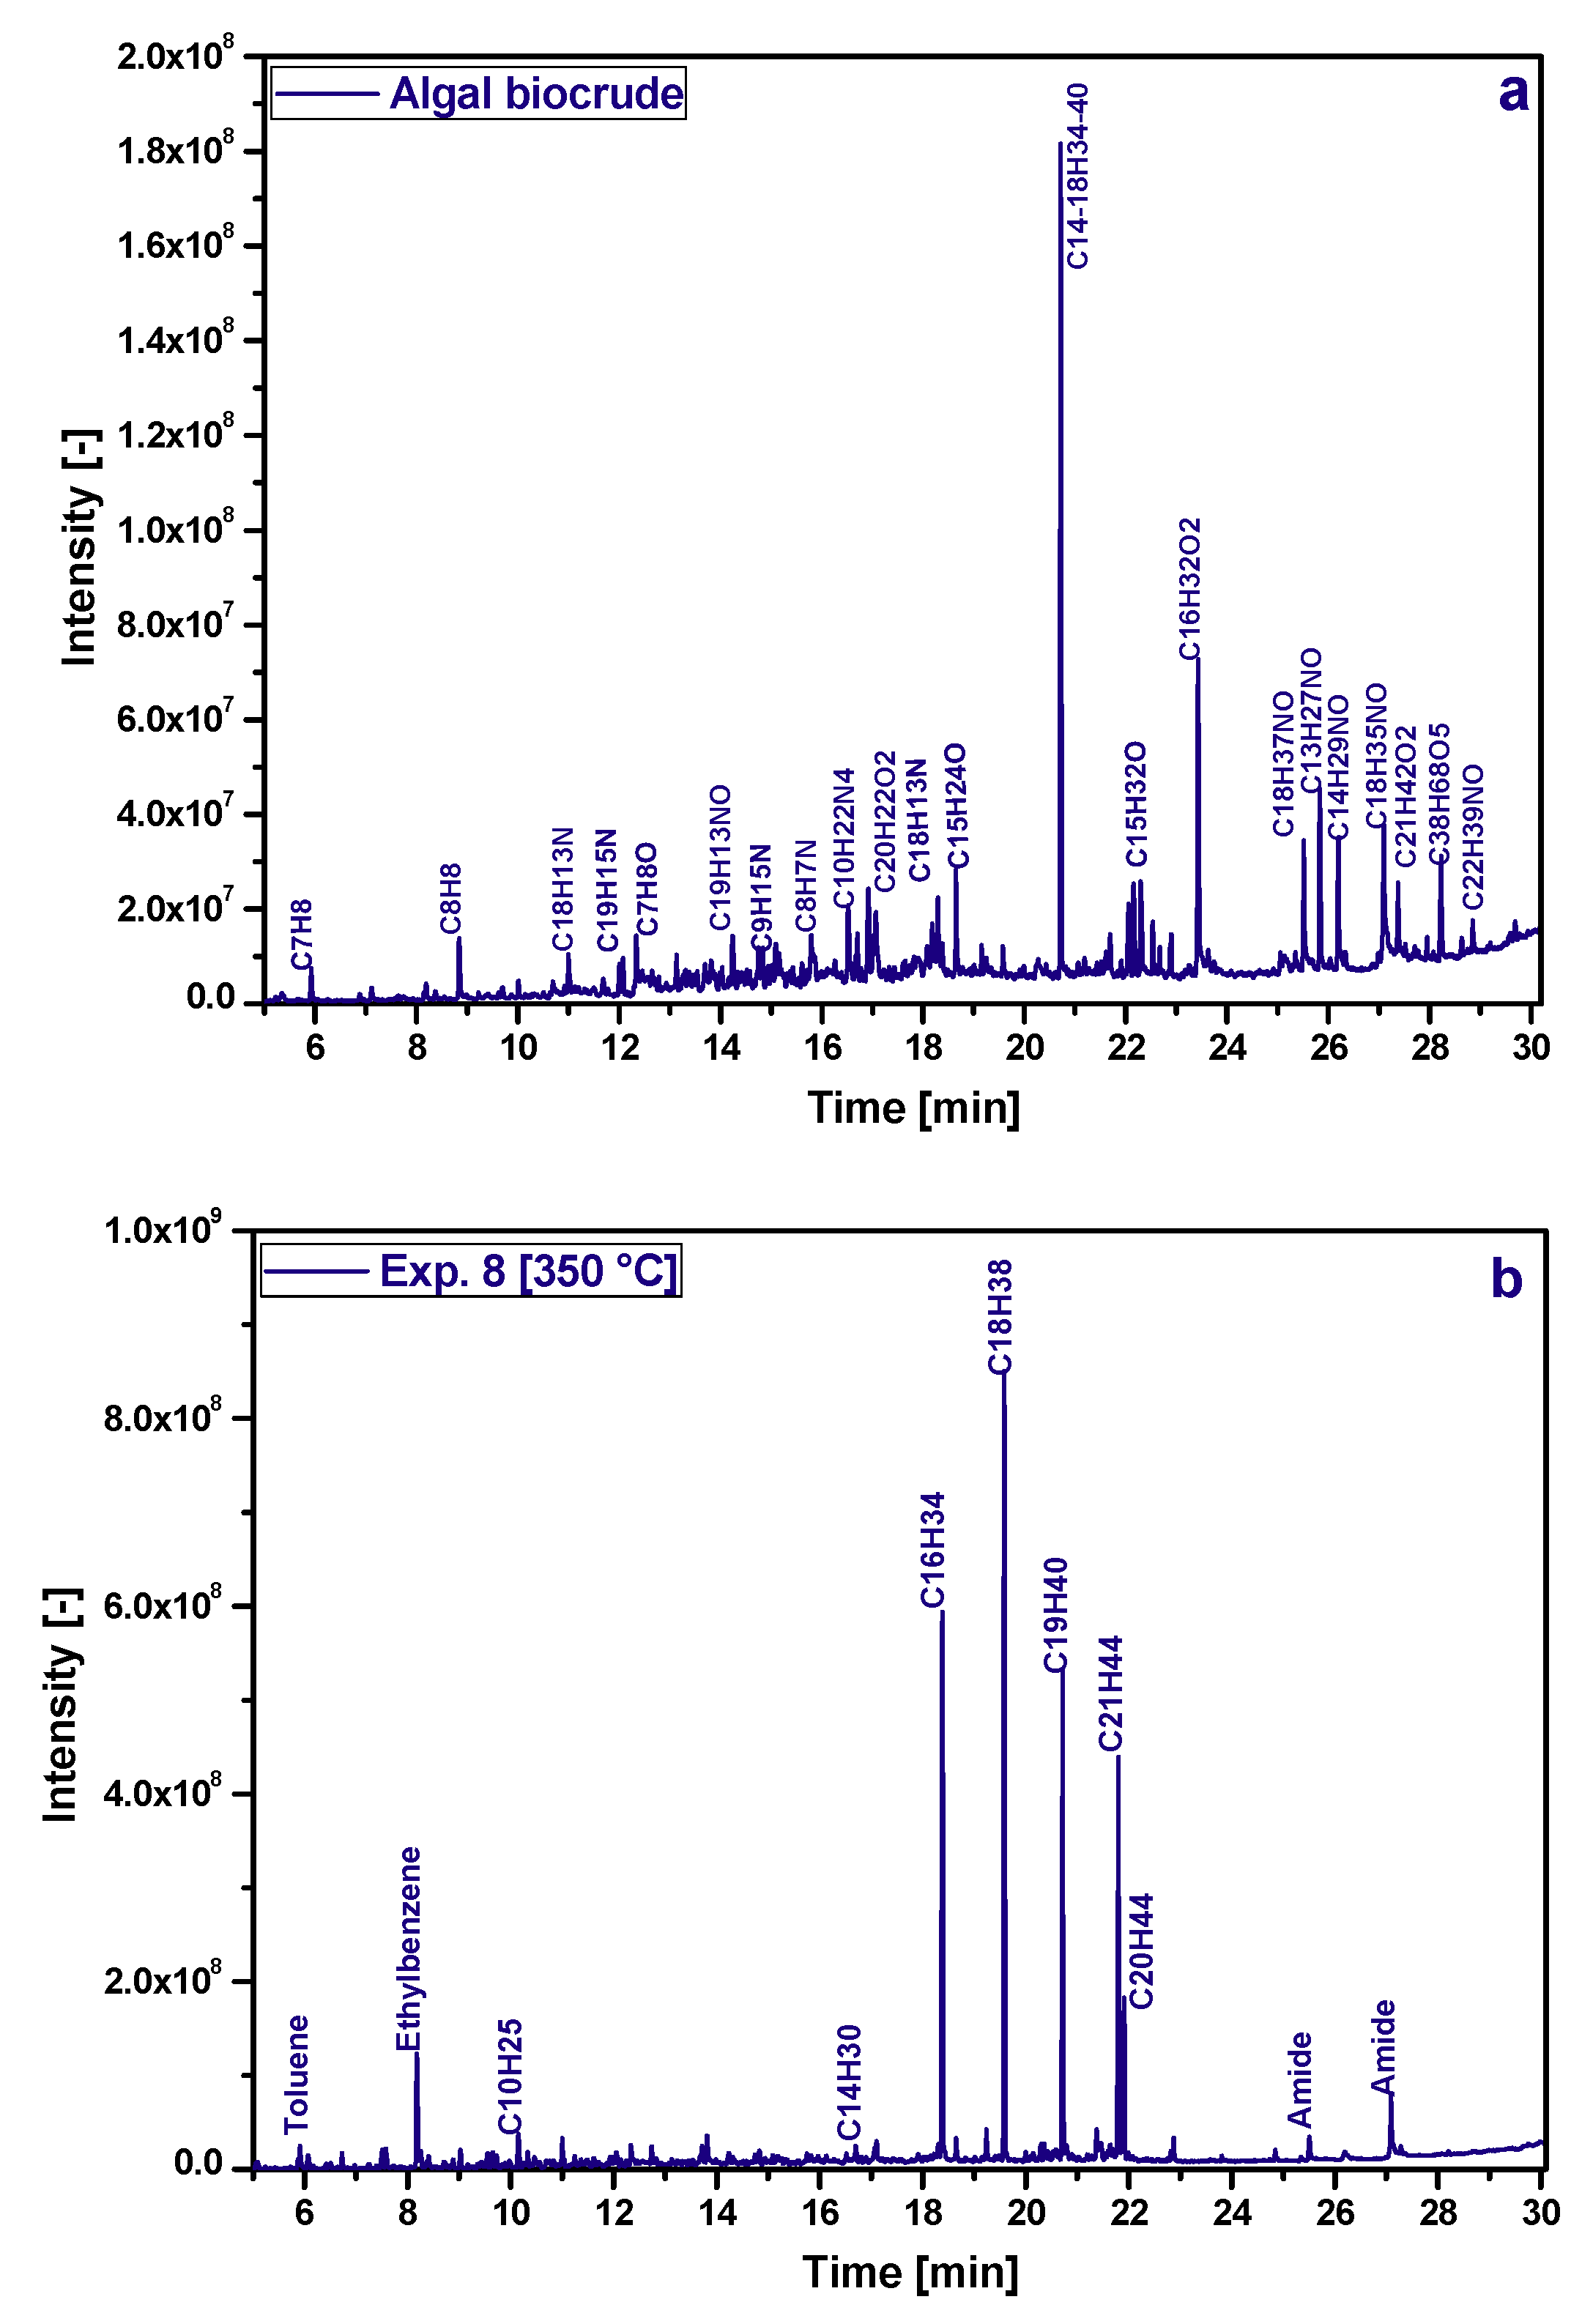
3.2. Analysis of the Up-Graded Oil
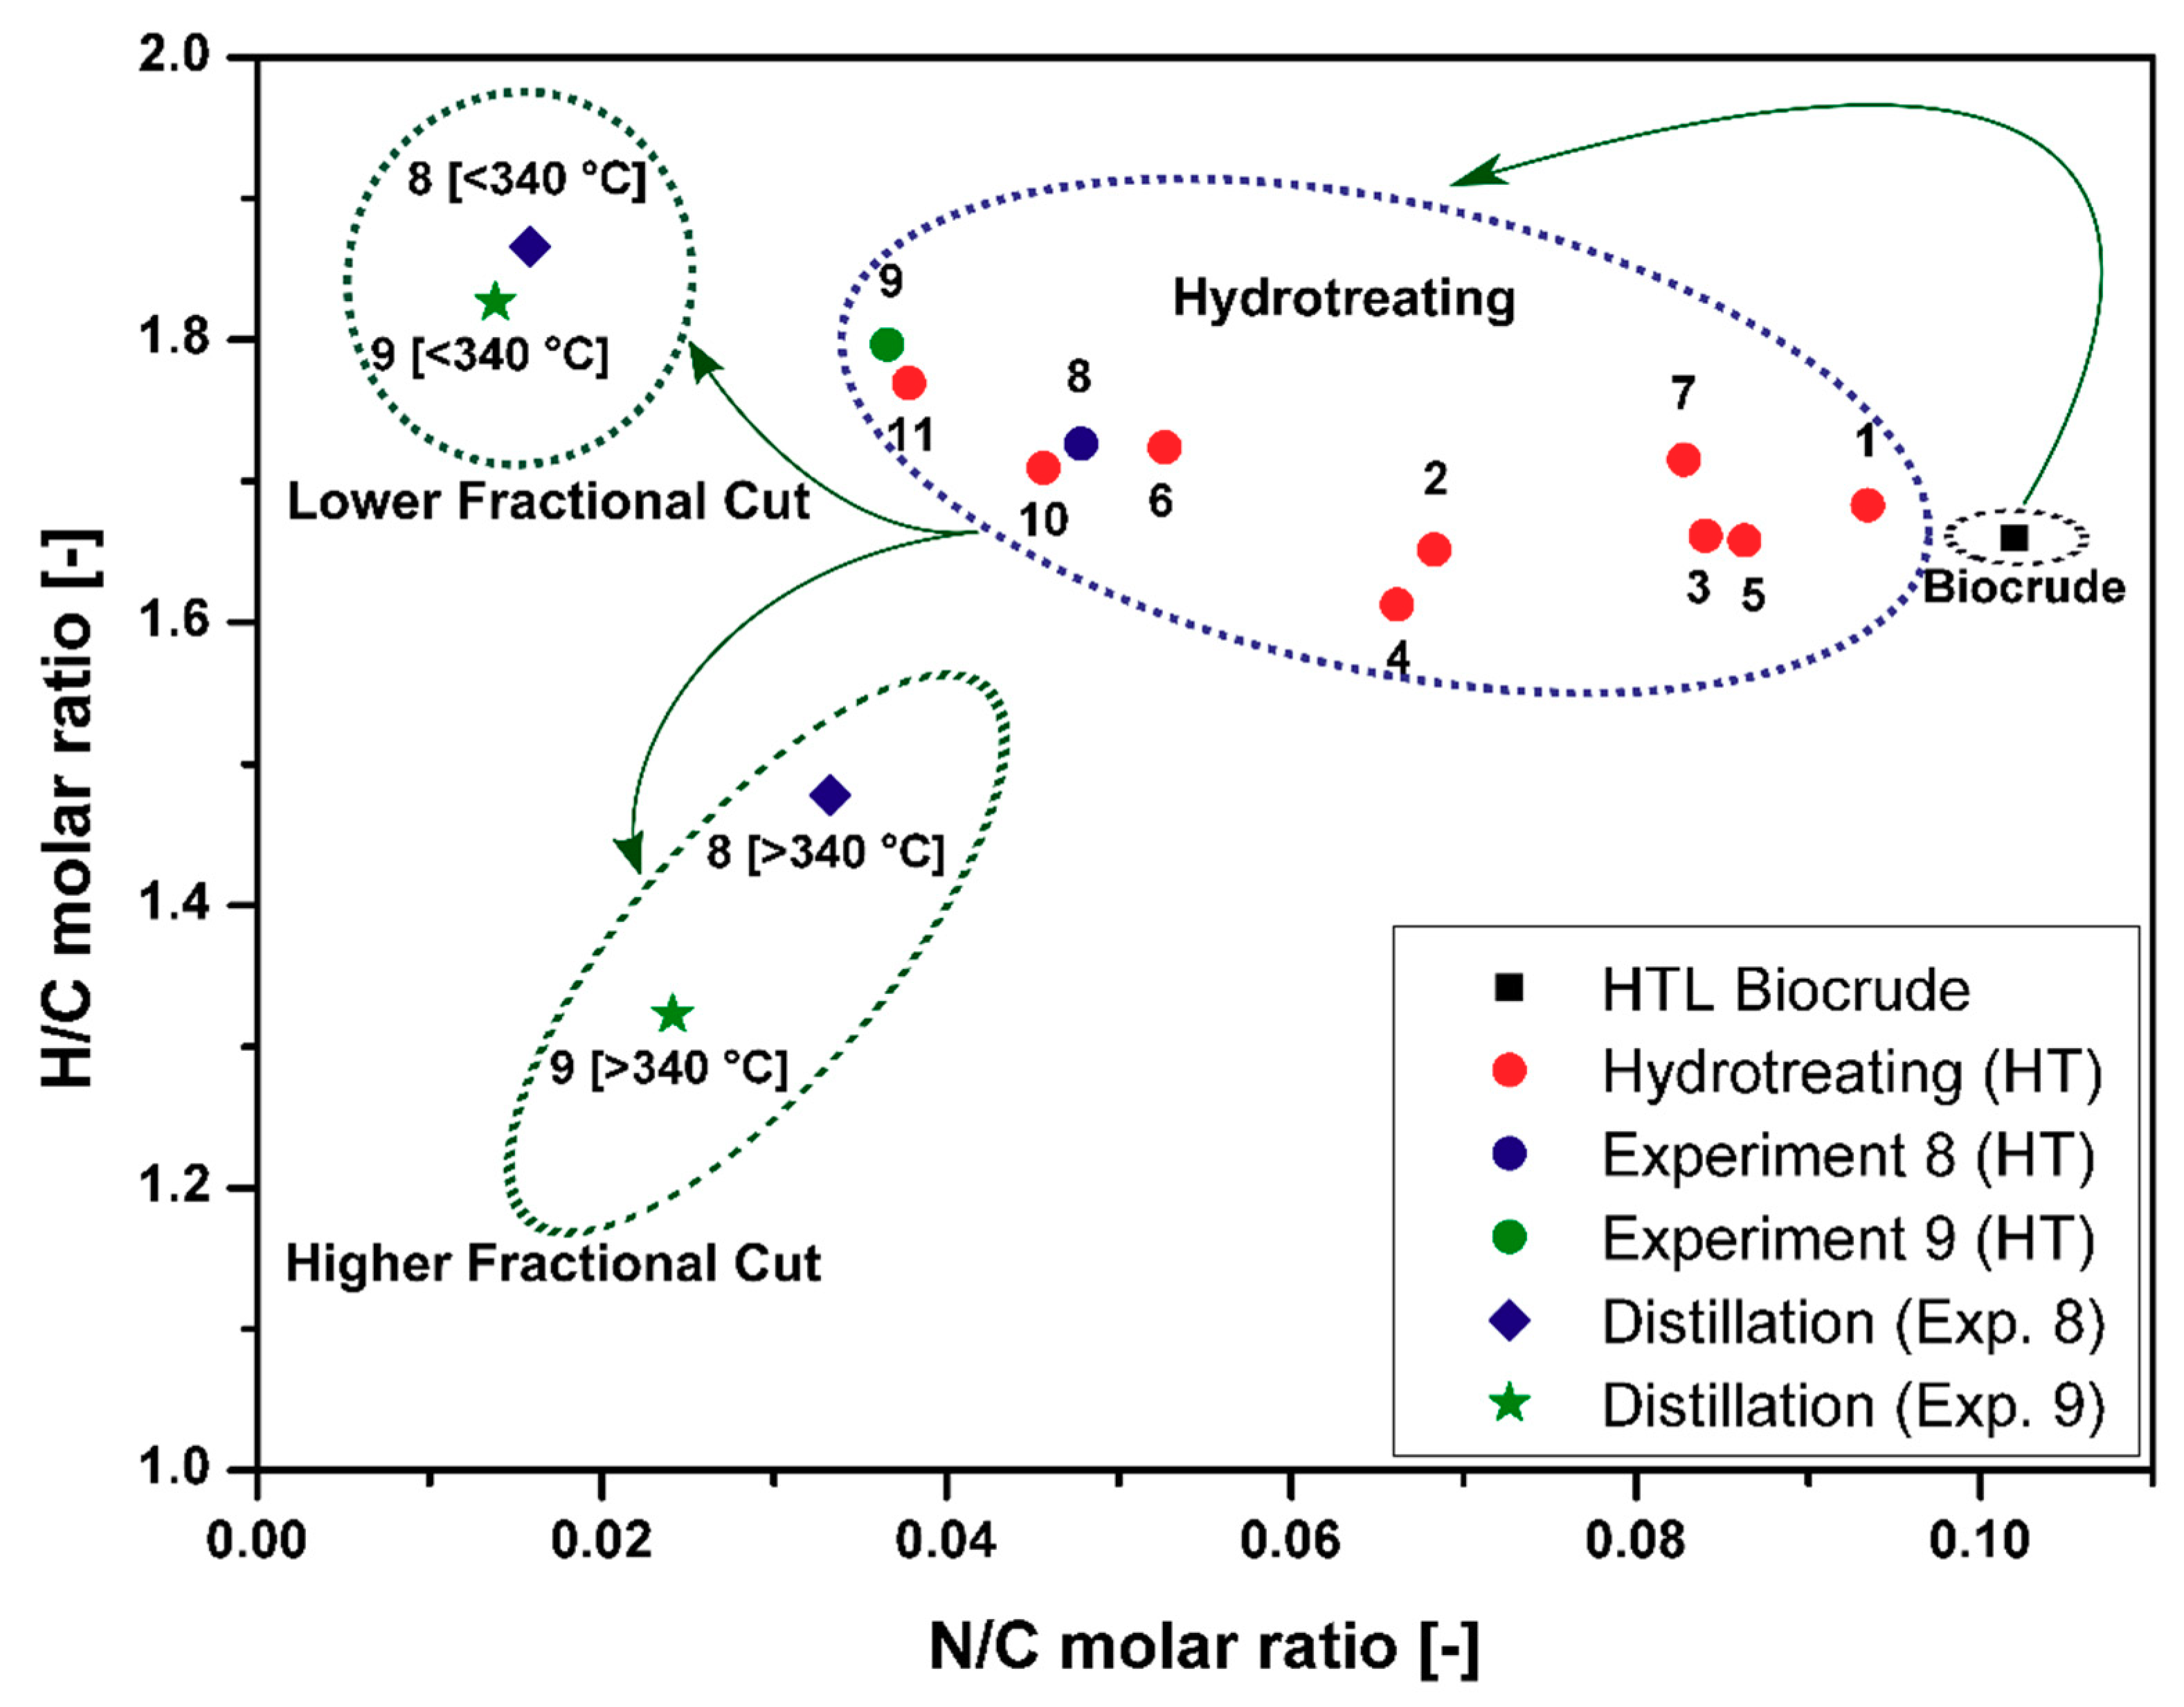
3.3. Distribution of Nitrogen-Containing Compounds
4. Conclusions
Author Contributions
Funding
Conflicts of Interest
References
- World Energy Outlook; International Energy Agency: Paris, France, 2017; Available online: https://webstore.iea.org/world-energy-outlook-2017 (accessed on 14 November 2018).
- Doornbosch, R.; Steenblik, R. Biofuels: Is the Cure Worse Than the Disease? Available online: https://www.oecd.org/sd-roundtable/papersandpublications/39348696.pdf (accessed on 13 July 2018).
- Sims, R.E.H.; Mabee, W.; Saddler, J.N.; Taylor, M. An overview of second generation biofuel technologies. Bioresour. Technol. 2010, 101, 1570–1580. [Google Scholar] [CrossRef] [PubMed]
- Alam, F.; Mobin, S.; Chowdhury, H. Third generation biofuel from Algae. Procedia Eng. 2015, 105, 763–768. [Google Scholar] [CrossRef]
- Chisti, Y. Biodiesel from microalgae. Biotechnol. Adv. 2007, 25, 294–306. [Google Scholar] [CrossRef] [PubMed]
- Molino, A.; Iovine, A.; Casella, P.; Mehariya, S.; Chianese, S.; Cerbone, A.; Rimauro, J.; Musmarra, D. Microalgae Characterization for Consolidated and New Application in Human Food, Animal Feed and Nutraceuticals. Int. J. Environ. Res. Public Health 2018, 15, 2436. [Google Scholar] [CrossRef] [PubMed]
- Biller, P.; Ross, A.B. Potential yields and properties of oil from the hydrothermal liquefaction of microalgae with different biochemical content. Bioresour. Technol. 2011, 102, 215–225. [Google Scholar] [CrossRef] [PubMed]
- Singh, N.K.; Dhar, D.W. Microalgae as second generation biofuel. A review. Agron. Sustain. Dev. 2011, 31, 605–629. [Google Scholar] [CrossRef]
- Pienkos, P.T.; Darzins, A. The promise and challenges of microalgal-derived biofuels. Biofuels Bioprod. Biorefin. 2009, 3, 431–440. [Google Scholar] [CrossRef]
- Peterson, A.A.; Vogel, F.; Lachance, R.P.; Fröling, M.; Michael, J.A.; Tester, J.W. Thermochemical biofuel production in hydrothermal media: A review of sub- and supercritical water technologies. Energy Environ. Sci. 2008, 1, 32–65. [Google Scholar] [CrossRef]
- Toor, S.S.; Rosendahl, L.; Rudolf, A. Hydrothermal liquefaction of biomass: A review of subcritical water technologies. Energy 2011, 36, 2328–2342. [Google Scholar] [CrossRef]
- Ramirez, A.J.; Brown, J.R.; Rainey, J.T. A Review of Hydrothermal Liquefaction Bio-Crude Properties and Prospects for Upgrading to Transportation Fuels. Energies 2015, 8, 6765–6794. [Google Scholar] [CrossRef]
- Frank, E.D.; Elgowainy, A.; Han, J.; Wang, Z. Life cycle comparison of hydrothermal liquefaction and lipid extraction pathways to renewable diesel from algae. Mitig. Adapt. Strateg. Glob. Chang. 2013, 18, 137–158. [Google Scholar] [CrossRef]
- Liu, X.; Saydah, B.; Eranki, P.; Colosi, L.M.; Mitchell, B.G.; Rhodes, J.; Clarens, A.F. Pilot-scale data provide enhanced estimates of the life cycle energy and emissions profile of algae biofuels produced via hydrothermal liquefaction. Bioresour. Technol. 2013, 148, 163–171. [Google Scholar] [CrossRef] [PubMed]
- Jones, S.; Zhu, Y.; Anderson, D.; Hallen, R.; Elliott, D.; Schmidt, A.; Albrecth, K.; Hart, T.; Butcher, M.; Drennan, C.; et al. Process Design and Economics for the Conversion of Algal Biomass to Hydrocarbons: Whole Algae Hydrothermal Liquefaction and Upgrading; Report No. PNNL-23227; Pacific Northest National Laboratory: Richland, WA, USA, 2014. [Google Scholar]
- Pedersen, T.H.; Hansen, N.H.; Pérez, O.M.; Cabezas, D.E.V.; Rosendahl, L.A. Renewable hydrocarbon fuels from hydrothermal liquefaction: A techno-economic analysis. Biofuels Bioprod. Biorefin. 2018, 12, 213–223. [Google Scholar] [CrossRef]
- Anastasakis, K.; Biller, P.; Madsen, R.; Glasius, M.; Johannsen, I.; Anastasakis, K.; Biller, P.; Madsen, R.B.; Glasius, M.; Johannsen, I. Continuous Hydrothermal Liquefaction of Biomass in a Novel Pilot Plant with Heat Recovery and Hydraulic Oscillation. Energies 2018, 11, 2695. [Google Scholar] [CrossRef]
- Jensen, C.U.; Guerrero, J.K.R.; Karatzos, S.; Olofsson, G.; Iversen, S.B. Fundamentals of HydrofactionTM: Renewable crude oil from woody biomass, Biomass Convers. Biorefinery 2017, 7, 495–509. [Google Scholar]
- Duan, P.; Savage, P.E. Hydrothermal Liquefaction of a Microalga with Heterogeneous Catalysts. Ind. Eng. Chem. Res. 2011, 50, 52–61. [Google Scholar] [CrossRef]
- Ross, A.B.; Biller, P.; Kubacki, M.L.; Li, H.; Lea-Langton, A.; Jones, J.M. Hydrothermal processing of microalgae using alkali and organic acids. Fuel 2010, 89, 2234–2243. [Google Scholar] [CrossRef]
- Biller, P.; Sharma, B.K.; Kunwar, B.; Ross, A.B. Hydroprocessing of bio-crude from continuous hydrothermal liquefaction of microalgae. Fuel 2015, 159, 197–205. [Google Scholar] [CrossRef]
- Huber, G.W.; Corma, A. Synergies between bio- and oil refineries for the production of fuels from biomass. Angew. Chem. Int. Ed. Engl. 2007, 46, 7184–7201. [Google Scholar] [CrossRef] [PubMed]
- Bai, X.; Duan, P.; Xu, Y.; Zhang, A.; Savage, P.E. Hydrothermal catalytic processing of pretreated algal oil: A catalyst screening study. Fuel 2014, 120, 141–149. [Google Scholar] [CrossRef]
- Duan, P.; Wang, B.; Xu, Y. Catalytic hydrothermal upgrading of crude bio-oils produced from different thermo-chemical conversion routes of microalgae. Bioresour. Technol. 2015, 186, 58–66. [Google Scholar] [CrossRef] [PubMed]
- Li, Z.; Savage, P.E. Feedstocks for fuels and chemicals from algae: Treatment of crude bio-oil over HZSM-5. Algal Res. 2013, 2, 154–163. [Google Scholar] [CrossRef]
- Elliott, D.C.; Hart, T.R.; Schmidt, A.J.; Neuenschwander, G.G.; Rotness, L.J.; Olarte, M.V.; Zacher, A.H.; Albrecht, K.O.; Hallen, R.T.; Holladay, J.E. Process development for hydrothermal liquefaction of algae feedstocks in a continuous-flow reactor. Algal Res. 2013, 2, 445–454. [Google Scholar] [CrossRef]
- Montgomery, D.C. Design and Analysis of Experiments, 8th ed.; John Wiley Sons: Singapore, 2012. [Google Scholar]
- ASTM International. ASTM D1160, Standard Test Method for Distillation of Petroleum Products at Reduced Pressure; ASTM International: West Conshohocken, PA, USA, 2015. [Google Scholar]
- ASTM International. ASTM D2892, Standard Test Method for Distillation of Crude Petroleum (15- Theoretical Plate Column); ASTM International: West Conshohocken, PA, USA, 2005. [Google Scholar]
- Maxwell, J.B.; Bonnell, L.S. Derivation and Precision of a New Vapor Pressure Correlation for Petroleum Hydrocarbons. Ind. Eng. Chem. 1957, 49, 1187–1196. [Google Scholar] [CrossRef]
- Channiwala, S.A.; Parikh, P.P. A unified correlation for estimating HHV of solid, liquid and gaseous fuels. Fuel 2002, 81, 1051–1063. [Google Scholar] [CrossRef]
- ASTM International. ASTM D7169, Standard Test Method for Boiling Point Distribution of Samples with Residues Such as Crude Oils and Atmospheric and Vacuum Residues by High Temperature Gas Chromatography; ASTM International: West Conshohocken, PA, USA, 2011. [Google Scholar]
- Pedersen, T.H.; Jensen, C.U.; Sandström, L.; Rosendahl, L.A. Full characterization of compounds obtained from fractional distillation and upgrading of a HTL biocrude. Appl. Energy 2017, 202, 408–419. [Google Scholar] [CrossRef]


| Materials | Elemental Composition (wt. %) | HHV (MJ/kg) | Ash Content (wt. %) | Water Content (wt. %) | ||||
|---|---|---|---|---|---|---|---|---|
| C | H | N | S | O | ||||
| Spirulina | 53.5 | 7.2 | 12.6 | - | 26.6 | 24.0 | 5.8 | 6.4 |
| Biocrude | 78.1 | 10.4 | 8.0 | - | 3.5 | 38.0 | 0.2 | 3.8 |
| Factor | Name | Unit | Low Level (−) | High Level (+) |
|---|---|---|---|---|
| A | Temperature | °C | 250 | 350 |
| B | H2 pressure | bar | 40 | 80 |
| C | Residence time | h | 2 | 4 |
| Exp. | Factor A Temperature | Factor B Initial H2 Pressure | Factor C Reaction Time |
|---|---|---|---|
| 1 | 250 (−) | 40 (−) | 2 (−) |
| 2 | 350 (+) | 40 (−) | 2 (−) |
| 3 | 250 (−) | 40 (−) | 4 (+) |
| 4 | 350 (+) | 40 (−) | 4 (+) |
| 5 | 250 (−) | 80 (+) | 2 (−) |
| 6 | 350 (+) | 80 (+) | 2 (−) |
| 7 | 250 (−) | 80 (+) | 4 (+) |
| 8 | 350 (+) | 80 (+) | 4 (+) |
| 9 | 375 (+) | 70 (+) | 3 (+) |
| 10 | 400 (+) | 65 (+) | 2.5 (+) |
| 11 | 400 (+) | 70 (+) | 2 (−) |
| Exp. | C | H | N | O | de-O [%] | de-N [%] | H2 Consumption [kg H2/kg feed] | H/C [-] | HHV [MJ/kg] |
|---|---|---|---|---|---|---|---|---|---|
| Biocrude | 75.01 ± 0.31 | 10.40 ± 0.09 | 7.65 ± 0.10 | 6.94 ± 0.12 | - | - | - | 1.66 ± 0.02 | 37.59 ± 0.20 |
| 1 | 76.94 ± 0.49 | 10.79 ± 0.10 | 7.19 ± 0.05 | 5.11 ± 0.61 | 26 | 6 | 0.0025 ± 0.0002 | 1.68 ± 0.01 | 38.93 ± 0.21 |
| 2 | 81.24 ± 0.12 | 11.18 ± 0.03 | 5.55 ± 0.04 | 1.95 ± 0.11 | 72 | 27 | 0.0060 ± 0.0001 | 1.65 ± 0.00 | 41.24 ± 0.06 |
| 3 | 77.72 ± 0.10 | 10.76 ± 0.05 | 6.53 ± 0.05 | 5.00 ± 0.20 | 28 | 15 | 0.0033 ± 0.0005 | 1.66 ± 0.01 | 39.18 ± 0.07 |
| 4 | 82.24 ± 0.22 | 11.05 ± 0.08 | 5.44 ± 0.04 | 1.28 ± 0.35 | 82 | 29 | 0.0058 ± 0.0008 | 1.61 ± 0.01 | 41.51 ± 0.14 |
| 5 | 77.16 ± 0.19 | 10.66 ± 0.02 | 6.66 ± 0.50 | 5.53 ± 0.69 | 24 | 10 | 0.0033 ± 0.0002 | 1.66 ± 0.01 | 37.59 ± 0.04 |
| 6 | 82.62 ± 0.17 | 11.87 ± 0.04 | 4.35 ± 0.12 | 1.17 ± 0.09 | 83 | 43 | 0.0108 ± 0.0001 | 1.72 ± 0.00 | 42.64 ± 0.09 |
| 7 | 76.82 ± 0.03 | 10.98 ± 0.03 | 6.36 ± 0.03 | 6.13 ± 0.03 | 12 | 17 | 0.0045 ± 0.0003 | 1.67 ± 0.00 | 38.68 ± 0.04 |
| 8 | 84.31 ± 0.35 | 12.13 ± 0.06 | 4.03 ± 0.17 | 0.00 ± 0.23 | 100 | 47 | 0.0125 ± 0.0002 | 1.73 ± 0.00 | 43.70 ± 0.16 |
| 9 | 84.55 ± 0.16 | 12.66 ± 0.10 | 3.09 ± 0.05 | 0.00 ± 0.01 | 100 | 60 | 0.0103 ± 0.0001 | 1.80 ± 0.00 | 44.38 ± 0.17 |
| 10 | 84.17 ± 0.02 | 11.99 ± 0.05 | 3.84 ± 0.11 | 0.00 ± 0.04 | 100 | 50 | 0.0080 ± 0.0002 | 1.71 ± 0.00 | 43.45 ± 0.06 |
| 11 | 84.37 ± 0.11 | 12.44 ± 0.02 | 3.19 ± 0.04 | 0.00 ± 0.01 | 100 | 58 | 0.0093 ± 0.0002 | 1.77 ± 0.00 | 44.05 ± 0.06 |
| Effect | Factor A | Factor B | Factor C | Factor AB | Factor AC | Factor BC | Factor ABC |
|---|---|---|---|---|---|---|---|
| Effect R1 [%] | 64.24 | 3.51 | 6.50 | 14.63 | 10.06 | 0.88 | 6.03 |
| Effect R2 [%] | 24.07 | 10.80 | 4.53 | 6.29 | −1.75 | −0.51 | 1.85 |
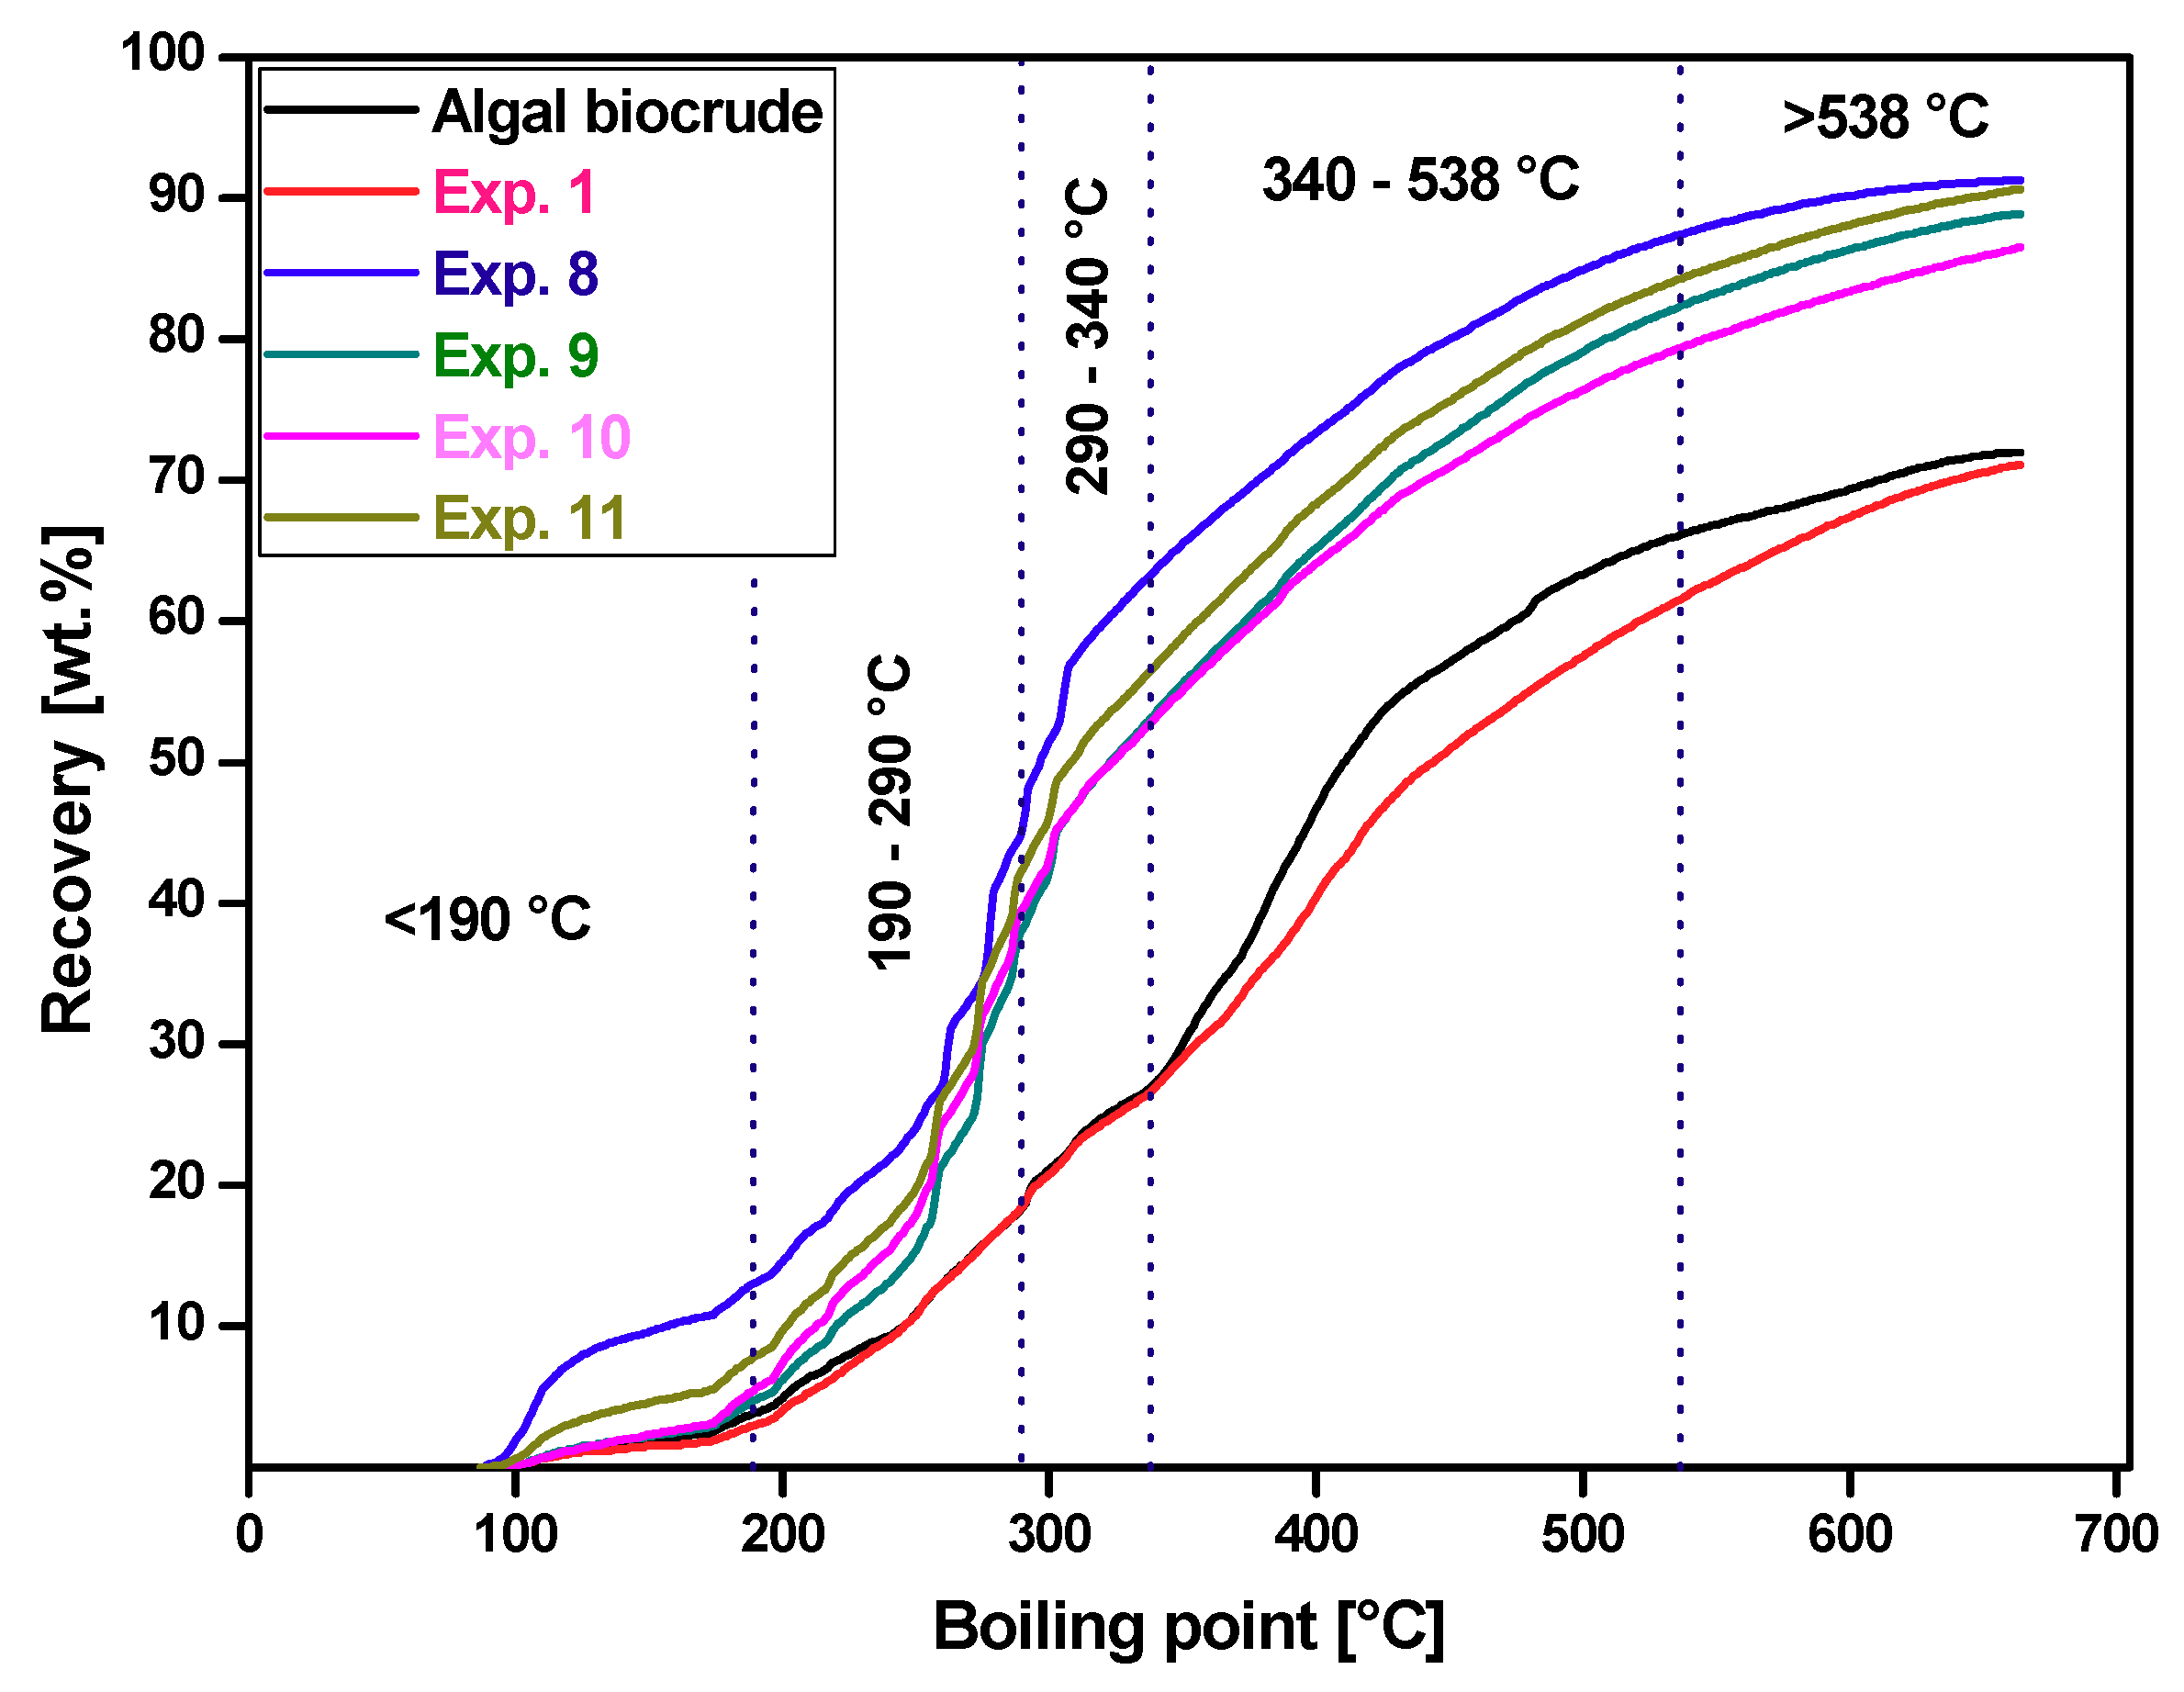
| Fractional Cuts | Boiling Point Range | Composition [wt. %] | |||||
|---|---|---|---|---|---|---|---|
| Biocrude | Exp. 1 | Exp. 8 | Exp. 9 | Exp. 10 | Exp. 11 | ||
| Gasoline | <190 °C | 3.9 | 3 | 13.1 | 4.8 | 5.6 | 7.9 |
| Jet fuel | 190–290 °C | 14.5 | 15.5 | 32.2 | 33.4 | 34 | 34.5 |
| Diesel | 290–340 °C | 8.9 | 8.5 | 18.4 | 15.3 | 13.6 | 14.5 |
| Vacuum gas oil | 340–538 °C | 38.9 | 34.7 | 23.8 | 29 | 26.3 | 27.5 |
| Vacuum residue | >538 °C | 33.8 | 38.3 | 12.5 | 17.5 | 20.5 | 15.6 |
| Exp. | Light Fraction (<340 °C) | Heavy Fraction (>340 °C) | ||||||||
|---|---|---|---|---|---|---|---|---|---|---|
| Yield [wt. %] | N [wt. %] | O [wt. %] | H/C [-] | N/C [-] | Yield [wt. %] | N [wt. %] | O [wt. %] | H/C [-] | N/C [-] | |
| 8 | 52 | 1.30 | 0 | 1.86 | 0.02 | 35 | 2.73 | 0.08 | 1.48 | 0.03 |
| 9 | 29 | 1.15 | 0 | 1.82 | 1.32 | 47 | 1.95 | 0.24 | 1.32 | 0.02 |
© 2018 by the authors. Licensee MDPI, Basel, Switzerland. This article is an open access article distributed under the terms and conditions of the Creative Commons Attribution (CC BY) license (http://creativecommons.org/licenses/by/4.0/).
Share and Cite
Haider, M.S.; Castello, D.; Michalski, K.M.; Pedersen, T.H.; Rosendahl, L.A. Catalytic Hydrotreatment of Microalgae Biocrude from Continuous Hydrothermal Liquefaction: Heteroatom Removal and Their Distribution in Distillation Cuts. Energies 2018, 11, 3360. https://doi.org/10.3390/en11123360
Haider MS, Castello D, Michalski KM, Pedersen TH, Rosendahl LA. Catalytic Hydrotreatment of Microalgae Biocrude from Continuous Hydrothermal Liquefaction: Heteroatom Removal and Their Distribution in Distillation Cuts. Energies. 2018; 11(12):3360. https://doi.org/10.3390/en11123360
Chicago/Turabian StyleHaider, Muhammad Salman, Daniele Castello, Karol Michal Michalski, Thomas Helmer Pedersen, and Lasse Aistrup Rosendahl. 2018. "Catalytic Hydrotreatment of Microalgae Biocrude from Continuous Hydrothermal Liquefaction: Heteroatom Removal and Their Distribution in Distillation Cuts" Energies 11, no. 12: 3360. https://doi.org/10.3390/en11123360
APA StyleHaider, M. S., Castello, D., Michalski, K. M., Pedersen, T. H., & Rosendahl, L. A. (2018). Catalytic Hydrotreatment of Microalgae Biocrude from Continuous Hydrothermal Liquefaction: Heteroatom Removal and Their Distribution in Distillation Cuts. Energies, 11(12), 3360. https://doi.org/10.3390/en11123360