Article

Numerical Assessment of the Influences of Gas Pressure on Coal Burst Liability

Department of Mining Engineering, Colorado School of Mines, Golden, CO 80401, USA
*
Author to whom correspondence should be addressed.
Energies 2018, 11(2), 260; https://doi.org/10.3390/en11020260
Submission received: 21 December 2017 / Revised: 8 January 2018 / Accepted: 11 January 2018 / Published: 23 January 2018

Abstract

:
When coal mines exploit deep seams with high-gas content, risks are encountered due to the additional high likelihood of rock bursting potential problems. The bursts of coal pillars usually lead to severe fatalities, injuries, and destruction of property, including impeding access to active mine workings underground. The danger exists given that conditions in the already highly brittle coal material can be exacerbated by high stress and high gas pressure conditions. It is thus critical to develop methods that improve current understanding about bursting liability, and techniques to forecast or prevent coal bursting in underground coal mines. This study uses field data from a deep coal mine, and numerical modeling to investigate the effects of gas pressure and mechanical compressive stresses on coal bursting liability in high gas content coal seams. The bursting energy index is adopted to determine the coal bursting liability under high gas pressure conditions. The adopted methodology uses a two-staged approach comprising investigating the influence of gas pressure on the bursting liability of coal pillar, and the influence of the gas pressure on the resulting pillar failure mode. Based on numerical simulations of coal pillars, correlations are observed between the magnitudes of gas pressures and the bursting energy index. Irrespective of pillar size, failure time is shortest when the gas pressure achieves a threshold value between 50 kPa to 70 kPa. At 50 kPa, the value of the BEI increases by 50% going from the 4 m pillar to the 6 m pillar. The value of the BEI increases by 43% going from the 6 m high pillar to the 8 m high pillar at 50 kPa. When pillars fail there is a degree of stress relief leading to a reduction in bursting liability. The results suggest that before 50 kPa, pillar failure is largely due to mechanical loading. After 50 kPa, pillar failure is largely due to excessive gas pressures.

1. Introduction

Rockburst is a dynamic phenomenon that is caused by the release of stored energy in coal and hard rock masses. Coal burst in an underground coal mine is mainly expressed in the form of sudden coal pillar yield, instantaneous vibration, and causes massive destruction of macroscopic characteristics [1,2,3,4]. It has been a long-term objective of the mining community to pursue safety, while maintaining high productivity and efficiency. However, coal mining remains a high-risk undertaking, and among all the possible factors that may cause fatalities and injuries, coal burst has been considered as one of the most catastrophic events in an underground coal mine. For example, a coal burst event that occurred at Muchenjian coal mine near Beijing led to roadway damage with a maximum length 600 m [5].
When considering most types of accidents in underground coal mining, the design of coal pillars to avoid pillar bursting and failure has become one of the most challenging engineering problems for the deep underground coal mine. For coal pillar bursting liability, there are several mechanical and physical factors that can affect it. Coal is an unusual porous material, which has fissures, low intensity strength, heterogeneous texture, and permeability distinguishing it from regular porous materials [6,7]. Gas within the coal seam can strongly affect coal strength, deformation, and fracture propagation, and other mechanical properties [8,9,10]. In underground coal mines, gas is stored in a coal seam mainly in absorbed form or free state. When compared with absorbed gas contained within a coal seam, the free gas stored in microcracks, and other void spaces of the coal can further enhance coal bursting liability.
Coal burst can be framed as a dynamic energy release rock failure form with two main energy sources: in-situ gas pressure and stress imposed by the overburden. According to this definition, coal burst can mainly be divided into two classes, stress-driven coal burst and gas-driven coal burst [11]. Most previous studies mainly focus on the coal burst mechanism or coal busting liability under uniaxial compress stress conditions [5,11]. However, based on some historical cases [12,13], it is clear that gas within the coal seam is also a key factor leading to coal burst in underground coal mines, as discussed above. Gas pressure can affect the pillar strength by the initiation and propagation of microcracks within the coal pillar.
According to bursting liability theory, the mechanisms of rock burst exhibit differences even under the same condition [4,12]. To evaluate the rock burst liability properly, the so-called bursting liability indicators are employed. The use of a bursting indicator is a good way to evaluate the coal bursting potential, including elastic strain energy index (WET), bursting energy index (KE), uniaxial compressive strength (Rc), the Bursting Efficiency Ratio ( η ), the Rheologic Ratio ( θ ), Failure Duration Index (Dt), and the Bursting Energy Index (BEI), (WCF) [8,13,14,15,16,17,18,19].
With appropriate and correct usage, bursting indices can provide us a method to evaluate the coal bursting liability. In this paper, the relationship between the coal bursting indicators and gas pressure will be investigated and explained in a quantitative manner. The result is important for predicting and monitoring coal bursting potential and gas drainage effects of the coal bursting potential.
It is extremely challenging to test coal bursts in-situ or in laboratory, including the high safety risks that are involved. To date, there are no studies available—to the knowledge of the authors—with clear video evidence showing directly an entire coal burst process in an underground coal mine. Therefore, to describe the relationships between gas pressure and coal burst, the coal burst properties are typically obtained using back-analysis method [20]. In addition, other methods, such as numerical simulation, can be applied to investigate coal pillar behavior under high-pressure gas condition, resulting in coal burst phenomenon [21,22].
This study uses FLAC 3D to study the coal bursting liability under varieties gas pressures and uniaxial compressive stresses. Two components of the research conducted comprise investigating the influence of gas pressure on the bursting liability of coal pillar, and the influence of the gas pressure on the pillar failure mode. The layout of the paper is as follows: in Section 2, mechanisms of gas pressure effects and several bursting liability indices will be reviewed to select a governing index of this study. In Section 3, numerical modeling and calibration of the relative parameters conducted is discussed; and, in Section 4, numerical results, including the relationship between gas pressure and the BEI, are presented. In Section 5, the preliminary analysis of the pillar failure mode is described, and the phenomenon of this test are discussed. Finally, Section 6 presents the conclusions of this study and provides some recommendations for future studies.

2. Empirical Study of Gas Pressure Effects on Coal Burst Liability

2.1. Mechanism of Gas Pressure Effect on Coal Burst Liability

Several previous studies have been conducted to analyze coal burst mechanism characterization, leading to theories proposed relating to pillar strength, pillar stability, roof and floor stiffness, and energy [23,24,25,26]. As a result of the previous studies, energy release, stress concentration, and seismic activity are now routinely applied to forecast rock burst potential. The released energy framework consists of several conceptual subsets, including gravitational potential energy, elastic potential energy, and strain energy.
This paper mainly focusses on the released energy approach, based on previous observations, which indicate that the energy release can be associated with crack initiation and propagation within a coal body [20]. In addition, Lan et al. (2010) conducted research on the energy mechanism of underground coal bursts showing that high gas pressure can cause gas expansion energy and the residual energy can increase [27].

2.2. Selection of Coal Bursting Liability Indices of Coal Pillar

Bursting liability is an inherent property of coal and relates to geological conditions, gas pressure, and other properties. Using bursting indices is a useful method to determine the bursting liability.
Li et al. developed a coal burst energy evaluation model by analyzing the coal burst events during 1960 to 2010 in China [28]. The gas expansion energy which was caused by the high gas pressure was mainly dissipated in fractures and crack propagation within coal pillar, and the resulting empirical gas expansion energy (E) formula, could be expressed by Equation (1)
E = 0.4 V ( 1.585 P 0.2 1 )
where, V represents the gas volume within the coal pillar and P is the gas pressure inside the coal pillar. From Equation (1), it is clear that with the increase of gas volume and gas pressure, the gas expansion energy will also increase.
In laboratory tests, there are mainly four indices employed, including the duration of DT, WET, KE, and RC, based on Chinese national standards “Classification and laboratory test method on bursting liability of coal” [29].
DT represents the period of the coal sample drop from the peak stress to its failure in the complete strain-stress curve.
WET is the ratio of the elastic deformation energy to the dissipation deformation energy.
W E T = ε 1 ε 2 σ u   d ε 0 ε 1 σ l   d ε ε 1 ε 2 σ u   d ε
KE, is the ratio of the pre-peak energy to the post-peak dissipated energy.
K E = 0 ε 3 σ l   d ε ε 3 ε 4 σ l   d ε
In Equations (2) and (3), σ l and σ u are the loading stress and unloading stress. The parameters ε 1 ,   ε 2 ,   ε 3   and   ε 4   represent strain values in the state of complete unload, at an unloading point, at peak load and at complete failure, respectively.
Yaodong (2011) et al. applied the BEI, (WCF) to analyze the bursting liability when studying the influence of roadway backfill on bursting liability and strength of coal pillar through numerical investigation [30].
W C F = W e + W p W f
In Equation (4), W f represents the energy dissipated during the failure process, W e   and   W p represent the elastic strain and plastic strain energy respectively, during the loading process (Figure 1).
Numerical simulation methods facilitate a means to monitor the coal bursting process and mechanisms, allowing for parametric investigations during an entire test process. When considering the bursting indices discussed in the preceding sections, the BEI is found to be the most suitable one in this paper. Using the BEI, not only helps to determine the bursting liability when pillars have different sizes and gas pressures, but also helps to calculate the energy dissipated during the process of failure, and also helps to evaluate the bursting severity according to the dissipated energy. In addition, the BEI is easily obtained from the complete strain-stress curve (including the pre- and post-failure curve) from uniaxial compressive stress tests.

3. Numerical Model and Determination of Parameters

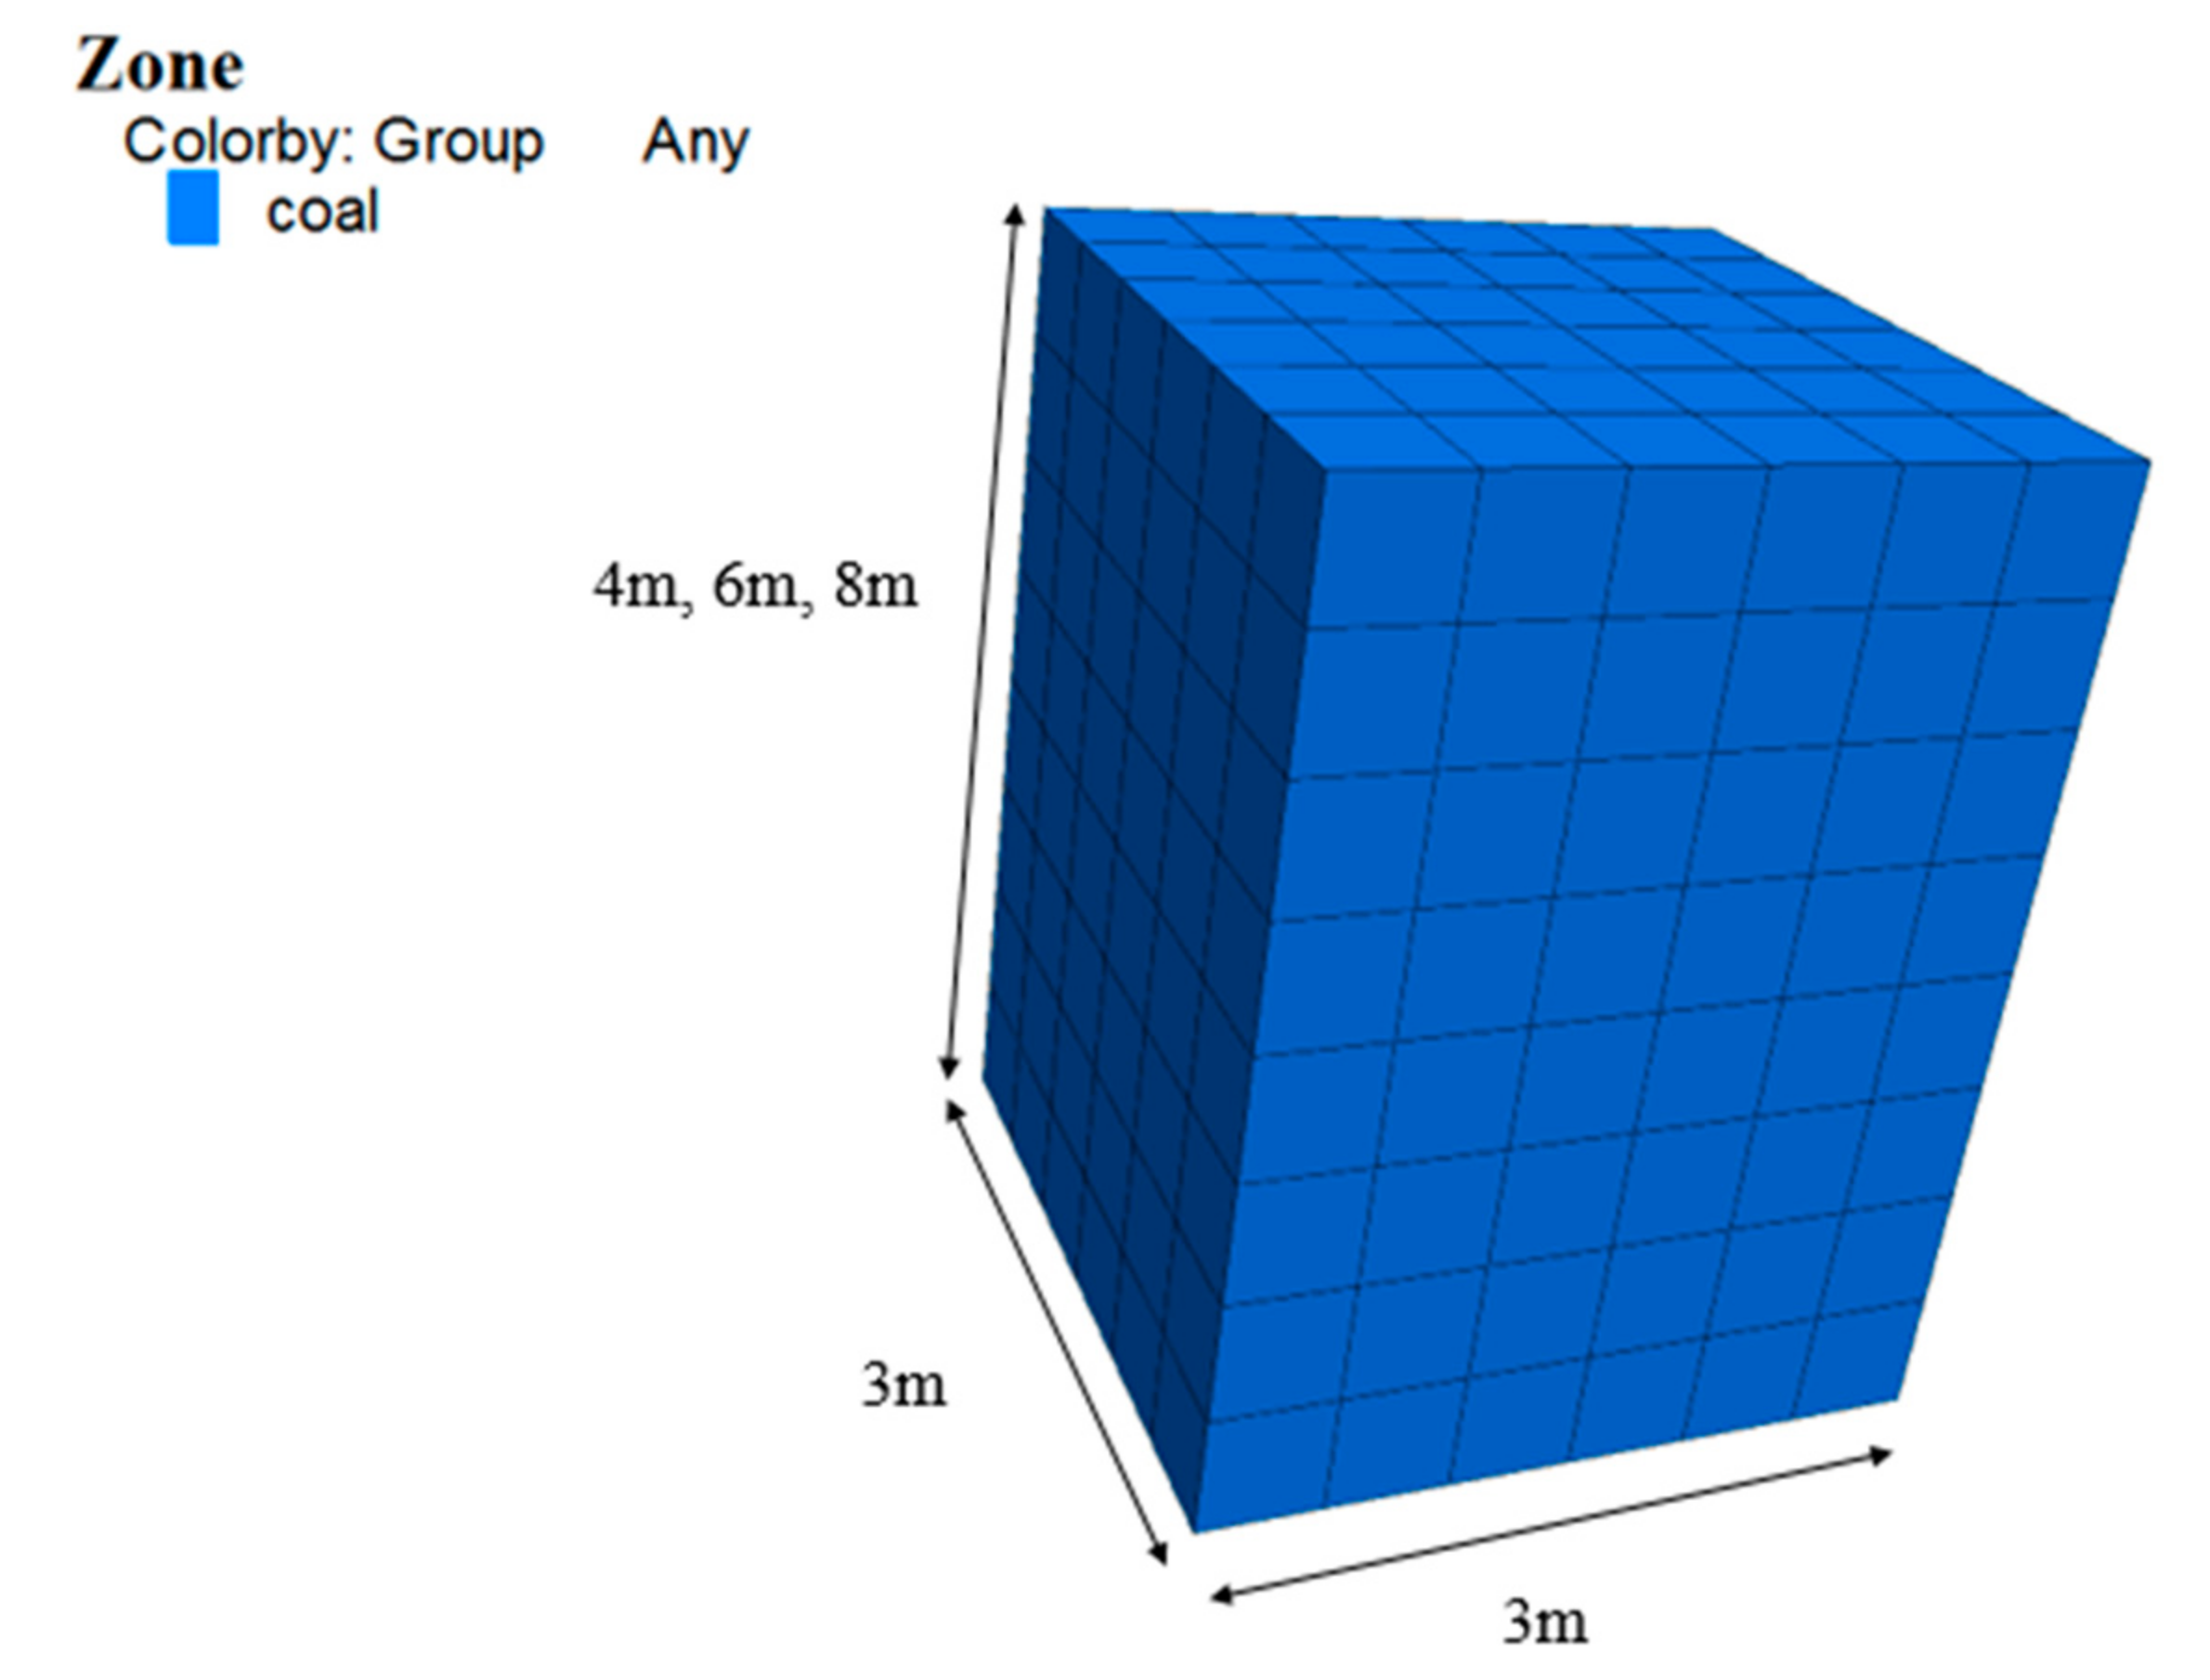
3.1. Numerical Model and Failure Criterion

The finite difference code, FLAC 3D (Fast Lagrangian Analysis of Continua in Three-Dimensions) was employed to simulate the influence of free gas pressure on the coal pillar burst liability at the Tianan No. 1 Coal mine, which located in Ping Dingshan, Henan province, China. Tianan mine is defined as a high gas concentration coal mine, and therefore provides a suitable investigation target. The pillar model analyzed herein is a typical coal pillar in underground coal mines, implying that it can extend in both axis directions of the plan section view. Based on this assumption, only a quarter of the pillar needs to be modeled instead of the entire pillar model, to save the running time of the simulations. Figure 2 shows the FLAC3D model mesh for a quarter of a mine pillar. The element size of the model was always maintained at 0.5 m × 0.5 m × 0.5 m. For consistent comparisons of each simulation result, all of the numerical models ran at 15,000 time steps.
The failure criterion which was employed in the model is the strain softening model, which is based on the FLAC 3D Mohr-Coulomb model with non-associated shear and associated tension flow rules [30]. The cohesion and friction angle were allowed to decrease as the strain softening developed, by a user-defined linear function. Further details of the strain softening behavior are discussed in Section 5.2.

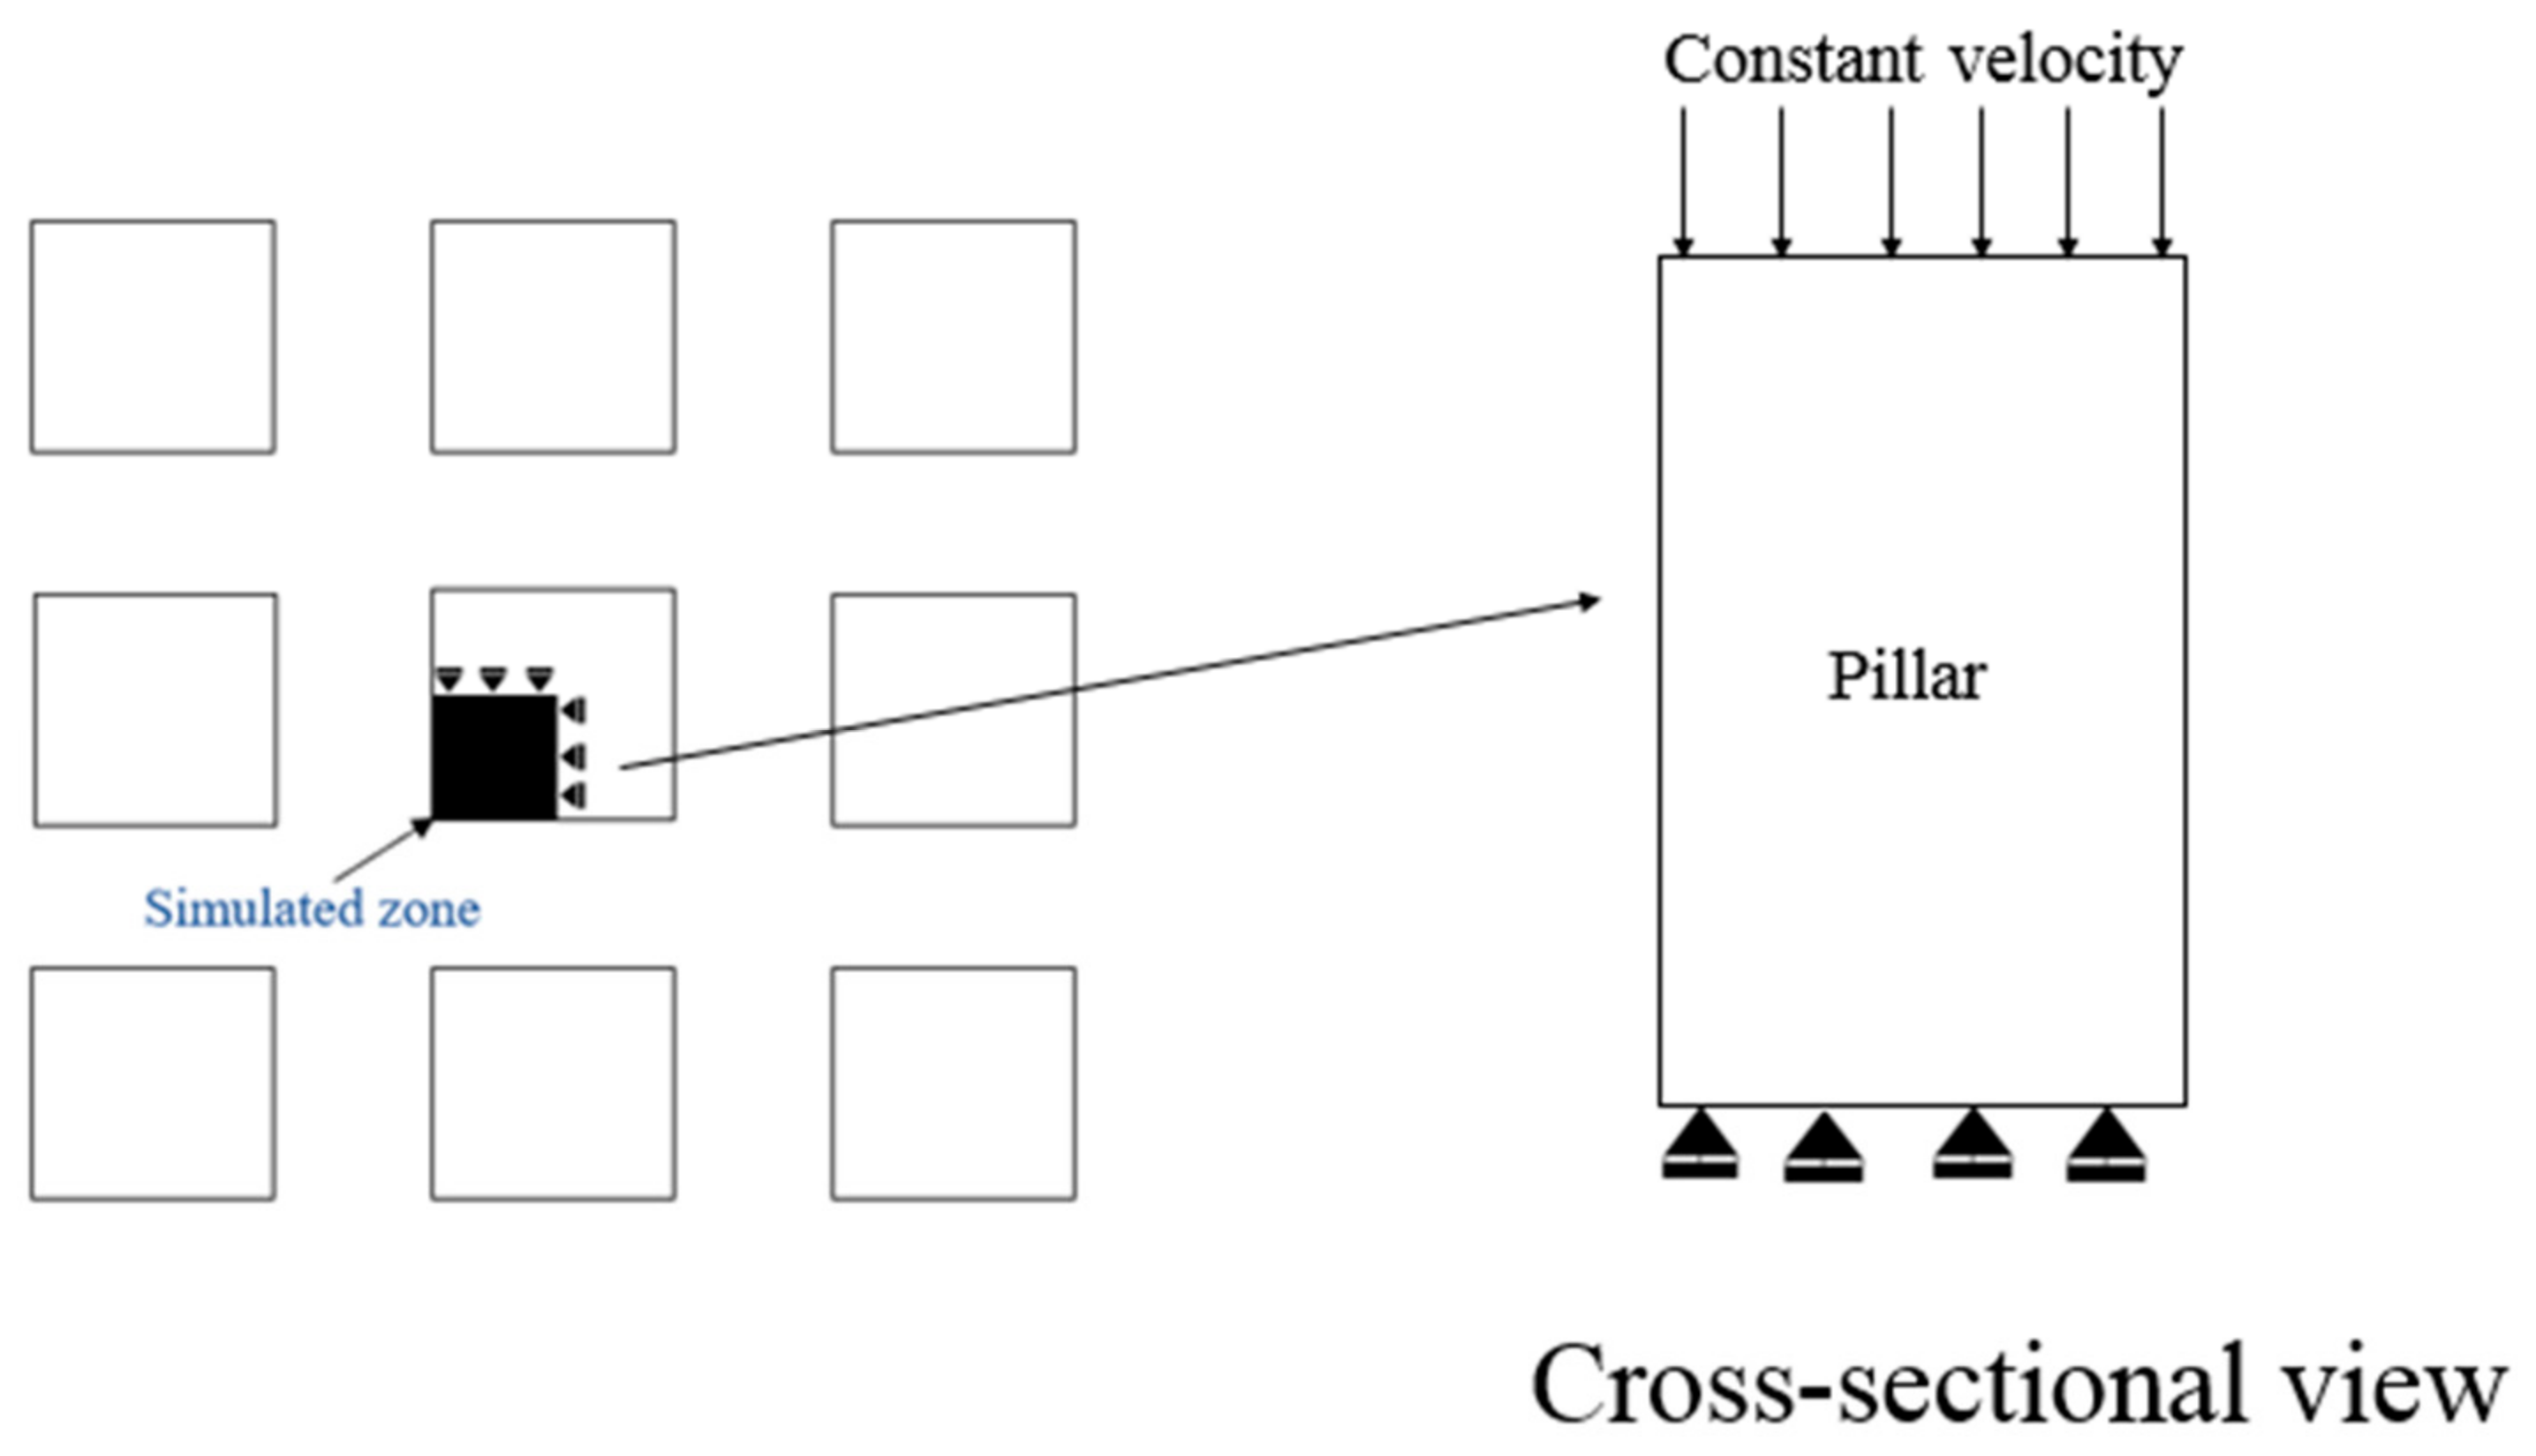
3.2. Boundary Conditions of Numerical Model

The objective of the numerical modeling study was to evaluate underground coal pillar bursting liability. To obtain the coal pillar coal burst liability, reasonable boundary conditions needed to be applied in the numerical model, and the selected boundary conditions are indicated in Figure 3. Since the model represents the quarter of a coal pillar with symmetry, zero displacements were set at the base of the model, free field conditions for the upper plate, and the displacement of two neighbor vertical planes of model is restricted in the normal direction. A low constant vertical velocity set at 1 × 10⁻⁵ m/s was applied to the top of the model in the negative z-direction to generate a constant loading on the whole system.

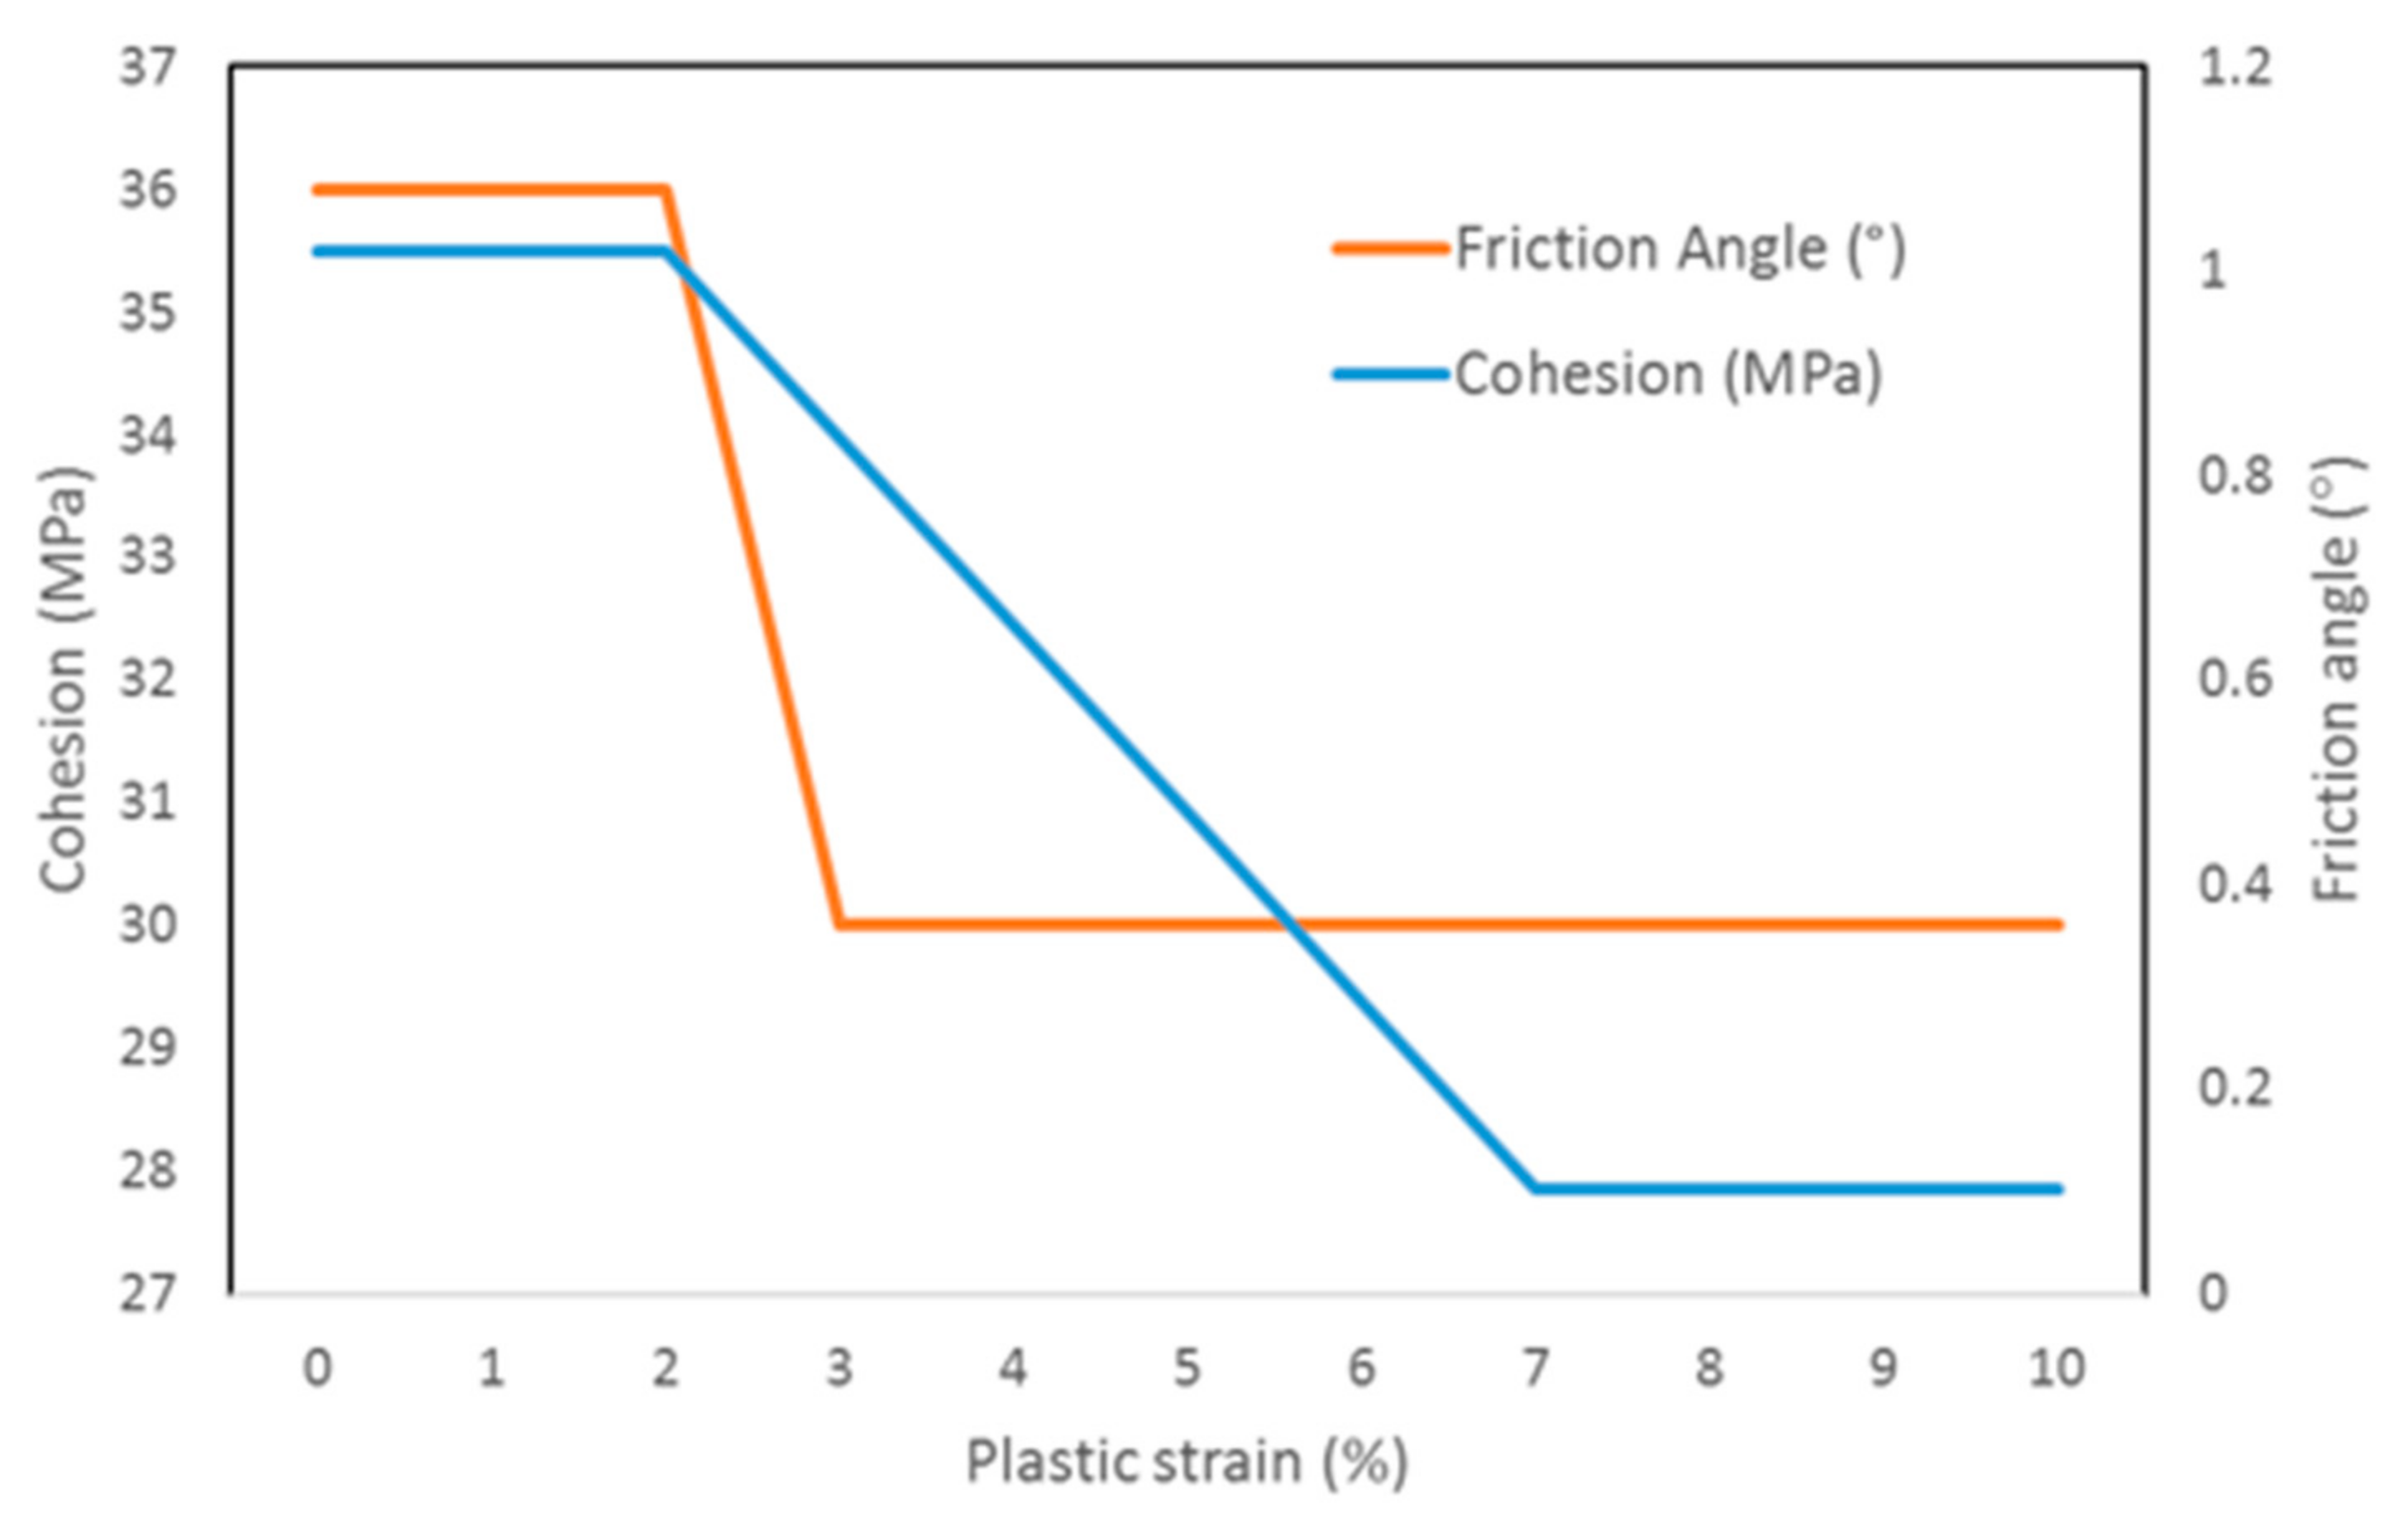
3.3. Determination of Pillar Parameters

Based on typical coal properties, the uniaxial compressive strength (UCS) of the coal was assigned as 4.0 MPa, and the tensile strength as 0.04 MPa. Young’s modulus, poisson’s ratio and dilation angle are representative average values from obtained from the literature. As discussed in Section 3.1, the model was set to a linear strain softening model. The model began to weaken after 2% deformation, at a softening rate of 90% cohesion reduction over 5% plastic strain, and six-degree friction angle reduction over 0.5% strain. The final mechanical parameters and the softening rate (Figure 4) used in this test are listed in Table 1.

3.4. Determination of Gas Parameter

FLAC3D simulates fluid flow and fluid effect on the solid model by assigning an associated pore pressure at each grid point of the model. To simulate coal bursting liability under different gas pressures, the first undertaking is to assume that the gas distribution within the coal pillar is homogeneous, in order to render the problem tractable. Therefore, in the numerical model simulations, gas pressures were held constant at 0 Pa, 10 kPa, 20 kPa, 30 kPa, 40 kPa, 50 kPa, 55 kPa, 57 kPa, 60 kPa, 63 kPa, 65 kPa, 70 kPa, and 80 kPa, respectively. The rest of the parameters used during the simulations are listed in Table 2, and were obtained directly from Tianan No. 1 coal mine. Detailed results are discussed in Section 4.

4. Results of the Numerical Analysis

The modeling results from the methodology described in Section 3 include the BEI, for different coal pillar sizes and gas pressure, as well as the complete stress-strain curve. Also, the relationship curves are plotted to better understand the relationship between BEI and gas pressure.

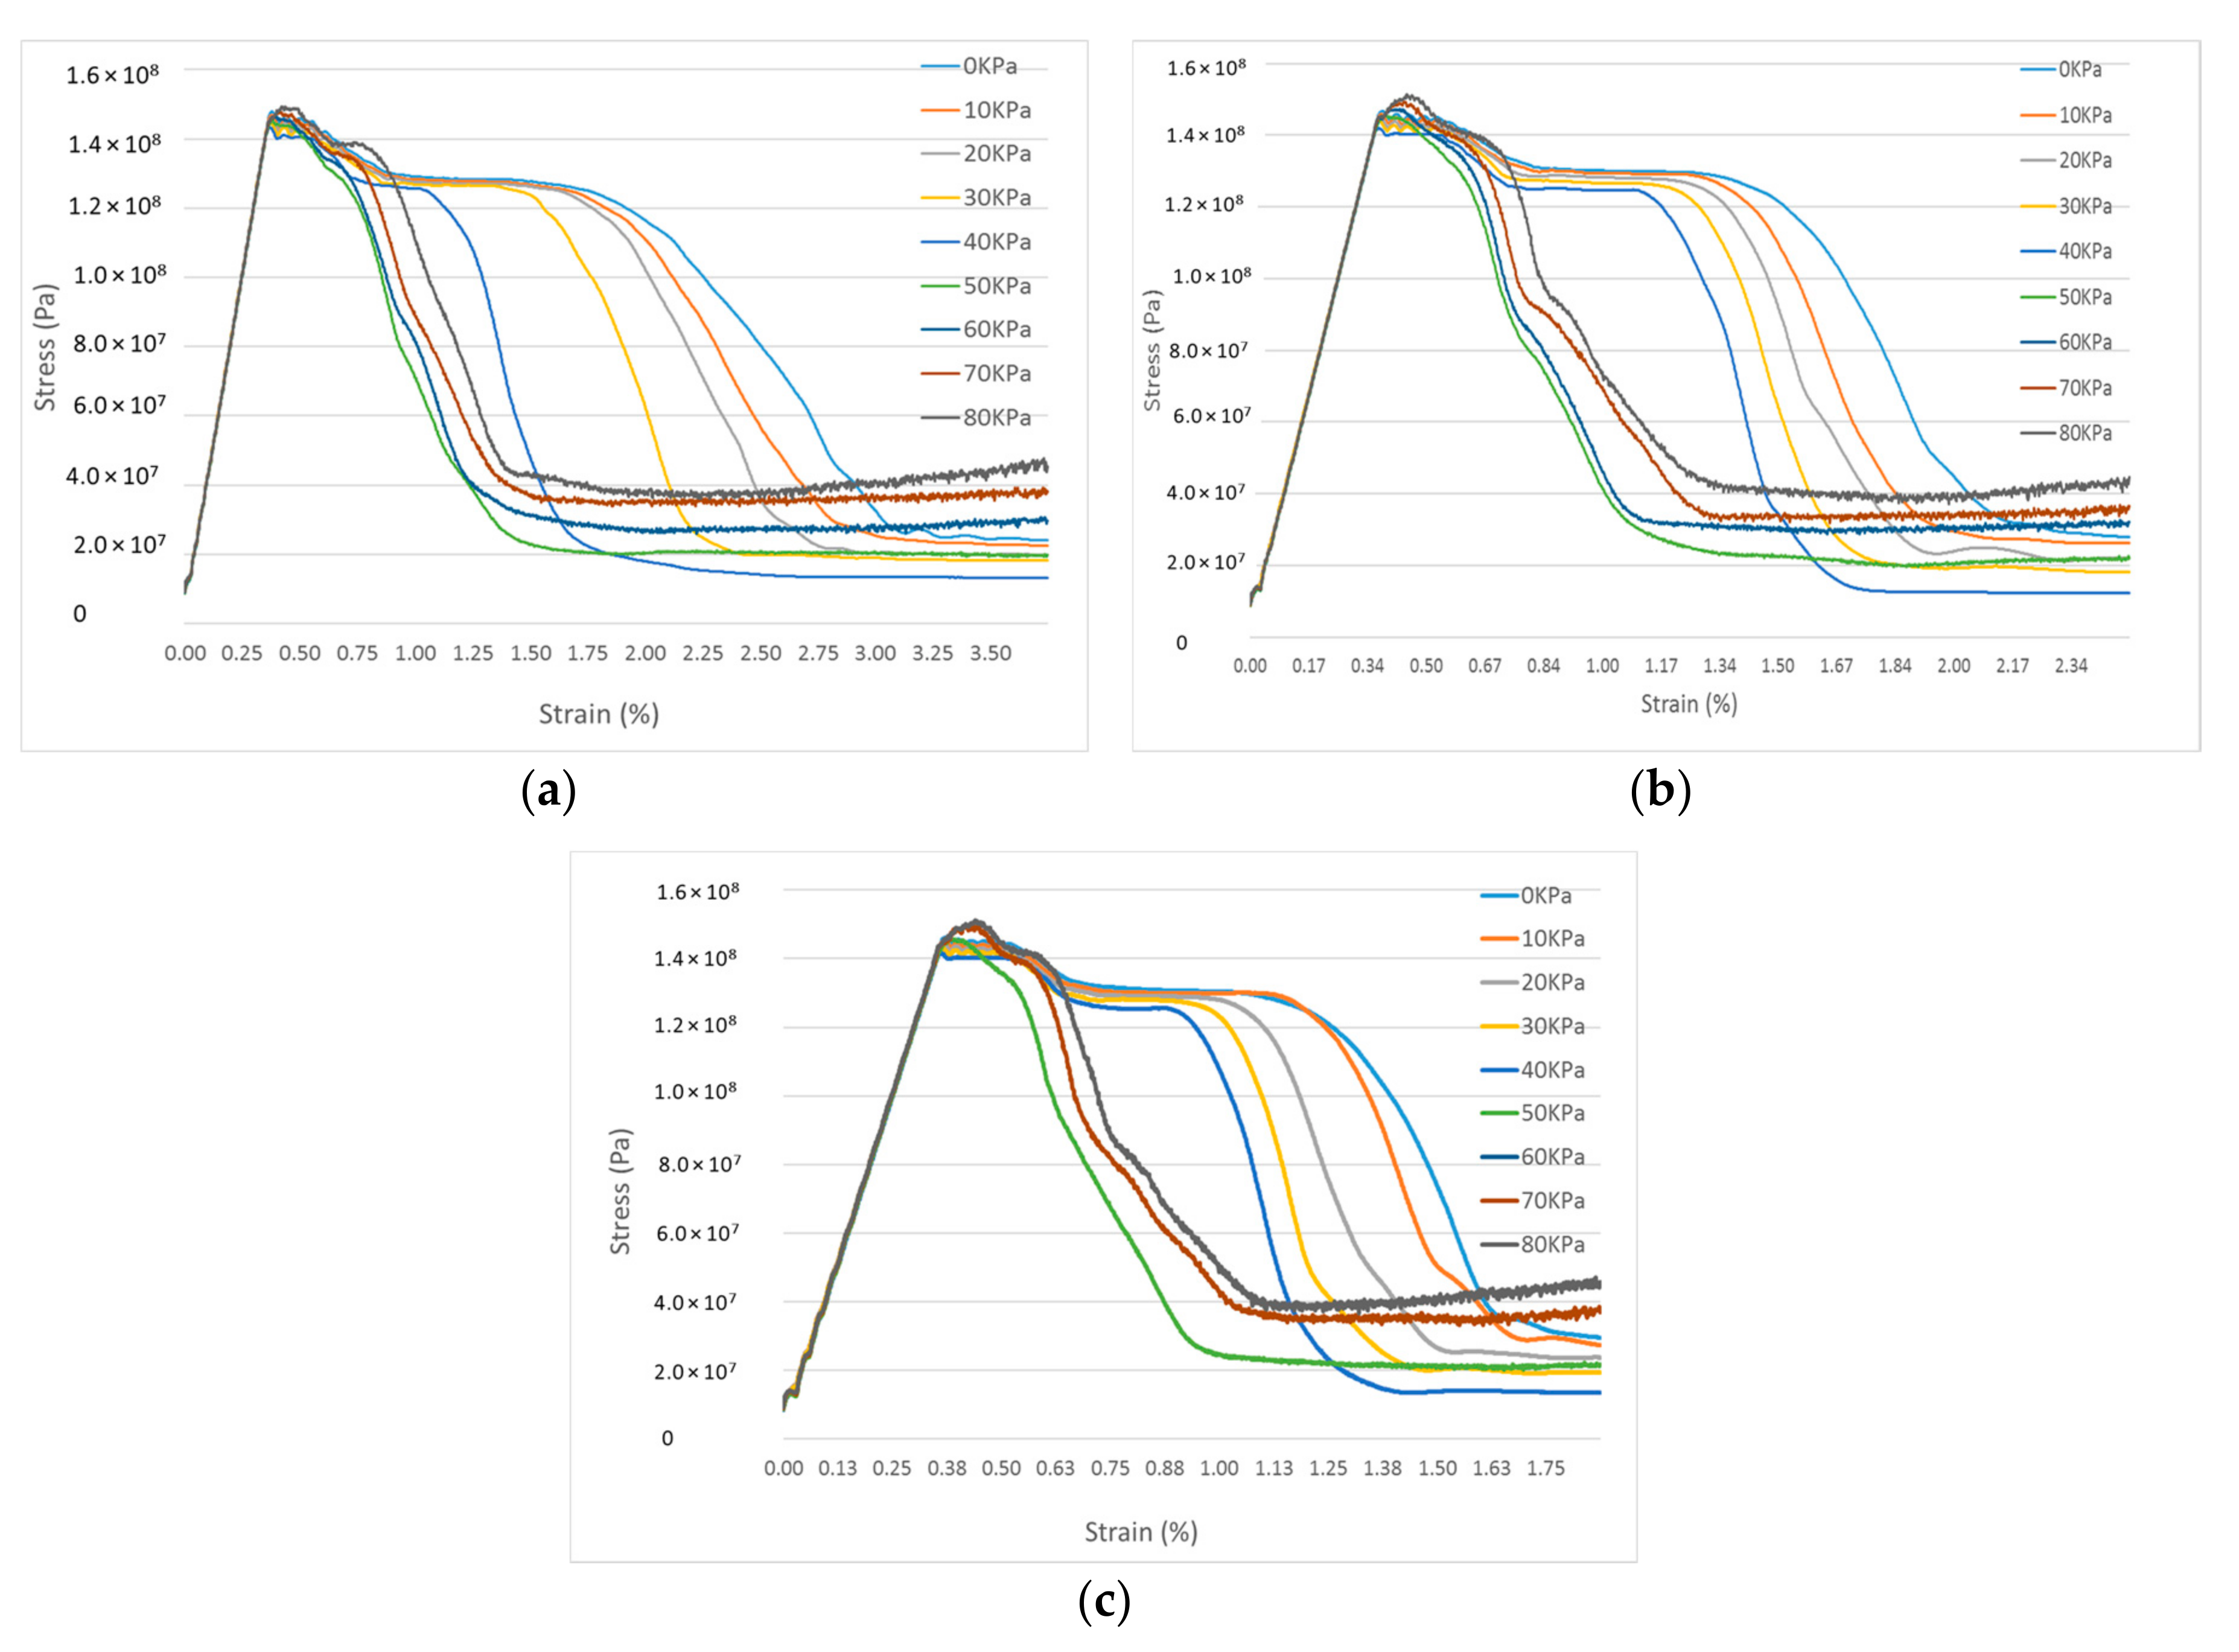
4.1. Complete Stress-Strain Curve of Coal Pillar

The goal of these series of simulations was to use the BEI to determine the coal pillar bursting liability. The complete stress-strain curve for a coal pillar was obtained by recording the stress and strain value of each numerical model every ten steps. The stress-strain curve includes all of the information that is necessary to calculate the BEI, such as a summary of the elastic strain energy (We), permanent strain energy (Wp), and the energy dissipated during the process of failure (Wf). Figure 5a–c show the complete stress-strain curves for coal pillars from a grand total of 39 simulated models. In each case, the magnitudes for the pillar heights and gas pressures were varied, while the rest of the model parameters remained fixed.
The modeling results show that for all the applied conditions, different peak strengths are displayed, although the loading stress remains the same. This implies that they possess the same elastic strain energy and permanent plastic strain energy. However, the failure process shows a totally different condition for different gas pressure magnitudes. Generally speaking, higher gas pressure can cause the rock to reach the residual strength after a smaller strain, and a lower pressure requires more loading time to reach the residual strength. However, it is obvious that no matter the pillar size, it is not necessarily the highest gas pressure, which has the lowest failure time; on the other hand, when the gas pressure achieves a threshold value between 50 kPa to 70 kPa, the failure time is shortest.
To determine the BEI, the area of the pre-failure and post-failure of the complete stress-strain curve were calculated for each coal pillar size and gas pressure condition as described in Section 2. In this section, it is assumed that failure begins at peak stress. All of the BEI values calculated from this study are shown in Table 3.

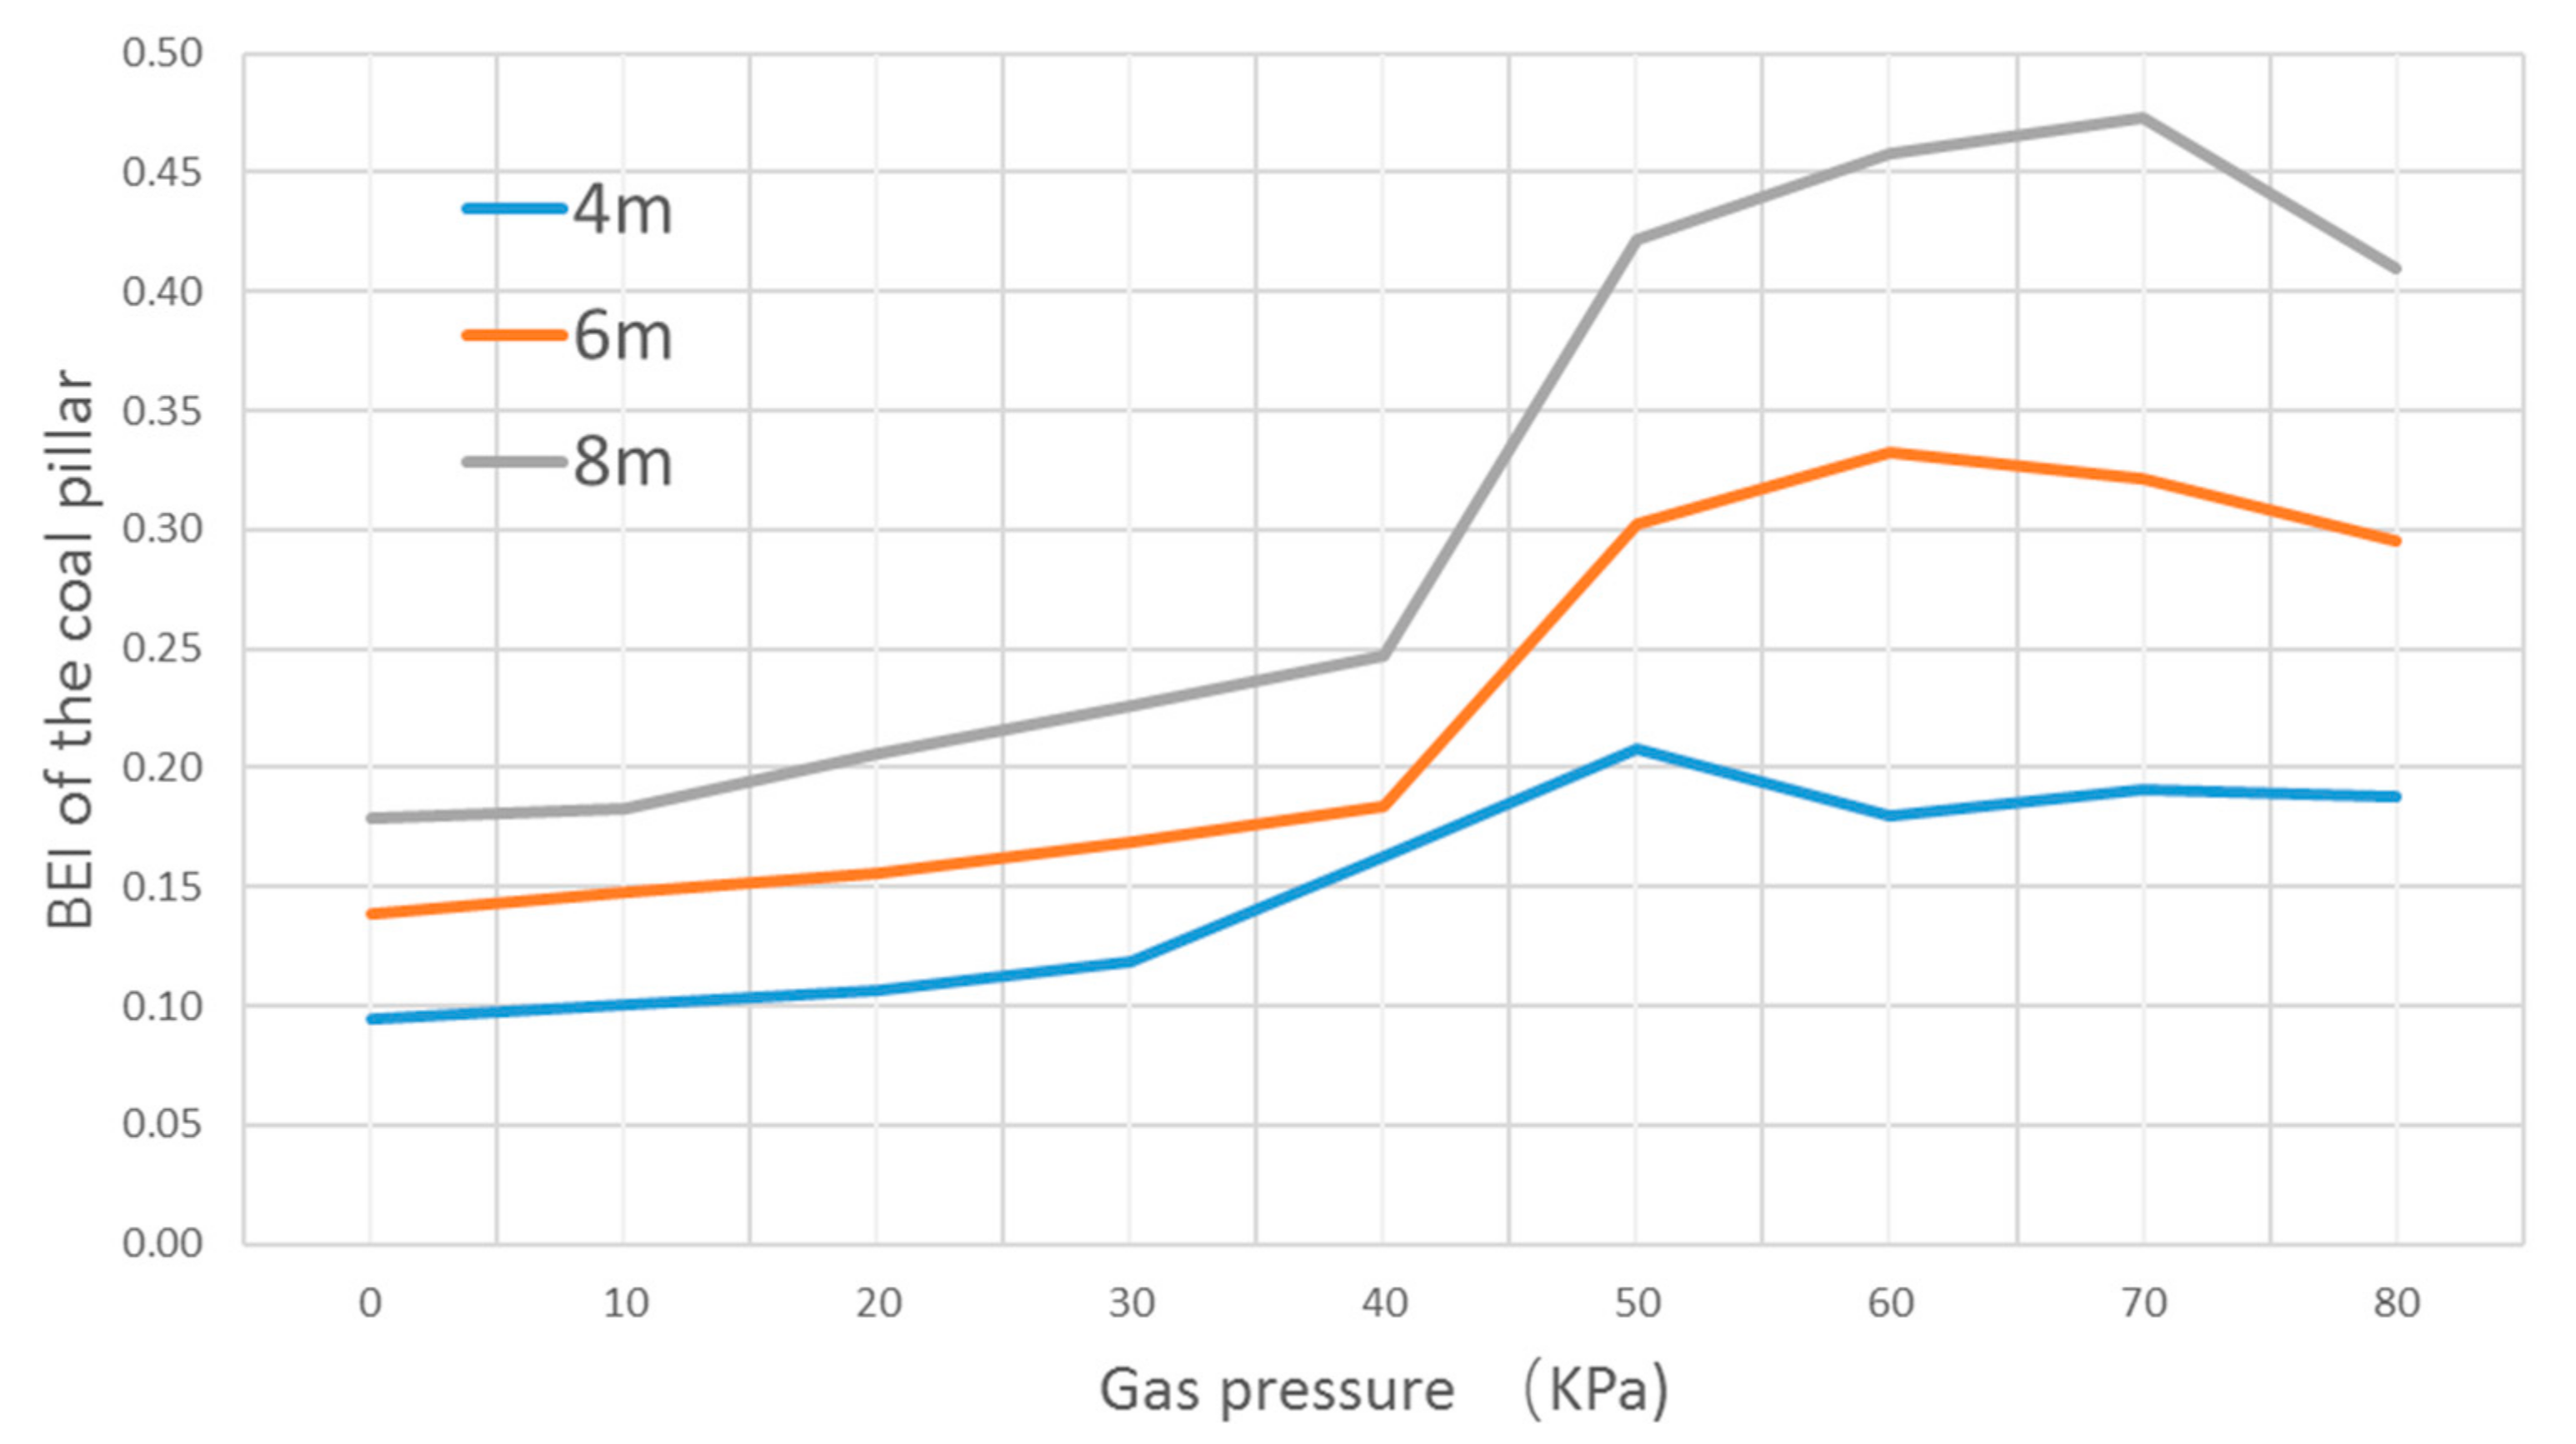
4.2. Relationship between Gas Pressure and Bursting Energy Index

The calculated relationships between gas pressures and bursting energy indices are plotted on Figure 6, based on the data from Table 3. The results show that in general as the gas pressure within the coal pillar increases, the BEI also increases, albeit non-linearly. For example, the rate of increase of the BEI before the gas pressure reaches 20 kPa is very low. However, after a gas pressure of approximately 20 kPa, the rate of increase in the BEI rises slightly. At approximately 40 kPa, there is a sudden jump to a characteristic BEI whose value is dependent on the height of the pillar. At 50 kPa, the value of the BEI increases by 50% going from the 4 m pillar to the 6 m pillar. The value of the BEI increases by 43%, going from the 6 m high pillar to the 8 m high pillar at 50 kPa. The trend of the BEI values after 50 kPa is highly dependent on the size of the pillar. The BEI for the 4 m high pillar begins to drop off past the 50 kPa mark right away. On the other hand, the BEI for the 6 m-high pillar continues its upward trend at a slower rate before beginning to decline. The BEI trend for the 8 m-high pillar continues to increase even much longer than for the 6 m-high pillar before beginning its descent. These observations are reasonable given that for the same magnitude of gas pressure, smaller pillars would be expected to fail first before larger pillars, leading to a degree of stress relief. An explanation for the marked difference in the response of each pillar beyond the 50 kPa threshold could thus be a function of non-linear changes in insitu stress conditions imposed on the system by the differences in geometrical characteristics. The observed trends at high gas pressures can also be analyzed in the context of incurred deformations, and are discussed in Section 5.

5. Discussion

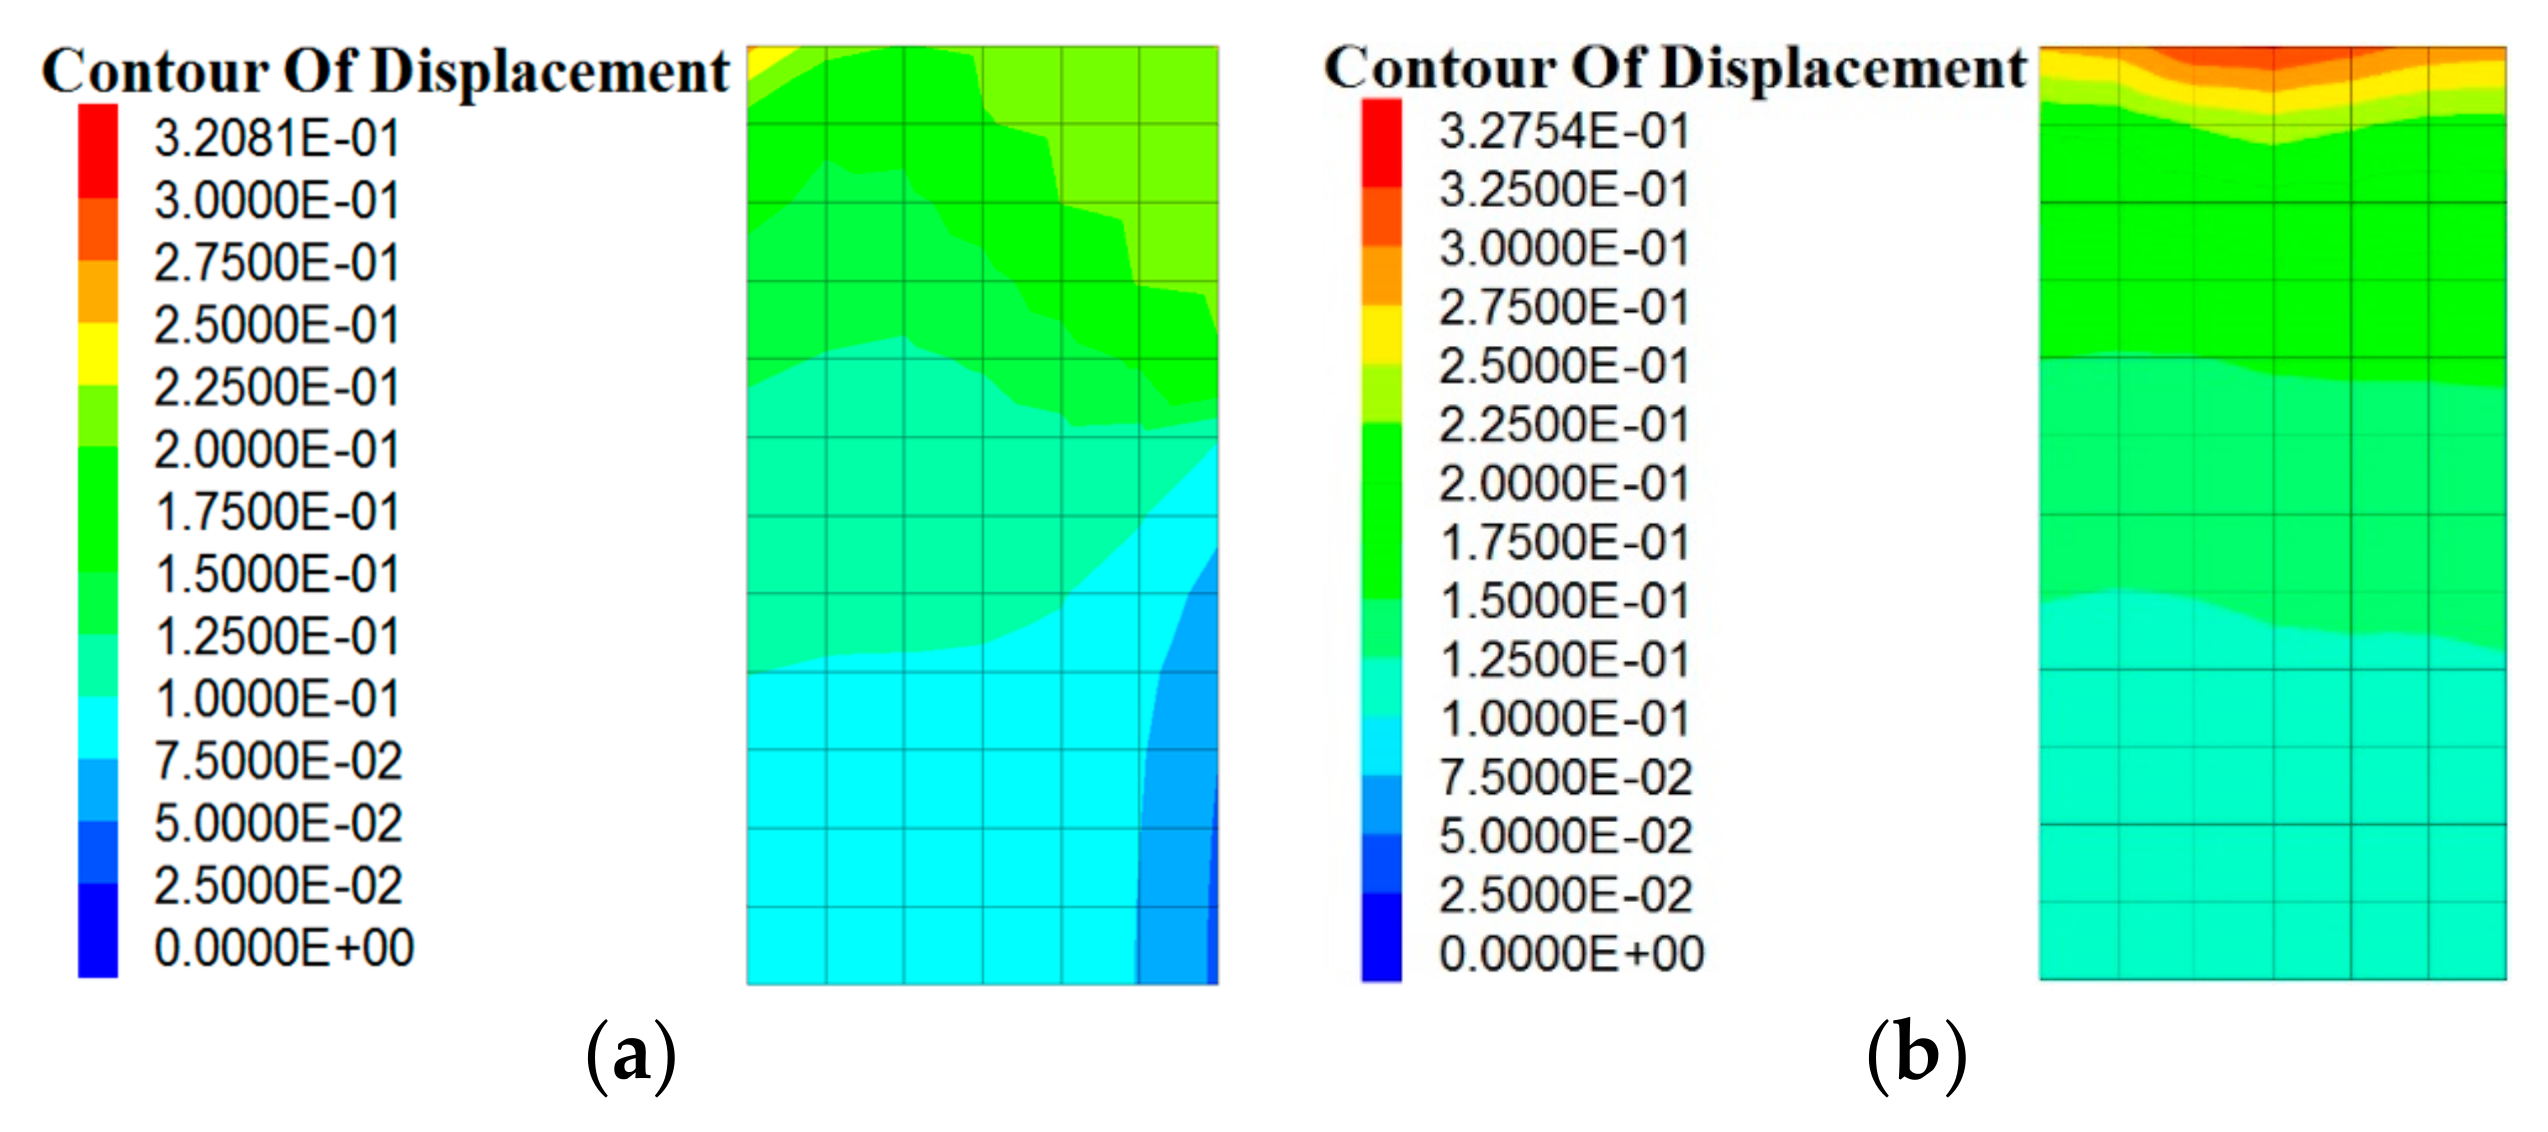
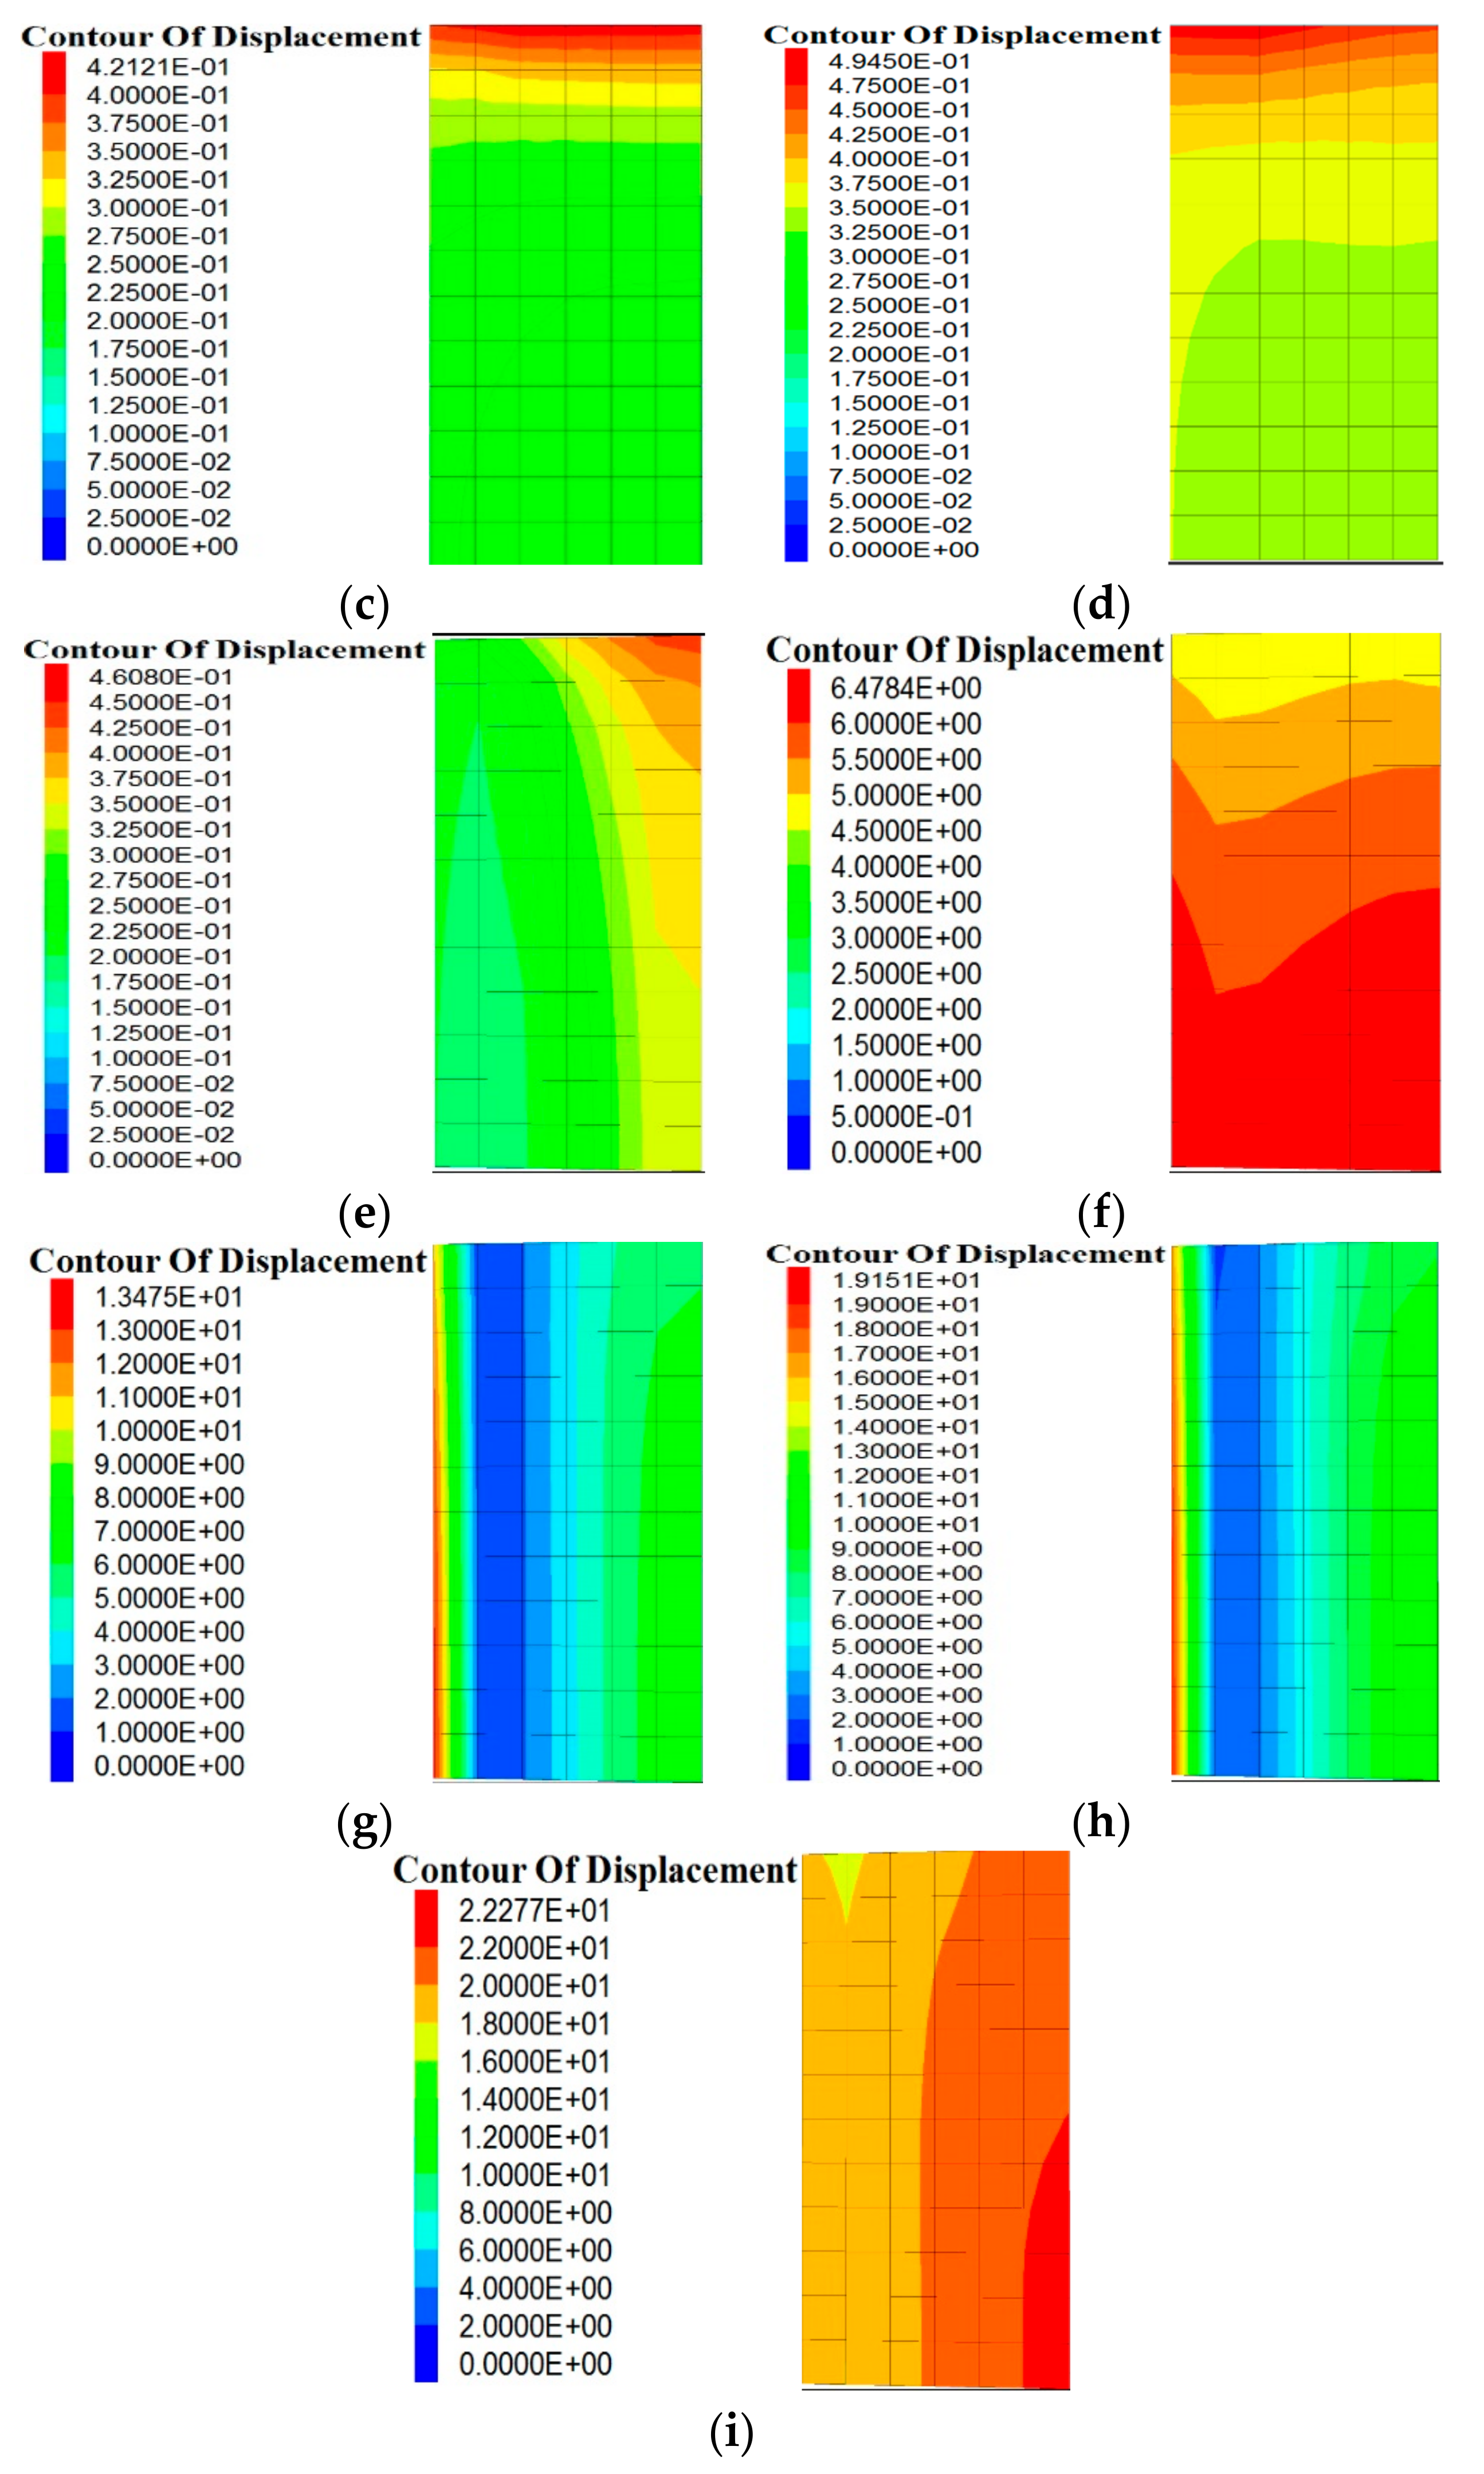
5.1. Deformation Detail of the Coal Pillar

As discussed in Section 3, the pillar model was set to a strain-softening material behavior. Irrespective of pillar height used during the modeling, the failure modes displayed similar deformation profiles and only differed in terms of magnitude. Therefore, only the 6 m high pillar is shown (Figure 7) for the purpose of illustration and discussion. Figure 7 shows the displacement contours and deformation condition when the entire 6 m high coal pillar reaches the residual strength under increasing gas pressure conditions. It is clear from the model that both the coal pillar displacement magnitude, as well as the displacement area become severe as the gas pressure increases. However, as observed in the BEI trends after 50 kPa on Figure 6, the coal pillar failure mode displays a marked deviation after the 50 kPa pressure threshold. Before 50 kPa, the deformations are largely imposed by the vertical loading stress leading to vertical displacements. At 50 kPa, the deformations are largely due to high gas pressure and increase bottom-up. After 50 kPa the proceeding failure modes now show a characteristic lateral deformation and displacement behavior, which is discussed further in Section 5.2.

5.2. The Relationship between Gas Pressure and Coal Pillar Bursting Liability

A comparison of the plots showing relationships between gas pressure and BEI (Figure 6), and the coal pillar model deformation details (Figure 7) indicates that if the applicable gas pressure exceeds the threshold value of 50 kPa, significant differences in pillar response and failure modes are displayed. The results suggest that before 50 kPa, pillar failure is largely due to mechanical loading, and to a lesser effect by the gas exerting a pressure greater than the coal pillar strength. However after 50 kPa, pillar failure is largely due to the gas exerting a pressure greater than the coal pillar strength, and to a lesser extent, by mechanical loading. Hence, after the after gas pressures exceed a threshold of 50 kPa there is a change in the resulting failure mode of the pillar. However, there is some stress relief after the pillar fails irrespective of whether the failure is as a result of mechanical loading or excessive gas pressure. The stress relief would then explain the reduction in bursting liability reflected by declining BEI trends shown in Figure 6.

6. Conclusions

This study investigates the relationship between gas induced pressure in underground coal seams and rock burst liability quantified by the BEI. Given that in-situ tests are impractical, FLAC 3D simulations were employed to study the problem. A representative quarter of a coal pillar model based on a real mine in China was built, with the width kept constant and different gas pressures assigned to each grid point of the numerical model to represent the gas trapped in the microfractures of the coal pillar. The simulation procedure involved sequential loading similar to laboratory uniaxial compression testing of rock samples, while recording stress and strain values at every ten time steps. The final displacement of each model provided the failure mode for a specific gas pressure condition, and the results were used to compute BEI values. It is clear that high-pressure gas within the interior of a coal pillar can enhance the coal bursting potential, however, the specific effects on magnitudes and failure modes are not clearly constrained. Based on the final BEI and the final displacement of the model at different gas pressure the following additional conclusions can be made:
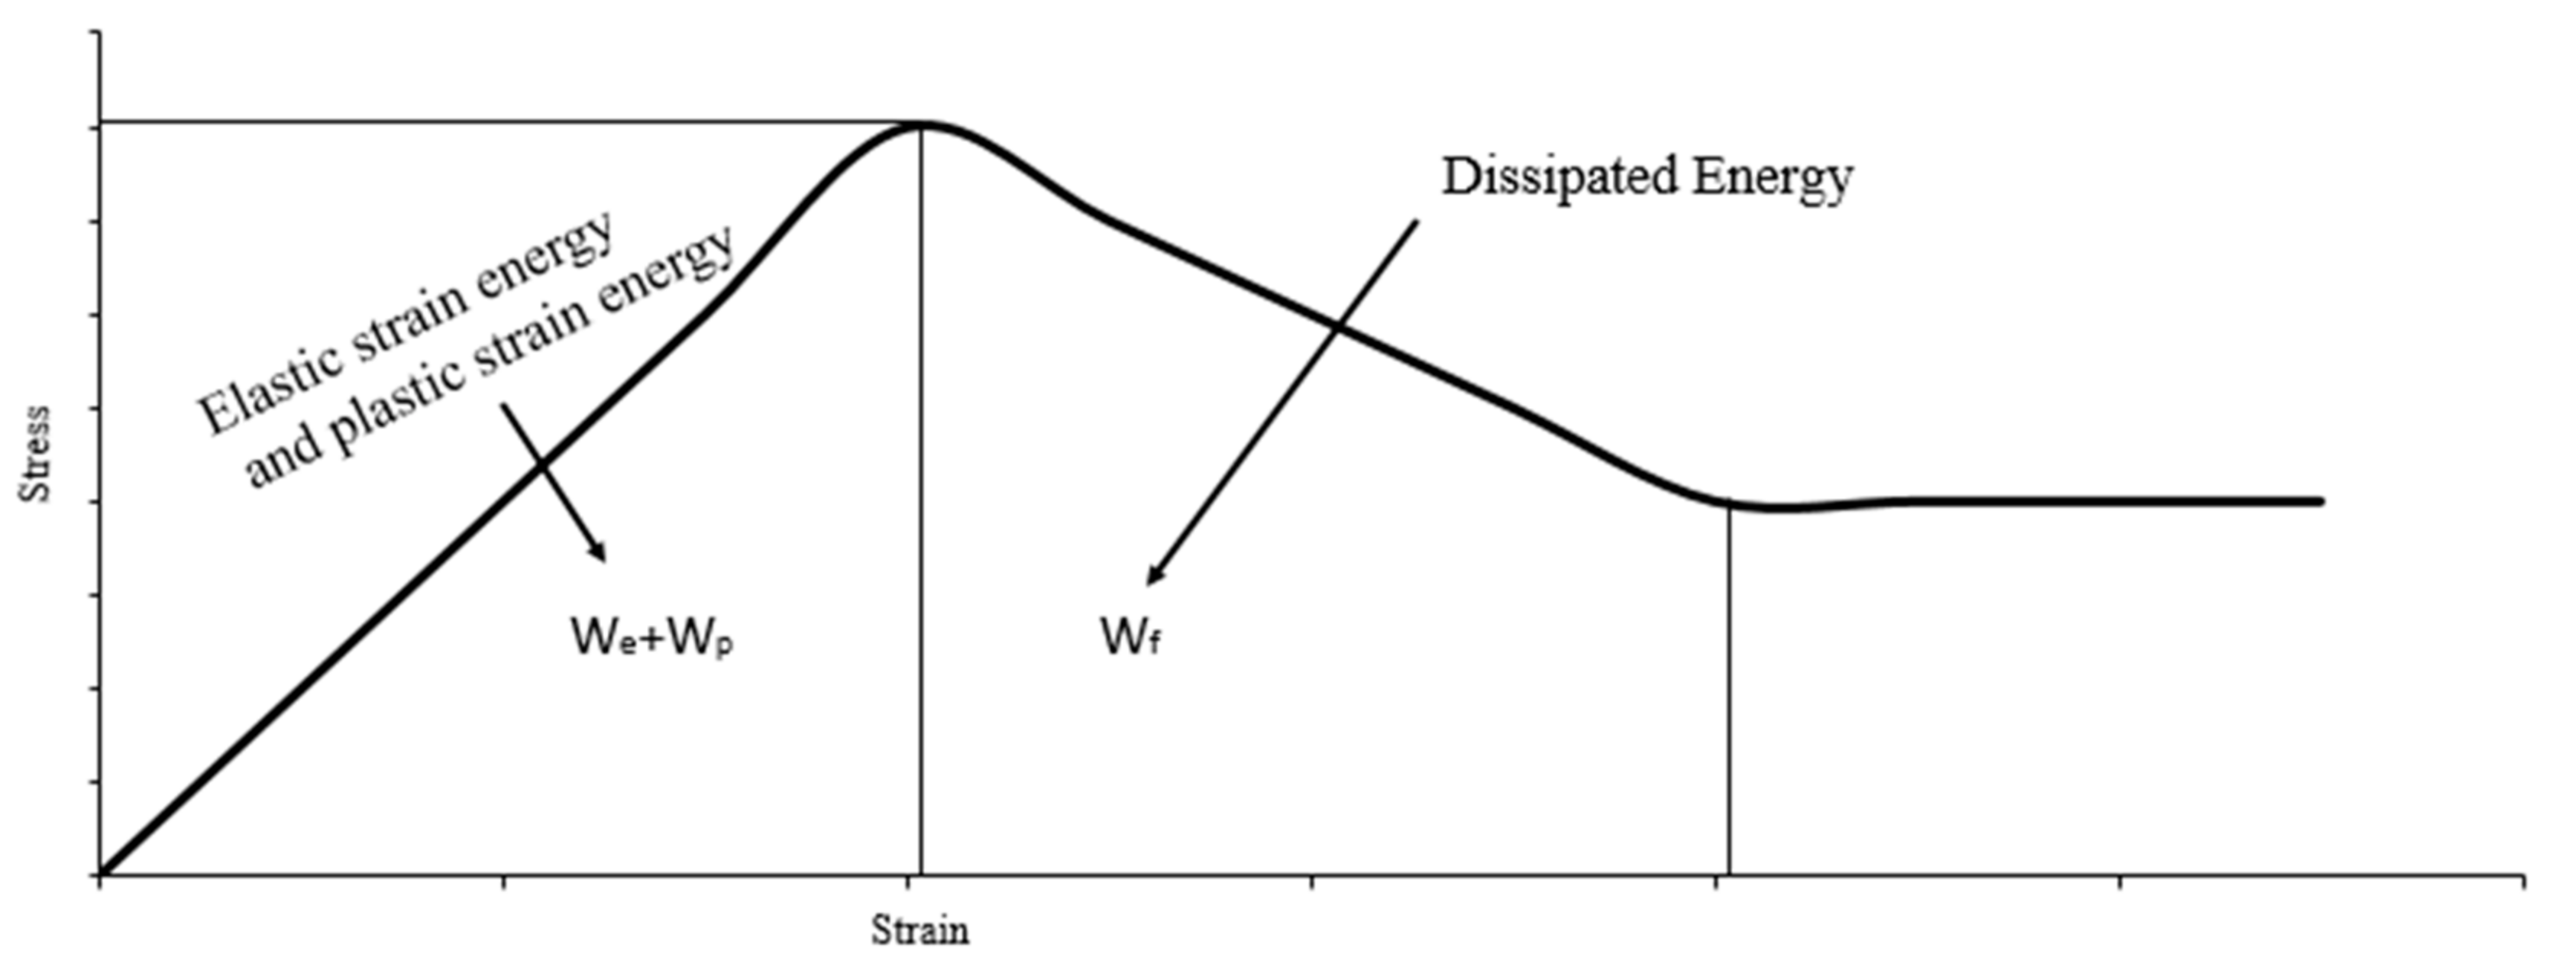
  • The complete stress-strain curve of the coal pillar during loading can be derived from the numerical simulation results. Based on the derived stress-strain curve, the peak point of the failure envelope can be determined and used to calculate the area under the curve of the pre- and post-failure response.
  • The area under the curve of the pre- and post-failure response represent the sum of elastic strain and plastic strain energy before the failure, and the dissipated energy after the failure, respectively. The BEI is then applied to determine the coal pillar bursting liability by applying the pre- and post-failure energy principle.
  • From the analysis of the stress-strain curves obtained from the numerical simulation, it was observed that before the gas pressure within the pillar reaches a magnitude of 50 kPa, there is a positive non-linear relationship between gas pressure and the BEI. In other words, doubling the gas pressure does not necessarily result in a two-fold increase in the likelihood of the bursting potential for a particular coal pillar.
  • Analyses of loaded coal pillar stress-strain curves, BEI values, and the displacements of pillars, indicate that when the gas pressure exceeds a threshold of greater than 50 kPa, the BEI growth rate will decrease at a rate that is dependent on the size of the coal pillar.
  • Finally, stress-strain curves and BEI values also show a marked difference in deformation patterns beyond a 50 kPa gas pressure threshold. The deviation is due to changes in loading conditions and stress states resulting in quasi-failed coal pillars, as a result of the high gas pressure. Further studies are warranted to validate the observed deviation in BEI trends and coal pillar failure modes beyond gas pressure thresholds of 50 kPa.

Acknowledgments

Special thanks to Xihe Li, Deputy Chief Engineer at Tianan No. 1 Coal Mine, Pingdingshan, Henan, China for providing the case study data. The reviewers are also acknowledged for their helpful comments and suggestions that greatly improved the manuscript.

Author Contributions

H.Z. conceived and designed the experiments; H.Z. performed the simulations; H.Z. and R.B.K. analyzed the data; H.Z. and R.B.K. wrote the paper.

Conflicts of Interest

The authors declare no conflict of interest.

References

  1. Dou, L.M.; Lu, C.P.; Mu, Z.L.; Gao, M.S. Prevention and forecasting of rock burst hazards in coal mines. Min. Sci. Technol. 2009, 19, 585–591. [Google Scholar] [CrossRef]
  2. Jiang, Y.D.; Zhao, Y.X. State of the art: Investigation mechanism, forecast and control of coal bumps in China. Chin. J. Rock Mech. Eng. 2015, 34, 2188–2204. [Google Scholar]
  3. Liu, J.; Wang, E.Y.; Song, D.Z.; Wang, S.H.; Niu, Y. Effect of rock strength on failure mode and mechanical behavior of composite samples. Arab. J. Geosci. 2015, 8, 4527–4539. [Google Scholar] [CrossRef]
  4. Guo, W.; Zhao, T.; Tan, Y.; Yu, F.; Hu, S.; Yang, F. Progressive mitigation method of rock bursts under complicated geological conditions. Int. J. Rock Mech. Min. Sci. 2017, 96, 11–22. [Google Scholar] [CrossRef]
  5. Jiang, Y.D.; Zhao, Y.X.; He, M.C.; Peng, S.P. Investigation on mechanism of coal mine bumps based on mesoscopic experiments. Chin. J. Rock Mech. Eng. 2007, 26, 901–907. [Google Scholar]
  6. Mallikarjun, P.; Satya, H.; Liu, S.M. Gas diffusion behavior of coal and its impact on production from coalbed methane reservoirs. Int. J. Coal Geol. 2011, 86, 342–348. [Google Scholar]
  7. Wang, Z.; Yin, G.Z.; Hu, Q.T.; Jin, H.W. Inducing and transforming conditions from rockburst to coal-gas outburst in a high gassy coal seam. J. Min. Saf. Eng. 2010, 27, 572–575. [Google Scholar]
  8. Shen, B.; King, A.; Guo, H. Displacement, stress and seismicity in roadway roofs during mining-induced failure. Int. J. Rock Mech. Min. Sci. 2008, 45, 672–688. [Google Scholar] [CrossRef]
  9. Tulu, I.B.; Esterhuizen, G.S.; Klemetti, T.; Murphy, M.M.; Sumner, J.; Sloan, M. A case study of multi-seam coal mine entry stability analysis with strength reduction method. Int. J. Min. Sci. Technol. 2015, 26, 193–198. [Google Scholar] [CrossRef] [PubMed]
  10. Wang, Z.; Hu, Q.T.; Yin, G.Z. Experimental research on the burst proneness index of coal threated with gas pressure. J. China Univ. Min. Technol. 2010, 39, 516–519. [Google Scholar]
  11. Wen, Z.J.; Tan, Y.L.; Han, Z.Z.; Meng, F.B. Construction of time-space structure model of deep stope and stability analysis. Pol. J. Environ. Stud. 2016, 25, 2633–2639. [Google Scholar] [CrossRef]
  12. Liu, X.; Wang, X.; Wang, E.; Kong, X.; Zhang, C.; Liu, S.; Zhao, E. Effects of gas pressure on bursting liability of coal under uniaxial conditions. J. Nat. Gas Sci. Eng. 2017, 39, 90–100. [Google Scholar] [CrossRef]
  13. Su, C.D.; Yuan, R.F.; Zhai, X.X. Experimental research bursting liability index of coal samples of Chengjiao coal mine. Chin. J. Rock Mech. Eng. 2013, 32 (Suppl. 2), 3692–3704. [Google Scholar]
  14. Khair, A.W. An analysis of coal bump liability in a bump prone mine. Int. J. Min. Eng. 1985, 3, 243–259. [Google Scholar] [CrossRef]
  15. Kidybinski, A. Bursting liability indices of coal. Int. J. Rock Mech. Min. Sci. Geomech. Abstr. 1981, 18, 295–304. [Google Scholar] [CrossRef]
  16. Pan, J.F.; Ning, Y.; Du, T.T.; Lan, H.; Zhang, Y.; Liu, J.; Xia, Y.X.; Wei, Z.X. The theory and system for preventing rock burst in large-scale areas. J. China Coal Soc. 2012, 37, 1803–1809. [Google Scholar]
  17. Qi, Q.X.; Peng, Y.W.; Li, Y.H.; Li, J.Q.; Wang, Y.G.; Li, C.R. Study of bursting liability of coal and rock. Chin. J. Rock Mech. Eng. 2011, 30 (Suppl. 1), 2736–2742. [Google Scholar]
  18. Wu, Y.; Zhang, W. Evaluation of the bursting proneness of coal by means of its failure duration. In Rockbursts and Seismicity in Mines; Gibowicz, S.J., Lasocki, S., Eds.; A. A. Balkema: Rotterdam, The Netherlands, 1997; pp. 285–288. [Google Scholar]
  19. Zhao, Y.X.; Jiang, Y.D. Acoustic emission and thermal infrared precursors associated with bump-prone coal failure. Int. J. Coal Geol. 2010, 83, 11–20. [Google Scholar] [CrossRef]
  20. Zhang, C.; Canbulat, I.; Bruce, H.; Ward, C.R. Assessing coal burst phenomena in mining and insights into directions for future research. Int. J. Coal Geol. 2017, 179, 28–44. [Google Scholar] [CrossRef]
  21. Liu, Q.; Cheng, Y.; Wang, H.; Kong, S.; Dong, J.; Chen, M.; Zhang, H. Numerical assessment of the influences of coal permeability and gas pressure inhomogeneous distributions on gas drainage optimization. J. Nat. Gas Sci. Eng. 2017, 45, 797–811. [Google Scholar] [CrossRef]
  22. Li, Z.; Nocelli, B.; Saydam, S. Effect of rock strength and surface roughness on adhesion strength of thin spray-on liners. Int. J. Rock Mech. Min. Sci. 2017, 91, 195–202. [Google Scholar] [CrossRef]
  23. Cook, N.G.W. The seismic location of rockbursts. In Proceedings of 5th U.S. National Symposium on Rock Mechanics; Pergamon Press: Oxford, UK, 1963; pp. 493–516. [Google Scholar]
  24. Neyman, B.Z.; Szecowka, Z.; Zuberek, W. Effective methods for fighting rockbursts in polish collieries. In Proceedings of the 5th International Strata Control Conference, London, UK, 21 August 1972; p. 23. [Google Scholar]
  25. Petukhov, I.M.; Linkov, A.M. The theory of post-failure deformations and the problem of stability in rock mechanics. Int. J. Rock Mech. Min. Sci. Geomech. Abstr. 1979, 16, 57–76. [Google Scholar] [CrossRef]
  26. Salamon, M.D.G.; Wagner, H. The Role of Stabilising Pillars in the Alleviation of Rockburst Hazzard in Deep Mines; Research Report No. 27/79; Chamber of Mines of South Africa Research Organization: Johannesburg, South Africa, 1979. [Google Scholar]
  27. Lan, H.; Pan, J.; Peng, Y. Numerical simulation for energy mechanism of underground dynamic disaster. Meitan Xuebao/J. China Coal Soc. 2010, 35, 10–14. [Google Scholar]
  28. Li, C.; Xie, B.; Cao, J.; Wang, T.; Wang, X. The energy evaluation model of coal and gas outburst intensity. Meitan Xuebao/J. China Coal Soc. 2012, 37, 1547–1552. [Google Scholar]
  29. Classification and Laboratory Test Method on Bursting Liability of Coal; GT/T 25217. 2-2010; Standards Press of China: Beijing, China, 2010.
  30. Jiang, Y.D.; Wang, H.W.; Zhao, Y.X.; Zhu, J.; Pang, X.F. The influence of road way backfill on bursting liability and strength of coal pillar by numerical investigation. Procedia Eng. 2011, 26, 1125–1143. [Google Scholar]
Figure 1. Stress-strain curve illustrating how the Bursting Energy Index can be determined by determining areas under the curve representing elastic strain, plastic strain and the dissipated energy.
Energies 11 00260 g001
Figure 2. Fast Lagrangian Analysis of Continua in Three-Dimensions (FLAC3D) model mesh for an entire pillar using an element size of 0.5 m × 0.5 m × 0.5 m. During each simulation, all of the numerical models were run at 15,000 steps.
Energies 11 00260 g002
Figure 3. Plan view and cross-sectional view of applied boundary conditions to the model. Zero displacements were set at the base of the model, and free field conditions for the upper plate and the four-vertical symmetry planes of coal pillar.
Energies 11 00260 g003
Figure 4. Material behavior applied to the model, showing the variation of cohesion and friction angle with plastic strain. The linear-softening model began to weaken after 2% deformation, at a softening rate of 90% cohesion reduction over 5% plastic strain, and six-degree friction angle reduction over 0.5% strain.
Energies 11 00260 g004
Figure 5. Stress-strain curves obtained from numerical simulation results for (a) 4 m, (b) 6 m and (c) 8 m high coal pillar with 0 to 80 kPa gas pressure. In each case, the magnitudes for the pillar heights and gas pressures were varied while the rest of the model parameters remained fixed.
Energies 11 00260 g005
Figure 6. Graphs showing relationship between gas pressure and Bursting Energy Index for various pillar sizes, based on the raw data from Table 3. The results show that as the gas pressure within the coal pillar increases, the Bursting Energy Index increases non-linearly before dropping off.
Energies 11 00260 g006
Figure 7. Plots showing displacement contours in 6 m high pillars when gas pressure is (a) 0 kPa, (b) 10 kPa, (c) 20 kPa, (d) 30 kPa, (e) 40 kPa, (f) 50 kPa, (g) 60 kPa, (h) 70 kPa and (i) 80 kPa. Deformations represent conditions when the 6 m high coal pillar reaches the residual strength under the different gas pressure conditions.
Energies 11 00260 g007aEnergies 11 00260 g007b
Table 1. Final mechanical parameters used after the strain softening shown in Figure 4 for the numerical pillar model.
Property Young’s Modulus (GPa)Poisson’s RatioUCS (MPa)Tensile Strength (MPa)CohesionFriction AngleDilation Angle (°)
Original Value (MPa)Softening Rate (%)Residual Value (MPa)Original Value (°)Softening Rate (%)Residual Value (°)
Coal 1.10.34.00.041.025.00.10236.0.5306.000
Table 2. Mechanical parameters used for the numerical gas model obtained directly from Tianan No. 1 coal mine. Detailed results are discussed in Section 4.
PorosityCoefficient of Permeability (m2)Gas Pressure (MPa)Gas Density (kg/m3)Gas Bulk Modulus (GPa)Tensile Strength (MPa)
0.052.5 × 10−170.60.7160.2540
Table 3. Summary of calculations from numerical modeling results showing relationships between the Bursting Energy Index and gas pressure, based on the methodology described in Section 2.
Approximate Gas Pressure (kPa)WCF of the Coal Pillar
Pillar Width
4 m6 m8 m
00.0942410.1390700.178855
100.1009480.1473800.183257
200.1061790.1558550.205874
300.1184740.1688080.225705
400.1623270.1835650.246674
500.2076360.3026130.421820
550.2037020.3142830.390673
570.1970330.3041070.429803
600.1797750.3325540.458227
630.2021870.3138590.456203
650.1965840.3037010.469571
700.1911530.3210370.473001
800.1879070.2949130.409714

