Organic Soiling: The Role of Pollen in PV Module Performance Degradation


1
Renewable Energies Chair, University of Evora, 7002-554 Evora, Portugal
2
Institute of Earth Sciences, University of Evora, 7000-671 Evora, Portugal
3
Hercules Laboratory, University of Evora, 7000-089 Evora, Portugal
*
Author to whom correspondence should be addressed.
Energies 2018, 11(2), 294; https://doi.org/10.3390/en11020294
Submission received: 14 December 2017
/
Revised: 12 January 2018
/
Accepted: 16 January 2018
/
Published: 26 January 2018
(This article belongs to the Special Issue PV System Design and Performance)
Abstract
:Soiling is a problem for solar energy harvesting technologies, such as in photovoltaic modules technologies. This paper describes not only one complete year of Soiling Ratioindex and rates measured in a rural environment of Southern Europe, but also focuses on the seasonal variation of the type of soiling, mainly spring and summer. The Soiling Ratio index is calculated based on the maximum power output and short circuit current of two photovoltaic (PV) panels, along with Scanning Electron Microscopy and Energy Dispersive X-Ray of glass samples to provide visual and chemical inspection of the type of soiling. Mass accumulation on glass samples mounted on a “glass tree” was weekly measured with a microbalance and related with the Soiling Ratio metrics. Soiling rates were calculated to infer the degree of soiling for each season and the respective comparison made. Results show a soiling rate of 4.1%/month in April (spring), 1.9%/month in July (summer) and 1.6%/month in September (fall). Rain (the main natural cleaning agent of the photovoltaic modules) as well as aerosol optical depth (proxy for atmospheric particle concentration) were correlated with the Soiling Ratio. In-depth analysis on the type of organic soiling was performed.
1. Introduction
Soiling on solar harvesting technologies, namely in photovoltaic systems (PV), has been intensively studied in the past few decades since it induces severe performance losses on such systems by reducing the incoming radiation, through reflection, scattering and absorption [1,2,3]. This implies that the systems do not work at their fullest capability [4]. As a consequence, frequent cleaning of the systems is required, which represents an important slice of the kWh cost of the electricity being produced. Moreover, soiling is not only a local [5], but also a seasonal phenomenon and for that reason, if operational costs are to be reduced, a proper characterization of it is needed. This has been done extensively in the literature, but mostly focused on desert regions [6,7,8], which have high irradiance values and significant problems with dust deposition, namely mineral and not organic.
However, everyday, new PV plants are being deployed around the world and the tendency is to have more of them in the future. Naturally, PV also suffers from soiling, not only from local sources but also transported from remote ones [5]. One country in Europe that is certainly going to increase its use of solar technologies is Portugal, due to its high irradiance availability [9]; its southern region has, on average, an annual global horizontal irradiation of 1800 kWh/m2 [10]. With this in mind, studies of soiling in this region are very important for future plants.
A first study of soiling in the region of Alentejo, Portugal, has already been published [5] and shows how Saharan dust long-range transport [11] can decrease the performance of PV systems. However, Saharan dust is not the only source of soiling that impacts PV [12]. There is one particular season of the year, spring, where organic material, such as pollen [13], can be a problem regarding soiling. This paper describes the seasonal variation in the type of particles that adhere to the relevant surfaces from winter to summer. It also describes how rain (which is the main natural cleaning agent [14]) and aerosols, affect the Soiling Ratio index (SR) in this location (Évora—38°34′0.01″ N; 7°54′0.00″ W). To identify the type of deposited particles, Scanning Electron Microscopy (SEM) and Energy Dispersive Spectroscopy (EDS) were performed. For organic particle deposition, EDS cannot be used since the composition is mainly carbon based and no conclusions can be taken. For this purpose, the Portuguese Society of Aerobiology (Sociedade Portuguesa de Aerobiologia), was able to identify some of the organic material deposited using the SEM images obtained.
Environmental variables, like rain and aerosol optical depth (AOD), contribute to explaining the observed SR during the period of the measuring campaign, November 2016 to October 2017, showing how both variables shape the evolution of the SR metrics. The authors consider these variables of vital importance for soiling deposition and removal, since rain is the main natural cleaning agent and AOD is used as a proxy for particle concentration in the atmosphere. Note also that the absence of rain allows for particles to build up on top of surfaces, increasing the soiling and consequently decreasing PV module performance.
Although most soiling work considers dust to be the main soiling agent, it is restricted to mineral particles such as desert dust [15,16], this paper instead focuses mainly on the role of organic soiling on the PV module performance. Measurements were done in Alentejo, an ideal location for this type of study since this is the region with the highest pollen concentration in Portugal [17]. Pollen concentration is expected to increase in the next few decades in Europe [18], and that may imply more organic soiling in the future; thus, this is one more reason to study its impact on PV. In addition, studies of organic soiling are very scarce, making it an excellent study opportunity. An annual soiling analysis for the measurement location is also reported for the first time, as well as the soiling rates that develop during periods without rain, which are then related to the environment, through AOD, SEM imagery and image processing.
The structure of the paper is as follows: in Section 2 the experiment is explained, as well as the equipments and methodologies used to obtain the data. In Section 3 an analysis of the annual soiling, as well as soiling rates, is performed. The analysis considers rain and AOD, as the main variables to explain soiling behaviour. The effect of organic material in soiling is also highlighted in comparison to mineral material. In Section 4 the organic material deposited at the measuring location (through SEM images) is characterized in detail. Section 5 draws some conclusions.
2. Methodology
Mass accumulation measurements, as well as the PV performance measurements, took place in a rural location in the outskirts of Évora, in Alentejo (southern Portugal) at the Solar Colector Test Plataform (Plataforma de Ensaios de Coletores Solares, PECS) facilities from the Renewable Energies Chair (Catedra Energias Renovaveis, CER), University of Évora.
2.1. Mass Accumulation Experiment
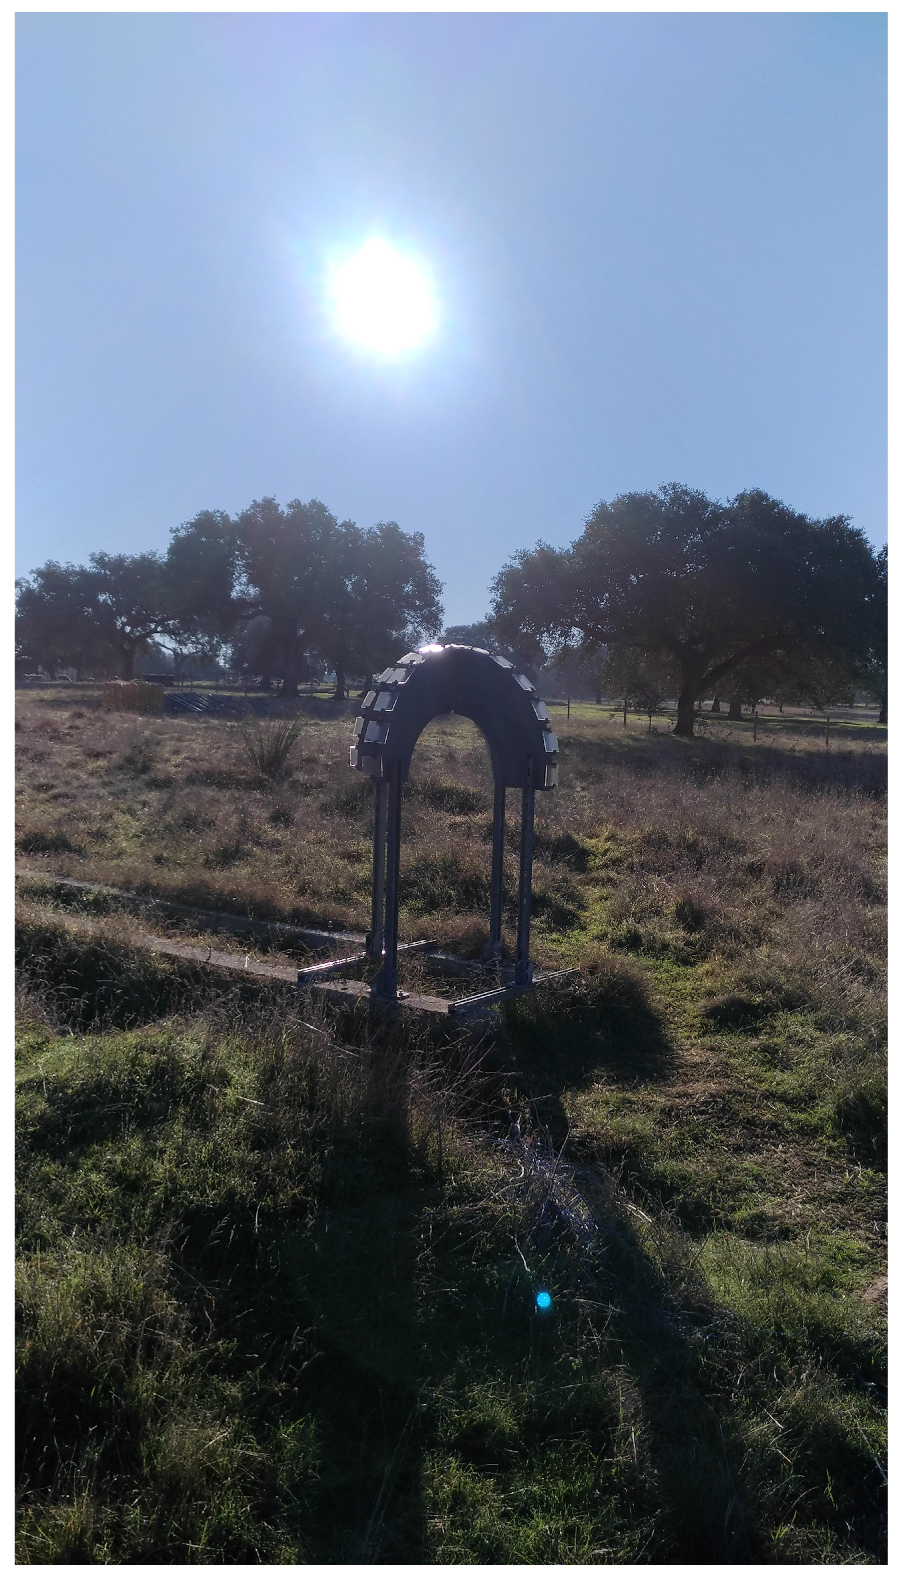
A glass tree, see Figure 1, was used. Inspired by [19], it is composed of 25 glass samples, with 6 per cardinal direction, in 15 inclination steps, with one completely horizontal, as shown in Figure 1. The glass samples are from Interfloat Corporation (Ruggel, Liechtenstein), model SINA (high solar transmittance and fine micropatterned glass suitable for flat-plate solar collectors and photovoltaic modules), with 11 by 9 cm (length × width) and 3.2 mm thickness. When possible, weekly mass measurements were performed on each of the 25 samples at PECS; however, aspects such as intense rain or vacations may introduce longer periods between measurements. Monthly Scanning Electron Microscopy (SEM) and Energy Dispersive X-ray Spectroscopy (EDS) measurements were carried out on the completely horizontal sample, except for in the month of August.
Each glass sample weight was measured with a Bosch SAE 80/200 microbalance (Germany), model SAE 80/200. Mass accumulation on week t, , is determined by subtracting from the measured mass at that week, , the initial mass of the clean glass, as in Equation (1):
No cleaning is done to the glasses during the experiment and only environmental action (e.g., rain, dew) can act towards reducing the mass accumulated on the samples.
2.2. PV Experiment
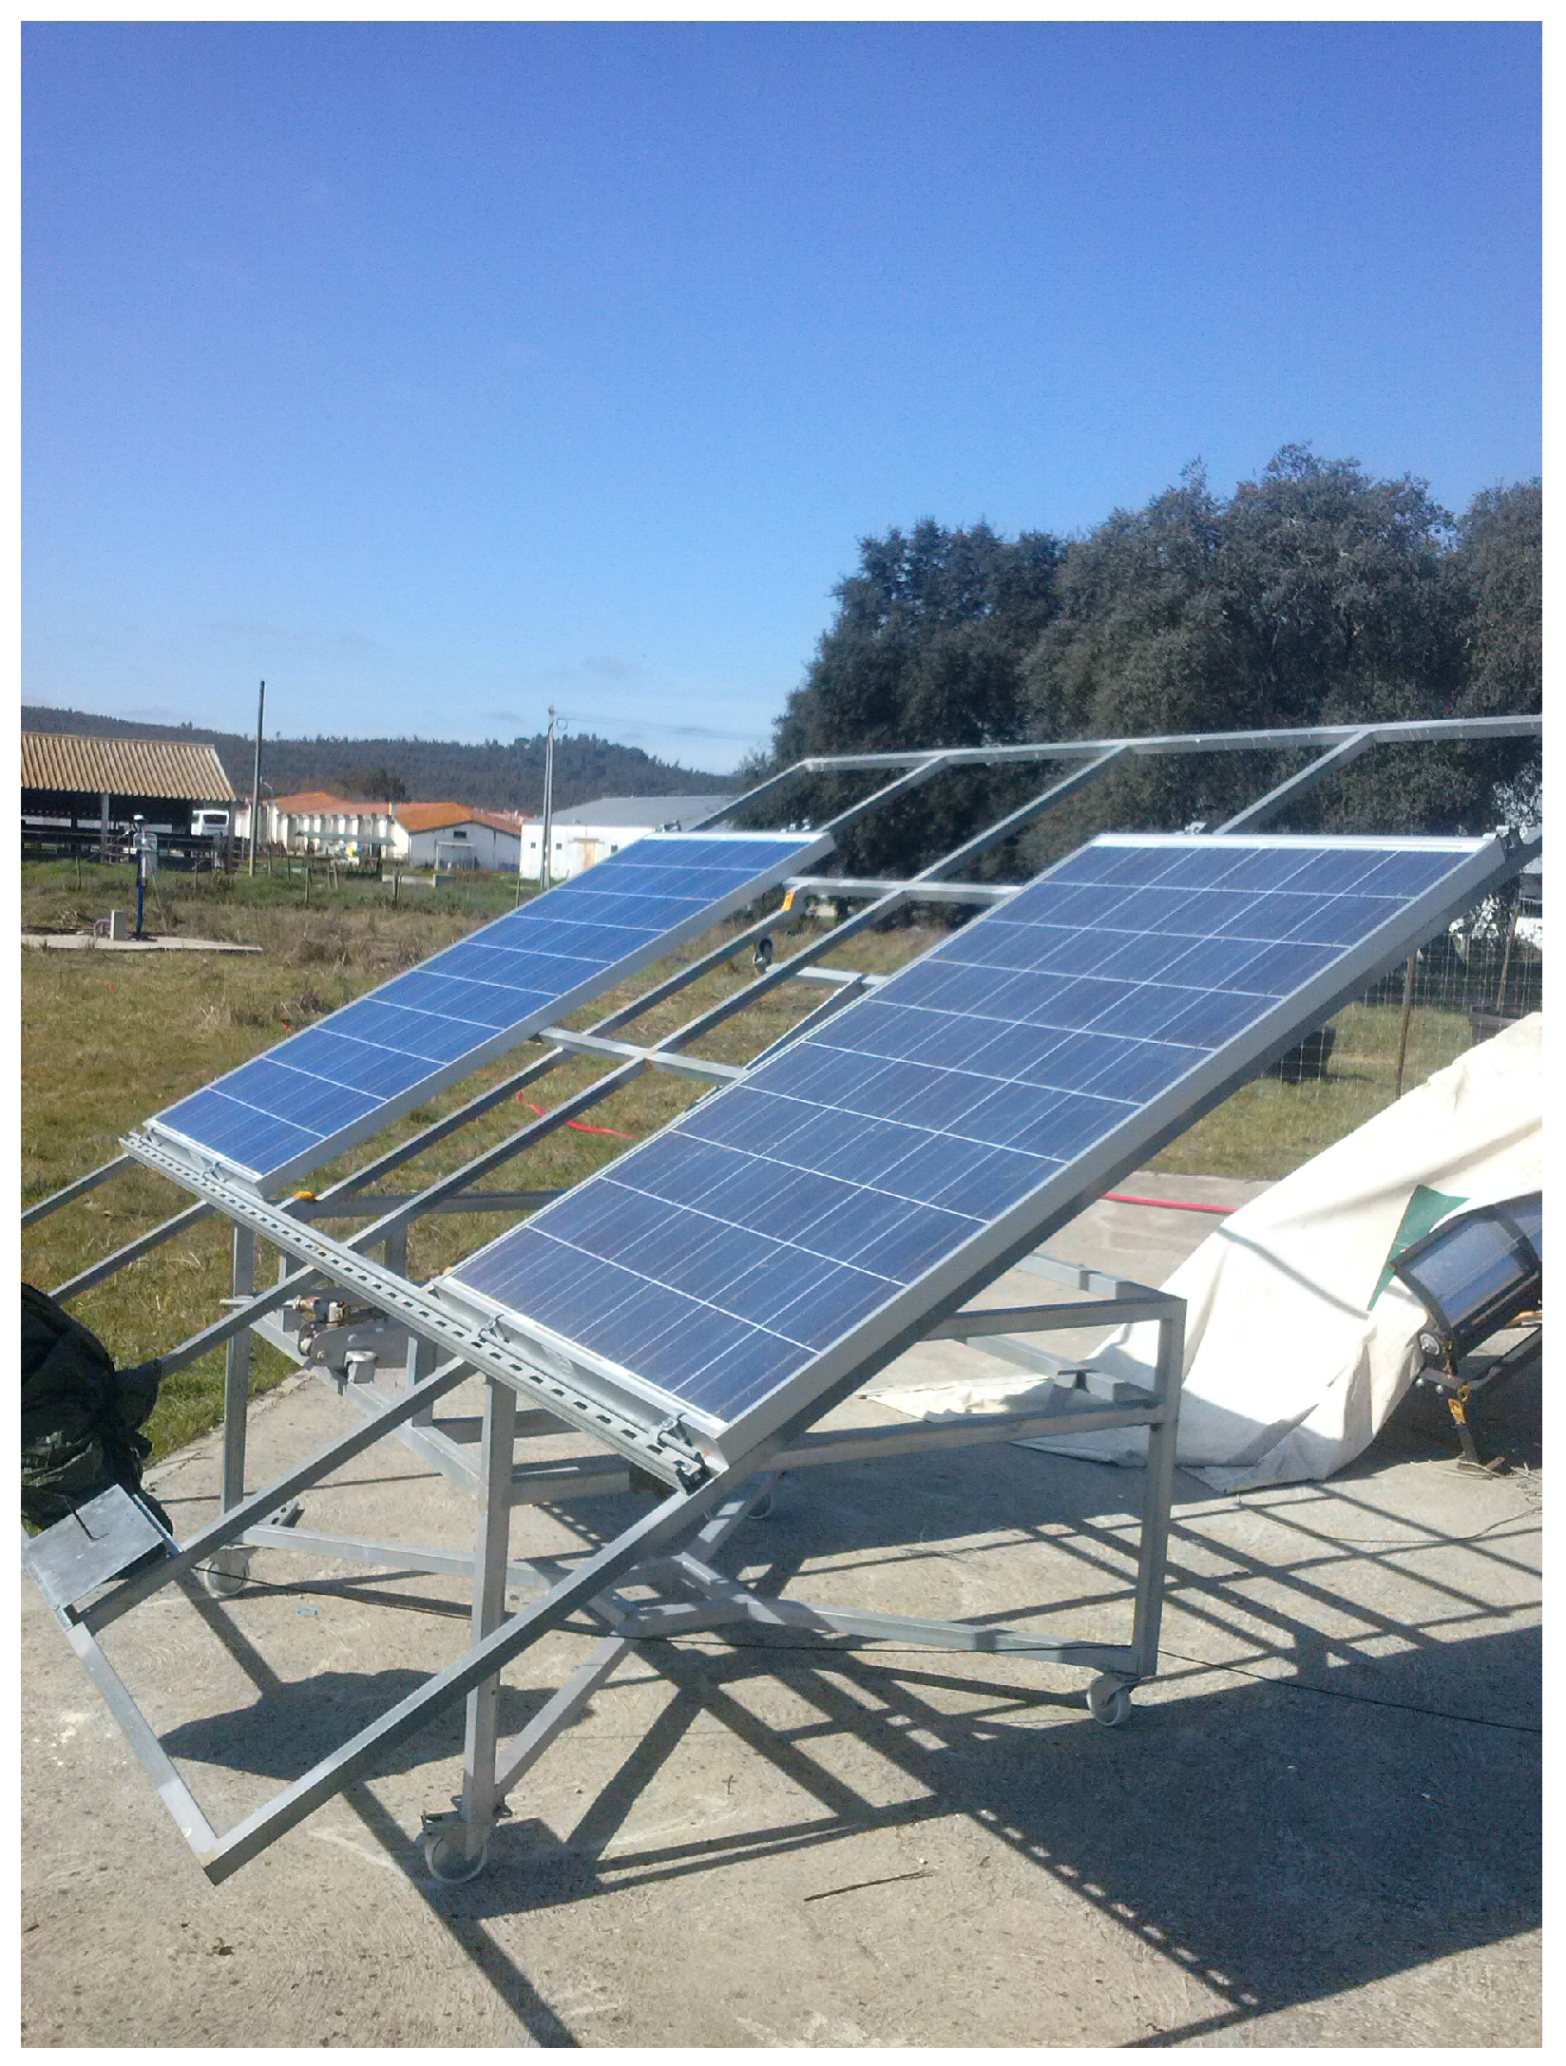
The PV system used, see Figure 2, is based on the methodology developed in [20], all measurements performed manually, with an I–V curve tracer from Metrel (Horjul, Slovenia), model Eurotest PV Lite MI 3109. Another difference is that instead of calculating the mean of the PV parameters for a static position along the day, the mean of three measurements is obtained with the normal to the PV pointing towards the sun, only in clear sky days and near solar noon. However, when not being measured, the PV panels were facing south with a tilt angle of around 30, a value close to the optimum tilt angle value for the highest annual performance in this region. The PV flat panels are mc-Si of the same model, FTS-220P, manufactured by Fluitecnik (Madrid, Spain). The clean reference PV panel is always cleaned before the measurements and the other one left to the effect of natural soiling, without any artificial cleaning.
The Soiling Ratio index (SR) can be calculated using two different metrics: based of the short-circuit current (), which is denominated () and the maximum power output (), designated () of the two PV panels. The main difference noted in [20] is the fact that when soiling is homogeneous, both metrics give similar results, but when the soiling is not homogeneous, calculating the soiling ratio based on the short circuit current can give either an underestimated or overestimated result, compared to what was actually lost in power output. This method works by comparing what is being currently measured, short-circuit or maximum power output, at some environment conditions with the value converted from Standard Test Conditions (STC), in a clean state, to those exact same conditions. In mathematical terms, and are calculated through Equations (2)–(4):
where is the short-circuit current of the dirty PV panel, is the short-circuit current at Standard Test Conditions (STC) of the soiled panel, is the short-circuit temperature correction coefficient, is the cell temperature of the soiled panel, is the temperature at reference condition (25 C), G is the irradiance in the PV plane and the irradiance at STC conditions (1000 W/m2).
where is the maximum power of the dirty PV panel, is the maximum power at clean condition and is the maximum power temperature correction coefficient. For the calculation of the irradiance in the PV plane, the clean module is used:
where is the short-circuit current of the clean PV panel, is the short-circuit current at STC of the clean panel, is the short-circuit temperature correction coefficient and is the cell temperature of the cleaned panel. As stated in [21], soiling ratios may be measured with absolute uncertainties on the order of ±1% or better on an absolute basis, under appropriate conditions. Measurements should be restricted to the middle portion of the day to exclude high uncertainties from morning and evening hours related to lower signal amplitudes and the effects of angular alignment differences, preferably averaging data for equal periods surrounding solar noon. As stated before, it is highlighted here that the measurements were only performed at clear sky conditions (to avoid any effects on the irradiance perceived by both solar panels due to passing clouds), near to solar noon and with the panels normal to the sun. This ensures that the experiment is performed under circumstances for which the uncertainty is the lowest.
3. Annual Soiling Characterization
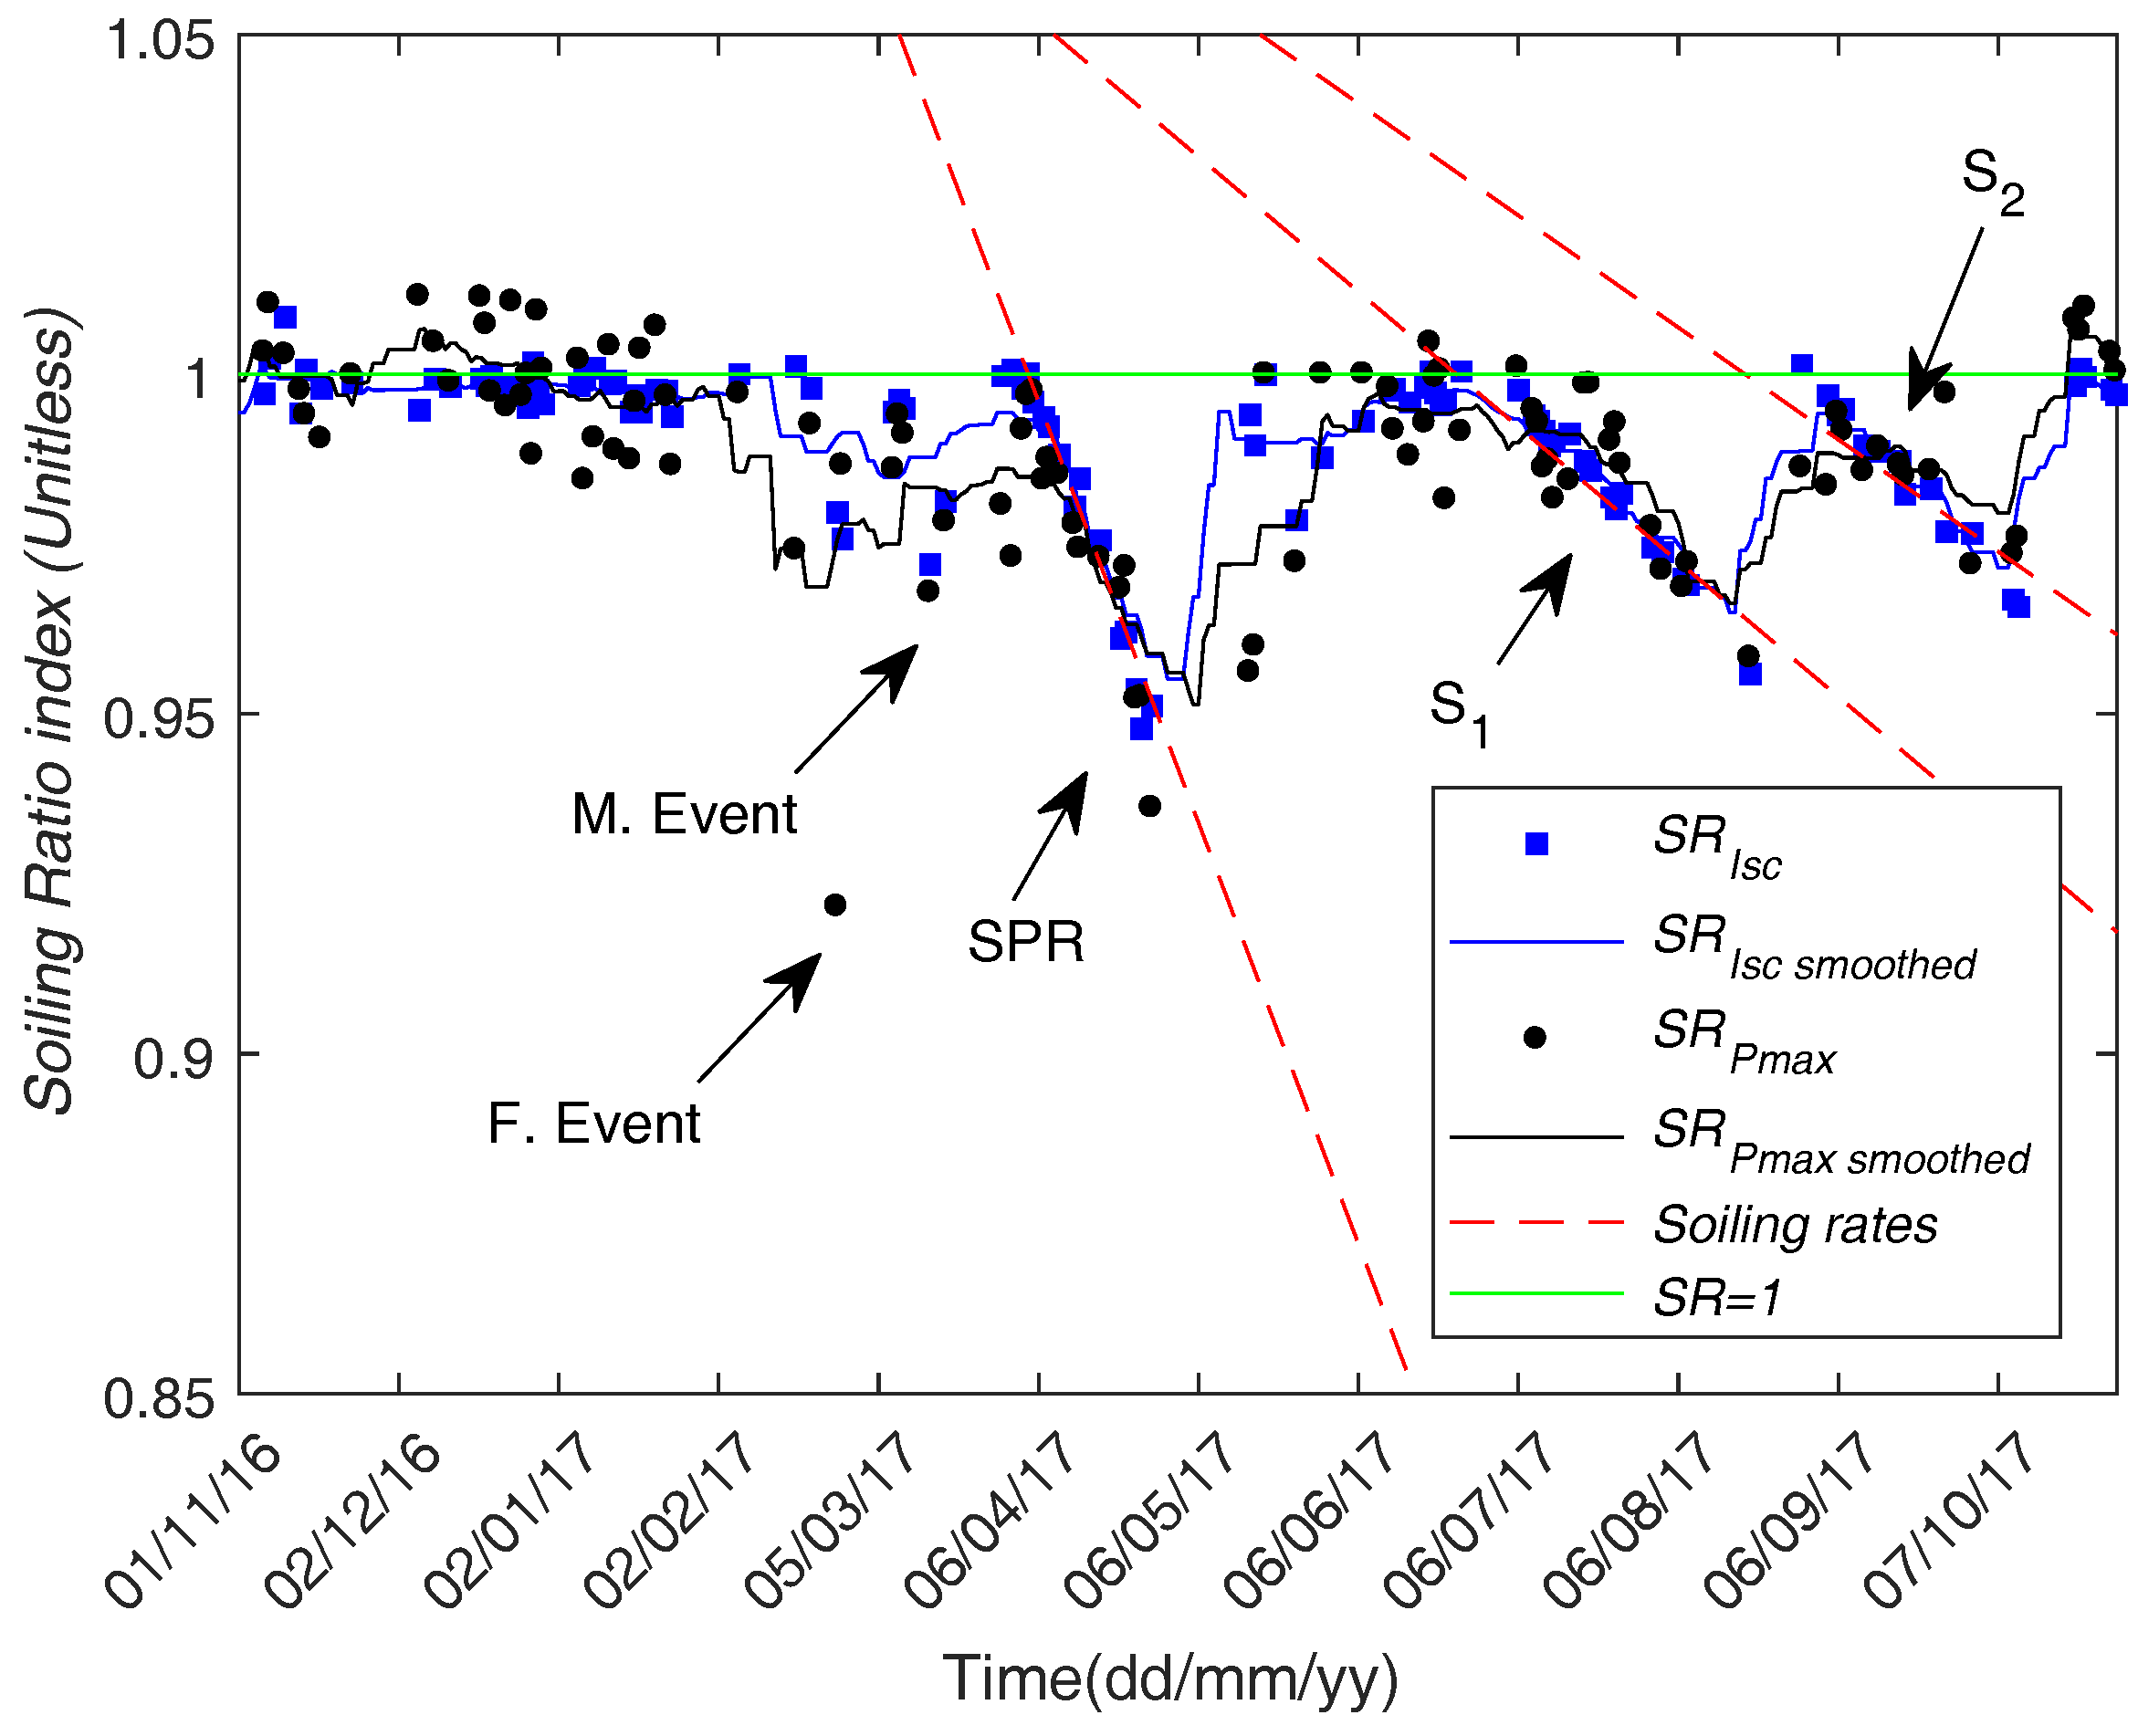
An annual series of soiling data for the region under study is reported here for the first time, with data ranging from 1 November 2016 to 31 October 2017, as presented in Figure 3. Soiling rates, , between periods without rain are shown as red dashed lines in this figure. To explain the observed soiling ratio and the respective soiling rates, rain is also added to the study, see Figure 4a and aerosol optical depth data, see Figure 4b. Rain as the main cleaning agent is very important, as well as the AOD, proxy of particle concentration in the atmosphere. Details on this analysis can be found in [5]. There are five evident cases in Figure 3: two long-range desert dust transportation events, one in February (denoted in Figure 3 as F. Event) and other in March (denoted as M. Event), with both events documented in [5], and three periods where the lack of rain, denoted as SPR (meaning spring), S and S, which led to a linear decrease in both SR metrics, marked with the red dashed line.
During fall and winter, because of frequent rain, soiling cannot accumulate in significant amounts on the glass surfaces, yielding SR metrics close to 1 as expected. The first major soiling event was in February, the F. Event, where a major quantity of Saharan dust was transported to southern Europe, mainly Portugal and Spain [5], leading to a decrease of ≈8% in (). The second one was in March, the M. Event, although with less intensity led to a decrease of ≈3% in both SR metrics. During spring, mainly April, denoted as SPR, there was an absence in rain, which allowed for organic material (confirmed below with complementary measurements to be mostly pollen) to deposit on the PV glass surfaces, leading to a decrease of 4.1% in both metrics, see Table 1. Note that since the soiling rates are per month, that also means that at the end of the month the losses are the same as the loss rates, since at the beginning of every event the panels were clean. However, heavy rain in the first part of May, was able to remove the accumulated soiling. In June, maintenance was done to the PV tracker and because of that the PV panels were cleaned, which resulted in two weeks without data coinciding with some rain. During July, the period denoted by S1, due to the scarce rain, soiling was able to settle, leading to a decrease of 1.9%. In August (vacation period), there were fewer data points at the end of the month. There was then a rainy day, which cleaned the PV panels, returning both metrics close to one. Due to the continued lack of rain during September, particles accumulated over the surface, leading to a decrease of 1.8%. After a heavy rain period in the beginning of October, the SR metrics recovered near to unity.
Analysis shows that, the February dust event is responsible for the highest loss registered; however, due to an increase of organic material, spring reveals itself as the second most important soiling case. Moderate March dust can be rated third, hand in hand with the soiling rates developed during summer.
The SR metrics decay was smoothed due to the noisy data derived from the reduced amount of data points [20]. In statistical terms, the values of , for the linear decay of the SR metrics are presented on Table 1; they are all above 0.9, which represent very high correlation values, while Root Mean Square Error (RMSE) values are always bellow 0.002. This fact ensures that not only are the soiling rates close to being linear, but they also enhance confidence in the results obtained for the Soiling Ratio.
Note that in Figure 4b, AOD data is in red and the smoothed data in black, which serves the purpose of being able to visualize the trends in AOD. It can be seen that the highest AOD was in February, due to the large dust event, while lower values are in March when the event with less intensity took place. After that, a peak in April can be seen, which is due to the increase in organic material in the atmosphere, with a more or less constant trend during the summer, until it starts to decay from September on. However, as stated before, due to rain in May, maintenance in June, lack of data and high rain at the end of August, soiling was only able to develop during summer. If these exceptions are ignored, it can be concluded that the soiling rates follow the same trend as the AOD and lack of rain. As a consequence it means that the AOD is working as particle concentration proxy. Higher AOD values, means there are more particles in the atmosphere, which increases the probability of a particle to be deposited on the surface, leading to higher PV performance losses. For further proof, see Figure 5, where represents the mass accumulation on the 30° tilted glass sample. Note that fast dust events are not well represented by this particular glass, probably probably due to the glass tree architecture. However, for periods without rain and continuous particle deposition it relates very well to the AOD and SR metrics.
It can be seen that the mass accumulation is higher during April, then July and lastly during September. This corroborates not only the soiling rates results, but also the use of AOD to explain such phenomena. Note again that, due to maintenance, the glasses had to be clean in the beginning of June, which is the reason why the mass accumulation is zero in that period.
As seen in the data of Figure 3 and Table 1, if the rain is scarce during the spring, the organic material (namely pollen as shown below) may induce very high soiling levels, even higher than mineral material. In the next section a descriptive analysis is given on the type of soiling found in SEM images from April and July.
4. Organic Material Characterization and Features
Organic material has been out of the scope of most of the known soiling studies, since they are absent or in very low quantities in desert areas, where most studies were and are still being done. However, Portugal is one of the places in Europe, which is not only affected by desert dust, e.g., Saharan long dust transport, but also by high amounts of pollen, mostly during spring. More specifically, the region of Alentejo is the one with the highest pollen concentration in Portugal as in [17]. The type of pollen in higher concentrations belong to the family of Gramineae, Oleaceae, Fagaceae, Pinaceae, Cupressaceae, Platanaeae, and Urticaceae, according to [22]. It is known that the locations far from the ocean coast and situated more to the south of the country are the ones with more pollen concentration. From [22] it is also known that pollen counts can roughly go from 3000 grains/m3 in January to 40,000 grains/m3 in May. Assuming that most of pollen species follow the trend of low values at night to high values towards the afternoon [23], there is a potential problem, since dew that forms during the night can hold pollen during the beginning of the day, when it had not yet evaporated. However, there are some types of pollen [24] that have their maximum concentration during the night, which, following the same logic, can also cause higher deposition in PV panels, if they get trapped by the dew water.
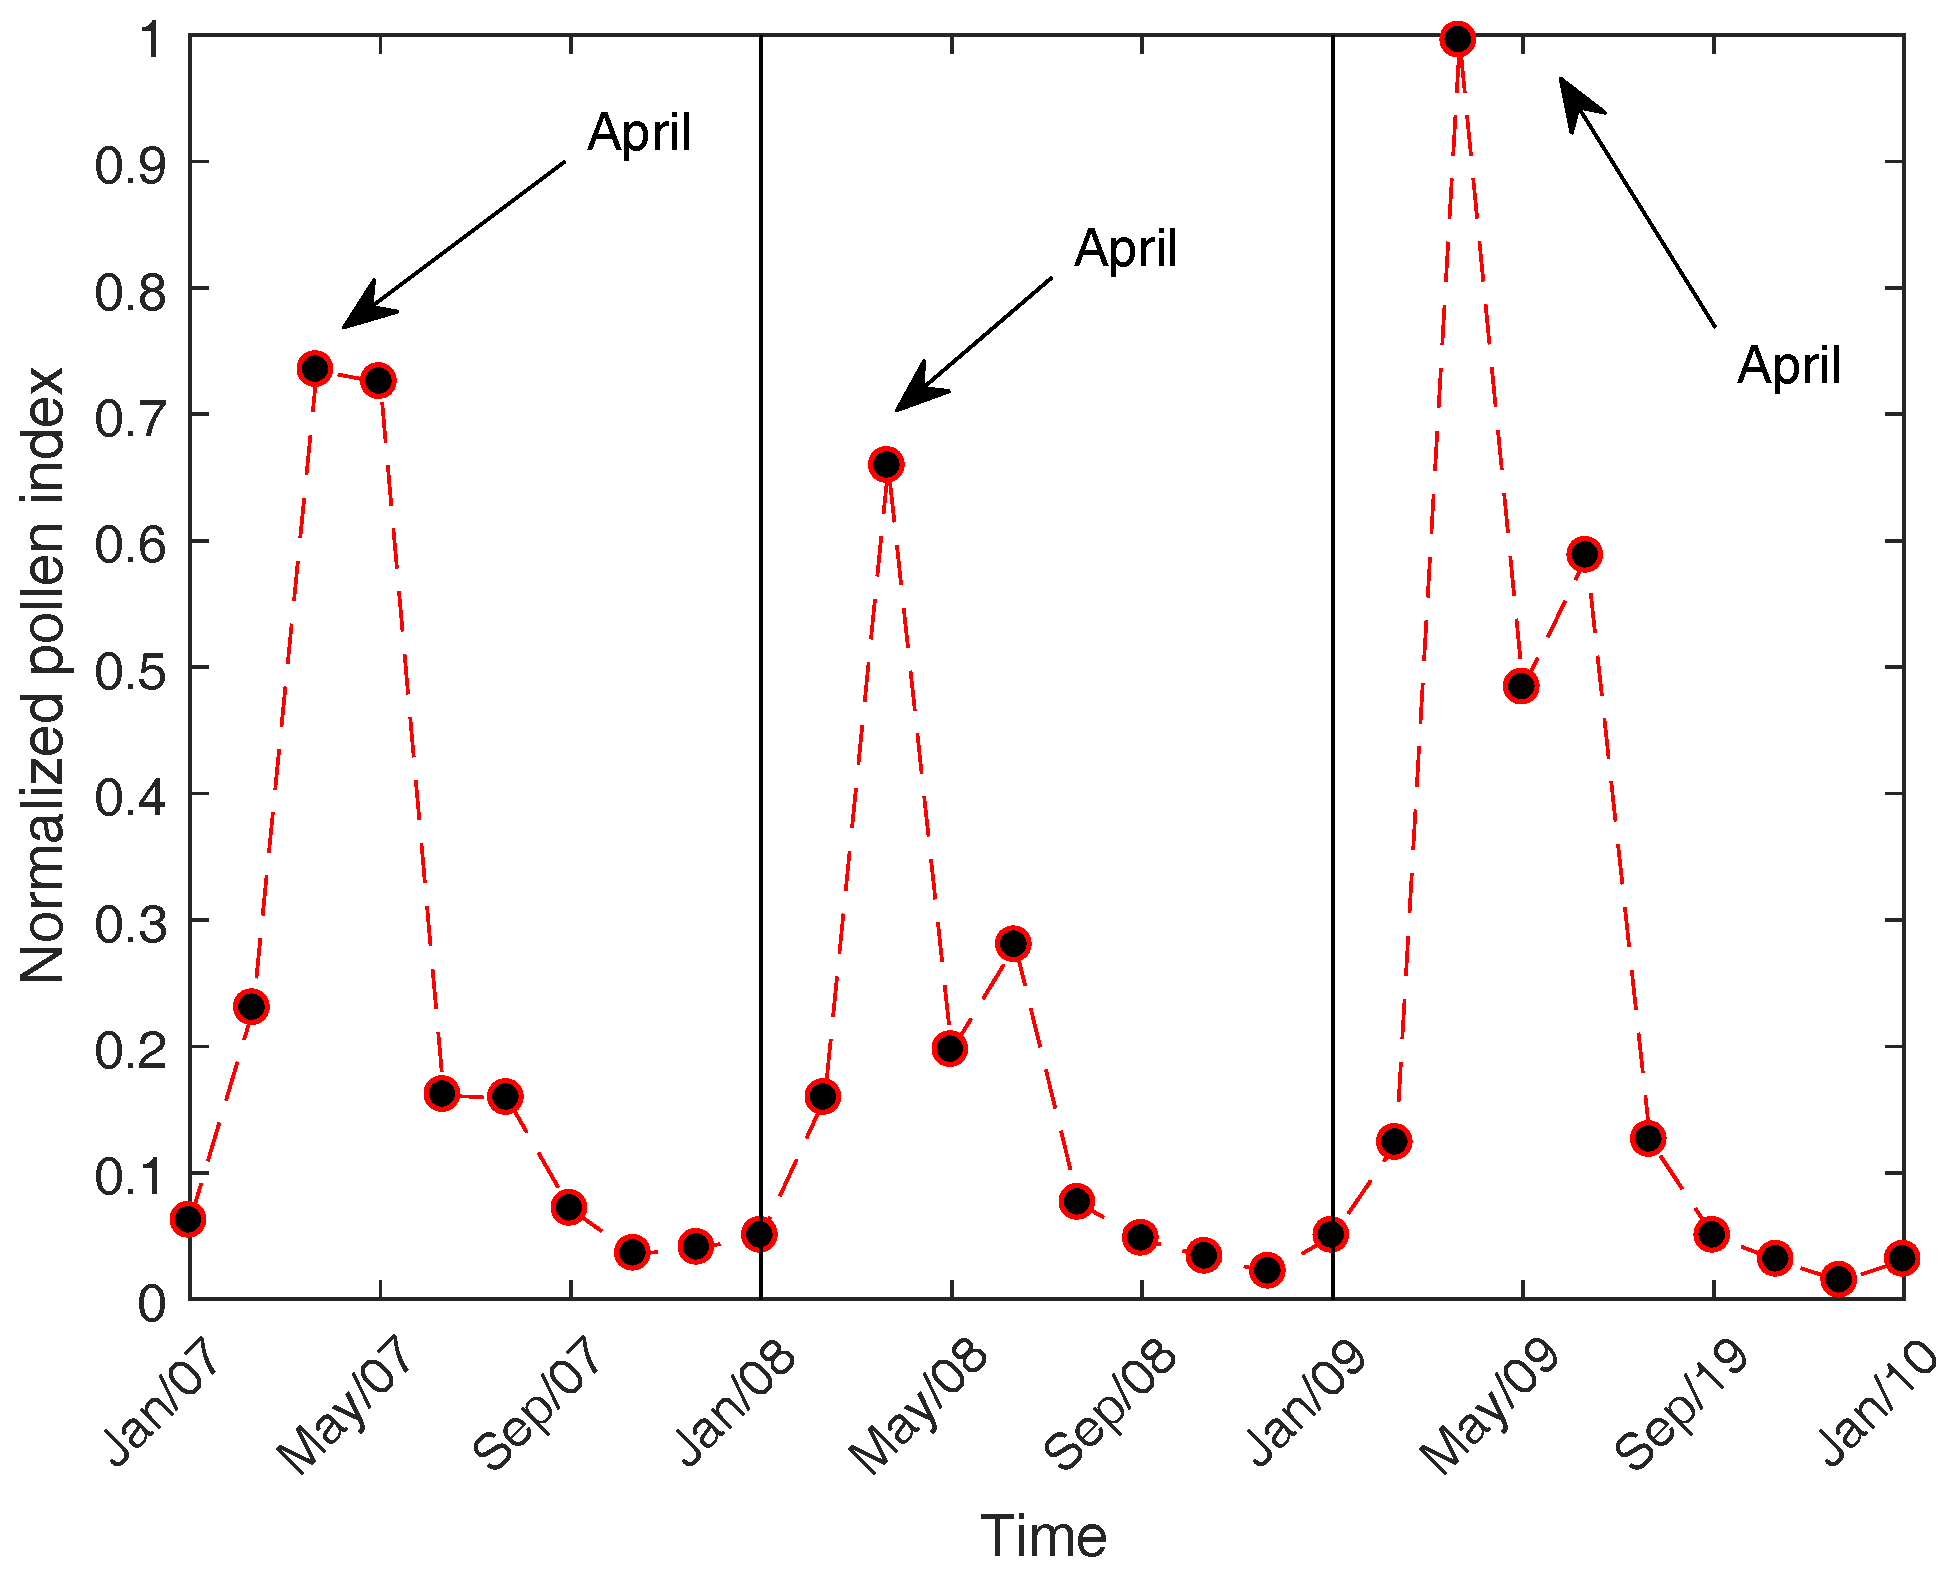
Also from 2007 to 2009, for some of the pollen species referred to before, total pollen count was calculated, in the city of Lisbon [25] and normalized, which can be seen in Figure 6. It is assumed that the trends in Évora and Lisbon are similar, mainly because they are not far apart (around 100 km). However, Évora should have substantially higher pollen count values. It can be seen that, from January to April/May, the tendency is to have an increasing amount of pollen, which then starts to decay until the end of the year. The fact that April has the highest concentration of pollen, together with the lack of rain can lead to a harsh decrease in the PV performance, corroborates what was seen before, Figure 3.
In spite of the already high pollen concentration, the prediction for the future is that the concentration of some species of pollen will increase, see [26]. This could make pollen (as a soiling agent) even more important in the future. This is reinforced by NASA Earth Exchange Global Daily Downscaled Projections for 2100, predicting less frequent rain for Portugal. If it indeed becomes a reality, it may not only be possible that soiling will have more time to build up on surfaces, but also the amount could be higher (mainly during the spring), which will eventually result in higher losses than the ones shown here.
SEM Characterization and Image Processing
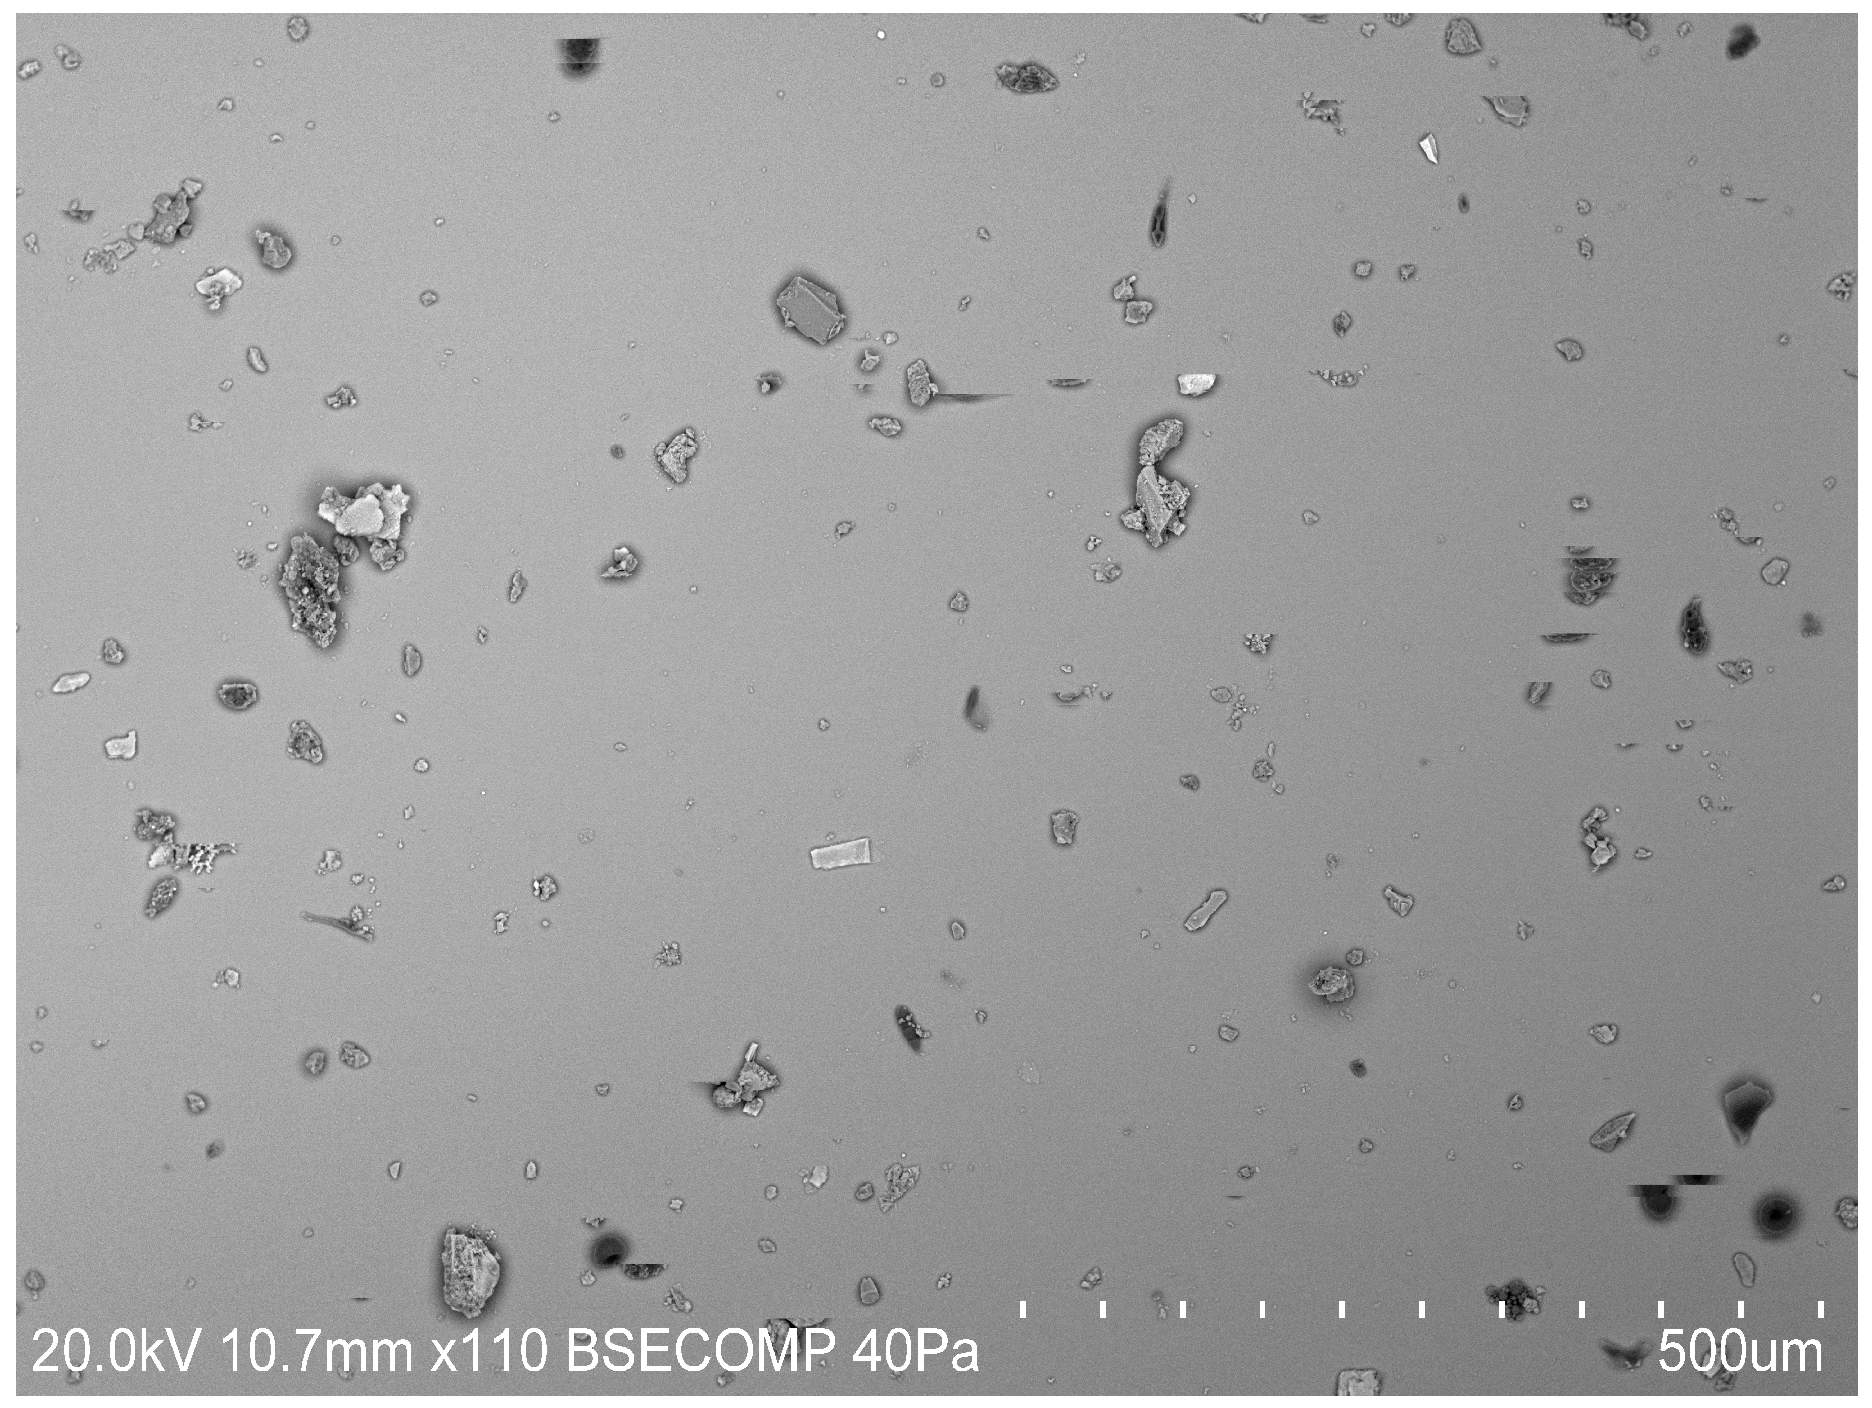
In order to have a deeper insight into what kind of organic and mineral material gets deposited on PV surface, SEM and EDS measurements were made to the central glass sample (with zero tilt angle) on the glass tree shown in Figure 1. The organic material found in the SEM was mainly pollen, which is shown in Figure 7.
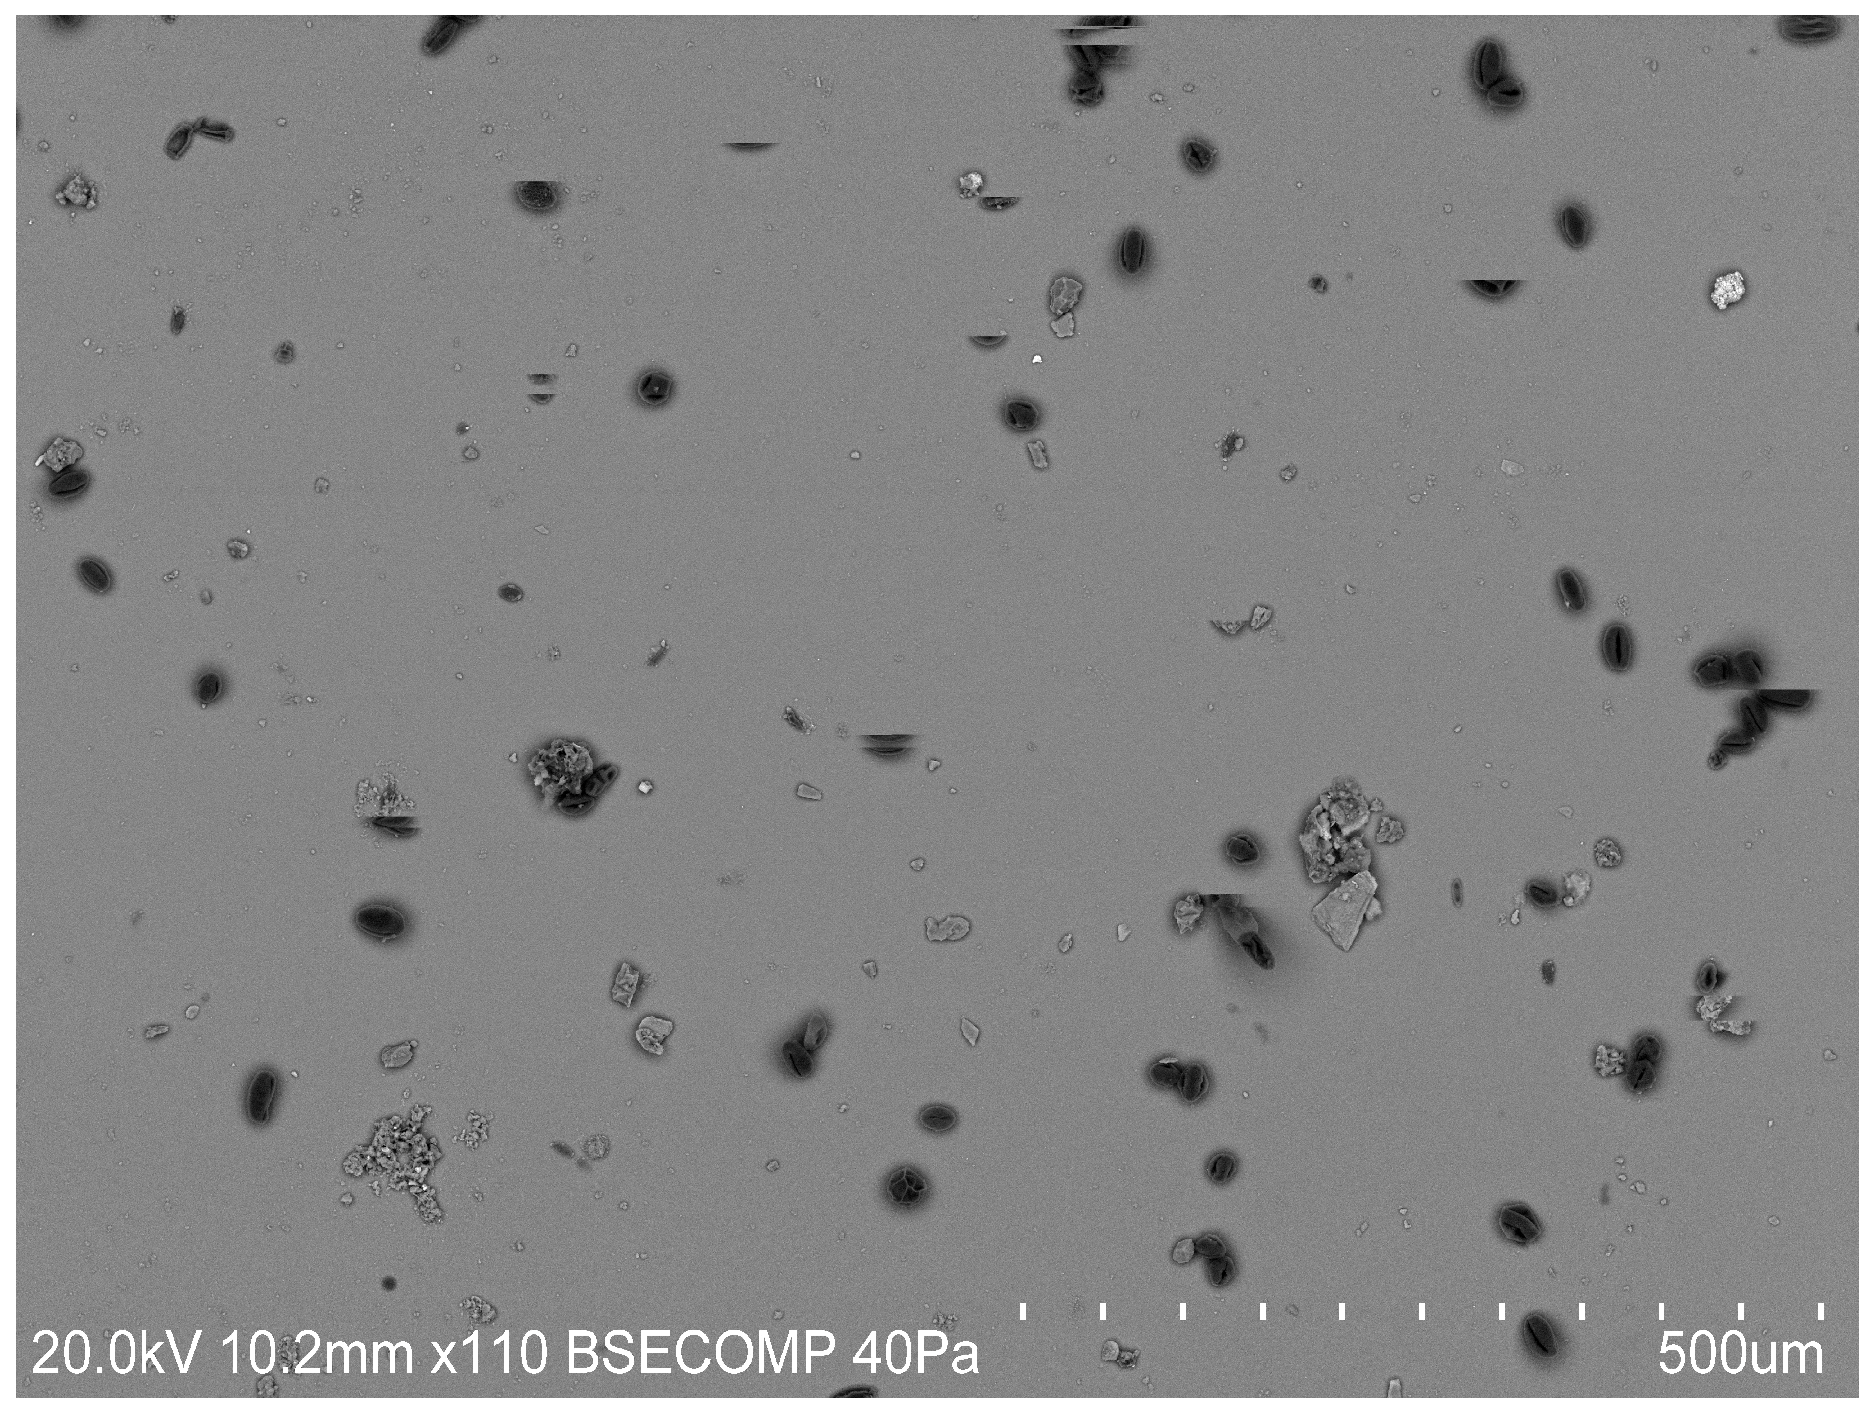
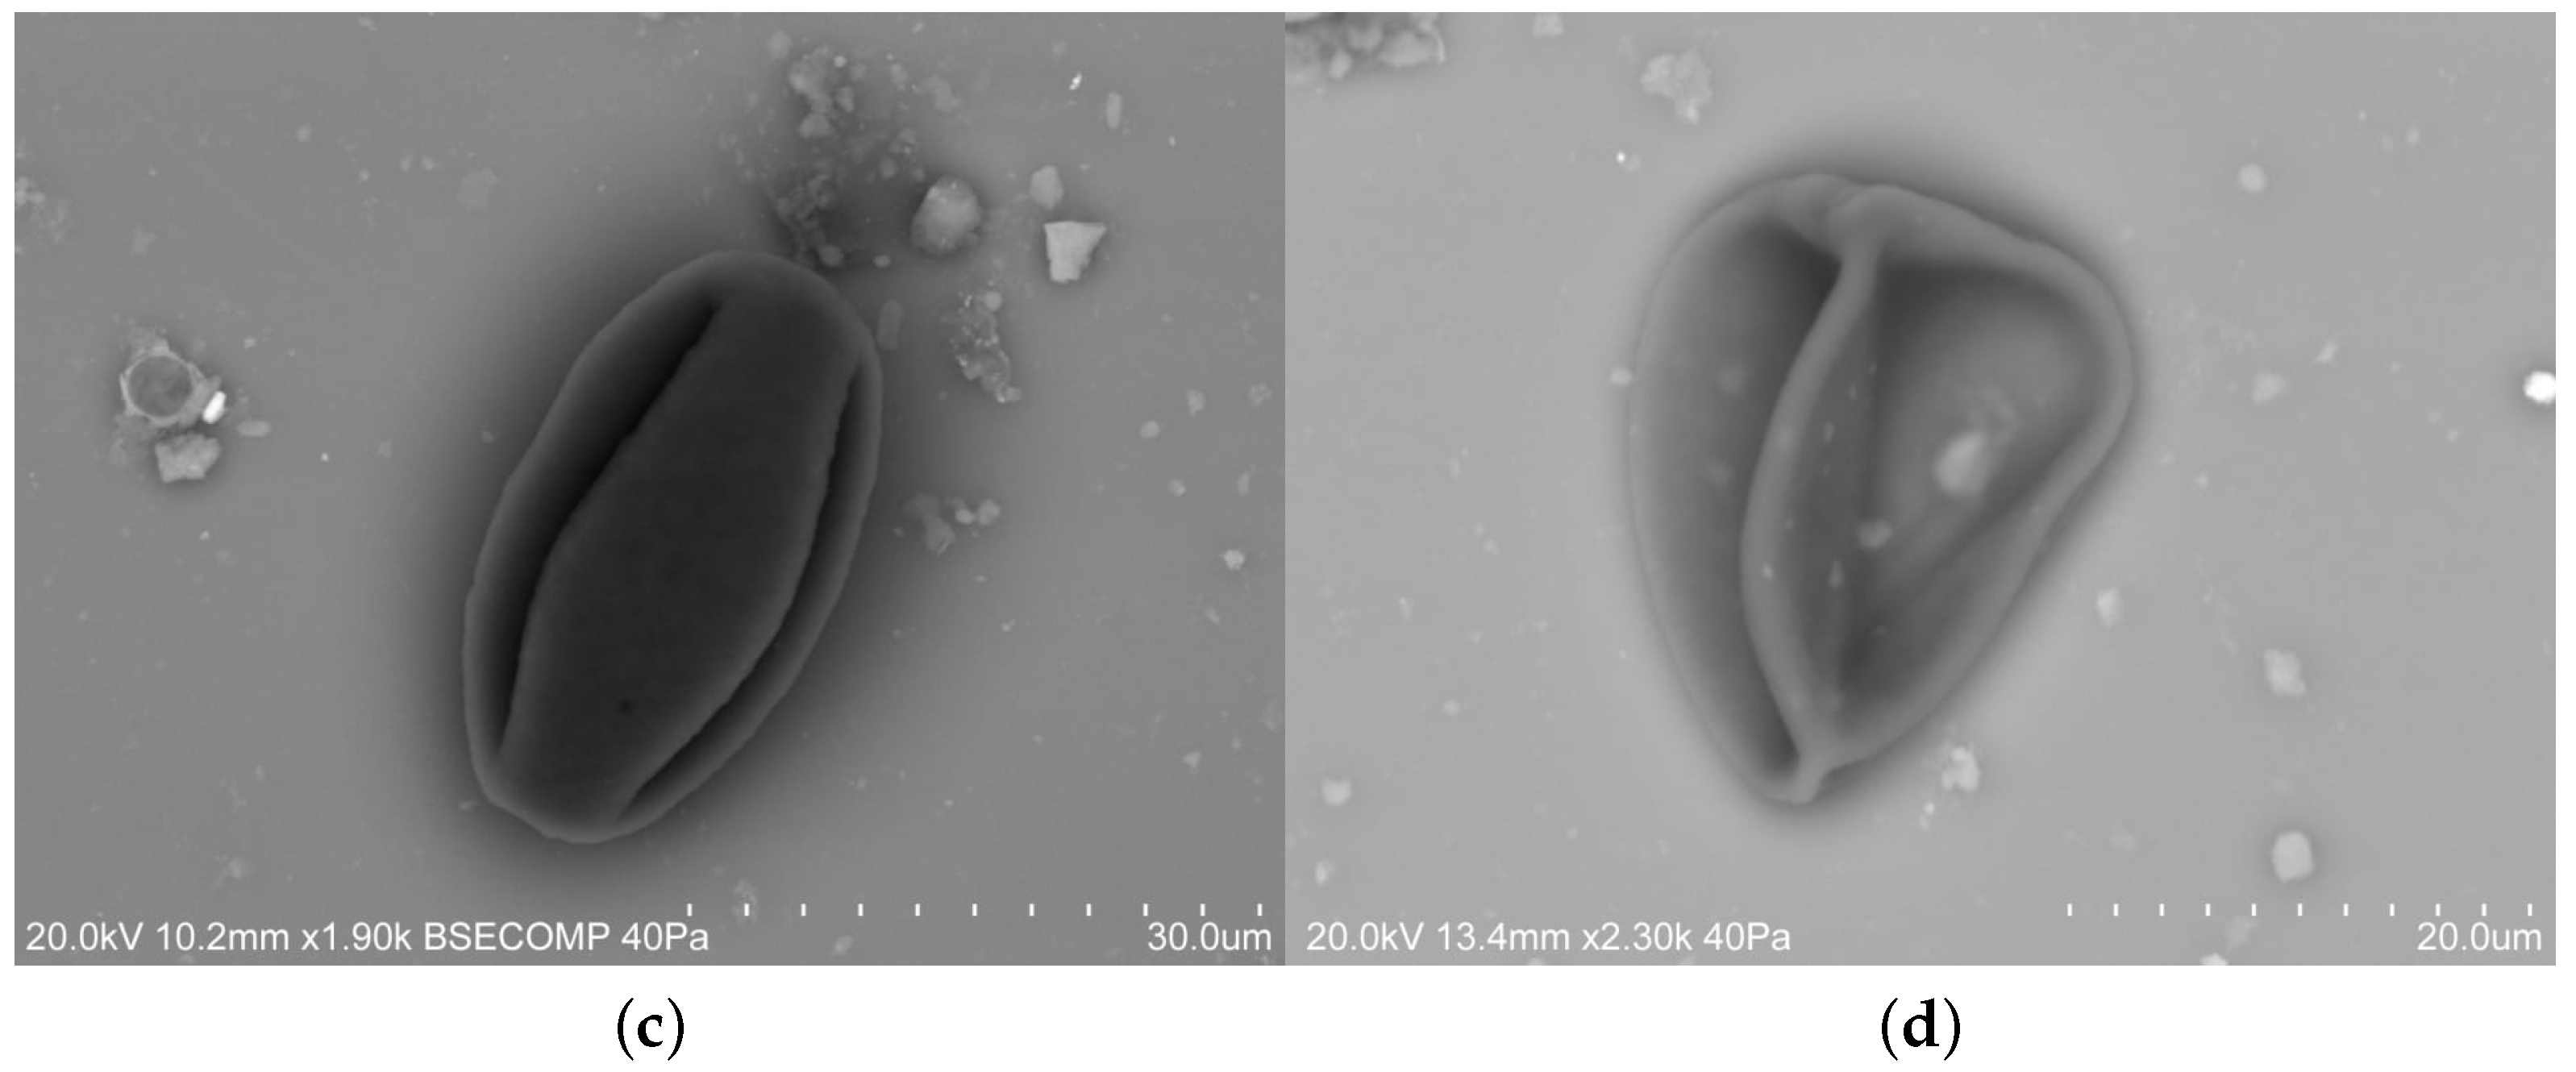
Different species were found as the Arecaceae in Figure 7a, Pinaceae in Figure 7b, Pinaceae in Figure 7b and Quercus sp in Figure 7c. The identification of the organic material in the SEM images, was made by the Portuguese Society of Aerobiology (Sociedade Portuguesa de Aerobiologia). From image observation, it can be seen that these pollen species tend to be geometrically spherical or elliptical. It can also be seen that they tend to be around 20 to 30 in diameter, if assumed spherical. For a better understanding of how the pollen affected PV performance during the spring and summer, the following SEM images are shown, one taken at April and other at July with the same magnification in Figure 8.
Using ImageJ, which is an open source image processing program (http://imagej.net), the following characteristics of the organic material, as well as all the material in the SEM images were found, see Table 2. The variable corresponds to the average diameter of the organic material (in black on the SEM images), is the average diameter of all the particles detected in the image, is the ratio percentage between the organic and all material present in the image, in terms of particle count, while is the ratio in percentage (in terms of area) between the organic and all material in the image.
The organic materials, which are essentially pollen, namely Quercus sp, have ≈ 20 diameter, which is in line with the size of that species in Figure 7c. When considering all the material in the sample, organic and mineral, the diameter drops to ≈ , which is expected, since mineral soiling tends to be smaller than pollen. In April, 33.8% of the particles present are organic material, while in July this figure is only 4.1%. This illustrates the difference, considering the number of particles, between these two different seasons in terms of soiling. Regarding the percentage ratio of area occupied by organic particles, 40.3% of the area occupied by all particles is occupied by organic soiling in April, while in July only 6.5%. From this data, it can be concluded, that organic material, namely pollen, deposits on surfaces during the spring at higher concentrations and due to its higher diameter it has relatively more impact than mineral soiling (smaller particles).
5. Conclusions
This study reveals that organic soiling can have a significant importance on the decrease of PV performance. It provides in depth insight in terms of deposited particle characterization. It describes the contents, shape and size of particles that build up on the top of surfaces with visual and chemical analysis, which can help in future studies for soiling modelling/prediction, since these characteristics are perhaps the most important ones to characterize soiling at microscopic scales. Soiling rates have been calculated and compared for different seasons of the year and highlight how spring and periods without rain can impact solar harvesting technologies. During spring, besides the mineral soiling that can be deposited, pollen at high concentration in the atmosphere also leads to PV module performance decrease. Furthermore, the periods without rain allow for the particles to build up, increasing the soiling over time, resulting in higher losses along that period. Due to this fact, it is possible to distinguish several soiling rates along the year. Soiling rates were analysed together with rain (the main cleaning agent) and AOD as a proxy for particle concentration, showing a good agreement. SEM imagery helped in the detection of organic soiling, namely pollen, which deposited on the PV modules increasing the background soiling seen during summer, which led to a greater module performance degradation. Note that these data may be helpful to determine cleaning schedules and for modelling purposes for future PV plants in the region.
Acknowledgments
Ricardo Conceição acknowledges the FCT scholarship SRFH/BD/116344/2016. Hugo G. Silva is grateful to DNI-ALENTEJO, INSHIP (H2020-LCE-2016-ERA) projects and COST Action CA16235, “PEARL PV”. This work is was funded by the European Union through the European Regional Development Fund, framed in COMPETE2020 (Operational Programme Competitiveness and Internationalisation) through the ICT Project (UID/GEO/04683/2013) with Reference POCI-01-0145-FEDER-007690. The authors are truly grateful to Elsa Caeiro from the Portuguese Society of Aerobiology for the information related with the pollen characterization.
Author Contributions
Ricardo Conceição has conducted the SEM sessions at Hercules Laboratory under the supervision and with the help of José Mirão. Ricardo Conceição and Hugo G. Silva have developed the experiments at PECS and shared the writing. The programming was done by Ricardo Conceição. Exhaustive revision of the final manuscript was done by Manuel Collares-Pereira. All authors read and approved the final manuscript.
Conflicts of Interest
The authors declare no conflict of interest.
References
- Garg, H.P. Effect of dirt on transparent covers in flat-plate solar energy collectors. Sol. Energy 1974, 15, 299–302. [Google Scholar] [CrossRef]
- El-Shobokshy, M.S.; Hussein, F.M. Effect of dust with different physical properties on the performance of photovoltaic cells. Sol. Energy 1993, 51, 505–511. [Google Scholar] [CrossRef]
- Hassan, A.; Rahoma, U.A.; Elminir, H.K.; Fathy, A.M. Effect of airborne dust concentration on the performance of PV modules. J. Astron. Soc. Egypt 2005, 13, 24–38. [Google Scholar]
- Maghami, M.R.; Hizam, H.; Gomes, C.; Radzi, M.A.; Rezadad, M.I.; Hajighorbani, S. Power loss due to soiling on solar panel. Renew. Sustain. Energy Rev. 2016, 59, 1307–1316. [Google Scholar] [CrossRef]
- Conceição, R.; Silva, H.; Mirão, J.; Gostein, M.; Fialho, L.; Narvarte, L.; Collares-Pereira, M. Saharan dust transport to Europe and its impact on photovoltaic performance: A case study of soiling in Portugal. Sol. Energy 2018, 160, 94–102. [Google Scholar] [CrossRef]
- Figgis, B.; Ennaoui, A.; Ahzi, S.; Rémond, Y. Review of PV soiling particle mechanics in desert environments. Renew. Sustain. Energy Rev. 2017, 76, 872–881. [Google Scholar] [CrossRef]
- Figgis, B.; Ennaoui, A.; Guo, B.; Javed, W.; Chen, E. Outdoor soiling microscope for measuring particle deposition and resuspension. Sol. Energy 2016, 137, 158–164. [Google Scholar] [CrossRef]
- Alnaser, N.W.; Al Othman, M.J.; Dakhel, A.A.; Batarseh, I.; Lee, J.K.; Najmaii, S.; Alothman, A.; Al Shawaikh, H.; Alnaser, W.E. Comparison between performance of man-made and naturally cleaned PV panels in a middle of a desert. Renew. Sustain. Energy Rev. 2018, 82, 1048–1055. [Google Scholar] [CrossRef]
- Šúri, M.; Huld, T.A.; Dunlop, E.D.; Ossenbrink, H.A. Potential of solar electricity generation in the European Union member states and candidate countries. Sol. Energy 2007, 81, 1295–1305. [Google Scholar] [CrossRef]
- Lopes, F.; Silva, H.; Salgado, R.; Cavaco, A.; Canhoto, P.; Collares-Pereira, M. Short-term ECMWF Forecasts of Solar Irradiance for Solar Energy Systems Validated in Southern Portugal. Sol. Energy. Submitted.
- Silva, H.G.; Lopes, F.M.; Pereira, S.; Nicoll, K.; Barbosa, S.M.; Conceição, R.; Neves, S.; Harrison, R.G.; Collares Pereira, M. Saharan dust electrification perceived by a triangle of atmospheric electricity stations in Southern Portugal. J. Electrost. 2016, 84, 106–120. [Google Scholar] [CrossRef]
- Stridh, B. Evaluation of economical benefit of cleaning of soiling and snow in PV plants at three European locations. In Proceedings of the IEEE Photovoltaic Specialists Conference, Austin, TX, USA, 3–8 June 2012; pp. 1448–1451. [Google Scholar]
- Appels, R.; Lefevre, B.; Herteleer, B.; Goverde, H.; Beerten, A.; Paesen, R.; De Medts, K.; Driesen, J.; Poortmans, J. Effect of soiling on photovoltaic modules. Sol. Energy 2013, 96, 283–291. [Google Scholar] [CrossRef]
- Naeem, M.; Tamizhmani, G. Climatological relevance to the soiling loss of photovoltaic modules. In Proceedings of the 2015 Saudi Arabia Smart Grid, Jeddah, Saudi Arabia, 7–9 Dcember 2016; pp. 1–5. [Google Scholar]
- Aïssa, B.; Isaifan, R.J.; Madhavan, V.E.; Abdallah, A.A. Structural and physical properties of the dust particles in Qatar and their influence on the PV panel performance. Sci. Rep. 2016, 6, 1–12. [Google Scholar] [CrossRef] [PubMed]
- Olivares, D.; Ferrada, P.; Matos, C.D.; Marzo, A.; Cabrera, E.; Portillo, C.; Llanos, J. Characterization of soiling on PV modules in the Atacama Desert. Energy Procedia 2017, 124, 547–553. [Google Scholar] [CrossRef]
- Caeiro, E.; Brandão, R.; Carmo, S.; Lopes, L.; de Almeida, M.M.; Gaspar, Â.; Oliveira, J.F.; Todo-Bom, A.; Leitã, T.; Nunes, C. Rede Portuguesa de Aerobiologia: Resultados da monitorização do pólen. Rev Port Imunoalergologia 2007, 15, 235–250. [Google Scholar]
- Hamaoui-Laguel, L.; Vautard, R.; Liu, L.; Solmon, F.; Viovy, N.; Khvorostyanov, D.; Essl, F.; Chuine, I.; Colette, A.; Semenov, M.A.; et al. Effects of climate change and seed dispersal on airborne ragweed pollen loads in Europe. Nat. Clim. Chang. 2015, 5, 766–771. [Google Scholar] [CrossRef]
- Elminir, H.K.; Ghitas, A.E.; Hamid, R.H.; El-Hussainy, F.; Beheary, M.M.; Abdel-Moneim, K.M. Effect of dust on the transparent cover of solar collectors. Energy Convers. Manag. 2006, 47, 3192–3203. [Google Scholar] [CrossRef]
- Gostein, M.; Duster, T.; Thuman, C. Accurately measuring PV soiling losses with soiling station employing module power measurements. In Proceedings of the 2015 IEEE 42nd hotovoltaic Specialists Conference, New Orleans, LA, USA, 14–19 June 2015; pp. 3–7. [Google Scholar]
- Dunn, L.; Littmann, B.; Caron, J.R.; Gostein, M. PV module soiling measurement uncertainty analysis. In Proceedings of the 2013 IEEE 39th Photovoltaic Specialists Conference, Tampa, FL, USA, 16–21 June 2013; pp. 658–663. [Google Scholar]
- Todo-bom, A.; Brandão, R.; Nunes, C.; Caeiro, E.; Leitão, T.; Oliveira, J.F.; de Almeida, M.M. Allergenic airborne pollen in Portugal 2002–2004. Rev Port Imunoalergologia 2006, 14, 41–49. [Google Scholar]
- Alcázar, P.; Galán, C.; Cariñanos, P.; Domínguez-Vilches, E. Diurnal variation of airborne pollen at two different heights. J. Investig. Allergol. Clin. Immunol. 1999, 9, 89–95. [Google Scholar] [PubMed]
- Grewling, L.; Bogawski, P.; Smith, M. Pollen nightmare: Elevated airborne pollen levels at night. Aerobiologia 2016, 32, 725–728. [Google Scholar] [CrossRef] [PubMed]
- Marques, G.; Martins, C.; Belo, J.; Alves, C.; Paiva, M.; Caeiro, E.; Leiria-Pinto, P. Pollen Counts Influence Web Searches for Asthma and Rhinitis. J. Investig. Allergol. Clin. Immunol. 2016, 26, 192–194. [Google Scholar]
- Albertine, J.M.; Manning, W.J.; Da Costa, M.; Stinson, K.A.; Muilenberg, M.L.; Rogers, C.A. Projected carbon dioxide to increase grass pollen and allergen exposure despite higher ozone levels. PLoS ONE 2014, 9, 1–6. [Google Scholar] [CrossRef] [PubMed] [Green Version]
Figure 1.
Glass tree apparatus in Solar Colector Test Plataform (PECS).

Figure 2.
PV apparatus in PECS.

Figure 3.
Soiling ratio and rates.

Figure 4.
Environmental measurements: (a) rain; (b) aerosol optical depth.
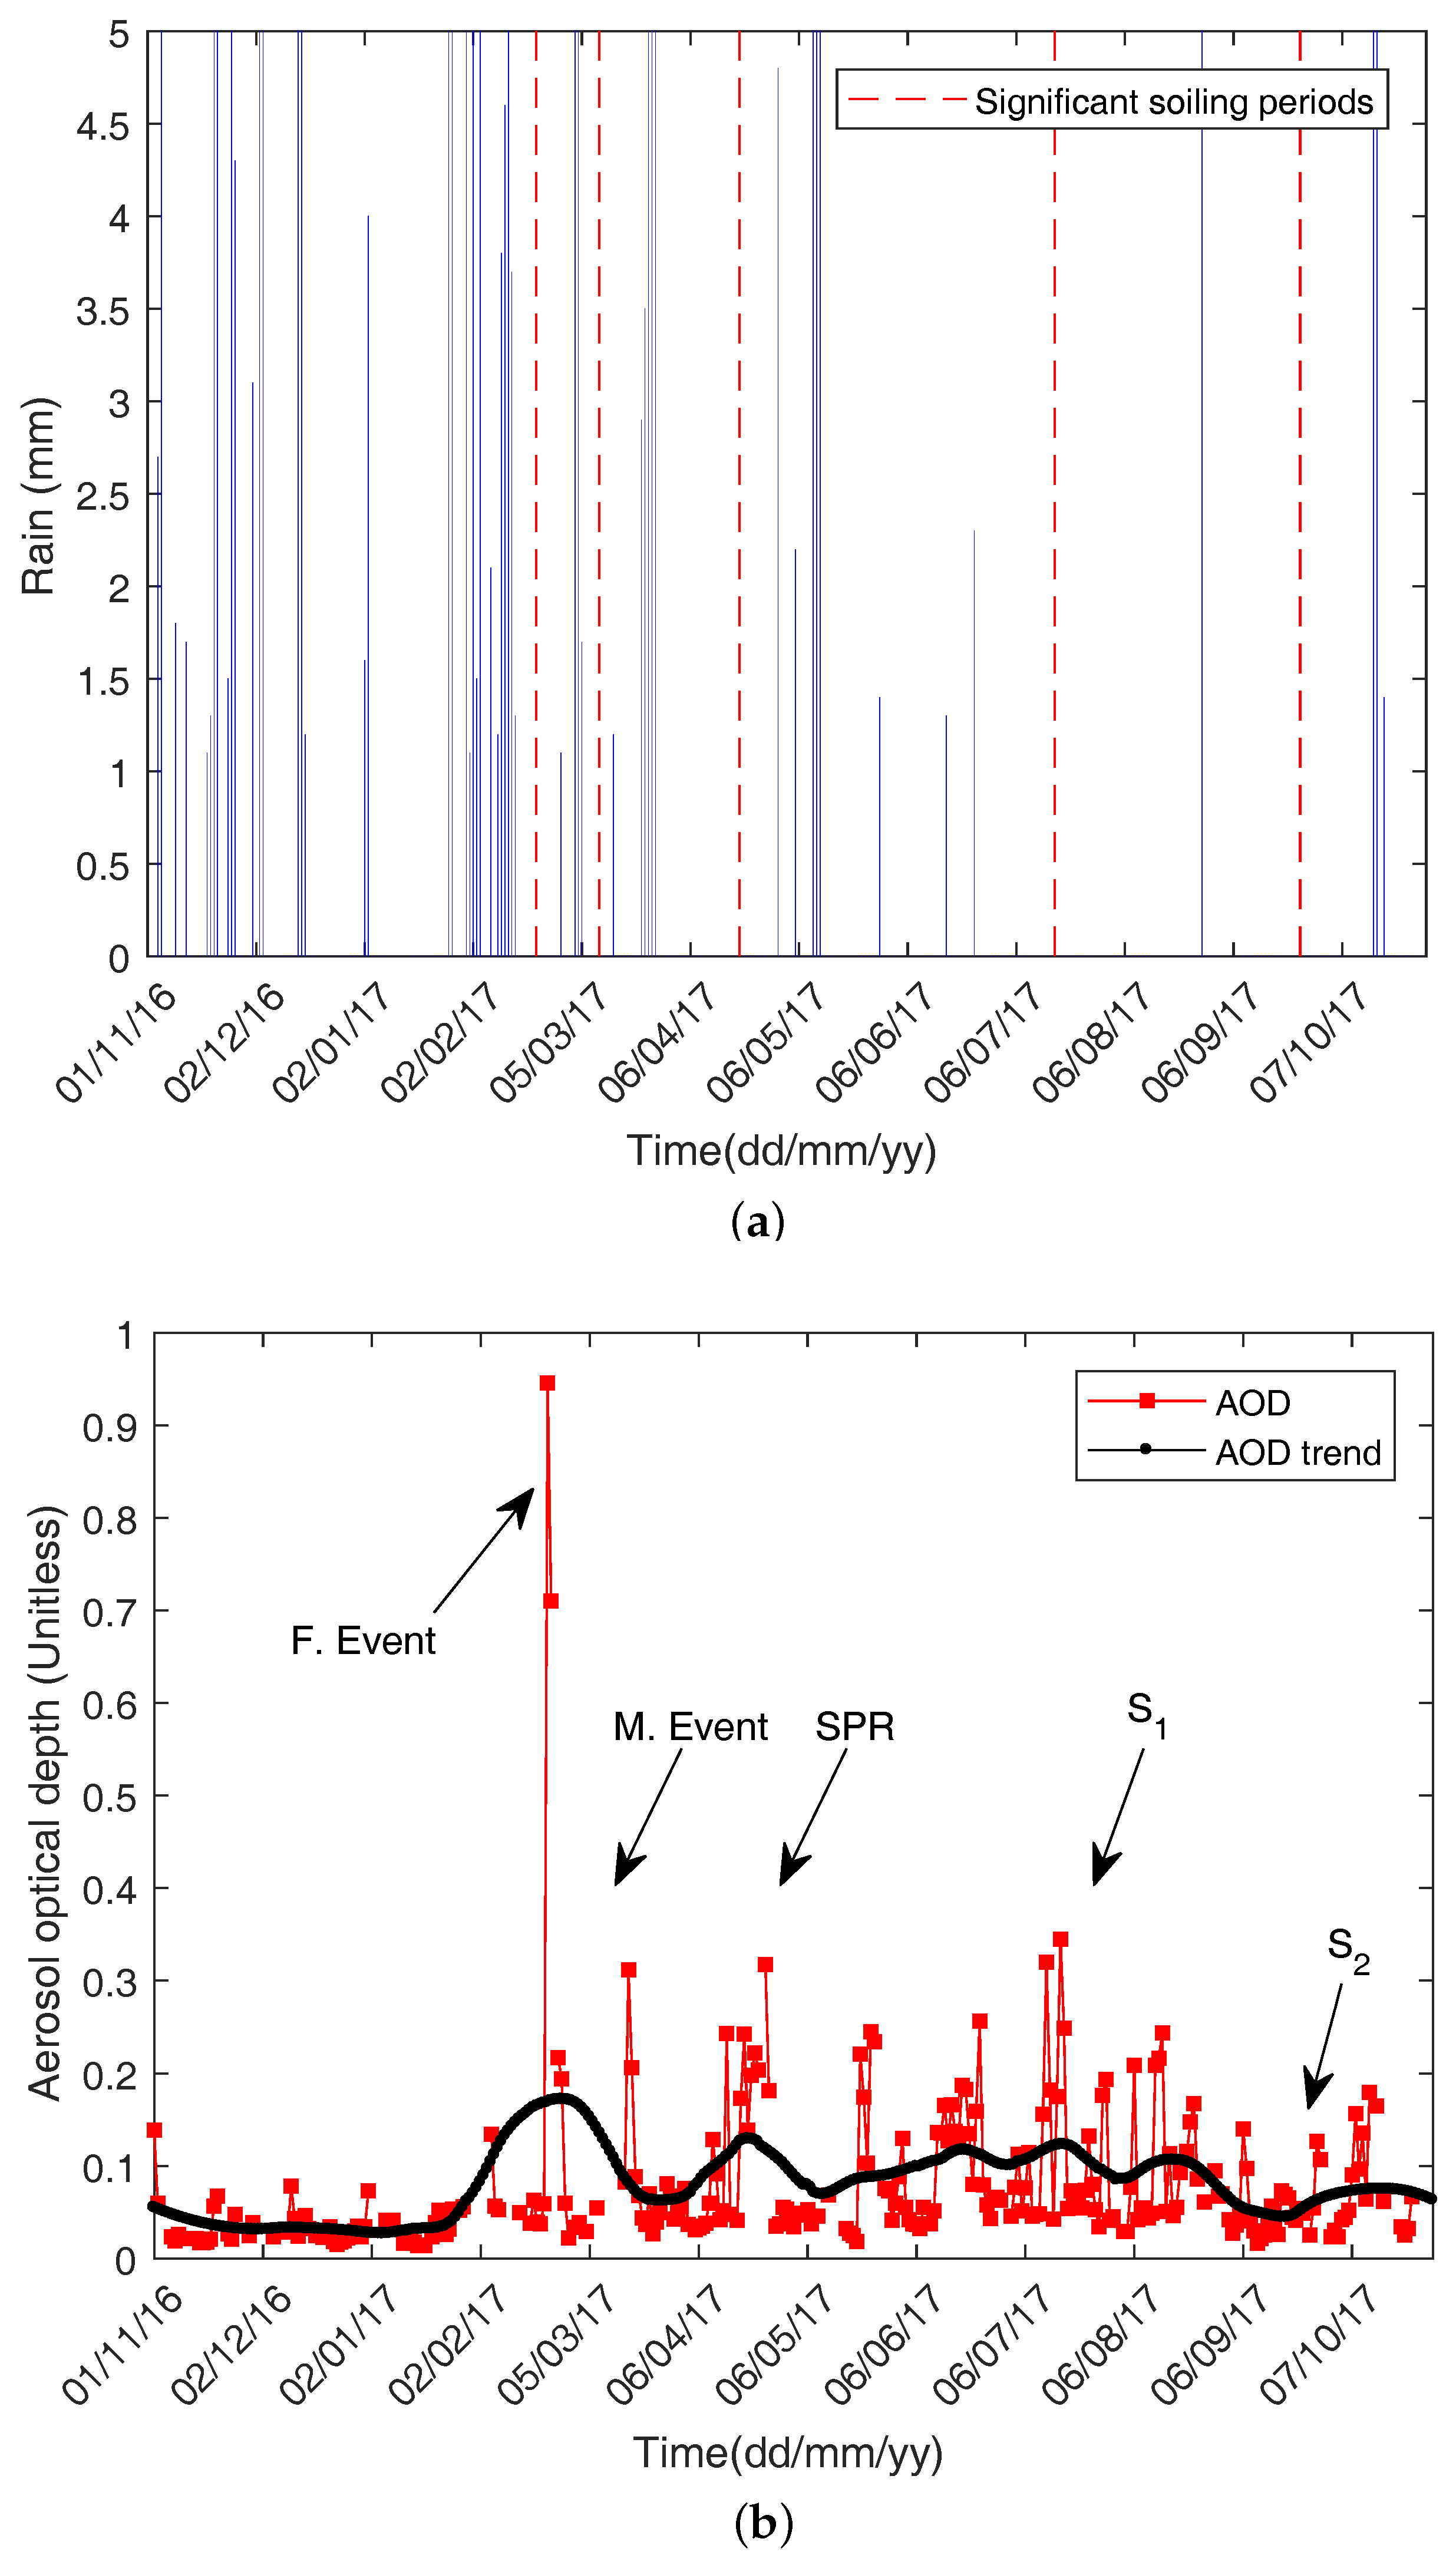
Figure 5.
Mass accumulation on 30° tilted glass sample.
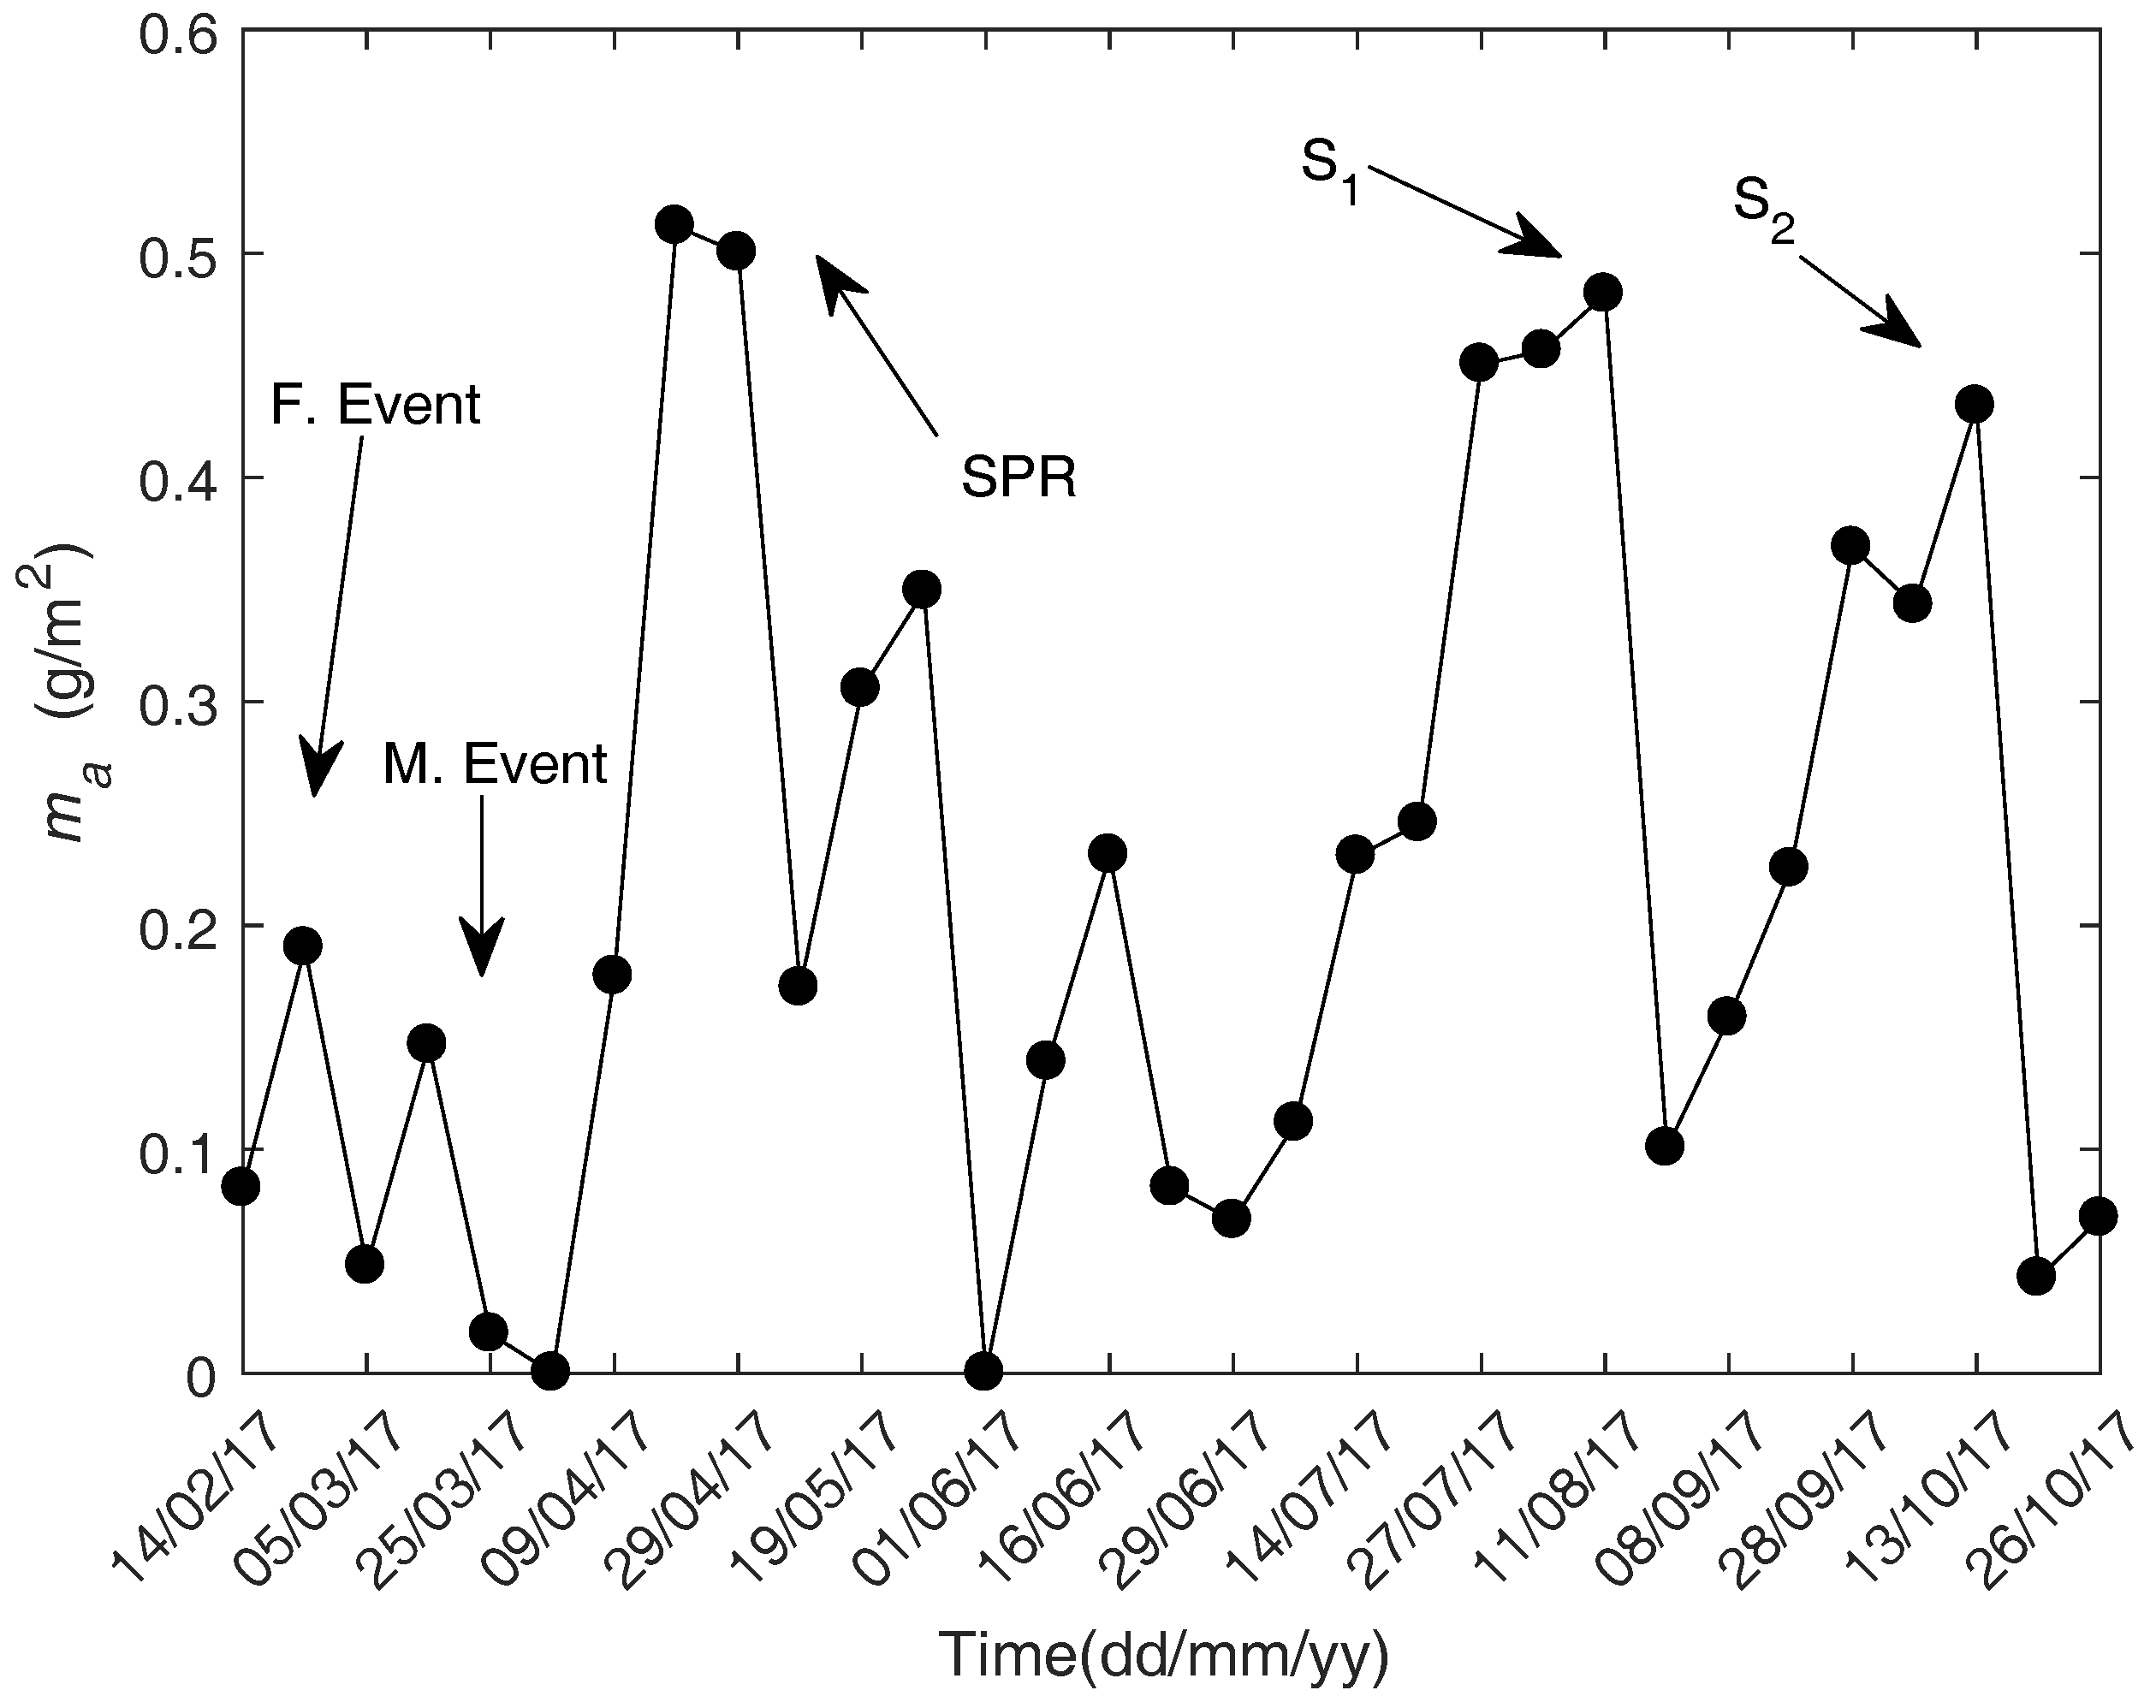
Figure 6.
Annual pollen trends in Lisbon (Portugal) from 2007 to 2009.

Figure 7.
Pollen species from glass sample SEM: (a) Arecaceae; (b) Pinaceae; (c) Quercus sp; (d) Poaceae.
Figure 7.
Pollen species from glass sample SEM: (a) Arecaceae; (b) Pinaceae; (c) Quercus sp; (d) Poaceae.
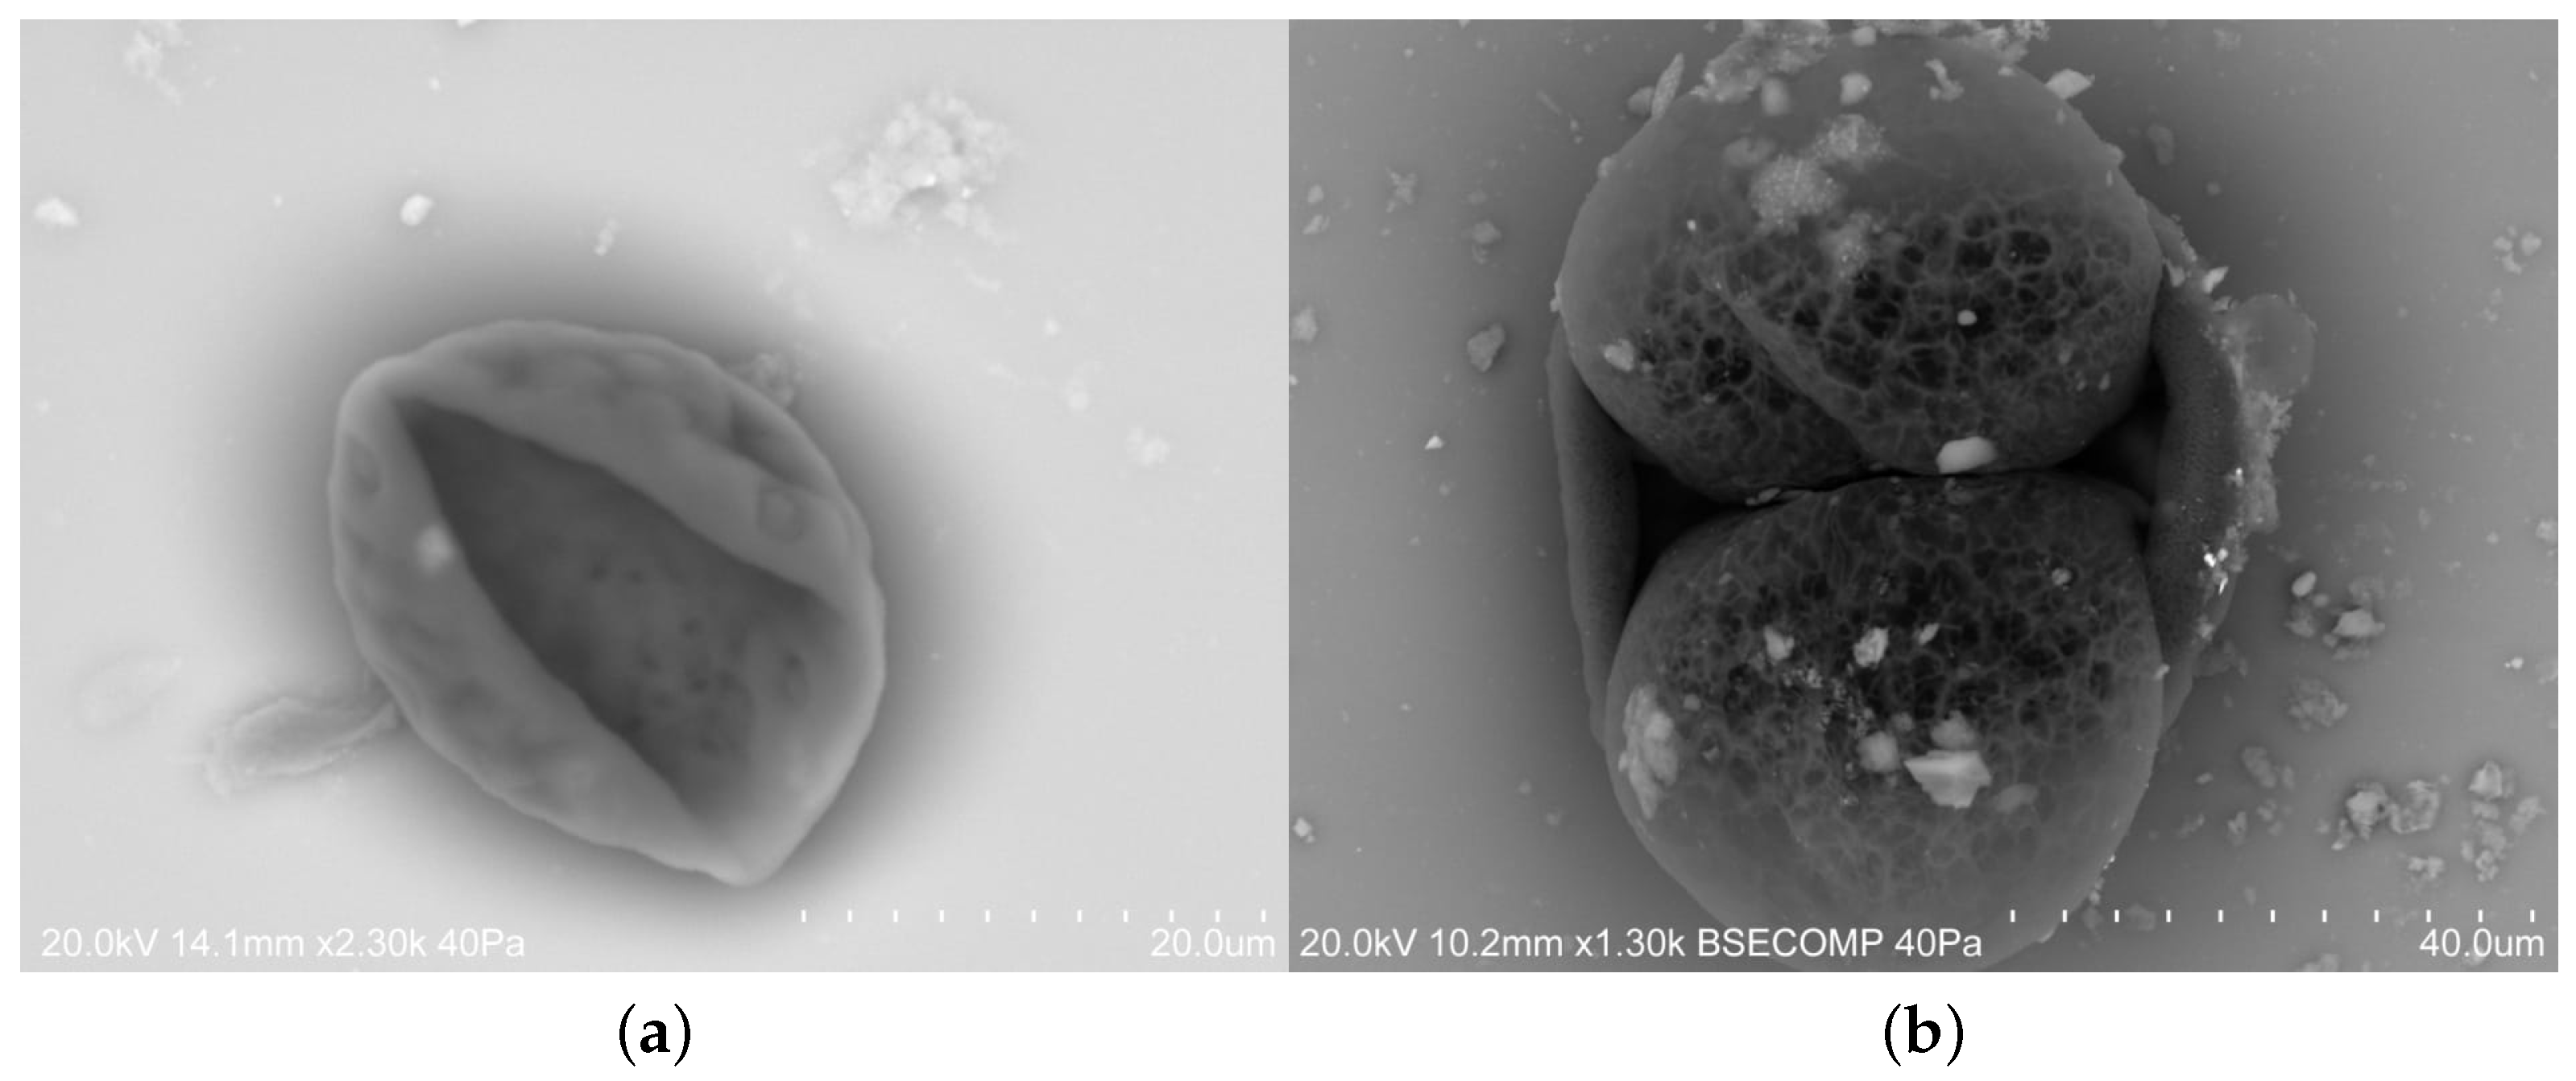

Figure 8.
SEM images: (a) April 2017; (b) July 2017.

Table 1.
Soiling rates and respective statistical indicators.
| Indicators | SPR | S1 | S2 |
|---|---|---|---|
| (%/month) | 4.1 | 1.9 | 1.6 |
| 0.97 | 0.97 | 0.94 | |
| RMSE | 0.0013 | 0.0007 | 0.0008 |
Table 2.
SEM image parameter analysis.
| Parameters | April | July |
|---|---|---|
| () | 20.5 | 19.3 |
| () | 14.4 | 14.9 |
| (%) | 33.8 | 4.1 |
| (%) | 40.3 | 6.5 |
© 2018 by the authors. Licensee MDPI, Basel, Switzerland. This article is an open access article distributed under the terms and conditions of the Creative Commons Attribution (CC BY) license (http://creativecommons.org/licenses/by/4.0/).
Share and Cite
MDPI and ACS Style
Conceição, R.; Silva, H.G.; Mirão, J.; Collares-Pereira, M. Organic Soiling: The Role of Pollen in PV Module Performance Degradation. Energies 2018, 11, 294. https://doi.org/10.3390/en11020294
AMA Style
Conceição R, Silva HG, Mirão J, Collares-Pereira M. Organic Soiling: The Role of Pollen in PV Module Performance Degradation. Energies. 2018; 11(2):294. https://doi.org/10.3390/en11020294
Chicago/Turabian StyleConceição, Ricardo, Hugo G. Silva, José Mirão, and Manuel Collares-Pereira. 2018. "Organic Soiling: The Role of Pollen in PV Module Performance Degradation" Energies 11, no. 2: 294. https://doi.org/10.3390/en11020294
Note that from the first issue of 2016, this journal uses article numbers instead of page numbers. See further details here.