Article

Analysis of the Effect of Vehicle, Driving and Road Parameters on the Transient Performance and Emissions of a Turbocharged Truck

by
Evangelos G. Giakoumis
* and
George Triantafillou
Internal Combustion Engines Laboratory, School of Mechanical Engineering, National Technical University of Athens, 15780 Athens, Greece
*
Author to whom correspondence should be addressed.
Energies 2018, 11(2), 295; https://doi.org/10.3390/en11020295
Submission received: 8 January 2018 / Revised: 18 January 2018 / Accepted: 23 January 2018 / Published: 27 January 2018

Abstract

:
In this paper, a fundamental analysis of the effects of various influential parameters on the performance and emissions of a turbocharged truck operating under transient conditions is presented. The results derive from a detailed vehicle model that comprises two parts. The first is an engine performance and emissions module that follows a mapping approach, with experimentally derived correction coefficients employed to account for transient discrepancies; this is then coupled to a comprehensive vehicle model that takes into account various vehicle operation attributes such as gearbox, tires, tire slip, etc. Soot, as well as nitrogen monoxide, are the examined engine-out pollutants, together with fuel consumption and carbon dioxide. The parameters examined are vehicular (mass and gearbox), driving (driver ‘aggressiveness’ and gear-shift profile) and road (type and grade). From the range of values investigated, the most critical parameters for the emission of NO and soot are vehicle mass, driving ‘aggressiveness’ and the exact gear-change profile. Vehicle mass, driving ‘aggressiveness’ and road-grade were identified as the most influential parameters for the emission of CO2. A notable statistical correlation was established between pollutant emissions (NO, soot) and vehicle mass or road-tire friction, as well as between fueling/CO2 and vehicle mass, road-tire friction and road grade. It is believed that the results obtained shed light into the effect of critical operating parameters on the engine-out emissions of a truck/bus, underlining at the same time the peculiarities of transient operating conditions.

1. Introduction

The internal combustion engine has dominated the medium and large transport sector (trucks, buses) for many decades now. The major contributing factor for this has been its versatility/ability to operate efficiently at a variety of speed and (mostly) load conditions. In particular, it is the compression ignition (diesel) engine that is primarily used for medium and heavy-duty trucks all over the world. The ability of the diesel engine to operate (highly) turbocharged, as well as its higher fuel efficiency compared to the spark ignition engine are the obvious reasons for its dominance. Nowadays, all diesel engines are turbocharged, with two-stage (series) turbocharged units achieving impressive values of brake mean effective pressure of approximately 30 bar.
Nonetheless, there are certain aspects of the turbocharged diesel engine’s operation that have proven problematic over the years, such as its cold starting difficulty, its combustion noise radiation (largely mitigated today by electronically controlled, common rail injection systems with pre-injection) and, mostly, its transient performance and emissions [1,2]. The authorities in many regions in the world have acknowledged the latter by applying transient cycles for the certification of new heavy-duty engines/vehicles. For example, many countries/regions in the world, such as the European Union, Japan and S. Korea, apply the WHTC (Worldwide Harmonized Transient Cycle) transient engine-dynamometer cycle for the certification of new heavy-duty engines, whereas in the US and Canada, the similarly transient FTP (Federal Test Procedure) cycle has been in use since the mid-1980s, replacing earlier steady-state test procedures [3,4].
Modeling and experimental investigation of transient diesel engine operation started rather late, in the late 1960s, with the pioneering works from Watson and co-workers [5], and Winterbone and co-workers [6]. In the next decades, various thermodynamic models were developed dealing with transient (diesel engine) operation, and simulating both the engine and turbocharger response during acceleration, load acceptance and starting; these are reviewed in detail in [7]. Such simulation tools were mostly based on a zero-dimensional modeling philosophy, which was considered a good compromise between accuracy and (acceptable) computational time. A few attempts have also been made to simulate a whole driving cycle applying filling and emptying modeling techniques [8,9], although with high burden on the code execution time. In any case, none of the above models has proven capable of accurately predicting the engine or vehicle performance during transients, particularly so for modern engines equipped with complex electronically controlled systems and antipollution devices.
In parallel, quasi-steady or mean-value models have also been developed and employed over the years, with obvious benefits in terms of simplicity and code short running time. Such simplified models are usually based on steady-state maps of all the interesting engine properties, applying correction coefficients to account for the peculiarities during transients [10,11,12,13,14]. Although these cannot capture engine properties development on a microscopic (degree crank angle) scale, they have proven very useful owing to their simplicity and real-time execution capabilities.
The research group led by the first author has demonstrated the capabilities of quasi-linear approaches in a series of previous works [15,16,17]. The developed procedure combines simulation and experiment, being thus considerably less costly than pure experimental approaches, and at the same time more versatile. This is based on an initial experimental mapping of the engine under steady-state conditions with correction coefficients applied to account for the transient emission overshoots (detailed in Section 2). These coefficients have been derived experimentally, based on a variety of discrete accelerations conducted in the authors’ laboratory. The emissions estimation is then combined with a comprehensive vehicle model that ‘runs’ each time on the requested transient schedule. The analysis presented and discussed in this article is a continuation of these earlier models, which were applied to driving/transient cycles. However, the current work provides three distinct novel features:
(a)
it focuses on specific discrete transient events, a fact that will facilitate better insight into the complex dynamic phenomena an engine encounters during transients (this was not always feasible when 1200 [16] or even 1800 [17] seconds of a cycle were studied);
(b)
a much more detailed vehicle model has been incorporated in the simulation code, facilitating better evaluation of the vehicle’s true behavior on the road; and
(c)
a detailed parametric study of the effect of various critical vehicle, driving and road parameters will be conducted in order to assess their importance on both performance and emissions from a typical medium to heavy-duty vehicle equipped with a turbocharged diesel engine.
The paper is structured as follows: Section 2 will provide an outline of the model developed and the experimental work it is based on. Section 3 will highlight the performance and emissions behavior of the engine/vehicle during the two studied transient schedules. The detailed parametric analysis will then follow in Section 4, based on the conclusions from the fundamental analysis of Section 3. It is highlighted that in the investigation that follows all emitted pollutants discussed are engine out, and concern fully warmed-up engine operation.

2. Methodology—Engine and Vehicle Model

The methodology employed for the estimation of performance and emissions during a transient schedule has been detailed in previous publications [15,16,17]; only a brief description is provided here, with reference to Figure 1, for the sake of completeness. As was the case with other similar mapping-based approaches developed in the past [10,11,12,13,14,18,19,20,21,22,23], the context of quasi-linear modeling [24] is, in general, followed.
Initially, a thorough steady-state testing was performed aiming to formulate the engine performance and emissions map. The properties under test are soot, nitric monoxide (NO), and fueling (from which CO2 emissions can be directly estimated).
Based on the steady-state engine testing, the engine emissions and performance were mapped applying a fourth order polynomial for every studied property with respect to the engine speed and torque [15].
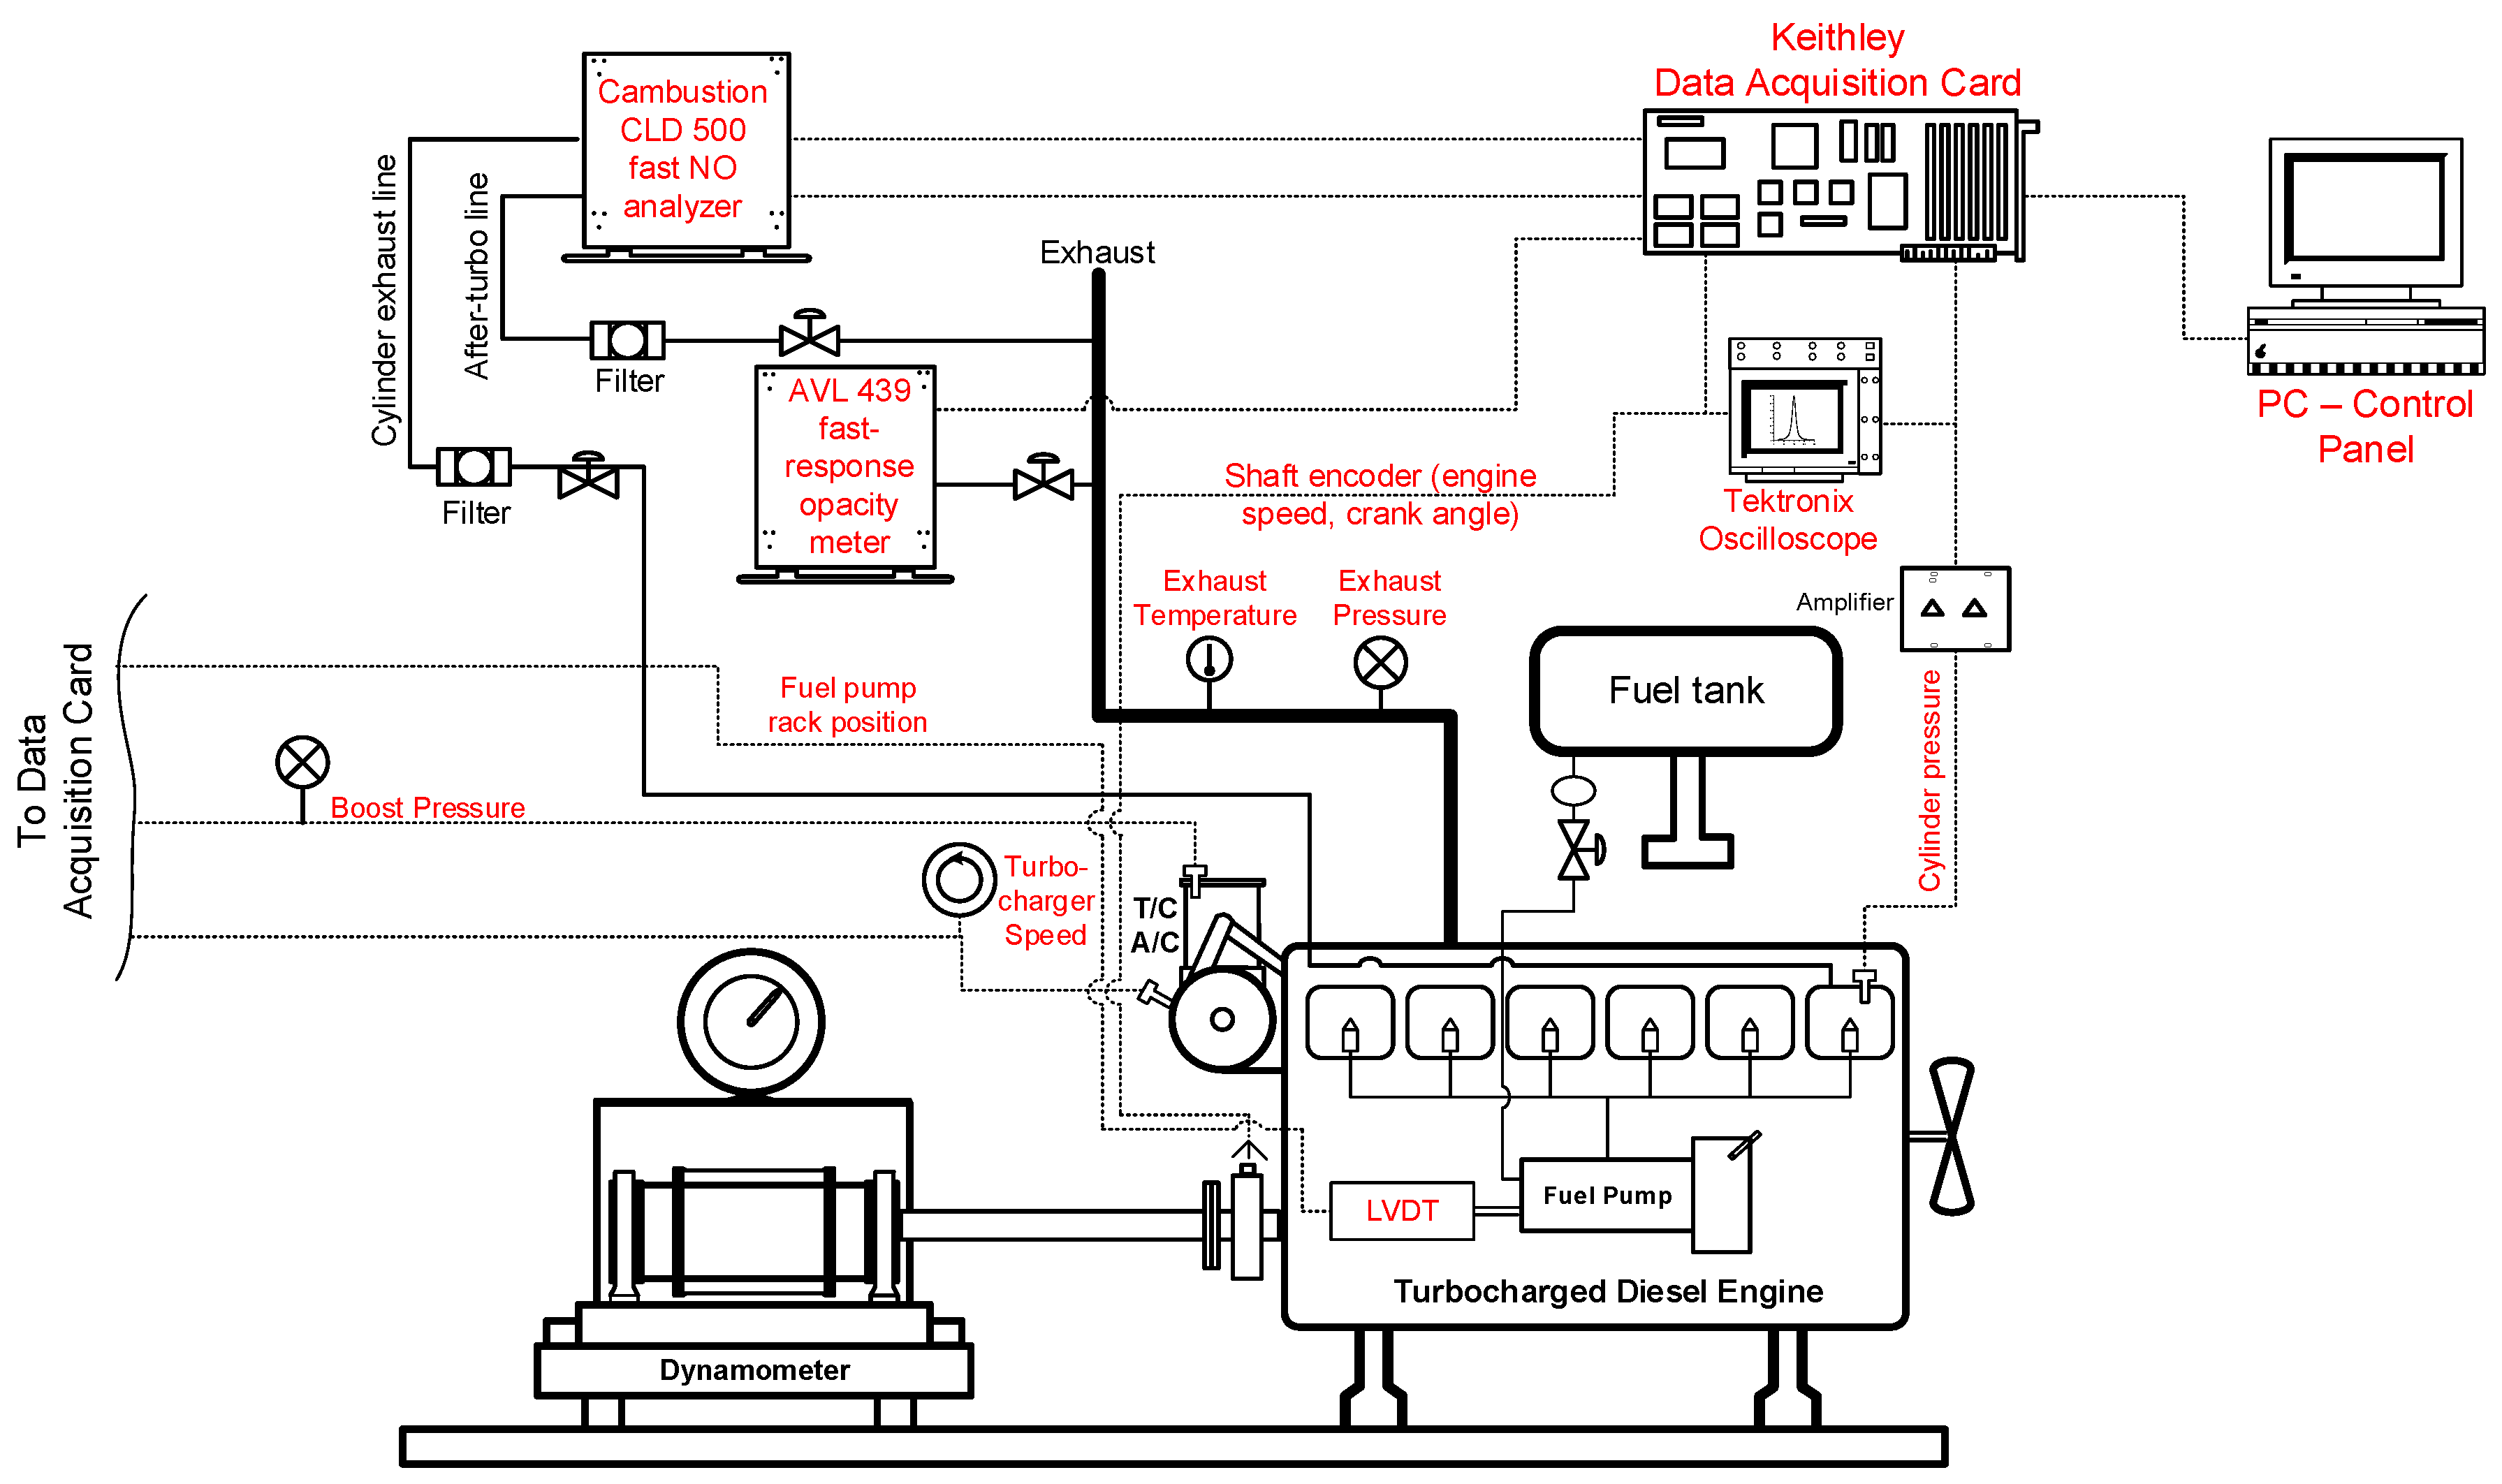
Afterwards, a variety of transient schedules were conducted, using fast-response soot and NO analyzers (Figure 2). The transient schedules investigated were discrete accelerations at various loads, such as the ones that will be studied in this paper, from a variety of initial engine speeds and for a variety of demanded speed changes. By doing so, we were able to estimate the emission peaks observed for the current engine during accelerations, a very essential element when turbocharged engines operate [1,2]. From the engine experimentation during transients, correction coefficients were derived for each pollutant that were used to ‘correct’ (i.e., increase) the steady-state emissions [17]; more information on the transient experimental tests is available in [25]. With reference to Figure 1, at each time step of the examined transient schedule:
  • From the vehicle speed, we were able to calculate the actual engine torque and speed based on a drive-train model (Figure 3) for the vehicle concerned [26,27]. The vehicle model employed in this work has been considerably upgraded from the previously mentioned publications, incorporating, among other things, the effect of the [28,29,30]:
    Inertia of the equivalent rotating masses (engine, driveshaft, wheels),
    Tires (inflation pressure, resistance, slip and friction coefficient),
    Road (gradient and friction coefficient),
    Transmission (gear number and ratio, speed-dependent mechanical efficiency etc.),
    Differential (final drive ratio, inertia, etc.), and finally the
    Driver (simulates the specific driving habits, for example gear shift duration).
  • Afterwards, we perform an interpolation of the digitized engine map to estimate the steady-state fueling and emissions at the exact load and speed operating point.
  • The next step is to apply correction coefficients to the previous mentioned quasi-steady emissions evaluating the ‘real’ transient emissions profile; these coefficients were evaluated after the extensive transient testing of the engine in hand mentioned above, and are specific to each transient event (e.g., load increase or speed change) that the engine experiences.
The last step is to integrate the instantaneous results over the examined transient schedule in order to calculate the total amount of emitted pollutants and CO2.
The main technical engine specifications are provided in Table 1; the engine is a six-cylinder, direct-injection, turbocharged diesel engine installed in buses and/or medium-duty trucks. Further, Table 2 provides data for the heavy-duty vehicle the engine is installed in, needed for the computational analysis.

3. Vehicle and Engine Results during Typical Transient Schedules

In this section, a description of the vehicle performance and engine emissions during two transient schedules will be provided and discussed. These transient schedules simulate real-world driving, and are typical components of certification driving cycles [4]. The first schedule is a continuous up-gear shift change, typical when entering a highway (Figure 4, Figure 5 and Figure 6); cf. the first seconds of the extra-urban driving cycle (EUDC) of the NEDC (New European Driving Cycle). As past research has indicated [1,2], such an accelerating event is the most demanding dynamic operation a vehicle experiences in terms of emissions. The second transient schedule is a typical urban route, incorporating accelerating, cruising and decelerating phases at low engaged gear and vehicle speeds (Section 3.2Figure 7), cf. the urban segment of the NEDC. The results from the fundamental analysis of this section will be used to interpret the effects of the various examined parameters on the engine/vehicle performance and emissions in Section 4. We believe that employing such short schedules with discrete accelerations can provide better understanding of the underlying phenomena. Please notice that the two transient schedules examined in this paper were formulated in such a way so as their accelerations ‘coincide’ to a large degree with the accelerations measured experimentally, in order for the experimental-computational procedure discussed in Section 2 to be directly applicable. In other words, we designed the two examined transient schedules to be as close as possible to the experimental data in hand.

3.1. Continuous Acceleration Schedule

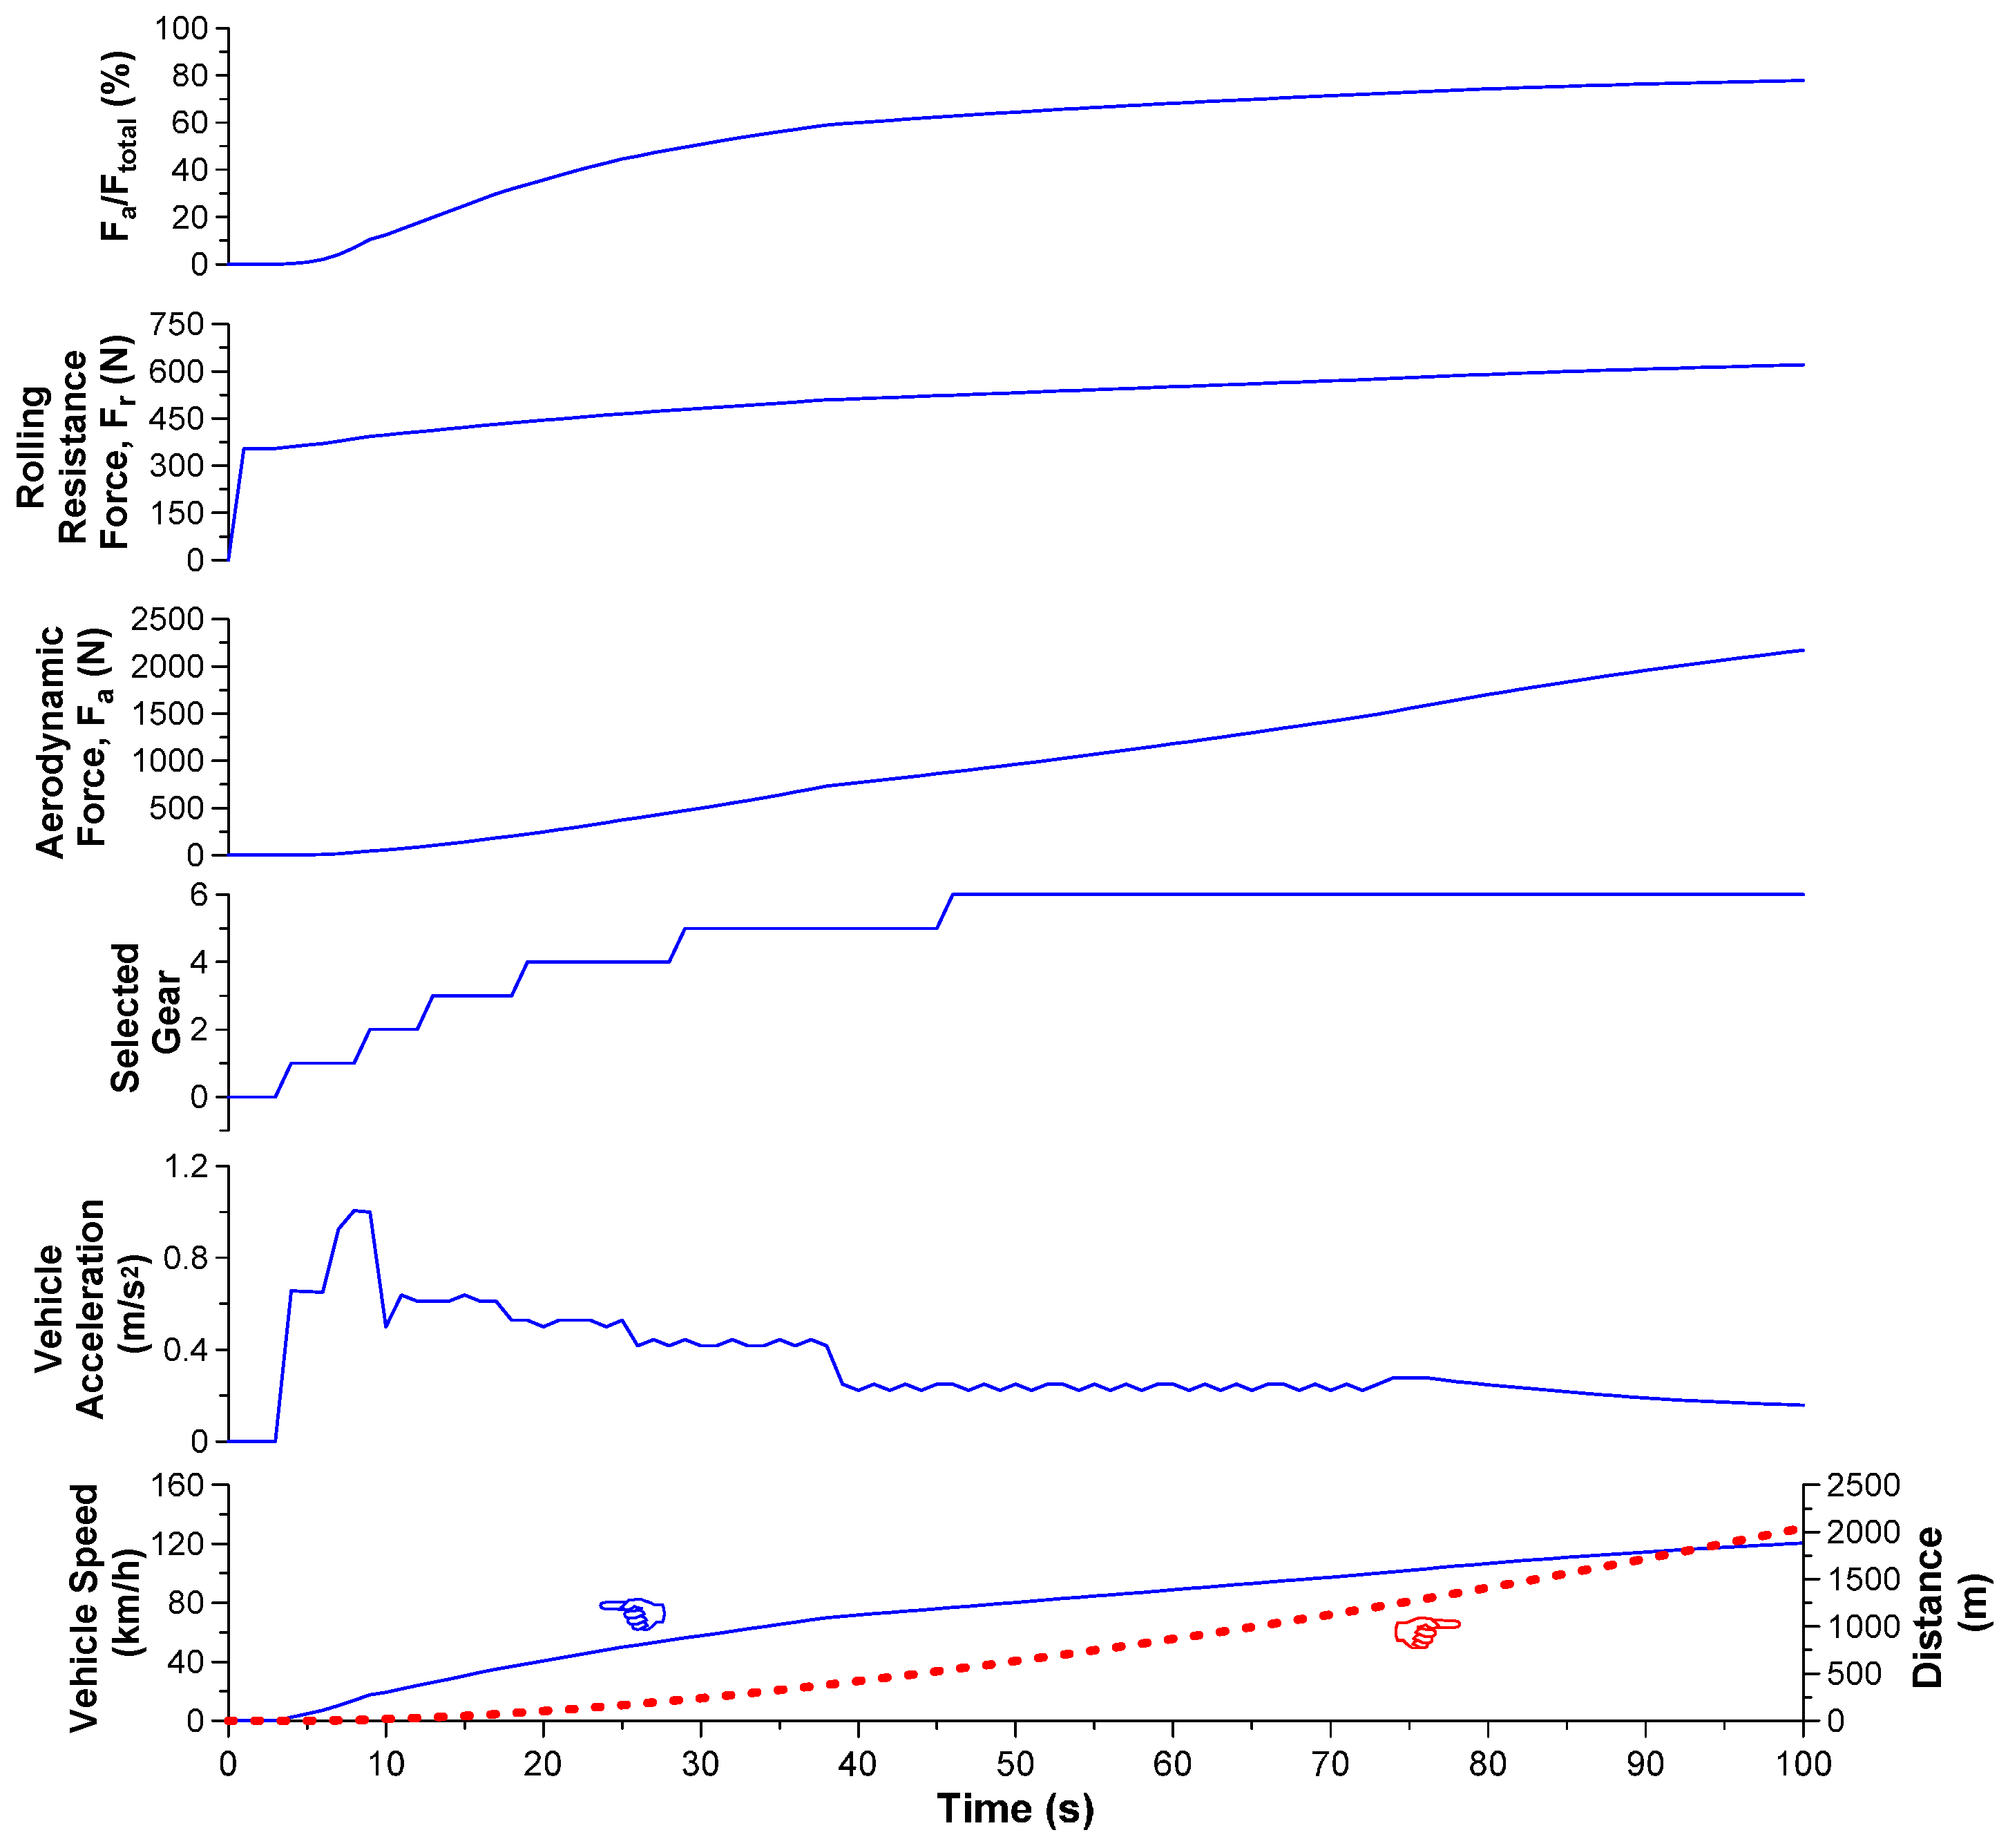
One of the primary criteria for evaluating truck response, and powertrain performance in general, is based on the ability to accelerate after a sudden increase of driver demand [28]. Figure 4 focuses on such a critical transient schedule, illustrating distance covered, vehicle speed and acceleration, selected gear, and resistance forces. In general, the resistance forces a vehicle experiences when moving on a road are the rolling resistance force Fr, the grade-dependent force Fgr, the aerodynamic force Fa, as well as the inertia force Fin; total traction force Ftr is then given by [4,27]:
F t r = F r + F g r + F a + F i n
For this transient, the road is considered flat (the effect of road grade will be investigated later in Section 4.3), hence the applied resistance forces are only aerodynamic and rolling (as is the case with legislated driving cycles), as well as inertia during the acceleration segments. The transient schedule lasts 100 s, and the vehicle speed reaches the desired value of 120 km/h covering a distance of 2 km. During the low-velocity parts of the transient event, corresponding to gears 1 through 3, the rolling resistance force Fr prevails over the aerodynamic one Fa. As soon as the fifth gear is engaged, and the vehicle speed approaches 60 km/h, the aerodynamic force begins to assume greater values, further supported by the large frontal area of the vehicle and the much smaller (but not negligible) dependence of rolling resistance on vehicle speed [4]. In any case, the rolling resistance contribution, as the upper sub-diagram of Figure 4 demonstrates, is, even at high speeds, at least 25% of the total resistance experienced by the vehicle. This is mostly the result of the high vehicle mass, and is typical for heavy-duty vehicles such as trucks and buses. As expected, the aerodynamic resistance graph is patterned after the vehicle speed one.
In general, the lower the selected gear (this means high gear ratio ig), e.g., during the low-speed segments (or the urban parts during a driving cycle), the smaller the apparent vehicle moment of inertia. This then leads to higher (vehicle) acceleration values (Figure 4); emissions too as will be detailed later in the text [4]. On the other hand, for higher selected gears (hence low gear ratio), the higher the assumed vehicle velocity, whereas the accelerations are (much) lower, since the apparent vehicle inertia is now higher [27].
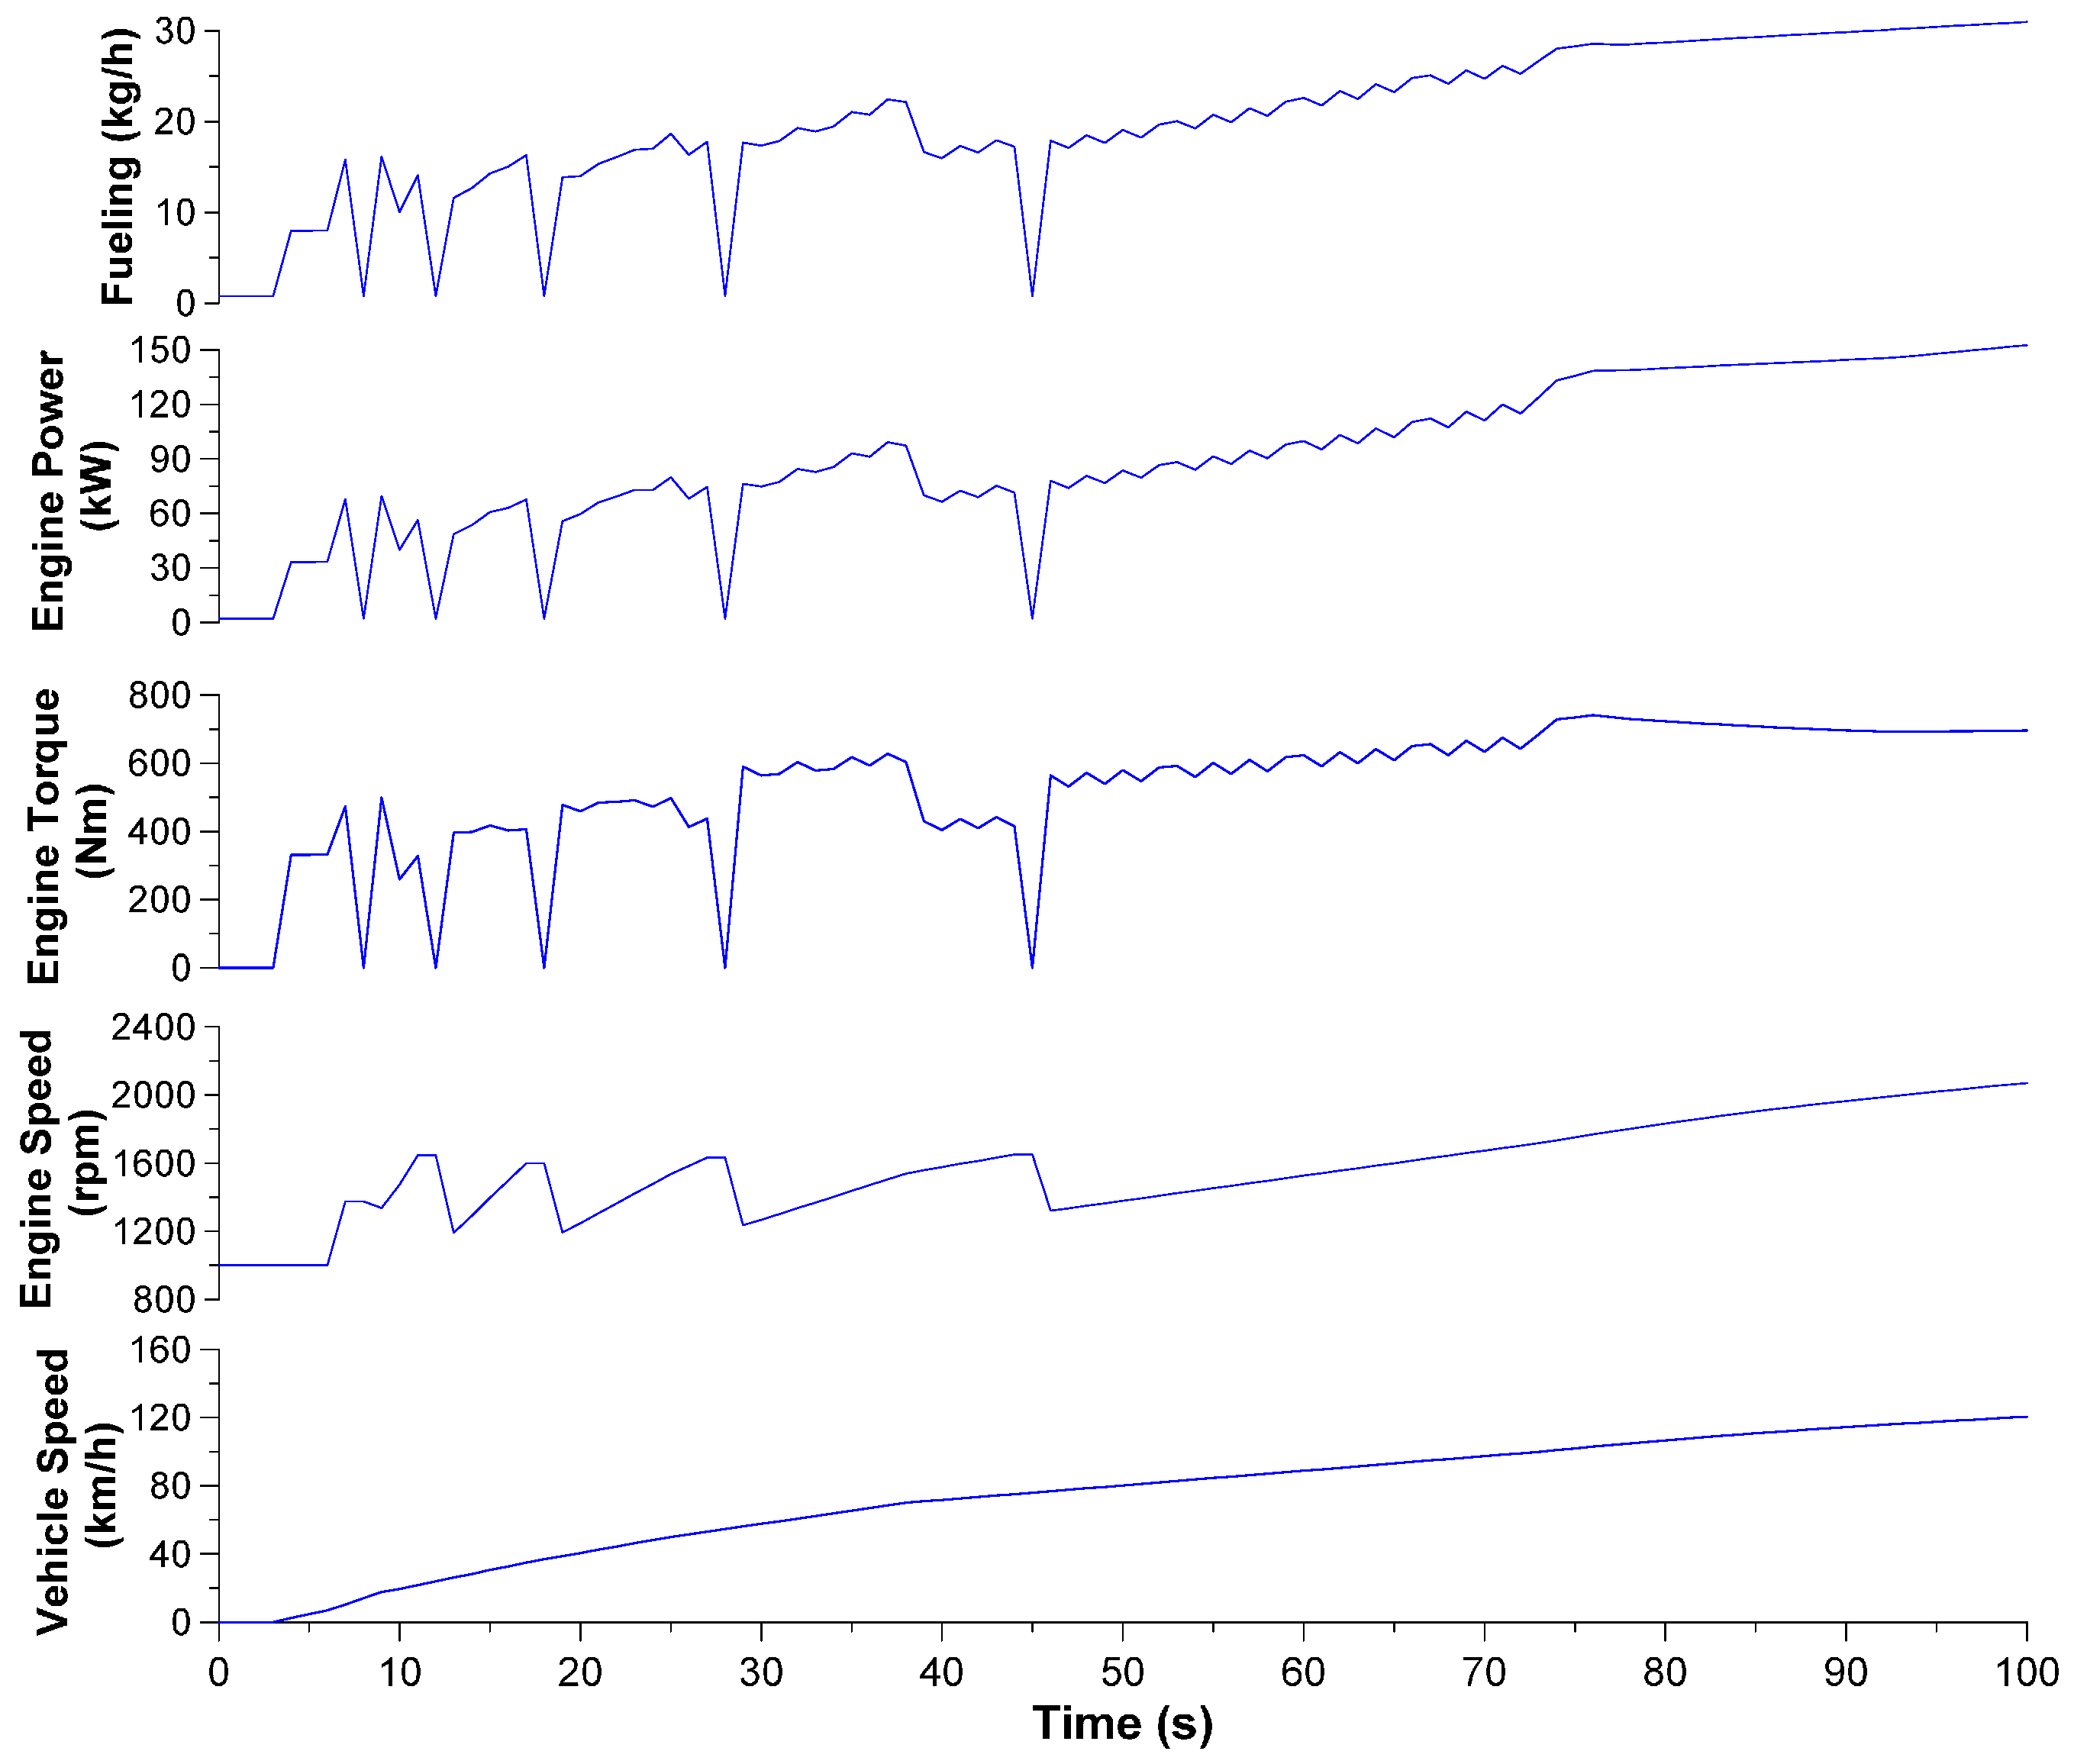
The specific profile of the engine speed development in Figure 5 incorporates the effects of driver ‘aggressiveness’ and gear-shift profile; the influence of both parameters will be investigated in Section 4.2. The absolute values of the engine speed, as Equation (2) shows, are specific to the installed gearbox and wheel radius [26]:
N e ( r p m ) = V ( k m / h ) × i b × i g 2 × π × r w h e e l ( m ) 60 × 10 3
where Ne is the engine speed, V the vehicle speed, and ig, ib are the corresponding gear and back-axle ratios, respectively; rwheel represents the wheel radius.
The development of torque, power and fueling, on the other hand, follows an identical profile throughout the transient event, as all these engine properties are inter-related with engine loading. During the low-speed, low-gear segments, the engine load is mostly influenced by the respective acceleration. This is due to the fact that the absolute vehicle velocities are low, however the accelerations steeper, resulting in increased inertia terms in Equation (1). In particular, the vehicle mass factor MF (=ratio of apparent mass to vehicle mass, with the apparent mass defined as the vehicle plus rotating masses) is almost triple when the first gear is engaged compared to the sixth. During the high-speed segments, on the other hand, where vehicle acceleration (from Figure 4) assumes lower values, it is the elevated vehicle velocities that primarily determine the engine load through the contribution of the aerodynamic resistance [27]; the loading then determines the values for power, torque, and fueling. It is not surprising that during each steep transient, fuel consumption overshoots are noticed. This is mostly due to the extra power required to overcome the vehicle inertia.
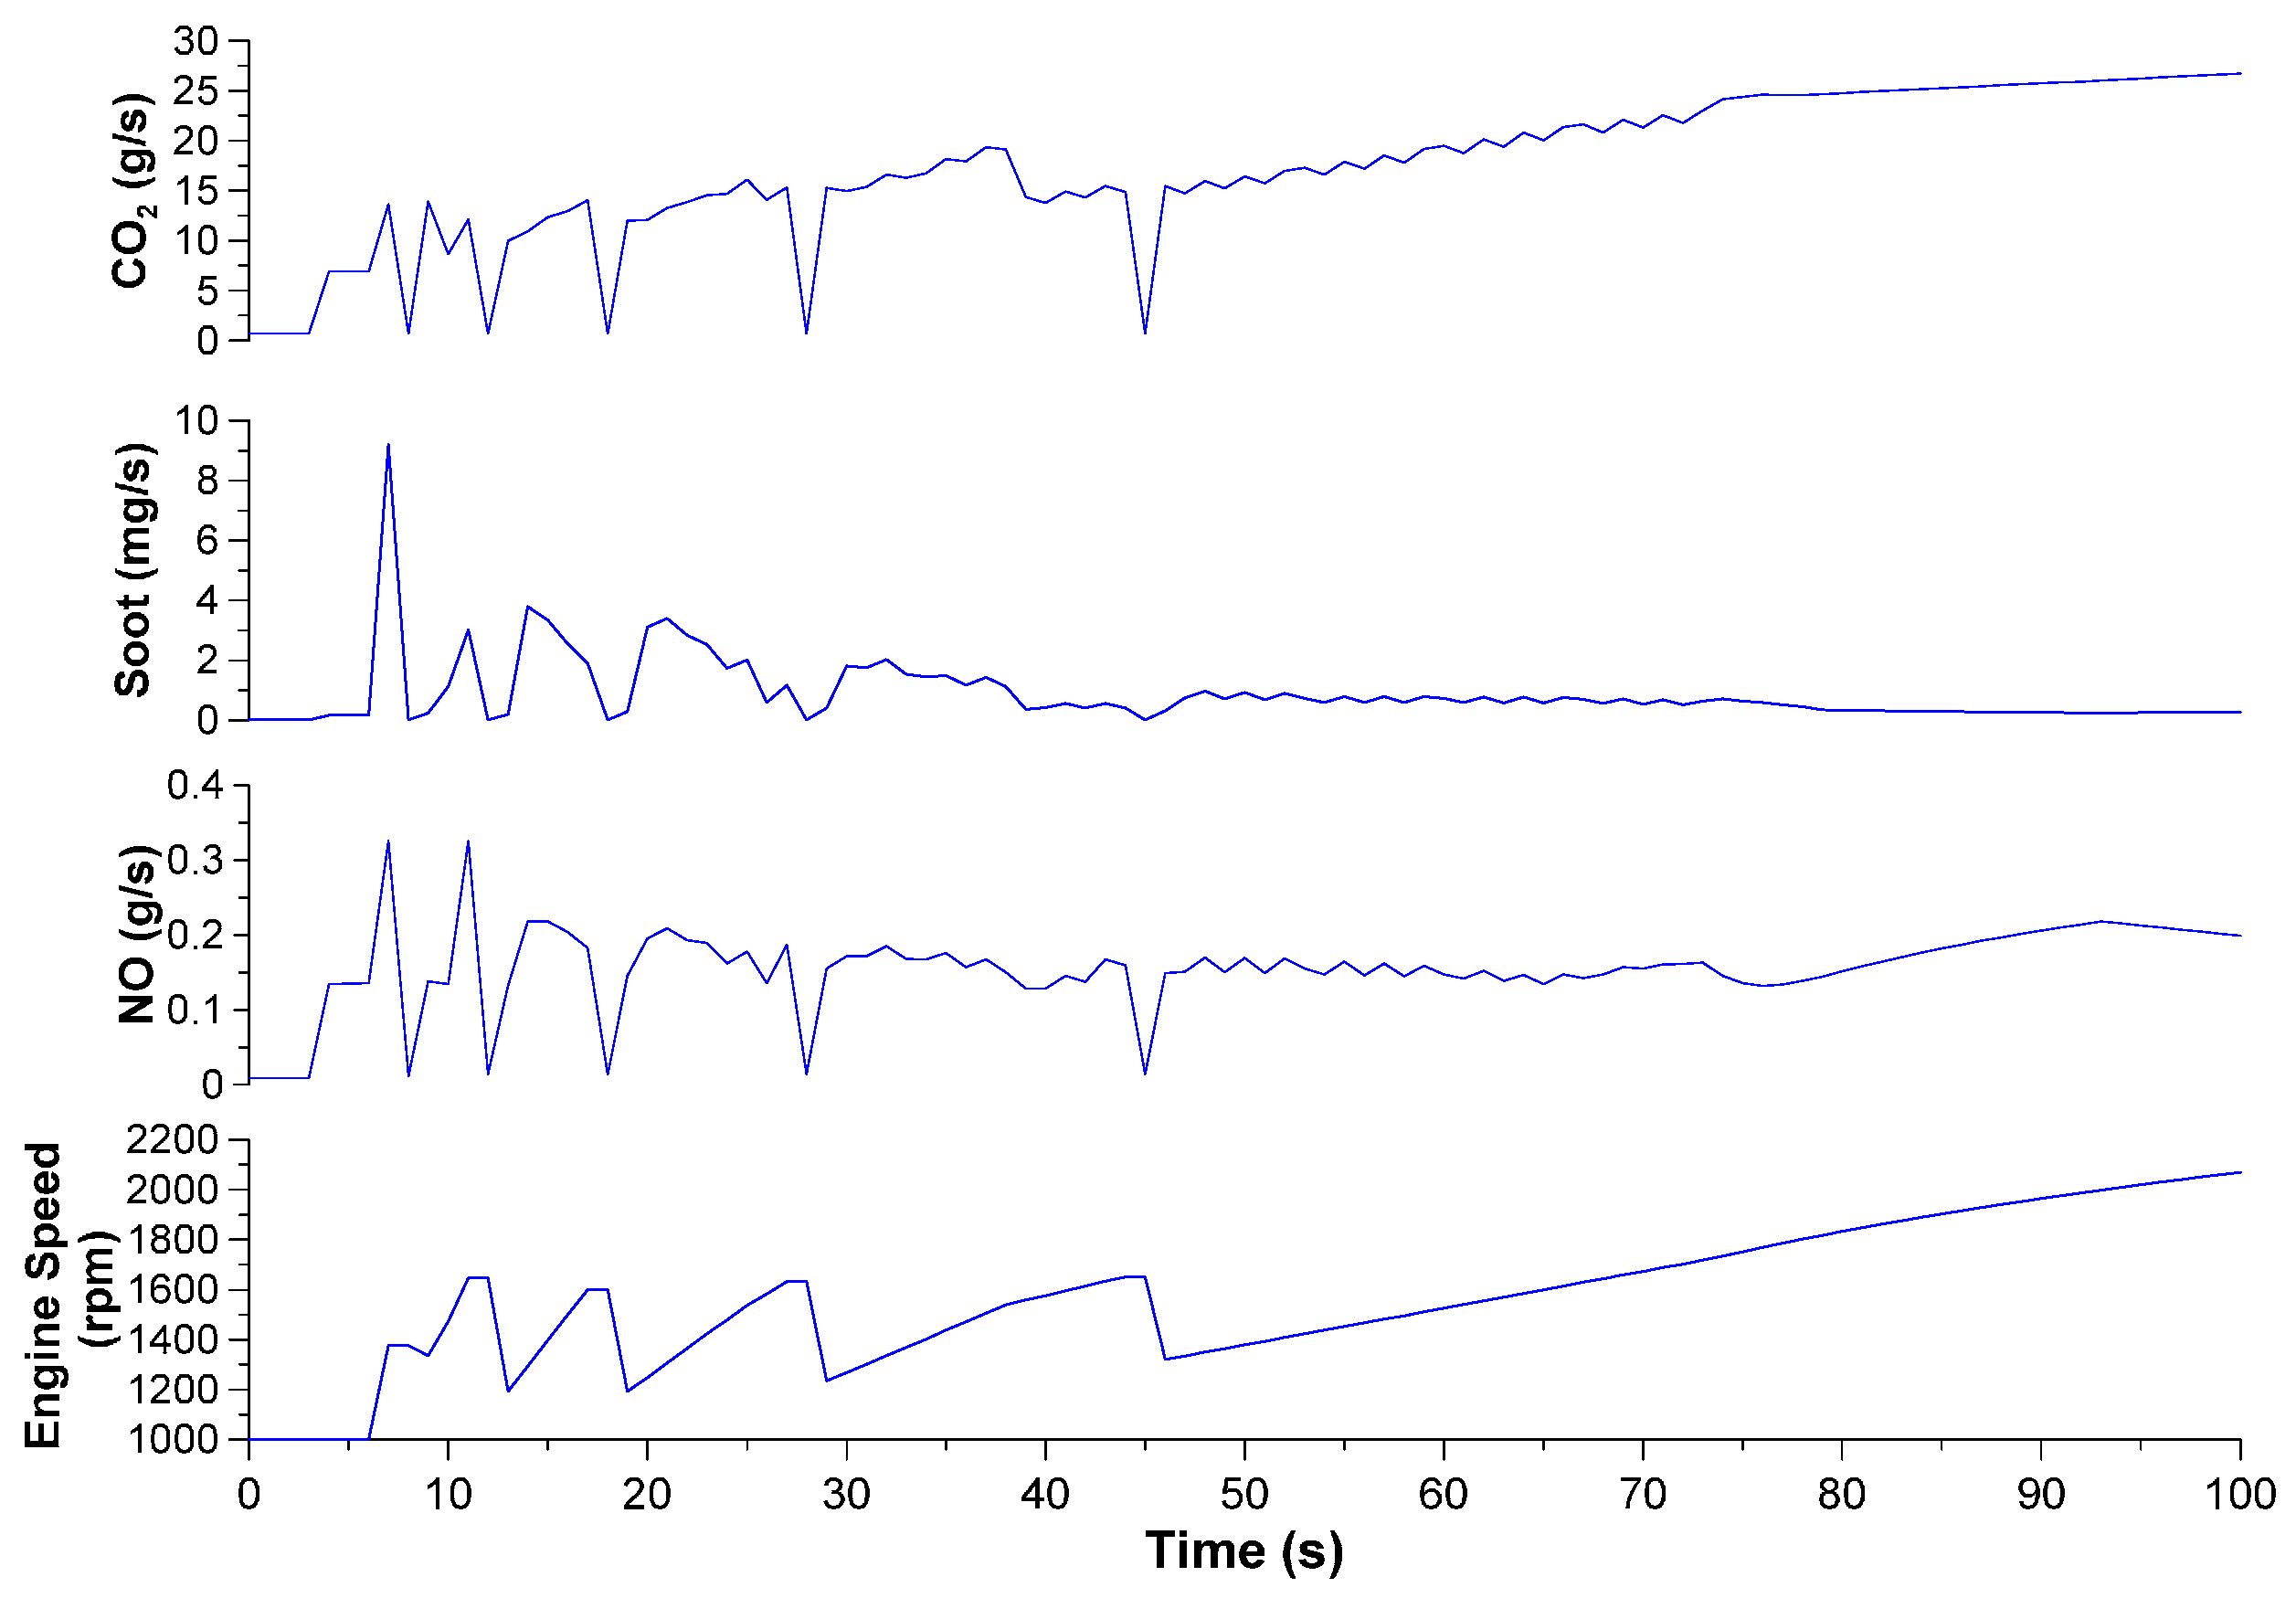
Further to the above, each steep acceleration leads also to a substantial increase in emissions, as Figure 6 eloquently demonstrates. It is well known that net soot production (fuel consumption and carbon dioxide emissions too) is mainly determined by engine load [31]. When the load increases, more fuel is injected, resulting in an increase of the temperatures in the fuel-rich zones; at the same time, diffusion combustion is prolonged, promoting the production of soot. In parallel, the availability of oxygen decreases; thus, the production of soot is favored [31]. During each acceleration, the above production mechanism is further enhanced by very low air–fuel values owing to turbocharger lag.
For the NO emissions in Figure 6, the main parameter is the temperature of the burned gas but the availability of oxygen plays an influential role too [32,33]. NO emissions are increased following the high temperatures during the turbocharger lag thermodynamic cycles; these high temperatures originate in the air-fuel mixture assuming close to stoichiometric values [2]. However, as long as the air-fuel equivalence ratio is lower than unity, the oxygen supply is limited. The combined effect of the above-mentioned two mechanisms produces a not so pronounced NO emission increase compared to soot [2]. This will be quantified in the parametric analysis (Section 4) for various cases.
It may be noticed also in Figure 6 that soot emissions are rather low at elevated vehicle speeds, owing to the turbocharger operating at high speeds, thus providing adequately high air supply. Conversely, NO continues to assume increased values at high vehicle speeds, as the combination of high loading and oxygen availability promote the production of NO. In general, as is made obvious from Figure 6, an abrupt acceleration proves more polluting (regarding engine-out soot) than many seconds or even minutes of cruising.
Lastly, following basic combustion principles [32], the CO2 increases in Figure 6 follow exactly the fuel consumption ones from Figure 5, with peaks noticed at each acceleration. Particularly high values are also observed during the high-speed segment, as the increased aerodynamic resistance from Equation (1) requires high engine loading/fueling in order to be overcome [34].

3.2. Low-Speed, Urban Schedule

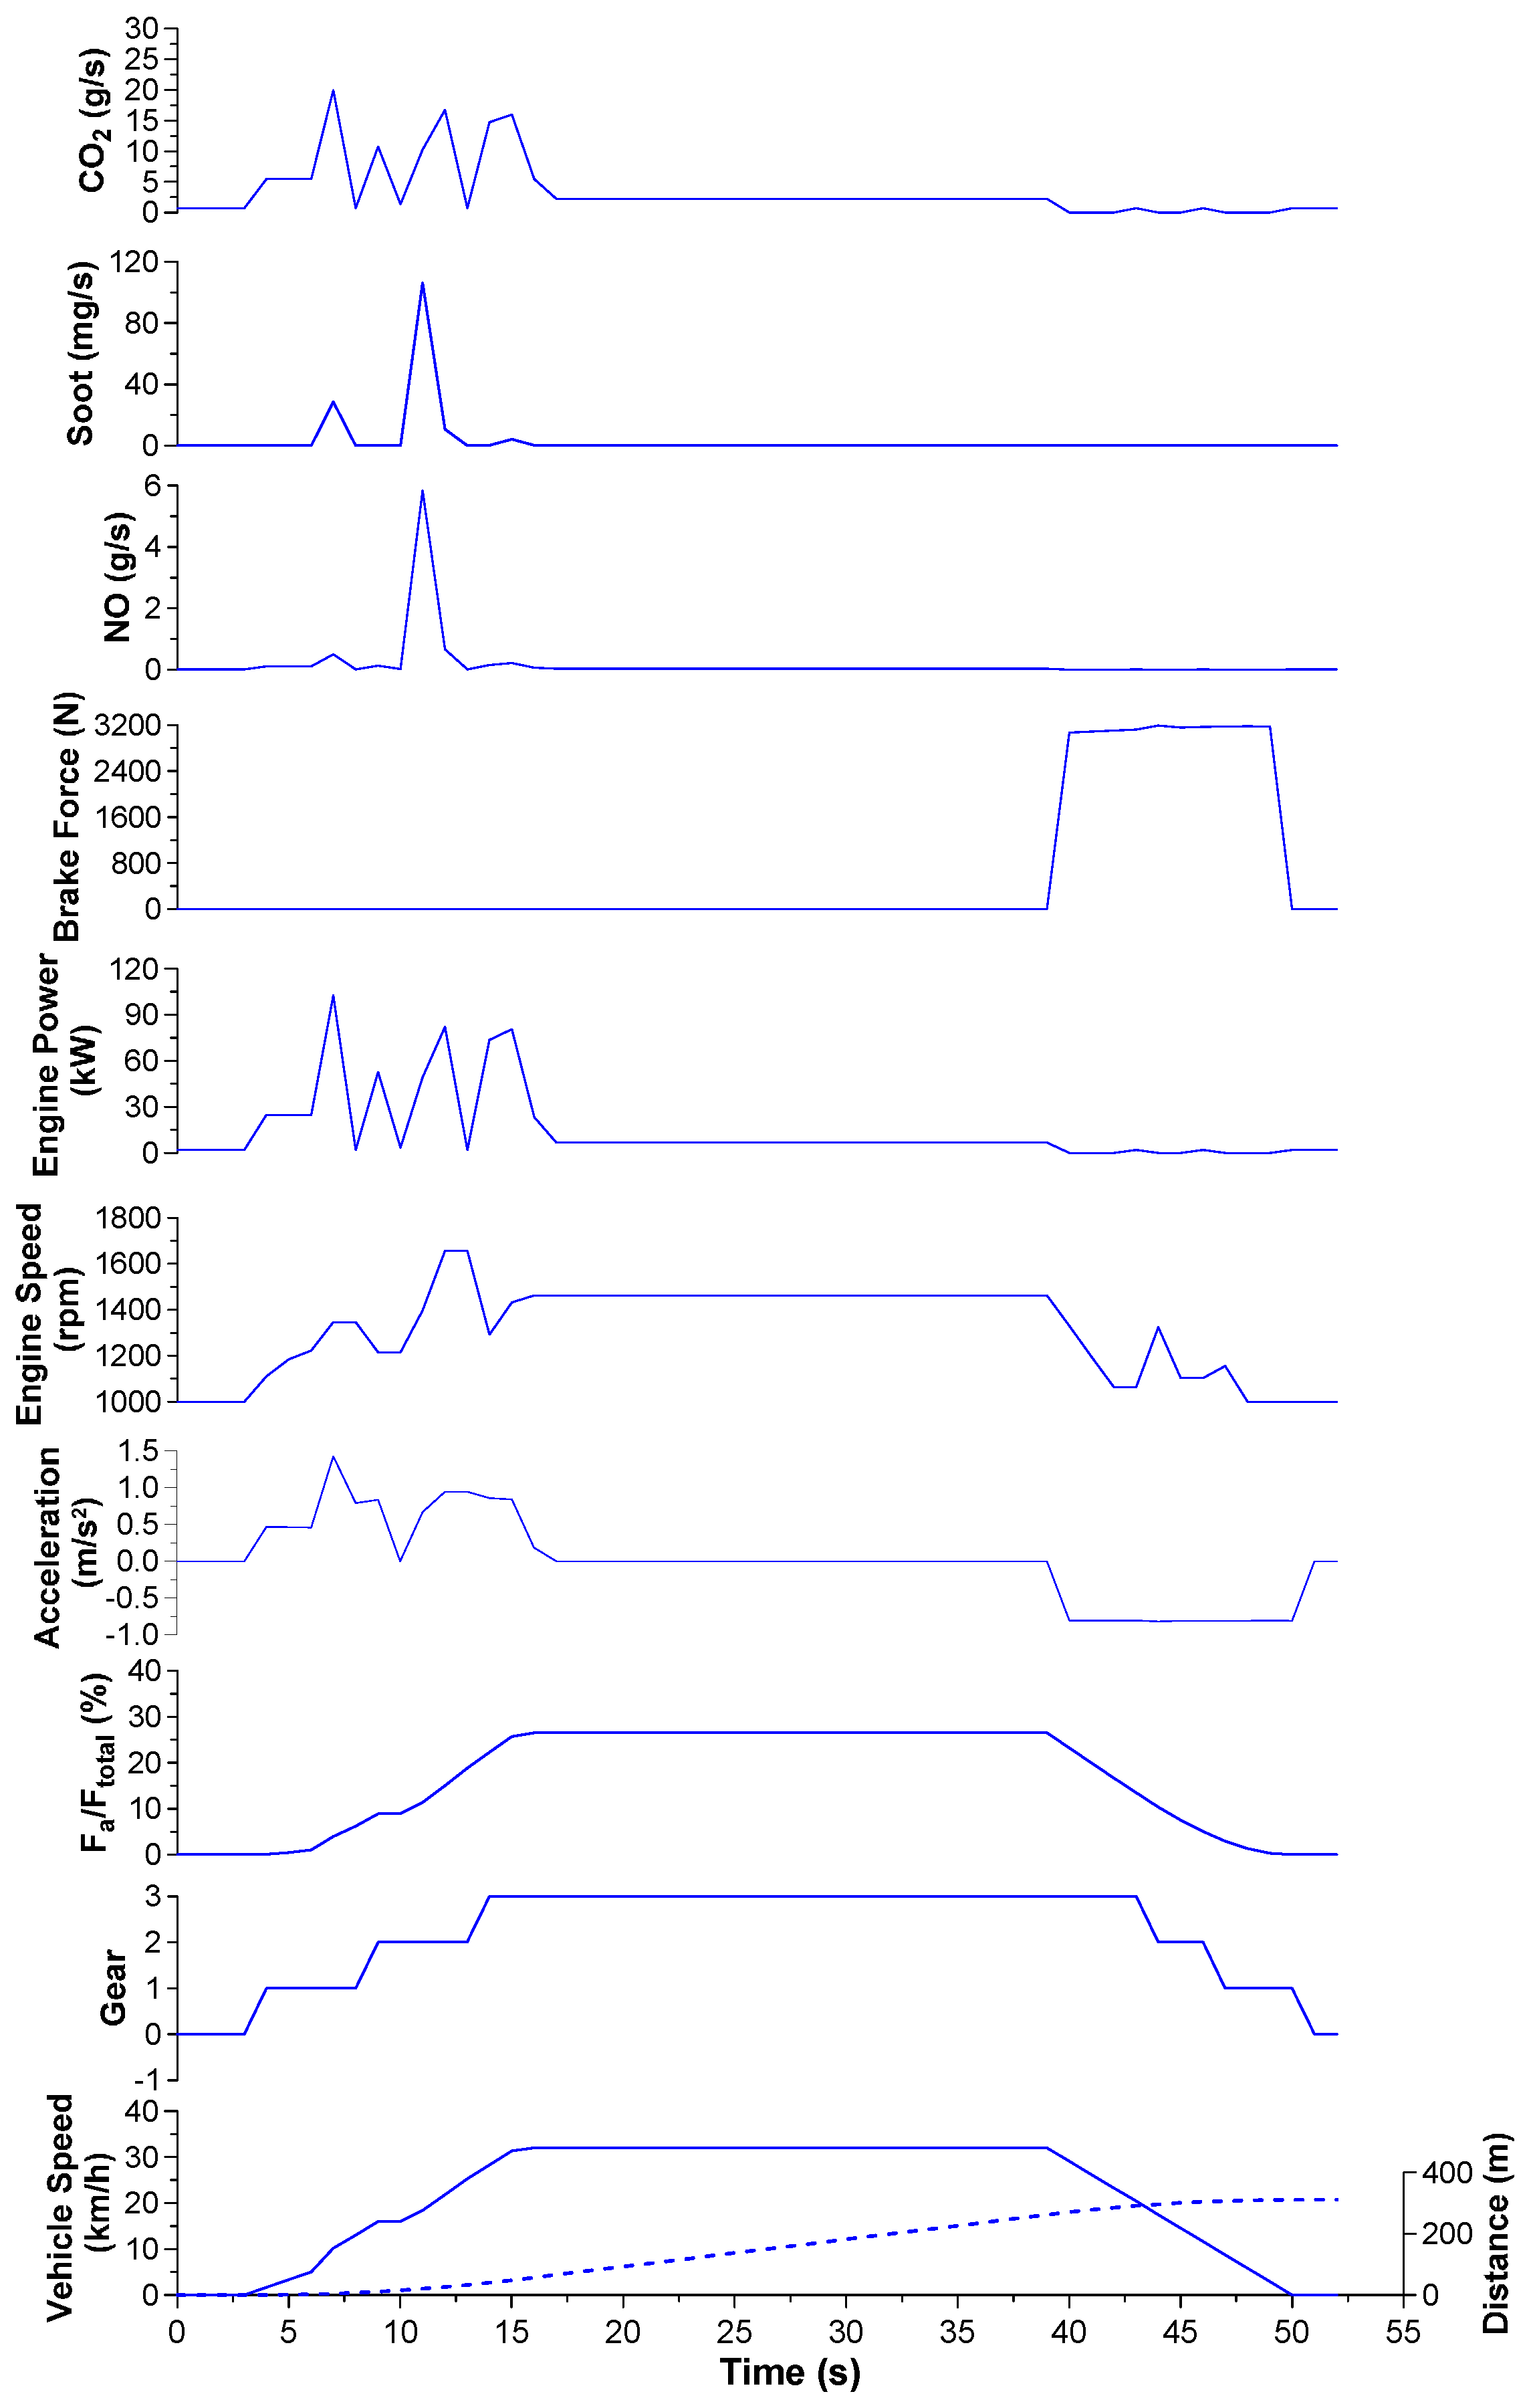
An additional transient event is depicted in Figure 7. This is more typical of urban vehicular operation (cf. the urban segment, or micro-trip, of the European NEDC driving cycle [3,4]), comprising a three-part acceleration, cruising section and deceleration. The whole schedule lasts 52 s, and the vehicle covers a distance a little over 300 m, reaching a maximum speed of 30 km/h. This schedule can be considered, for example, indicative of a bus route between two stops or a truck driving route between two stop lights. The important conclusions from the graphs presented in Figure 7 are as follows: Owing to the much lower vehicle speeds involved, the rolling resistance term prevails over its aerodynamic counterpart throughout the whole transient schedule. Thus, ‘external’ or ‘internal’ parameters such as road-type, tire pressure and road gradient assume much greater importance, as will be discussed in Section 4. A new property is depicted in Figure 7, namely brake force, applicable during the deceleration phase; this, however, is maintained at overall small values (up to 6% of the maximum), owing to the rather mild deceleration profile, typical for a heavy vehicle. Another important finding from Figure 7 is that the engine/vehicle emissions are of considerably lesser importance during decelerations. This is due to the fact that the dominating turbocharger lag effect is now absent [1,2], hence the production of pollutants very low (the engine practically operates in naturally aspirated mode and at low loading). Predictably, the same holds true for fueling and CO2 emissions as the resistance and inertia forces are diminishing during deceleration. In general, emissions are low too during the quasi-steady cruising section.
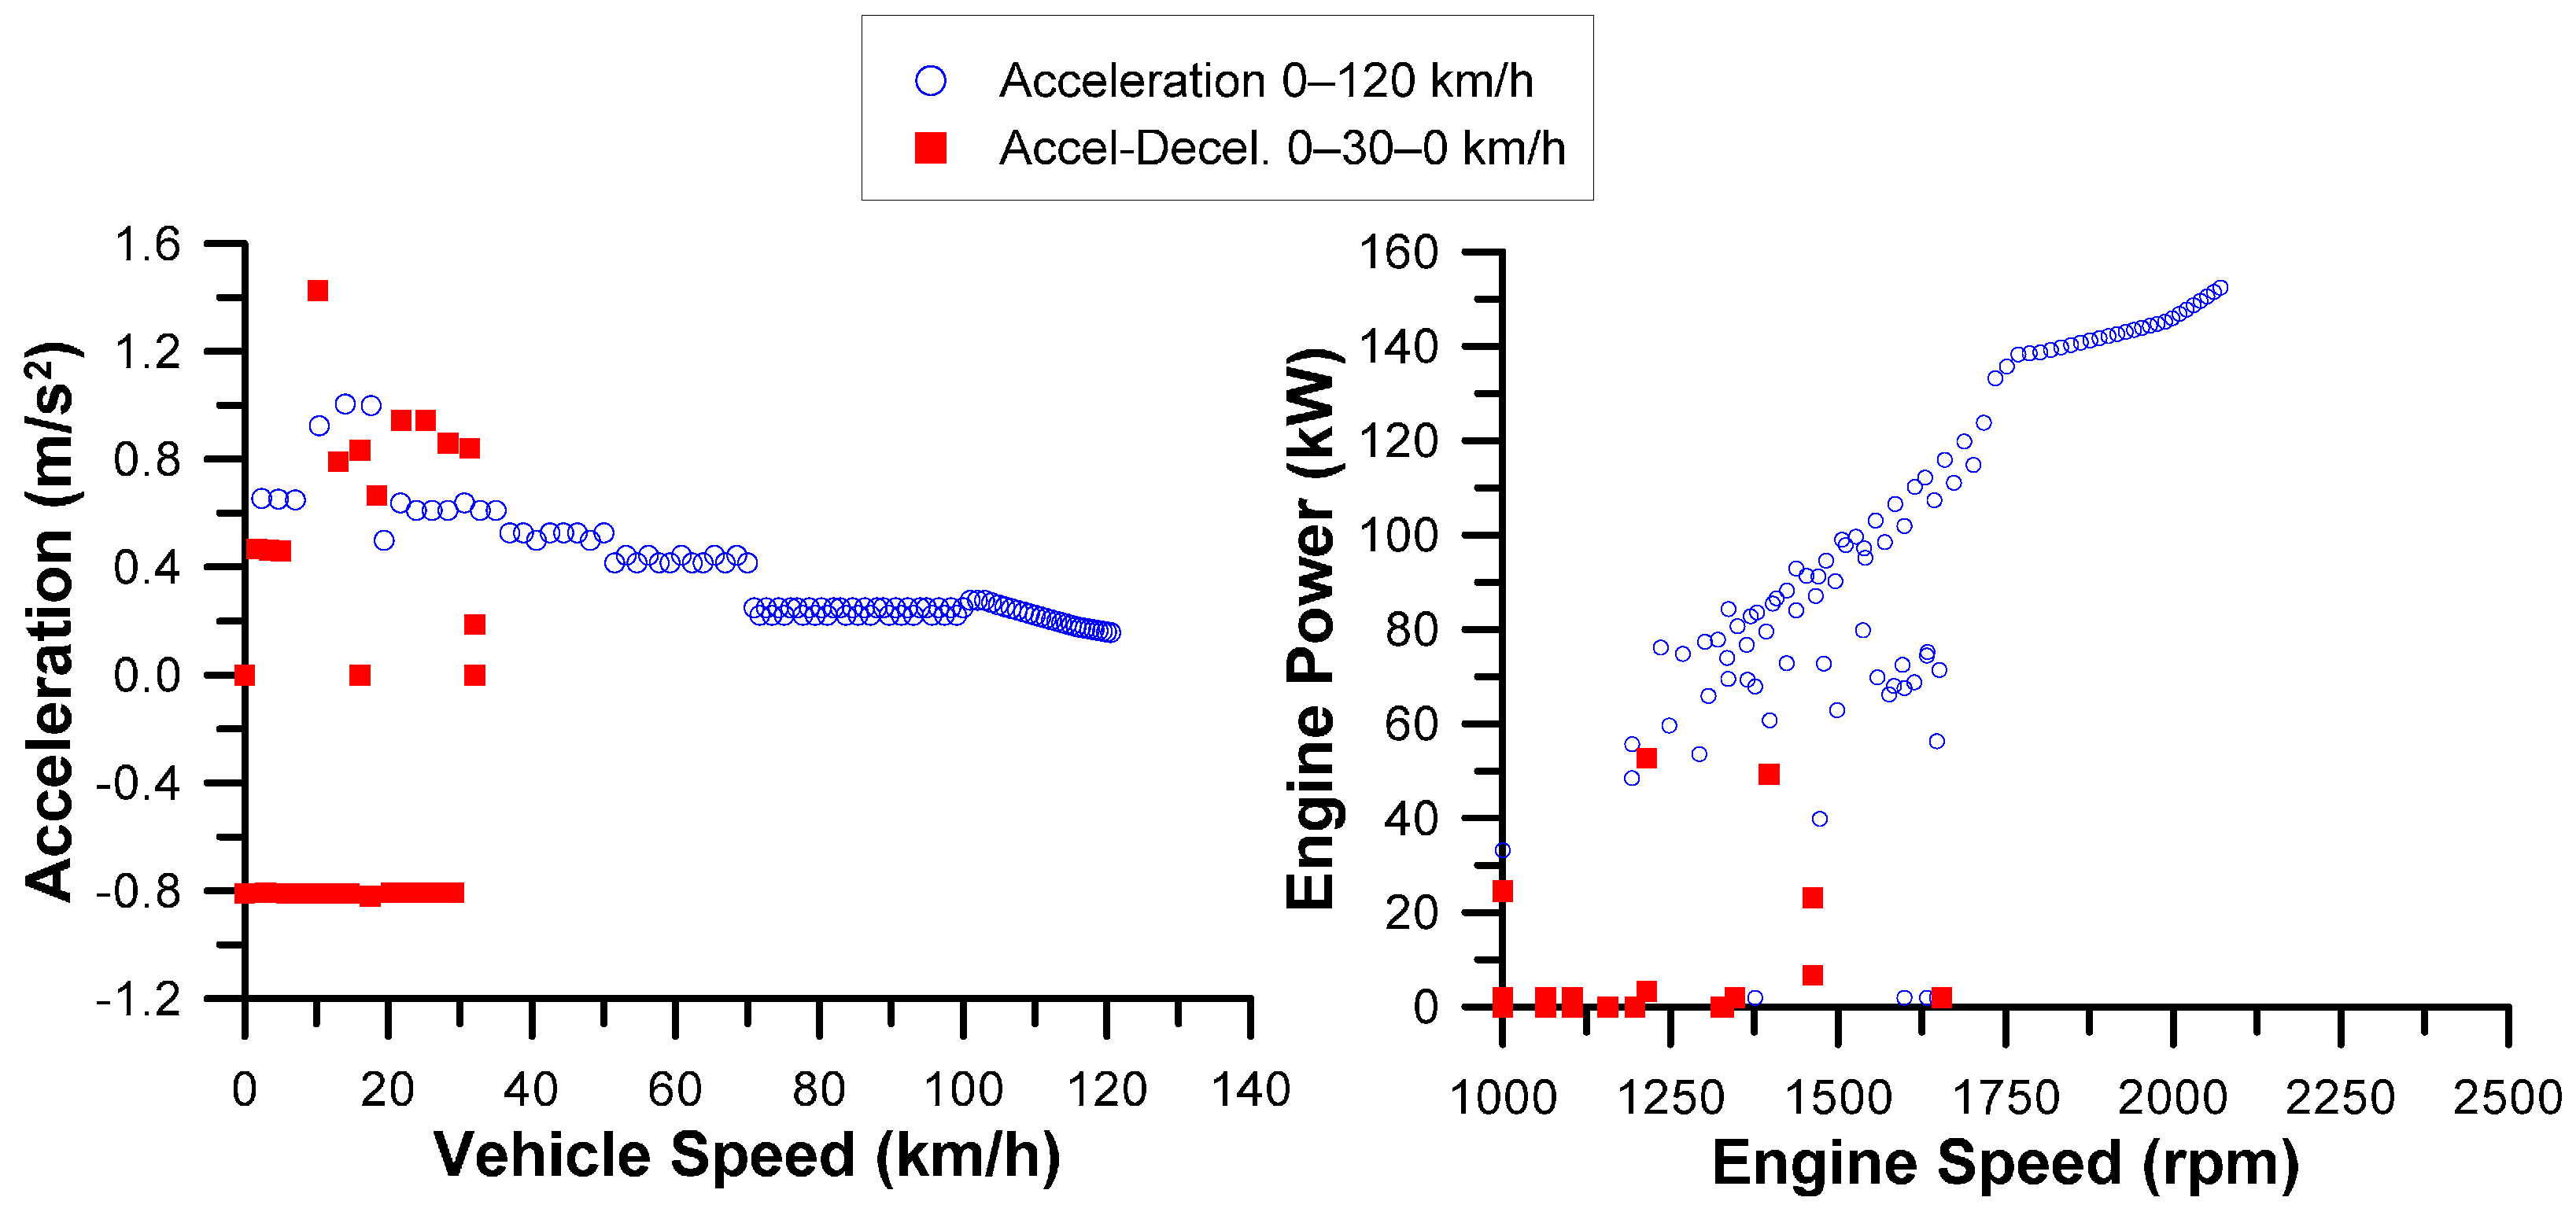
The completely different driving (and engine operation) profile between the two examined driving schedules is best illustrated in Figure 8 that demonstrates vehicle speed/acceleration distribution (left sub-diagram) and engine speed/power distribution (right sub-diagram). As noticed, the demand from the engine to cope with the prescribed transient is much harder during the first schedule, although the single highest vehicle acceleration is experienced during the second one.
Owing to the much more pronounced pollutants and fueling during the continuous up-gear shift schedule of Section 3.1, this is the transient schedule that will primarily be the basis for the parametric investigation that follows.

4. Parametric Study

In the following paragraphs, a comprehensive parametric analysis will be conducted focusing on engine-out pollutant emissions (NO and soot), CO2 and fuel consumption over the previously described transient schedules (mostly, the one of Section 3.1). To do so the computational/experimental procedure discussed in Section 2 will be applied. Overall, six influential parameters will be investigated, grouped into three categories. The first category will cover two basic vehicle attributes, namely mass and gearbox (Section 4.1). The second will focus on the driver, investigating driver ‘aggressiveness’ and the specific gear-shift change schedule (Section 4.2). Lastly, Section 4.3 will present the effects of road characteristics, namely road-type and gradient. Each parameter will be studied separately so as for its effects to be readily discernible.

4.1. Effect of Vehicle Attributes (Mass and Gearbox)

Perhaps the most obvious parameter influencing a vehicle’s performance (and emissions) is the latter’s mass. Two cases have been investigated apart from the nominal (corresponds to an unloaded vehicle). One with 1500 kg loading (e.g., bus with 20 passengers or half-loaded truck), and another with 3000 kg loading (e.g., fully-loaded bus or truck); the emission results are illustrated in Figure 9.
Predictably, the higher the vehicle mass, the higher the amount of emitted pollutants, CO2 and fueling. The obvious culprit here is the rolling resistance term, which increases in proportion to vehicle mass, hence leads to higher engine loads throughout the transient schedule, as the engine has to overcome higher ‘internal’ resistance; Equation (3) is helpful here, describing the rolling resistance term [4,26]:
F r = c f r W   cos θ = c f r   m V   g   cos θ
where mV (kg), W (N) are the vehicle mass and weight, respectively, θ is the road grade (=0; investigated later in the text, in Section 4.3), g is the gravitational acceleration (9.81 m/s2), and cfr the rolling resistance coefficient, studied in more detail in Section 4.3 too.
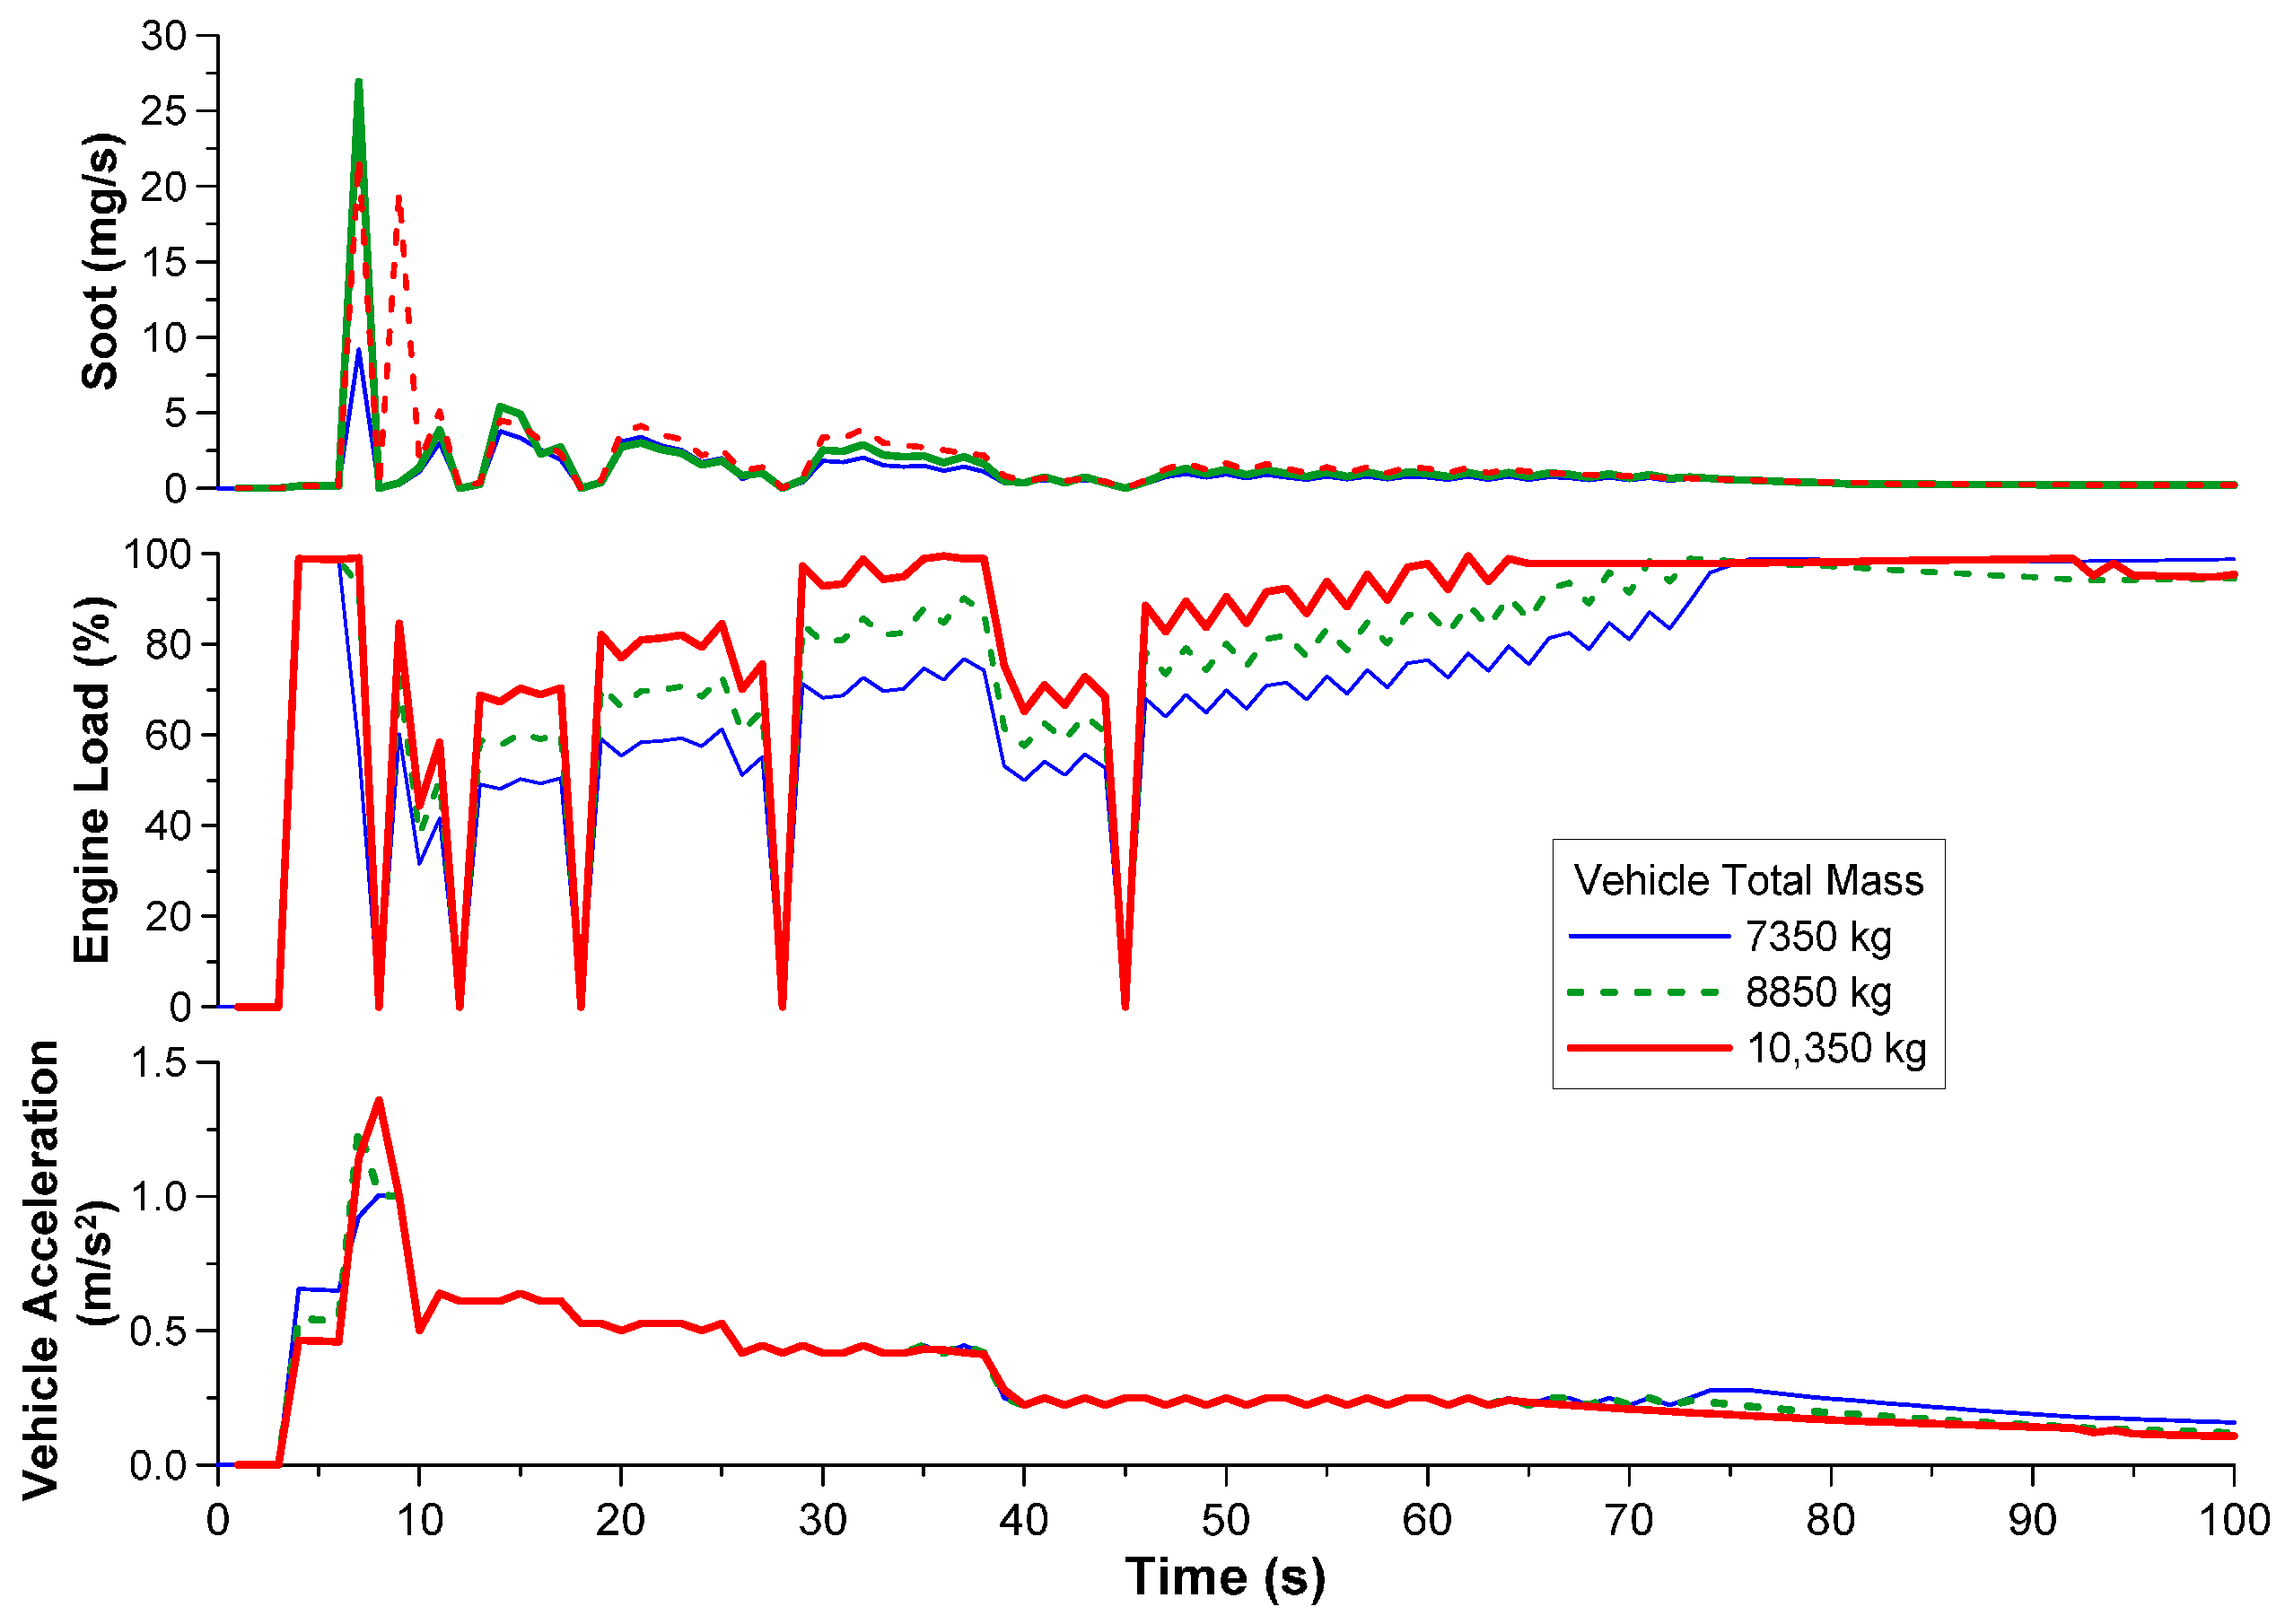
From Figure 9, it is revealed that it is the soot production that is mostly influenced by the increased vehicle mass. The higher the vehicle mass, the more intense the turbocharger lag phases during each acceleration in the cycle (owing to the need to overcome greater inertia), hence the lower the experienced air–fuel ratios. Supportive here is Figure 10 that presents the acceleration profile of the three trucks as well as the instantaneous soot emissions and corresponding engine load. The higher-mass vehicles experience harsher accelerations, particularly at low speeds, where the turbocharger lag is more pronounced as the turbocharger is called to operate from zero boost [1,2]. These harsher accelerations are, in turn, reflected into instantaneous higher engine loads (lower air–fuel ratios too that cannot be predicted by the current investigation) and much bigger amount of emitted soot, as the upper sub-diagram of Figure 10 illustrates. Closer examination of the lower sub-diagram of Figure 10 reveals another interesting feature. The higher-loaded vehicles are actually unable to follow the prescribed driving schedule when it comes to the ‘highway’ segment, as the engine cannot provide the increased torque needed (the 8850-kg vehicle follows the driving schedule up to the point it reaches a speed of 100 km/h, whereas the 10,350-kg one up to 91 km/h). Furthermore, the vehicle response is worse with increasing mass at the beginning of the transient event, owing to the 1st-gear mass factor MF being extremely high.
Following the above, the comparative emission data demonstrated in Figure 9, corresponds to the first 64 s of the transient schedule, during which all three vehicles were able to follow exactly the prescribed driving pattern, hence a direct comparison was feasible.
Overall, increase of the vehicle mass from 7350 to 8850 kg (+20%) resulted in 44% increase in soot, ‘only’ 5.4% in NO and 15% in CO2/fueling. Further increase to 10,350 kg (+41% increase in mass) led to 90% increase in the emitted soot, 9% in NO and 30% for CO2/fueling. Interestingly, for all three examined emissions, their correlation with vehicle mass proves highly statistical (R2 = 0.99).
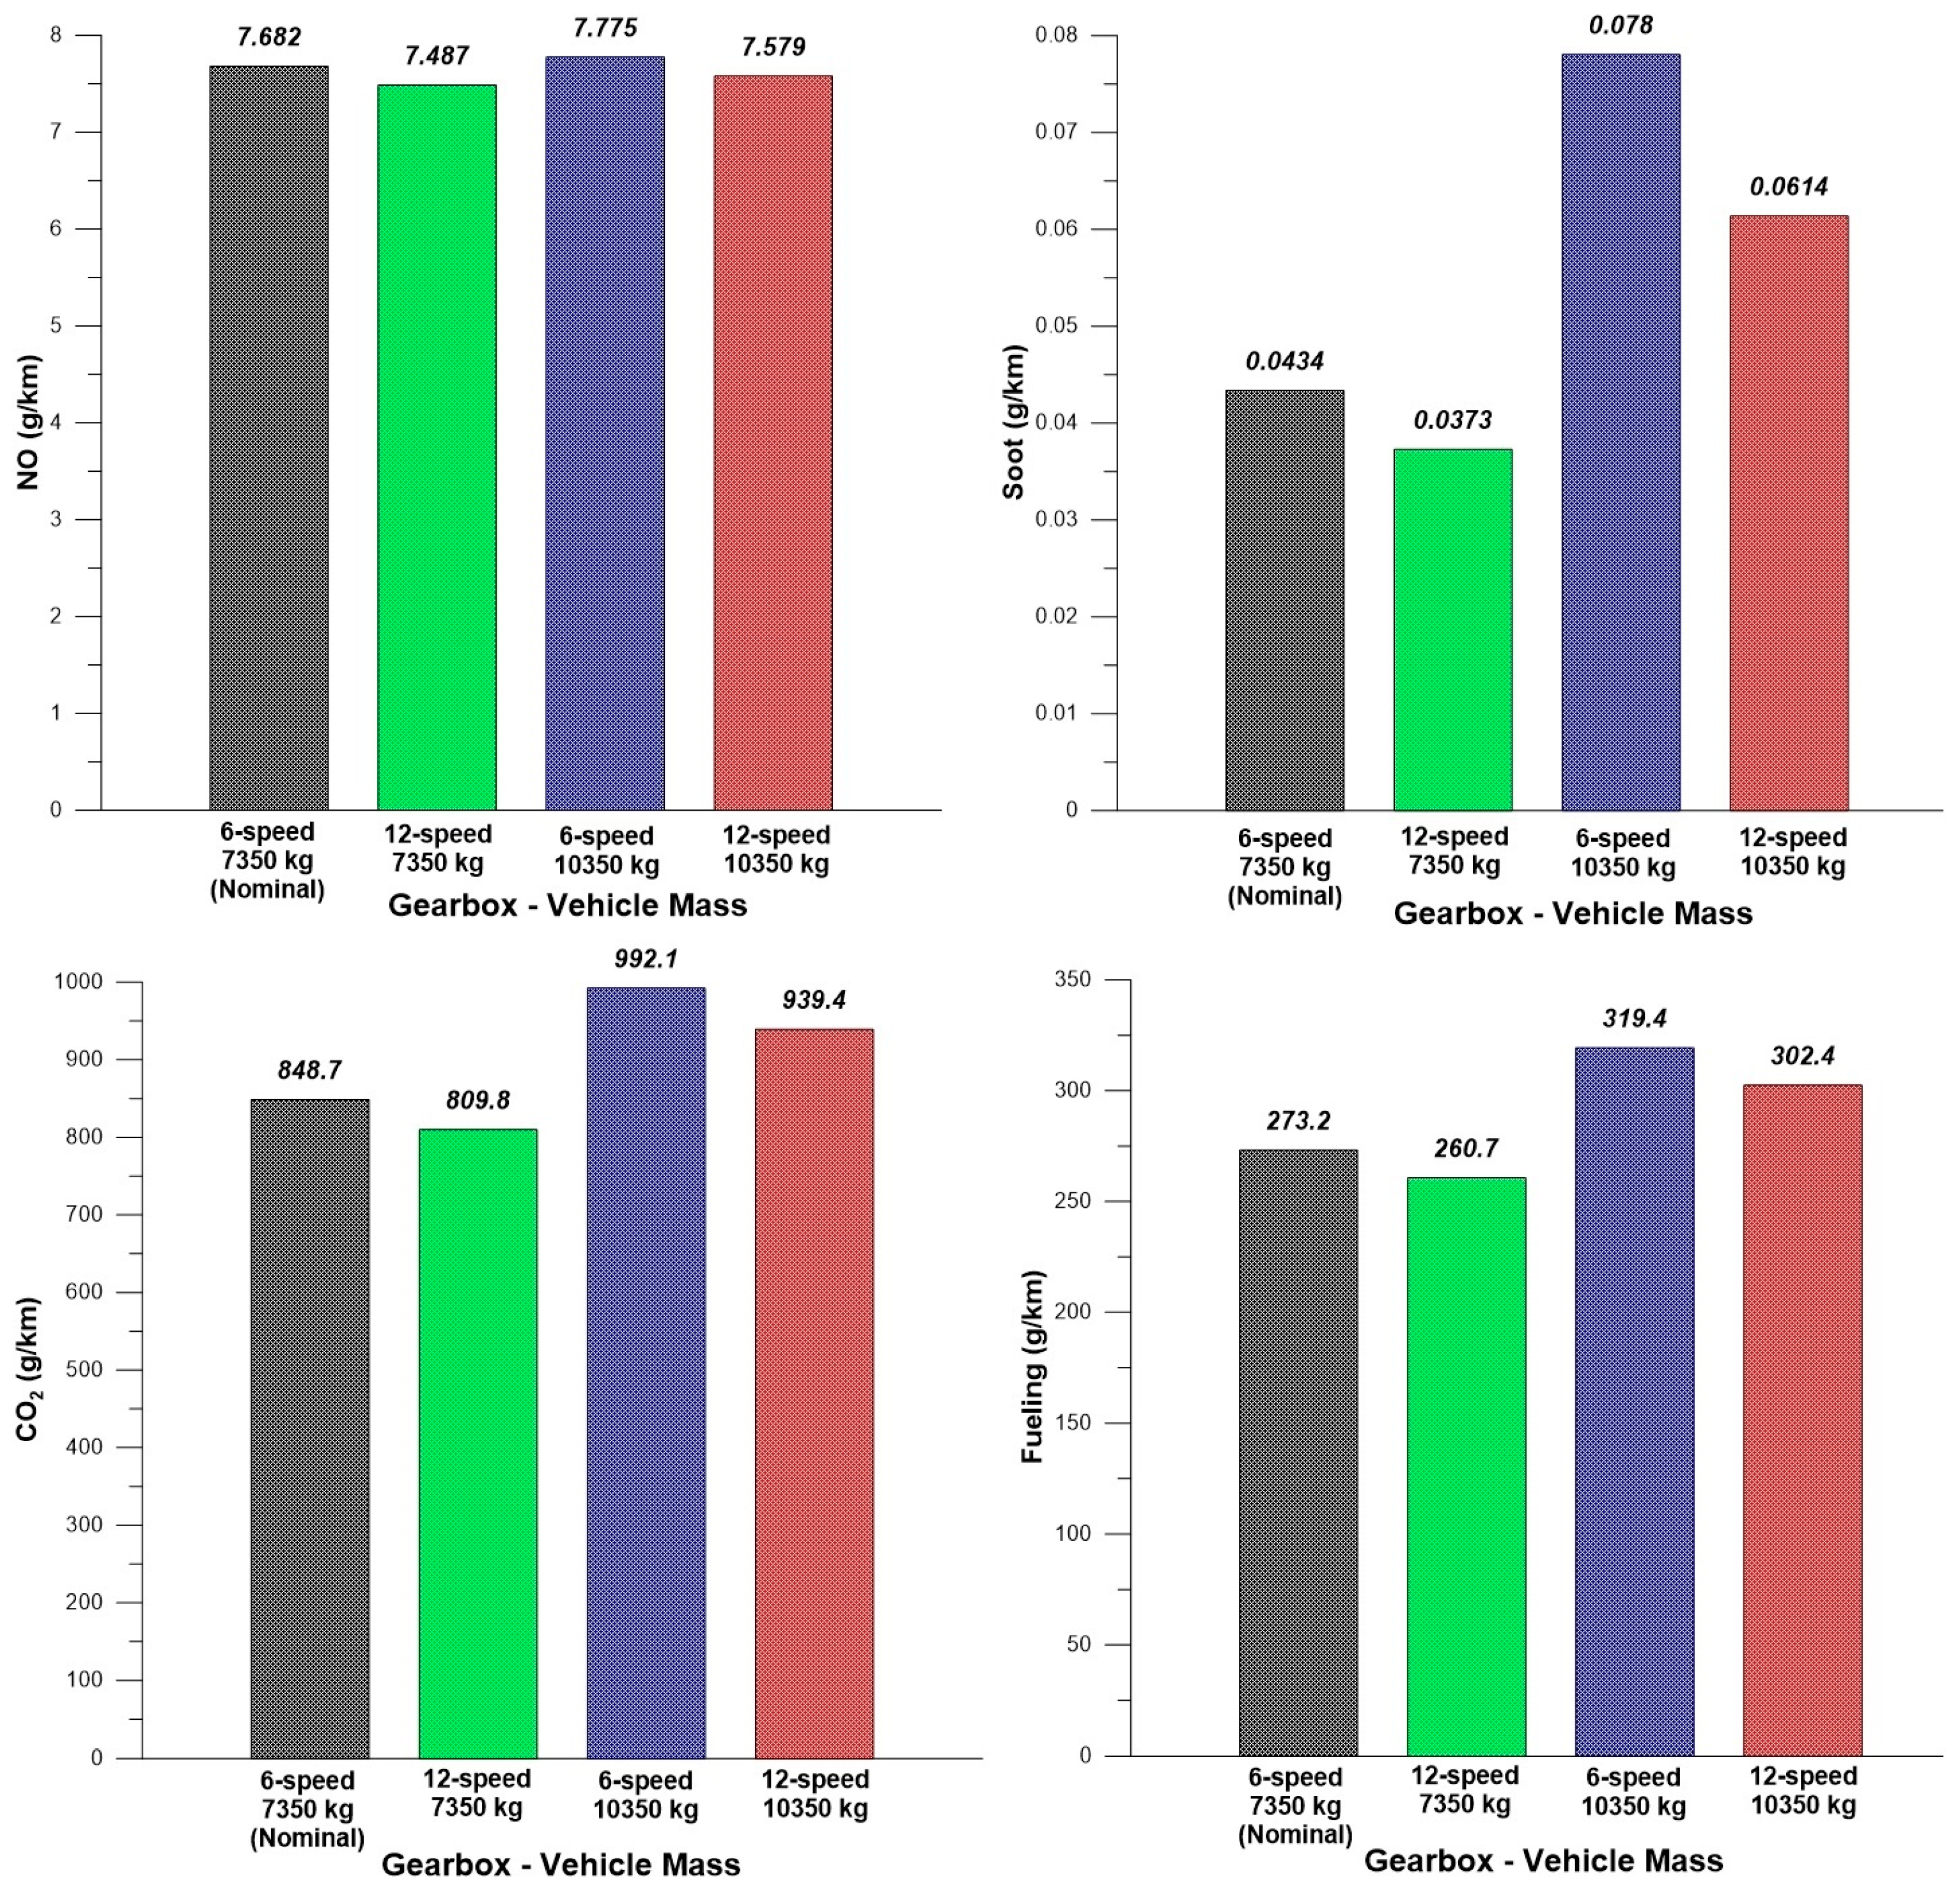
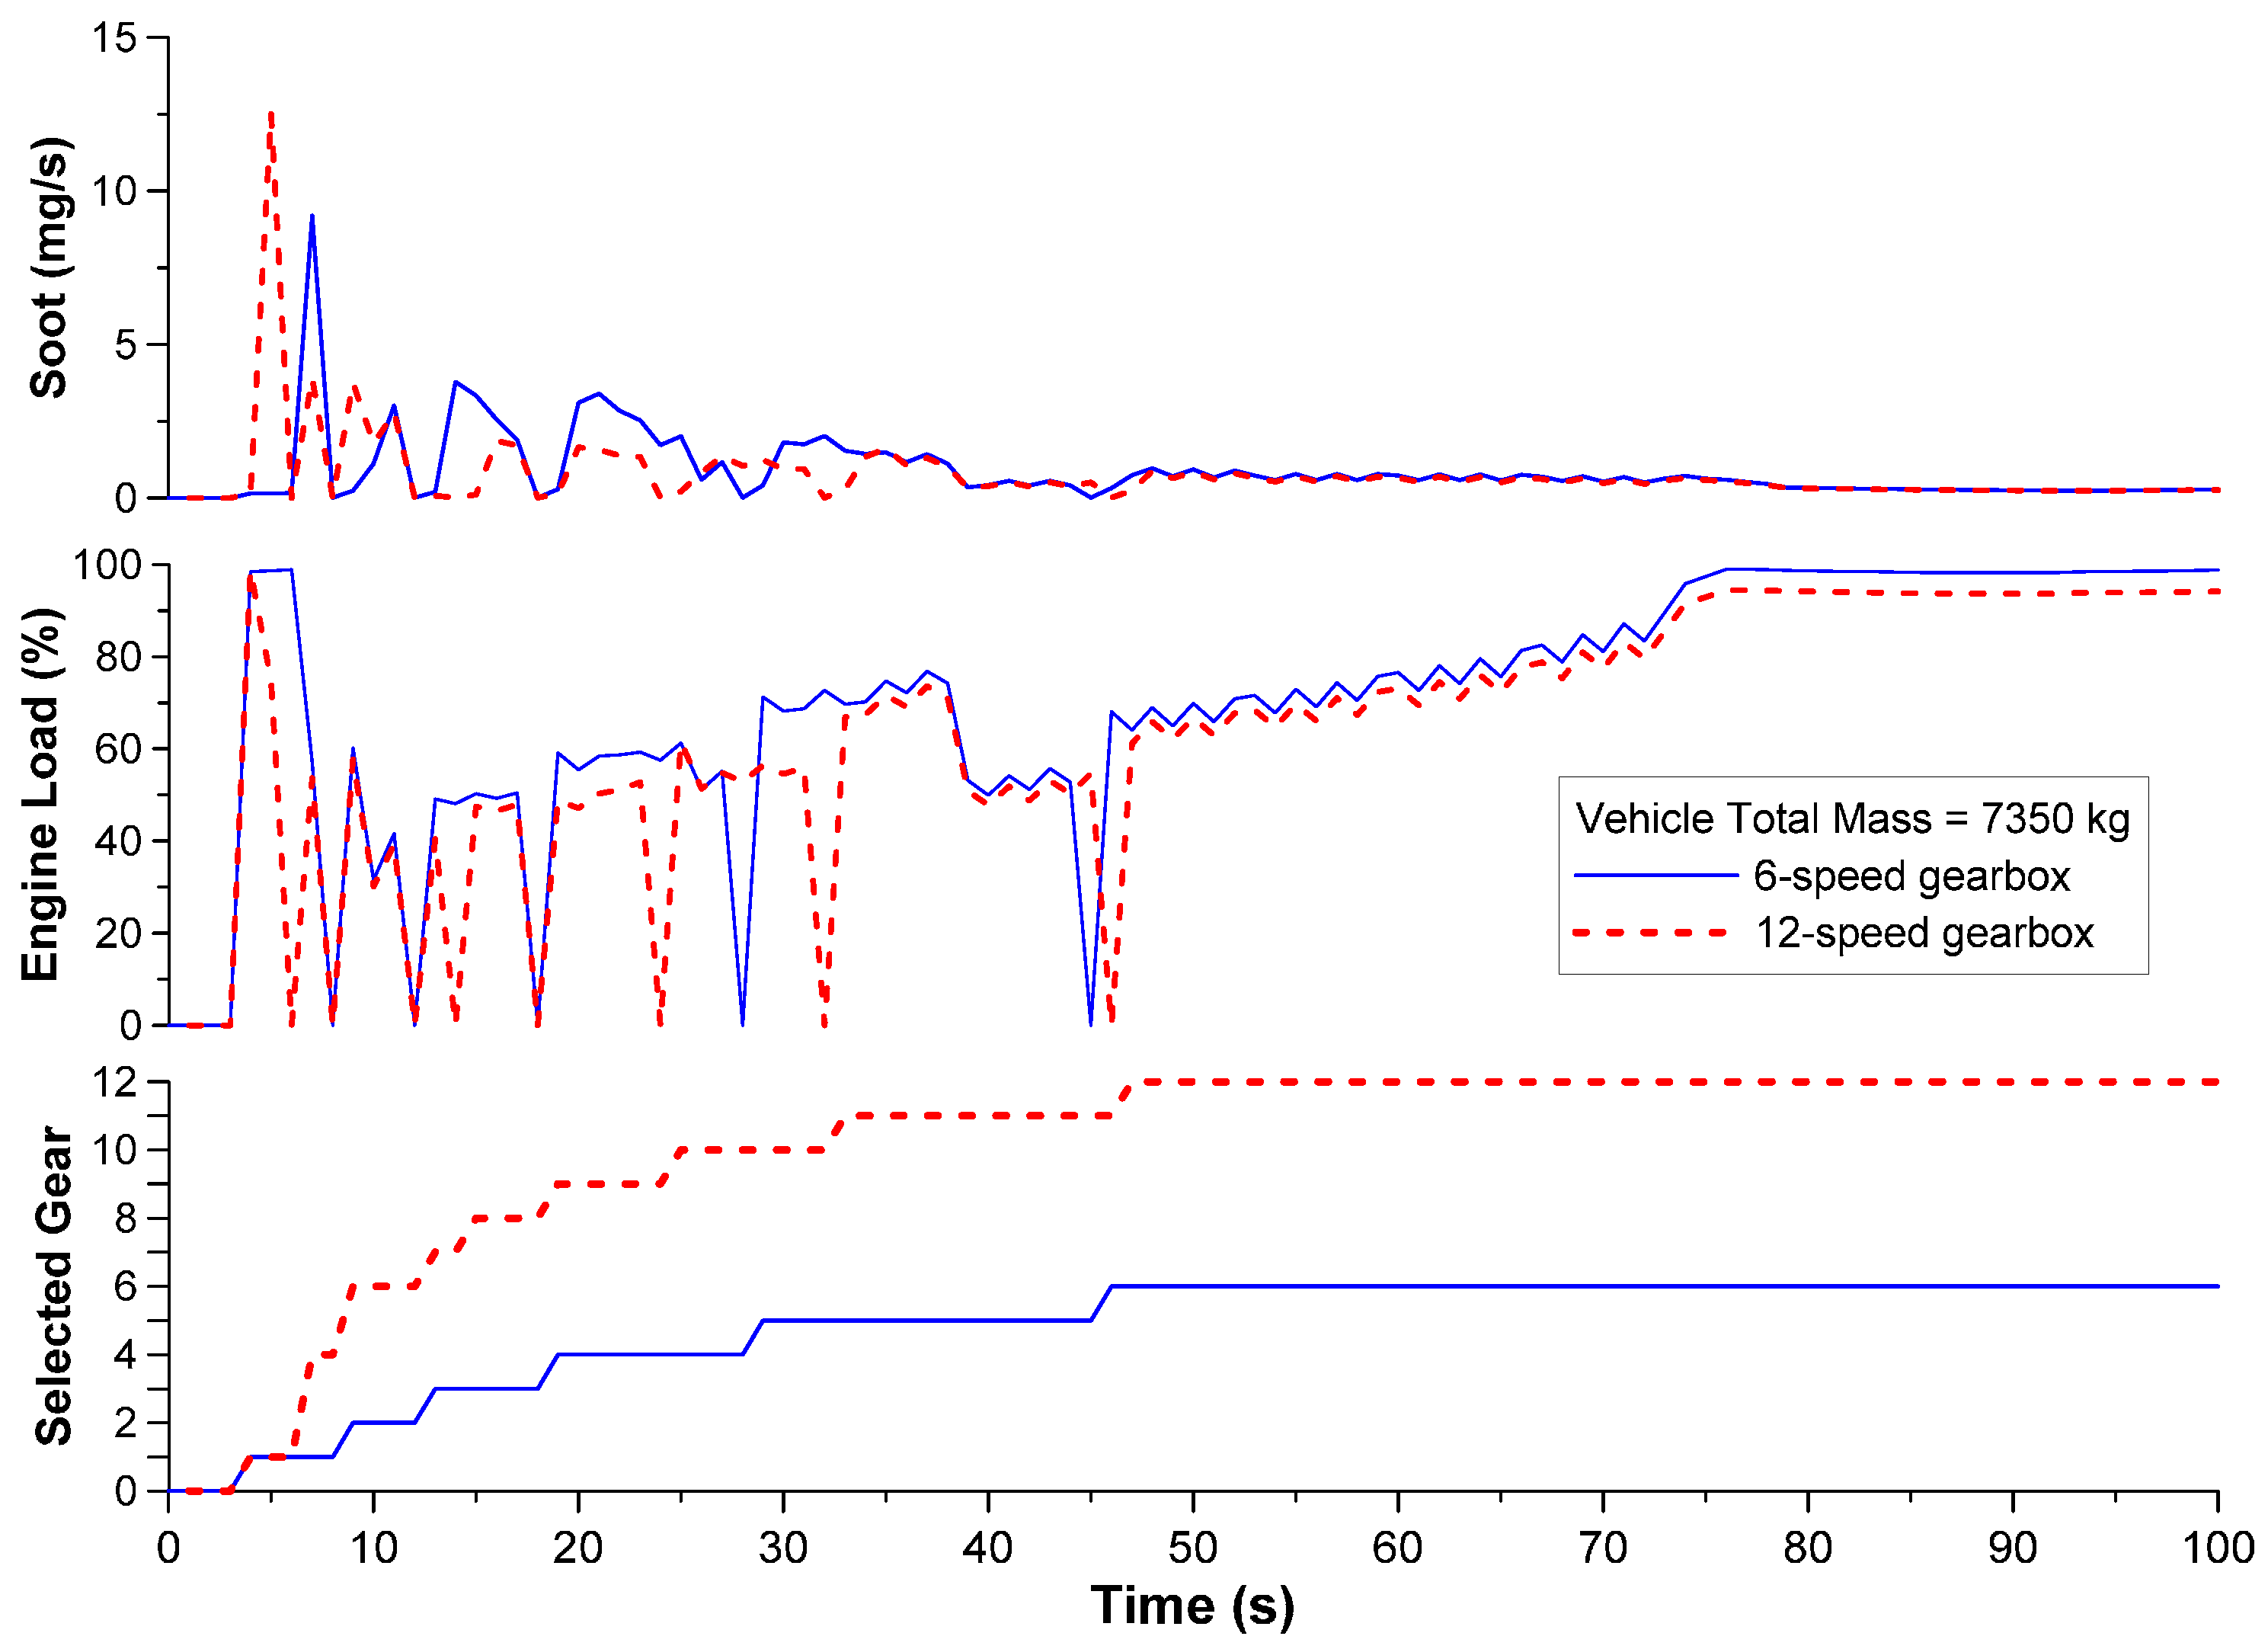
Figure 11 expands on the previous results by incorporating in the analysis the effect of the installed gearbox. Four cases are examined here, two with the nominal 6-speed gearbox of Table 2, and another two with a 12-speed gearbox (for either the 7350 or the 10,350-kg total vehicle mass). The results from Figure 11 indicate the beneficial effects of multi-speed gearboxes, as these clearly lead to lower engine-out pollutants and CO2/fueling.
The apparent explanation here is again located in the number and magnitude of the turbocharger lag occurrences. Namely, the more the available gears in the gearbox, the smaller the accelerations throughout the driving schedule, resulting in smaller speed changes and milder turbocharger lag phases [17]. The benefit is expressed in terms of lower emitted pollutants, primarily soot which is mostly influenced by steep transients [1,2]; Figure 12 supports these arguments. In this figure, it is also revealed (upper sub-diagram) that the initial acceleration from standstill is more demanding for the vehicle equipped with the 12-speed gearbox; this is due to its much higher MF value (1st-gear ratio being 14.94 compared to 7.72 of the 6-speed gearbox). Were it not for this ‘discrepancy’, the 12-speed-gearbox vehicles would have exhibited even lower cumulative soot and NO emissions throughout the examined transient schedule.

4.2. Effect of Driving Attributes (Driver ‘Aggressiveness’ and Gear-Shift Schedule)

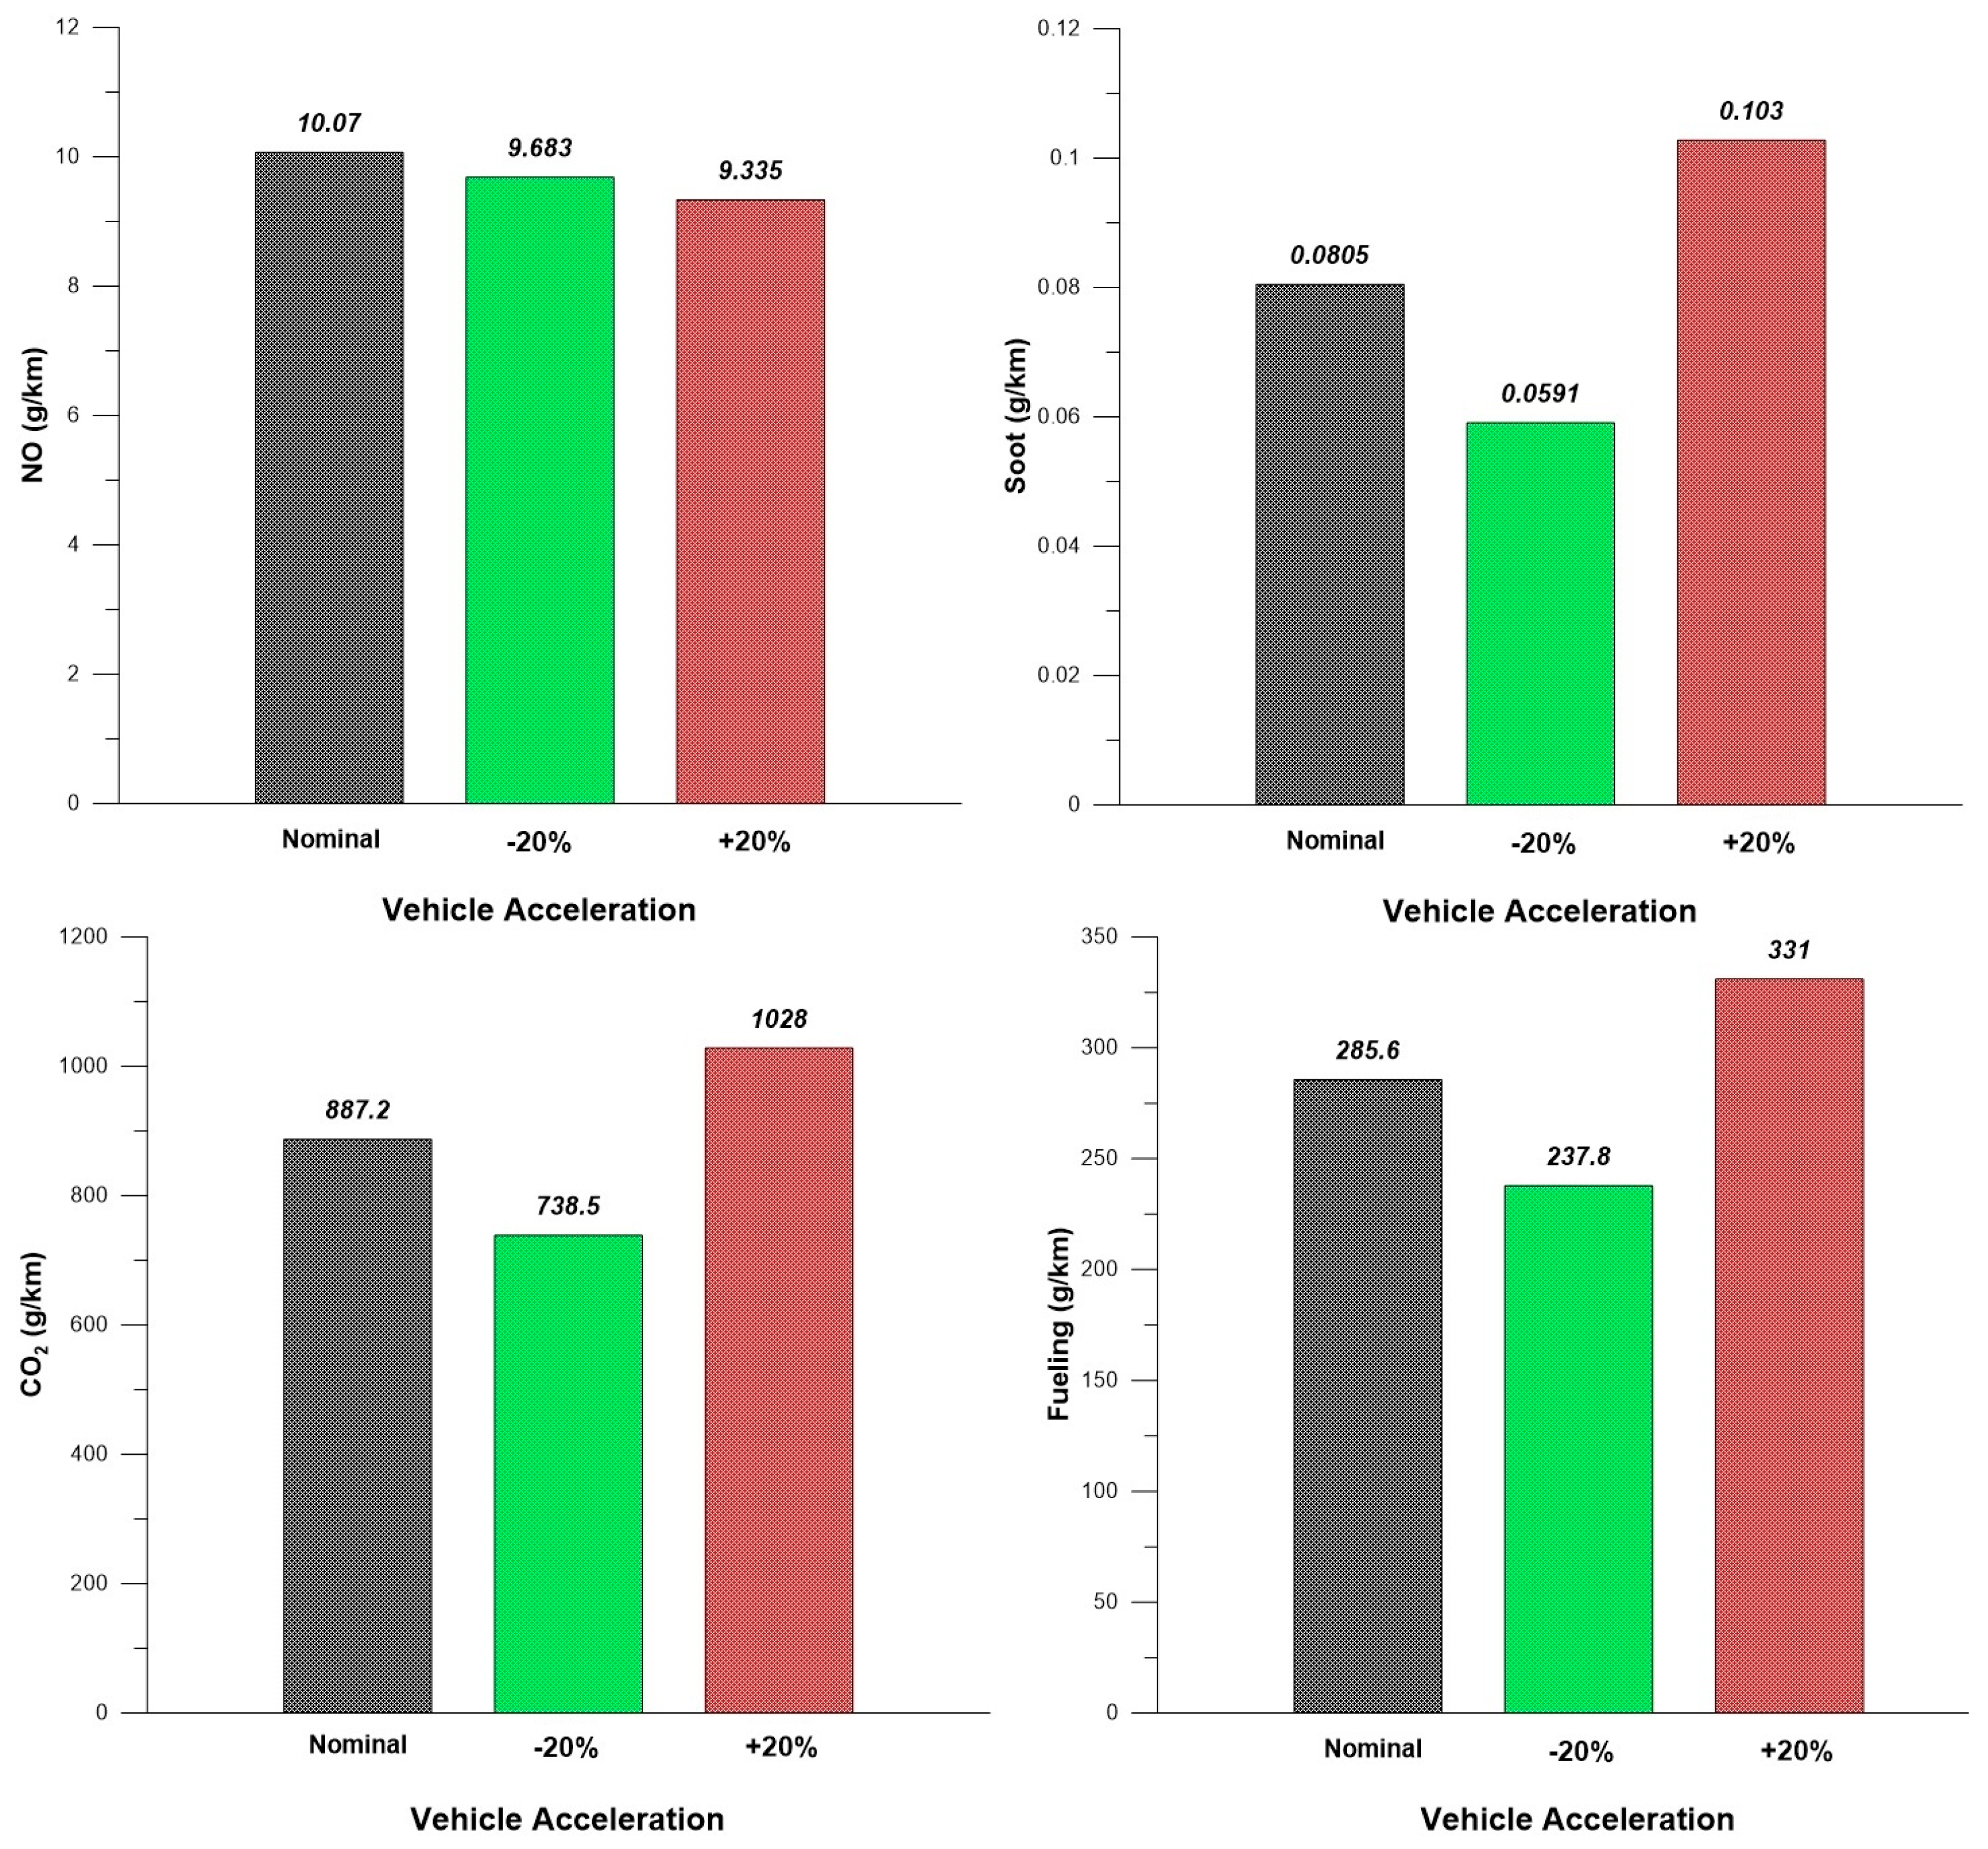
Further interesting comparisons can be made on the basis of the driver’s driving habits. In this section, the effect of the accelerating and the gear-shift profile will be studied. Figure 13 focuses on the accelerating profile throughout the transient event, investigating one more aggressive (average acceleration +20% compared to the nominal) and one milder (−20% compared to the nominal) approach. It is noted that the acceleration remains identical when the 1st gear is selected (owing to already very high MF value), whereas from the 2nd gear onwards, the different accelerating profile is applied.
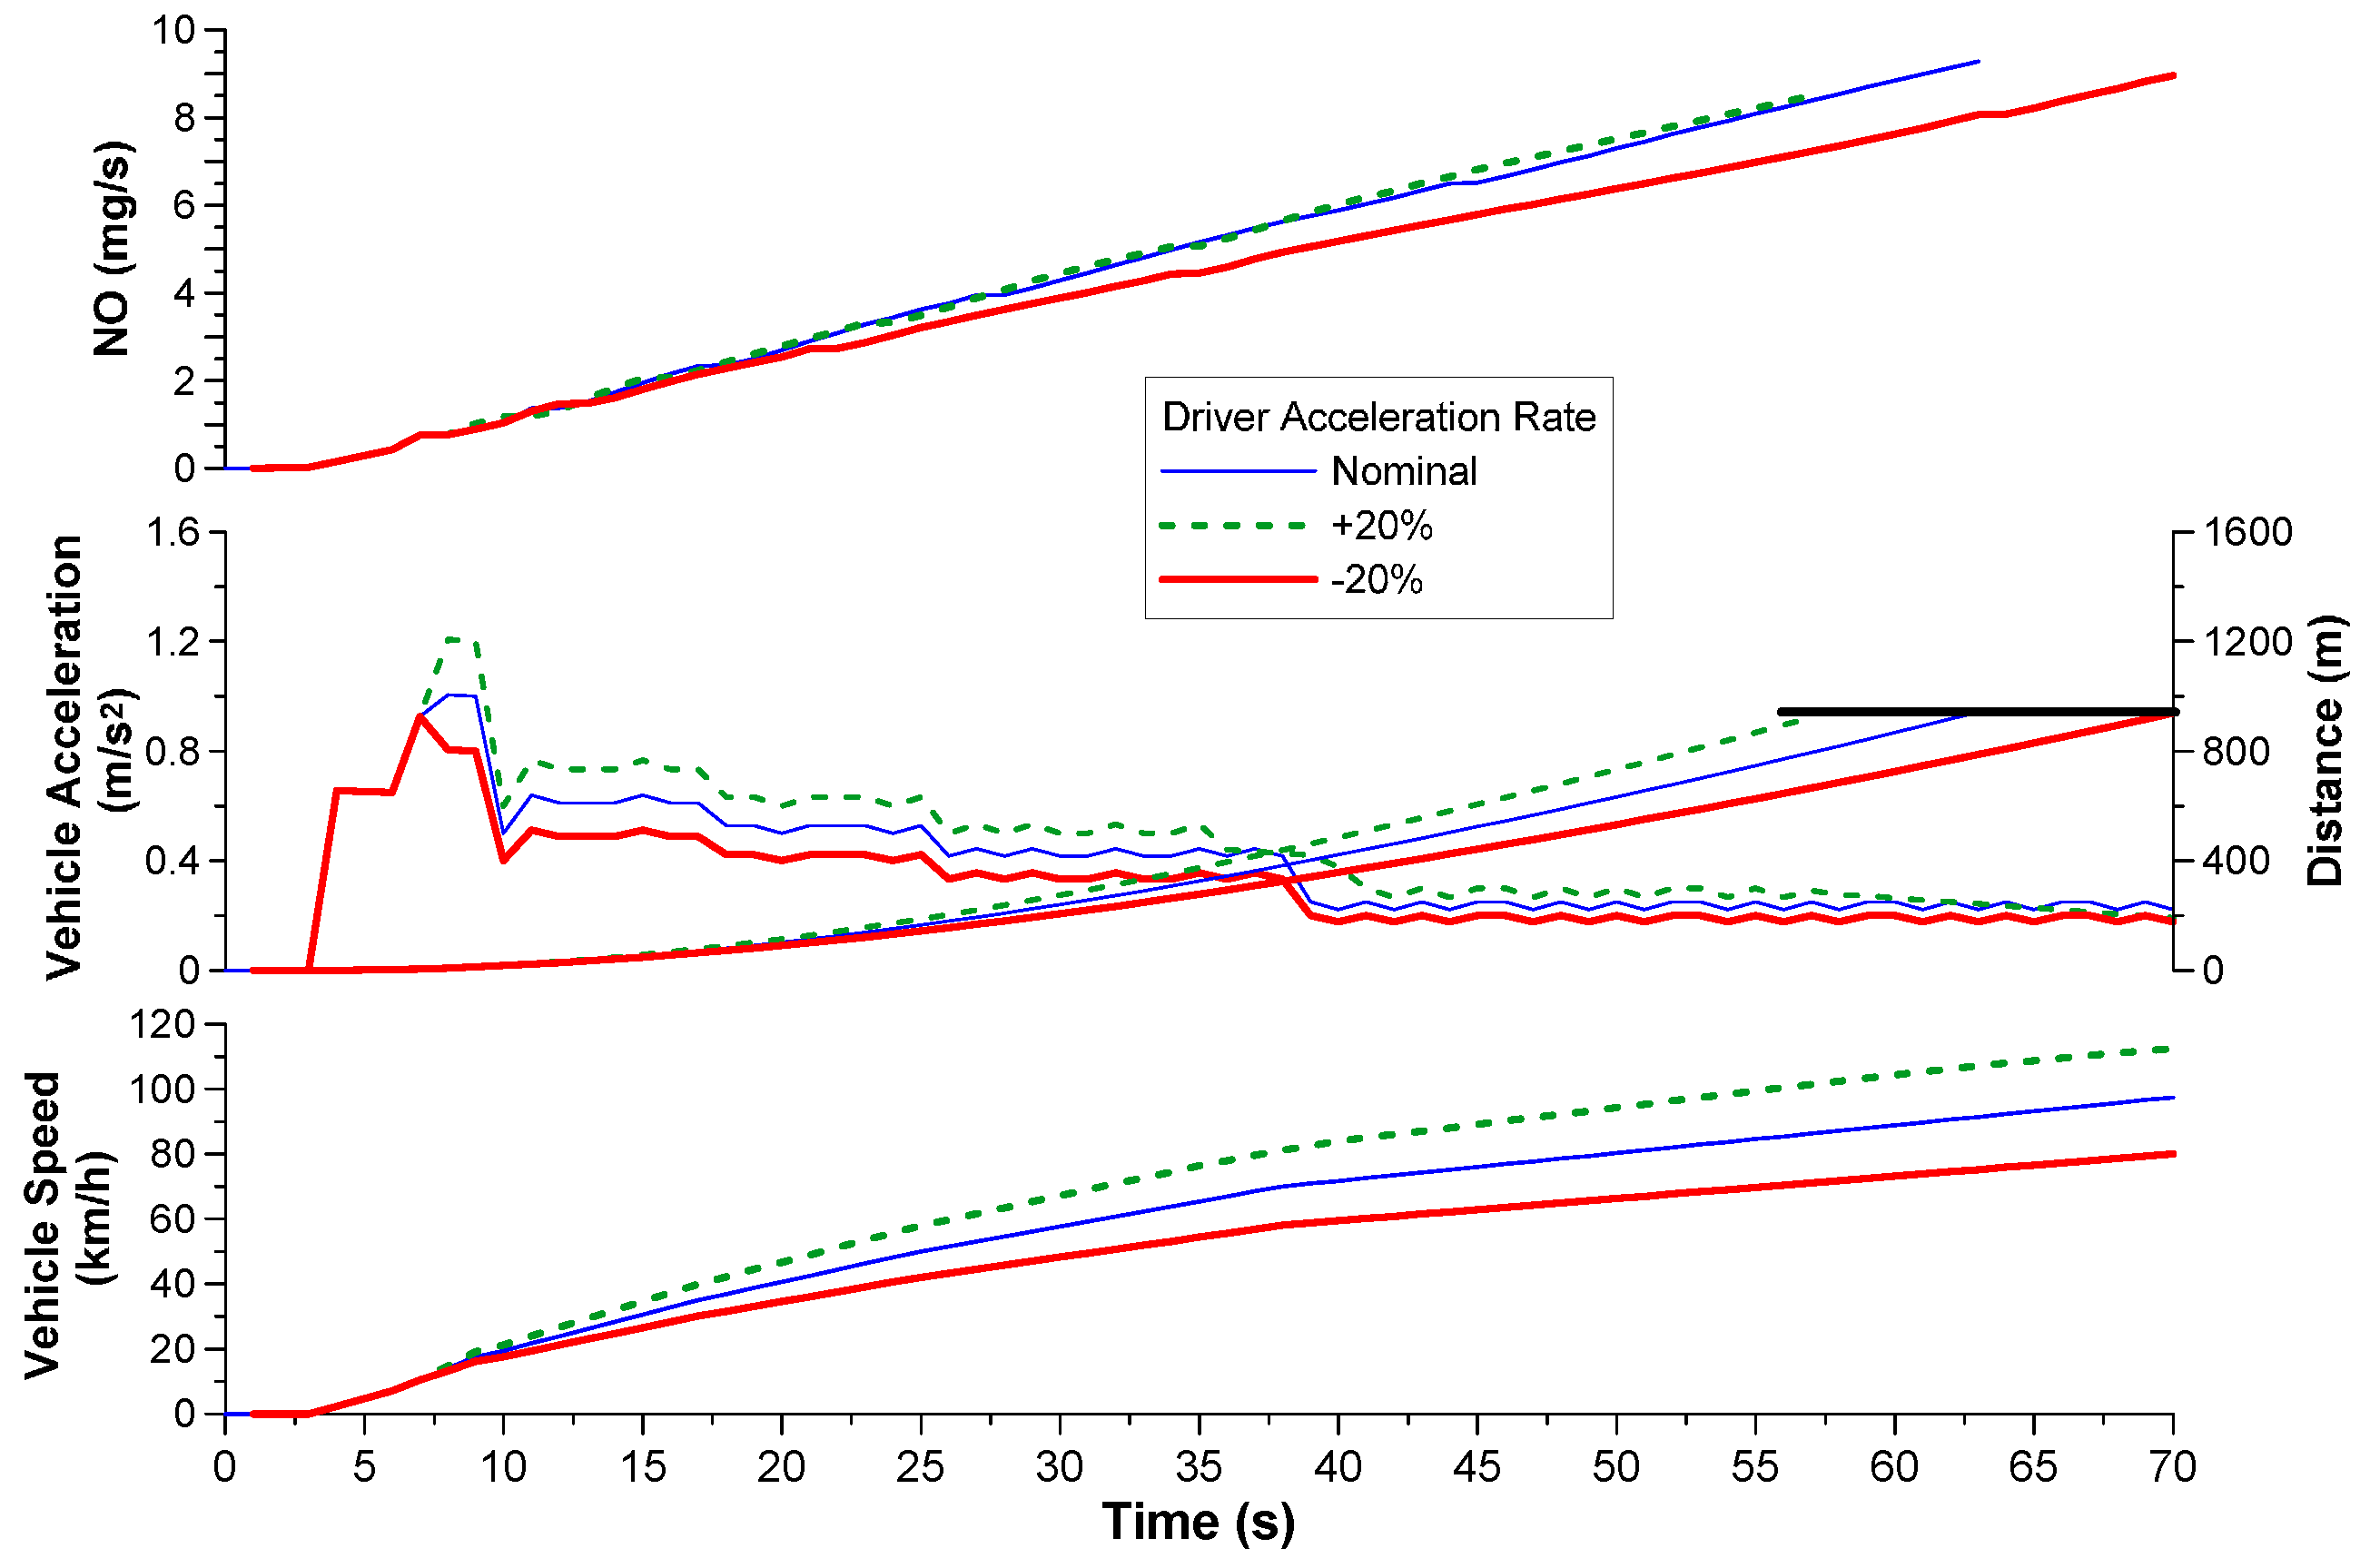
Since the vehicle speed profile is different for each case, the comparison is now made on the basis of the covered distance, namely 895 m—see Figure 14 (middle sub-diagram). For soot and CO2/fueling, the results presented in Figure 13 were rather expected. More aggressive driving results in harsher accelerations, hence more pronounced turbocharger lag that enhances the production of soot. The increase in engine loading is then reflected into increased fuel consumption. A different picture is, however, drawn when NO emissions are investigated. As observed in Figure 13, and further expanded in the upper sub-diagram of Figure 14, NO emissions increase during both the milder and more aggressive acceleration. For the latter case, the explanation is obvious. For the former (−20% acceleration rate), this result was perhaps not anticipated. The instantaneous absolute values of emitted NO when driving conservatively, are, of course, lower. However, owing to the much smaller acceleration (compared to the other cases), the time needed to reach the distance of 895 m is longer, hence more NO is cumulatively emitted, as the upper sub-diagram of Figure 14 depicts (recall that NO is also emitted when cruising, much more than soot). The same result would be reached if the comparison was made on the basis of the driving time for all three scenarios. In that case, the emitted NO for the lower accelerating case would be lower (owing to milder accelerations) but the covered distance even shorter; distance being the denominator in the g/km values of Figure 14.
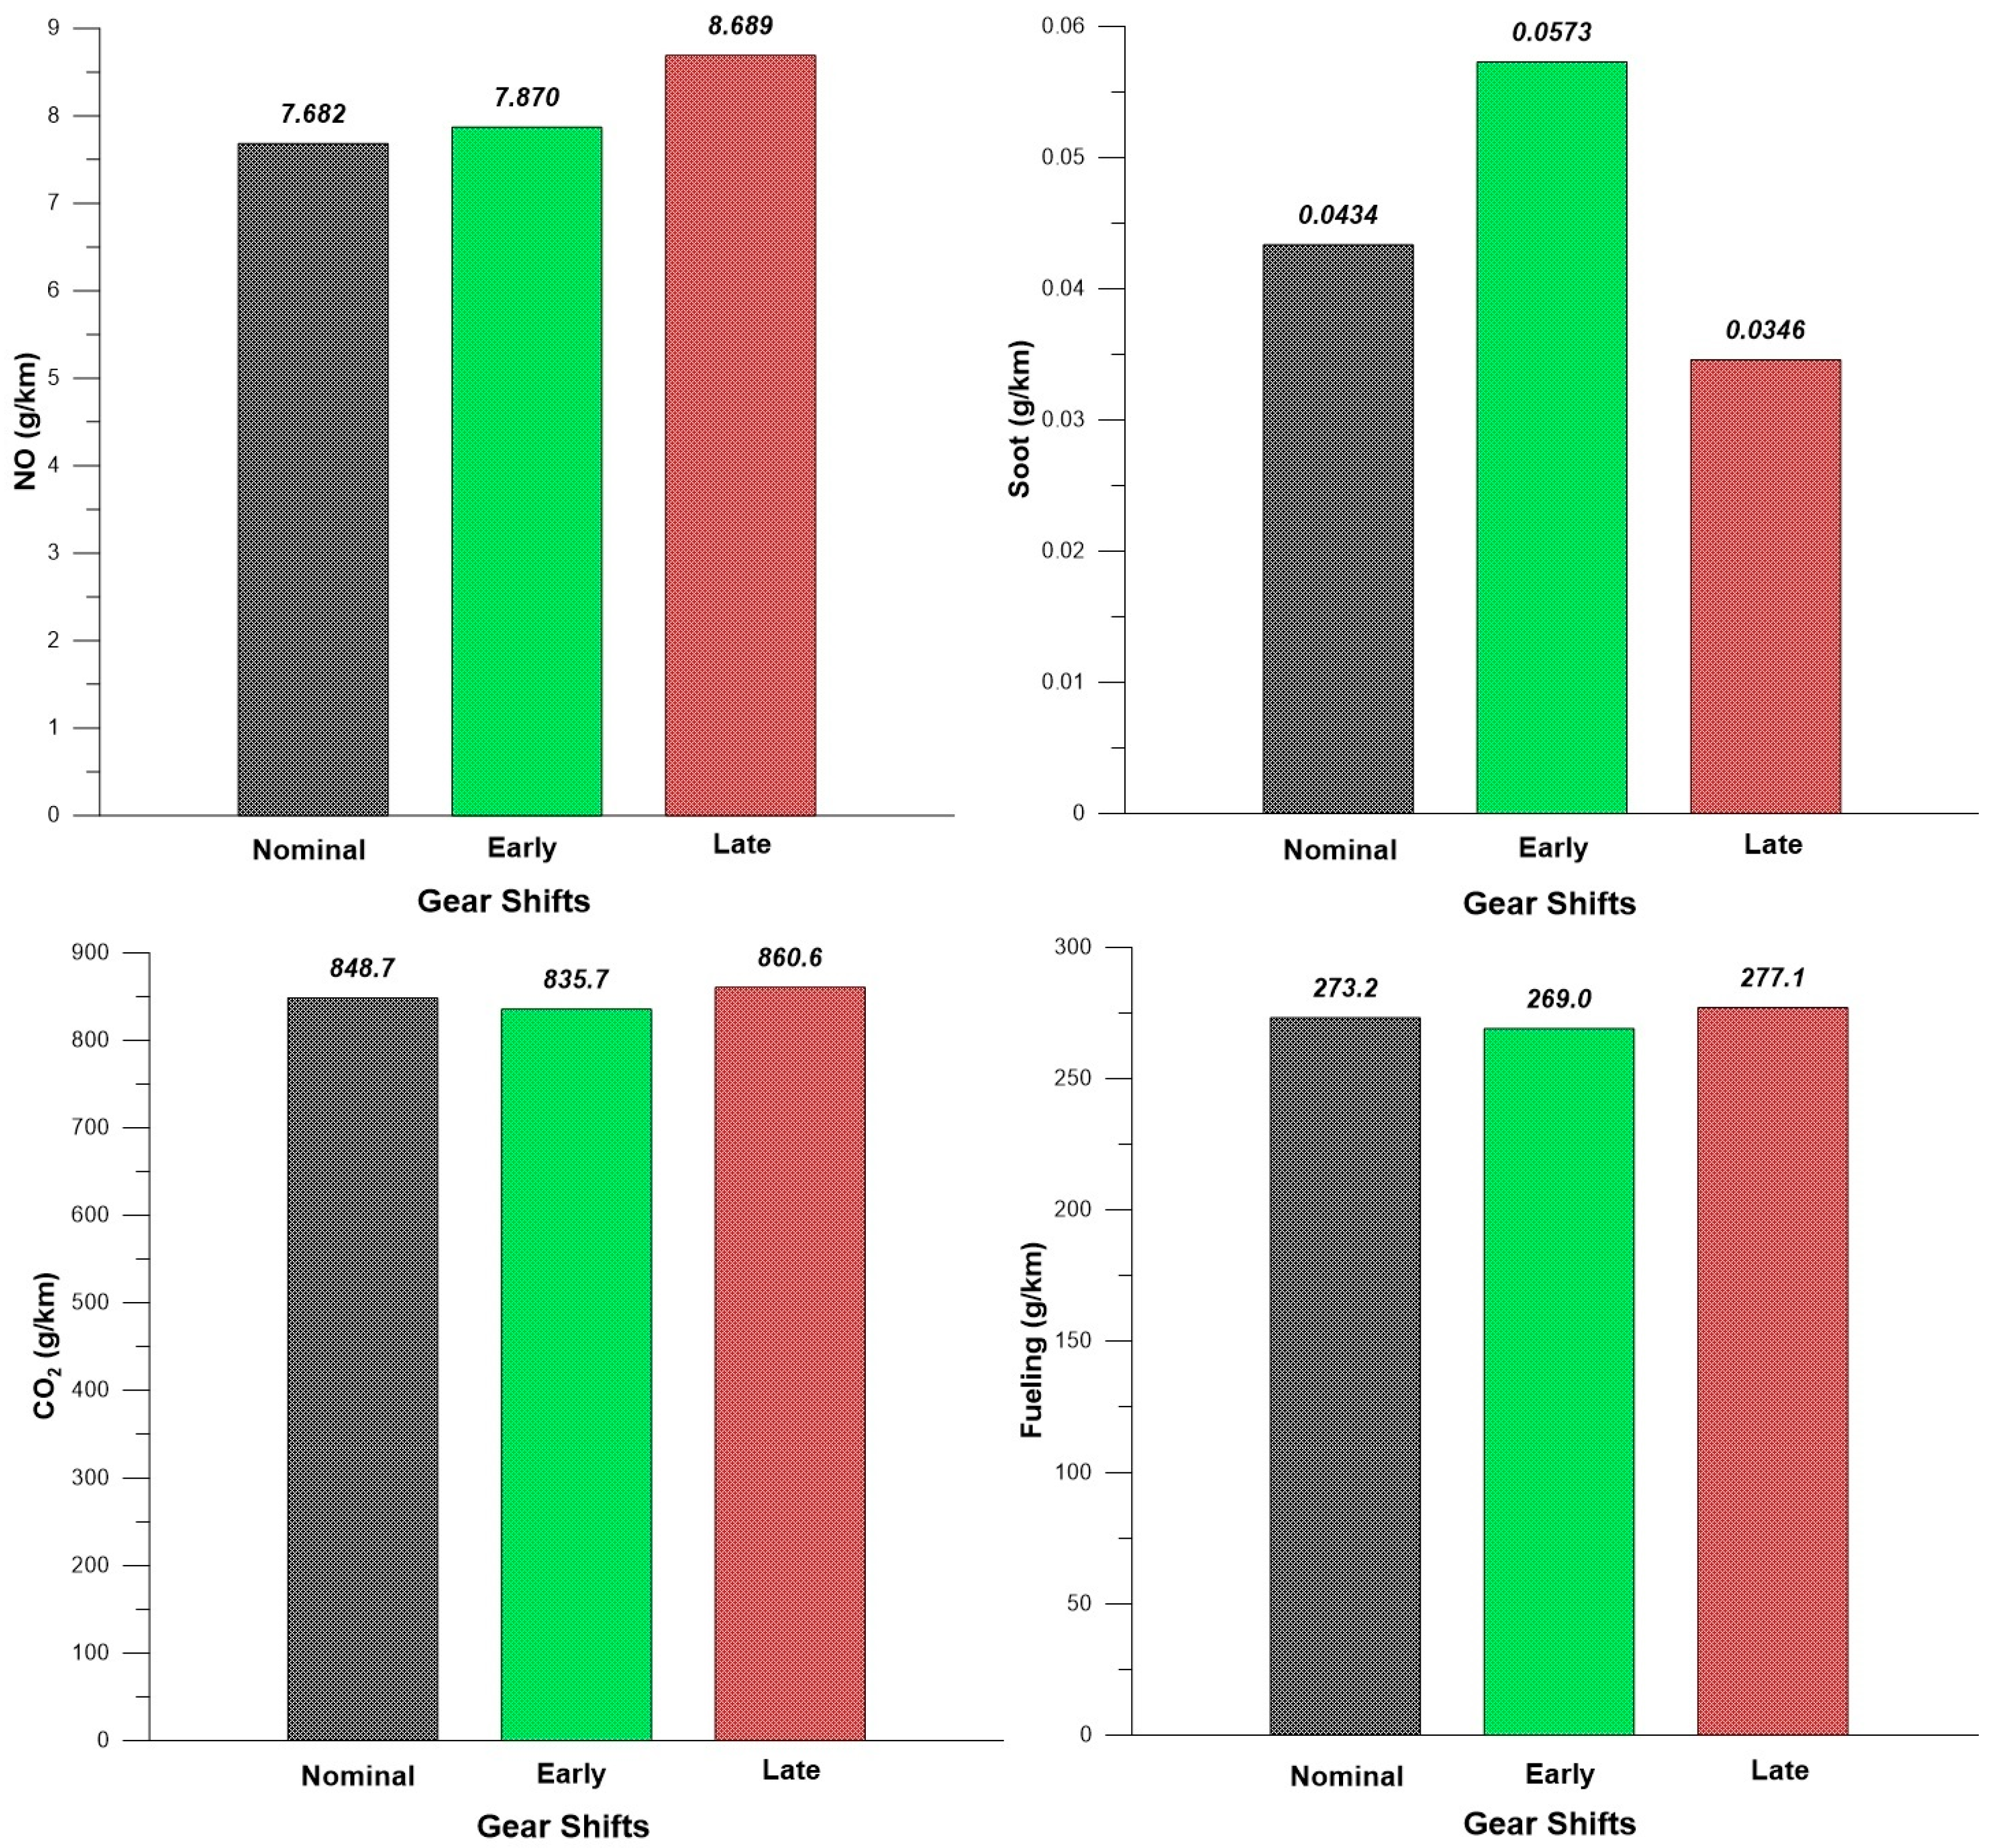
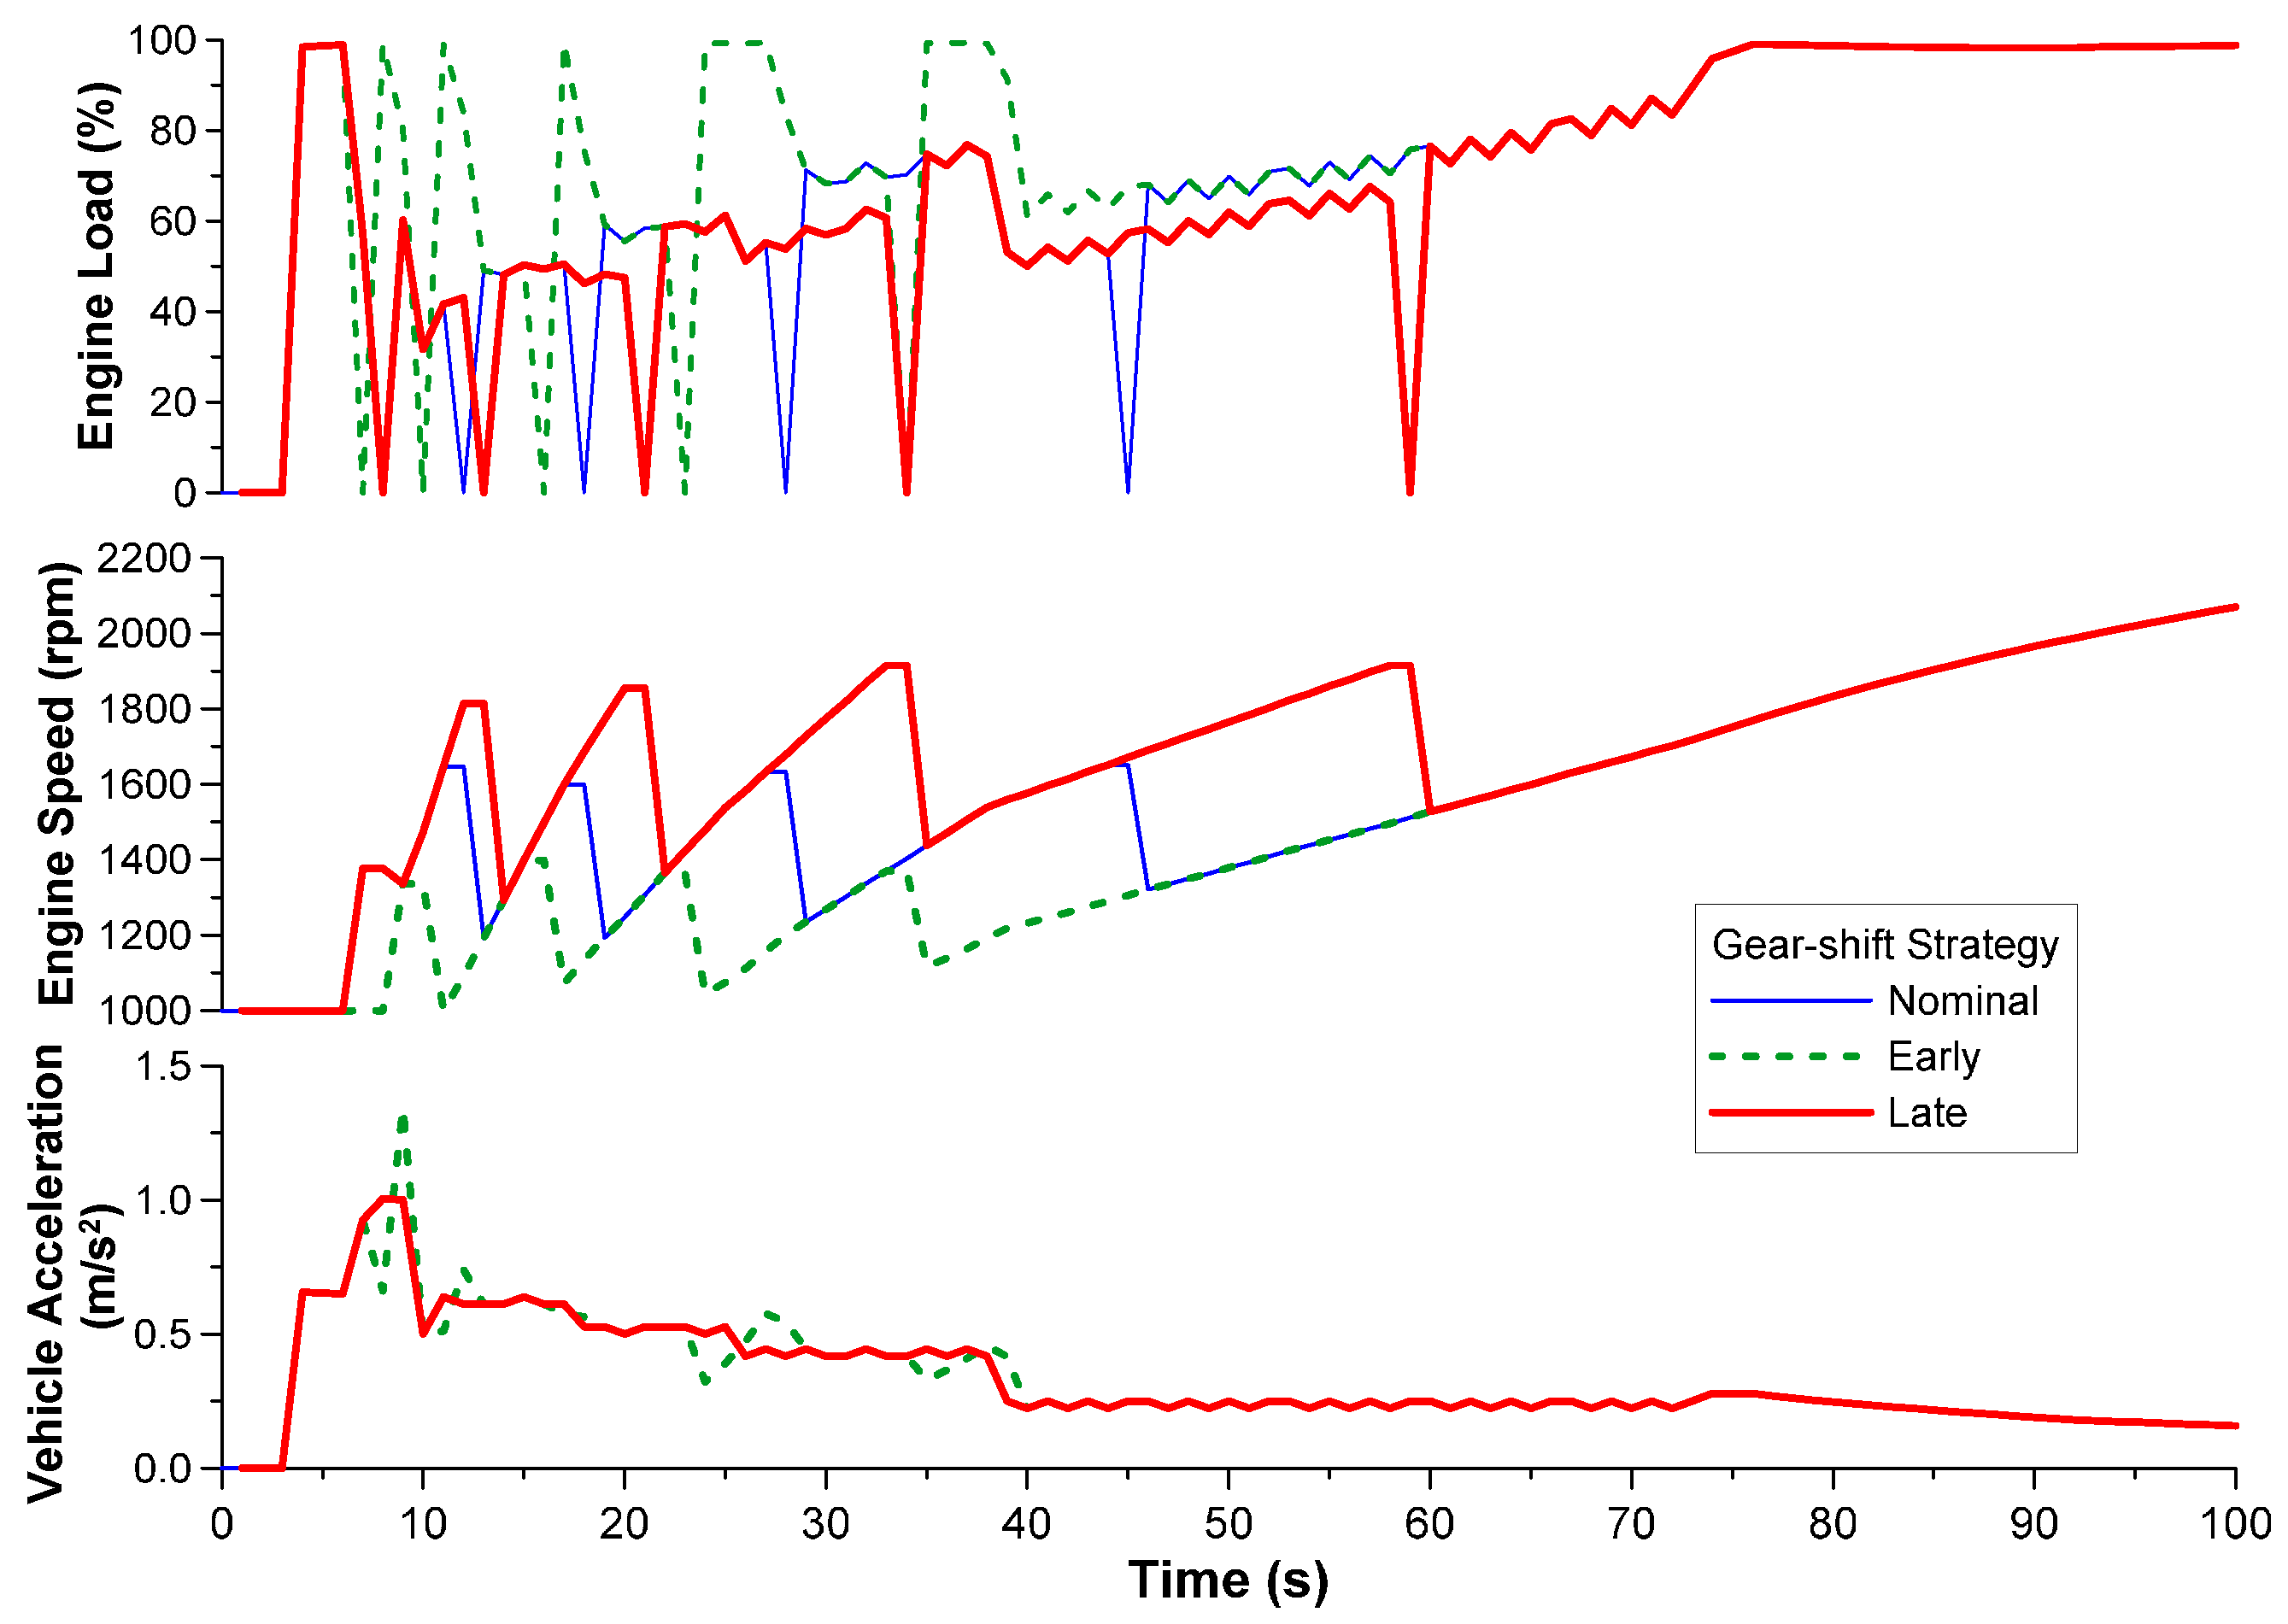
Figure 15 illustrates the effects of the gear-change timing on the cumulative soot, NO and fueling/CO2 during the studied transient schedule. Two cases are examined here apart from the nominal, namely one with earlier and one with later gear-change strategy. A first important conclusion from the analysis is that when an earlier gear-shift scenario was selected, the vehicle was unable to follow the prescribed transient schedule. This was due to the fact that the engine was called upon to operate with higher loading at lower engine speeds, which was not always feasible. In general, the engine operated at higher loading levels throughout the whole transient (upper sub-diagram of Figure 16) when earlier gear changes were selected, a fact that influenced decisively the amount of the emitted pollutants. As expected also, the late-change scenario led to higher engine speeds during the transient event (middle sub-diagram of Figure 16).
From the vehicle acceleration profile, it is obvious that the earlier gear-change timing led also to more abrupt accelerations, a fact that was responsible for the increased soot emissions. On the other hand, NO increased more when the gears where changed later than normal, as owing to the higher engine speeds involved, the quasi-steady NO emissions were higher too. Interestingly, fueling seems to be independent of the gear-shift strategy. This comes as a result of the combined effect of higher engine speeds coupled with lower accelerations (late-change scenario) or vice versa (for the earlier-change case).

4.3. Effect of Road Characteristics (Road-Type and Gradient)

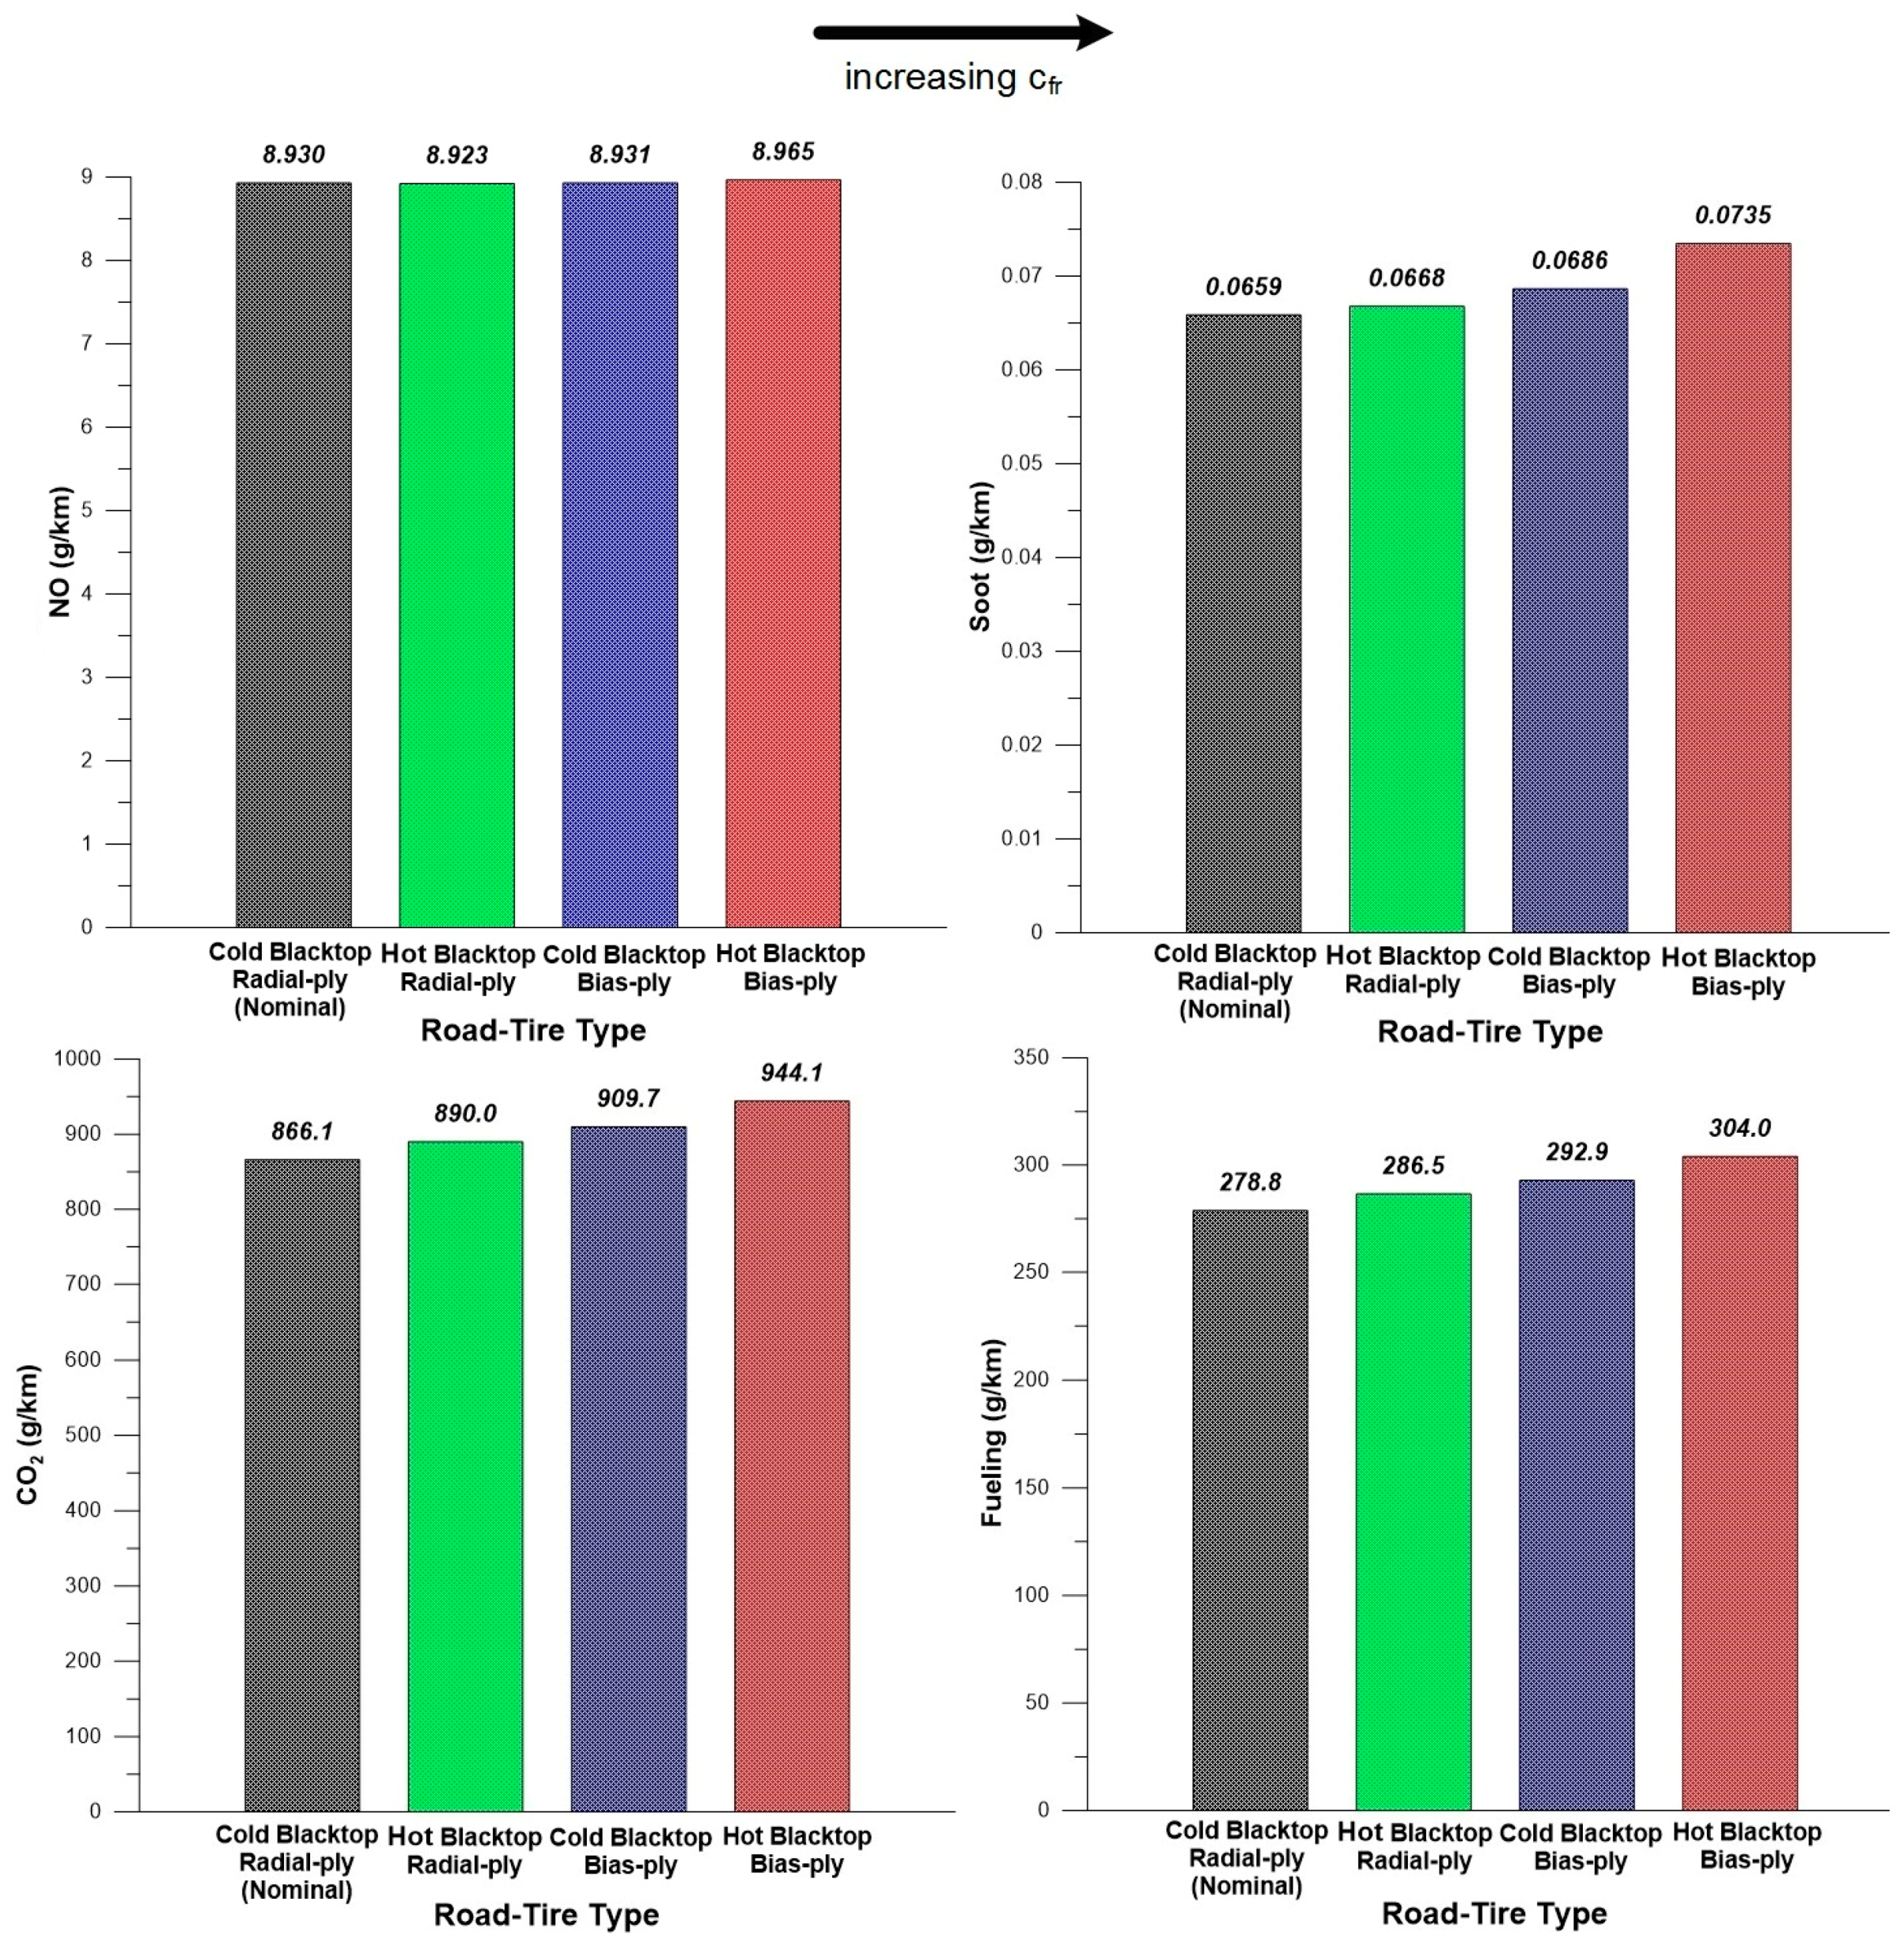
The last category of examined variables deals with road parameters, namely road-type and gradient. Figure 17, in particular, compares four combinations of road-types/vehicle tires. It is reminded here that the road-type and tire influence the friction coefficient between vehicle and road. Thus, they determine the rolling resistance force Fr through Equation (3) mentioned earlier in the text. The investigated parameter here is the friction coefficient cfr in Equation (3), which is influenced by tire deformation (biggest contribution), tire penetration and slippage. In general, cfr increases with increasing loading, vehicle speed and decreasing tire pressure.
Two road-types are studied, cold and hot blacktop, each one with radial or bias ply tires. The presented results in Figure 17 seem rather self-explanatory in this case. Increasing the resistance coefficient between tires and road, leads to an increase in the respective force, hence engine load and emitted pollutants as well as fuel consumption.
One important remark is that the tire effect is greater than the road one, as moving from radial to bias ply has a larger impact on the resistance coefficient than when moving from cold to hot blacktop. Further, increasing the resistance coefficient results in the vehicle being unable to follow the prescribed transient schedule at high speeds. For the fourth, most demanding, examined case (hot blacktop/bias-ply tires), the vehicle follows the schedule up to the 73rd second. Consequently, the results presented in Figure 17 are limited to the 73 first seconds of the transient schedule (recall that similar remarks were made earlier in the text, in Section 4.1, when discussing another important component of the rolling resistance force, namely vehicle mass).
A third important conclusion is that although the examined resistance coefficients span over a rather wide range, their effect on emissions is much smaller, as the aerodynamic term prevails over its rolling resistance counterpart at higher vehicle speeds, hence the rolling resistance effects are narrowed down; this is especially true for NO. The relation between soot or CO2/fueling and road friction was found highly statistical, with R2 values 0.975 and 0.972 respectively.
Finally, the effect of road grade θ is investigated. Grade is defined as the ‘rise’ over the ‘run’ (vertical distance over horizontal), and is the tangent of the grade angle θ. Frequently it is expressed as a percentage after multiplying by 100. The corresponding road grade resistance term Fgr in Equation (1) is given by [30]:
F g r = W sin θ = m V g sin θ
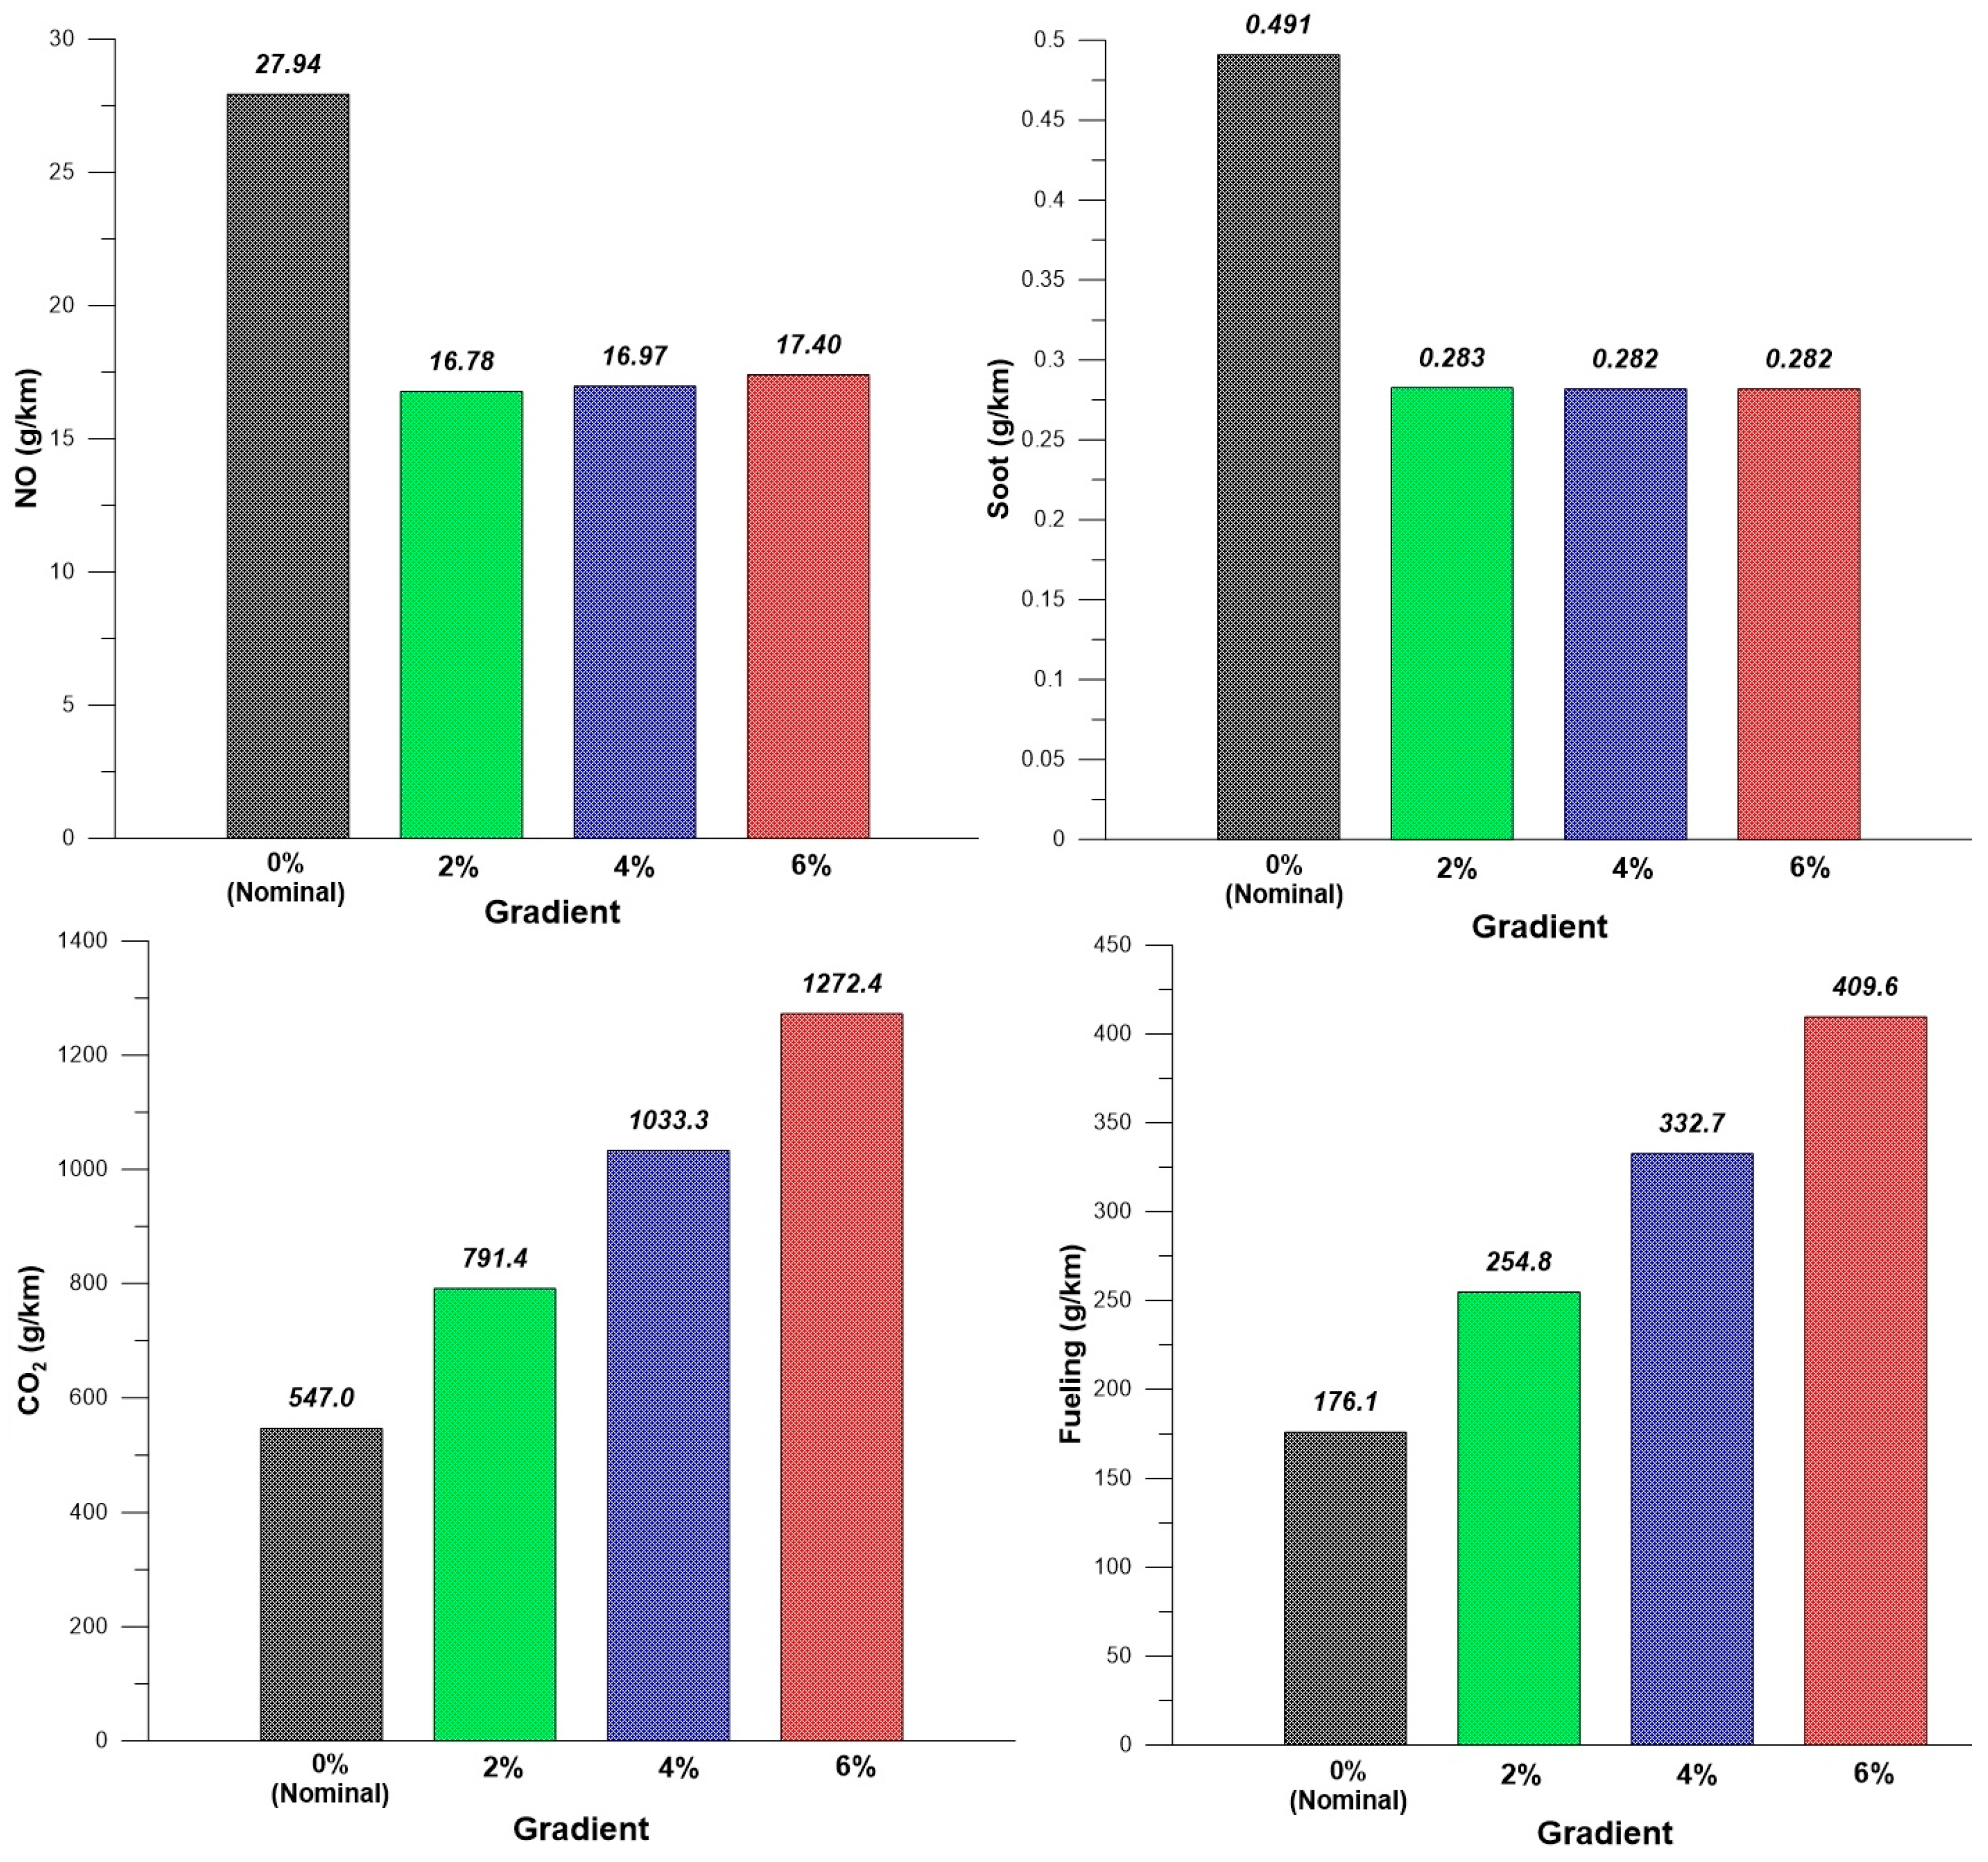
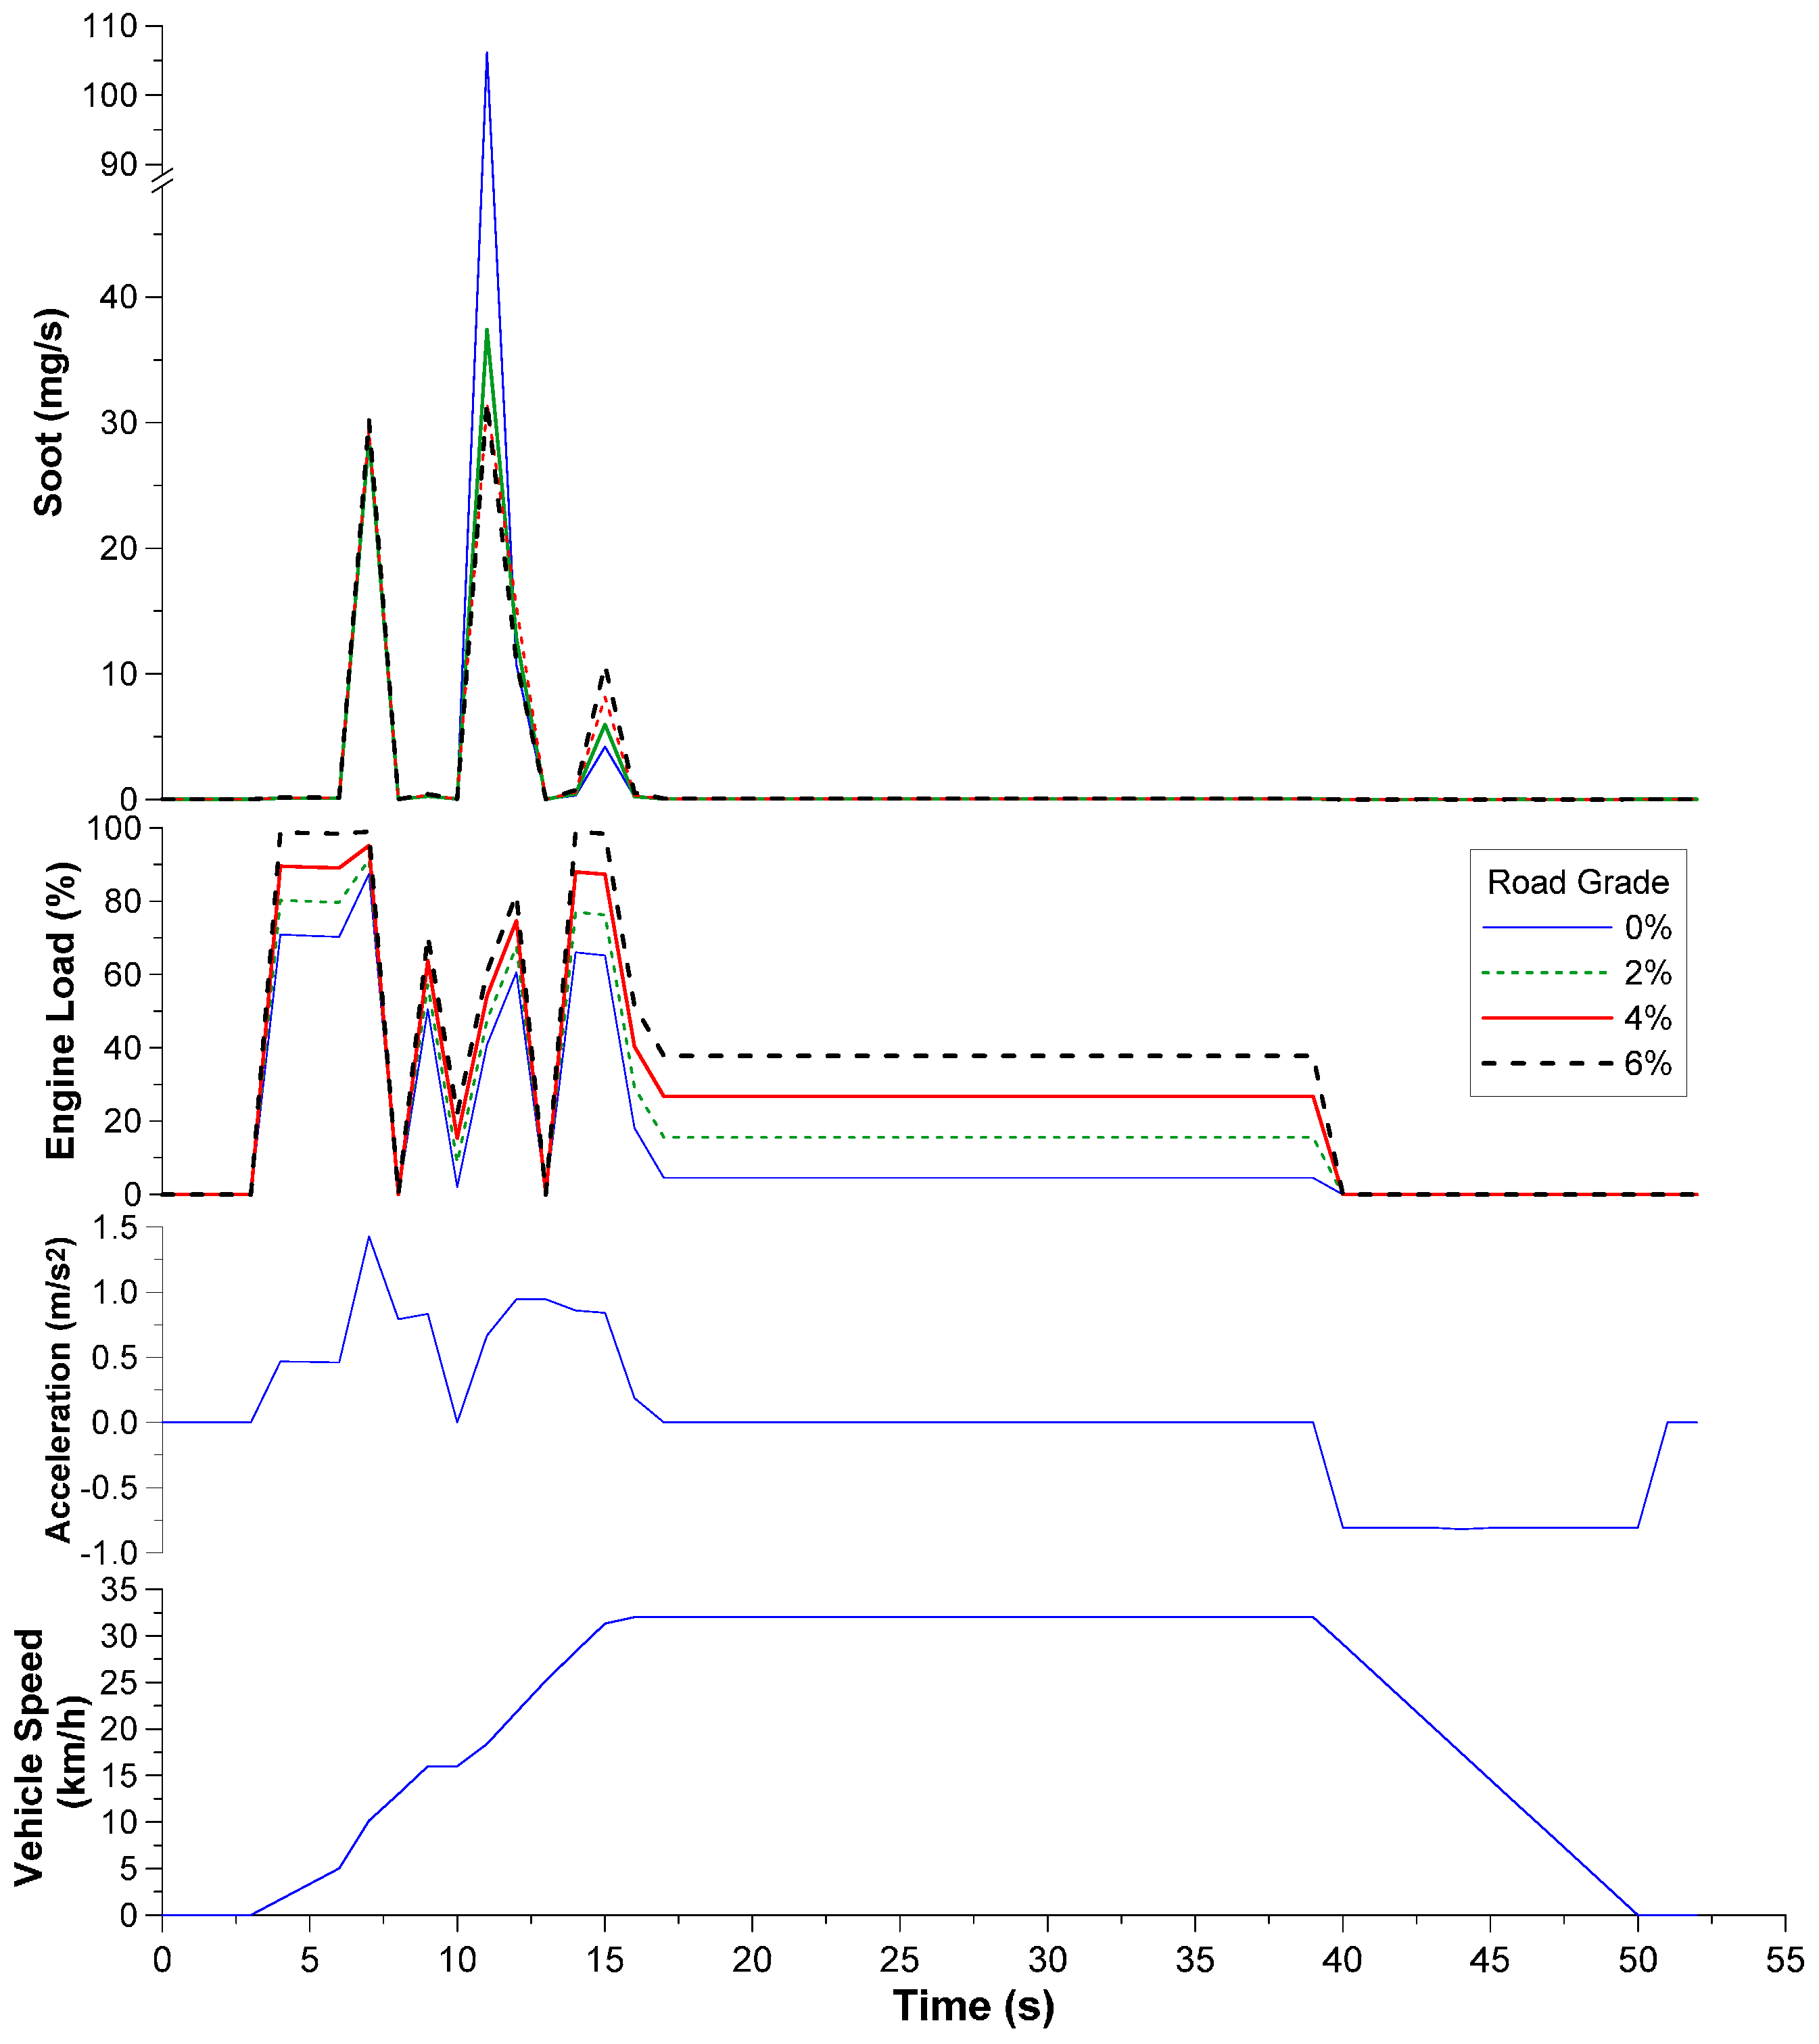
Three cases are examined in Figure 18, apart from the nominal one of zero grade, namely 2%, 4% and 6%. Owing to the considerable burden the road grade imposes on the vehicle [27], for this investigation, the second transient schedule (from Figure 7) will be examined, i.e., the low-speed urban scenario; the first transient was impossible for the vehicle to run in the prescribed manner (particularly for vehicle speeds up to and exceeding 100 km/h). On the other hand, even the 6% road grade was manageable by the engine during the second, milder in terms of vehicle speeds, transient schedule.
The results presented in Figure 18 seem rather obvious when fueling/CO2 are concerned; increasing the road gradient increases accordingly the total force the vehicle has to overcome, hence higher engine loading is established (Figure 19), leading to elevated fuel consumption and CO2. The correlation between road gradient and fuel consumption is ‘adequately’ statistical (R2 = 0.88). What is quite interesting, however, is the effect the road grade has on the emitted pollutants.
From Figure 18 it is obvious that the biggest amount of emitted soot and NO is noticed when the vehicle operates on a flat road. On the contrary, as the grade increases, soot and NO are reduced. In order to interpret this, rather unorthodox, finding, the middle and upper sub-diagram of Figure 19 are helpful. Notice in Figure 19, that for the most part of the specific driving schedule, soot and NO emissions are rather low (very close to zero), owing to cruising at low speed and deceleration. It is practically the three accelerations during the beginning of the transient schedule that determine the total amount of the emitted pollutants, and particularly the second acceleration, which, as was depicted in Figure 8, is the most demanding from the ones studied in this work (corresponding to 5.22 km/h/s). As is made obvious from the engine loading graph in Figure 19, the higher the grade, the higher the instantaneous (and average) engine loading. This, in turn, leaves very small room for abrupt accelerations, hence the turbocharger lag occurrences are considerably milder. Since the engine loading is high, the turbocharger is called upon to operate from higher initial points, hence the turbocharger lag is minimized [1,2,5,6]. Similar results had been reached in a previous publication [9] applying a zero-dimensional commercial code (GT-Power® software, version 7.2 from Gamma Technologies LLC, Chicago, IL, USA). Following this logic, the 2% grade is the one with the second highest emission overshoot after the flat road case. As mentioned above, it is the second acceleration in the transient (between 10 and 14 s), i.e., the most abrupt one, that is mostly contributing to soot emissions. Since during this acceleration, the emission overshoot is very pronounced on the flat road, it affects decisively the cumulative results too. On the other hand, during the acceleration between 15 and 18 s, as well as during the cruising period, the trend is reversed, and the higher road grades lead also to (slightly) higher emissions, as expected. However, in these cases, the soot and NO absolute values are overall very small, hence the emission overshoot during the second acceleration proves decisive for the cumulative emissions.

5. Summary and Conclusions

A detailed parametric study was conducted on a turbocharged truck running on two different transient schedules, a 100-s continuous up-gear shift one, typical when entering a highway, and a 52-s urban route, typical when driving between two stop lights. The mean-value modeling analysis was based on a previously conducted transient engine testing, applying a detailed vehicle simulation model.
The effect of six important parameters was studied, namely vehicle mass and gearbox, driver ‘aggressiveness’ and gear-shift strategy, and road-type and gradient. The results from the analysis regarding engine-out emissions as well as fuel consumption/CO2 can be summarized as follows for the engine in hand:
  • Vehicle speed was identified as the most critical property influencing performance and practically all vehicle parameters. In this respect, low-speed (‘urban’) and high-speed (‘motorway’) segments were found to affect vehicle operation in a different way. For the engine, it was the speed fluctuations (due to gear changes) that affected mostly the emissions and performance.
  • At each step in the transient schedule where a steep vehicle velocity increase was experienced, a peak in engine-out emissions (particularly soot) was noticed as well owing to turbocharger lag. This was more pronounced during the first examined transient schedule owing to its continuous up-gear shift profile. In fact, one abrupt acceleration produced more engine-out soot than many minutes of constant-speed operation.
  • Increasing the vehicle mass resulted in deterioration of its performance at high velocities, hence the vehicle failed to follow the prescribed driving schedule; elevated amount of pollutants was also observed. Similar results were reached when studying the effect of road-tire friction and road grade; all the above being parameters directly affecting the vehicle resistance forces.
  • The selected gearbox was a critical parameter affecting driving behavior as well as emissions and performance. More specifically, for gearboxes with high number of gears, the accelerations were in general milder (hence the amount of soot lower), although the vehicle drivability is expected to be adversely affected.
  • Predictably, driving in a more aggressive way, as a result of higher average accelerations, had significant impact on all emissions and the vehicle performance in general.
  • A noteworthy statistical correlation was established between pollutant emissions (NO, soot) and vehicle mass or road-tire friction, as well as between fueling/CO2 and vehicle mass, road-tire friction and road grade.
  • From the range of values investigated in this paper, and for the current engine/vehicle combination, it seems that the most critical parameters for the emission of NO and soot are the vehicle mass, the driving ‘aggressiveness’ and the exact gear-change profile (the latter only for soot). Vehicle mass, driving ‘aggressiveness’ and road-grade were identified as the most influential parameters for the emission of CO2.

Acknowledgments

The authors would like to thank Cambustion Ltd. and particularly M. Peckham for the loan of the CLD500 NO analyzer and his continuous support during the experimental investigation of the engine. The significant contribution of A. Dimaratos in setting up the experimental installation and carrying out the measurements is greatly acknowledged.

Author Contributions

George Triantafillou developed the vehicle model subroutines and was responsible for the program runs and analysis of the results. Evangelos G. Giakoumis supervised the study, authored the paper and formulated many of the final graphs.

Conflicts of Interest

The authors declare no conflict of interest.

References

  1. Watson, N.; Janota, M.S. Turbocharging the Internal Combustion Engine; McMillan: London, UK, 1982. [Google Scholar]
  2. Rakopoulos, C.D.; Giakoumis, E.G. Diesel Engine Transient Operation; Springer: London, UK, 2009. [Google Scholar]
  3. Available online: https://www.transportpolicy.net/ (accessed on 5 January 2018).
  4. Giakoumis, E.G. Driving and Engine Cycles; Springer International Publishing: Cham, Switzerland, 2017. [Google Scholar]
  5. Watson, N. Eliminating Rating Effects on Turbocharged Diesel Engine Response; SAE Technical Paper 840134; SAE International: Warrendale, PA, USA, 1984. [Google Scholar]
  6. Horlock, J.H.; Winterbone, D.E. (Eds.) The Thermodynamics and Gas Dynamics of Internal Combustion Engines, Vol. II; Clarendon Press: Oxford, UK, 1986. [Google Scholar]
  7. Rakopoulos, C.D.; Giakoumis, E.G. Review of Thermodynamic Diesel Engine Simulations under Transient Operating Conditions; SAE Technical Paper 2006-01-0884; SAE International: Warrendale, PA, USA, 2006. [Google Scholar]
  8. Filipi, Z.; Wang, Y.; Assanis, D. Effect of Variable Geometry Turbine (VGT) on Diesel Engine and Vehicle System Transient Response; SAE Technical Paper 2001-01-1247; SAE International: Warrendale, PA, USA, 2001. [Google Scholar]
  9. Giakoumis, E.G.; Alysandratou, A. Performance and emissions of a heavy-duty truck during the UDDS driving cycle—Simulation analysis. J. Energy Eng. 2016, 142, E4015011. [Google Scholar] [CrossRef]
  10. Berglund, S. A Model of Turbocharged Engines as Dynamic Drivetrain Members; SAE Technical Paper 933050; SAE International: Warrendale, PA, USA, 1993. [Google Scholar]
  11. Rackmil, C.I.; Blumberg, P.N.; Becker, D.A.; Schuller, R.R.; Garvey, D.C. A dynamic model of a locomotive diesel engine and electrohydraulic governor. J. Eng. Gas Turbines Power 1988, 110, 405–414. [Google Scholar] [CrossRef]
  12. Jiang, Q.; Van Gerpen, J.H. Prediction of Diesel Engine Particulate Emission during Transient Cycles; SAE Technical Paper 920466; SAE International: Warrendale, PA, USA, 1992. [Google Scholar]
  13. Jensen, J.P.; Kristensen, A.F.; Sorensen, S.C.; Houbak, N.; Hendricks, E. Mean Value Modeling of a Small Turbocharged Diesel Engine; SAE Technical Paper 910070; SAE International: Warrendale, PA, USA, 1991. [Google Scholar]
  14. Ericson, C.; Westerberg, B.; Egnell, R. Transient Emission Predictions with Quasi Stationary Models; SAE Technical Paper 2005-01-3852; SAE International: Warrendale, PA, USA, 2005. [Google Scholar]
  15. Giakoumis, E.G.; Alafouzos, A.I. Study of diesel engine performance and emissions during a Transient Cycle applying an engine mapping-based methodology. Appl. Energy 2010, 87, 1358–1365. [Google Scholar] [CrossRef]
  16. Giakoumis, E.G.; Lioutas, S.C. Diesel-engined vehicle nitric oxide and soot emissions during the European light-duty driving cycle using a transient mapping approach. Transp. Res. Part D 2010, 15, 134–143. [Google Scholar] [CrossRef]
  17. Giakoumis, E.G.; Zachiotis, A.T. Investigation of a diesel-engined vehicle’s performance and emissions during the WLTC driving cycle—Comparison with the NEDC. Energies 2017, 10, 240. [Google Scholar] [CrossRef]
  18. Celik, V.; Arcaklioglu, E. Performance maps of a diesel engine. Appl. Energy 2005, 81, 247–259. [Google Scholar] [CrossRef]
  19. Bishop, J.D.K.; Stettler, M.E.J.; Molden, N.; Boies, A.M. Engine maps of fuel use and emissions from transient driving cycles. Appl. Energy 2016, 183, 202–217. [Google Scholar] [CrossRef]
  20. Roy, S.; Banerjee, R.; Bose, P.K. Performance and exhaust emissions prediction of a CRDI assisted single cylinder diesel engine coupled with EGR using artificial neural network. Appl. Energy 2014, 119, 330–340. [Google Scholar] [CrossRef]
  21. Johri, R.; Filipi, Z. Neuro-fuzzy model tree approach to virtual sensing of transient diesel soot and NOx emissions. Int. J. Engine Res. 2014, 15, 918–927. [Google Scholar] [CrossRef]
  22. Wang, J.; Rakha, H.A. Fuel consumption model for conventional diesel buses. Appl. Energy 2016, 170, 394–402. [Google Scholar] [CrossRef]
  23. Tang, Y.; Zhang, J.; Gan, H.; Jia, B.; Xia, Y. Development of a real-time two-stroke marine diesel engine model with in-cylinder pressure prediction capability. Appl. Energy 2017, 194, 55–70. [Google Scholar] [CrossRef]
  24. Gambarotta, A.; Lucchetti, G.; Vaja, I. Real-time modelling of transient operation of turbocharged diesel engine. Proc. Inst. Mech. Eng. Part D J. Automob. Eng. 2001, 225, 1186–1203. [Google Scholar] [CrossRef]
  25. Rakopoulos, C.D.; Dimaratos, A.M.; Giakoumis, E.G.; Peckham, M.S. Experimental Assessment of Turbocharged Diesel Engine Transient Emissions during Acceleration, Load Change and Starting; SAE Technical Paper 2010-01-1287; SAE International: Warrendale, PA, USA, 2010. [Google Scholar]
  26. Winterbone, D.E.; Benson, R.S.; Mortimer, A.G.; Kenyon, P.; Stotter, A. Transient Response of Turbocharged Diesel Engines; SAE Technical Paper 770122; SAE International: Warrendale, PA, USA, 1977. [Google Scholar]
  27. Gillespie, T.D. Fundamentals of Vehicle Dynamics; SAE International: Warrendale, PA, USA, 1992. [Google Scholar]
  28. Assanis, D.; Bryzik, W.; Chalhoub, N.; Filipi, Z.; Henein, N.; Jung, D.; Liu, X.; Louca, L.; Moskwa, J.; Munns, S.; et al. Integration and Use of Diesel Engine, Driveline and Vehicle Dynamics Models for Heavy Duty Truck Simulation; SAE Technical Paper 1999-01-0970; SAE International: Warrendale, PA, USA, 1999. [Google Scholar]
  29. Lucas, G.G. Road Vehicle Performance: Methods of Measurement and Calculation; Gordon and Breach Science: New York, NY, USA, 1986. [Google Scholar]
  30. Cole, D. Elementary Vehicle Dynamics—Course Notes in Mechanical Engineering; University of Michigan: Ann Arbor, MI, USA, 1972. [Google Scholar]
  31. Heywood, J.B. Internal Combustion Engine Fundamentals; McGraw-Hill: New York, NY, USA, 1988. [Google Scholar]
  32. Hountalas, D.T.; Mavropoulos, G.C.; Zannis, T.C.; Mamalis, S.D. Use of Water Emulsion and Intake Water Injection as NOx Reduction Techniques for Heavy Duty Diesel Engines; SAE Technical Paper 2006-01-1414; SAE International: Warrendale, PA, USA, 2006. [Google Scholar]
  33. Law, C.K. Combustion Physics; Cambridge University Press: Cambridge, UK, 2006. [Google Scholar]
  34. Tsokolis, D.; Tsiakmakis, S.; Dimaratos, A.; Fontaras, D.; Pistikopoulos, P.; Ciuffo, B.; Samaras, Z. Fuel consumption and CO2 emissions of passenger cars over the New Worldwide Harmonized Test Protocol. Appl. Energy 2016, 179, 1152–1165. [Google Scholar] [CrossRef]
Figure 1. Flowchart describing the computational procedure during a transient schedule.
Energies 11 00295 g001
Figure 2. Schematic representation of the experimental set-up of the engine.
Energies 11 00295 g002
Figure 3. Engine drivetrain configuration used in the analysis (N corresponds to the engine speed, Τe to the engine torque, and ΤL to the load (resistance) torque; the latter incorporating rolling, aerodynamic, and road grade resistance terms).
Energies 11 00295 g003
Figure 4. Development of various vehicle parameters during the first examined transient schedule.
Energies 11 00295 g004
Figure 5. Development of various engine parameters during the first examined transient schedule.
Energies 11 00295 g005
Figure 6. Development of soot, nitrogen monoxide and carbon dioxide during the first examined transient schedule.
Energies 11 00295 g006
Figure 7. Development of vehicle and engine parameters and emissions during the second examined transient schedule.
Energies 11 00295 g007
Figure 8. Comparison of vehicle speed/acceleration distribution and engine speed/power distribution between the two examined transient schedules from Figure 4 and Figure 7.
Energies 11 00295 g008
Figure 9. Effect of vehicle mass on fueling and emissions (NO, soot, CO2) during the first 64 s of the first transient schedule.
Energies 11 00295 g009
Figure 10. Development of vehicle acceleration, engine load and instantaneous soot emissions during the first transient schedule for three vehicle masses.
Energies 11 00295 g010
Figure 11. Effect of gearbox on fueling and emissions (NO, soot, CO2) during the first transient schedule.
Energies 11 00295 g011
Figure 12. Development of selected gear, engine load and instantaneous soot emissions during the first transient schedule for the two examined gearboxes.
Energies 11 00295 g012
Figure 13. Effect of vehicle acceleration profile on fueling and emissions (NO, soot, CO2) during the first transient schedule.
Energies 11 00295 g013
Figure 14. Development of vehicle speed, acceleration, distance covered and instantaneous NO emissions during the first transient schedule for the two examined vehicle acceleration profiles.
Energies 11 00295 g014
Figure 15. Effect of gear change profile on fueling and emissions (NO, soot, CO2) during the first transient schedule.
Energies 11 00295 g015
Figure 16. Development of vehicle acceleration, engine speed and load during the first transient schedule for the two examined gear-shift strategies.
Energies 11 00295 g016
Figure 17. Effect of road-tire type on fueling and emissions (NO, soot, CO2) during the first 73 s of the first transient schedule.
Energies 11 00295 g017
Figure 18. Effect of road gradient on fueling and emissions (NO, soot, CO2) during the second transient schedule.
Energies 11 00295 g018
Figure 19. Development of vehicle speed, engine load and instantaneous soot during the second transient schedule for the four examined road-grade cases.
Energies 11 00295 g019
Table 1. Engine specifications.
Engine Model and TypeSix-Cylinder, Four-Stroke, Direct Injection, Turbocharged and Aftercooled Diesel Engine
Total displacement5958 cm3
Bore/Stroke97.5 mm/133 mm
Compression ratio18:1
Speed range800–2600 rpm
Maximum power177 kW @ 2600 rpm
Maximum torque840 Nm @ 1250–1500 rpm
Maximum turbocharger pressure2.50 bar
FuelStandard automotive diesel fuel
Table 2. Vehicle specifications.
Nominal Mass (Refers to Unloaded Vehicle)7350 kg
Frontal area4.65 m2
Aerodynamic resistance coefficient0.70
Gear ratios1st—7.72:1
2nd—4.42:1
3rd—2.66:1
4th—1.79:1
5th—1.28:1
6th—1.00:1
Back-axle ratio3.70:1
Wheel radius0.57 m
Longitudinal distance between center of gravity and front axle1.95 m
Longitudinal distance between center of gravity and rear axle1.30 m
Vertical distance (height) between center of gravity and ground level0.89 m