Natural Fractures Characterization and In Situ Stresses Inference in a Carbonate Reservoir—An Integrated Approach


1
Department of Petroleum Engineering, School of Mining and Geosciences, Nazarbayev University, Astana 010000, Kazakhstan
2
Department of Earth & Environmental Sciences, University of Waterloo, Waterloo, ON N2L 3G1, Canada
3
Research Institute for Earth Sciences, Geological Survey of Iran, P.O. Box 13185-1494 Tehran, Iran
4
National Iranian Offshore Oil Company (IOOC), P.O. Box 13185-1494 Tehran, Iran
*
Author to whom correspondence should be addressed.
Energies 2018, 11(2), 312; https://doi.org/10.3390/en11020312
Submission received: 9 December 2017
/
Revised: 17 January 2018
/
Accepted: 25 January 2018
/
Published: 1 February 2018
(This article belongs to the Section L: Energy Sources)
Abstract
:In this paper, we characterized the natural fracture systems and inferred the state of in situ stress field through an integrated study in a very complex and heterogeneous fractured carbonate heavy oil reservoir. Relative magnitudes and orientations of the in-situ principal stresses in a naturally fractured carbonate heavy oil field were estimated with a combination of available data (World Stress Map, geological and geotectonic evidence, outcrop studies) and techniques (core analysis, borehole image logs and Side View Seismic Location). The estimates made here using various tools and data including routine core analysis and image logs are confirmatory to estimates made by the World Stress Map and geotectonic facts. NE-SW and NW-SE found to be the dominant orientations for maximum and minimum horizontal stresses in the study area. In addition, three dominant orientations were identified for vertical and sub-vertical fractures atop the crestal region of the anticlinal structure. Image logs found useful in recognition and delineation of natural fractures. The results implemented in a real field development and proved practical in optimal well placement, drilling and production practices. Such integrated studies can be instrumental in any E&P projects and related projects such as geological CO2 sequestration site characterization.
1. Introduction
Carbonate reservoirs are usually naturally fractured (diagenetically or tectonically pre-fractured or pre-sheared rock masses) and are known as Naturally Fractured Carbonate Reservoirs (NFCRs). NFCRs are responsible for over 1/3 of the current global conventional oil production; dominantly in the prolific Persian Gulf Basin. About 1/2 of the global proven conventional petroleum reserves are found in NFCRs. Over 1/5 of the heavy oil, extra heavy oil and bitumen endowment of the world is also found in NFCRs. These later resources are located mainly in the Middle East, Russia and Canada [1,2]. These numbers reinforce the value of understanding geological and geomechanical characteristics of this type of reservoir.
By definition, NFCRs are reservoirs characterized with their systematic natural fractures systems (e.g., planar discontinuities) generated via natural processes (e.g., tectonic forces, lithification processes such as diagenesis) forming a consistent and connected network in the reservoir [3]. The interconnected fracture system serves as the major flow paths, very high permeability-low storage capacity and the rock matrix serves as major source of the petroleum; low permeability and high storage capacity). Fluid flow in NFCRs and the interaction between the matrix and the fractures flow is controlled by the fracture system characteristics (azimuth, dip, spacing, aperture, persistence and continuity, filling materials, water saturation and transmissivity), geomechanical parameters (magnitude and direction of principal stresses, rock stiffness, anisotropy) and intact rock petrophysical properties (matrix porosity, permeability, saturation, wettability). Large-scale flow is almost exclusively through the interconnected fracture network [4,5,6]. As depletion occurs, small volume changes take place (the compressibility effect) and the in-situ stress state is perturbed; the resulting effective stress changes lead to fracture aperture changes and thus to alteration of the fracture transmissivity. This is a strongly coupled stress-flow process that can lead to large changes in rock mass permeability and thus large changes in injection or depletion rate [4,5,6].
The data and information on nature and characteristics of natural fracture systems can be utilized in optimal and efficient well construction practices. Open fractures can lead to drilling problems such as lost circulation during overbalanced drilling and cementing operations. In worst-case scenario, this can even lead to loss of wells. In addition, the drilling fluids lost in the formations and cement from cementing operations can block the near wellbore open fractures and this adversely affect the production rate. The transmissivity of natural fractures can be severely impaired far beyond the perforation depth and then require additional stimulation (hydraulic fracturing, acidizing) [7,8]. Using underbalanced drilling (UBD) methods [9] along with less formation damaging drilling and cementing fluids may reduce lost circulation and its consequent damages. Nevertheless, so often the driller is bound to very limited options. During drilling in mature and depleted NFCRs especially in presence of low permeability shales or higher pressure zones, the drillers must administer and sustain a proper mud weight to reinforce the shale or to block a blowout from the higher pressure zone. Mathematical modeling of steam flooding in naturally fractured carbonate formations containing heavy oil [10,11] showed the importance of natural fractures in the case of steam flooding. During steam flooding, due to their higher thermal conductivity, fractures can help to conduct heat more rapidly into the reservoir and thus help mobilize the heavy oil from the matrix into the fracture network. This demonstrates the practical value of investigation of the state of fracturing in a NFCR [11,12]. Natural fractures also play a major role in all thermal and non-thermal geomechanics of NFCRs and control convective mass and heat transfer in the media during operations such as steam processes, geothermal energy development, groundwater development and leaching of minerals.
Capability of systematic investigation and characterization of natural fractures system is considered as a fundamental dimension in optimal development of NFCRs. Natural fracture systems are studied and categorized with descriptive, genetic and geometric methods, generating data of a qualitative to quantitative nature. Knowing fracture types enhances the engineer’s ability to simulate fluid flow through fracture networks because fracture type governs the way fluids move in a given NFCR [13]. Such studies can be conducted at the core scale (centimeters), log scale (centimeters), grid simulation scale (meters), or reservoir scale (tens to hundreds of meters).
Sedimentary basin in situ stresses delineation (magnitude and direction as functions of depth and location) has extremely broad engineering applications in NFCR development, the most important being [14,15,16,17,18,19,20,21,22,23,24,25,26,27,28,29]:
- Understanding the structural fabric of the sedimentary basins and rock densification,
- Evaluation of stress and pressure controlled hydrocarbon migration episodes in exploration activities (paleo-stresses),
- Calculation of mud-weight windows for safe drilling (blow-out prevention),
- Determination of optimum drilling trajectories to reduce borehole instability in shales,
- Evaluation of horizontal well placement in reservoirs with horizontal permeability anisotropy arising from stressed natural fracture fabric,
- Casing shoe depth choice in mildly and strongly over-pressured regimes,
- Casing design including casing-rock interaction potential during production leading to shear or parting,
- Design of cementing operations to avoid drilling fluids losses (in both natural and induced fractures),
- Well completion design to manage or exclude sand,
- Design of hydraulic fracture installations,
- Assessment of compaction potential and magnitude,
- Evaluation of potential fault reactivation,
- Thermal stress calculations in thermal EOR or cold water flooding,
- Microseismic monitoring data interpretation,
- Interpretation of acoustical wave velocity and quality changes in 4-D seismic surveys or tomographic surveys,
- Design and evaluation of liquid and solid deep well waste disposal,
- Site characterization for geological CO2 storage
- Autopsies and post-analysis of unexpected problems in drilling and production
In this article, natural fractures are characterized in a heavy oil field in SW Iran using different geological, geomechanical and geophysical data. Different seismic techniques and data were integrated and implemented for the purpose of fracture characterization (i.e., genesis, properties, orientation, fracturing variance with depth and fracturing intensity). A field investigation and survey of surface and subsurface fractures was carried out and the dominant fracture systems were delineated. Finally, a combination of geological, geomechanical and log data was used to infer relative magnitude and orientation of the in situ stresses and the pore pressure in the study area. Such studies can be instrumental for optimal field development, well placement, hydraulic fracture design and reservoir simulation practice in this class of complex and heterogeneous reservoir.
2. Kuh-e-Mond Heavy Oil Field
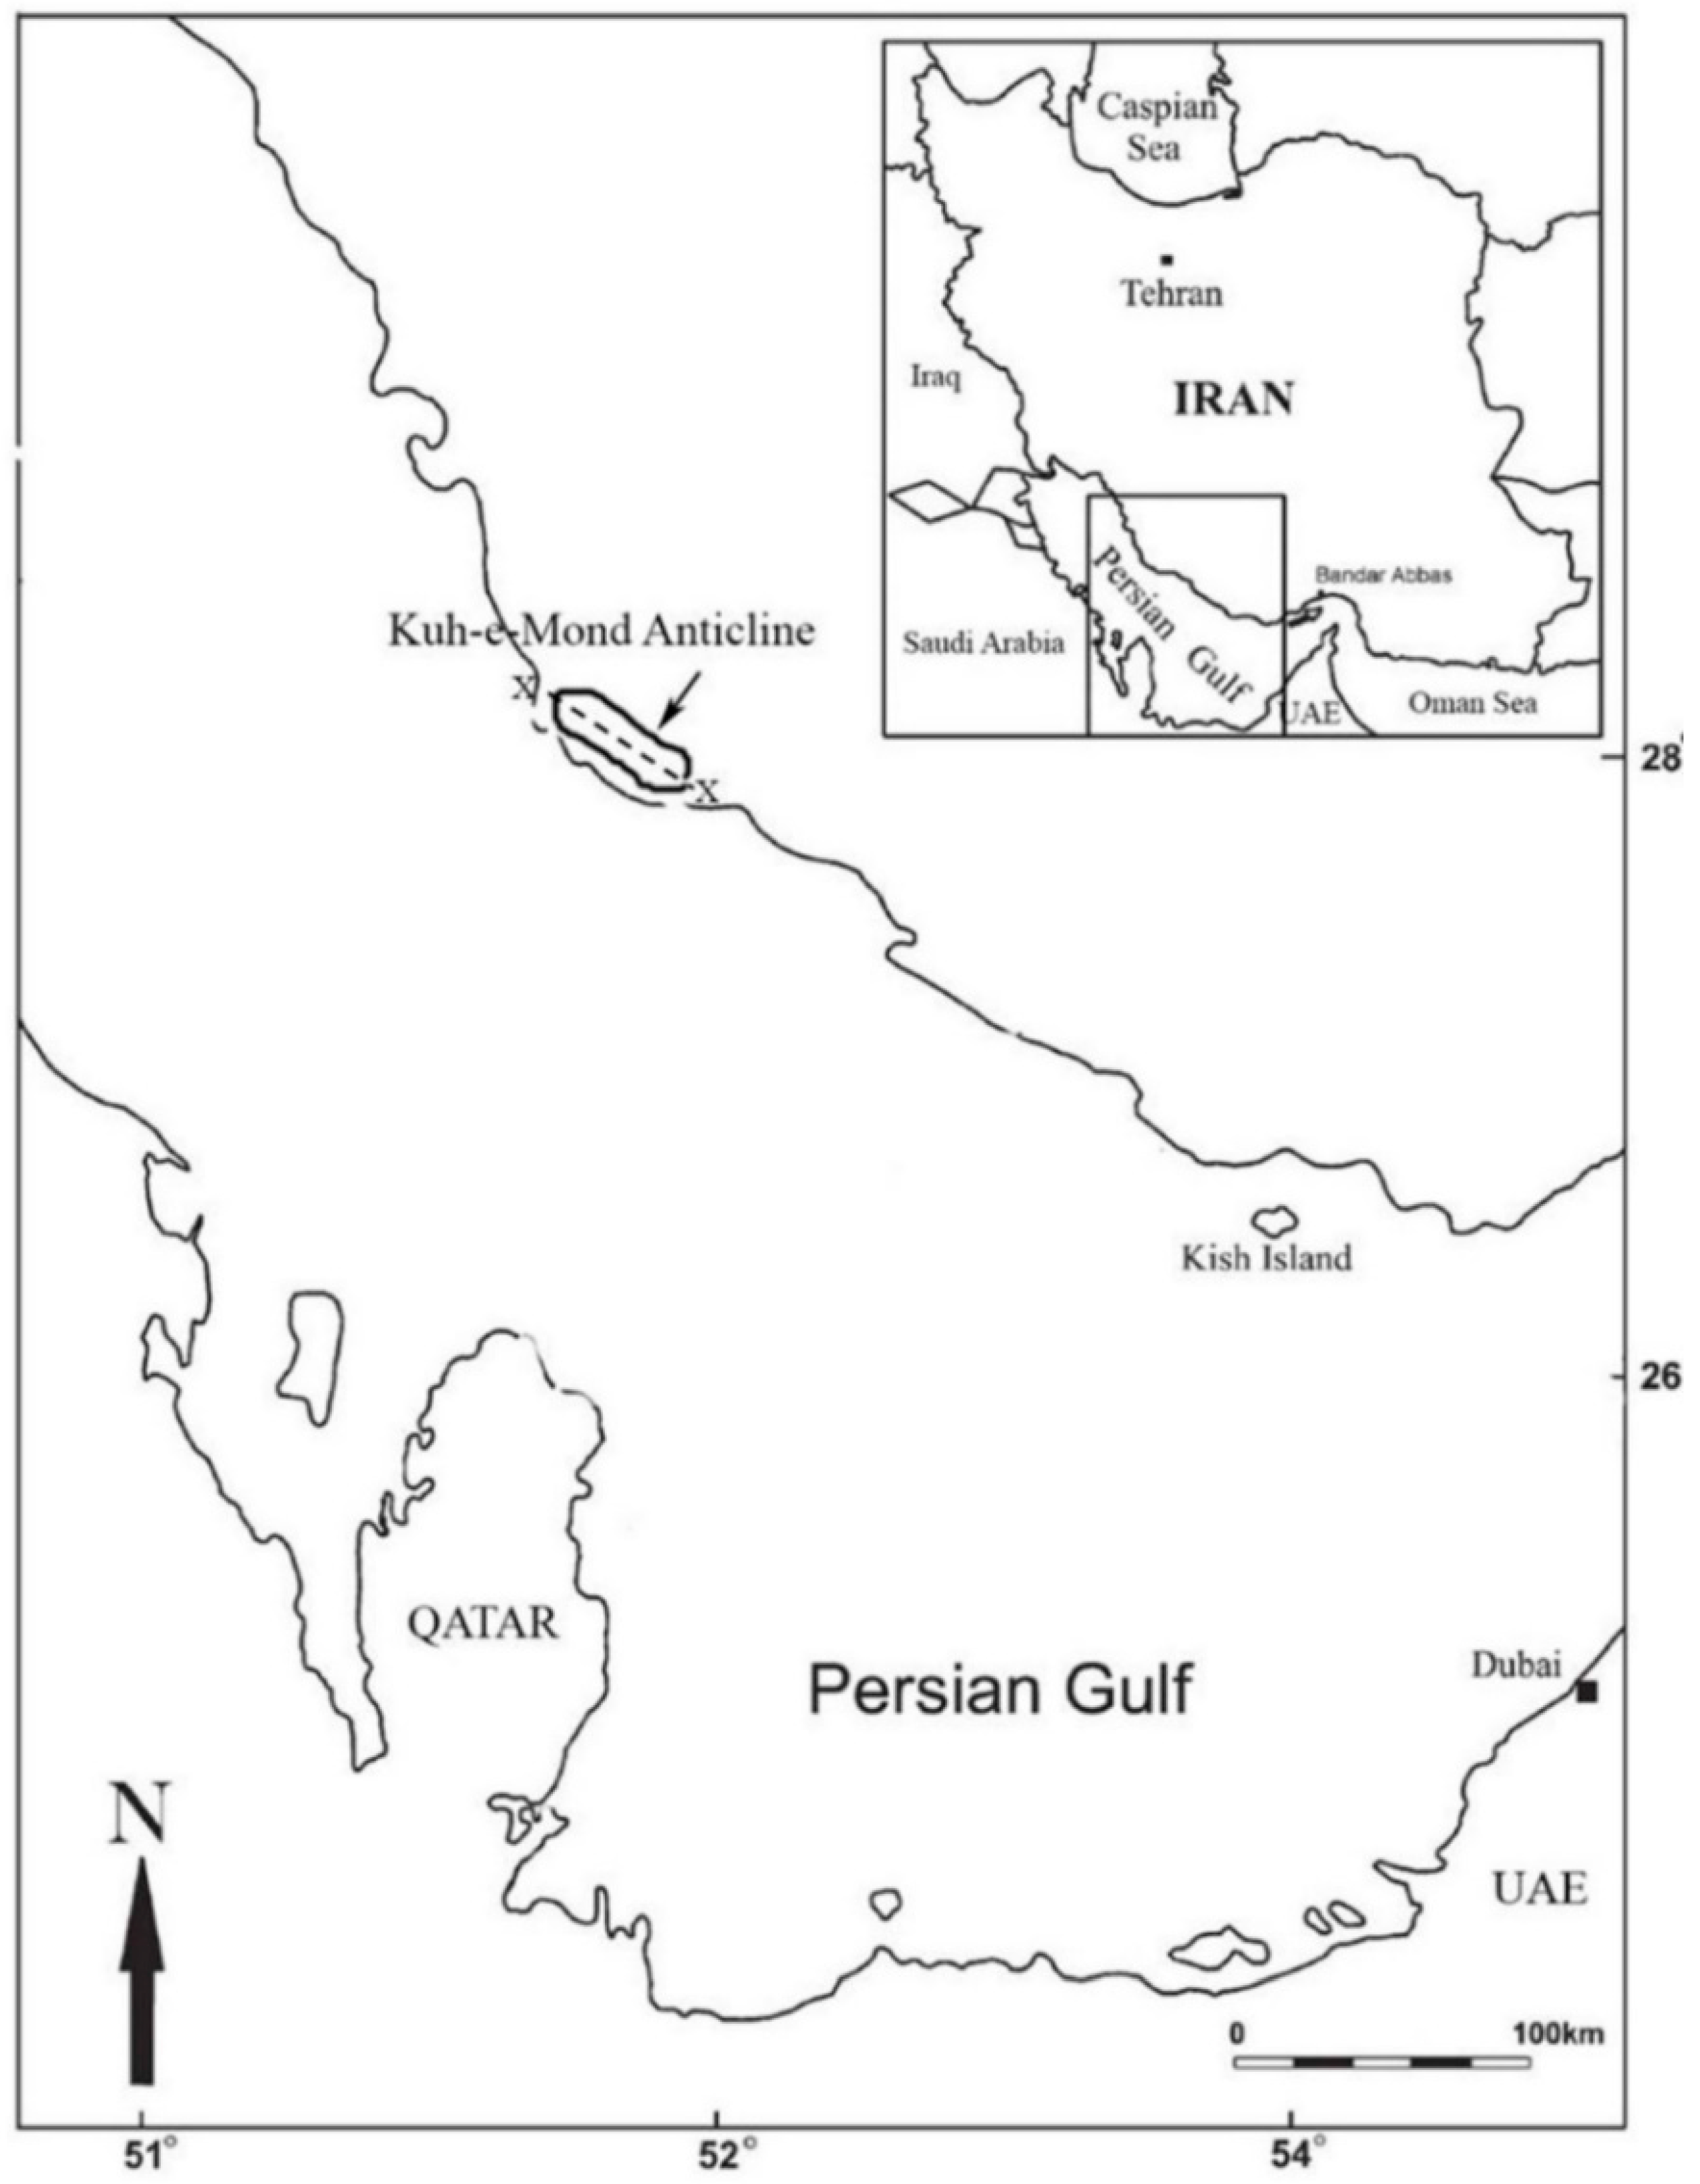
Kuh-e-Mond (Figure 1) is located along the coast of the Persian Gulf, new the Bushehr port and is recognized as the largest heavy oil field in Iran and. The structural trap is a colossus anticline with a prominent NW-SE trend in harmony with the famous Zagros orogenic belt. The field was discovered first back in 1931 when exploring natural gas resources in the region. The systematic exploration and multifaceted full field investigation of the field and considering various development plans began in mid-1980s. The geographical location and depth of exploration wells drilled in the field over the past three decades is presented in Figure 2. The anticline is somewhat symmetrical. It is 90 km long and 16 km wide. The estimated heavy oil resource base is about 6 billion barrels (OOIP) which has occurred in three different reservoirs. The depth of the HO occurrences ranges from 680 to 1200 m. The viscosity of the HO also varied from 550 to 1120 cP in situ (up to 2500 cP). The HO has some mobility under reservoir conditions. Several structural elements such as cut the axial plane of the anticline. This has caused displacement of some layers around the center and plunging zones of the anticline [30,31]. The study area has gone through two different tectonic events (i.e., orogenic episodes) which their interaction has shaped up the current complex fracture systems and in situ stresses in the region. General tectonic setting of the Zagros and the Kuh-e-Mond is presented in Figure 3 [32]. Lithostratigraphic column of the Coastal Fars, the study area, is also shown in Figure 4. At the right side of the column where the Sarvak, Jahrum and Asmari formations can be identified [33,34].
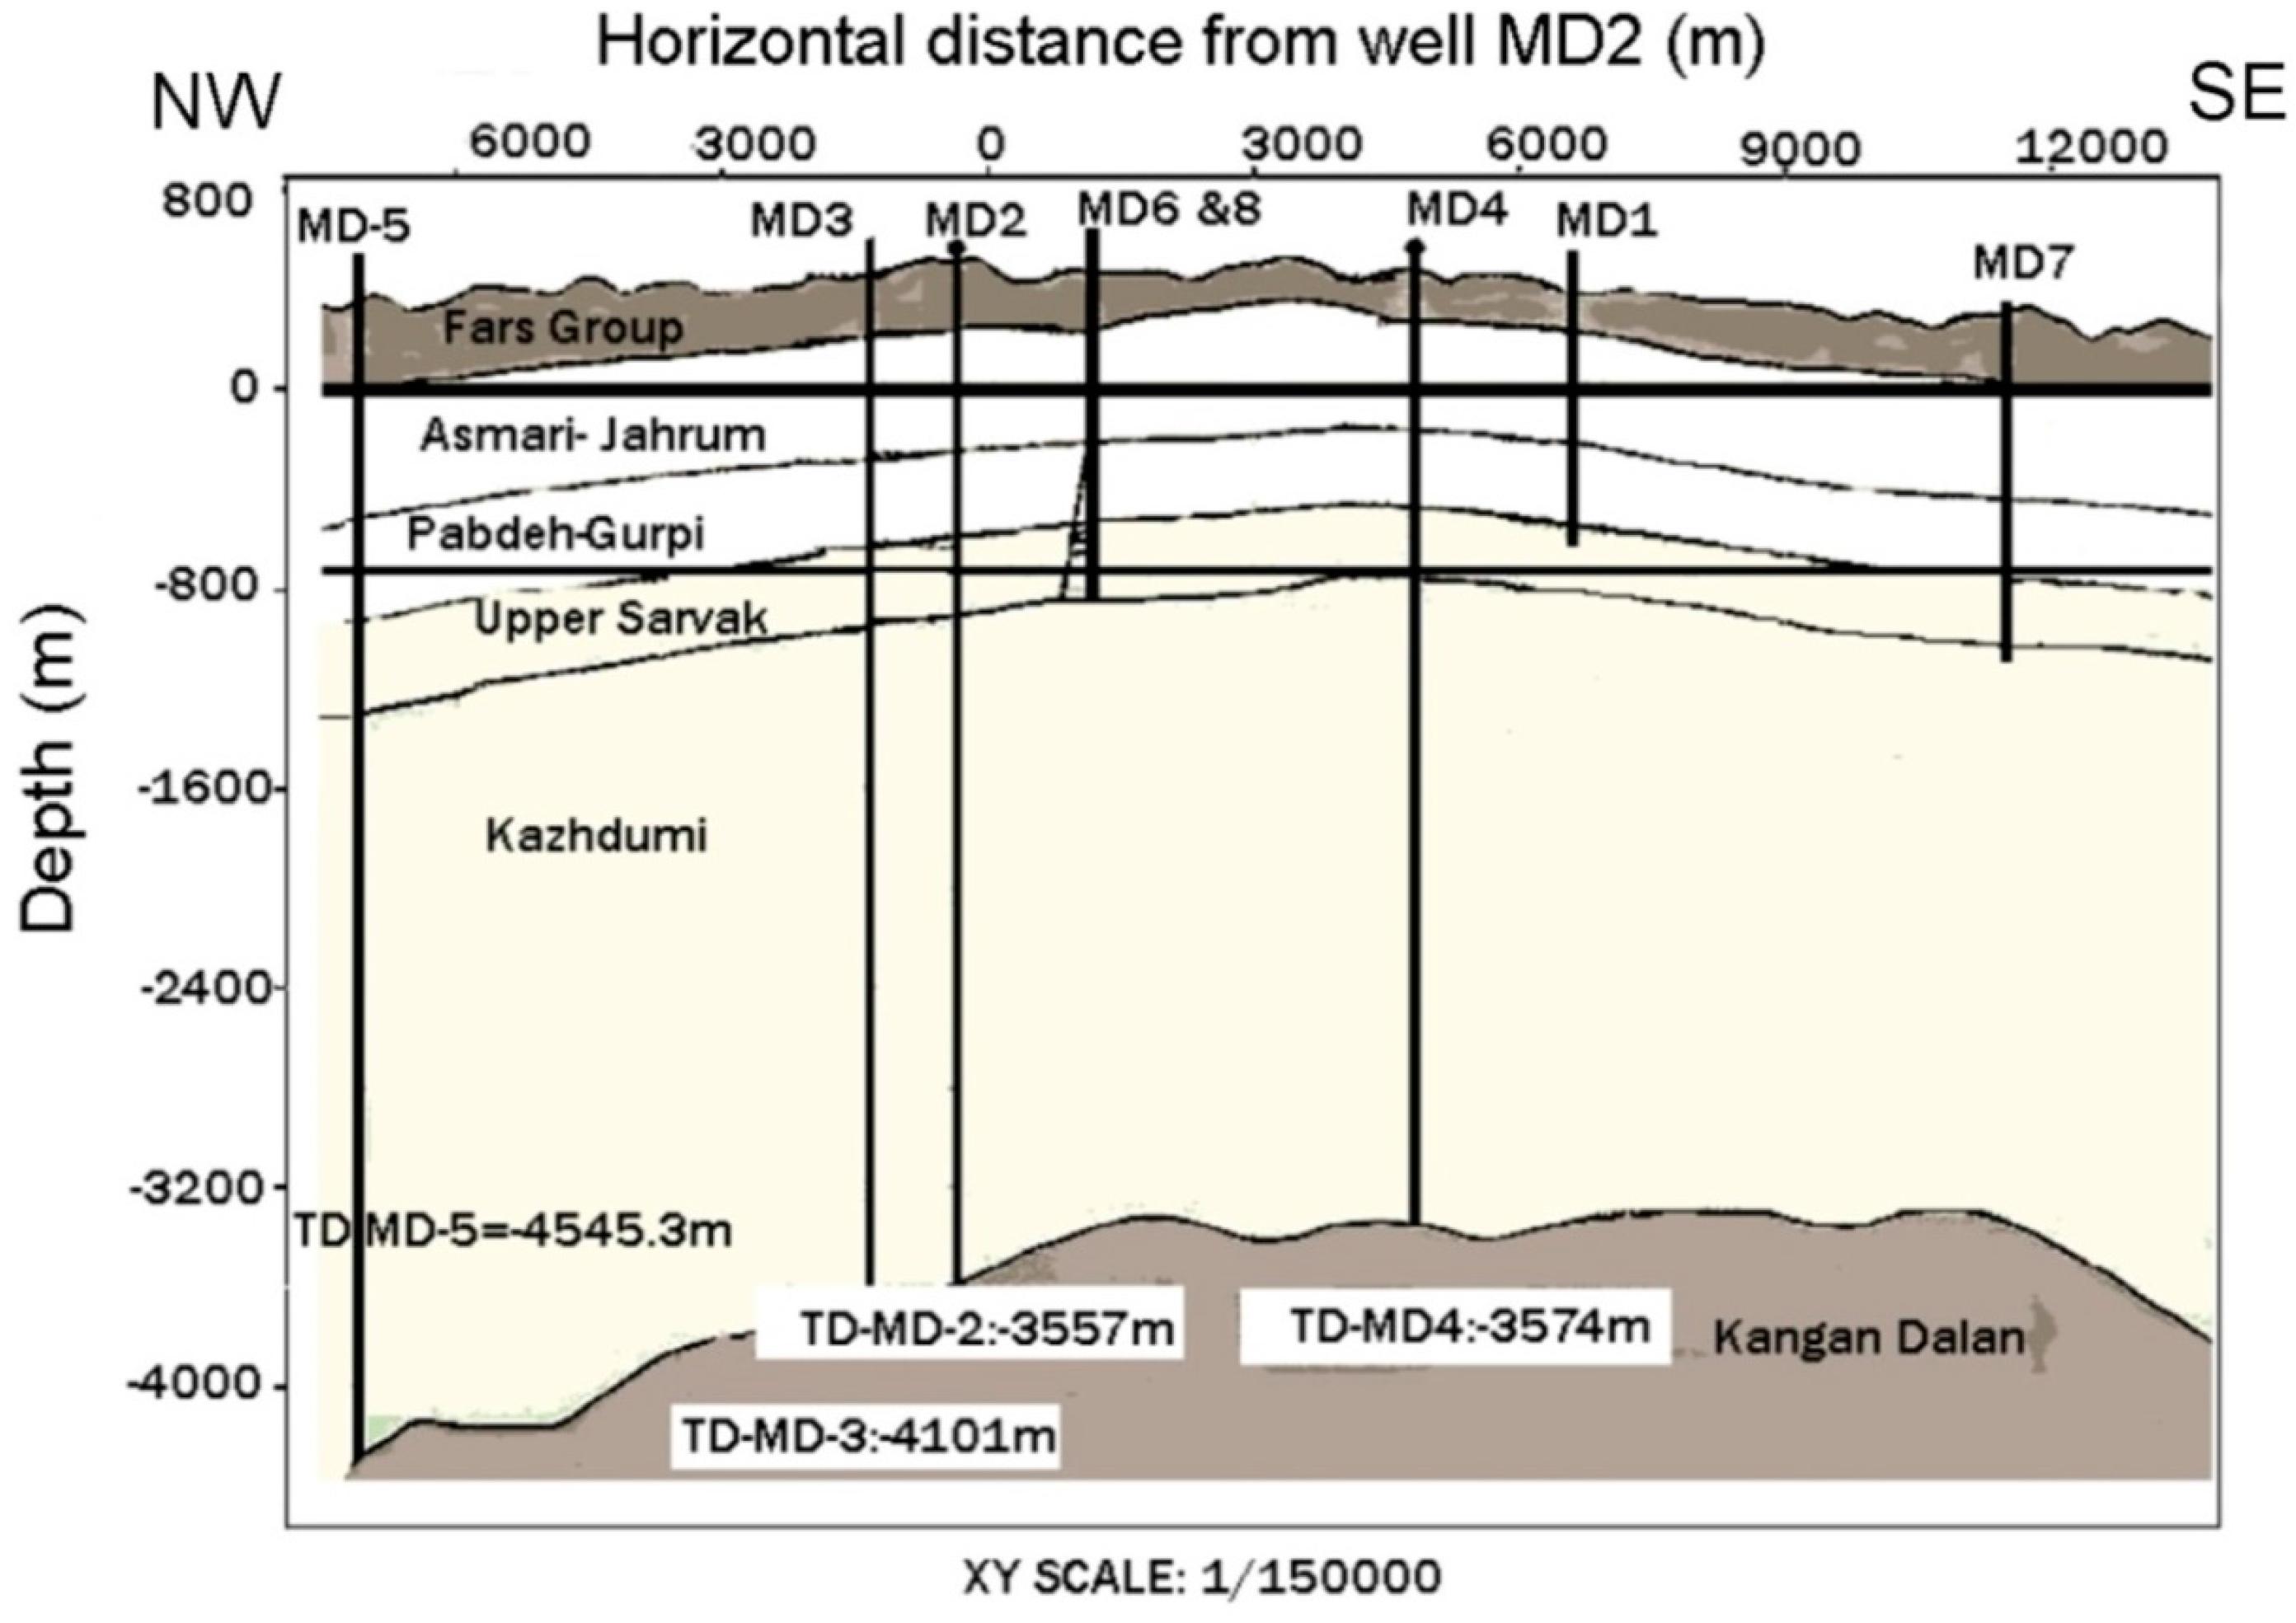
Occurrence of heavy oil is reported in 2 different highly fractured formations: Jahrum formation which is Eocene in geological age and Sarvak, a Cretaceous in age formation (Figure 2). The structural trap structure was created during the main phase of Zagros folding episode in the late Miocene and Pliocene. This is characterized by presence of the lower Miocene successions with relatively constant thickness in the region [30,31]. Based on petrophysical evaluations, parts of the Jahrum has excellent porosity (ϕ = 0.24 to 0.31) and low water saturation (Sw ~ 0.2). The strata mainly consist of intensely fractured light-brown dolomite with vuggy and fracture porosity: a dual or triple porosity system). The lower Jahrum is mostly limestone with an estimated 3 billion barrels of heavy oil originally in place [30,31]. The Sarvak reservoir is mostly composed of intensely fractured limestone with some shale interbeds. The formation is divided into three major units in the study area based on variations in lithology: The upper Sarvak is a pure limestone with minor argillaceous zones. Shale and marls are notable in the middle Sarvak. The lower Sarvak mostly consists of marly limestone and some shale intercalations [31]. Heavy mud losses were reported during the drilling operation, which are an indication to intensely fractured nature of the formation in the study area. Well locations and depth of formations in the study area are presented in Figure 2 along the cross section X-X which his parallel to the axis of the Kuh-e-Mond anticlinal structure.
3. Fracture Characterization
3.1. Field Geological and Core Studies
Inclusive field survey of fractures both at the surface and subsurface was conducted during the course of this study Surface fracture delineations imply that crestal normal faults are recognized along the axis of the anticlinal structure. These structural elements also tend to be more persistent at the crestal zones along the anticlinal structure. As expected, three dominant structural orientations of vertical and subvertical fracture systems were identified and delineated atop the crestal zones, in north, northeast and east orientations. Two major fracture systems including one shear conjugated and one set a tensile fracture were identified during the surface fracture investigations.
The technical reader should note that throughout this manuscript various terms such as natural fracture, fracture, fracturing, fracturing intensity and fracture orientation are used to describe the process of genesis and formation and characterization of natural fractures in the studied NFCR. Fracture here is a “natural fracture” and in this manuscript, there is no discussion of any hydraulically induced fractures or hydraulic fracturing related fractures or processes.
The origin of majority of the shear fractures in the study area is compressional tectonic events in the Zagros orogeny belt, evidently. Shear fractures ate typically tight (e.g., low k). However, tectonics episodes have greatly opened them. This is because a compressional stress regime can change to an extensional tectonic regime followed by uplift, bending, folding and further fracturing (i.e., new sets). This scenario, can lead to an area of intensely fractured rock mass characterized by high permeability open fractures. Obviously, presence of open fractures improves the fluid flow in a given reservoir. At the same time, it can cause issues with cap rock integrity because of damages to reservoir seal. The latter is very crucial when assessing a given NFCR for oil production technologies, which require continuous injection of steam using either vertical wells or long horizontal wells.
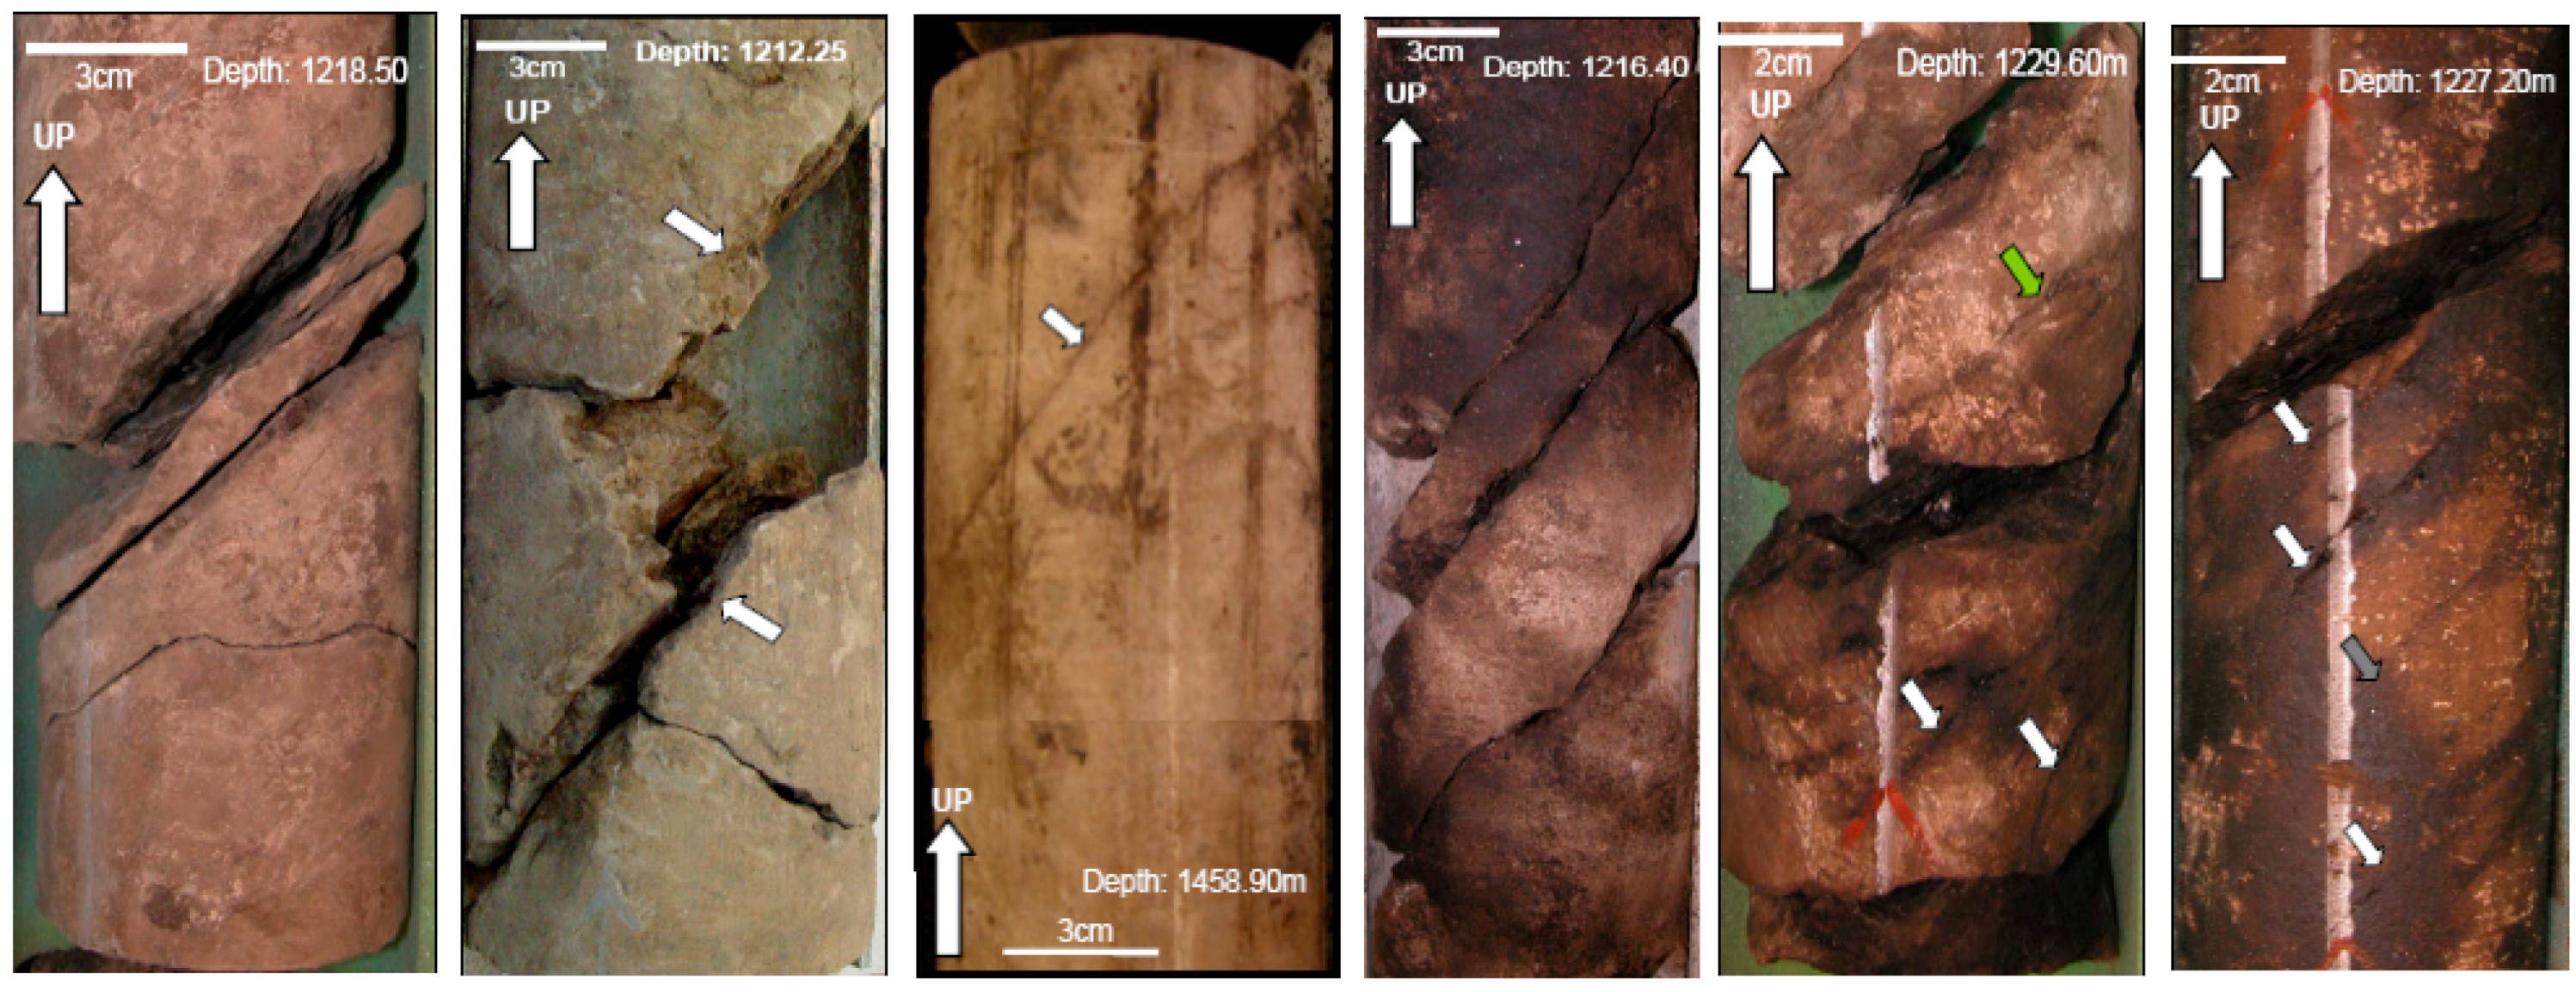
Results from comprehensive field investigations suggest that the studied reservoirs are highly fractured. This also include HO bearing zones in both Jahrum and Sarvak formation is the study area. At the core level, tensional fractures, characterized by their rectangular pattern, were easy to identify. Such fractures, are normally open and filled with HO (Figure 5—See the photos in the right side). Shear fractures were also easy to identify at core scale. This type of systematic fractures ate characterized by slickensides on the fractures’ surface. Randomly generated fracture sets, also known as second order fractures, we also easy to distinguish in some of the cores studied.
3.2. Seismic Surveys
Side View Seismic Location Survey
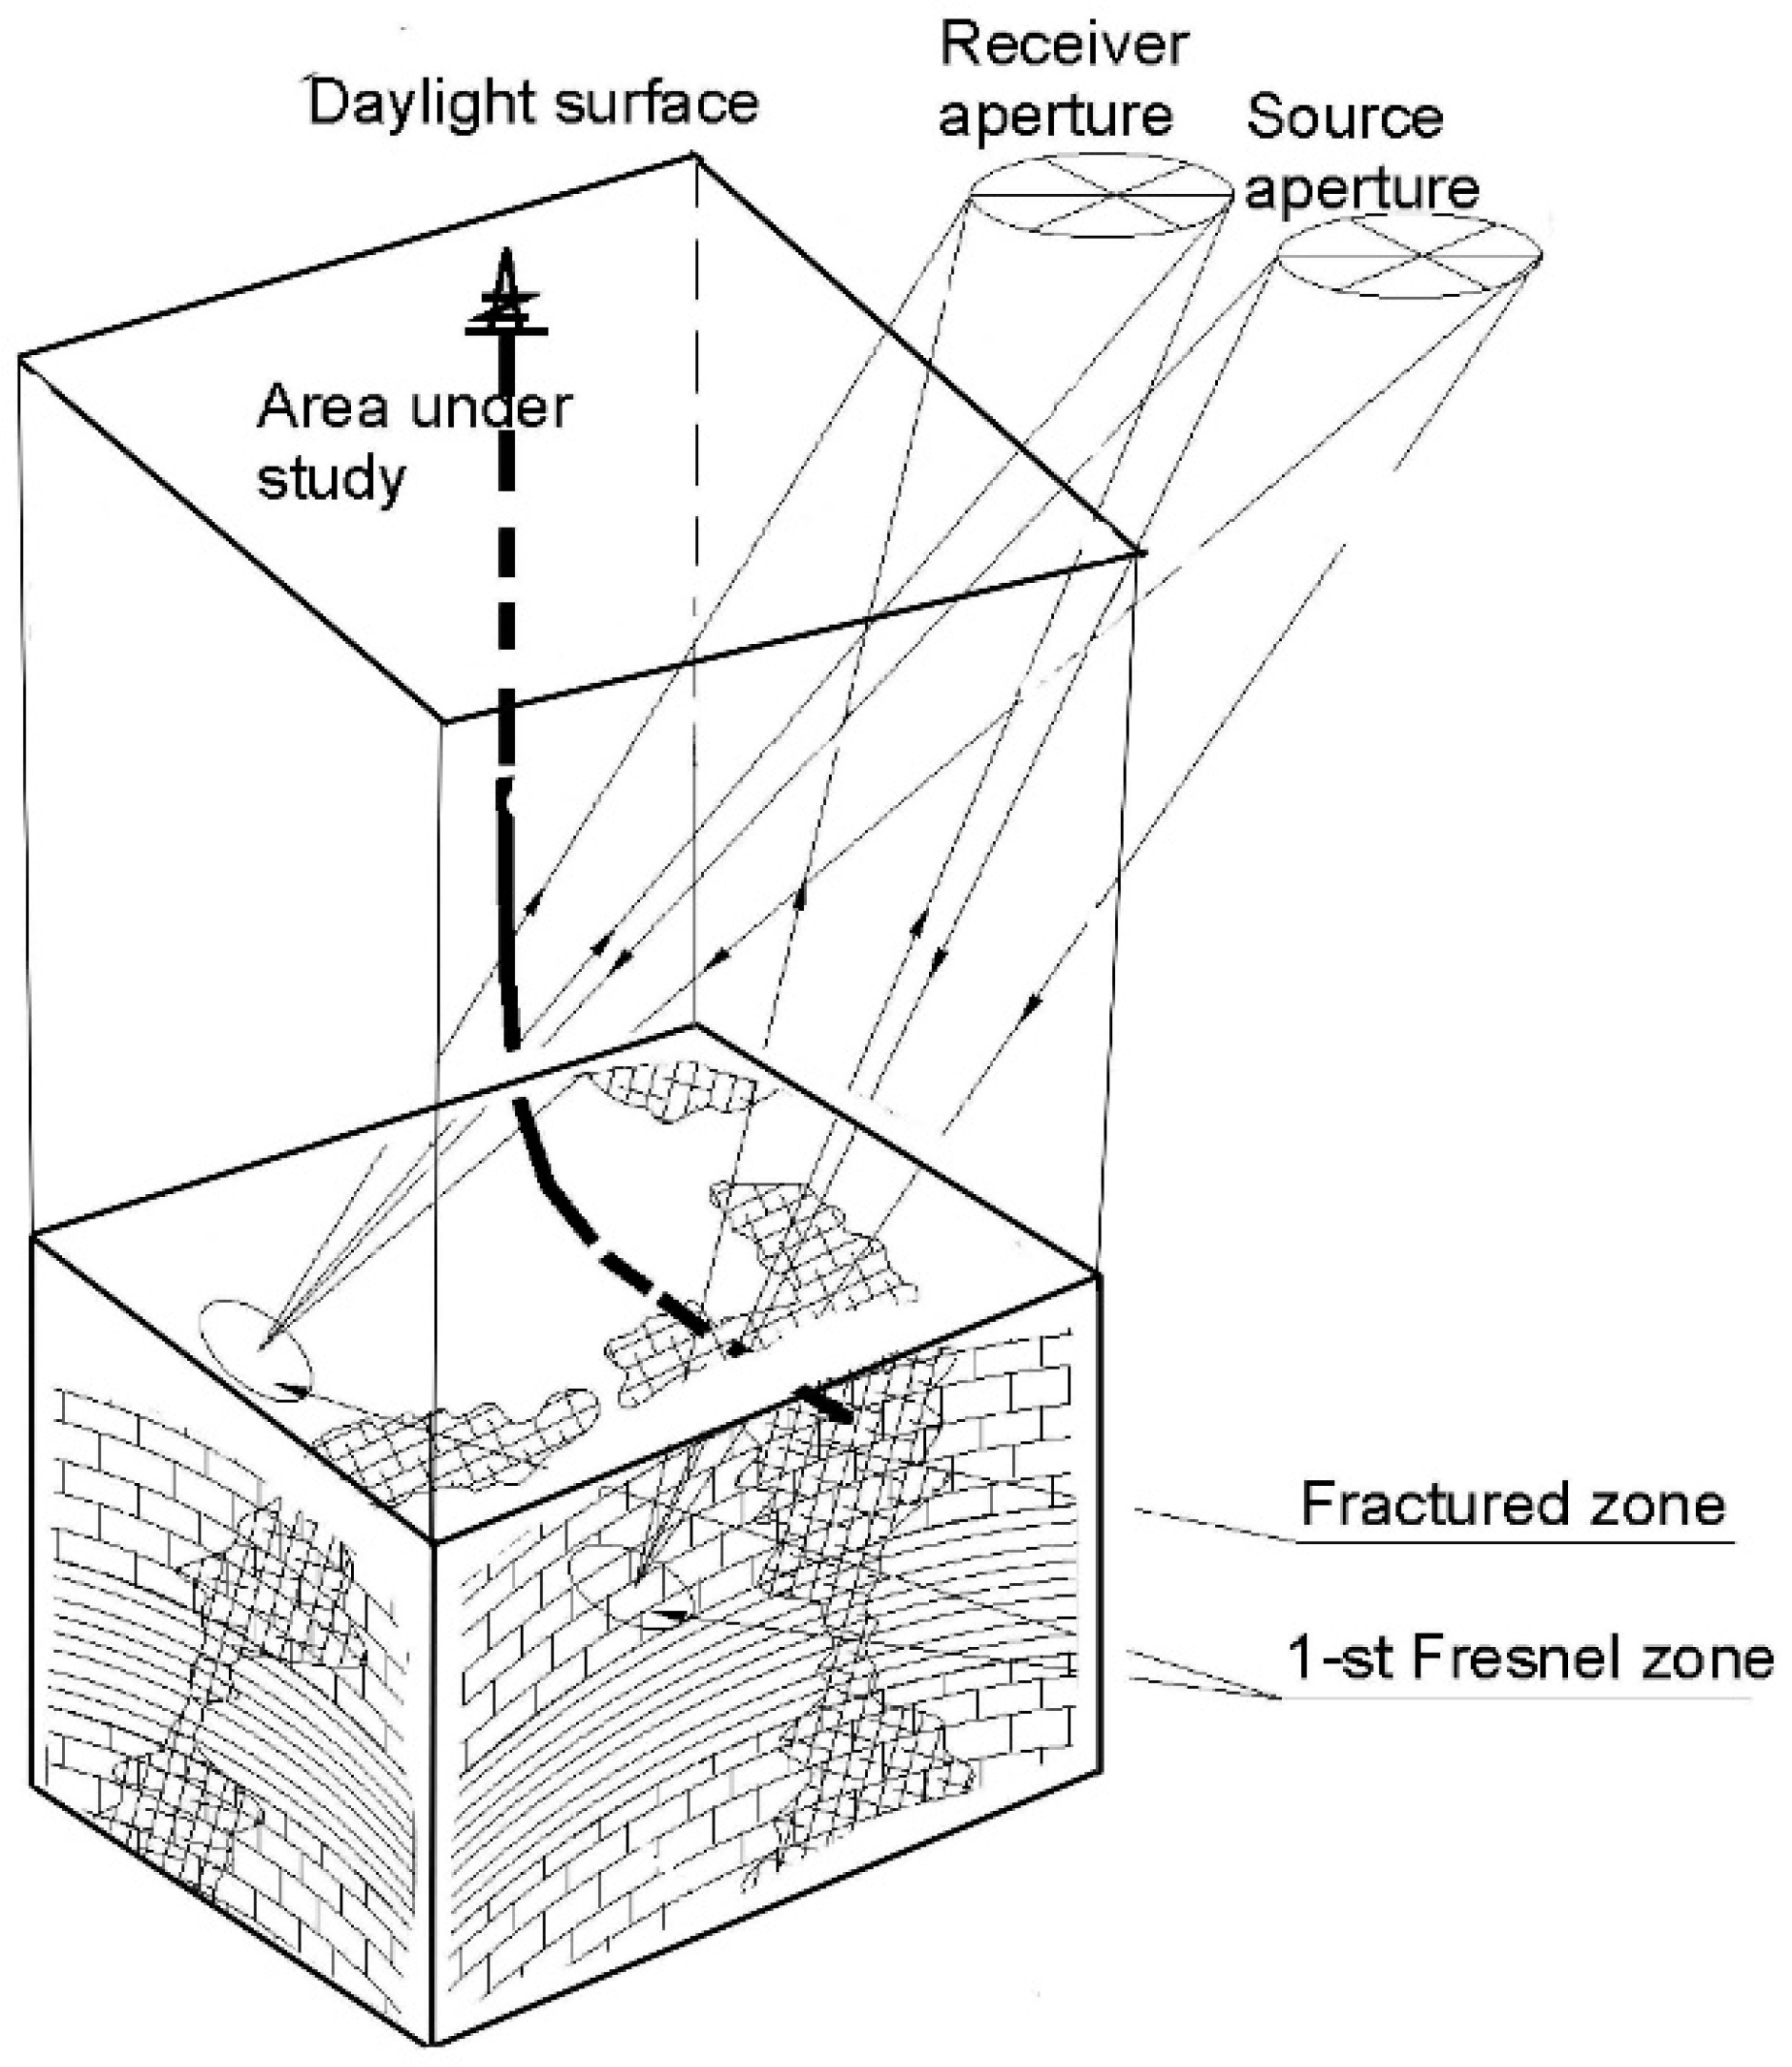
The Side View Seismic Location method (SVSL—Figure 6) was introduced and implemented in Russia (~1990) to investigate open fractures via seismic wave scatter [35]. In SVSL technique, when the length of elastic waves is significantly higher than the characteristic length of the heterogeneity of the formation then the waves are partly converted to scattered seismic waves through reflections. Zones with a high concentration of scattered seismic waves represent more densely fractured zones and have a higher acoustic impedance.
The SVSL approach is founded on identifying back-scattered waves (SW) and determining their loci—the SW generation loci. The most intense SW’s are generated by fully open fractures with maximum reflectivity contrast and the back-scattered energy depends on the density or intensity of fracturing in the zone (labeled 1st Fresnel zone in the figure because of the analogy to a Fresnel mirror or lens). Therefore, from the 3-D distribution of back-scattered energy one can estimate the spatial fracturing intensity. The energy of SW’s is less by a factor of 10 to 100 than the energy of reflected P-waves which are used to characterize the structure of the layered sedimentary series, so to identify low-energy SW’s it is necessary to apply special-designed field observation and data-processing systems based on SVSL principles. The reader is encouraged to check out the EAGE’s Earthdoc for more papers on the technique.
As usual, many factors enter into the interpretation including mechanical properties, fracture void space, degree of partial fracture filling, overburden seismic properties (especially high frequency attenuation behavior) and stresses. Brittle rocks (dense, low-porosity) more readily form intensely fractured zones, whereas more ductile rocks such as higher porosity shales rarely form intensely fractured zones and in salt rocks fractures generally do not exist. Fractures in carbonates are far more pronounced than in sandstones, except for very low porosity sandstones that have been tectonically deformed. Zones with open fractures can be identified on vertical and horizontal sections of a SVSL survey as anomalies with different signs [35]. Effects of overburden load can also be identified in the form of a predominant subvertical fracture array and growth in fracturing intensity with depth, as well. In carbonates, their high solubility leads to porosity loss during diagenesis. Stylolites form in the direction normal to the vertical stress because of the loads that do not allow fractures to open. In horizontal directions, fractures form because of the diminution of the lateral stress as intense diagenesis takes place through dissolution and precipitation, diminishing the porosity. Earth stresses are one of the major controlling agents of the natural fracture fabric; a random distribution of fractures in a homogeneous geomedium will develop if the stresses in the horizontal direction are exactly the same; but, if diagenesis took place in an anisotropic stress field; the fractures are strongly oriented (not randomly distributed) with far more fractures forming normal to the minimum horizontal stress direction. Certain types of fractures are associated with particular tectonic structures, which makes their identification feasible using the SVSL technique combined with tectonic history models of the sedimentary basin.
The study area was investigated utilizing the SVSL technique. Study of distribution of open fractures in Sarvak leaded to identification of a transversely oriented zone with minimum number of open fractures in the NW part of anticlinal structure. This zone divides the reservoir layers in the field to two separate and isolated blocks (i.e., no hydraulic communication). An abnormally intensely fractured zone was identified in the SE zone. The zone was determined as a potential sweet spot to be considered for development and further production technology appraisal. Analysis of open fractures using the SVSL indicated that distribution of open fracture is linked to systematic fractures and in lesser extent to randomly distributed fractures in the study area.
Results from a SVSL survey are presented in Figure 7a–c. In Figure 7a, the sections are averaged over horizontal planes of the source cube and Figure 7b presents sections averaged over the lateral surfaces. Figure 7c presents the difference of these two matrices a–b. Such subtraction allows elimination of the effects of lithological, gravity and vertical dilation factors on the resulting distribution of fracturing intensity. In fact, the accuracy of accounting for these factors depends on the accuracy of structural maps of the target horizons and the lithofacies’ persistence (lateral lithofacies changes) in the stratigraphic complexes throughout the study area.
Comparison of source (a) and resulting (c) sections shows that distribution of the fractures has changed only insignificantly, an indication that the tectonic factors are dominant, leading to an irregular distribution of fractures within the vertical section of the study area. Varying fracturing intensity and locations are the major reasons behind a random distribution of fractures in the study area. However, major systems of fractures caused by the tectonic deformation are pronounced against this random background. Analyzing the averaged vertical cross-sections (Figure 7a,b) shows that a major fracture system was formed during formation of the anticlinal fold. This system of fractures is characterized by a V-shaped complex of linear zones orthogonal to the fold flanks and a local anomaly in the fold arch.
The local fracturing intensity anomalies confined to the arch of inherited folds form a line tracing the displacement of the arch of the series of strata. The fracturing intensity varies depending on the lithology. These local anomalies can be positive or negative. In the first case, a decompaction is present in the arch, whereas in the second case rocks in the arch are compacted. The latter can be attributed to diagenetic “welding” of fractures that is characteristic of shallow carbonate series. In addition to the fracturing system described above, another major system is identified here and is shown in (Figure 7c). This system is characterized by the presence of a series of linear zones with a common north-east dipping direction. Dip angles of different zones are somewhat different and grow with depth, suggesting these zones belong to a radial fracturing system formed by a deep local stress center. Thus, based on analysis of the distribution of fracturing intensity averaged over the cross-sections, two major fracturing systems interfering with each other were identified in the study area.
The analysis of vertical and horizontal variations of fracturing intensity and geological interpretation of fracture distribution features indicates that the distribution of open fractures in the study area depends on factors such as tectonic deformation, lithology, depth and rock mass dilation characteristics. However, in the Kuh-e-Mond compressional feature, tectonic factors are the major controls on the fracturing, as would be expected.
Based on additional processing of SVSL data aimed at identification of tectonic factors and elimination of other factors, a major center for tectonic strain which formed the major system of fracturing in the Kuh-e-Mond was identified. This center is located under the anticlinal structure, generating a system of fractures during formation of the anticlinal fold in the layered media owing to the upward movement of the underlying strata. This system of fracturing is clearly shown in the generalized vertical cross-line section (Figure 7c).
An abnormal zone of low fracturing intensity (a compacted zone) was also recognized in the NW of the study area. The zone separates the central and NW parts of the oil field. Fracture distribution analysis in the Sarvak reservoir indicates that the general structure is formed by three major centers of strain identified from the analysis of generalized horizontal and vertical variations of fracturing intensity in the study area. From the point of view of open fractures’ distribution in the Sarvak, the SE section of the reservoir with the largest number of abnormally high open fractured zones is the most promising region for reservoir development. A zone characterized by minimum open fractures and therefore low permeability expectations is identified in the north-west part of the study area and is considered as the least promising region. Recommendations were made based on this study to select optimum locations for well drilling. Based on interpretation of SVSL results, it is concluded that the resulting spatial distribution of fractures at the depth interval of +350 m down to −6000 m in the Kuh-e-Mond field will be valuable in developing a drilling program and implementing proper development options for heavy oil production.
As mentioned earlier, factors such as differential rock strength, dilatancy factor, overburden and earth in situ stresses control the generation and distribution of open fractures in the geomedium. The impact of each factor can be semi-quantitatively distinguished based on the unique distribution of open fractures generated. Evaluation of effects of a particular factor on genesis of open fractures is also possible through excluding or accounting for the effects of other factors in the analysis—a filtering process that can be statistically optimized as required as more data from drilling become available.
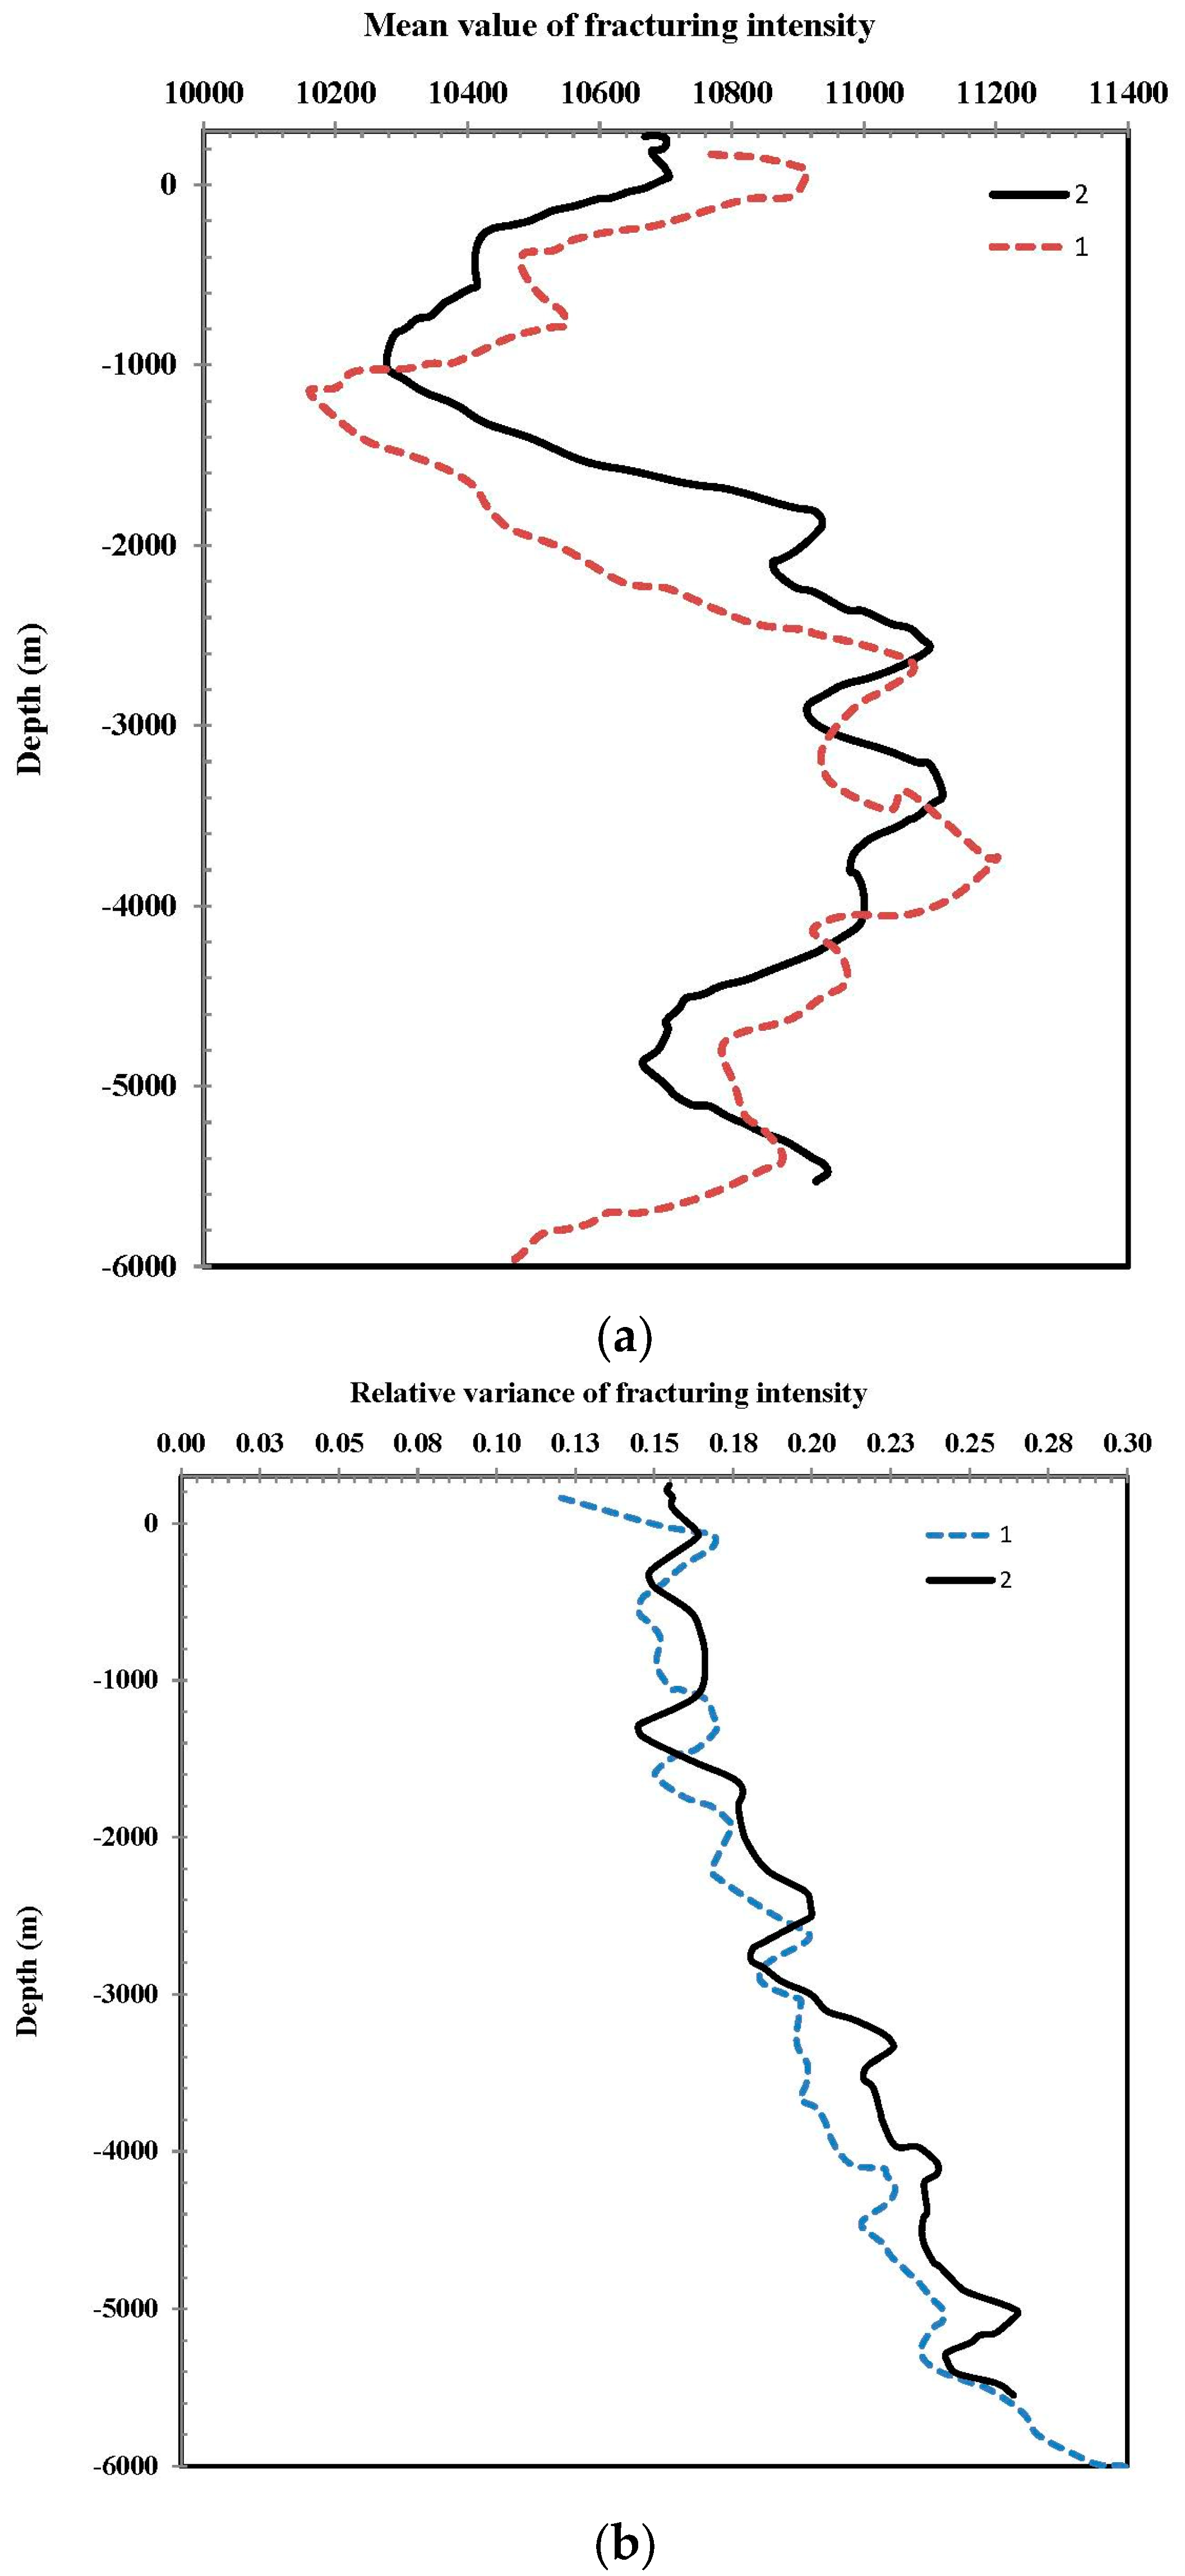
The source 3-D distribution of fracturing intensity from SVSL data was used to calculate the mean values and variance of fracturing intensity within horizontal and lateral slices. Diagrams of mean values and variance of fracturing intensity show the depth variation of the average fracturing intensity over the study area, indicating the effects of gravity, lithology and vertical dilatancy factors. The horizontal and lateral dilatancy affects the fracturing intensity variance, which is manifested in a relative variation of fracturing intensity within horizontal (diagram 1) and curvilinear (diagram 2) surfaces. The range of relative variation of mean fracturing intensity with depth in the entire depth interval makes up ~10% for horizontal slices and ~8% for lateral slices. The fracturing variance changes from 12% to 30% and such differences in variation of the mean value with depth and of fracturing intensity variance within a horizontal plane (in lateral direction) suggest that effect of dilatancy on fracturing intensity variation is higher in the horizontal plane than in vertical direction.
Results from the SVSL survey, Figure 8a,b, suggest that the general trend of depth variation of the mean fracturing intensity averaged within the horizontal and lateral planes are about the same. In general, the mean values and variance increase with depth. However, some anomalies were observed which are associated with the non-uniformity of the averaging surfaces. In addition, there is a clear trend of increase of subvertical fractures and therefore increase of the dilatancy effect with depth and the formation of compacted and decompacted zones. A zone with the highest fracturing intensity is located in the depth interval of 2.4–4.2 km (for horizontal slices or graph 1 in Figure 7a) or 1.7–4 km (for lateral slices or graph 2 in Figure 8a). Ductile strata with lower fracturing intensities are located below and above this depth interval. Hence, this finding implies subdividing the studied section based on the geomechanical properties or some measure of “strength” of the rock units:
- The upper part of the section (up to ~0 m) is intensely fractured (from 0 to 800 m);
- Below is a zone with a minimum fracturing intensity (800–1200 m);
- Next, to a depth of ~4000 m, is an intensely fractured zone
- And, in the deepest interval, fracturing intensity decreases sharply
The mean value and relative variance of fracturing intensity within the horizontal and lateral slices (Figure 8a,b) also suggests a co-phased variation of these two parameters. This can be interpreted as a more ductile layered structure compared with its underlying strata. The fracturing variance increases with decrease in the mean value of fracturing intensity starting at the depth of ~4000 m (Figure 8a,b). This anti-phased variation of the mean fracturing intensity and variance indicates that this depth interval consists of more dense rocks with a blocky structure.
From the point of view of development of this heavy oil NFCR, Kuh-e-Mond, one should note that identifying so-called “open fracture” zones is not the only goal where potential “sweet spots” must be selected for development and production. Such sweet spots and the heavy oil trapped in the fractures only accounts for less than 2% of the original oil in place and it is insignificant in terms of oil production. The goal here is to have a better understanding of the fracture systems and their spatial distribution for an overall optimum field development. In this scenario, fracture systems serve as a conduit to drain and transfer the heavy oil from the rock matrix, where over 98% of the original oil in place is located, into the production well. Some points for drilling productive deposits of the Sarvak Formation were proposed as top-priority actions that might help achieve high oil flow rates. As shown in Figure 7, placements of wells are presented in the structural slice located 175 m below the top of the Sarvak Formation. As far as the south-west part of the studied area, linear fractured zones are common and oriented across the strike of the dip and it is recommended to drill those strata with horizontal wells along the strike of the south-west slope of the structure.
The SVSL technique proved useful in characterizing fracture opening in the study area. However, this method reaches its maximum utility only when implemented in parallel with other direct techniques of reservoir characterization (core analysis, borehole wall geophysical surveys, well test data and surface expressions). A vertical well (MD-8) was drilled into a highly fractured zone identified using the results from this study. Cold production tests using progressive cavity pumps in the well reached a daily production of 1000 m3/d, an exceptionally promising rate for a heavy oil well. However, previous field experience shows that such high initial productions will drop drastically as the fracture network is drained, with no further notable cumulative oil production; thereafter; consideration of thermal stimulation methods would be necessary.
3.3. FMI and UBI Image Logs
Image logs are resistivity or acoustic devices that measure certain physical properties of the rock on the borehole wall or near the well that can be displayed as images to be interpreted visually or with computer-aided analysis. Formation Micro Imager logs (FMI) provide a resistivity image of the borehole wall in water-based mud drilling with a resolution on the order of millimeters. Introduced by Schlumberger in 1991 [36], they are now applied widely to study borehole geological features such as fractures, bedding plane orientation and shape, borehole breakouts and washouts and drilling-induced axial extensional fractures.
The Ultrasonic Borehole Imager or UBI was introduced by Schlumberger in 1993 [36] and works independent of mud type. In a manner similar to the FMI log, the UBI imager can be used to analyze fractures and the stress regime and conduct borehole stability studies in any type of rock. An amplitude image is used for interpretation of geological features including bedding patterns (planar, non-planar, lenticular), stylolites or dissolution seams, natural fractures (open and closed), drilling induced fractures and fine sedimentary structures such as flaser bedding and burrow casts. The radial UBI image gives a precise borehole geometry view, which can be used to understand wellbore stability issues.
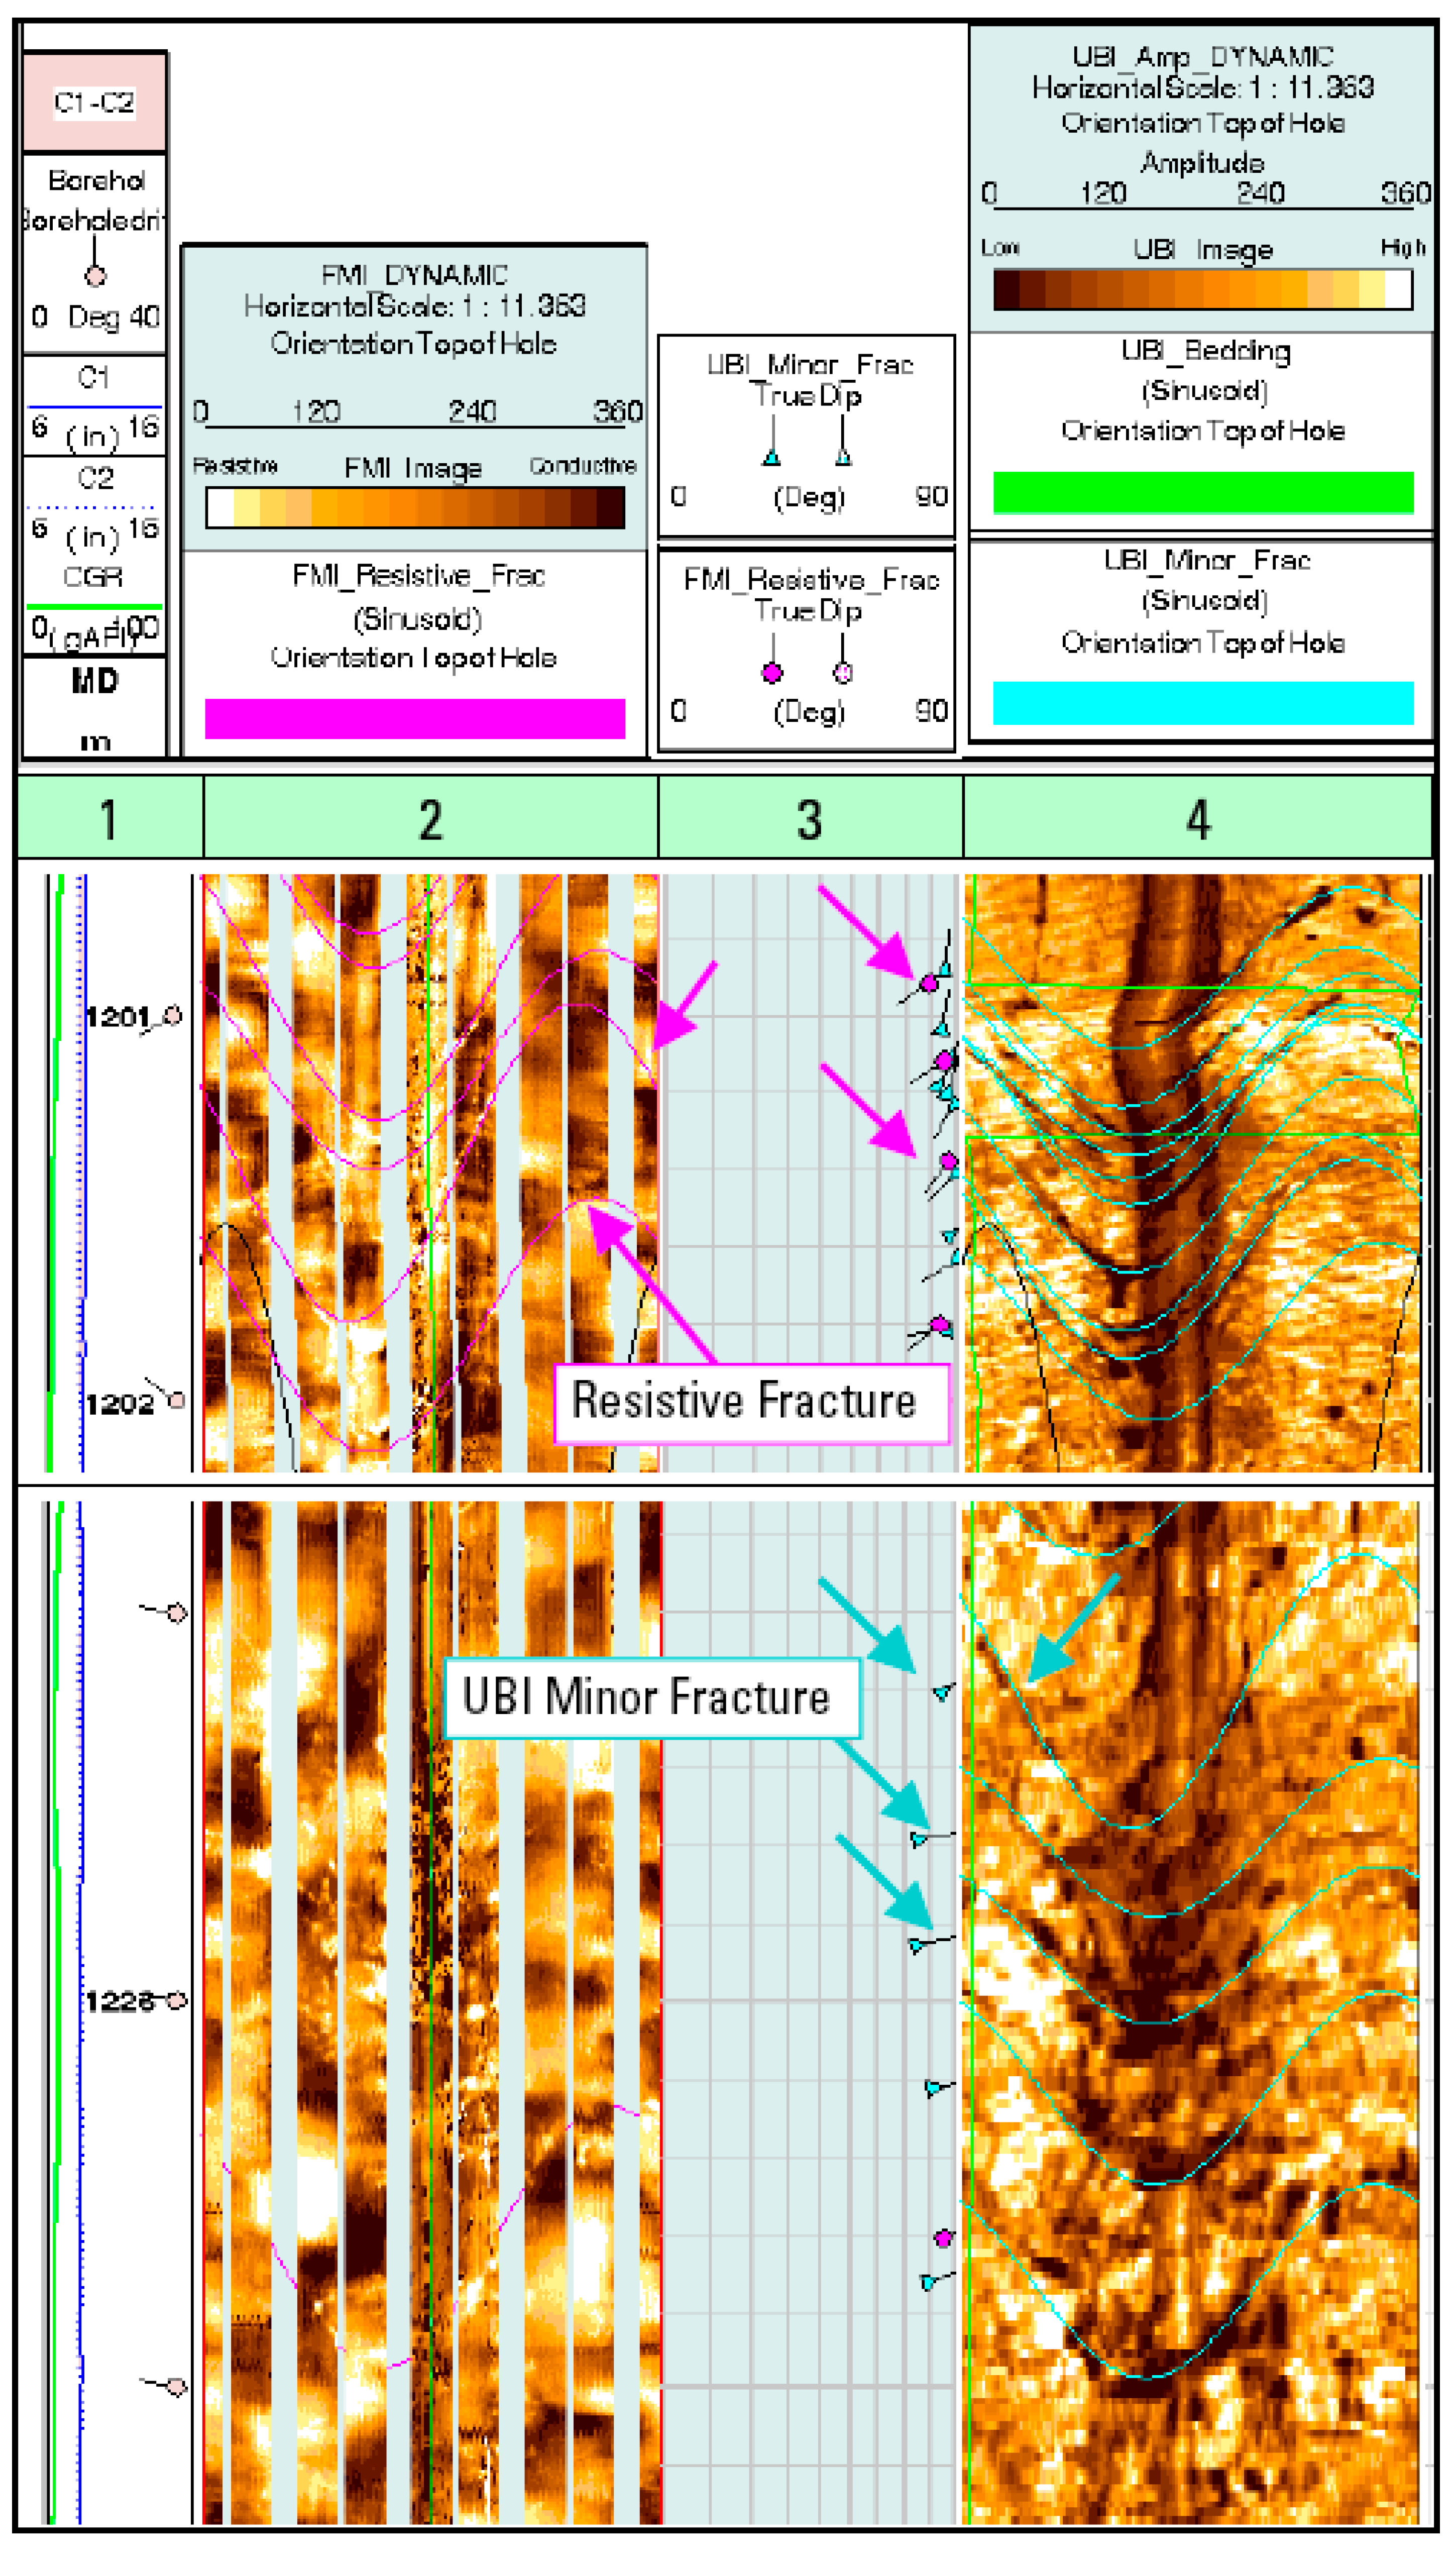
Borehole image logs, FMI and UBI, were used to identify and characterize natural fractures in the boreholes. In addition, the data were used for structural dip evaluation in the Sarvak I interval. FMI and UBI image logs from well MD-8 drilled close to the crest of the Kuh-e-Mond anticline were used. Summary plots of the features identified and picked out from FMI and UBI images in the Well MD-8 are presented at depth 1200 m–1300 m in Figure 9.
Resistive fractures on the FMI image are indicated by magenta arrows (Figure 10). Minor open fractures on the UBI image are shown with cyan arrows, below. In some cases, one feature appears on both images but open on the UBI image and closed on the FMI image. This may indicate that the open fractures are filled with oil-based mud, which is detected by the FMI tool as resistive fractures.
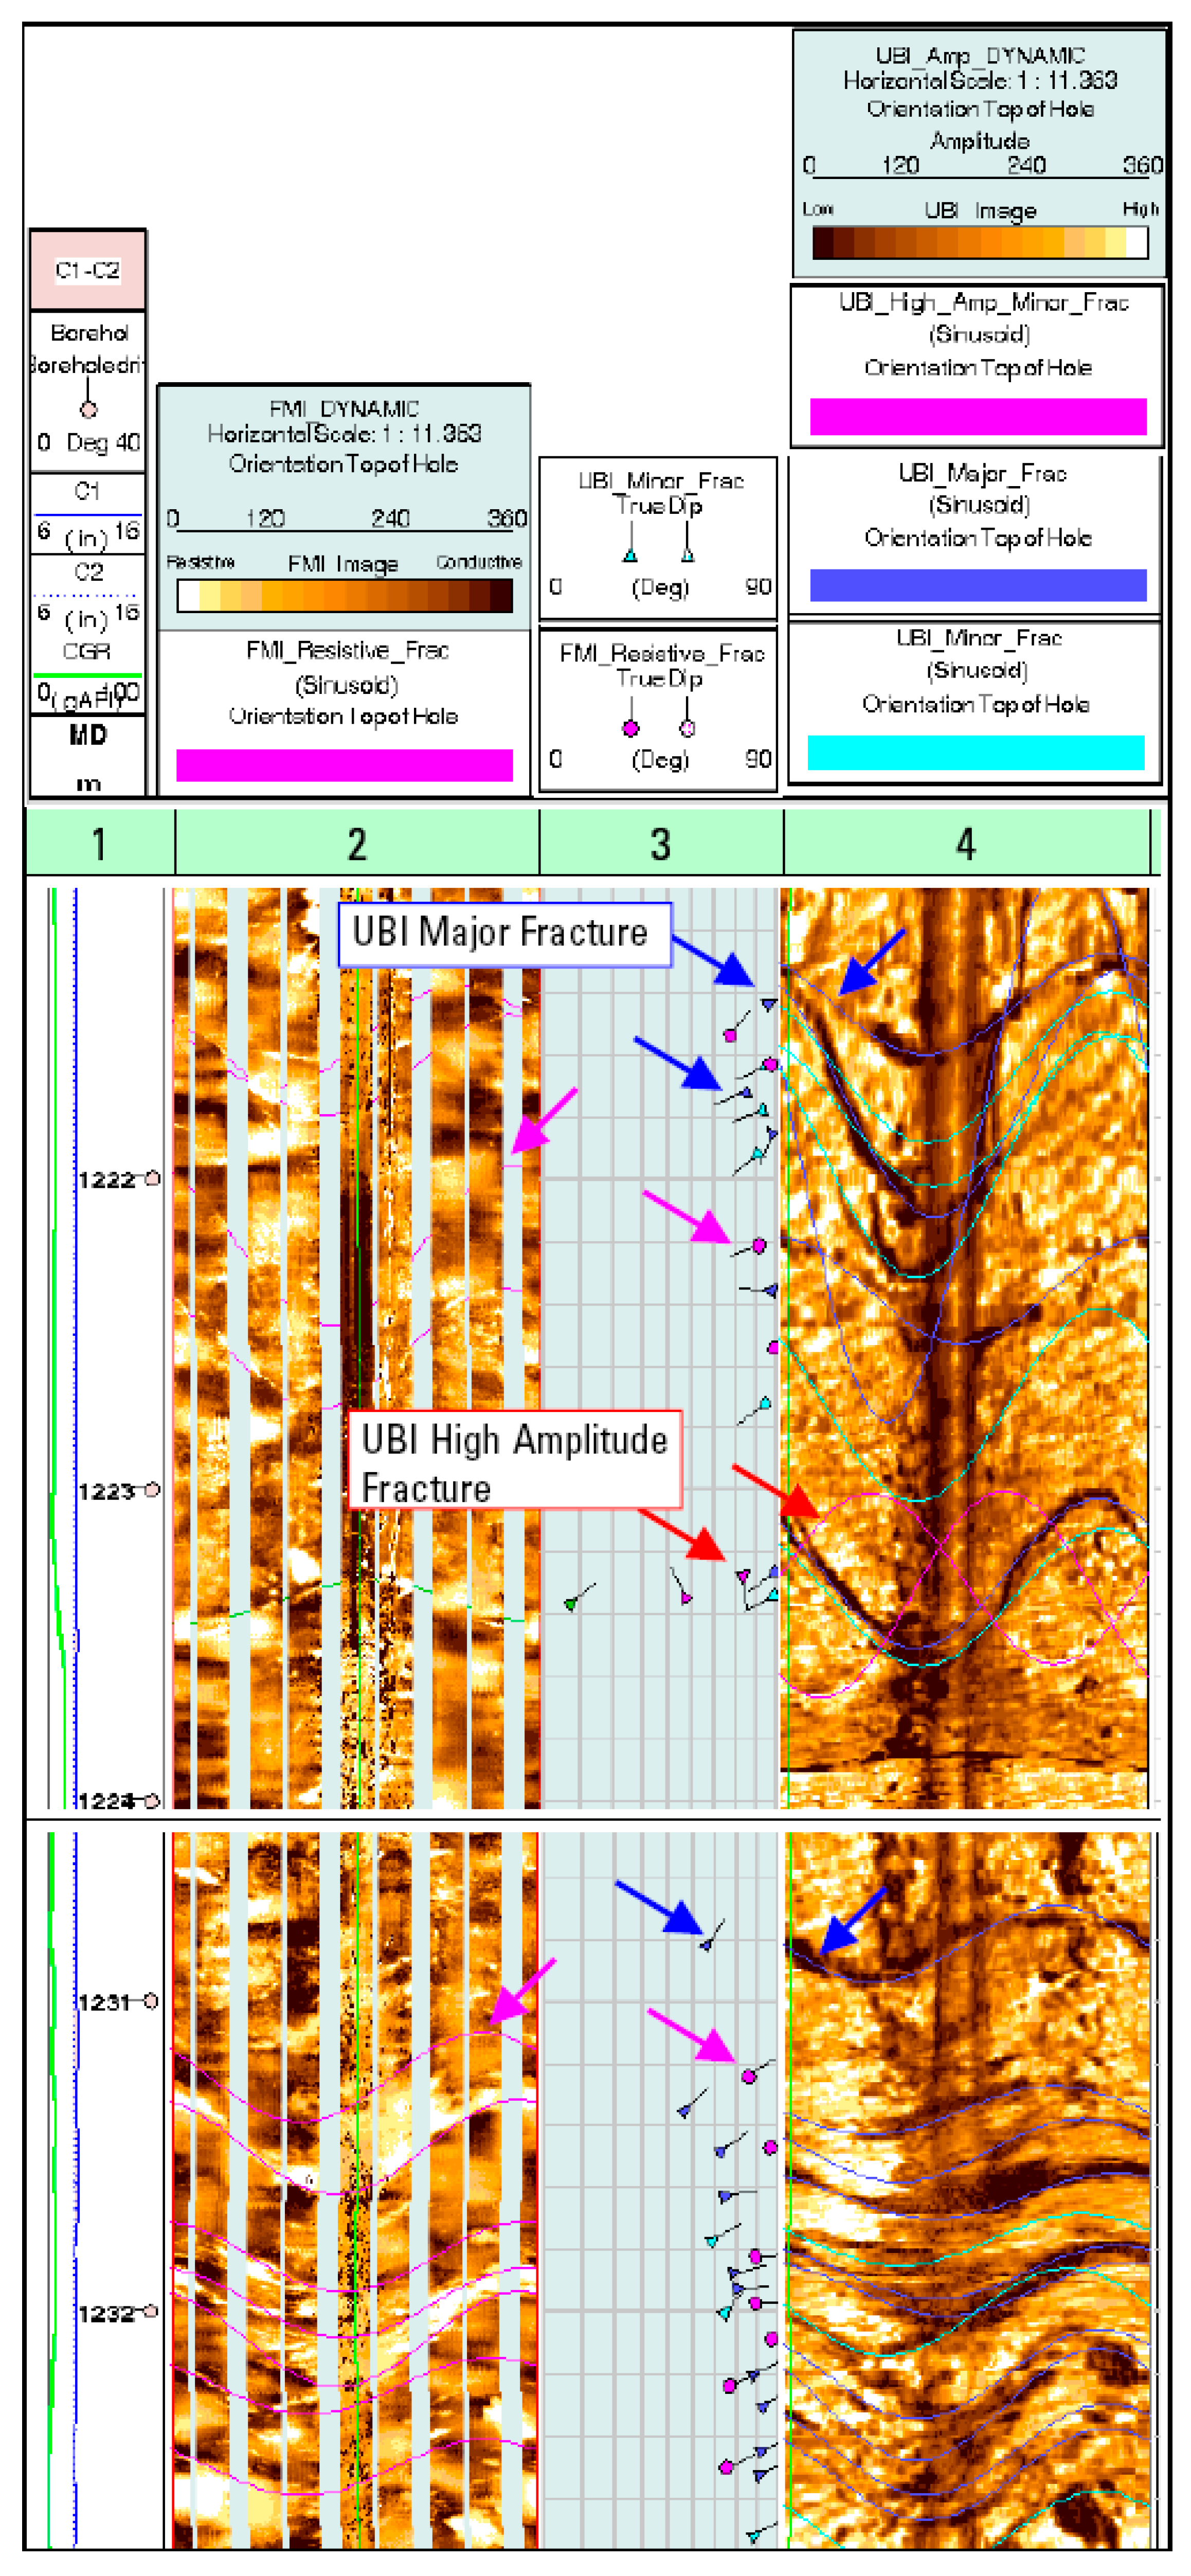
Two highly fractured zones in the Sarvak I interval are shown in Figure 11. Blue arrows indicate major open fractures picked from the UBI. On the FMI image, some resistive fractures can be seen (magenta arrows), some of which coincide with open fractures visible on the UBI but filled with resistive mud. There also are red arrows to indicate two UBI high amplitude minor fractures in the upper image. These minor fractures are interpreted as filled or healed.
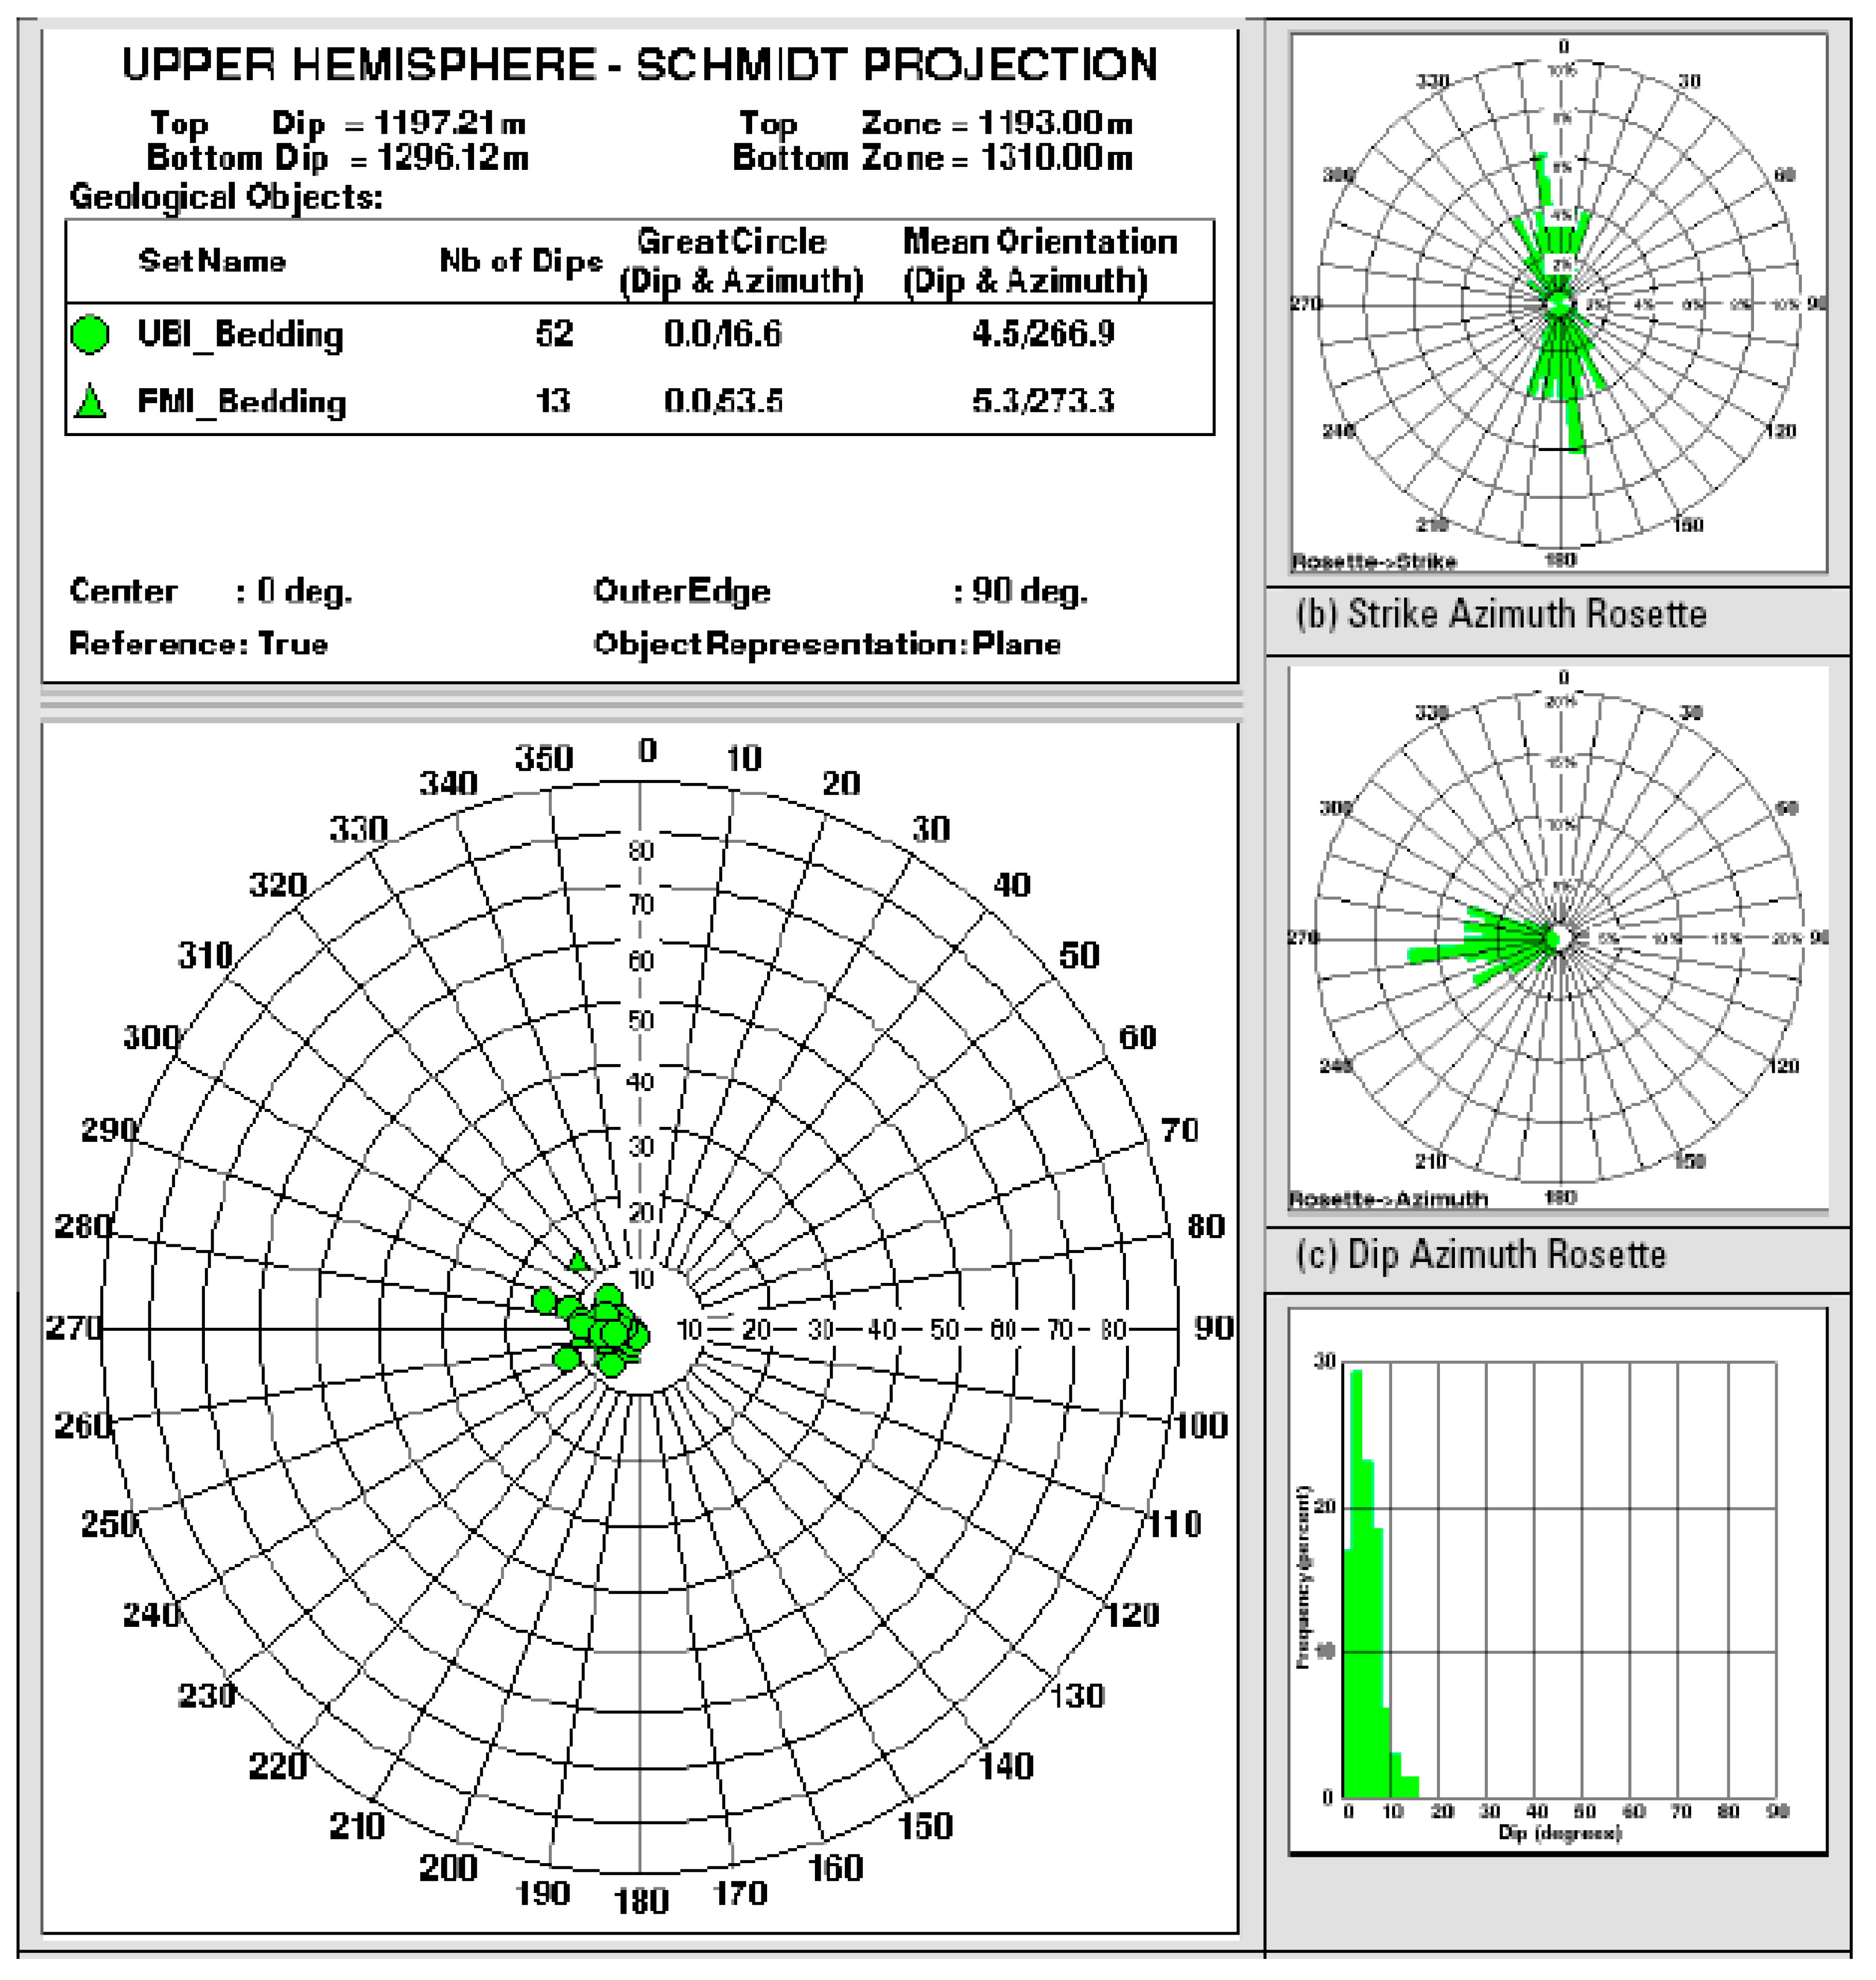
Based on the observations and interpretation of the images from 1194.2 to 1310 m (Well MD-8), the highlights of the study are summarized (Figure 12). The structural dip in the logged interval (Sarvak I), based on 52 UBI bedding dips and 123 FMI bedding dips, is 5° towards S84W. This structural dip is consistent throughout the logged interval with no evidence of any major structural boundary such as a major fault or angular unconformity. Fracturing is observed at a number of places. FMI images also show fractures in a number of places. Both dip and dip direction of the UBI major open fractures show high variation. However, the dip magnitude varies between 45°–90° with dominant values of 83°–88°. The same condition is true for the dip direction that has a dominant direction towards N67W, varying almost in all directions. UBI minor open fractures dip mainly towards the SW, NW and NE with dip varying from 45°–90° with a dominant 84° dip. For FMI resistive fractures, the dip ranges between 38°–90° toward mainly the SW with a similar dominant dip. Some minor dip directions towards NW, NE and SE are also significant.
3.4. Earth Stresses—Geological Inference
Natural stresses can neither be computed nor precisely measured; they can only be estimated at some level of reliability using a variety of techniques. Stresses are different for each point in the earth and a “stress state” can only be defined at a single point. In situ stresses can be estimated through field measurements (e.g., image logs, hydraulic fracture tests, step-rate injection tests, calibrated dipole sonic logs) or inferred through geological indicators (e.g., tectonic fabric and history, faults, fractures, borehole breakouts). A combination of methods for each study region is necessary to integrate data between wells, to reduce uncertainty (each method has particular limitations in NFCRs) and to build the 3-D geomechanics model that will serve as the basis for reservoir simulations and predictions.
To conduct a comprehensive assessment of natural fractures in the reservoir, all fractures were measured on whole and slabbed cores reoriented to their original status in the reservoir using geological criteria and image log data. Results obtained from core analysis are presented in Figure 13a. Orientation of the detected fractures in cores is highly variable; however, most fractures are steep, N-S to NNE trending structures with dip azimuth towards the E to EES. This suggests that the Persian Gulf Sedimentary Basin seems to be detached from its basement. Results obtained from fracture study by using image logs are presented in Figure 13b. The results of core analysis are more or less consistent with image log analysis but there are some differences between the results obtained from these two methods. The study area is a tectonically active area and multiple tectonic events over the past geological history of the study area can be considered as responsible for rotation of the structures (e.g., a massive 90 km in 11 km anticline). The trends of natural fractures measured from cores are aligned with the Qatar-Kazerun fault system in the study area. The Qatar-Kazerun fault has tilted the nose of the Kuh-e-Mond anticline. Such a rotation can result in orientation of the fractures both at depth and at the surface at various directions and at points in the study area. It should be highlighted here that using fracture data derived from core data and image logs is considered more reliable compared with the surface fracture studies data, as they are more likely to represent the current in situ stress state.
3.4.1. Magnitude of the In Situ Principal Stresses
Vertical stress magnitudes (σv) can be estimated by establishing depth-density relationships within about 2 to 4% reliability. Hydraulic Fracturing (HF), including leak-off tests, is the most common technique for measuring the σhmin magnitudes while drilling [37] if σhmin is vertical but no method alone can reliably measure the σHMAX. σHMAX can be estimated using a formula proposed by Hubert and Willis (1957) [38]. Extended leak-off test, XLOT, along with fracture reopening test can be used to estimate provided that the rock behaves elastically and that there are no severe thermal, poroelastic, or plasticity effects arising from the drilling and testing [39].
The relative quantity of the principal stresses can be determined via using geological inference from the tectonic history of the sedimentary basin. This is the case, especially when there are relatively recent tectonic activities in the region such as movement of faults that are sufficiently close to the site. As an example, salt at depth can create distinct elongated ridges, almost “waves.” Such structures are oriented at 90° from σhmin (=σ3). Hence, a relative quantity compared with the other two principal stresses can be determined.
Stress measurements using hydraulic fracturing and extended leak-off tests data are widely employed and commercial services are available (e.g., Minifrac™) based on precision pumps, bottom hole gauges and a refined methodology. Minimum stress magnitudes (σ3) from these data are highly reliable. Because of various effects, σHMAX values may be interpreted often as a lower-bound estimate: the actual σHMAX stress is likely to be larger than the calculated value.
In contrast to σv(z), increase in lateral stresses is not monotonic with depth at the scale of geological or rock units. Layers with different stiffness deviate from a regular increase pattern in lateral stress quantity. In addition, the quantity and nature of the difference depends on the rock type and the stress history in the region such as tectonic loading and erosion unloading. Lateral stresses in ductile shales are often closer to the vertical stress than the lateral stresses in adjacent stiff rocks such as dolomites and sandstones and in salt an isotropic stress state can be assumed.
Magnitudes of estimated in situ principal stresses and pore pressure were made at a depth of 1200 m in well MD-8; a hydrostatic stress regime is assumed here for pore pressure:
K was obtained as 0.45 based on Sheorey’s model [40].
Po = h × γw = 1200 × 9.81 = 11.77 MPa
σ2 = σV = h × γ = 1200 × 25 = 30 MPa
σ3 = σhmin = K × σV = K × σ2 = 13.5
σ1 = σHMAX > σ2 = σV = 30 MPa > σ3 = σhmin = 13.5 MPa
As one can see, the earth stress regime in the study area is a compressive stress regime as expected. Better estimates can also be obtained for the σhmin and fracturing pressure using hydraulic fracturing data. Unfortunately, there was no hydraulic fracturing test data available for the study area for use in calculations. Note that the estimated magnitudes of in situ principal stresses in this study are just “rough estimates” for such a big structure and oil field. This is despite the fact that values are consistent with the geological and field evidences from the study area. Implementation of some form of more detailed in situ measurement techniques for delineation of the stress field in the study area is inevitable.
3.4.2. Orientations of the In Situ Stresses
Stresses are controlled primarily by lithostatic loads and present-day tectonic loading [20,21,41]. Surface indicators (contemporary stress orientations) such as “pop ups” (small stress relief anticlines), may reveal mean stress orientations, the axis of the anticline will be roughly perpendicular to σHMAX [42,43]. Brittle fractures parallel to σHMAX can form at the surface. Subsurface indicators such as breakouts are the best for oil wells and aligned with σhmin. Borehole images help in distinguishing genuine breakouts from other features [20,21]. In most cases where breakouts occur the rock was subject to very high stress anisotropy. Core features, stress relief (center line petal fracturing, coring induced fractures, core disking) can be used and orientations of principal stresses can be estimated from the orientation of recovered strains using stress relief techniques on cores [44].
Geological inference is considered as a powerful and useful technique for assessment of the direction of earth stresses. In general, near faults, mountain chains and graben-rift systems the stress directions mirror the geological structures. For example, σ3 = σhmin is in the same direction with strike of an active normal fault. However, its direction is perpendicular to the fault strike if the fault is a thrust fault and then σ3 = σv. For a strike-slip fault, first the motion direction needs to be found and then σ3 = σhmin directions can be determined. Normally, the orientation of σhmin about 60°–70° from the fault’s strike. A check is required to ensure that the present-day stresses are measured and stress field has not rotated since the last tectonic activity in the region.
Large hydraulically induced fractures are perpendicular to σ3, simply because this is the most energetically efficient orientation for fractures to open. Provided that σhmin = σ3, the fracture will grow and spread vertically in the natural stress state. To be used as an indicator of stress directions, the fracture should be big enough to be far from the influence of the borehole region. In addition, it should be much longer than the joint spacing in the rock mass as the joints can affect the local fracture propagation but not large-scale direction. The most reliable method to determine the orientation of large vertical hydraulic fractures at moderate depths is using high precision tiltmeters.
From core analysis and image logs, it can be concluded that the orientation of the maximum horizontal stress (σHMAX = σ1) around the well MD-8 is NE-SW as shown in Figure 14. Hence, the orientation of σhmin (=σ3) is NW-SE and σ2 is vertical, as well. For petroleum geomechanics purposes, these results are more reliable compared with the information obtained from surface fracture studies for such a tectonically active area and such a large geological structure and oil field.
3.4.3. Pore Pressure Estimation
To complete the determination of stress state, knowledge about pore pressure is required. In general, these cannot be estimated reliably and with precision with any known means. This is due to geological heterogeneity and complex geological structures in geological environments similar to the case study presented here. It is recommended to check the estimates with seismic methods and extrapolation from offset wells, which can be quite useful in specific basin settings. During hydraulic fracturing with precision tools and packers to isolate the fracture zone, it is often possible to also obtain a good value of the pore pressure. If various methods are used, then it is normally possible to have proper data on orientation of the earth stresses and reasonable values for Po, σv, and σhmin, with a rough estimate of σHMAX from geological inference.
4. Results and Discussion
4.1. Origins of Natural Fractures in the Study Area
In geomechanics, natural fracture types can be divided into two classes considering their mode of creation: shear fractures, which are created through shearing of the rock parallel to the fracture formed and tension (extensional) fractures, which are created through extensional strain perpendicular to the fracture plane. In NFCRs, there are at least three sources of fractures. One is the high solubility of the carbonate rock that leads to porosity loss through internal mass transfer during diagenesis, causing a general shrinkage in the horizontal plane and leading to some fracturing when Po > σhmin. Similarly, volume diminution during dolomitization leads to opening of factures in a similar manner. Finally, there is the flexure response aspect of a stiff rock, which leads to open fractures. Non-fractured carbonates, invariably not too deeply buried, are far rarer than fractured carbonates because of these processes.
Geological interpretation of the fracturing system in the study area based on the tectono-physical models (Figure 14) showed that formation of the anticlinal fold is due to the vertical tectonic displacement of a deep-seated feature, which could be a basement block or a salt ridge. Another major system of fracturing identified as a radial system was formed by a deep-seated local center of tectonic uplift.
The averaged vertical in-line sections (Figure 7) show a more complicated image of a random distribution of fractures as compared to the previous cross-section. The random character of fracture distribution is increasing at depths below 4 km where the distribution of anomalies of maximum and minimum fracturing intensity has a mosaic character.
Generation of fractures in the Jahrum Formation occurred because of tectonic events within a Neo-Tethys age basin, which included the development of the present-day Zagros foreland basin. By the Late Cretaceous, basin convergence occurred due to subduction of the Arabian plate [46]). Continuing collision movements up to the late Miocene caused buckling which led to the shortening of the mountain range of the Zagros fold-and-thrust belt. The shortening normal to the Zagros range was confirmed by using magnetic fabric data from the Kuh-e-Mond anticline. Layer-parallel shortening in early to middle Miocene has leaded to detachment folding in the Kuh-e-Mond region adjacent to the Kazerun Fault [47,48,49,50,51,52]. This tectonic event created interconnected fractures over large distances, which significantly increased porosity and permeability and influenced draining and accumulation of petroleum fluids in the carbonate reservoirs [53,54,55,56,57].
4.2. Present Day Stress Field Orientation in the Study Area
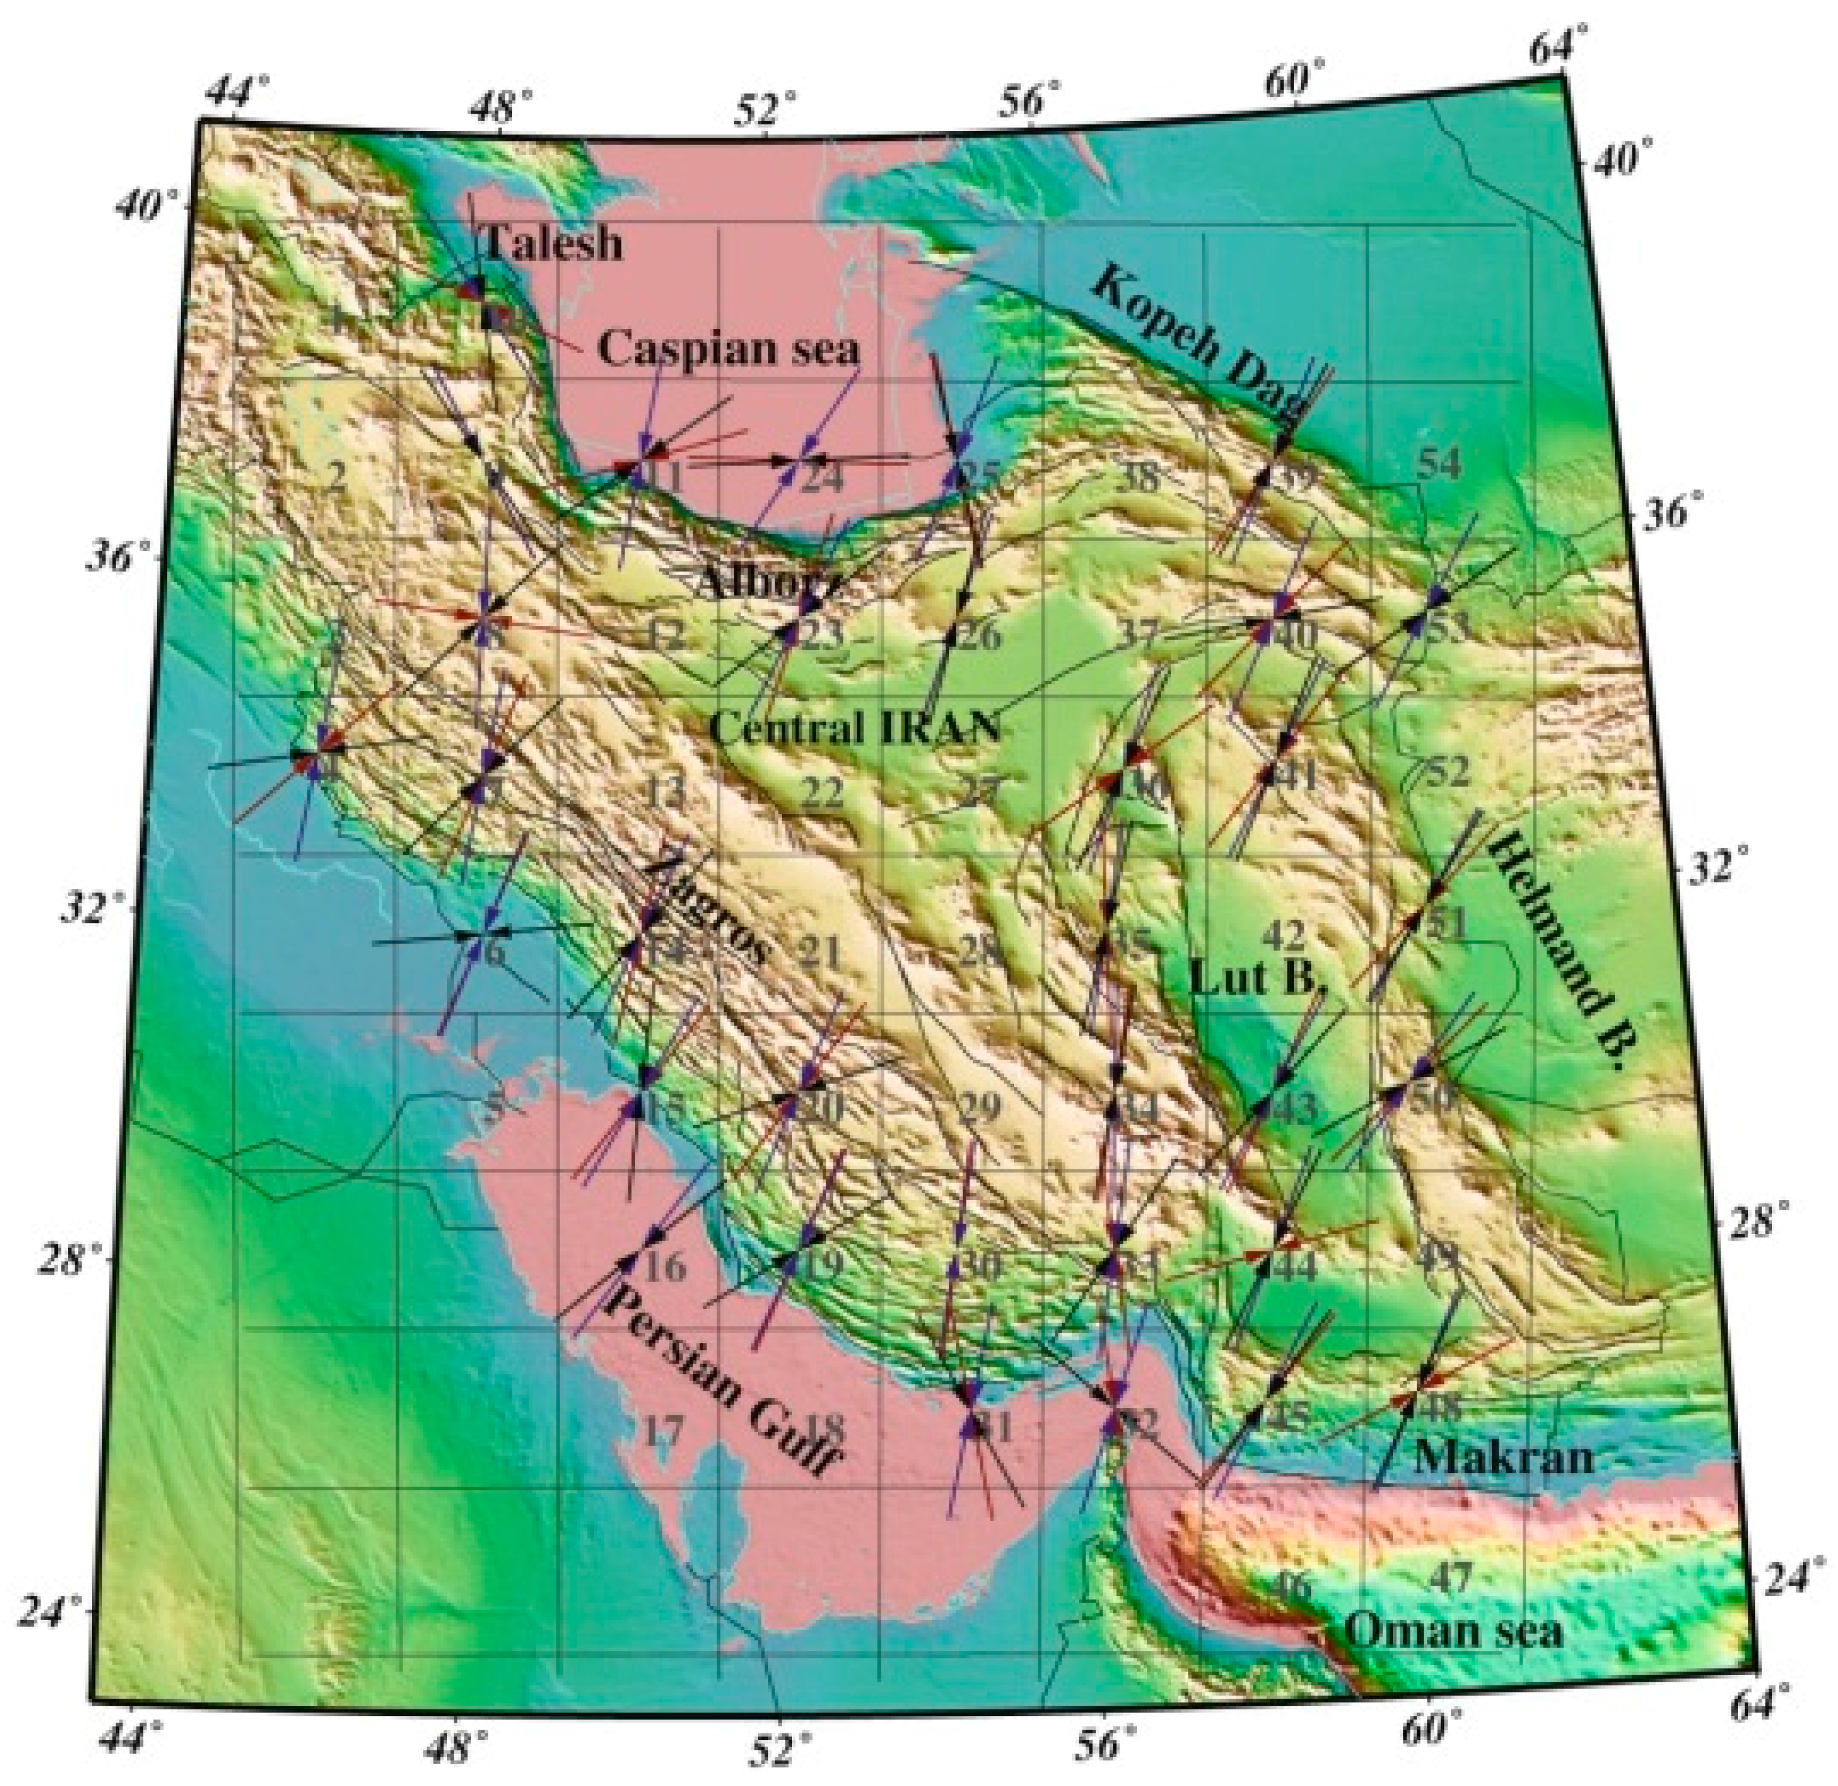
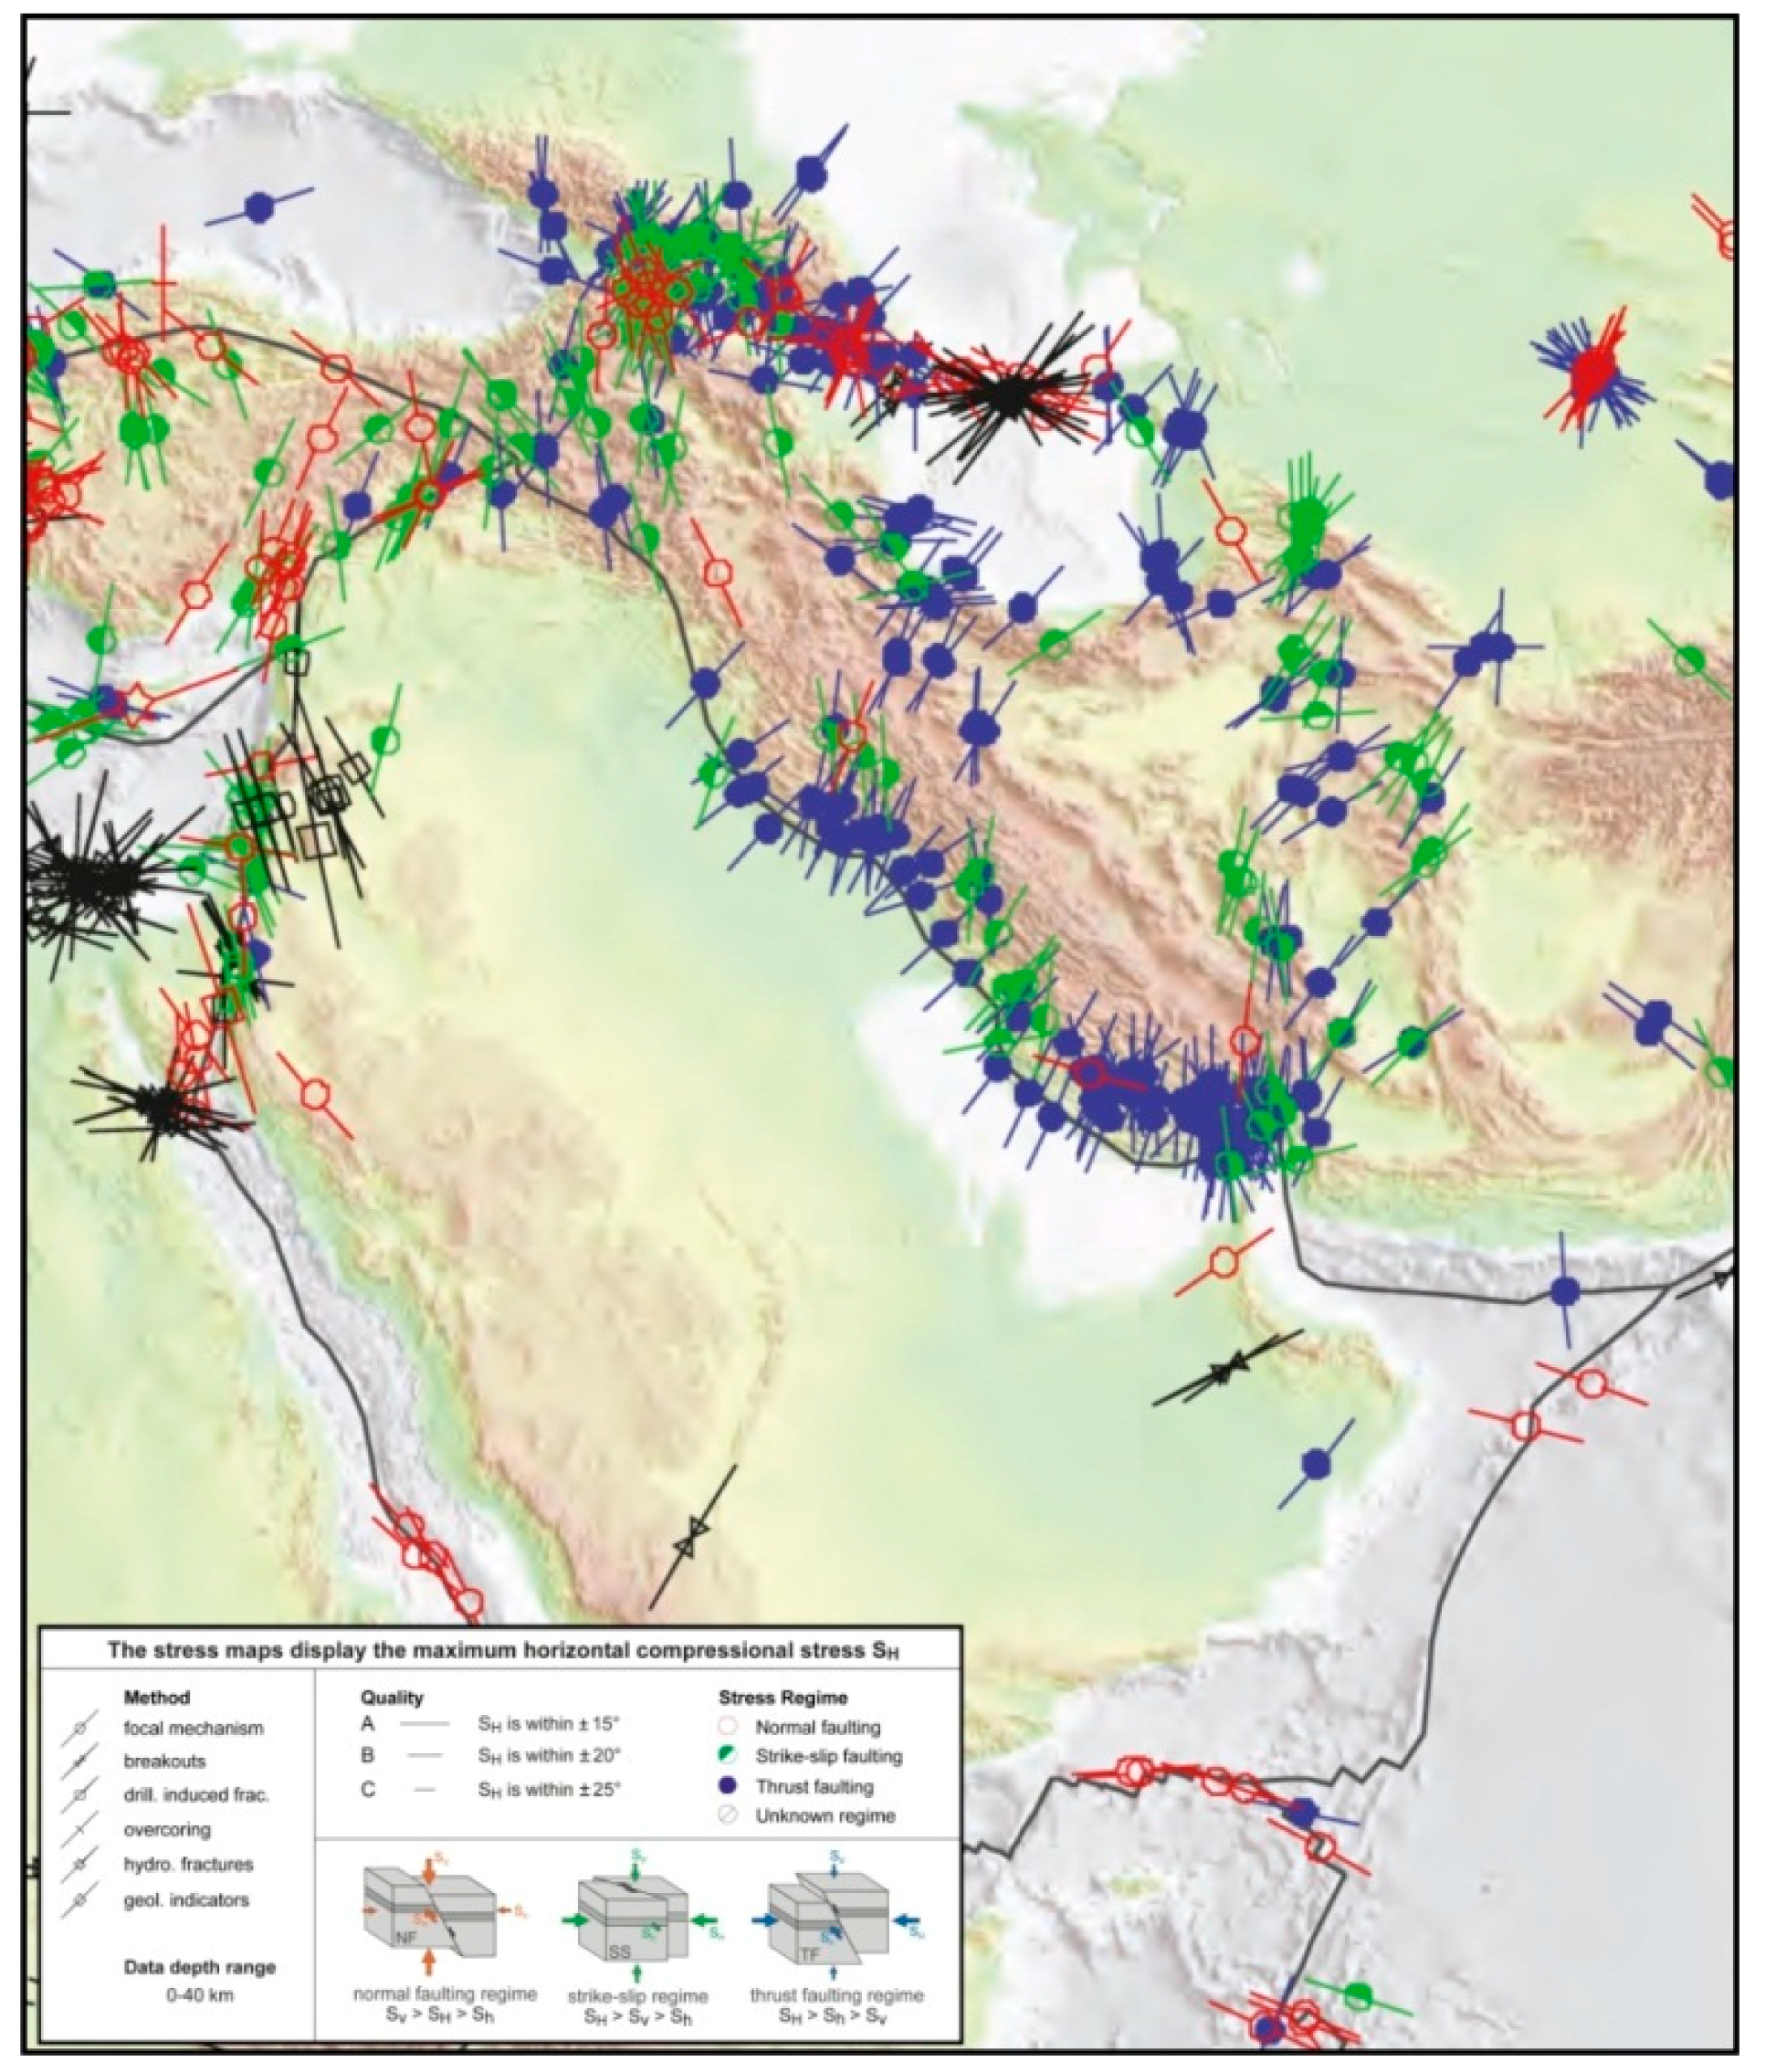
The present day tectonic stress state in the Middle East, the most prolific hydrocarbon basin in the world where vast amounts of hydrocarbon production are taking place, remains poorly understood in detail due to lack of data. Nevertheless, present-day stress field orientation in the study area is shown in Figure 14 and Figure 15 based on the currently available data in the public domain. These maps show that the azimuth of σ1 and σ3 in the study area is approximately 030°–035° and 120°–125°, respectively and σ2 is vertical and equal to the overburden weight. This orientation of in situ stress field is consistent with the geotectonics (passive plate tectonics margins), structural geology, image logs and fracture study used. Estimates made in this study using multiple sources such as core analysis and image logs are in a good agreement with estimates suggested by World Stress Map and geological and geotectonic evidences.
5. Conclusions
Data from outcrop studies, core analysis, SVSL seismic method and borehole image logs (FMI and UBI logs) were implemented to delineate natural fracture systems in a heavy oil fractured carbonate field in Iran. In addition, available data and techniques including core analysis, image logs, World Stress Map and geological and geotectonics inference were utilized to infer the in situ stress state in the study area. The following major conclusions can be drawn based on the results obtained from this study:
- Integrated studies of natural fracture systems in fractured reservoirs can be instrumental in E&P projects and site characterization practices for geological CO2 sequestration projects.
- Borehole image logs, FMI and UBI, proved to be useful tools in identifying and characterizing natural fractures in the study area.
- The studied reservoirs, including regions in both Jahrum and Sarvak formations are highly fractured. Three dominant orientations were identified for vertical and sub-vertical fractures atop the crestal region of the anticlinal structure: N, NE and E. Both the surface and subsurface fractures are shear fracture type of tectonic origin nearly in the same direction. Distribution of open fracturing in the study area depends on tectonic, lithology, overburden and rock dilation. Tectonics is the major factor.
- NE-SW and NW-SE found to be the dominant orientations for maximum and minimum horizontal stresses in the study area.
- Most fractures are steep, N-S to NNE trending structures with dip azimuth towards the E to EES. This suggests that the Persian Gulf Sedimentary Basin seems to be detached.
- From image logs, the strike azimuth of the drilling induced fracture is N45°W, which indicates that the orientation of σHMAX = σ1 around the well MD-8 is NE-SW; the orientation of σhmin = σ3 is NW-SE and σ2 is vertical. Azimuths of σ1 and σ3 in the study area are 030° to 035° and 120° to 125°; respectively.
- Estimated magnitudes of the in situ principal stresses and pore pressure at depth of 1200 m in well MD-8 are: Po = 11.77 MPa, σ2 = σV = 30 MPa, σ3 = σhmin = 13.5 MPa and σ1 = σHMAX = > σ2 = σV = 30 MPa > σ3 = σhmin = 13.5 MPa.
Author Contributions
Ali Shafiei conceived the idea and wrote the first draft of the manuscript; Maurice B. Dusseault reviewed the manuscript multiple times and contributed to the writing of the manuscript at various stages; Ehsan Kosari reviewed the manuscript and helped with analysis of the fracture data and wrote small sections on structural geology of the study area; Morteza N. Taleghani has reviewed the manuscript and helped with analysis and interpretation of the image logs and seismic data.
Conflicts of Interest
The authors declare no conflict of interest.
References
- Dusseault, M.B.; Shafiei, A. Oil Sands; Ullmann’s Encyclopedia of Chemical Engineering; Wiley: Hoboken, NJ, USA, 2011; p. 52. [Google Scholar] [CrossRef]
- Rogner, H.H.; Aguilera, R.F.; Archer, C.; Bertani, R.; Bhattacharya, S.C.; Dusseault, M.B.; Gagnon, L.; Haberl, H.; Hoogwijk, M.; Johnson, A.; et al. Chapter 7—Energy Resources and Potentials. In Global Energy Assessment—Toward a Sustainable Future; Cambridge University Press: Cambridge, UK; New York, NY, USA; International Institute for Applied Systems Analysis: Laxenburg, Austria, 2012; pp. 423–512. ISBN 978-0-52-118293-5. [Google Scholar]
- Saidi, A.M. Reservoir Engineering of Fractured Reservoirs—Fundamental and Practical Aspects; TOTAL Edition Press: Paris, France, 1987. [Google Scholar]
- Rutqvist, J.; Wu, Y.S.; Tsang, C.F.; Bodvarsson, G. A modeling approach for analysis of coupled multiphase fluid flow, heat transfer and deformation in fractured porous rock. Int. J. Rock Mech. Min. Sci. Eng. 2002, 39, 429–442. [Google Scholar] [CrossRef]
- Rutqvist, J.; Stephansson, O. The role of hydromechanical coupling in fractured rock engineering. Hydrogeol. J. 2003, 11, 7–40. [Google Scholar] [CrossRef]
- Yang, Y.; Liu, Z.; Sun, S.; An, S.; Zhang, W.; Liu, P.; Yao, J.; Ma, J. Research on Stress Sensitivity of Fractured Carbonate Reservoirs Based on CT Technology. Energies 2017, 10, 1833. [Google Scholar] [CrossRef]
- Chong, Z.; Li, X.; Chen, X.; Zhang, J.; Lu, J. Numerical Investigation into the Effect of Natural Fracture Density on Hydraulic Fracture Network Propagation. Energies 2017, 10, 914. [Google Scholar] [CrossRef]
- Fang, J.; Zhou, F.; Tang, Z. Discrete fracture network modelling in a naturally fractured carbonate reservoir in the Jingbei oilfield, China. Energies 2017, 10, 183. [Google Scholar] [CrossRef]
- Salimi, S.; Ghalambor, A. Experimental study of formation damage during underbalanced drilling in naturally fractured formations. Energies 2011, 4, 1728–1747. [Google Scholar] [CrossRef] [Green Version]
- Shafiei, A. Mathematical and Statistical Investigation of Steamflooding in Naturally Fractured Carbonate Heavy Oil Reservoirs. Ph.D. Thesis, University of Waterloo, Waterloo, ON, Canada, 2013. [Google Scholar] [CrossRef]
- Shafiei, A.; Zendehboudi, S.; Dusseault, M.B.; Chatzis, I. Mathematical model for steam flooding in naturally fractured reservoirs. Ind. Eng. Chem. Res. 2013, 52, 7993–8008. [Google Scholar] [CrossRef]
- Shafiei, A.; Dusseault, M.B. Geomechanics of thermal oil production from carbonate reservoirs. J. Porous Media 2014, 17, 301–321. [Google Scholar] [CrossRef]
- Nelson, R. Geologic Analysis of Naturally Fractured Reservoirs; Gulf Professional Publishing: Houston, TX, USA, 2001; ISBN 978-0-88-415317-7. [Google Scholar]
- Morgenstern, N.R. A relation between hydraulic fracture pressure and tectonic stresses. Geofis. Pura Appl. 1962, 52, 104–114. [Google Scholar] [CrossRef]
- Kashnikov, Y.A.; Ashikhmin, S.G. Influence of oil recovery on the change in the stress-strain state of rock mass. Part III: Technogenic activation of fault structures. J. Min. Sci. 2000, 36, 244–252. [Google Scholar] [CrossRef]
- Nolen-Hoeksema, R.C.; Rabaa, A.W.M. Waterflood improvement in the Permian Basin: Impact of in situ stress evaluations. SPE Res. Eng. 1994, 9, 254–260. [Google Scholar] [CrossRef]
- Tingay, M.; Müller, B.; Reinecker, J.; Heidbach, O.; Wenzel, F.; Fleckenstein, P. Understanding tectonic stress in the oil patch: The World Stress Map Project. TLE 2005, 24, 1276–1282. [Google Scholar] [CrossRef]
- Banks, D.; Odling, N.E.; Skarphagen, H.; Rohr-Torp, E. Permeability and stress in crystalline rocks. Terra Nova 1996, 8, 223–235. [Google Scholar] [CrossRef]
- Bell, J.S. In situ stresses in sedimentary rocks (Part 1): Measurement techniques. Geosci. Can. 1996, 23, 85–100. [Google Scholar]
- Bell, J.S. In situ stresses in sedimentary rocks (Part 2): Applications of stress measurements. Geosci. Can. 1996, 23, 135–153. [Google Scholar]
- Heffer, K. Geomechanical influences in water injection projects: An overview. Oil Gas Sci. Technol. 2002, 57, 415–422. [Google Scholar] [CrossRef]
- Heffer, K.J.; Fox, R.J.; McGill, C.A. Novel techniques show links between reservoir flow directionality, earth stress, fault structure and geomechanical changes in mature waterfloods. SPE 1995, 2. [Google Scholar] [CrossRef]
- Henk, A. Pre-drilling prediction of the tectonic stress field with geomechanical models. First Break 2005, 23, 53–57. [Google Scholar] [CrossRef]
- Araújo, J.S.; Vieira, M.M.; Bezerra, F.H.R. Influence of tectonic stresses in the permeability of petroliferous reservoir in Potiguar Basin, Brazil. In Proceedings of the SPE Latin American and Caribbean Petroleum Engineering Conference, Cartagena, Colombia, 31 May–3 June 2009. [Google Scholar]
- Yang, W.; Lin, B.Q.; Wu, H.J. Study of the stress relief and gas drainage limitation of a drilling and the solving mechanism. Proc. Earth Planet. Sci. 2009, 1, 371–376. [Google Scholar]
- Kosari, E.; Ghareh-Cheloo, S.; Kadkhodaie-Ilkhchi, A.; Bahroudi, A. Fracture characterization by fusion of geophysical and geomechanical data: A case study from the Asmari reservoir, the Central Zagros fold-thrust belt. J. Geophys. Eng. 2015, 12, 130–143. [Google Scholar] [CrossRef]
- Denga, H.; Stauffera, P.H.; Daia, Z.; Jiao, Z.; Surdamb, R.C. Simulation of industrial-scale CO2 storage: Multi scale heterogeneity and its impacts on storage capacity, injectivity and leakage. IGGGC 2012, 10, 397–418. [Google Scholar] [CrossRef]
- Bacon, D.H.; Qafoku, N.P.; Dai, Z.; Keating, E.H.; Brown, C.F. Modeling the impact of carbon dioxide leakage into an unconfined, oxidizing carbonate aquifer. IJGGC 2016, 44, 290–299. [Google Scholar] [CrossRef]
- Liu, H.; Zhang, X.; Lu, X.; Liu, Q. Study on flow in fractured porous media using pore-fracture network modeling. Energies 2017, 10, 1984. [Google Scholar] [CrossRef]
- Bashari, A. Occurrence of heavy crude oil in the Persian Gulf. In Proceedings of the 4th UNITAR/UNDP International Conference on Heavy Crude and Tar Sands, Edmonton, AB, Canada, 7–12 August 1988; pp. 203–214. [Google Scholar]
- Moshtaghian, A.; Malekzadeh, R.; Azarpanah, A. Heavy oil discovery in Iran. In Proceedings of the 4th UNITAR/UNDP International Conference on Heavy Crude and Tar Sands, Edmonton, AB, Canada, 7–12 August 1988; pp. 235–243. [Google Scholar]
- Tunini, L.; Jimenez-Munt, I.; Fernandez, M.; Verges, J.; Villasenor, A. Lithospheric mantle heterogeneities beneath the Zagros Mountains and the Iranian Plateau: A petrological-geophysical study. Geophys. J. Int. 2015, 200, 596–614. [Google Scholar] [CrossRef]
- Kamali, M.R.; Rezaee, M.R. Burial history reconstruction and thermal modeling at Kuh-e-Mond, SW Iran. J. Pet. Geol. 2003, 26, 451–464. [Google Scholar] [CrossRef]
- James, G.A.; Wynd, J.G. Stratigraphic nomenclature of Iranian Oil Consortium Agreement Area. AAPG Bull. 1965, 49, 2182–2245. [Google Scholar]
- Kouznetsov, O.L.; Faizulline, I.S.; Chirkine, I.A.; Meltchouk, B.Y.; Khisamov, R.S.; Slenkin, S.I.; Kashirin, G.V. Applying scattered seismic waves to study 3-D distribution of fracturing in geomedium (SVSL method). In Proceedings of the Iranian 11th Oil, Gas and Petrochemical Congress, Tehran, Iran, 11 June 2001. [Google Scholar]
- Daneshy, A.A.; Slusher, G.L.; Chisholm, P.T.; Magee, D.A. In situ stress measurements during drilling. JPT 1986, 38, 891–898. [Google Scholar] [CrossRef]
- Prensky, S.E. Advances in borehole imaging technology and applications. In Borehole Imaging: Applications and Case Histories; Lovell, M.A., Williamson, G., Harvey, P.K., Eds.; The Geological Society of London, Special Publications: London, UK, 1999; Volume 159, pp. 1–43. [Google Scholar]
- Hubbert, M.K.; Willis, D.G. Mechanics of hydraulic fracturing. Trans. AIME 1957, 210, 153–166. [Google Scholar]
- Bredehoeft, J.; Wolff, R.; Keys, W.; Shuter, E. Hydraulic fracturing to determine the regional in situ stress field, Piceance Basin, Colorado. GSA Bull. 1976, 87, 250–258. [Google Scholar] [CrossRef]
- Sheory, P.R. A theory for in situ stresses in isotropic and transversely isotropic rock. Int. J. Rock Mech. Min. Sci. Geomech. Abstr. 1994, 31, 23–34. [Google Scholar] [CrossRef]
- Becker, A.; Blümling, P.; Müller, W.H. Recent stress field and neotectonics in the Eastern Jura Mountains, Switzerland. Tectonophysics 1987, 135, 277–288. [Google Scholar] [CrossRef]
- Adams, J. Stress-relief buckles in McFarland Quarry, Ottawa. Can. J. Earth Sci. 1982, 19, 1883–1887. [Google Scholar] [CrossRef]
- Wallach, J.; Benn, K.; Rimando, R. Recent, tectonically induced, surficial stress-relief structures in the Ottawa-Hull area, Canada. Can. J. Earth Sci. 1995, 32, 325–333. [Google Scholar] [CrossRef]
- Engelder, T. Stress Regimes in the Lithosphere; Princeton University Press: Princeton, NJ, USA, 1993. [Google Scholar]
- Zarifi, Z.; Nilfouroushan, F.; Raeesi, M. Crustal stress map of Iran: Insight from seismic and geodetic computations. Pure Appl. Geophys. 2014, 171, 1219–1236. [Google Scholar] [CrossRef]
- Berbrian, M.; King, G.C.P. Towards a paleogeography and tectonic evolution of Iran. Can. J. Earth Sci. 1981, 18, 210–265. [Google Scholar] [CrossRef]
- Al-Laboun, A.A. Stratigraphy and hydrocarbon potential of the Paleozoic succession in both the Tabuk and Widyan basins, Arabia. In Future Petroleum Provinces of the World; Halbouty, M.T., Ed.; AAPG Memoir: Tulsa, OK, USA, 1986; Volume 40, pp. 373–397. [Google Scholar]
- Alsharhan, A.S.; Nairn, A.E.M. Sedimentary Basins and Petroleum Geology of the Middle East; Elsevier Science: New York, NY, USA, 1997; p. 878. ISBN 978-0-44-482465-3. [Google Scholar]
- Al-Husseini, M.I. Origin of the Arabian plate structures: Amar collision and Najd rift. GeoArabia 2000, 5, 527–542. [Google Scholar]
- Alavi, M. Regional stratigraphy of the Zagros fold-thrust belt of Iran and its proforeland evolution. Am. J. Sci. 2004, 304, 1–20. [Google Scholar] [CrossRef]
- Aubourg, C.; Smith, B.; Eshraghi, A.; Lacombe, O.; Authemayou, C.; Amrouch, K.; Bellier, O.; Mouthereau, F. New magnetic fabric data and their comparison with palaeostress Markers. In The Western Fars Arc (Zagros, Iran.): Tectonic Implications; The Geological Society of London, Special Publications: London, UK, 2010; Volume 330, pp. 97–120. [Google Scholar]
- Shariatinia, Z.; Haghighi, M.; Feiznia, S.; Alizai, A.H.; Levresse, G. Hydrocarbon migration in the Zagros Basin, offshore Iran, for understanding the fluid flow in the Oligocene–Miocene carbonate reservoirs. Russ. Geol. Geophs. 2013, 54, 64–81. [Google Scholar] [CrossRef]
- Heidbach, O.; Tingay, M.; Barth, A.; Reinecker, J.; Kurfeß, D.; Müller, B. The World Stress Map Database Release. 2008. Available online: http://dc-app3-14.gfz-potsdam.de/pub/poster/World_Stress_Map_Release_2008.pdf (accessed on 8 December 2017).
- Colman-Saad, S.P. Fold development in Zagros simply folded belt, southwest Iran. AAPG Bull. 1978, 62, 984–1003. [Google Scholar]
- Ge, S.; Garven, G. Hydromechanical modeling of tectonically driven groundwater flow with application to the Arkoma Foreland basin. J. Geophys. 1992, 97, 9119–9144. [Google Scholar] [CrossRef]
- Hansom, J.; Lee, M. Effects of hydrocarbon generation, basal heat flow and sediment compaction on overpressure development: A numerical study. Pet. Geosci. 2005, 11, 353–360. [Google Scholar] [CrossRef]
- Vaziri-Moghaddam, H.; Seyrafian, A.; Taheri, A.; Motiei, H. Oligocene-Miocene ramp system (Asmari Formation) in the NW of the Zagros basin, Iran: Microfacies, paleoenvironment and depositional sequence. Rev. Mex. Cienc. Geol. 2010, 27, 56–71. [Google Scholar]
Figure 1.
Kuh-e-Mond field in SW of Iran along the coast of Persian Gulf.

Figure 2.
Geological cross section along the line X-X (See Figure 1). The X-X line is also parallel with the axis of the Kuh-e-Mond anticlinal structure. The location of wells especially wells MD-1 to MD-8 is presented here. Drilling of MD-8 which is the last appraisal well drilled in the field is benefited from the studies reported in this paper over the past decade. In addition, the cores and the image logs all belong to MD-8.

Figure 3.
A general structural map of the main tectonic units of the Zagros Mountains from [32].
Figure 3.
A general structural map of the main tectonic units of the Zagros Mountains from [32].
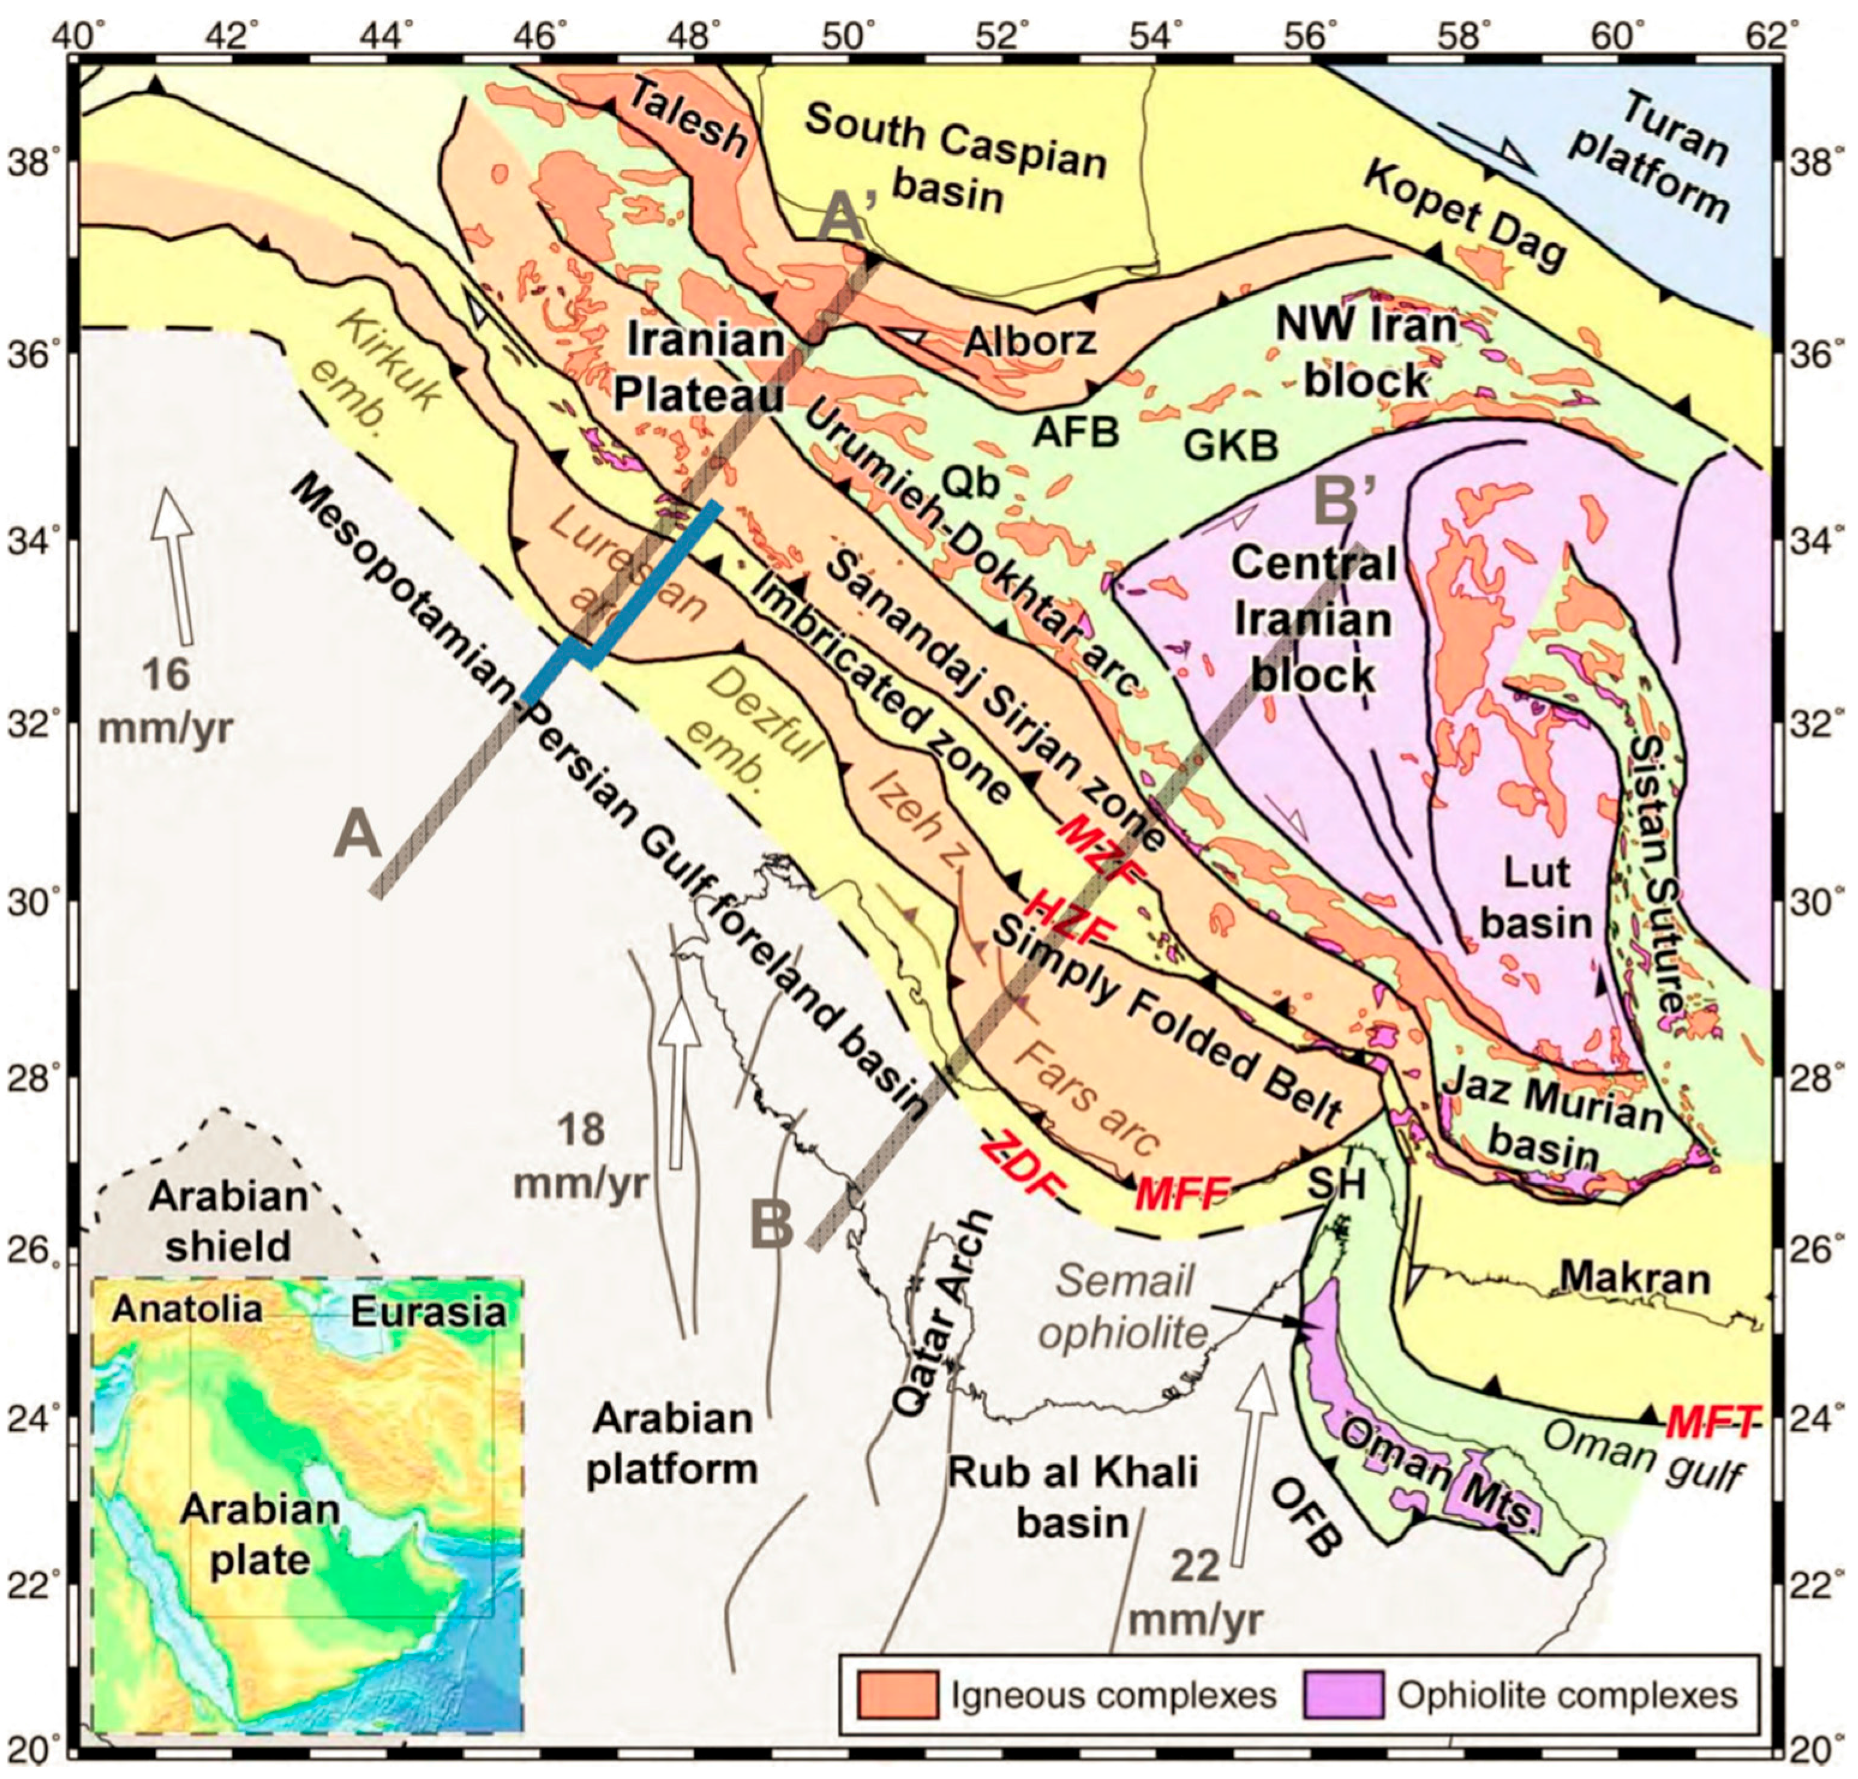
Figure 4.
Lithostratigraphic column of the Coastal Fars (Right side of the column where the Sarvak, Jahrum and Asmari formations can be identified) region where the Kuh-e-Mond heavy oil field is located (From [33] after [34]).
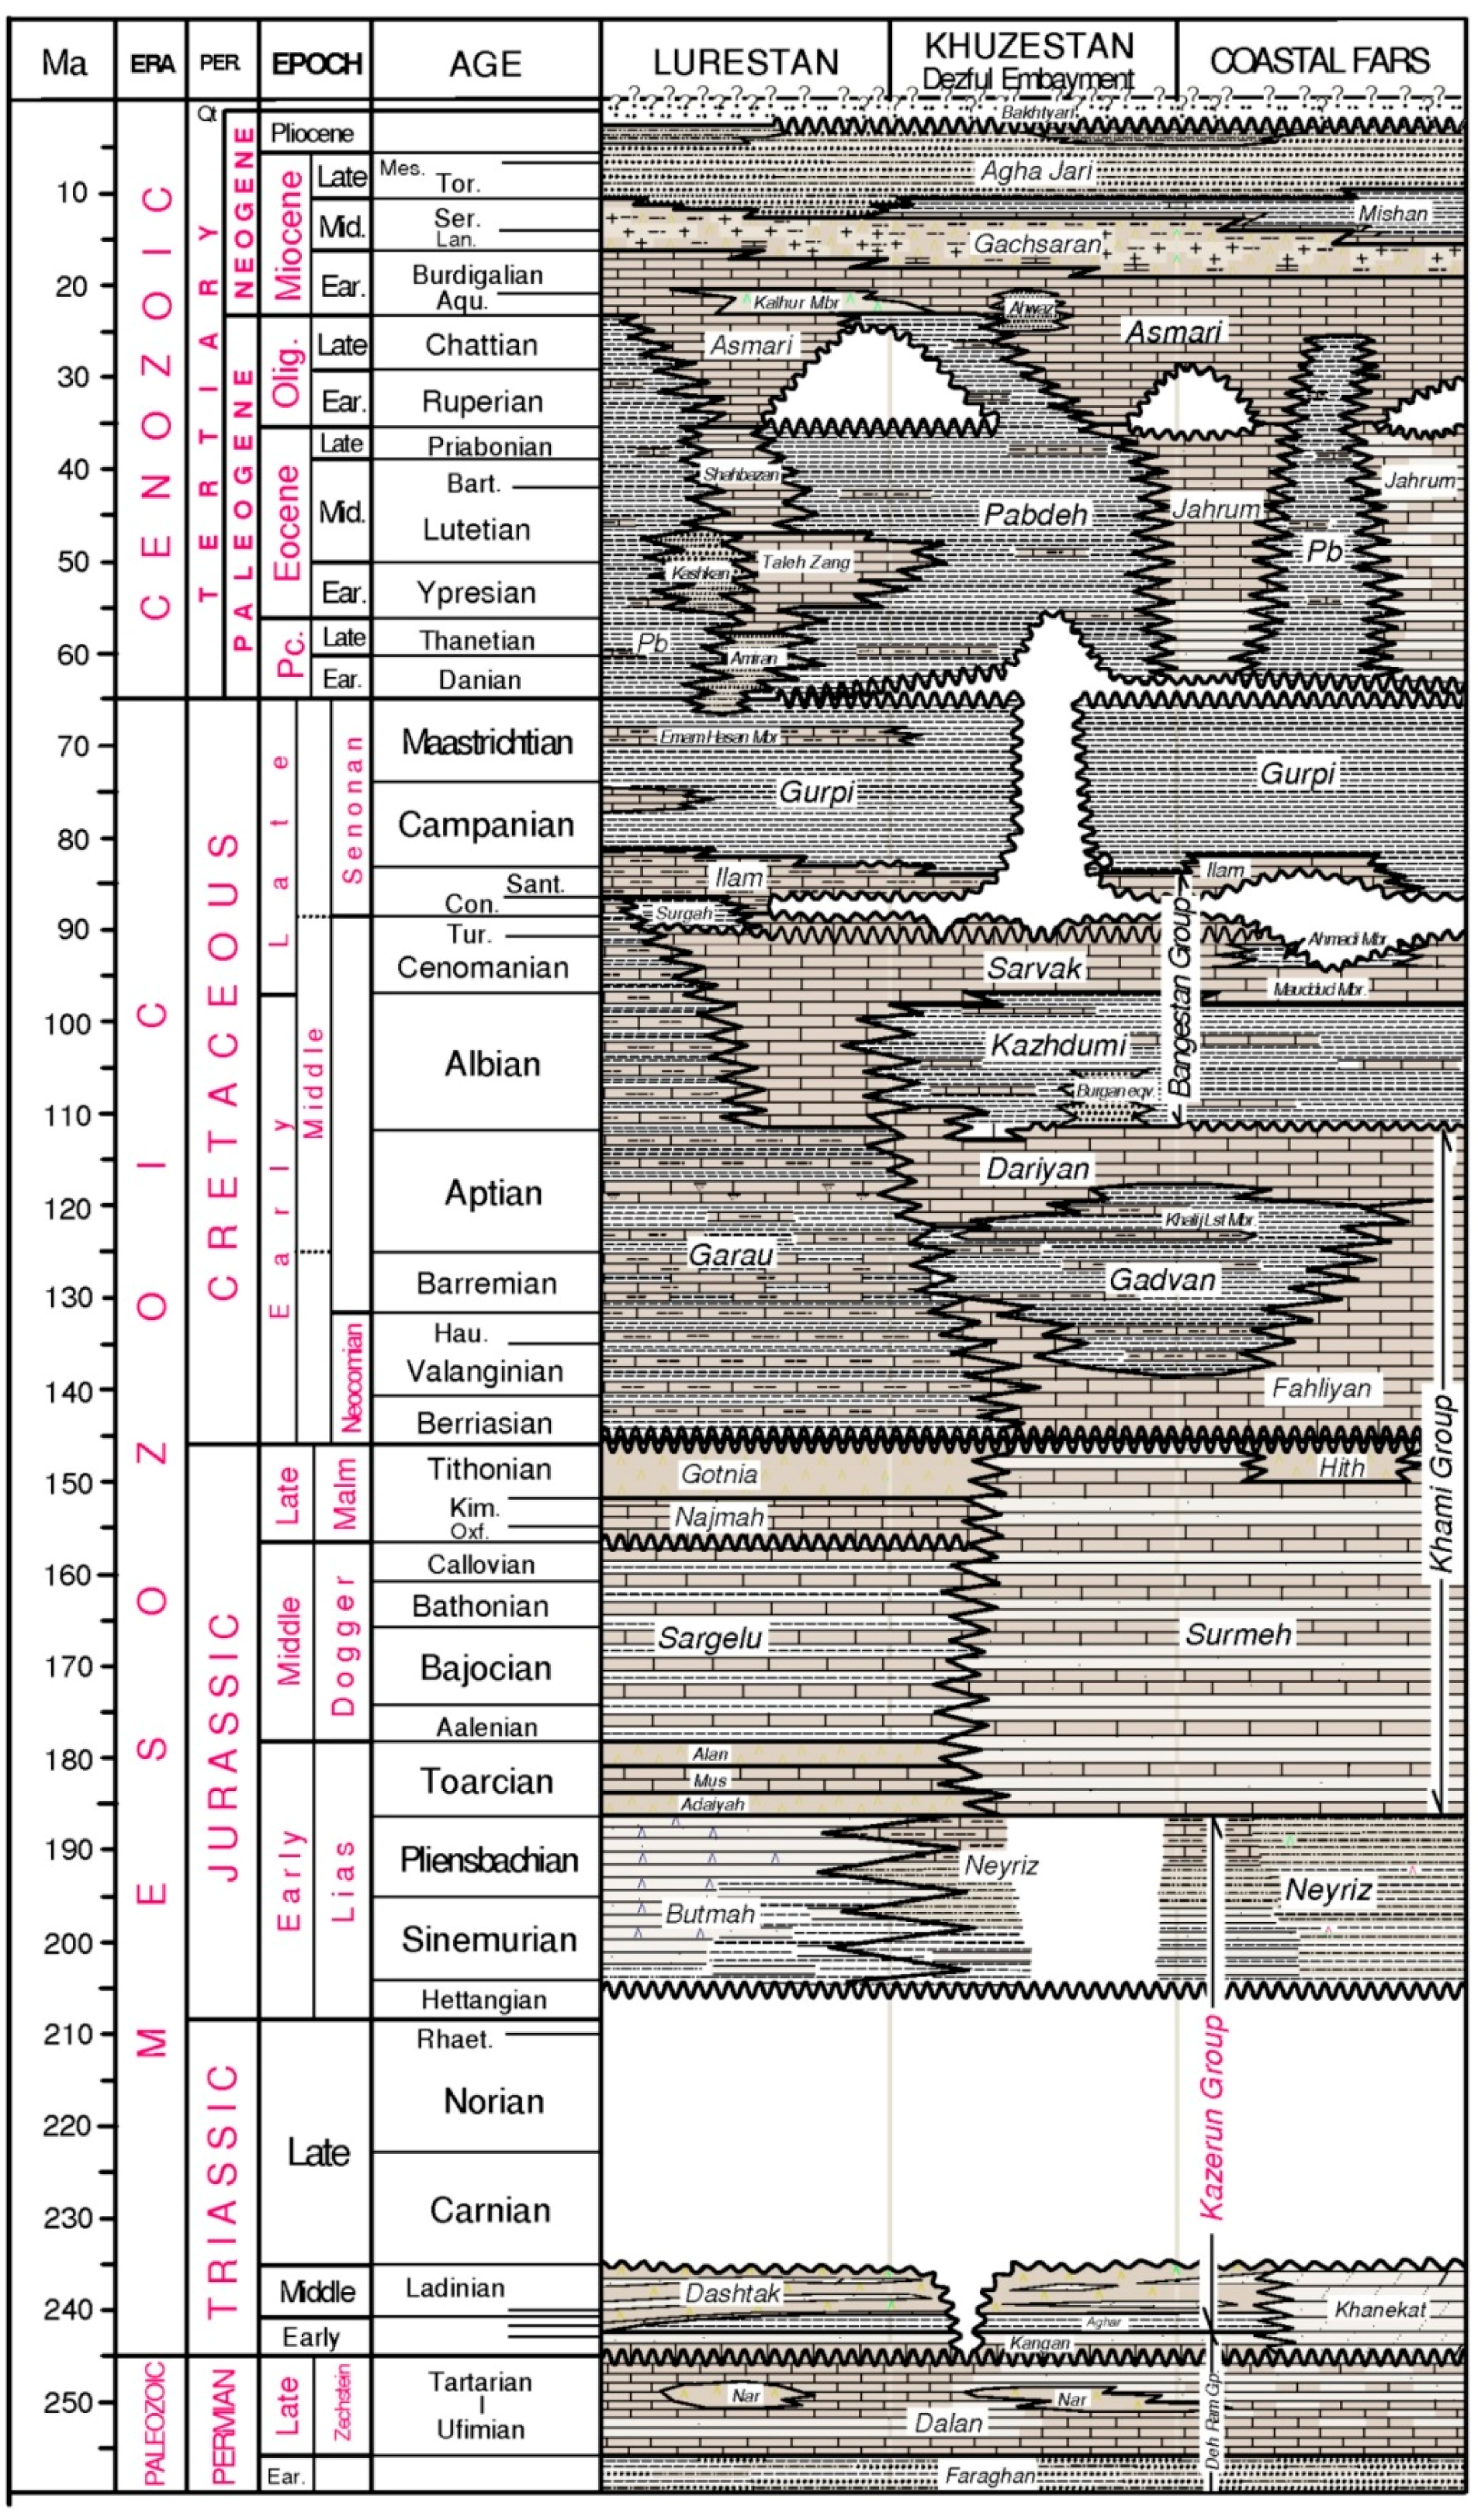
Figure 5.
Sub-vertical fractures and vugs some infilled with heavy oil in core samples taken from the Kuh-e-Mond heavy oil field.
Figure 5.
Sub-vertical fractures and vugs some infilled with heavy oil in core samples taken from the Kuh-e-Mond heavy oil field.

Figure 6.
Side View Seismic Location technique (SVSL) (From [35]).
Figure 6.
Side View Seismic Location technique (SVSL) (From [35]).

Figure 7.
The SVSL results for the study area. (a) The seismic sections are averaged over horizontal planes of the source cube; (b) The seismic sections are averaged over lateral surfaces; (c) presents a difference of these two matrices: a–b. Distribution of the fractures has changed insignificantly, an indication of the fact that the tectonic factors (highly various fracturing intensity and fractured zones locations) are the major reason behind random distribution of fractures. A major fracture system was formed during formation of the anticlinal fold which is characterized by a V-shaped complex of linear zones orthogonal to the fold flanks and a local anomaly in the fold arch.
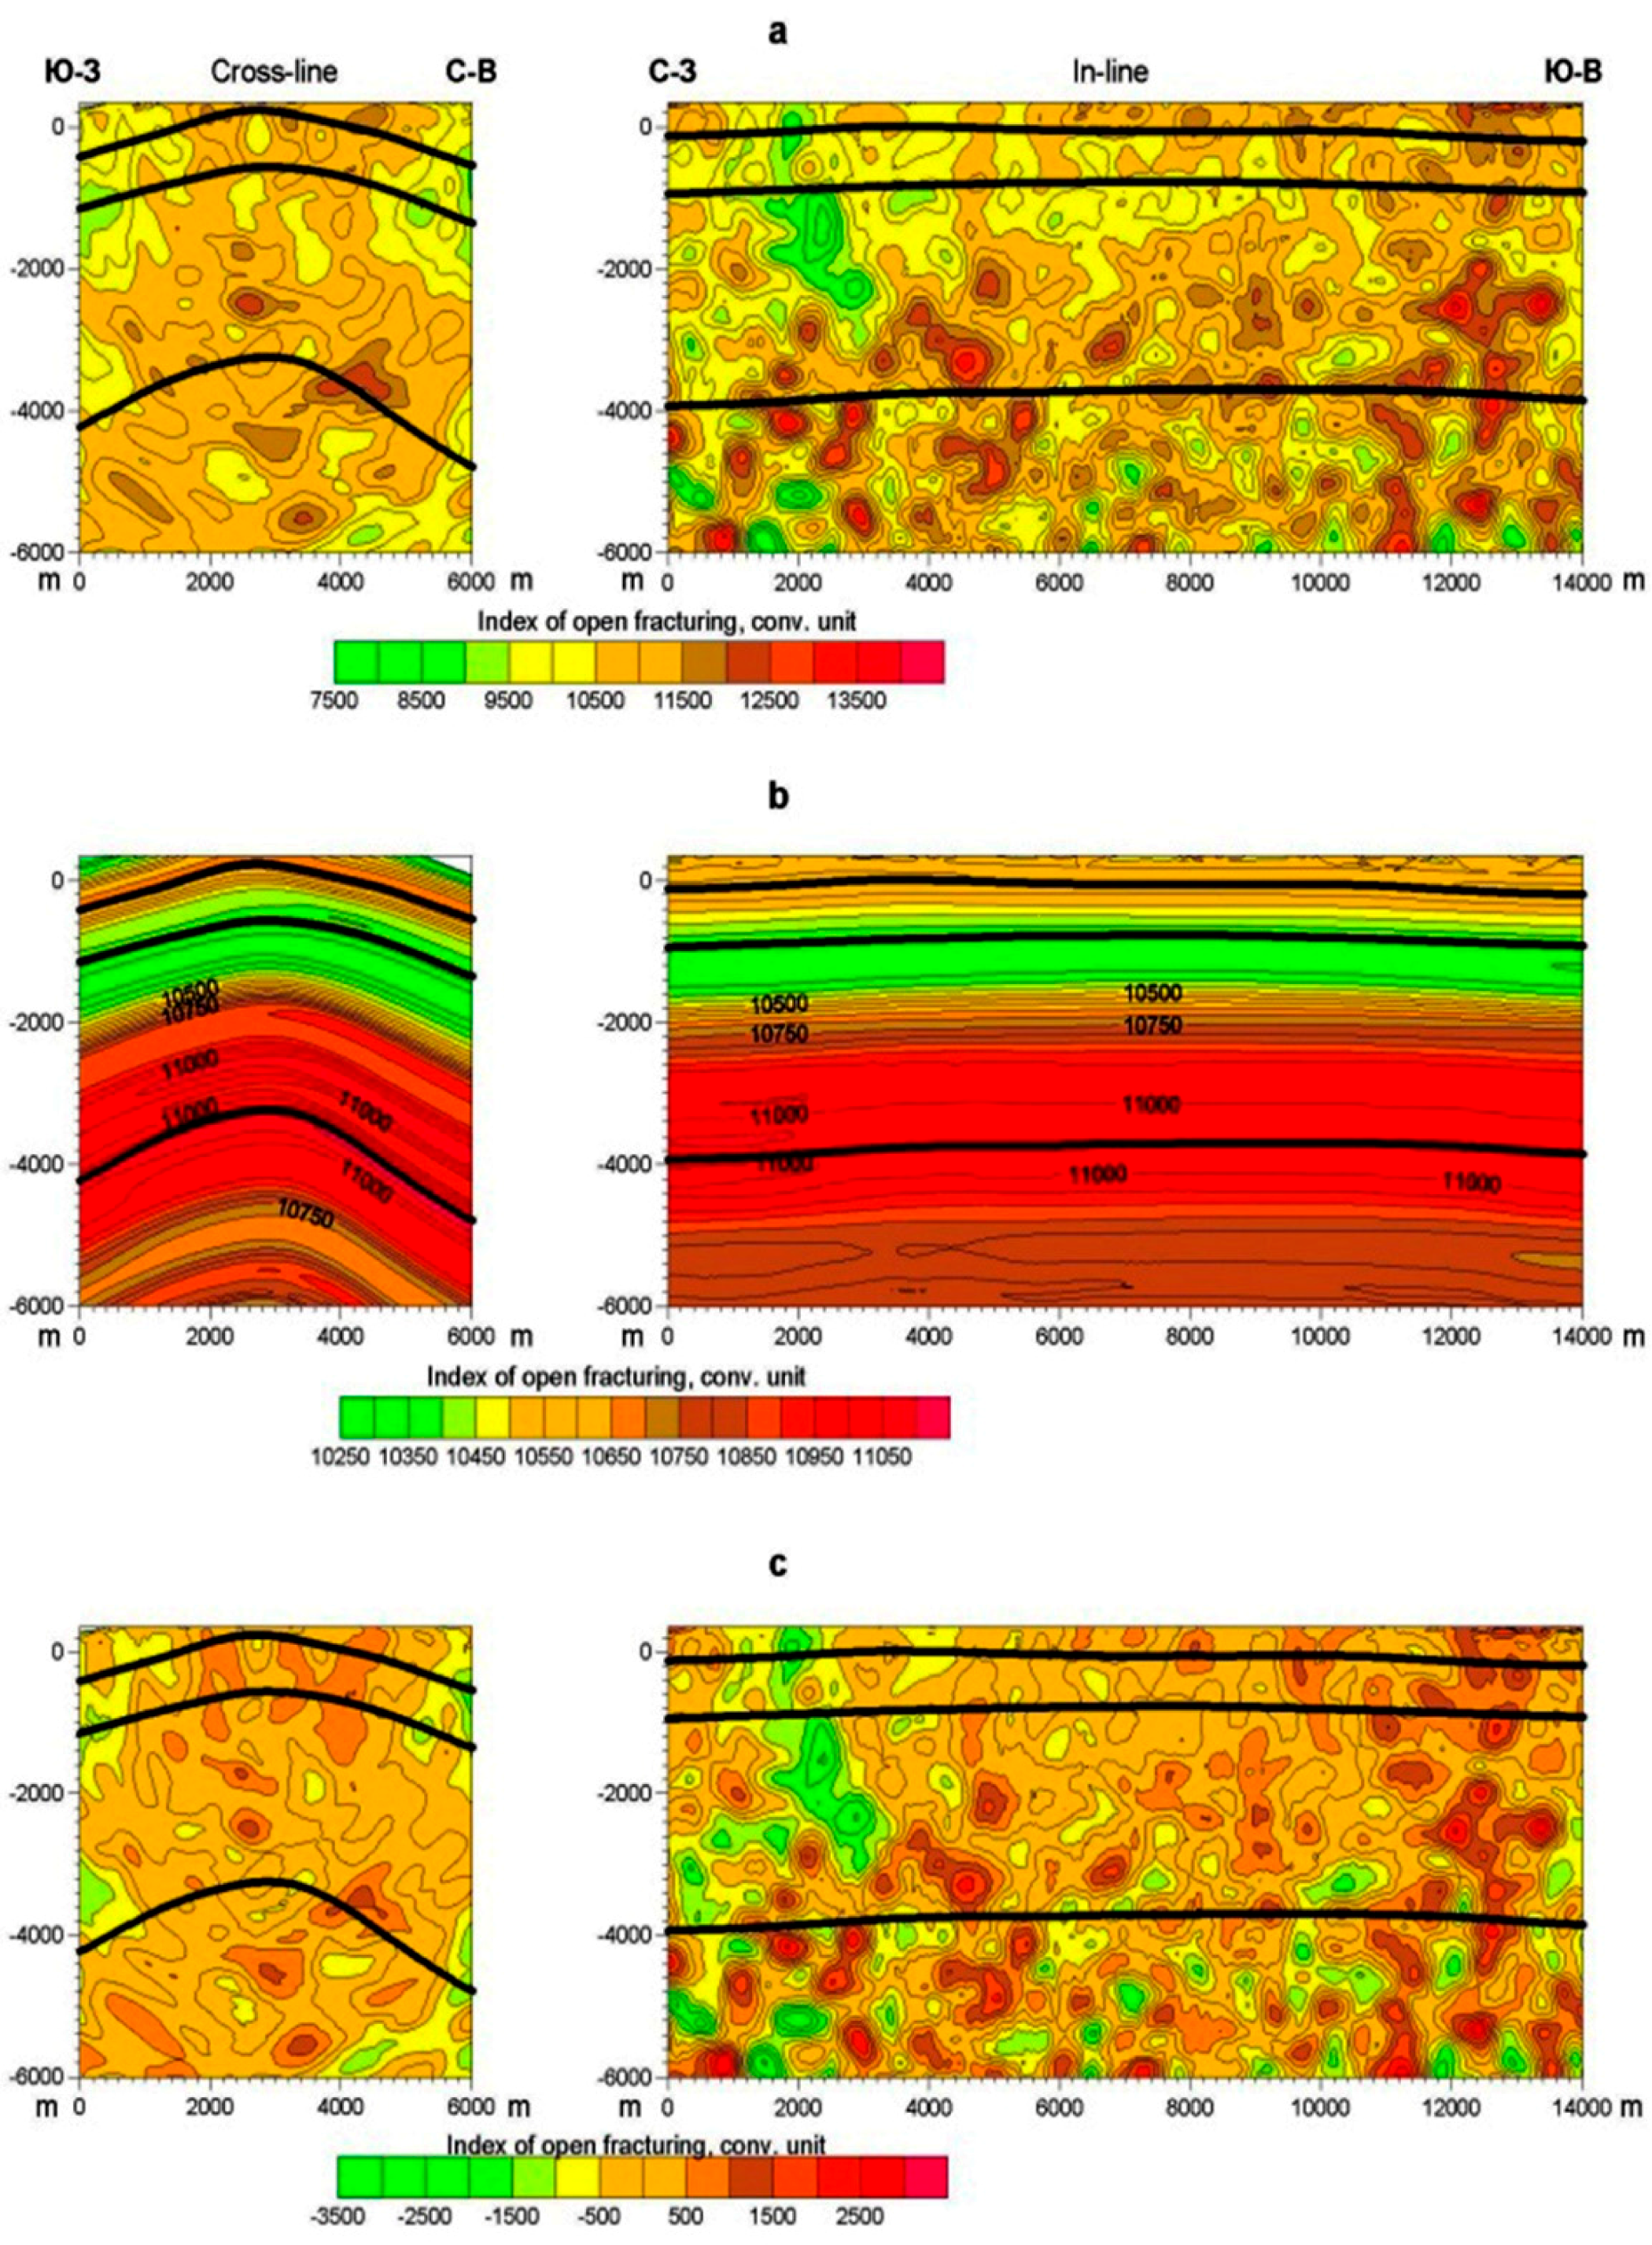
Figure 8.
Variation of the mean value (a) and relative variance (b) of fracturing intensity within horizontal (1) and lateral slices (2) in the study area.
Figure 8.
Variation of the mean value (a) and relative variance (b) of fracturing intensity within horizontal (1) and lateral slices (2) in the study area.

Figure 9.
Summary plot of the features identified and picked out from FMI and UBI images in the Well MD-8 at depth 1200 m–1300 m.
Figure 9.
Summary plot of the features identified and picked out from FMI and UBI images in the Well MD-8 at depth 1200 m–1300 m.
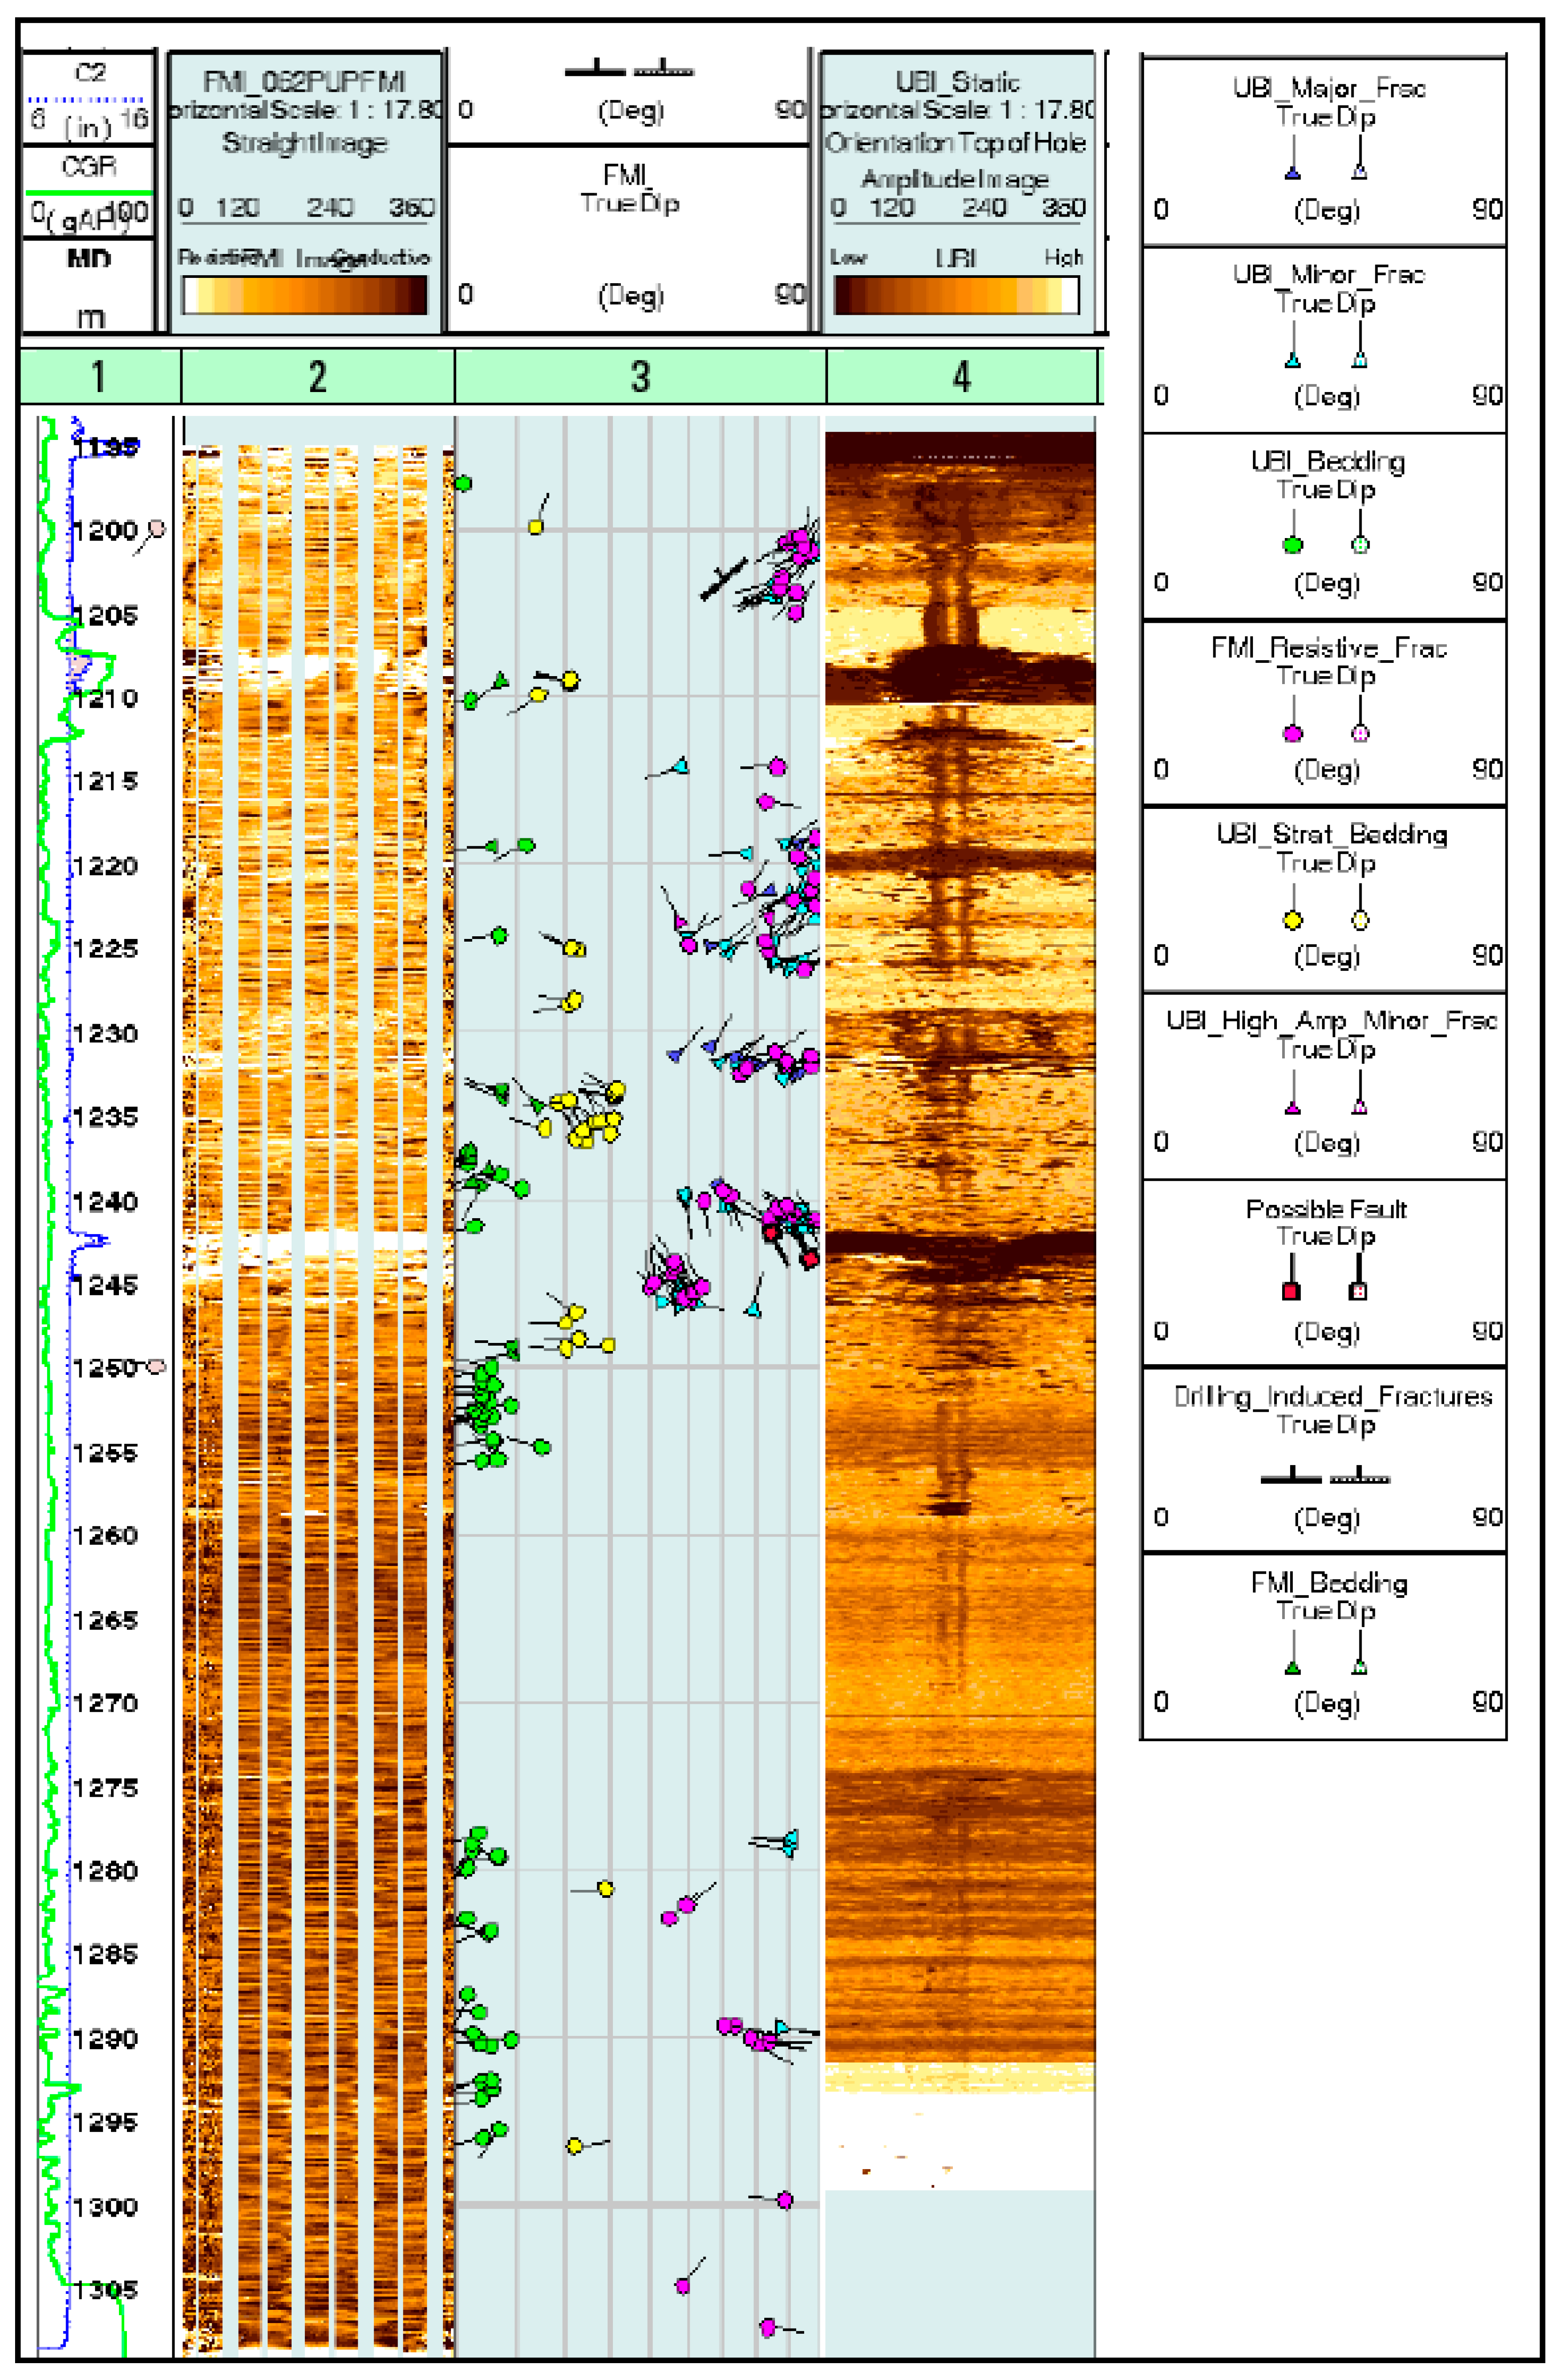
Figure 10.
Resistive fractures on the FMI image and minor open fractures on a UBI image.

Figure 11.
Two highly fractured zones in Sarvak I interval on UBI logs.

Figure 12.
Statistical plots of FMI and UBI bedding dips identified and picked up from the FMI and UBI images acquired across 1194.2–1310 m interval of the Well MD-8.
Figure 12.
Statistical plots of FMI and UBI bedding dips identified and picked up from the FMI and UBI images acquired across 1194.2–1310 m interval of the Well MD-8.

Figure 13.
Rose diagram of trends of natural fractures measured in image logs (a); Rose diagram of trends of natural fractures from core analysis (b).
Figure 13.
Rose diagram of trends of natural fractures measured in image logs (a); Rose diagram of trends of natural fractures from core analysis (b).
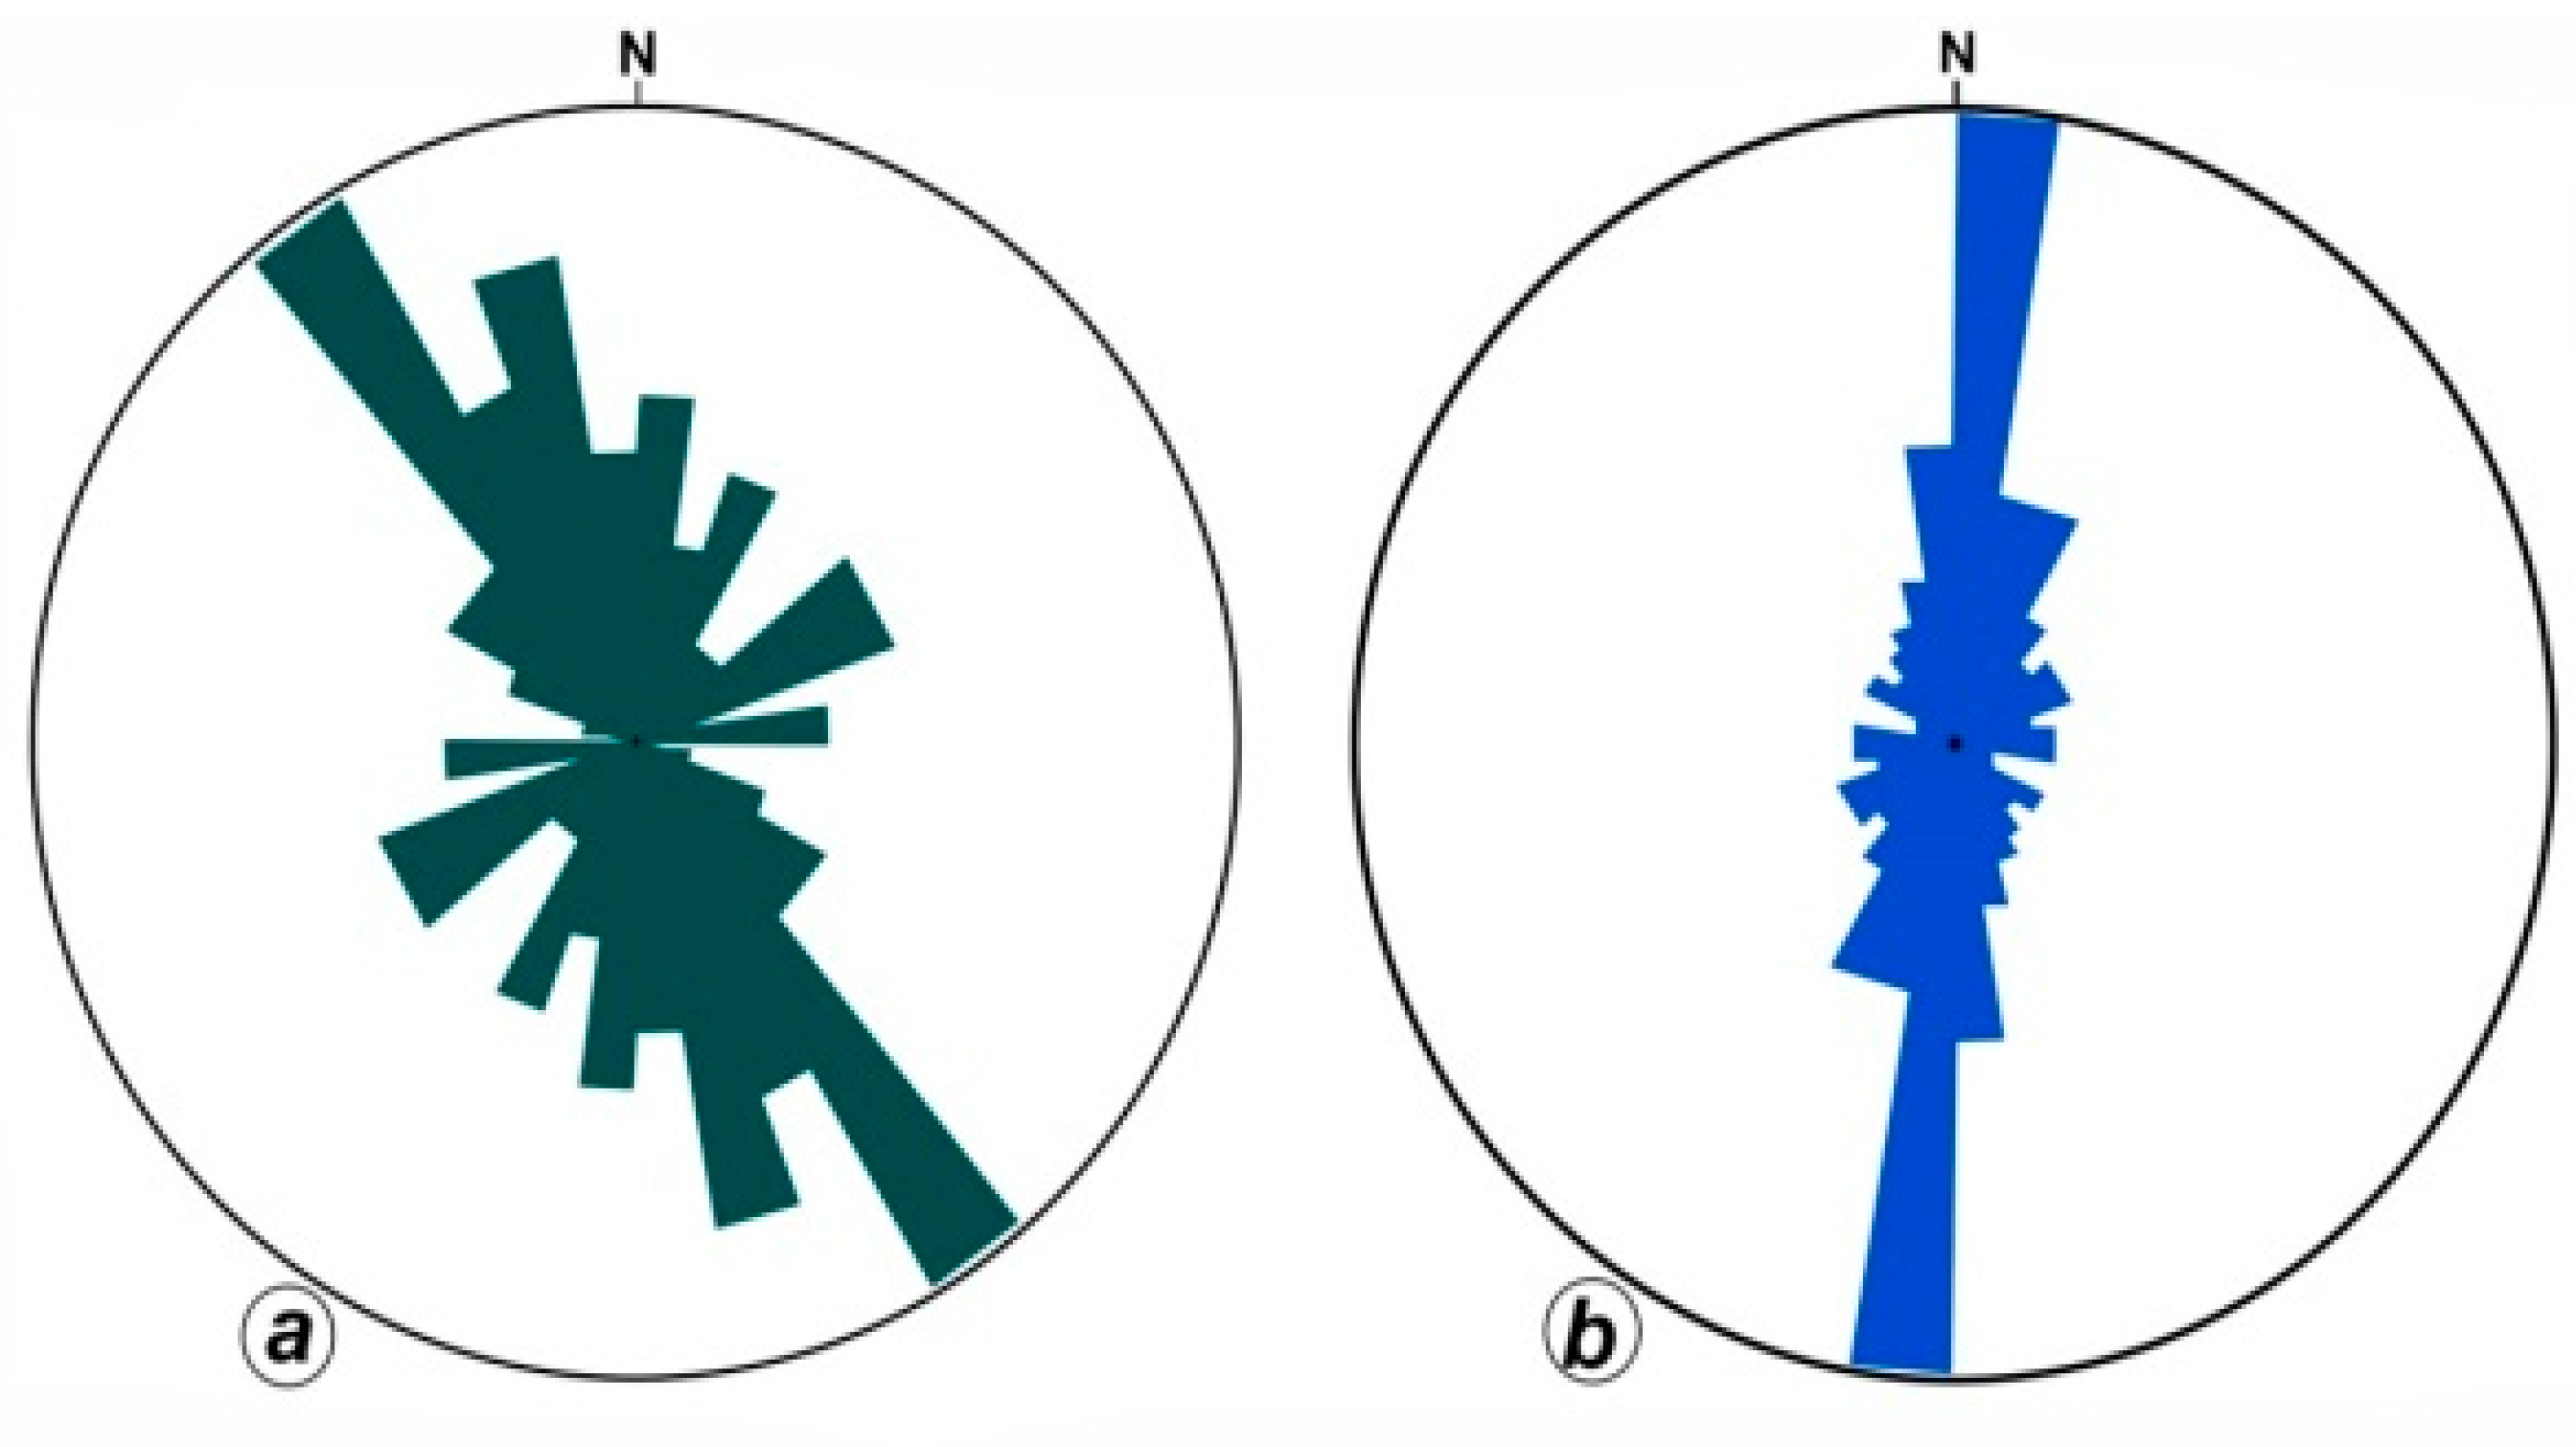
Figure 14.
Direction of maximum principal earth stresses (Red arrows) and strain rates from seismic (Black arrows) and geodetic (Purple arrows) data in the Iranian plateau (Modified from [45]).
Figure 14.
Direction of maximum principal earth stresses (Red arrows) and strain rates from seismic (Black arrows) and geodetic (Purple arrows) data in the Iranian plateau (Modified from [45]).

Figure 15.
World Stress Map generated for the study area to infer the orientation of the in situ stress field (Courtesy of the World Stress Map Project) [53].
Figure 15.
World Stress Map generated for the study area to infer the orientation of the in situ stress field (Courtesy of the World Stress Map Project) [53].
© 2018 by the authors. Licensee MDPI, Basel, Switzerland. This article is an open access article distributed under the terms and conditions of the Creative Commons Attribution (CC BY) license (http://creativecommons.org/licenses/by/4.0/).
Share and Cite
MDPI and ACS Style
Shafiei, A.; B. Dusseault, M.; Kosari, E.; N. Taleghani, M. Natural Fractures Characterization and In Situ Stresses Inference in a Carbonate Reservoir—An Integrated Approach. Energies 2018, 11, 312. https://doi.org/10.3390/en11020312
AMA Style
Shafiei A, B. Dusseault M, Kosari E, N. Taleghani M. Natural Fractures Characterization and In Situ Stresses Inference in a Carbonate Reservoir—An Integrated Approach. Energies. 2018; 11(2):312. https://doi.org/10.3390/en11020312
Chicago/Turabian StyleShafiei, Ali, Maurice B. Dusseault, Ehsan Kosari, and Morteza N. Taleghani. 2018. "Natural Fractures Characterization and In Situ Stresses Inference in a Carbonate Reservoir—An Integrated Approach" Energies 11, no. 2: 312. https://doi.org/10.3390/en11020312
Note that from the first issue of 2016, this journal uses article numbers instead of page numbers. See further details here.