PWM Carrier Displacement in Multi-N-Phase Drives: An Additional Degree of Freedom to Reduce the DC-Link Stress


Dipartimento Energia, Politecnico di Torino, 10129 Torino, Italy
*
Author to whom correspondence should be addressed.
†
These authors contributed equally to this work.
Energies 2018, 11(2), 443; https://doi.org/10.3390/en11020443
Submission received: 18 November 2017
/
Revised: 6 February 2018
/
Accepted: 11 February 2018
/
Published: 16 February 2018
(This article belongs to the Special Issue Emerging Power Electronics Technologies for Power Systems and Machine Drives)
Abstract
:The paper presents a particular Pulse Width Modulation (PWM) strategy to reduce the (Direct Current) DC-link capacitor stress for multi-n-phase drives. A multi-n-phase drive is composed of multiple independent systems of n inverter supplying a multi-n-phase electric machine. The paper focused on the investigation of the best phase shifting between carriers for a triple-3-phase drive compared to the 3-phase counterpart in order to reduce the capacitor bench design point. Simulation and experimental results show as the control technique proposed is able to reduce the value of the DC-link capacitor current in any operating condition including fault case. In this sense, the PWM carrier displacement appears like an additional degree of freedom that can be exploited in multi-n-phase drives but also in multi-motor application.
1. Introduction
In the automotive field, the reasons to search for integrated motor drive solutions are the same that pushed, some years ago, at looking for integrated plug and play solutions in the industrial environment [1]. Integrated solutions of electric machines and power electronics could bring strong benefits: to reduce (or eliminate) the cable length between motor and inverter with advantages in terms of overvoltages on the motor side [2], to help to mitigate Electromagnetic Compatibility (EMC) and Electromagnetic Interference (EMI) problems, to obtain a better International Protection Rating (IP), to realize a shared cooling system, and more integrated solutions lead to a strong reduction in the required space for the whole traction drive.
A particular drive that allows for obtaining more insightful integrated solutions is the multi-phase one [3]. In fact, in multi-phase structures, it is possible to realize a converter as a combination of standard modules with an equal subdivision of the current. The resulting power electronics modules meet the needs of an integrated solution: smaller and widely distributed.
Although road electric vehicles primarily adopt three-phase drives, the multi-phase version could represent a good alternative not only for its integration capability but also for other features like reduced weight and volume, high efficiency, low vibrations and noise, robustness and, overall, fault tolerance [4,5,6].
Advantages of multi-phase motors have been well evidenced in the past [7,8,9], especially for the application in which the machine current is very large [10,11]. The interest for multi-phase drives in the traction field has grown in recent years too [4,5,12,13]. One of the forms of multi-phase drives is the multi-n-phase, which is based on an electric machine constituted by multiple n-phase insulated stars [8].
The benefits offered by the power modules size reduction in the multi-n-phase machine has a cost: the converter structure becomes more complex. This intrinsic complexity can anyway be efficiently used to obtain further advantages. In a generic multi-phase machine, overall performance can be improved introducing additional degrees of freedom addressed as well in [7,14]. Improvements like torque enhancement and design for fault tolerant strategies can be obtained but cannot be exploited simultaneously.
The purpose of the paper is to investigate and test the benefits introduced from an additional degree of freedom (DoF) for the multi-n-phase electrical drives that does not preclude fault tolerance capability.
Multi-n-phase drives, in fact, offer the chance to use PWM carriers’ phase displacement for the different converters to reduce the DC-link RMS (Root Mean Square) current [15]. In particular, the possibility to reduce the size of the DC-link capacitor bench adopting a multi-n-phase drive has been presented in [15], as a general approach and in [16] for a six-phase structure. In addition, the phase displacement between carriers has been introduced in the past in order to reduce the harmonic distortion and power losses [17,18] in six-phase drives or to improve the quality of the line-to-line output voltages in interleaved Voltage-Source Inverters [19].
This paper suggests a simple PWM technique for triple-3-phase drives and offers a detailed analysis of the effects, on the converter side, of the proposed PWM technique extending the work of [15]—all of this in order to reach conscious guidelines to define the DC-link design conditions.
The paper firstly gives a presentation of the main rules for the peculiar multi-n-phase motor structure adopted. In particular, a multi-3-phase drive and its 3-phase counterpart are presented with an overview on the differences between the two solutions. The PWM strategy and the related reduction of the DC-link stresses through the PWM carriers phase displacement is presented and simulation results are collected. The limitation of the DC-link rms current offered by the PWM phase shifting is studied throughout all the possible operating points also considering the fault conditions. The proposed simulation methodology is validated through two different test bench setups with the aim to offer guidance for the uses that we are aware of for the proposed control strategy and then for the correct design of the DC-link capacitor.
2. Drive Solutions
As multi-n-phase or multi-star drive, the multi-3-phase one is chosen. This extension of 3-phase based drives is very fitting considering the widespread availability of 3-phase converters both in the power and in the control area. A multi-phase converter, in fact, can be generally obtained as the combination of modular systems. The number of adopted modular systems in the final drive depends on the modules availability or by fault tolerant features required. In a multi-star drive, it is possible to increase the fault-tolerant features reducing the number of phases supplied by a single source [20]. The paper focuses on triple-3-phase motor supplied by three 3-phase inverters (9 legs in total).
2.1. The Multi-N-Phase Motor
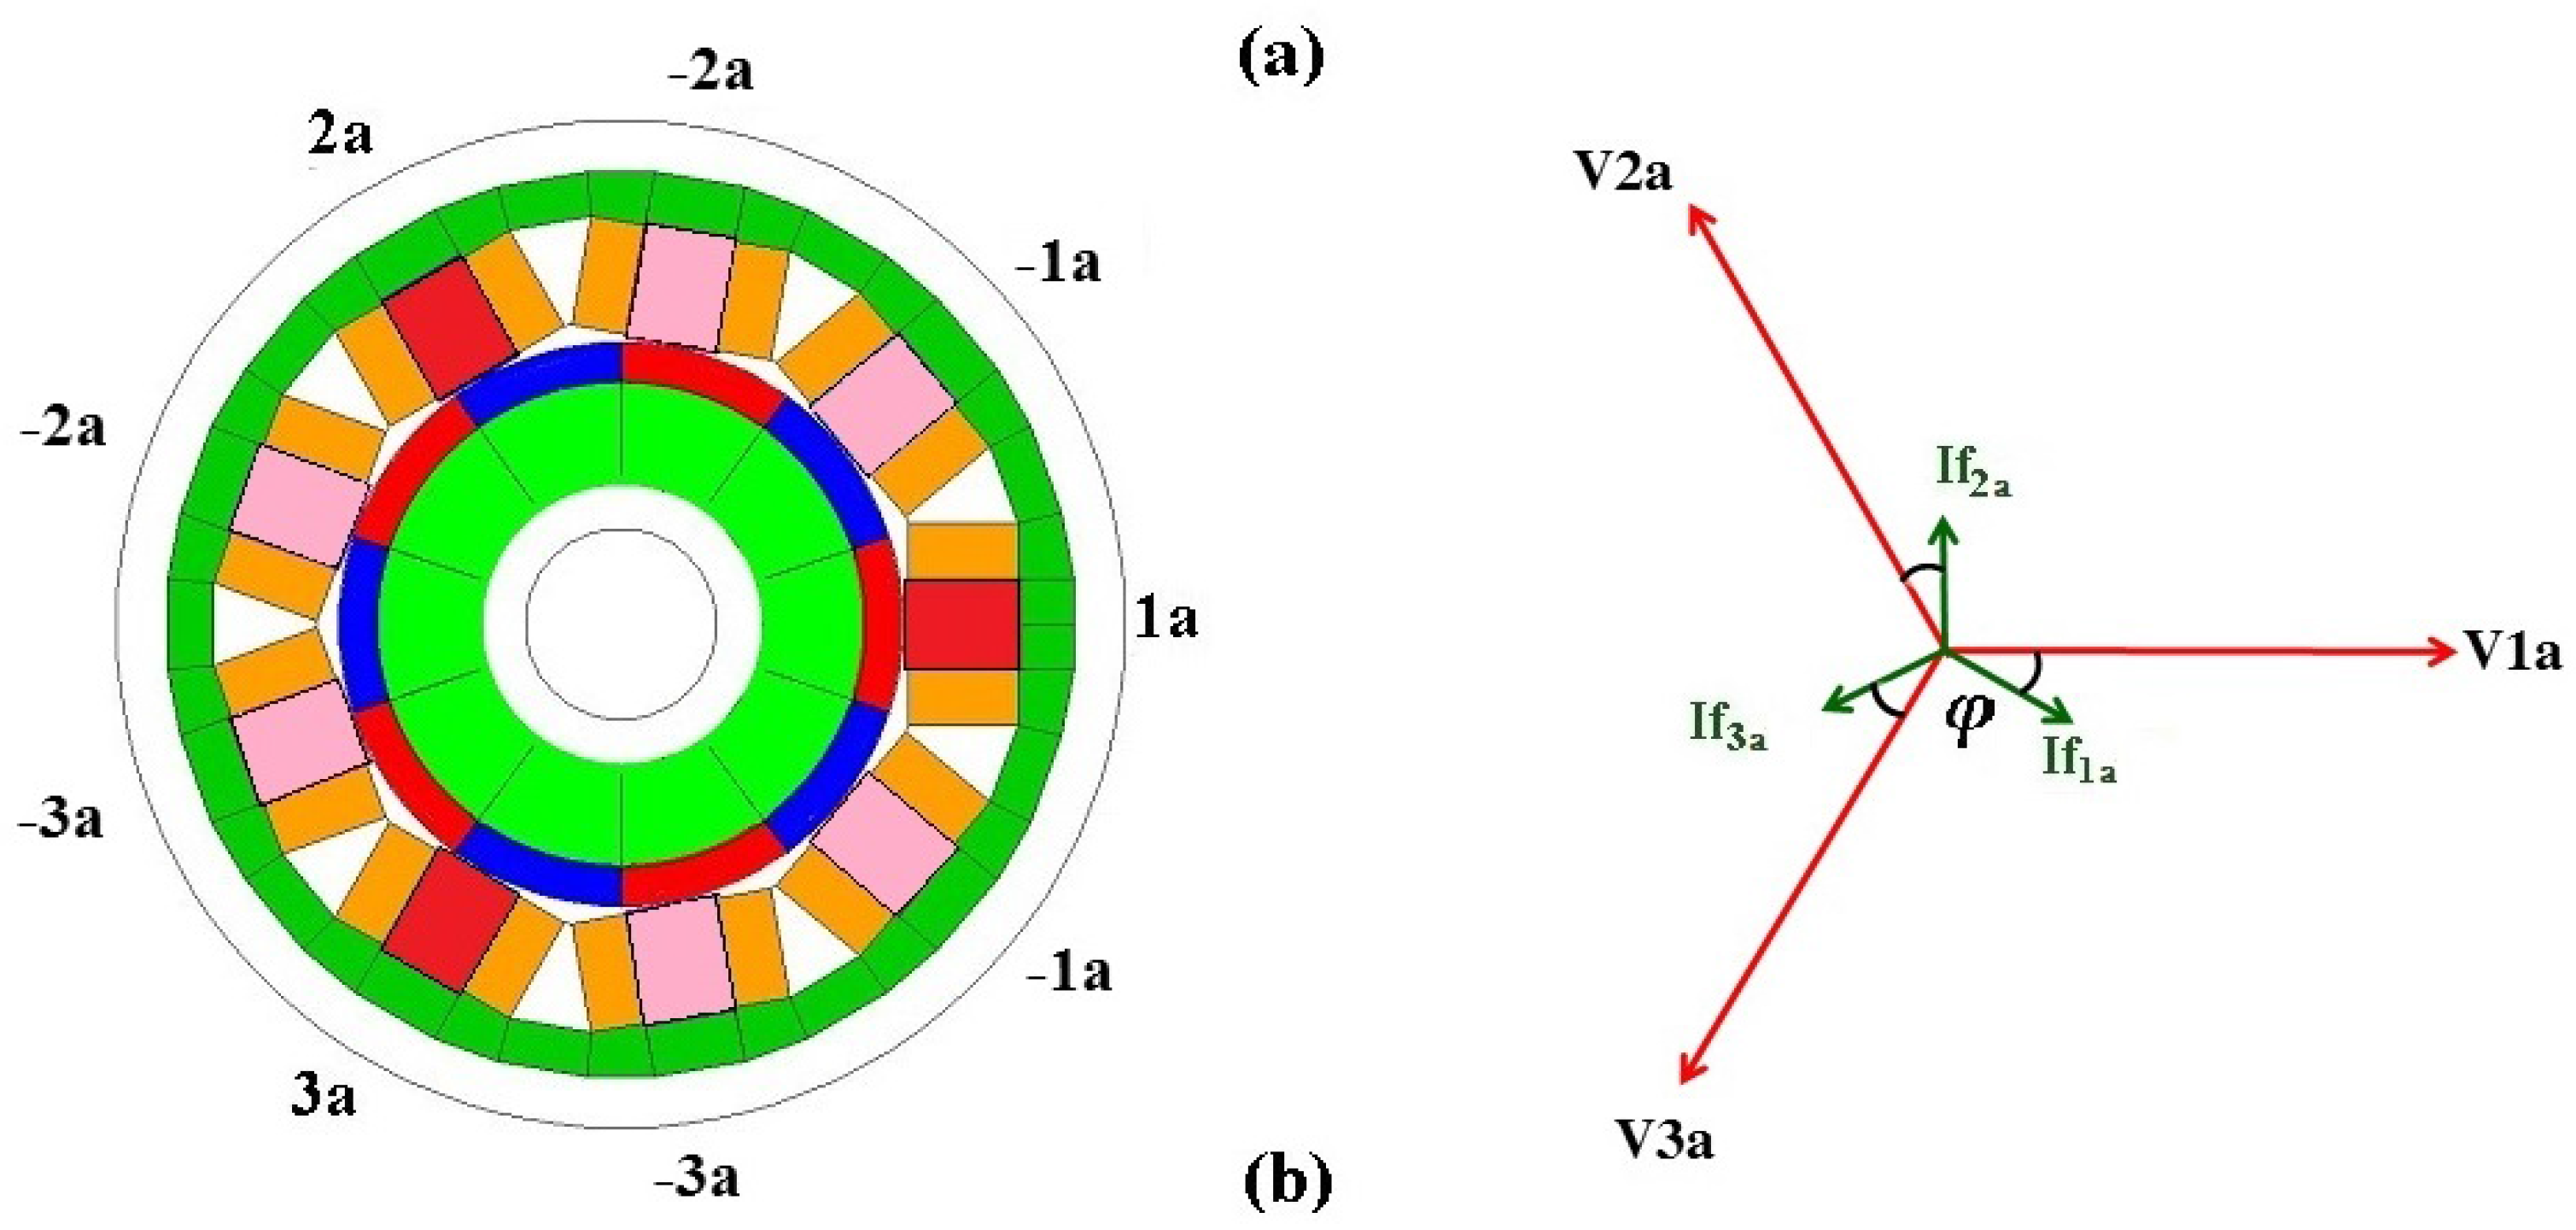
A 10-pole permanent magnet surface mounted (PMSM) machine, 9-coils double layer concentrated windings can been considered. As a base machine, rotor and stator structures are reported in Figure 1a, Figure 2a and Figure 3a. With the same stator and rotor structures, two electric machine are possible:
- as a resulting 3-phase double layer machine, defined by the parameter q (number of slot-per-pole-per-phase) and by the number of permanent magnets (poles),
- 3-3-10-1, meaning three stars of three phases, 10 pole, repeated 1 times, in the multi-n-phase version.
This duality means that, with the stator and rotor structure proposed, it is possible to realize three different motor-converter configurations. Different winding arrangements and matched converters allow for obtaining the following drive solutions:
In order to reduce the mutual coupling between phases belonging to difference stars, a double layer tooth coil open slot stator solution has been chosen. For the specific motor design, finite element analyses have been conducted. The value of the mutual inductance is equal to 1.37 mH, which is about of the self inductance, equal to 10.9 mH. Instead, in a closed slot solution, the value of the mutual inductance is equal to of the self inductance. In [21], the authors demonstrate that such a simple stator structure also allows, anyway, to obtain a very low torque ripple solution.
2.2. The Multi-N-Phase Converter
In case I, a classical 3-phase converter has been chosen. In II and III, a 9-phase converter (one leg for each coil of the base machine) like the one in Figure 4 has been adopted. The whole structure, in this latter case, has been designed as combination of modular parts. Each module is a 3-phase converter constituted by a control board and a power board based on a standard control and modulation technique.
2.3. Differences among Solutions
The solutions proposed in Figure 1a, Figure 2a and Figure 3a present a concentrated winding stator with the same number of poles. The concentrated winding stator introduces performance benefit, like simple construction, reduction of frontal connections and the related Joule losses reduction, and the constant power speed range can be properly increased thanks to the high Magneto Motive Force (MMF) harmonic contribution that affects the stator inductance [22].
The same stator structure produces different values of windings factor in the 3-phase solution (I, II) and in the triple-3-phase one (III). In particular, the solution III in Figure 3 has a greater fundamental winding factor [23,24].
From the slot winding layout in the electrical space, the windings factor for each phase has to be calculated as the ratio between the resulting electromotive force and the number of windings contribution for each phase [9,25,26].
The calculation of the winding factor for the 3-phase solutions (I, II) leads to the well known result of for the machine [24] considering the synchronous harmonic, while the triple-3-phase solution (III) presents a winding factor equal to for each star and then for the whole motor [15,27].
The ratio between the winding factor is equal to , which can be seen as an increase in the torque density of the triple-3-phase solution by 4%, or like an 8% reduction in the copper losses at the same delivered torque. Compared to cases I and II, case III then benefits in the copper losses reduction if the same DC-link voltage is chosen.
The per unit phase ripple current is reduced by a factor near to 3 for cases II and III machines compared to I. As a first approximation, in fact, the same phase voltage means to have three times the wires in each coil with an inductance that grows by a factor of 9. Phase current is reduced by a factor 3, and their ratio presents an advantage of a factor 3 in the per unit phase current ripple (at the same modulation frequency and the same motor voltage). In the end, it is possible to notice that the solution III with respect to the solution I, II allows for obtaining a reduction of the harmonic content of the MMF with benefits in terms of torque ripple [6,21]. Table 1 summarizes, for each case, the values of winding factor (), the harmonic order h of the first torque ripple harmonic () and the per unit phase ripple current (), normalized to the corresponding values of the case I.
In the next section, only solutions I, III will be considered.
3. PWM Control Strategy
What here is defined as PWM control strategy considers using only modular inverters to supply each 3-phase stars in the proposed triple-3-phase motor. The modulation technique used is an extension of the Sine triangle PWM (SPWM) with the common mode injection calculated from the balanced envelopment [28] where different carriers have been used for each inverter. The aim of the proposed paper is to understand what is the best phase shifting between carriers in order to reduce the DC-link rms current in any operating condition for a triple-3-phase drive. The modular structure of the converter offers different choices in how to supply the different machine portions. Then, for the triple-3-phase solution, the 3 coils of the first star are supplied by the first inverter, the second star by another and so on (Figure 4).
The 3 converters have to generate 3 voltage stars as in Figure 3b. The electrical displacement between two sequential stars is defined by electrical degrees [8]:
where:
- :
- Number of Coils that constitute star (considering always one coil per phase, here ),
- :
- Number of Stars (here ),
- :
- Number of Poles (i.e., PM) (here )
For a 3-3-10-1 machine, electrical degree.
The drive control block scheme is reported in Figure 5. Three identical rotor synchronous Direct and Quadrature () current references are generated from a lookup table (LUT), one for each star. For the proposed motor structure, the mutual coupling between phases being negligible, the dq reference currents are equal to each other for each control loop in healthy and fault conditions. In fact, no variation in the control strategies have been considered under fault.
In the proposed control scheme, three different synchronous carriers’ signals have to be used in the PWM control of the three sections. Triangles carried with the rising and falling symmetrical edge have been used in this work.
Different relationships between the carriers signals can be chosen. In this paper, the effects of a specific simple relationship between PWM carriers are discussed: the three carriers have the same mutual phase shift, as shown in Figure 6. In Figure 7, an example of the relationship between carrier has been reported for an angle degrees.
It is worth noticing that the introduction of a displacement between PWM carrier could also positively affect output torque ripple [29]. In this analysis, the authors focused on the effect of the control technique on the converter side.
In the following section, a detailed analysis based on simulations of the effect on the DC-link capacitor bench of the described PWM strategy is proposed.
The results will be compared with the one of the classical 3-phase drives. The reference case is then the case I, i.e., the 3-phase machine supplied by a single inverter with a simple current control in SPWM.
4. Reduction of the DC-Link Rms Current
The DC-link capacitor is one of the key converter components that affects the cost and the dimension of the whole drive [30]. Furthermore, physical shapes of the capacitors themselves could lead to difficult practical solutions, resulting in a large commutation path for the inverter switches with the related over-voltage problems.
DC-link operating voltages, and working temperature strongly influence the DC link capacitor life, and then the whole drive life [31].
DC-link capacitor performs several functions in the converter [31]: to allow for compatible hard switching commutations firstly, to allow for the impulsive inverter currents supply, to absorb the energy of the drive in the case of converter fault and to assure energy for power peaks. The DC-link current, immediately out of the switching legs, is composed of a DC value and all harmonics related to the switch commutations. These last represent, in ideality, the DC-link capacitor current . The relationship between the switching commutation and the DC link current waveform is reported in [32]. In general, decreases as the number of phases increases [32,33], and the value of the changes for different operating conditions.
As an example, for a three-phase machine supplied by a single inverter, the simulated values for different operating condition are reported in Figure 8 [31].
In order to have a complete description, simulations have been carried out for the 3-phase drive and for the triple-3-phase one.
The software used in simulation is Pspice ORCAD (16.5, CADENCE, San Jose, CA, USA). The switching frequency is fixed to 20 kHz and dead time is not considered.
In the 3-phase solution, a single inverter supplies a motor simply modelled by current generators. No ripple current effect is considered at the simulation level.
In the triple-3-phase solution, each module of the triple-3-phase converter (Figure 4) supplies one 3-phase star as in Figure 2 and Figure 3. The motor is again modelled by nine current generators with a current value equal to the 3-phase one.
When disregarding the output current ripple in a current loop control, the motor can be simply modelled by current generators, at least from the DC-link point of view. This approximation can in general be done as shown in [31,34]. In addition for fractional slot concentrated windings machines, like that one considered in the paper, to assume a negligible ripple current with respect to the nominal phase current became more consistent since the phase inductance is typically high.
The variations of the following parameters have been considered:
- Modulation index (VPhase/Vbus),
- Displacement between PWM carriers (),
- Phase between voltage and current (VI-phase).
Steady state simulations have been performed in all of the possible combinations of the above parameters. In particular, to consider different values of VI-phase means evaluating the effect of the proposed technique through different operating conditions like the one related to the constant power speed range in which the rotation of the current vector leads to a variation of the machine power factor. The values and their harmonic spectrum for all the operating points have been stored and proposed here.
All results have been normalized to ease the comparison. DC-link rms currents have been normalized to the rms phase current value of the 3-phase case. The modulation index M can vary from 0 to according to the linear inverter range extended through the injection of the proper common mode [28]. Data processing has been performed to search for the worst case in all conditions in order to guide for the DC-link capacitor choice. In the following, the more representative results are proposed.
4.1. Three Phase Solution
For the 3-phase solution, the values of the for different operating conditions are collected in Figure 8. The worst case is the one presenting the maximum value. The capacitor design value is p.u.
4.2. Triple-3-Phase Solution
In the triple-3-phase case, also depends on M and VI-phase. In Figure 9, it is possible to see the benefits of the introduction of the displacement . The graph in Figure 9 refers to the M value for which the greatest variation with in the values occurs. It can be noticed that, for the chosen M value, the is barely constant independently of the VI-phase for four values of : 50, 70, 110, 130 carrier degrees approximately.
For different operating conditions, the minimum of moves and the trend becomes barely flat as the M increases, as it will be shown in detail in the experimental part.
In Figure 10, a 3D picture collects all results for all simulated M, and VI-phase values.
Once the drive operating condition is known, it is possible to define the DC-link design point. To make the analysis independent from any particular application, it is possible to assume that the drive could explore all the operating conditions (all VI-phase/M couples). It is possible to see how, for the triple-3-phase machine, it is sufficient to calculate the value of for VI-phase 0 and 90 in order to calculate the worst case design. In Figure 11 and Figure 12, iso-level curves report the value of the in p.u with respect to the rms value of the phase current. It is possible to see how the design point is influenced by the operating conditions. If the VI-phase variation is limited from 0 to 30 electrical degrees, two equivalent angles are 60 and 120 degrees, but if the operating range of the drive is not well defined or the VI-phase moves from 0 to 90 electrical degrees, the design point moves and an optimal angle can be chosen around 45 degrees. Data in Figure 10 are then analysed in order to identify the locus of greatest values of versus in all operating conditions. Figure 13, in detail, represents this locus for each carrier displacement. The mutual phase shifting between PWM carriers for which the minimum of the greatest occurs can be chosen as the optimal PWM displacement angle. In [15], the analysis on the simulated results includes the evaluation of the DC-link current harmonic contributions for different . The design point chosen ( degrees) is the point where the first and the second harmonic contributions meet each other.
The same analysis, described above, has been extended for larger than 180 degrees and the collected results suggest a mirror behaviour. In addition, for V-I phases greater than 90 degrees, electrical degrees’ graphs regress from the previously overlapping curves. As an example, the resulting for 100 electrical degrees is equal to the one for 80 el. deg., and, for 180 el. deg., the curve overlaps the 0 one.
It is worth noticing that the simulation methodology proposed does not take into account any parasitism. In this ideal scenario, the proposed technique leads to a reduction close to of the p.u. The next section will show how the effectiveness of the proposed technique is affected by the converter layout.
5. Modulation in Fault Condition
As previously said, multi-n-phase drives offer additional degrees of freedom that can be used for different purposes, such as torque enhancement and design for fault tolerant strategies. The aim of this chapter is to highlight that, in the proposed PWM strategy, adjustments are not needed under fault operation. The displacement between carriers’ signals are also applicable under single or double inverter faults appearing as a real additional DoF. The analysis is conduced considering only inverter faults. If one phase of one converter fails, the whole converter is removed. Considering the adopted fault scheme, then, the maximum number of admitted inverter faults is 2 (removing 6 inverter legs).
The analysis in the previous section is here repeated considering one modular converter fault at a time. The proposed configuration, in fact, is not symmetric and two different faults could occur. For a single inverter fault, then, the value of depends on which converter has been shut down.
The values for a double inverter fault are equal to the values for a 3-phase case (Figure 8) reduced by a factor of 3, i.e., a constant maximum value of p.u independently of .
Figure 14 shows the locus of the greatest as a function of for any value of V-I phase and M including fault conditions. The fault of the inverter a and c leads to the same points and to the same harmonic spectrum, highlighting the fact that the harmonic compensation depends on the mutual phase shift independently from the sign of the shifting. The fault in the b inverter leads to the doubling of the adopted phase shifting.
Overlapping the locus of the greatest for each fault condition, it is possible to define a new design point that represents the global best worst case design point for the proposed drive, considering all operating conditions (continuous line in Figure 14). The value of optimal displacement angle on which the minimum occurs, also including the fault conditions, is close to the design point that could be defined if no faults would have been introduced.
6. Experimental Results
Measurements from two different laboratory setups verify the simulated values of the shown in previous sections. These verifications allow the simulated approach the capability to predict results and to define the appropriate design point. The reduction of the rms current in the capacitor has been tested for three asynchronous motors over a wide variety of operating conditions and then for a triple 3-phase motor. The tests are both essential in order to validate the effectiveness of the simulation methodology.
6.1. Three 3-Phase Motors Experimental Setup
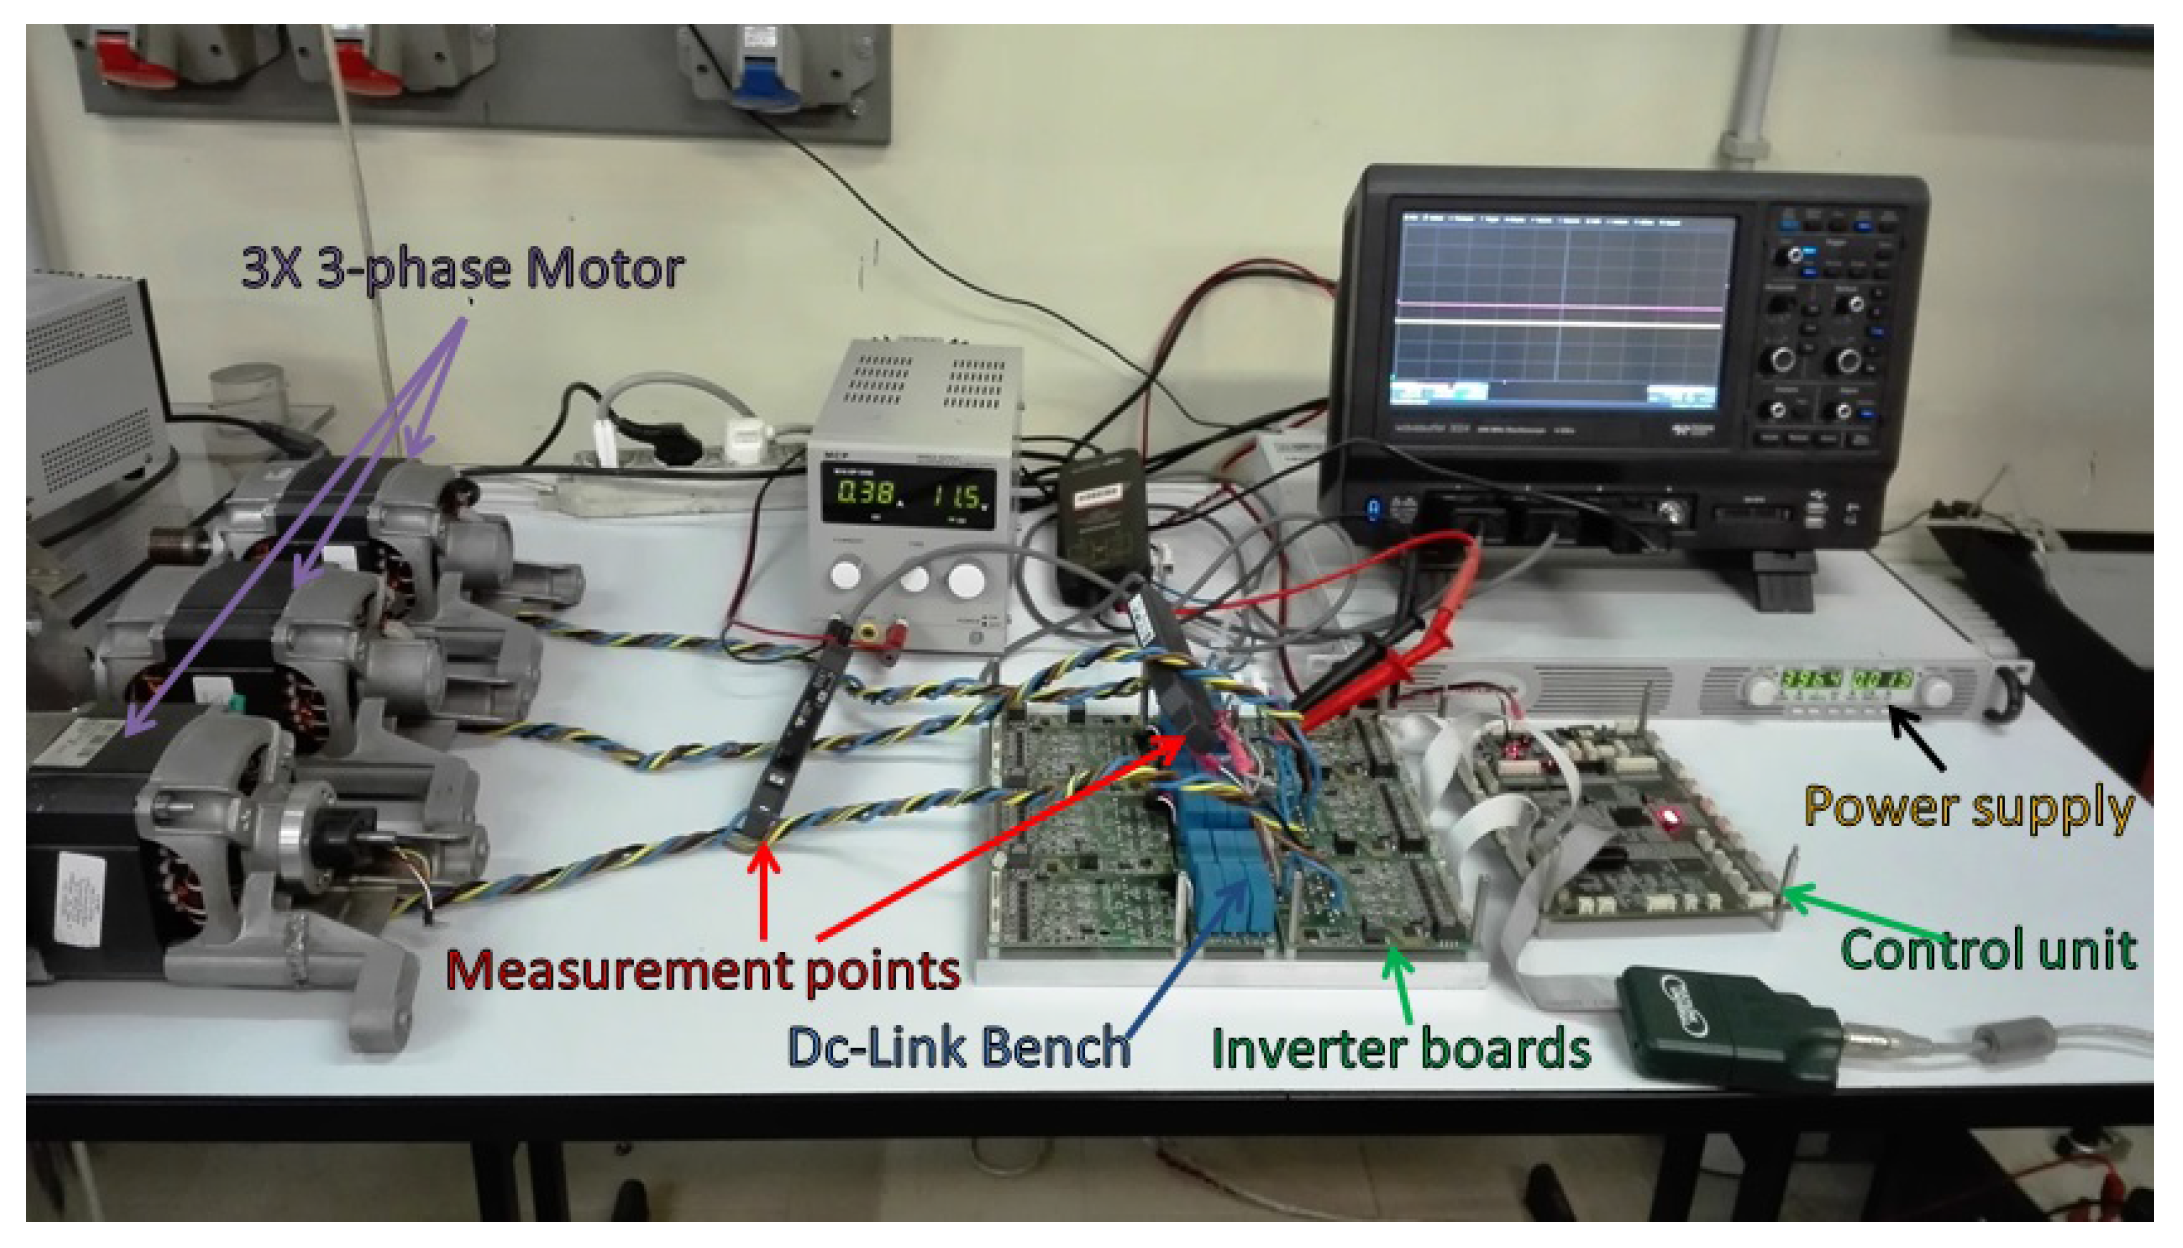
The experimental setup adopted in this set of measurements is shown in Figure 15. In the following a detailed explanation of the various elements that composed the test bed is given.
6.1.1. Power Electronics
The power electronics used for the test are composed of three inverter boards and a single control unit (Figure 15). Each inverter board has a capacitor (260 nF, 600 V) on each leg in order to reduce the commutation path as shown in Figure 16 and then to reduce the overvoltage related to the current commutation of each half bridge. The dimension of the ceramic capacitors are one order of magnitude lower with respect to the DC-link one (27 uF); as a consequence, it is possible to consider that the biggest amount of the current ripple flows through the DC-link capacitor. The three boards are connected in a parallel way to a common DC-bus. If the internal DC-bus is not directly accessible, then the values of the are estimated through the measurement of the AC current downstream the bus (inverters input). The measurement procedure itself affects the results. In fact, the wires introduced to allow for a high bandwidth current probe placing modify the characteristic impedance of the commutation path. The wires and the current probe introduce a parasitic inductance that reduces the amount of current that flows through the DC-link capacitor. In order to complete the analysis, the simulations have been extended including also parasitic parameters, commutation path capacitors and the parameters of the wires introduced for the measurement in Figure 17. Taking into account the parasitic parameters in the model is important since they affect the current flowing in the DC-link capacitor showing how the power electronics layout can affect the results. The values reported in Figure 17 have been estimated and are considered equal to nH, m and inductance nH.
6.1.2. Electrical Machines
In order to validate the control technique, three equal induction machines have been adopted (Figure 15). This choice has been done in order to verify the validity of the control technique neglecting high frequency phenomena. The results in this case are then compatible with a triple-3-phase machine in which the phases belonging to different stars are magnetically insulated. As reported in Section 2.1, the chosen motor design allows for minimizing the mutual coupling between adjacent stars. As a consequence, the interaction between phases belonging to different stars can be neglected in a first approach. The three motors used are motors for home appliance application with the following characteristics (Table 2).
The three motors are driven by simple V/Hz control with the three voltage stars displaced one with the other according to Figure 3b. No-load and locked rotor tests have also been realized to investigate different value of VI-phase.
6.1.3. Experimental and Simulated Results Comparison
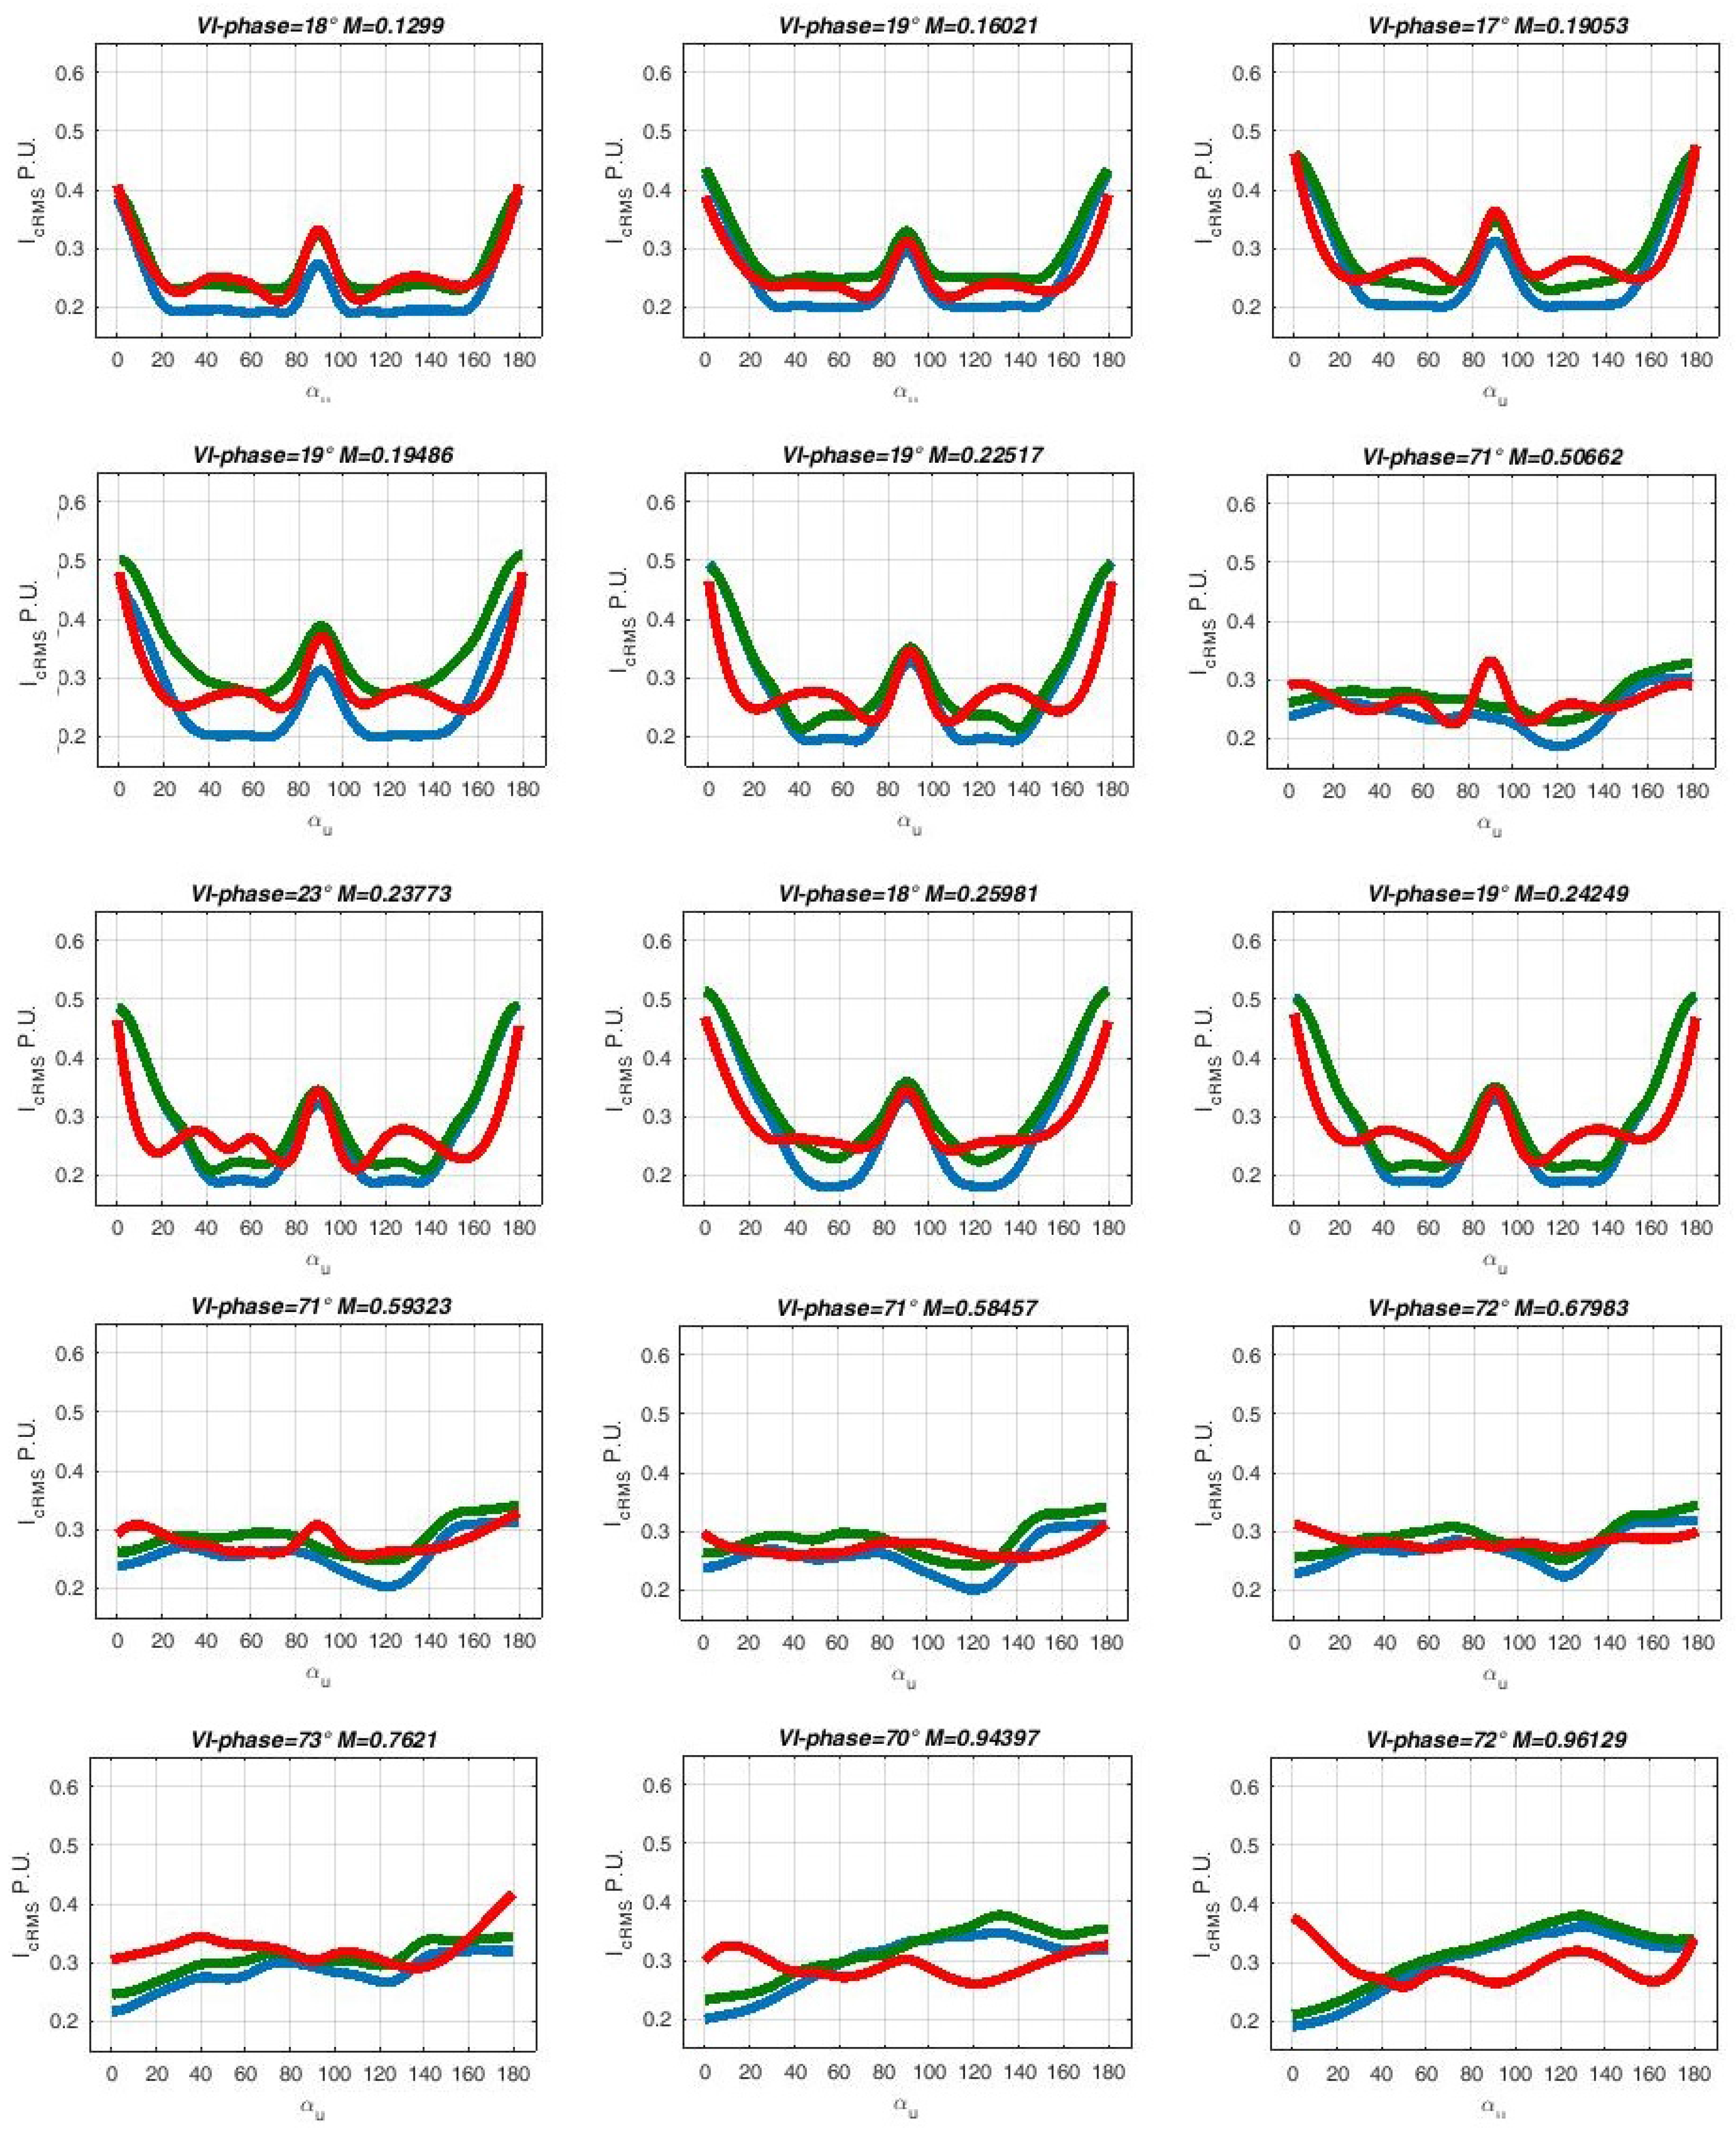
The in different operating conditions for different values of are depicted in Figure 18.
The graphs show different curves:
- the simulated values of for triple-3-phase converter in (Figure 4) (blue line).
- the simulated values of considering a model of the triple-3-phase converter used in the laboratory setup with estimated concentrated resonance parameters (green line).
- the measured values of with the laboratory setup (red line).
Similarly to what has been done in Section 4, it is possible to represent the locus of the greatest (Figure 13) so as to compare for the worst case for the capacitor bench in the simulations and in the experimental results.
Even if the experimental tests are limited in number and do not cover the whole operating area, the loci of the greatest for the three different evaluations are compared in Figure 19.
Figure 18 and Figure 19 show that the simulation model well represents the evolution of the phenomena with small differences for high M values. The comparison between the blue curve and the green one highlight that the values depend by the converter layout. The proposed PWM control technique become more effective if a proper commutation path is adopted, as always happens.
The experimental results provide trends for close to what was expected. The difference between the green curve and red ones could be due to two factors:
- It is difficult to identify the resonant parameters of the commutation path. These parameters are estimated and inserts it in the simulation model as concentrated parameters.
- The DC bus is not directly accessible: as a consequence, the measurements are conditioned by the measurement procedure itself.
Simulation and experimental results, anyway, indicate that the minimizing the for the proposed PWM strategy is not a constant, and it is not necessarily equal to 120 carrier degrees as could be at first thought. The optimal depends on the converter layout and by operating conditions. Downstream from the simulations and the experimental results, the present paper suggests defining the DC-link capacitor bench dimension considering a phase shifting between PWM carriers equal to 45 carrier degrees. In this case, it is possible to contain the value of in all operating conditions, also considering faults operation. The adoption of this value is advantageous also in terms of implementation being of the PWM period time, typically an integer number in the digital implementations.
6.2. Triple 3-Phase Motor Experimental Setup
In Figure 20, the test bench is reported. A triple 3-phase machine is driven by a I/Hz control with three equal dq reference current.
6.2.1. Power Electronics
The power electronics used for the test is composed by three inverter boards and a single control unit (Figure 15). Each inverter board has a capacitor ( uF, 600 V) on each leg in order to reduce the commutation path. An external DC-link film capacitor has been used (60 uF) and the DC-link capacitor is directly accessible. With respect to the previous case, a bigger DC-link inductance is presented (measured nH). Like has been done for the experimental setup previously presented, the estimated parameters shown in Figure 17 have been inserted in the simulation. Thanks to the chance to measure directly the DC-link capacitor current, the simulation and the experimental results become much more congruent and the effect of the parasitic element is more evident compared to the previous case.
6.2.2. Electrical Machines
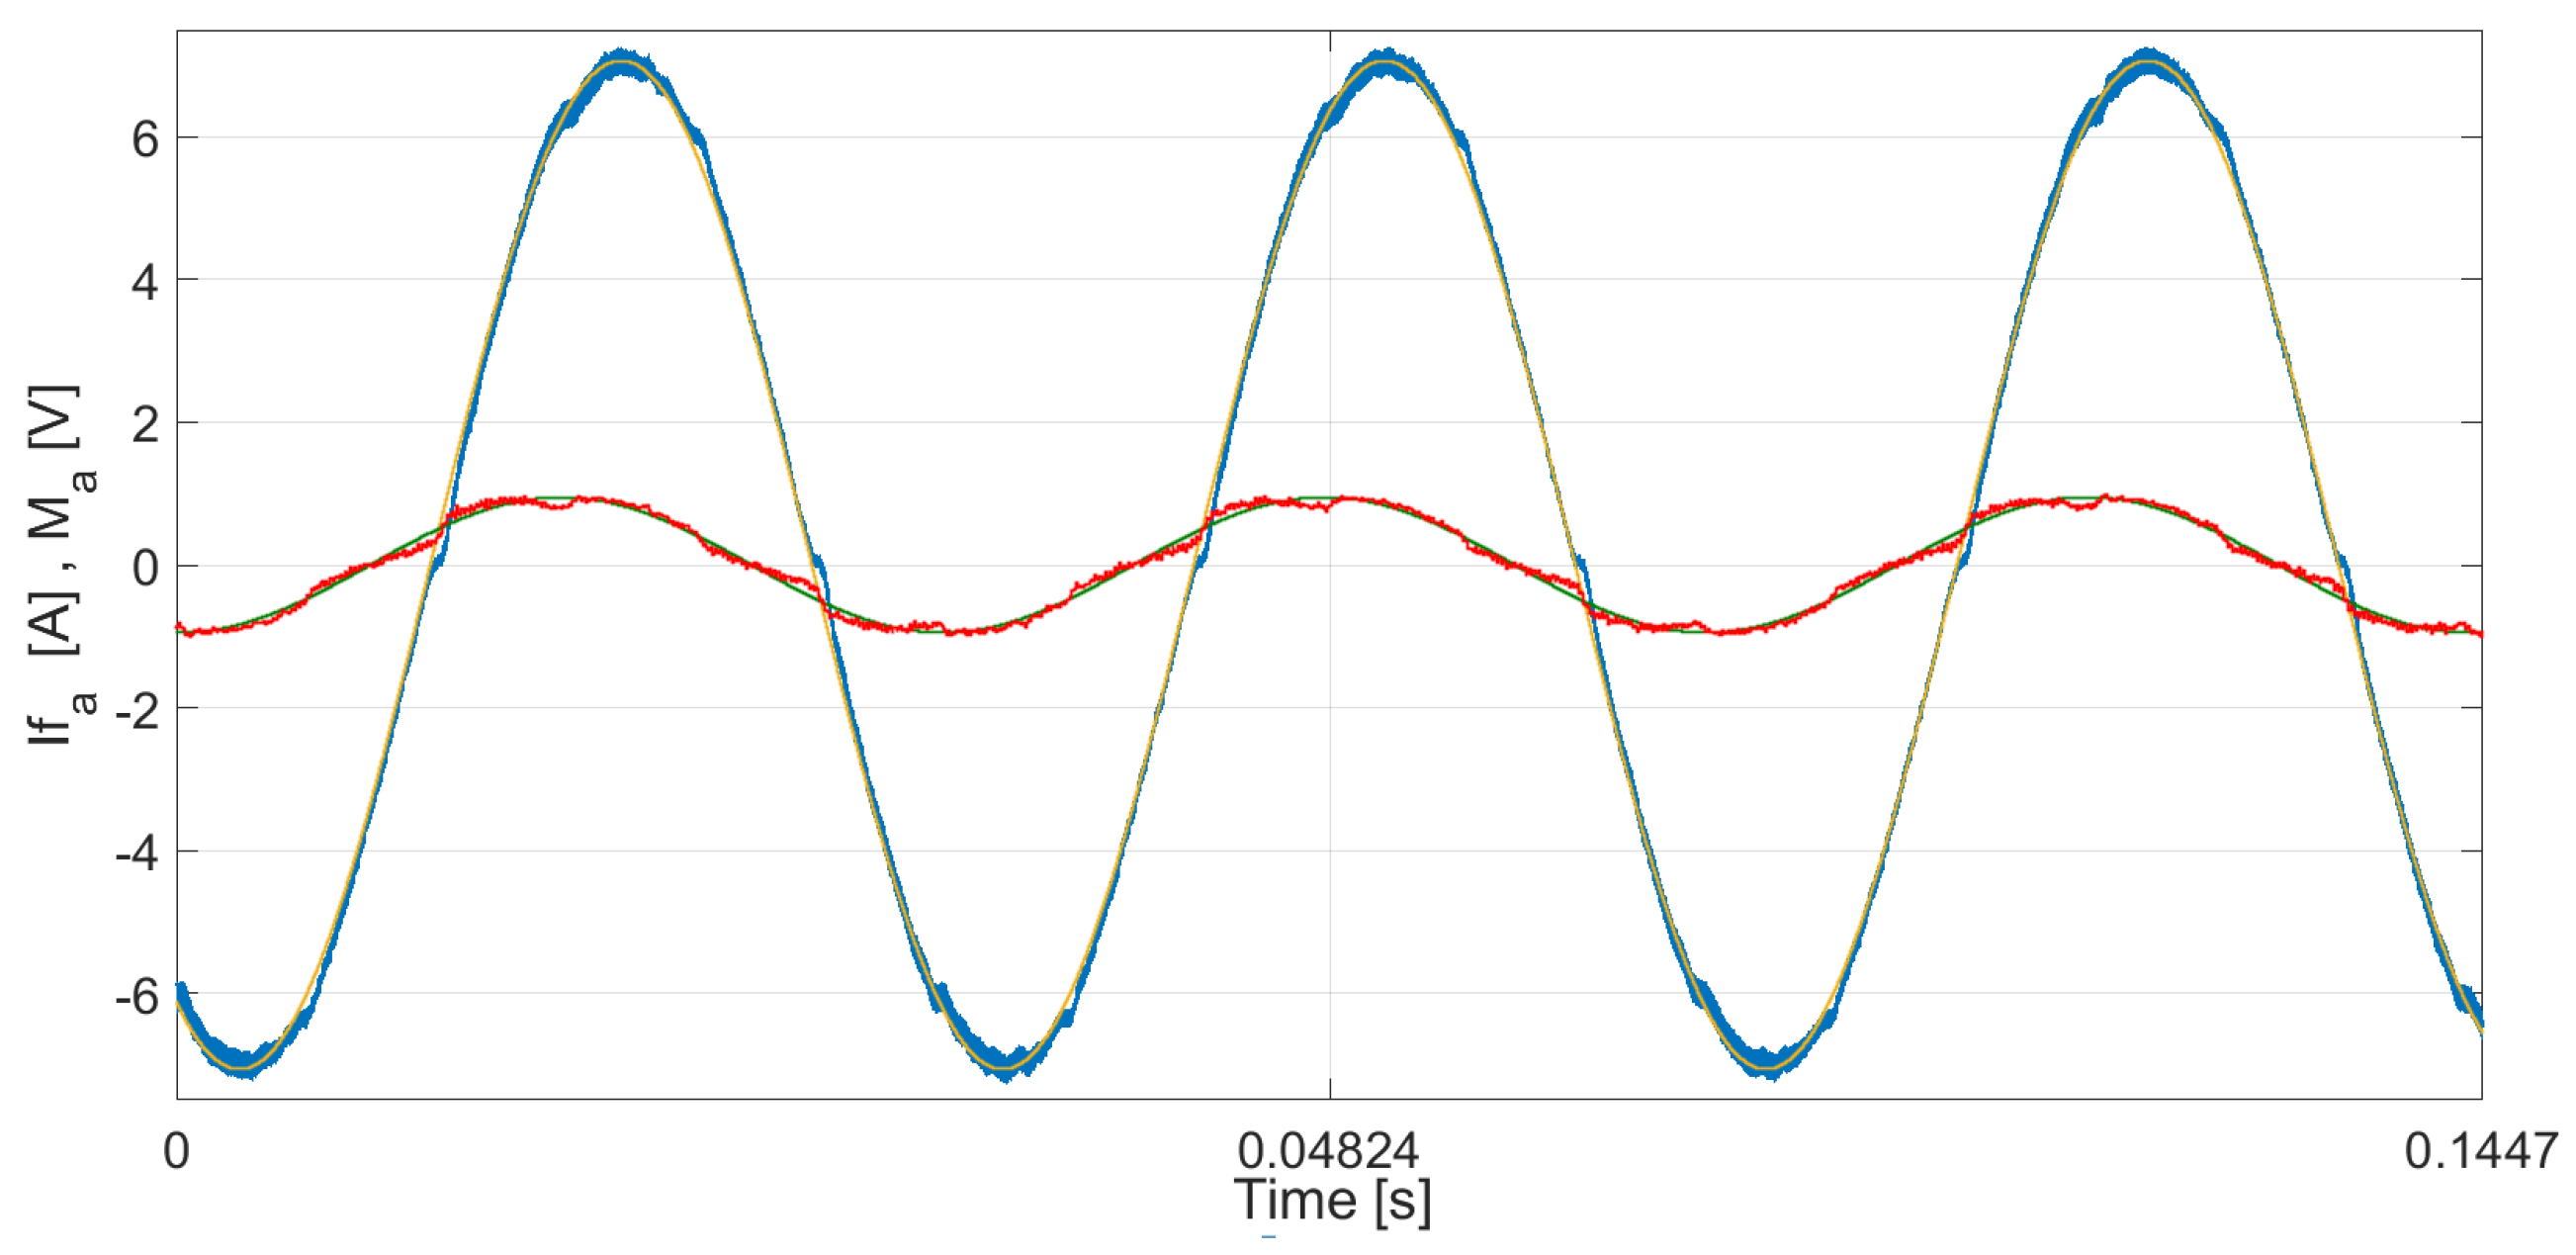
In order to validate the control technique, a triple 3-phase machine like that one schematically represented in Figure 3 has been adopted. The motor used has been designed for automotive application with the characteristics reported in Table 3. The triple 3-phase motor under test does not present sinusoidal EMF as a consequence, if a I/Hz control is driven at low speed, the shape of the modulation indexes is not perfectly sinusoidal. In Figure 21, the value of a phase current and corresponding modulation index acquired by a Digital to Analog Converter (DAC) have been reported.
Two different operatives’ conditions have been tested.
In Figure 20, the test bench and the measurement layout have been reported.
6.2.3. Experimental and Simulated Results Comparison
In Figure 22, results have been reported in detail for no load and on load conditions. For the same operatives’ conditions, the simulations have been conducted without considering the parasitic parameters in order to compare the results with the ideal case. Measurements and simulations highlight how the parasitic parameters can affect the final results.
The main differences between the simulation and experimental results are related to:
- the error in the estimation of the resonance parameters of the commutation path,
- the realized modulation index is not purely sinusoidal due to the not perfect sine EMF at load operation
7. Conclusions
The present paper highlights some of the benefits of the multi-n-phase structures and presents a simple modulation strategy that reduces the DC-link stress in terms of rms capacitor current. The approach to exploit an additional degree of freedom, the phase shifting between PWM carriers for the different 3-phase inverters, leads to a positive result and allows for the reduction of the DC-link rms current in multi-n-phase drives. The analysis of the benefits introduced by PWM phase shifting are extended to all possible operating conditions including the fault one. Simulated and experimental results show that the optimal PWM phase shifting is not a constant and the design point is affected by converters’ layout as well as operating conditions.
Acknowledgments
The authors would like to thanks the ASKOLL Holding s.r.l. company, Italy, that helped the Authors in the realization of the 9-phase electric machine prototype.
Author Contributions
All the authors gave their contribution to all of the aspects of the manuscript.
Conflicts of Interest
The authors declare no conflict of interest.
References
- Shakweh, Y.; Owen, G.; Hall, D.; Miller, H. Plug and play integrated motor drives. In Proceedings of the International Conference on Power Electronics, Machines and Drives, Sante Fe, NM, USA, 4–7 June 2002; pp. 655–661. [Google Scholar]
- Ruffo, R.; Guglielmi, P. Simple parameters estimation and precise over-voltage simulation in long cable connected drives. In Proceedings of the IECON 2016—42nd Annual Conference of the IEEE Industrial Electronics Society, Florence, Italy, 23–26 October 2016; pp. 4362–4367. [Google Scholar]
- Brown, N.R.; Jahns, T.M.; Lorenz, R.D. Power Converter Design for an Integrated Modular Motor Drive. In Proceedings of the 2007 IEEE Conference Record of the Industry Applications Conference, New Orleans, LA, USA, 23–27 September 2007; pp. 1322–1328. [Google Scholar]
- Bojoi, R.; Cagnagnino, A.; Tessarolo, A.; Vaschetto, S. Multiphase Electrical Machines and Drives in the Transportation Electrification. In Proceedings of the 2015 IEEE 1th International Forum on Research and Technologies for Society and Industry (RTSI), Turin, Italy, 16–18 September 2015. [Google Scholar]
- Yu, F.; Cheng, M.; Chau, K.T.; Li, F. Control and Performance Evaluation of Multiphase FSPM Motor in Low-Speed Region for Hybrid Electric Vehicles. Energies 2015, 8, 10335–10353. [Google Scholar] [CrossRef]
- Sui, Y.; Zheng, P.; Wu, F.; Yu, B.; Wang, P.; Zhang, J. Research on a 20-Slot/22-Pole Five-Phase Fault-Tolerant PMSM Used for Four-Wheel-Drive Electric Vehicles. Energies 2014, 7, 1265–1287. [Google Scholar] [CrossRef]
- Levi, E. Multiphase Electric Machines for Variable-Speed Applications. IEEE Trans. Ind. Electron. 2008, 55, 1893–1909. [Google Scholar] [CrossRef]
- Guglielmi, P.; Diana, M.; Piccoli, G.; Cirimele, V. Multi-n-phase electric drives for traction applications. In Proceedings of the 2014 IEEE International Electric Vehicle Conference (IEVC), Florence, Italy, 17–19 December 2014; pp. 1–6. [Google Scholar]
- Abolhassani, M. A novel multiphase fault tolerant high torque density permanent magnet motor drive for traction application. In Proceedings of the 2005 IEEE International Conference on Electric Machines and Drives, San Antonio, TX, USA, 15 May 2005; pp. 728–734. [Google Scholar]
- Ferreira, C.; Bucknall, R. Modelling and real-time simulation of an advanced marine full-electrical propulsion system. In Proceedings of the Second International Conference on Power Electronics, Machines and Drives, Edinburgh, UK, 31 March–2 April 2004; Volume 2, pp. 574–579. [Google Scholar]
- Brisset, S.; Vizireanu, D.; Brochet, P. Design and Optimization of a Nine-Phase Axial-Flux PM Synchronous Generator With Concentrated Winding for Direct-Drive Wind Turbine. IEEE Trans. Ind. Appl. 2008, 44, 707–715. [Google Scholar] [CrossRef]
- Bojoi, R.; Cavagnino, A.; Cossale, M.; Tenconi, A.; Vaschetto, S. Design Trade-off and Experimental Validation of multiphase starter generators for 48V mini-hybrid powertrain. In Proceedings of the 2014 IEEE International Electric Vehicle Conference (IEVC), Florence, Italy, 17–19 December 2014; pp. 1–7. [Google Scholar]
- Zheng, P.; Wu, F.; Lei, Y.; Sui, Y.; Yu, B. Investigation of a Novel 24-Slot/14-Pole Six-Phase Fault-Tolerant Modular Permanent-Magnet In-Wheel Motor for Electric Vehicles. Energies 2013, 6, 4980–5002. [Google Scholar] [CrossRef]
- Parsa, L. On advantages of multi-phase machines. In Proceedings of the 31st Annual Conference of IEEE Industrial Electronics Society, Raleigh, NC, USA, 6–10 November 2005; p. 6. [Google Scholar]
- Diana, M.; Guglielmi, P.; Piccoli, G.; Rosu, S.G. Multi-N-phase SMPM drives. In Proceedings of the 2015 IEEE International Electric Machines Drives Conference (IEMDC), Coeur d’Alene, ID, USA, 10–13 May 2015; pp. 1011–1017. [Google Scholar]
- Basler, B.; Greiner, T.; Heidrich, P. Reduction of DC link capacitor stress for double three-phase drive unit through shifted control and phase displacement. In Proceedings of the 2015 IEEE 11th International Conference on Power Electronics and Drive Systems (PEDS), Sydney, NSW, Australia, 9–12 June 2015; pp. 887–889. [Google Scholar]
- Glose, D.; Kennel, R. Carrier-Based Pulse Width Modulation for Symmetrical Six-Phase Drives. IEEE Trans. Power Electron. 2015, 30, 6873–6882. [Google Scholar] [CrossRef]
- Basler, B.; Greiner, T. Power loss reduction of DC link capacitor for multi-phase Motor drive systems through shifted control. In Proceedings of the 2015 9th International Conference on Power Electronics and ECCE Asia (ICPE-ECCE Asia), Seoul, Korea, 1–5 June 2015; pp. 2451–2456. [Google Scholar]
- Capella, G.J.; Pou, J.; Ceballos, S.; Konstantinou, G.; Zaragoza, J.; Agelidis, V.G. Enhanced Phase-Shifted PWM Carrier Disposition for Interleaved Voltage-Source Inverters. IEEE Trans. Power Electron. 2015, 30, 1121–1125. [Google Scholar] [CrossRef] [Green Version]
- Argile, R.; Mecrow, B.; Atkinson, D.; Jack, A.; Sangha, P. Reliability analysis of fault tolerant drive topologies. In Proceedings of the 4th IET Conference on Power Electronics, Machines and Drives, York, UK, 2–4 April 2008; pp. 11–15. [Google Scholar]
- Diana, M.; Guglielmi, P.; Vagati, A. Very low torque ripple multi-3-phase machines. In Proceedings of the IECON 2016—42nd Annual Conference of the IEEE Industrial Electronics Society, Florence, Italy, 23–26 October 2016; pp. 1750–1755. [Google Scholar]
- EL-Refaie, A. Fractional-Slot Concentrated-Windings Synchronous Permanent Magnet Machines: Opportunities and Challenges. IEEE Trans. Ind. Electron. 2010, 57, 107–121. [Google Scholar] [CrossRef]
- Magnussen, F.; Sadarangani, C. Winding factors and Joule losses of permanent magnet machines with concentrated windings. In Proceedings of the 2003 IEEE International Electric Machines and Drives Conference, Madison, WI, USA, 1–4 June 2003; Volume 1, pp. 333–339. [Google Scholar]
- Cros, J.; Viarouge, P. Synthesis of high performance PM motors with concentrated windings. IEEE Trans. Energy Convers. 2002, 17, 248–253. [Google Scholar] [CrossRef]
- Aslan, B.; Semail, E.; Korecki, J.; Legranger, J. Slot/pole combinations choice for concentrated multiphase machines dedicated to mild-hybrid applications. In Proceedings of the IECON 2011—37th Annual Conference on IEEE Industrial Electronics Society, Melbourne, Australia, 7–10 November 2011; pp. 3698–3703. [Google Scholar]
- Fornasiero, E.; Bianchi, N.; Bolognani, S. Rotor losses in fractional-slot three-phase and five-phase PM machines. In Proceedings of the 2010 XIX International Conference on Electrical Machines (ICEM), Rome, Italy, 6–8 September 2010; pp. 1–5. [Google Scholar]
- Burkhardt, Y.; Spagnolo, A.; Lucas, P.; Zavesky, M.; Brockerhoff, P. Design and analysis of a highly integrated 9-phase drivetrain for EV applications. In Proceedings of the 2014 International Conference on Electrical Machines (ICEM), Berlin, Germany, 2–5 September 2014; pp. 450–456. [Google Scholar]
- Haghbin, S.; Thiringer, T. DC bus current harmonics of a three-phase PWM inverter with the zero sequence injection. In Proceedings of the 2014 IEEE Transportation Electrification Conference and Expo (ITEC), Dearborn, MI, USA, 15–18 June 2014; pp. 1–6. [Google Scholar]
- Lin, C.C.; Tzou, Y.Y. An innovative multiphase PWM control strategy for a PMSM with segmented stator windings. In Proceedings of the Applied Power Electronics Conference and Exposition (APEC), Charlotte, NC, USA, 15–19 March 2015; pp. 270–275. [Google Scholar]
- Burkart, R.; Kolar, J. Component cost models for multi-objective optimizations of switched-mode power converters. In Proceedings of the 2013 IEEE Energy Conversion Congress and Exposition (ECCE), Denver, CO, USA, 15–19 September 2013; pp. 2139–2146. [Google Scholar]
- Kolar, J.; Round, S. Analytical calculation of the RMS current stress on the DC-link capacitor of voltage-PWM converter systems. IEE Proc. Electr. Power Appl. 2006, 153, 535–543. [Google Scholar] [CrossRef]
- Lazzari, M.; Profumo, F.; Tenconi, A.; Grieco, G. Analytical and Numerical Computation of RMS Current Stress on the DC Link Capacitor in Multiphase Voltage Source PWM Inverters. EPE 2001 2001. [Google Scholar]
- Patzak, A.; Gerling, D. Design of a multi-phase inverter for low voltage high power electric vehicles. In Proceedings of the 2014 IEEE International Electric Vehicle Conference (IEVC), Florence, Italy, 17–19 December 2014; pp. 1–7. [Google Scholar]
- Wen, H.; Xiao, W.; Wen, X.; Armstrong, P. Analysis and Evaluation of DC-Link Capacitors for High-Power-Density Electric Vehicle Drive Systems. IEEE Trans. Veh. Technol. 2012, 61, 2950–2964. [Google Scholar]
Figure 1.
Case I: base machine (a) and phasor diagrams (b). Red stator teeth are the axes of the coil supplied by the converter a. is the V-I phase angle.
Figure 1.
Case I: base machine (a) and phasor diagrams (b). Red stator teeth are the axes of the coil supplied by the converter a. is the V-I phase angle.

Figure 2.
Case II: base machine (a) and phasor diagrams (b). Red stator teeth are supplied by the converter a, yellow teeth by the converter b; blue teeth by the converter c. is the V-I phase angle and is the electric angle between coil supplied by different converter.
Figure 2.
Case II: base machine (a) and phasor diagrams (b). Red stator teeth are supplied by the converter a, yellow teeth by the converter b; blue teeth by the converter c. is the V-I phase angle and is the electric angle between coil supplied by different converter.
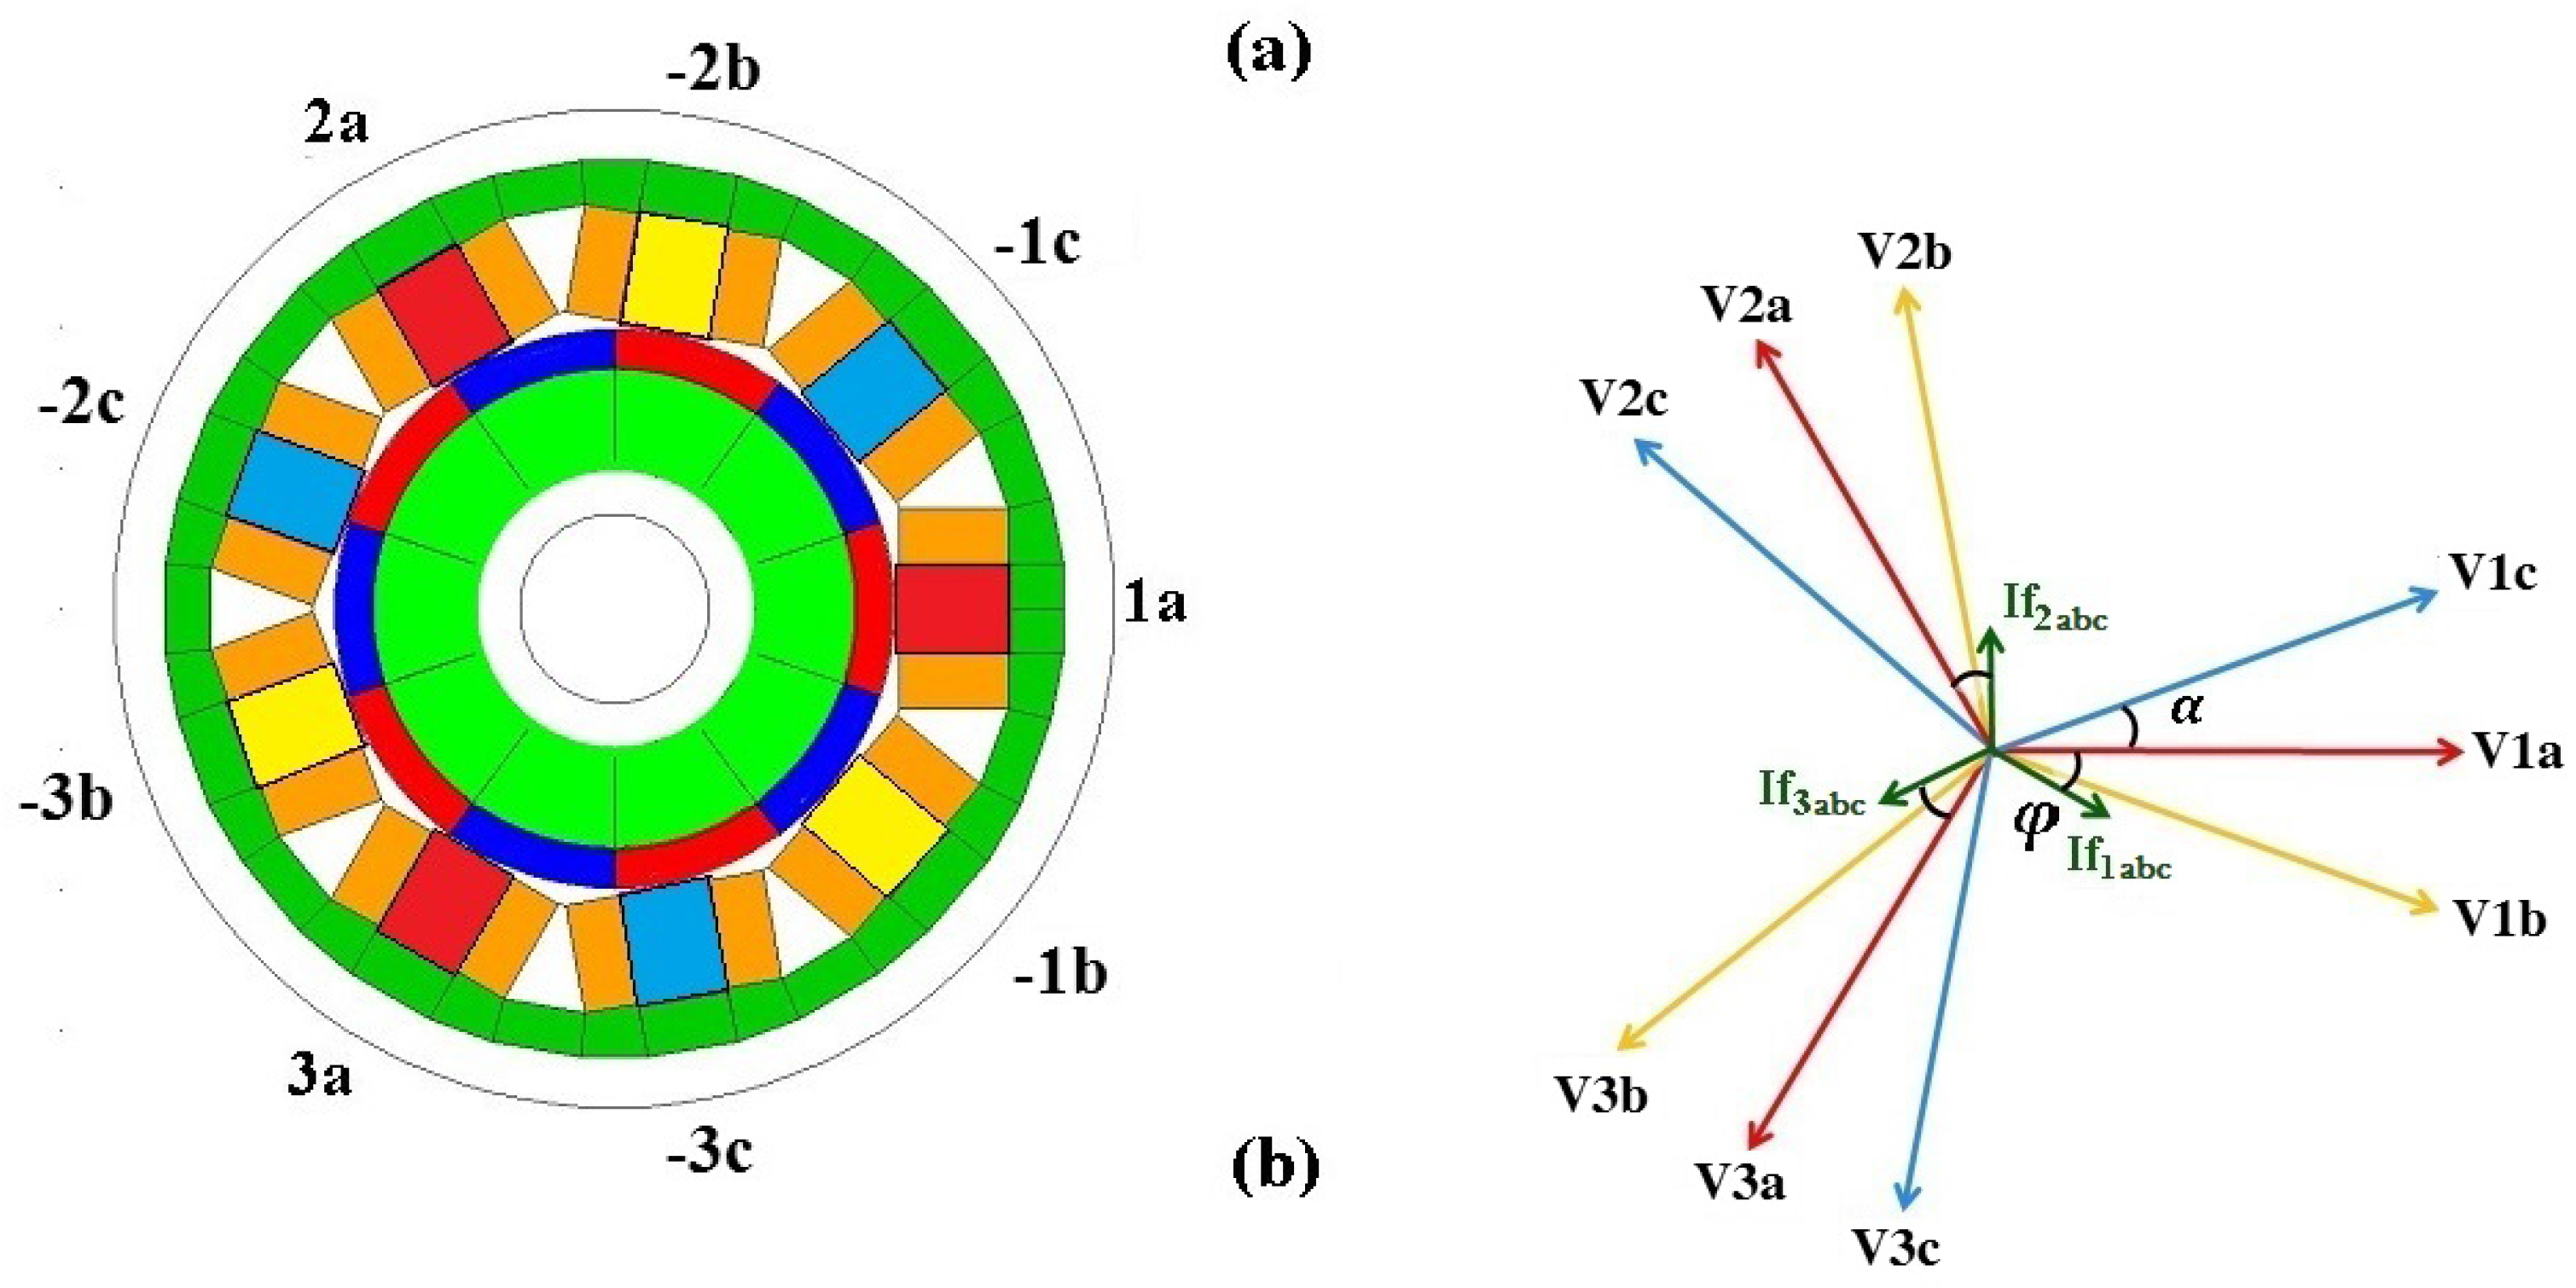
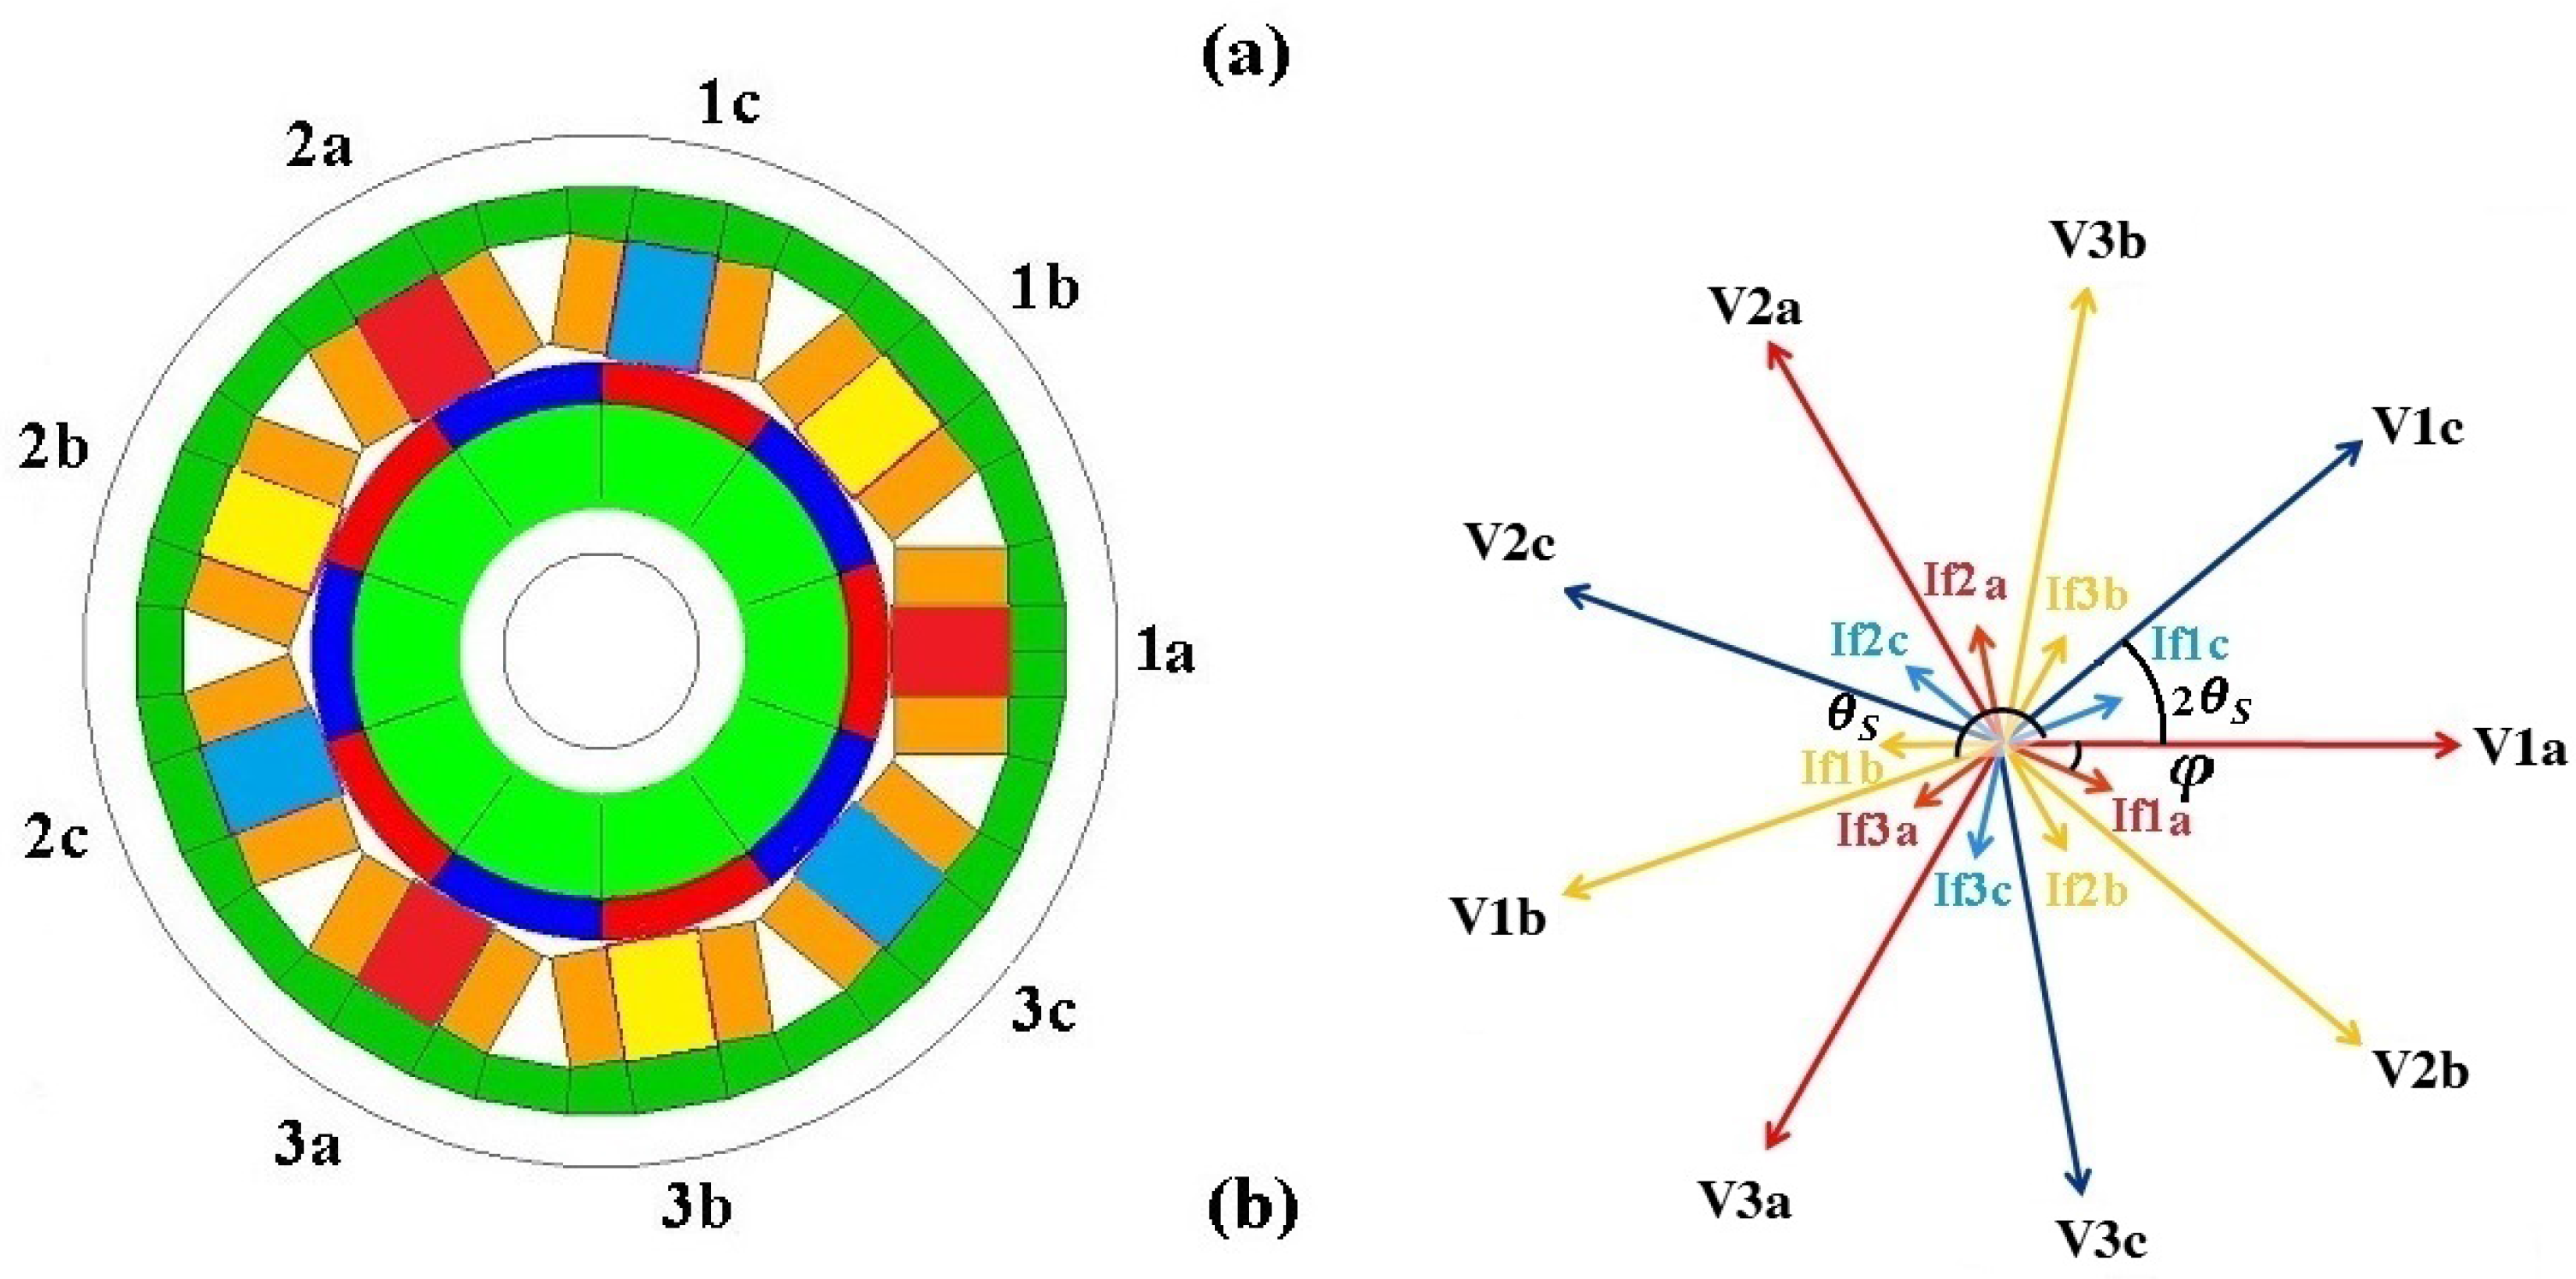
Figure 3.
Case III: base machine (a) and phasor diagrams (b). Red teeth and red star supplied by the converter a, yellow teeth and yellow star supplied by the converter b; blue teeth and yellow star supplied by the converter c. is the V-I phase angle and is the electric displacement between two sequential stars.

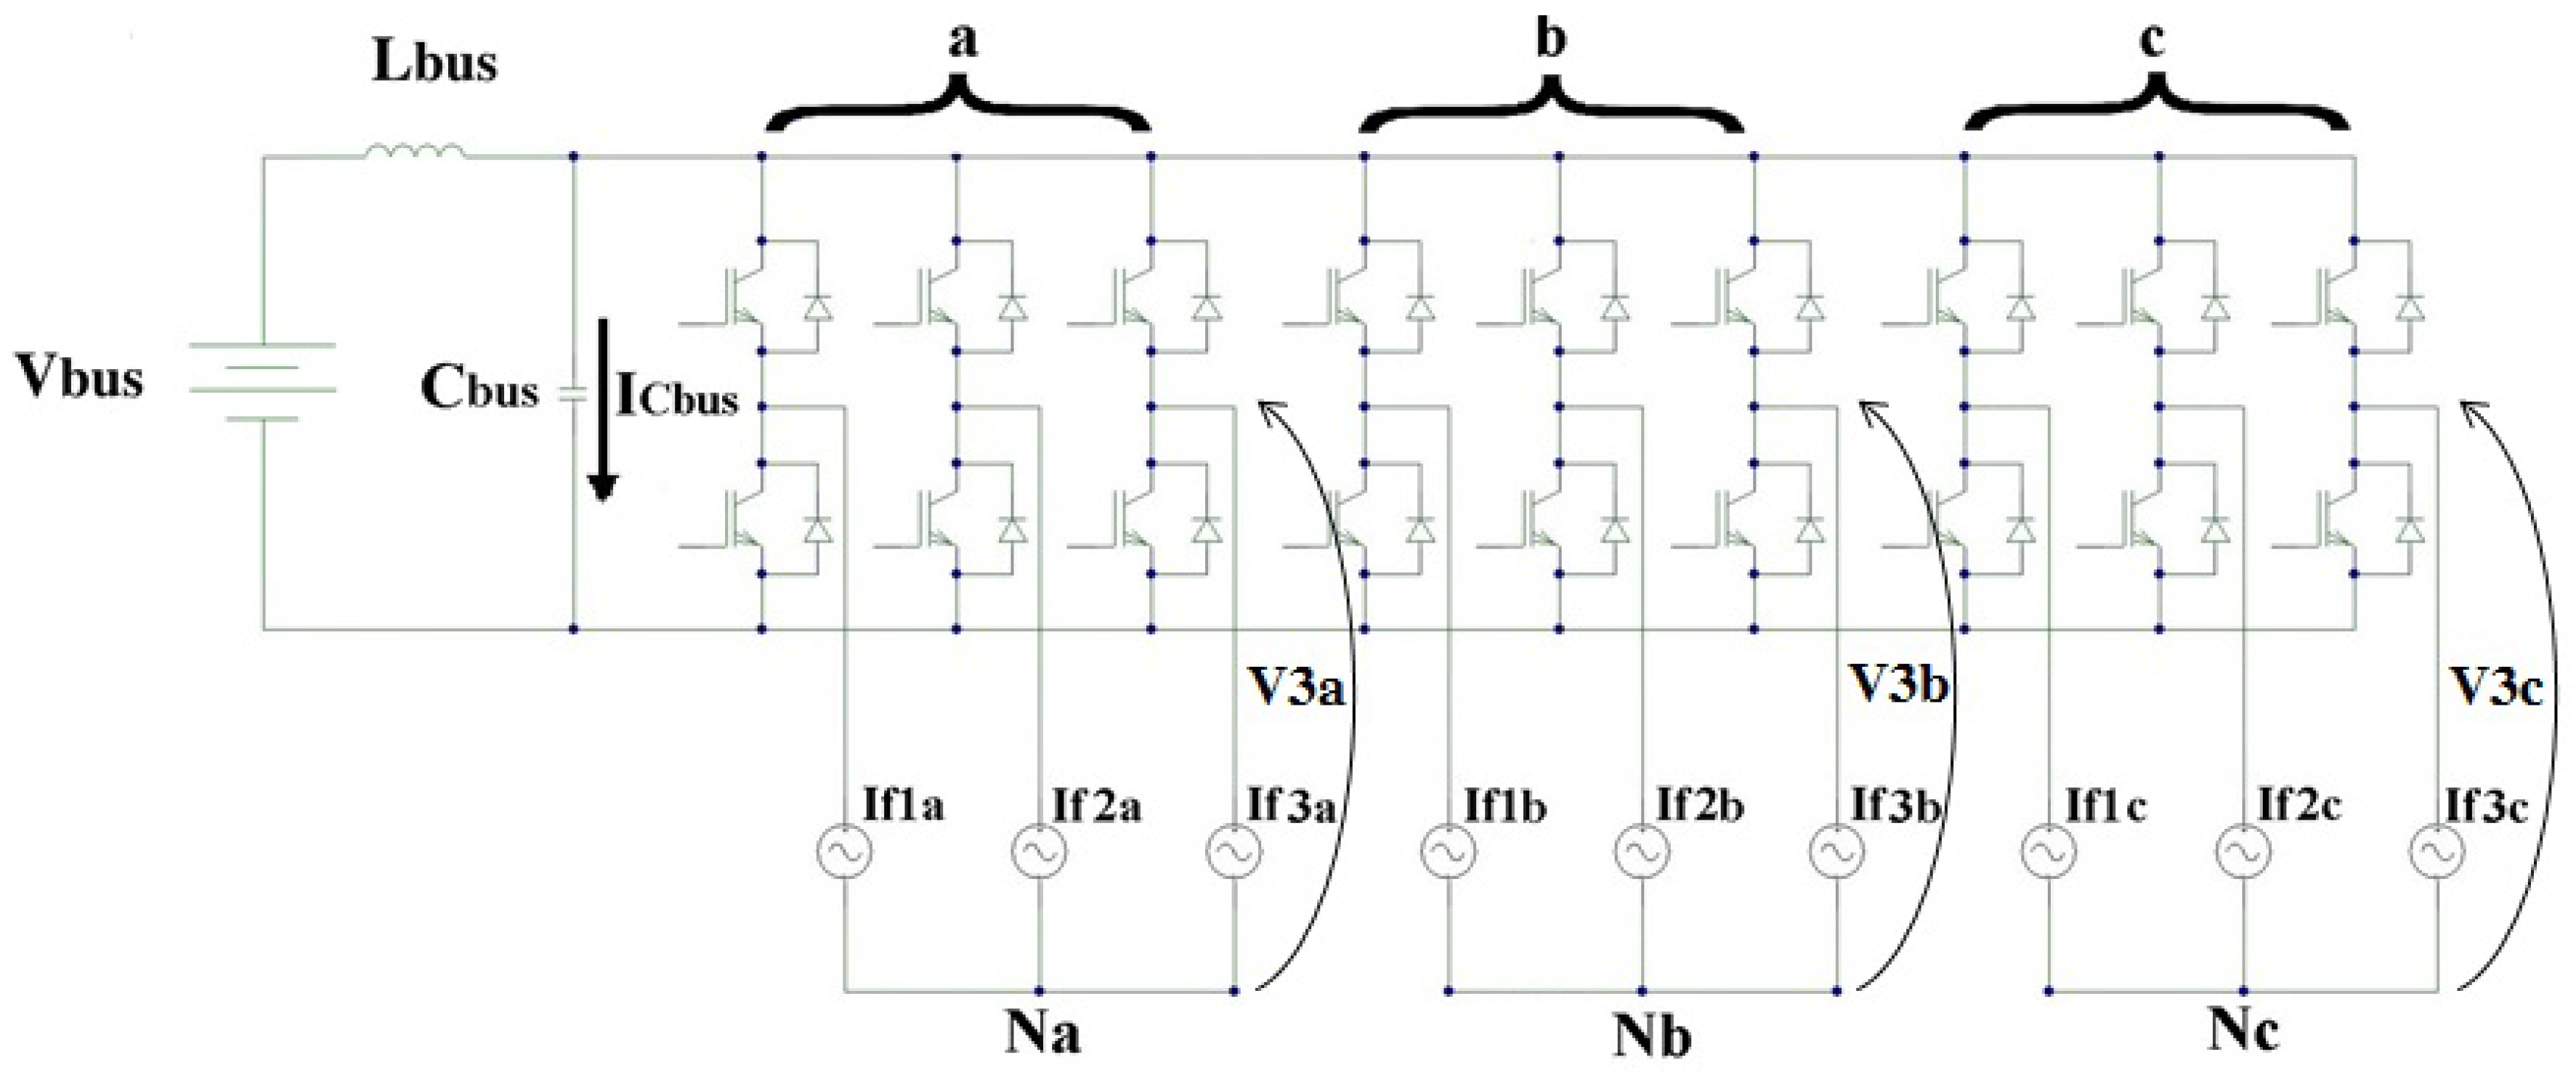
Figure 4.
Triple-3-phase converter IGBT (Insulated Gate Bipolar Transistor) based. The converter is obtained from the composition of three 3-phase converter modules. Each 3-phase converter (a,b,c) supplies a 3-phase star of the machine.
Figure 4.
Triple-3-phase converter IGBT (Insulated Gate Bipolar Transistor) based. The converter is obtained from the composition of three 3-phase converter modules. Each 3-phase converter (a,b,c) supplies a 3-phase star of the machine.

Figure 5.
Control block scheme for the triple-3-phase drive.
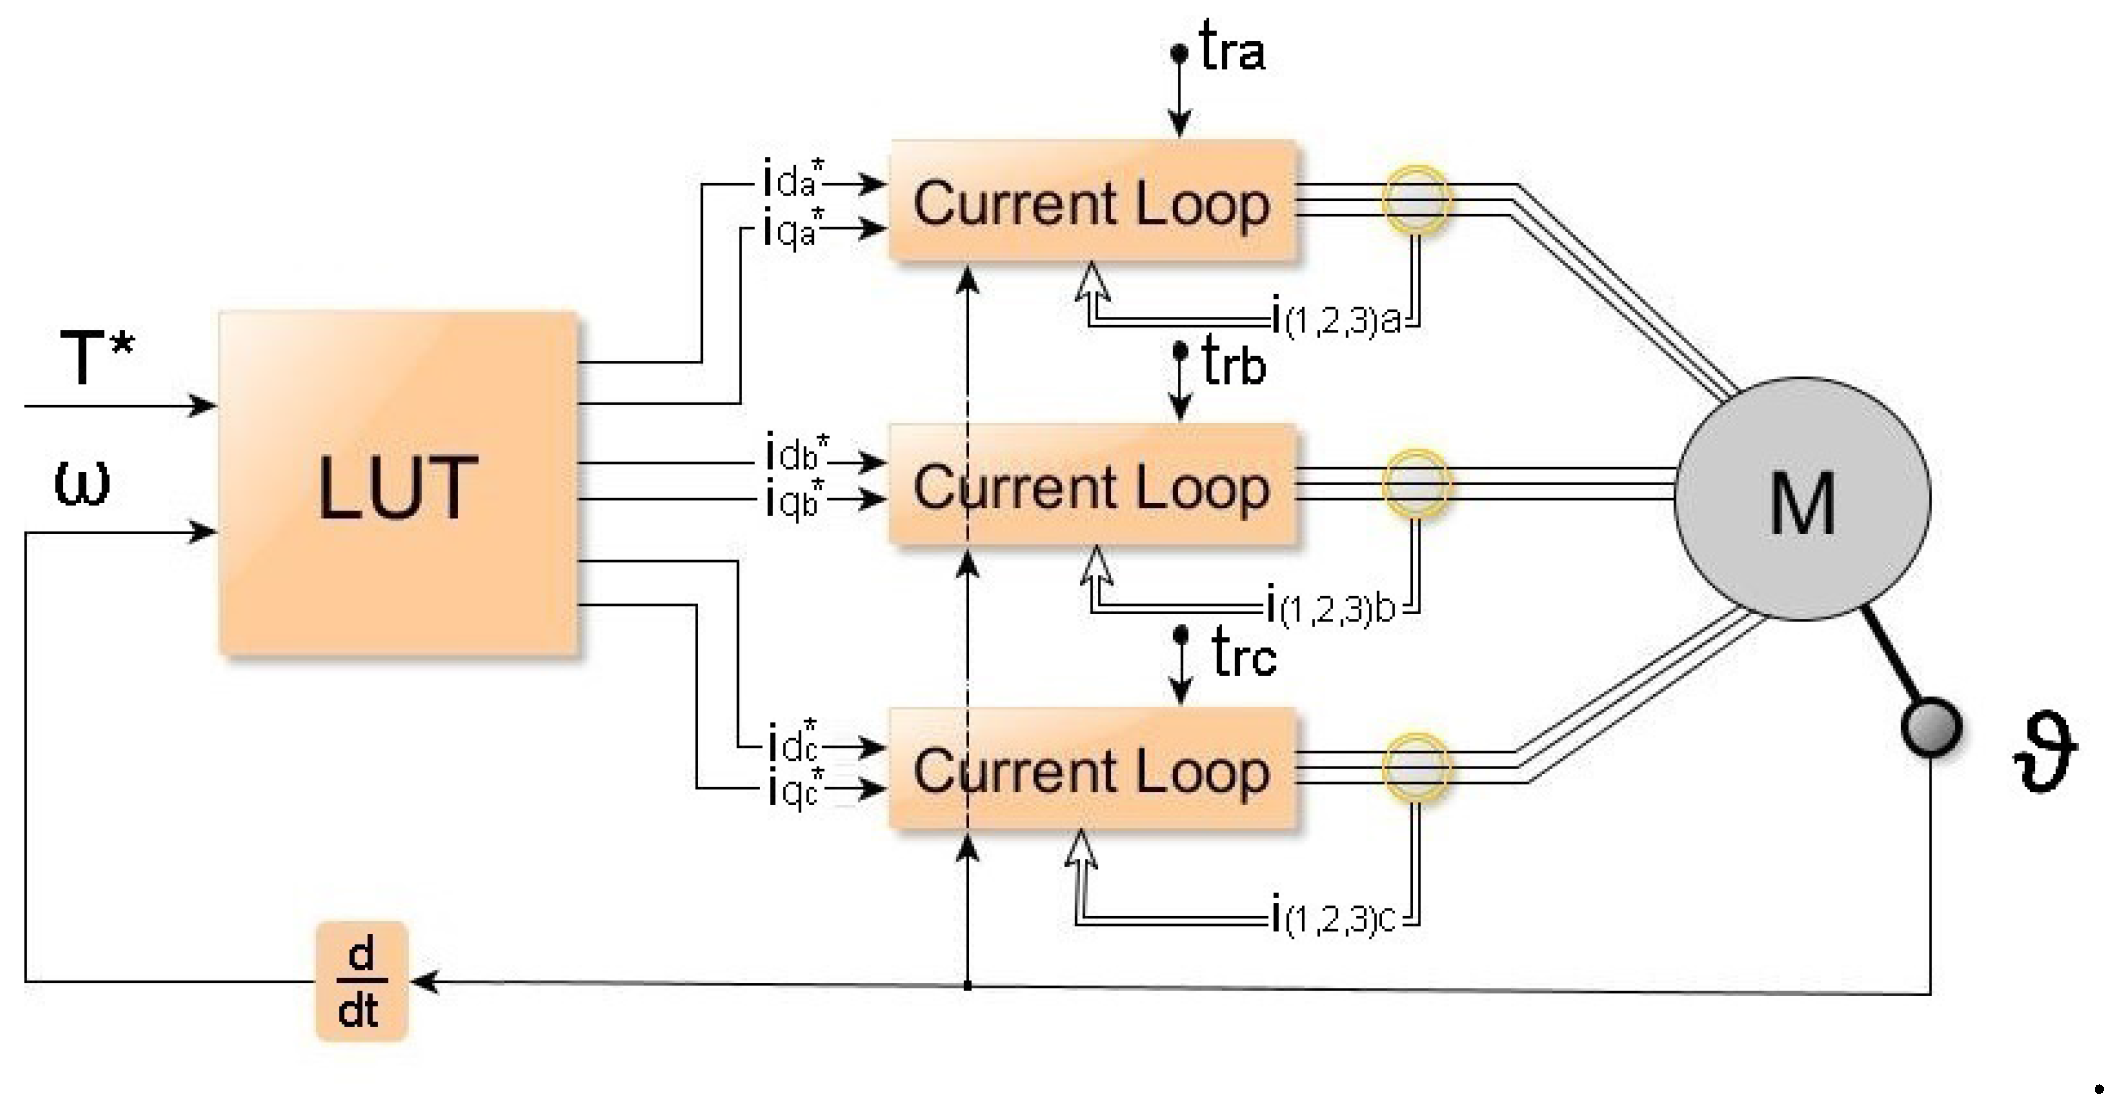
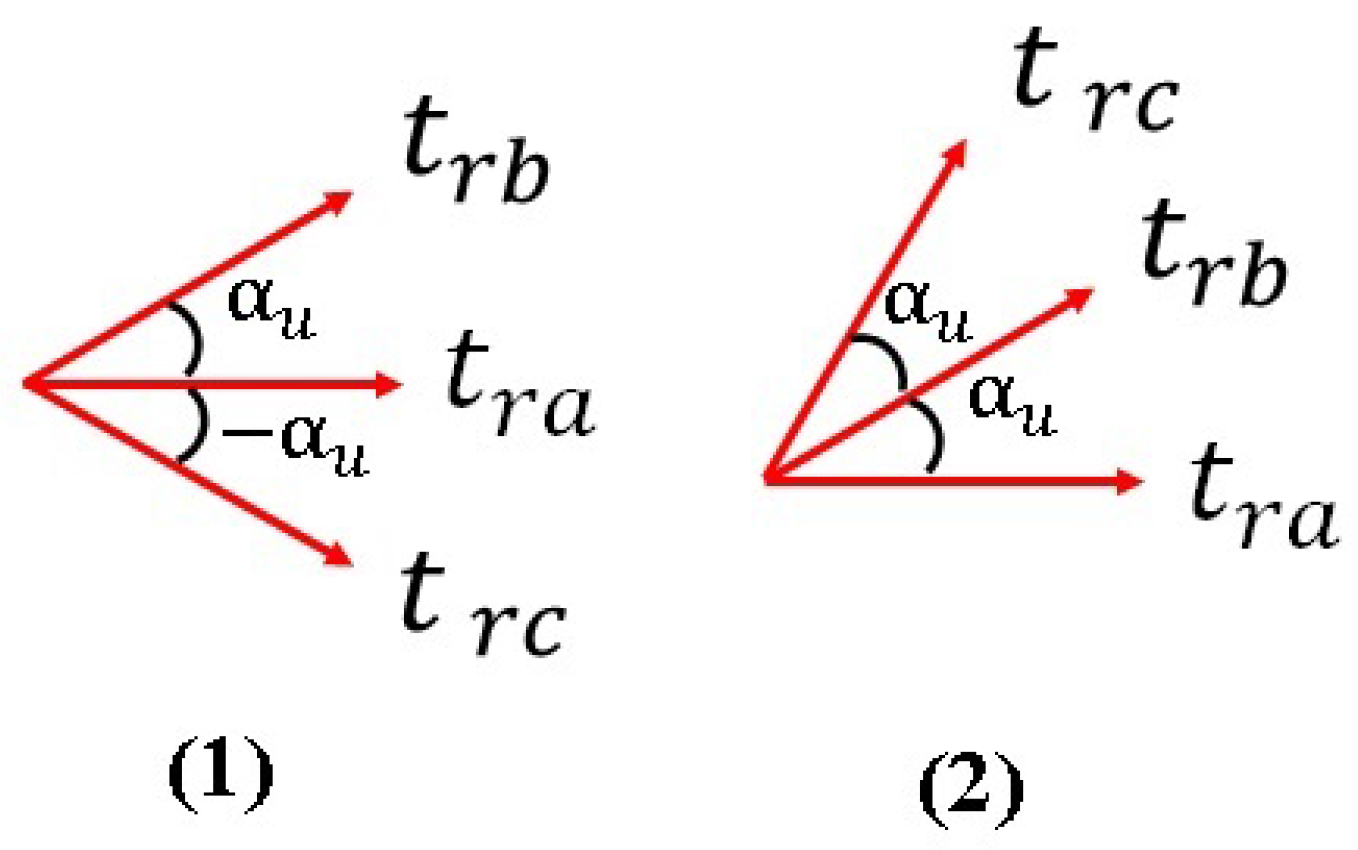
Figure 6.
Phase shifting between carriers’ signals: the results of the analysis are the same regardless of the reference (1,2) if the three PWM carriers’ signals have equal mutual phase shift.
Figure 6.
Phase shifting between carriers’ signals: the results of the analysis are the same regardless of the reference (1,2) if the three PWM carriers’ signals have equal mutual phase shift.

Figure 7.
Carriers , , related to an angle of degrees.
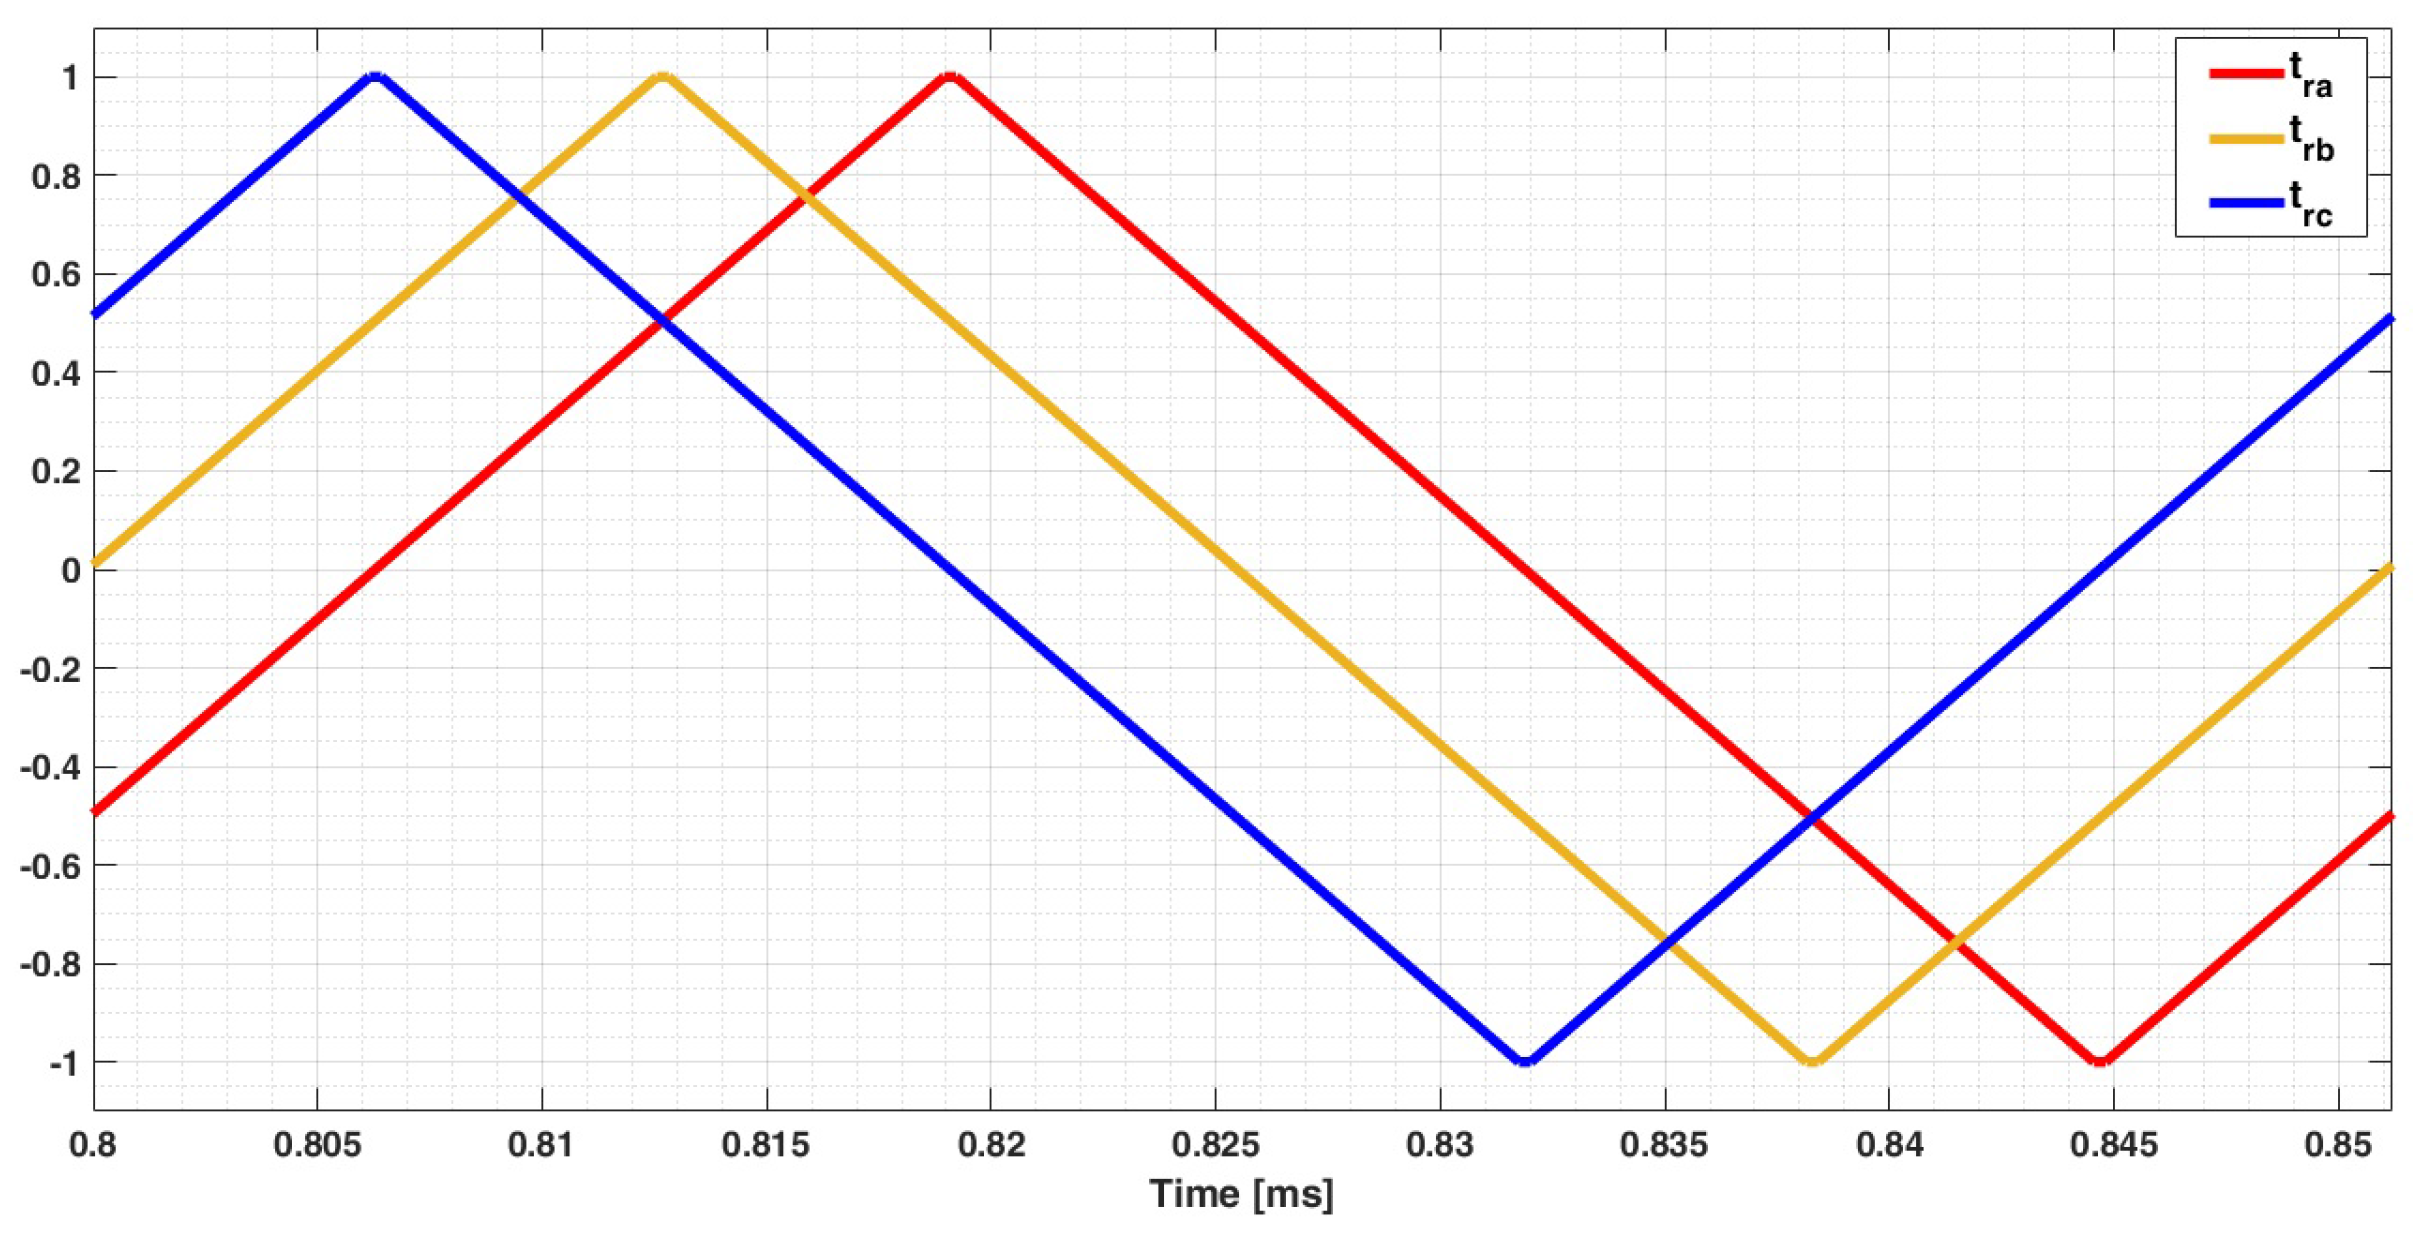
Figure 8.
Simulated results: 3-phase machine 3-phase powered: variation vs. M for different value of electric angle between voltage and current (VI-phase).
Figure 8.
Simulated results: 3-phase machine 3-phase powered: variation vs. M for different value of electric angle between voltage and current (VI-phase).

Figure 9.
Simulated results triple-3-phase machine: for different displacement between PWM carriers signals () and different V-I phases. At , there is the larger variation of as function of .
Figure 9.
Simulated results triple-3-phase machine: for different displacement between PWM carriers signals () and different V-I phases. At , there is the larger variation of as function of .

Figure 10.
Simulated results: triple-3-phase phase machine: values of with the variation of M and . Each surface represents a different value of VI-phase.
Figure 10.
Simulated results: triple-3-phase phase machine: values of with the variation of M and . Each surface represents a different value of VI-phase.

Figure 11.
Simulated results: isolevel of greatest in p.u with respect to the rms value of the phase current worst case vs. for all M value. The different figure represents the locus of the greatest values for a specific operating range.
Figure 11.
Simulated results: isolevel of greatest in p.u with respect to the rms value of the phase current worst case vs. for all M value. The different figure represents the locus of the greatest values for a specific operating range.
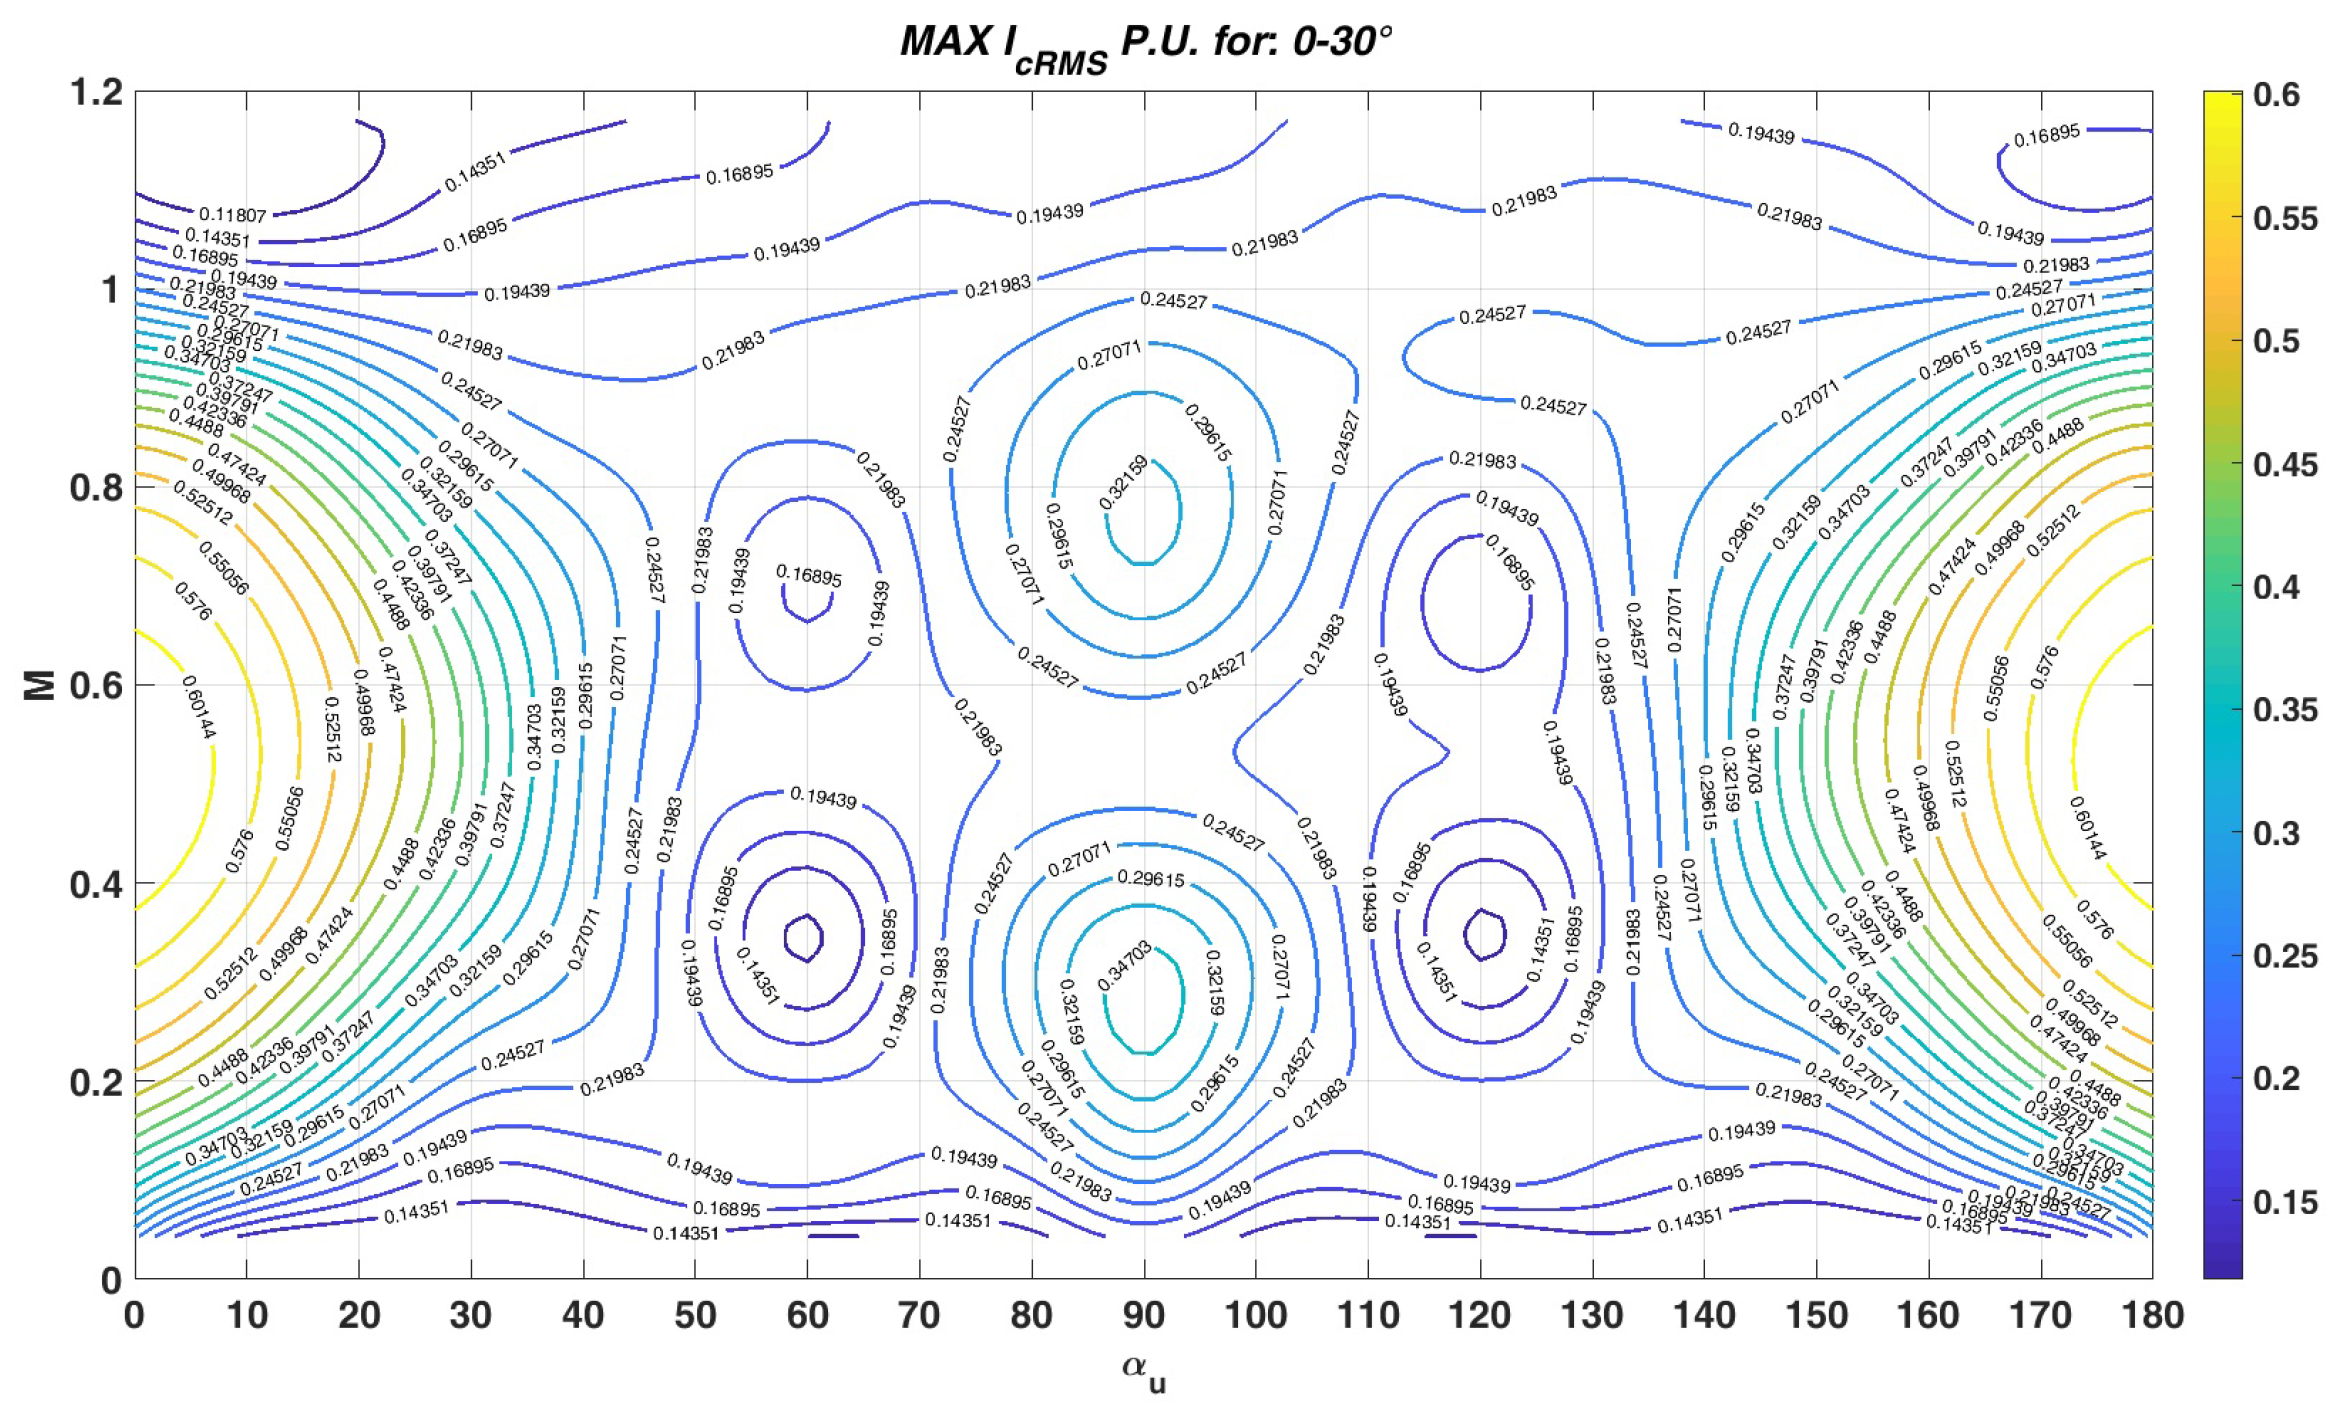
Figure 12.
Simulated results: Isolevel of greatest in p.u respect to the rms value of the phase current worst case vs. for all M value. The different figure represent the locus of the greatest values for a specific operating range.
Figure 12.
Simulated results: Isolevel of greatest in p.u respect to the rms value of the phase current worst case vs. for all M value. The different figure represent the locus of the greatest values for a specific operating range.

Figure 13.
Simulated results: triple-3-phase phase machine: worst case vs. for all M value. The different curves represent the maximum values for different V-I phases.
Figure 13.
Simulated results: triple-3-phase phase machine: worst case vs. for all M value. The different curves represent the maximum values for different V-I phases.
Figure 14.
Simulated results: triple-3-phase machine: worst case vs. for all M/VI-phase combinations including in fault conditions.
Figure 14.
Simulated results: triple-3-phase machine: worst case vs. for all M/VI-phase combinations including in fault conditions.

Figure 15.
Experimental setup: three 3-phase motors, the control board and the power section with two triple-3-phase converter.
Figure 15.
Experimental setup: three 3-phase motors, the control board and the power section with two triple-3-phase converter.

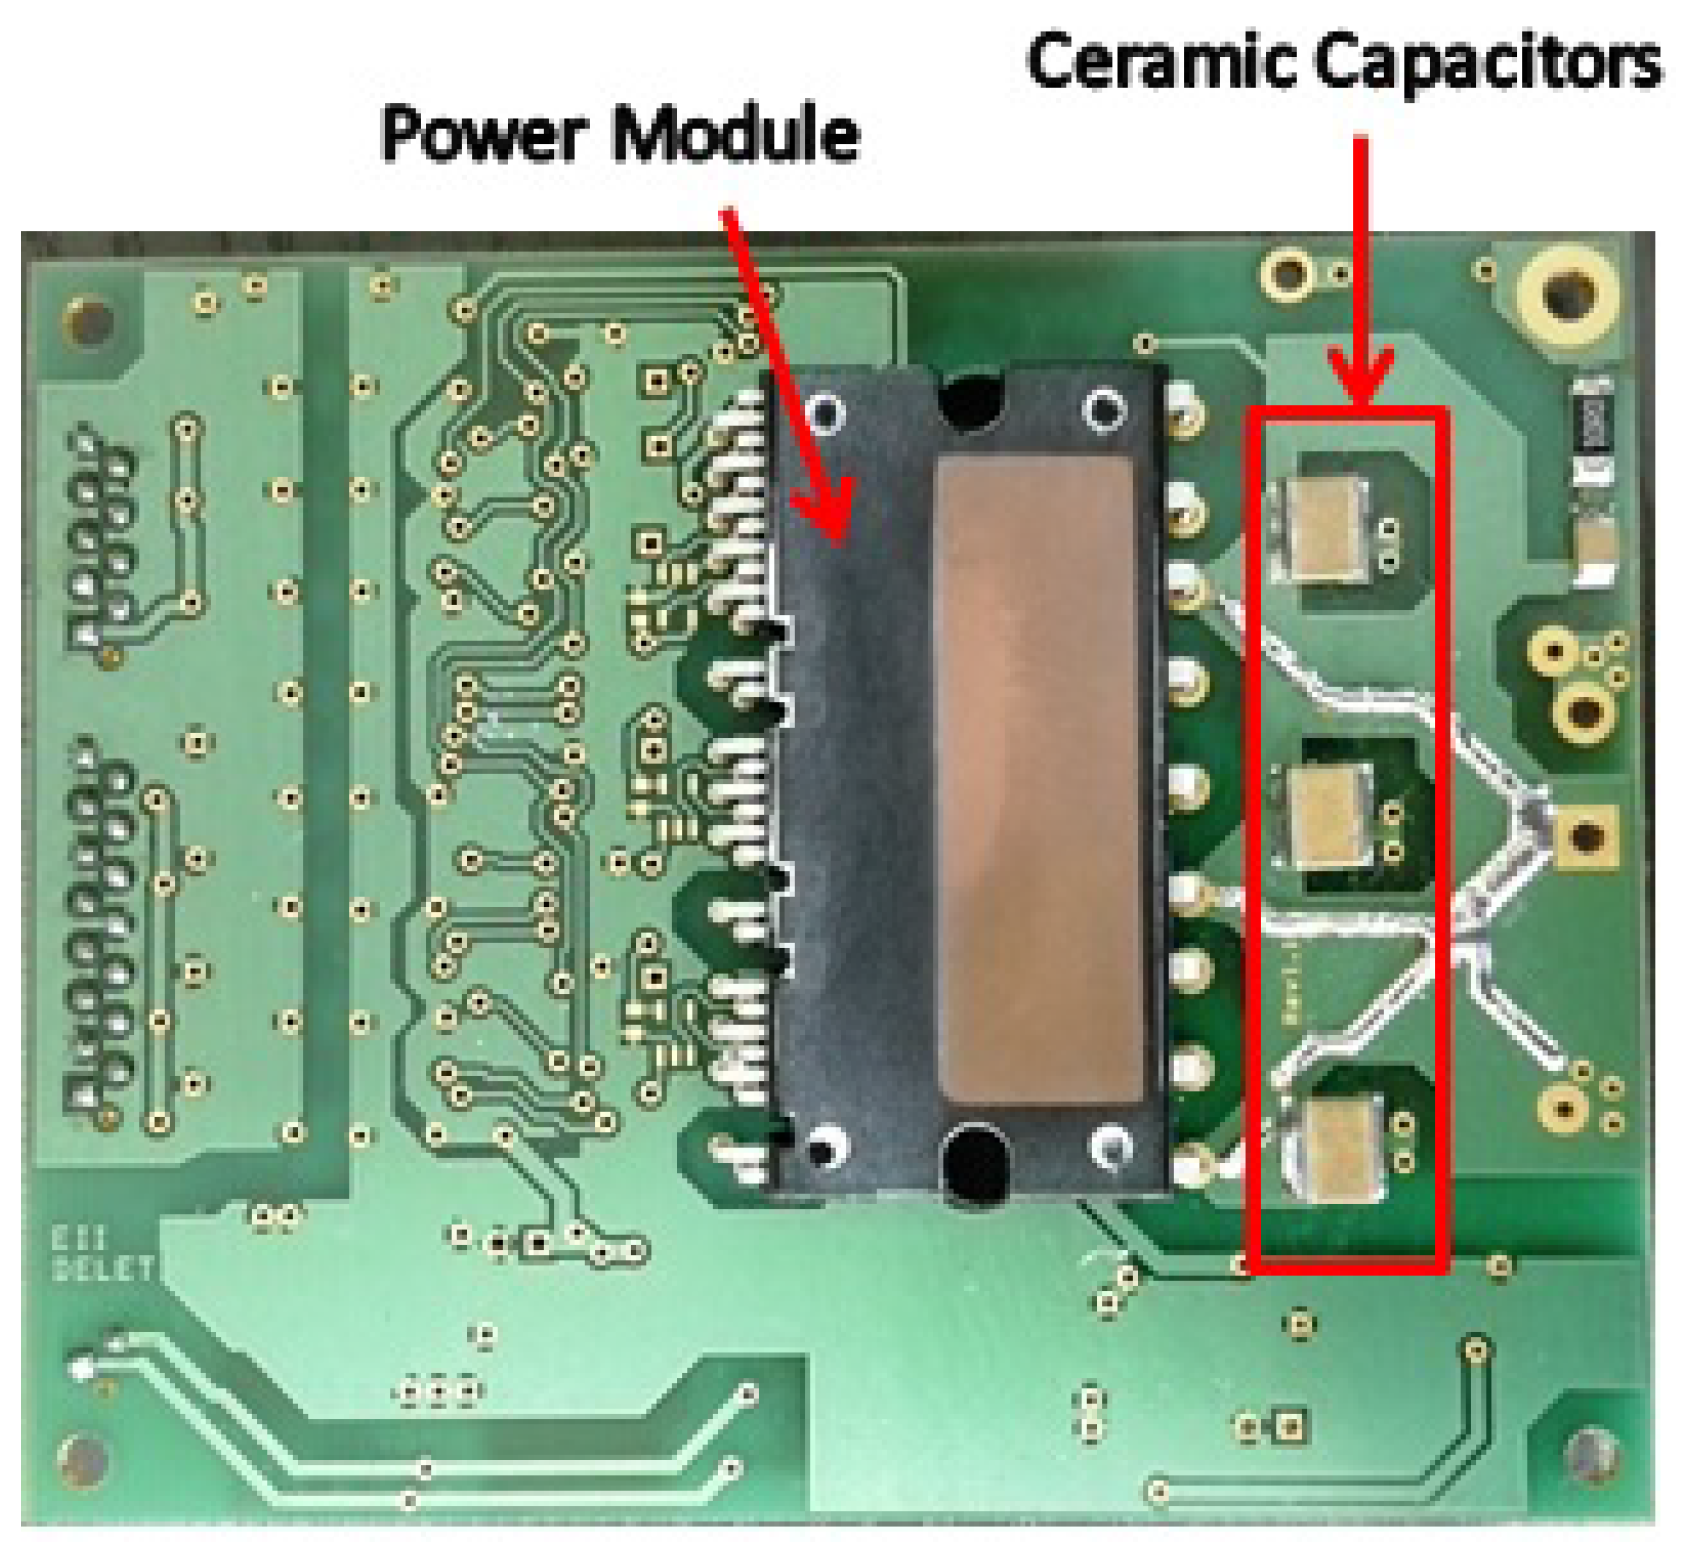
Figure 16.
3-phase module: in the picture, the Intelligent Power Module (IPM) and the ceramic capacitors introduced in order to reduce the commutation path are highlighted.
Figure 16.
3-phase module: in the picture, the Intelligent Power Module (IPM) and the ceramic capacitors introduced in order to reduce the commutation path are highlighted.

Figure 17.
Triple-3-phase converter IGBT based including parassitic inductance , commutation path capacitors , DC-link connecting cable resistance and inductance .
Figure 17.
Triple-3-phase converter IGBT based including parassitic inductance , commutation path capacitors , DC-link connecting cable resistance and inductance .
Figure 18.
Each picture shows values for different and different couples of M and VI-phase. The blue line is the simulated for triple-3-phase converter in Figure 4, the green line is the simulated considering a model of the triple-3-phase converter used in the laboratory setup with estimated concentrated resonance parameters, and the red line is the measured evolution of with the laboratory setup.

Figure 19.
worst case for variation for considered couples of M and V-I phases values. The blue line is the simulated for triple-3-phase converter in Figure 4, the green line is the simulated considering a model of the triple-3-phase converter used in the laboratory setup with estimated concentrated resonance parameters, and the red line is the measured evolution of with the laboratory setup.
Figure 20.
Experimental setup: triple 3-phase motors, the control board and the power section with one triple-3-phase converter.
Figure 20.
Experimental setup: triple 3-phase motors, the control board and the power section with one triple-3-phase converter.
Figure 21.
Measurement of the current (blue) and the corresponding modulation index (red) for a single phase. In yellow and green, the corresponding first harmonic of the waves is reported.
Figure 21.
Measurement of the current (blue) and the corresponding modulation index (red) for a single phase. In yellow and green, the corresponding first harmonic of the waves is reported.

Figure 22.
Each picture shows values for different and different couples of M and VI-phase. The blue line is the simulated for triple-3-phase converter in Figure 4, the green line is the simulated considering a model of the triple-3-phase converter used in the laboratory setup with estimated concentrated resonance parameters, and the red line is the measured evolution of with the laboratory setup.


Table 1.
Differences among solutions.
| Solution | |||
|---|---|---|---|
| I | 1 | 1 | 1 |
| II | 1 | 1 | |
| III | 1.04 | 2 |
Table 2.
Induction machine data.
| Characteristics | Value |
|---|---|
| Poles | 2 |
| Nominal Current rms | 3.2 A |
| Nominal Voltage rms | 190 V |
| Speed Max | 17.900 rpm |
Table 3.
9-phase motor data.
| Characteristic | Value |
|---|---|
| Poles | 10 |
| Nominal Current rms | 16 A |
| Nominal Voltage rms | 400 V |
| Speed Max | 8.000 rpm |
© 2018 by the authors. Licensee MDPI, Basel, Switzerland. This article is an open access article distributed under the terms and conditions of the Creative Commons Attribution (CC BY) license (http://creativecommons.org/licenses/by/4.0/).
Share and Cite
MDPI and ACS Style
Diana, M.; Ruffo, R.; Guglielmi, P. PWM Carrier Displacement in Multi-N-Phase Drives: An Additional Degree of Freedom to Reduce the DC-Link Stress. Energies 2018, 11, 443. https://doi.org/10.3390/en11020443
AMA Style
Diana M, Ruffo R, Guglielmi P. PWM Carrier Displacement in Multi-N-Phase Drives: An Additional Degree of Freedom to Reduce the DC-Link Stress. Energies. 2018; 11(2):443. https://doi.org/10.3390/en11020443
Chicago/Turabian StyleDiana, Michela, Riccardo Ruffo, and Paolo Guglielmi. 2018. "PWM Carrier Displacement in Multi-N-Phase Drives: An Additional Degree of Freedom to Reduce the DC-Link Stress" Energies 11, no. 2: 443. https://doi.org/10.3390/en11020443
Note that from the first issue of 2016, this journal uses article numbers instead of page numbers. See further details here.