Thermal Assessment of a Novel Combine Evaporative Cooling Wind Catcher

School of Architecture, National Technical University of Athens, Section III, 42 Patission Av., 10682 Athens, Greece
*
Author to whom correspondence should be addressed.
Energies 2018, 11(2), 442; https://doi.org/10.3390/en11020442
Submission received: 5 January 2018
/
Revised: 6 February 2018
/
Accepted: 13 February 2018
/
Published: 15 February 2018
(This article belongs to the Special Issue Building Energy Use: Modeling and Analysis)
Abstract
:Wind catchers are one of the oldest cooling systems that are employed to provide sufficient natural ventilation in buildings. In this study, a laboratory scale wind catcher was equipped with a combined evaporative system. The designed assembly was comprised of a one-sided opening with an adjustable wetted pad unit and a wetted blades section. Theoretical analysis of the wind catcher was carried out and a set of experiments were organized to validate the results of the obtained models. The effect of wind speed, wind catcher height, and mode of the opening unit (open or closed) was investigated on temperature drop and velocity of the moving air through the wind catcher as well as provided sensible cooling load. The results showed that under windy conditions, inside air velocity was slightly higher when the pad was open. Vice versa, when the wind speed was zero, the closed pad resulted in an enhancement in air velocity inside the wind catcher. At wind catcher heights of 2.5 and 3.5 m and wind speeds of lower than 3 m/s, cooling loads have been approximately doubled by applying the closed-pad mode.
1. Introduction
Wind catchers are small towers with heights between 5 and 33 m raised from the roof of the buildings. They serve as a cooling system to provide favorable ventilation and pleasant interior environment with low energy technologies. Wind catchers are commonly constructed in the majority of hot and dry or humid regions [1,2]. A wind catcher usually consists of a chimney, stalk, catgut, chain, and shelf [3]. It works under the influence of two driving forces: buoyant force, which is due to the temperature difference, and external winds [4].
In hot-arid climate, the ambient air is usually hot, dry, and there is often dust and sand in it. This makes the unprocessed air insufferable [5]. In traditional wind catchers, the air passing over the water surfaces, like porous pots, pond, etc., was used for improving natural cooling and air conditioning. Such systems retain a balance between the two important parameters of evaporative cooling and ventilation. The concept works based on the absorption of the relatively large amount of energy needed for evaporation of water from the air at the vicinity of the wetted surface. This leads to a reduction in temperature and an increase in density of the air that subsequently results in the downward movement of the fresh air through the wind catcher [6]. Lack of control over the water evaporation process was the major drawback of the system.
Several researchers have analyzed various designs of wind catchers. Montazeri et al. [7] demonstrated that the maximum performance obtained at the air incident angle of 90°. Awbi et al. [8] showed that the efficiency of four-sided wind catchers were much higher than that of the circular ones at the same wind speed. Dehnavi et al. [9] found the most efficient form of the squared wind catchers for decreasing the indoor air temperature were those equipped with the plus blades. Ghadiri et al. [10] concluded that the height of wind catcher influenced the ventilation rate and volumetric flow rate at the different opening ratios of the wind catcher.
Engelmann et al. [11] tried to simulate a typical office building to investigate the potential of different ventilations and cooling strategies. Some other researches have studied wind catchers equipped with evaporative cooling systems. Bahadori [12] introduced two new designs of the wind catchers including wind catchers with wetted columns and those with wetted surfaces. Goudarzi et al. [13] studied a new design of wind catcher constructed from a four-quadrant-peak wind-catcher rooftop, nozzles, and turbines. Kalantar [14] experimentally and numerically studied the cooling performance of a wind catcher with water sprayers on top in a hot and dry region. Haghighi et al. [15] evaluated the performance of a wind catcher coupled with shower cooling system. Saffari et al. [16] carried out a numerical study on the wind catcher consisting of wetted curtains hung in the column. Elzaidabi [17] constructed an indirect evaporative cooler system by combining a modified wind catcher and a diamond-shaped psychometric energy core (PEC) unit. Pearlmutter et al. [18] developed a multi-stage down-draft evaporative cool tower (DECT).
A survey of the literature reveals the acceptable level of indoor comfort and savings in energy using the wind catcher integrated evaporative cooling system (WCIECS). However, optimal operation of some of these wind catchers have been limited to only when the wind speed was low or very high [12]. Furthermore, from the architectural point of view, some of them have had less of a resemblance to those of traditional buildings. For this reason, the present research proposed a novel traditional wind catcher equipped with wetted blades and an adjustable opening pad. Governing expressions of the designed wind catcher were developed using the thermodynamic laws and a set of experiments were conducted to verify the obtained models.
2. Wind Catcher Description
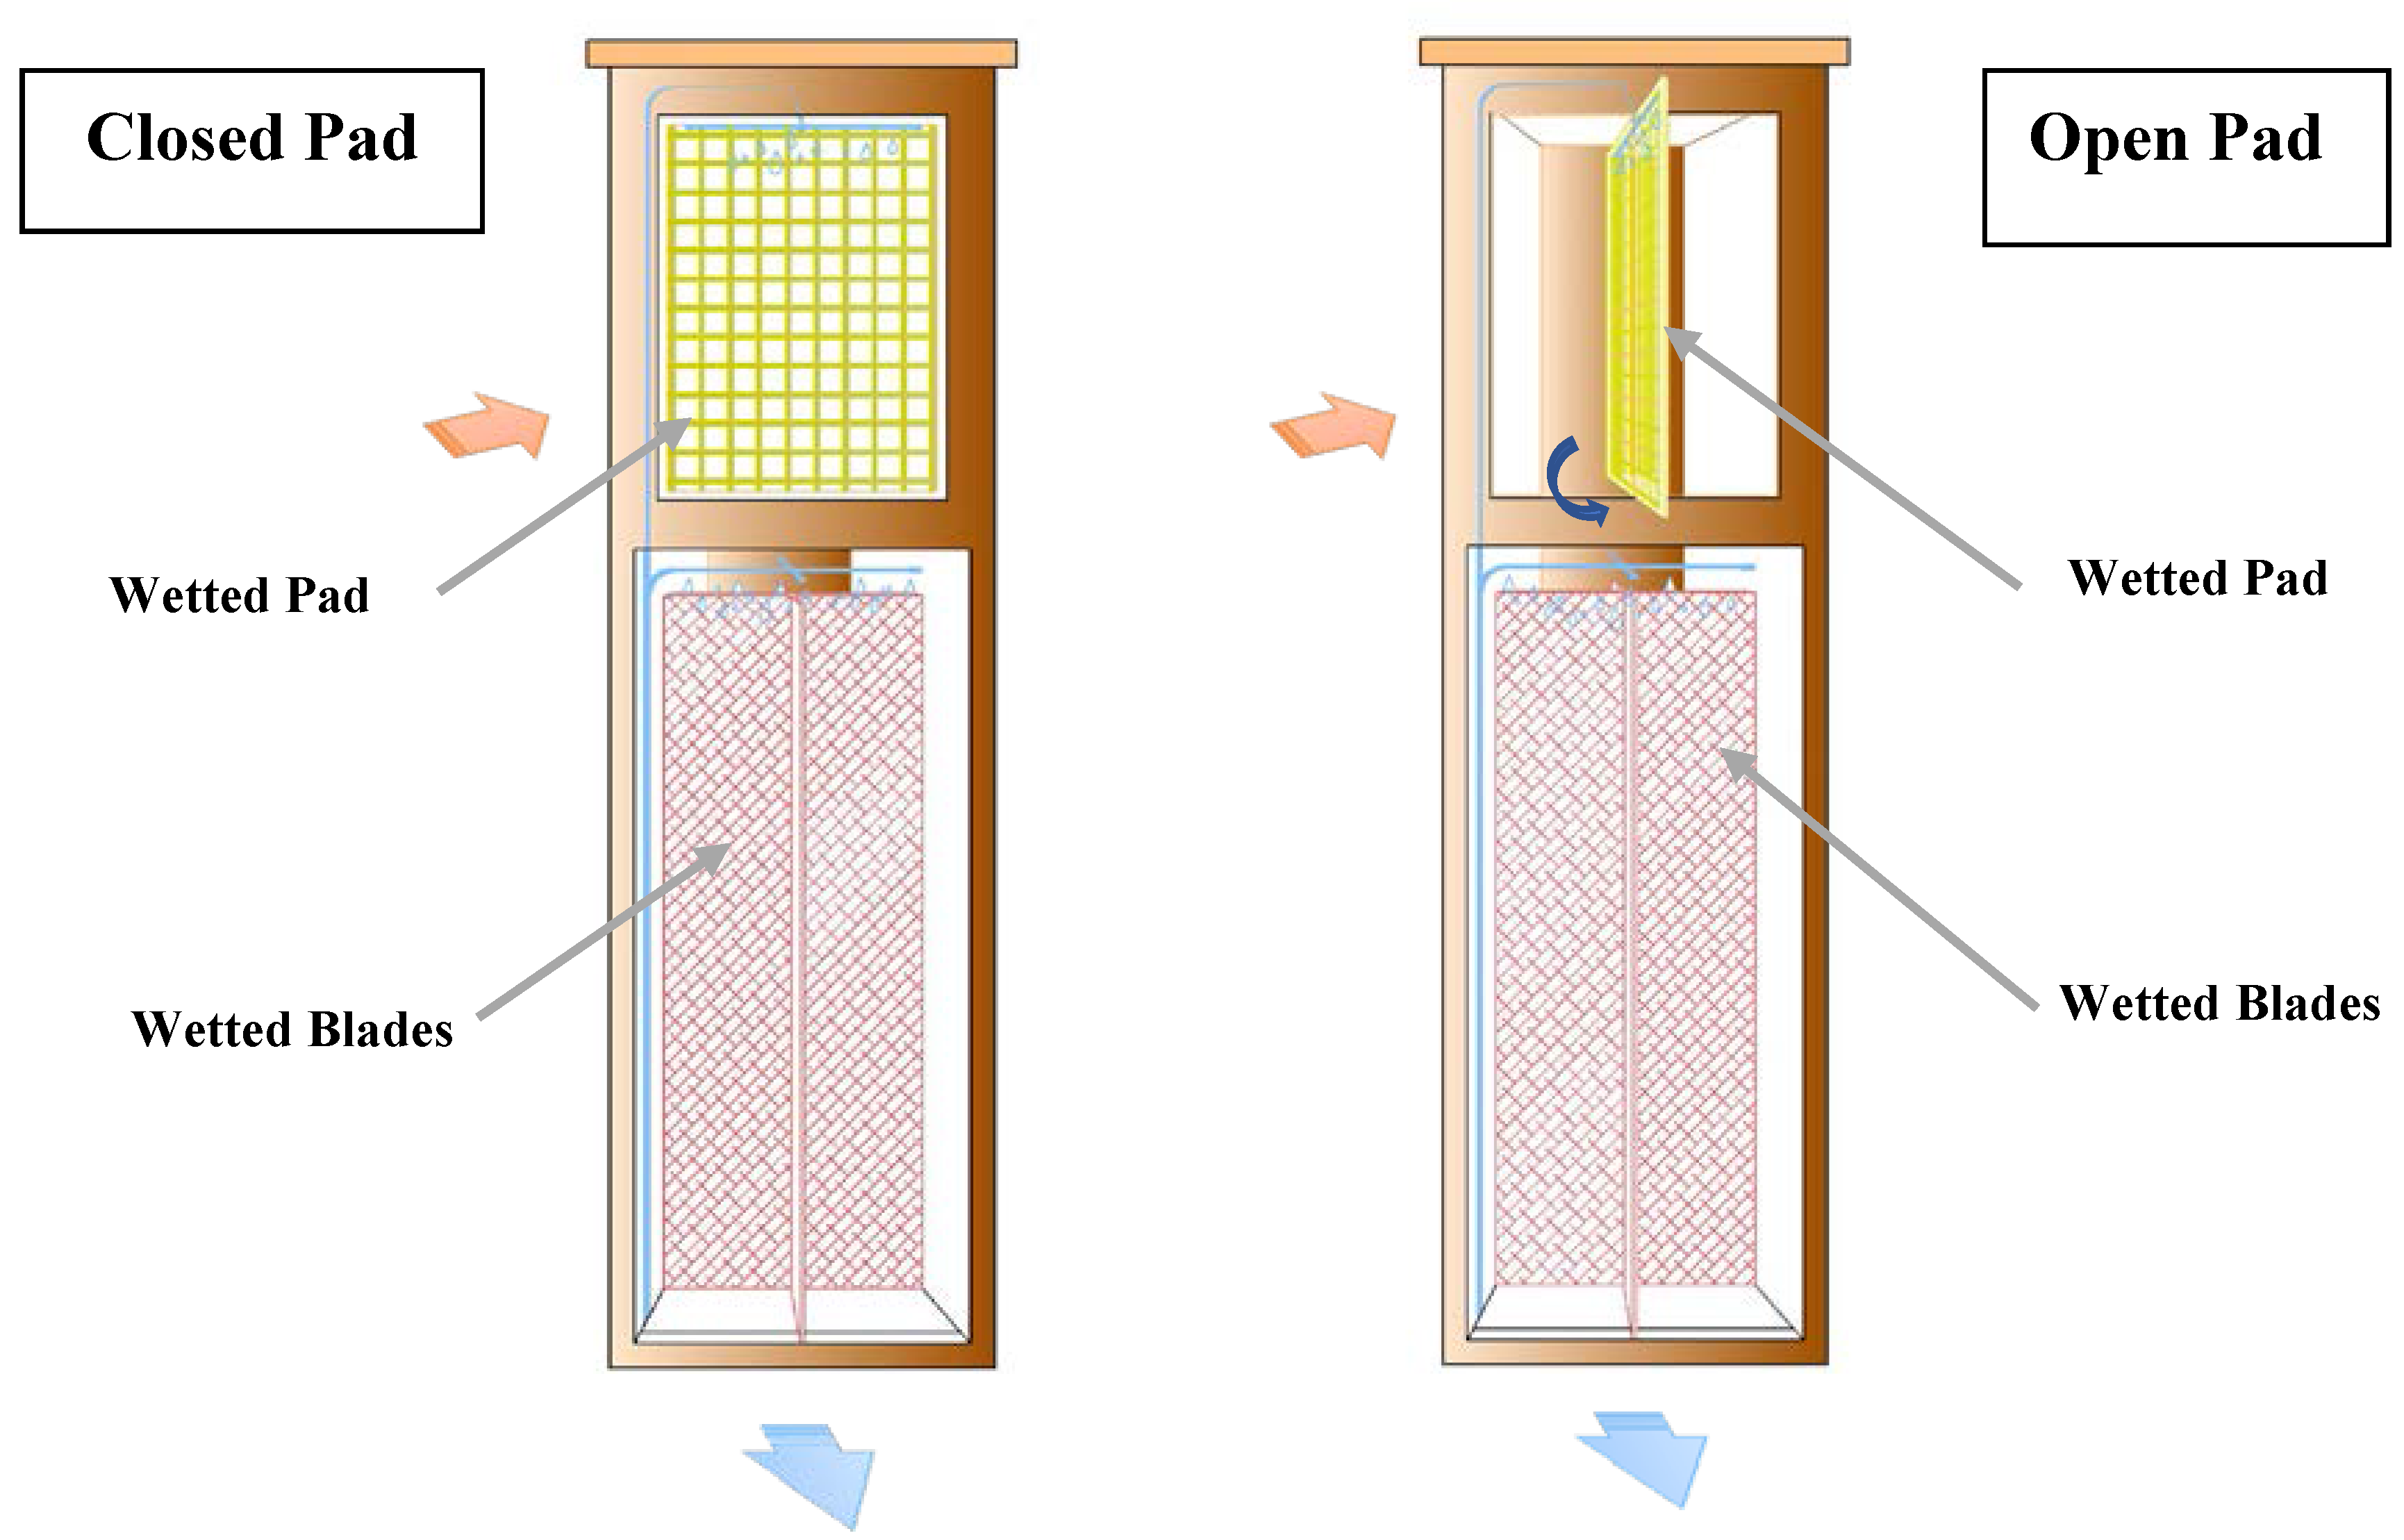
The designed device is a unidirectional wind system that was equipped with two evaporative cooling parts. A prototype of the assembly was shown Figure 1. The construction has a foursquare cross section and its dimensions have been determined according to the previous works [12,19]. It is comprised of a head, which is the upper part of the structure and includes two parts of an opening and hinged evaporative cooling unit. The hinged pad works like a filter and is soaked by water sprayers placed on its top. Moreover, it can manually be opened or closed in a swinging motion based on the wind speed. The roof of the wind catcher is flat [19].
The column, the middle part of the wind catcher, consists of number of vertical cloth curtains as the wetted blades section. Blades have been suspended from the bottom of the head and is extended to the air distribution window. Water spraying pipes have been applied to sprinkle water on some of the blades. The excess water is collected in a pool located at the bottom for re-pumping to the system. A window, which is deployed at the bottom part of the column, distributes the fresh and cold air (comes from the wind catcher) into the building.
Different types of wind catcher functions based on the natural forces of wind pressure and stacks work to direct the air through buildings. When wind speed is suitable, air pressure on the opening face to the wind is positive while the leeward opening meets a negative pressure. Air enters the wind catcher through the opening with positive pressure and forced out through the opening with negative pressure. Therefore, wind catcher acts as a ventilator in which the fresh air is taken into the building and the hot and polluted air is discharged [4]. The proposed system is a one-sided wind catcher that is orientated to capture favorable winds. Consequently, wind speed is the most dominant driving force for moving the air through the conduit. When wind speed is almost zero, wind catchers need a driving force, caused by buoyancy effect, to operate. The pad unit and blades section are wetted by the water nozzles installed on their top. When warm air passes near the wetted pad and blades, due to the temperature difference between water and air flow, the convective heat transfer mechanism becomes active. Simultaneously, the water evaporation process reduces air temperature close to the wet-bulb temperature. Therefore, the density of the air increases leading to a pressure difference from the top to the bottom of the column. This makes an efficient flow due to the buoyancy effect.
3. Analytical Modelling
The objective of the study is to assess the temperature and humidity variations of the air flow rate through the constructed wind catcher. When the pad is closed, the air passes through the wetted straw and the water evaporation results in a reduction in temperature and an increase in relative humidity (RH) of the flowing air. On the other side, when the pad is open, the entering air flows parallel to the pad. So, the pad acts like a screen.
Temperature drop of the air when passing through the wetted straw is obtained by the following expression [20]
where is the efficiency of the straws, and are respectively dry and wet bulb temperatures of ambient air (°C), and defines the air temperature after the pads (°C). The efficiency of the pad depends on the thickness of the straw (dp) in centimeter and air speed through the pad () in meters per second as the equation
Since the evaporative cooling by the pad is assumed to be an isenthalpic process, the RH of the air after the pad given by the expression
where is the specific heat of the air (J/(kg K)), T is the dry air temperature, is the humidity ratio of the air (kg/kg), and is enthalpy of the saturated vapor at the air temperature. and which refer to the interior and exterior airflows, respectively.
In the second part, the entering air passes through the conduits. To determine temperature and RH variations of the air inside the conduit, its height is divided to smaller parts (with a length of 0.5 m) in which the wall and ambient temperatures, solar radiation, and wind speed were assumed to be constant. When the pad is open, it works like the screens inside the conduit, a similar calculation has been considered for the open pad. So it assumed as the first part of the conduit unit.
The energy balance equation for each part of the column can be written as [21,22]
where b is the area of the walls (m2), I is solar beam on the walls (W/m2), is the wall absorptivity (decimal), is the mass flow rate of the wind entering the wind catcher (kg/s), is the specific heat of the humid air (J/(kg K)), ho is convection heat transfer coefficient of ambient air (W/(m2 K)). is the latent heat of the evaporation (J/g) and the subscripts s, e, w, and n refer to the south, east, west, and north walls of the wind catcher, respectively.
The rate of the water vaporization is calculated by [23]
where is the mass transfer coefficient (g/(m2 s)), is wetted surface of the column (m2), is the humidity ratio of the saturated air at the desired temperature. is the humidity ratio of the inner air flow. Mass transfer coefficient can be expressed as
where is the inner convection heat transfer coefficient of the air (W/(m2 K)) which was given by Equation (8).
Finally, the cooling load calculated the various parts of the column as
To obtain the air velocity inside the wind catcher, we use the expression [12,20,24]
where f, L, D, Cpw, Z, vw, To, and R respectively show the friction coefficient of the conduit (dimensionless), length of the conduit (m), hydraulic diameter of the conduit (m), the pressure coefficient of wind (dimensionless), height of the wind catcher (m), wind velocity (m/s), outlet temperature of the wind catcher (°C), and the gas constant for air (J/(kg K)). stands for pressure drop in the opening pad which has been calculated using the empirical expression
4. Experimental Procedure
In order to evaluate the performance of the system under real operating conditions, and to validate the obtained analytical expressions a set of experiments were carried out during May 2017 at the campus of Bozrgmehr University, Qaen (33°43′36″ N and 59°11′04″ E) Iran. According to Köppen and Geiger, this climate has been classified as cold desert climate (BWk). The average temperature in the warmest month of the year is 27.6 °C.
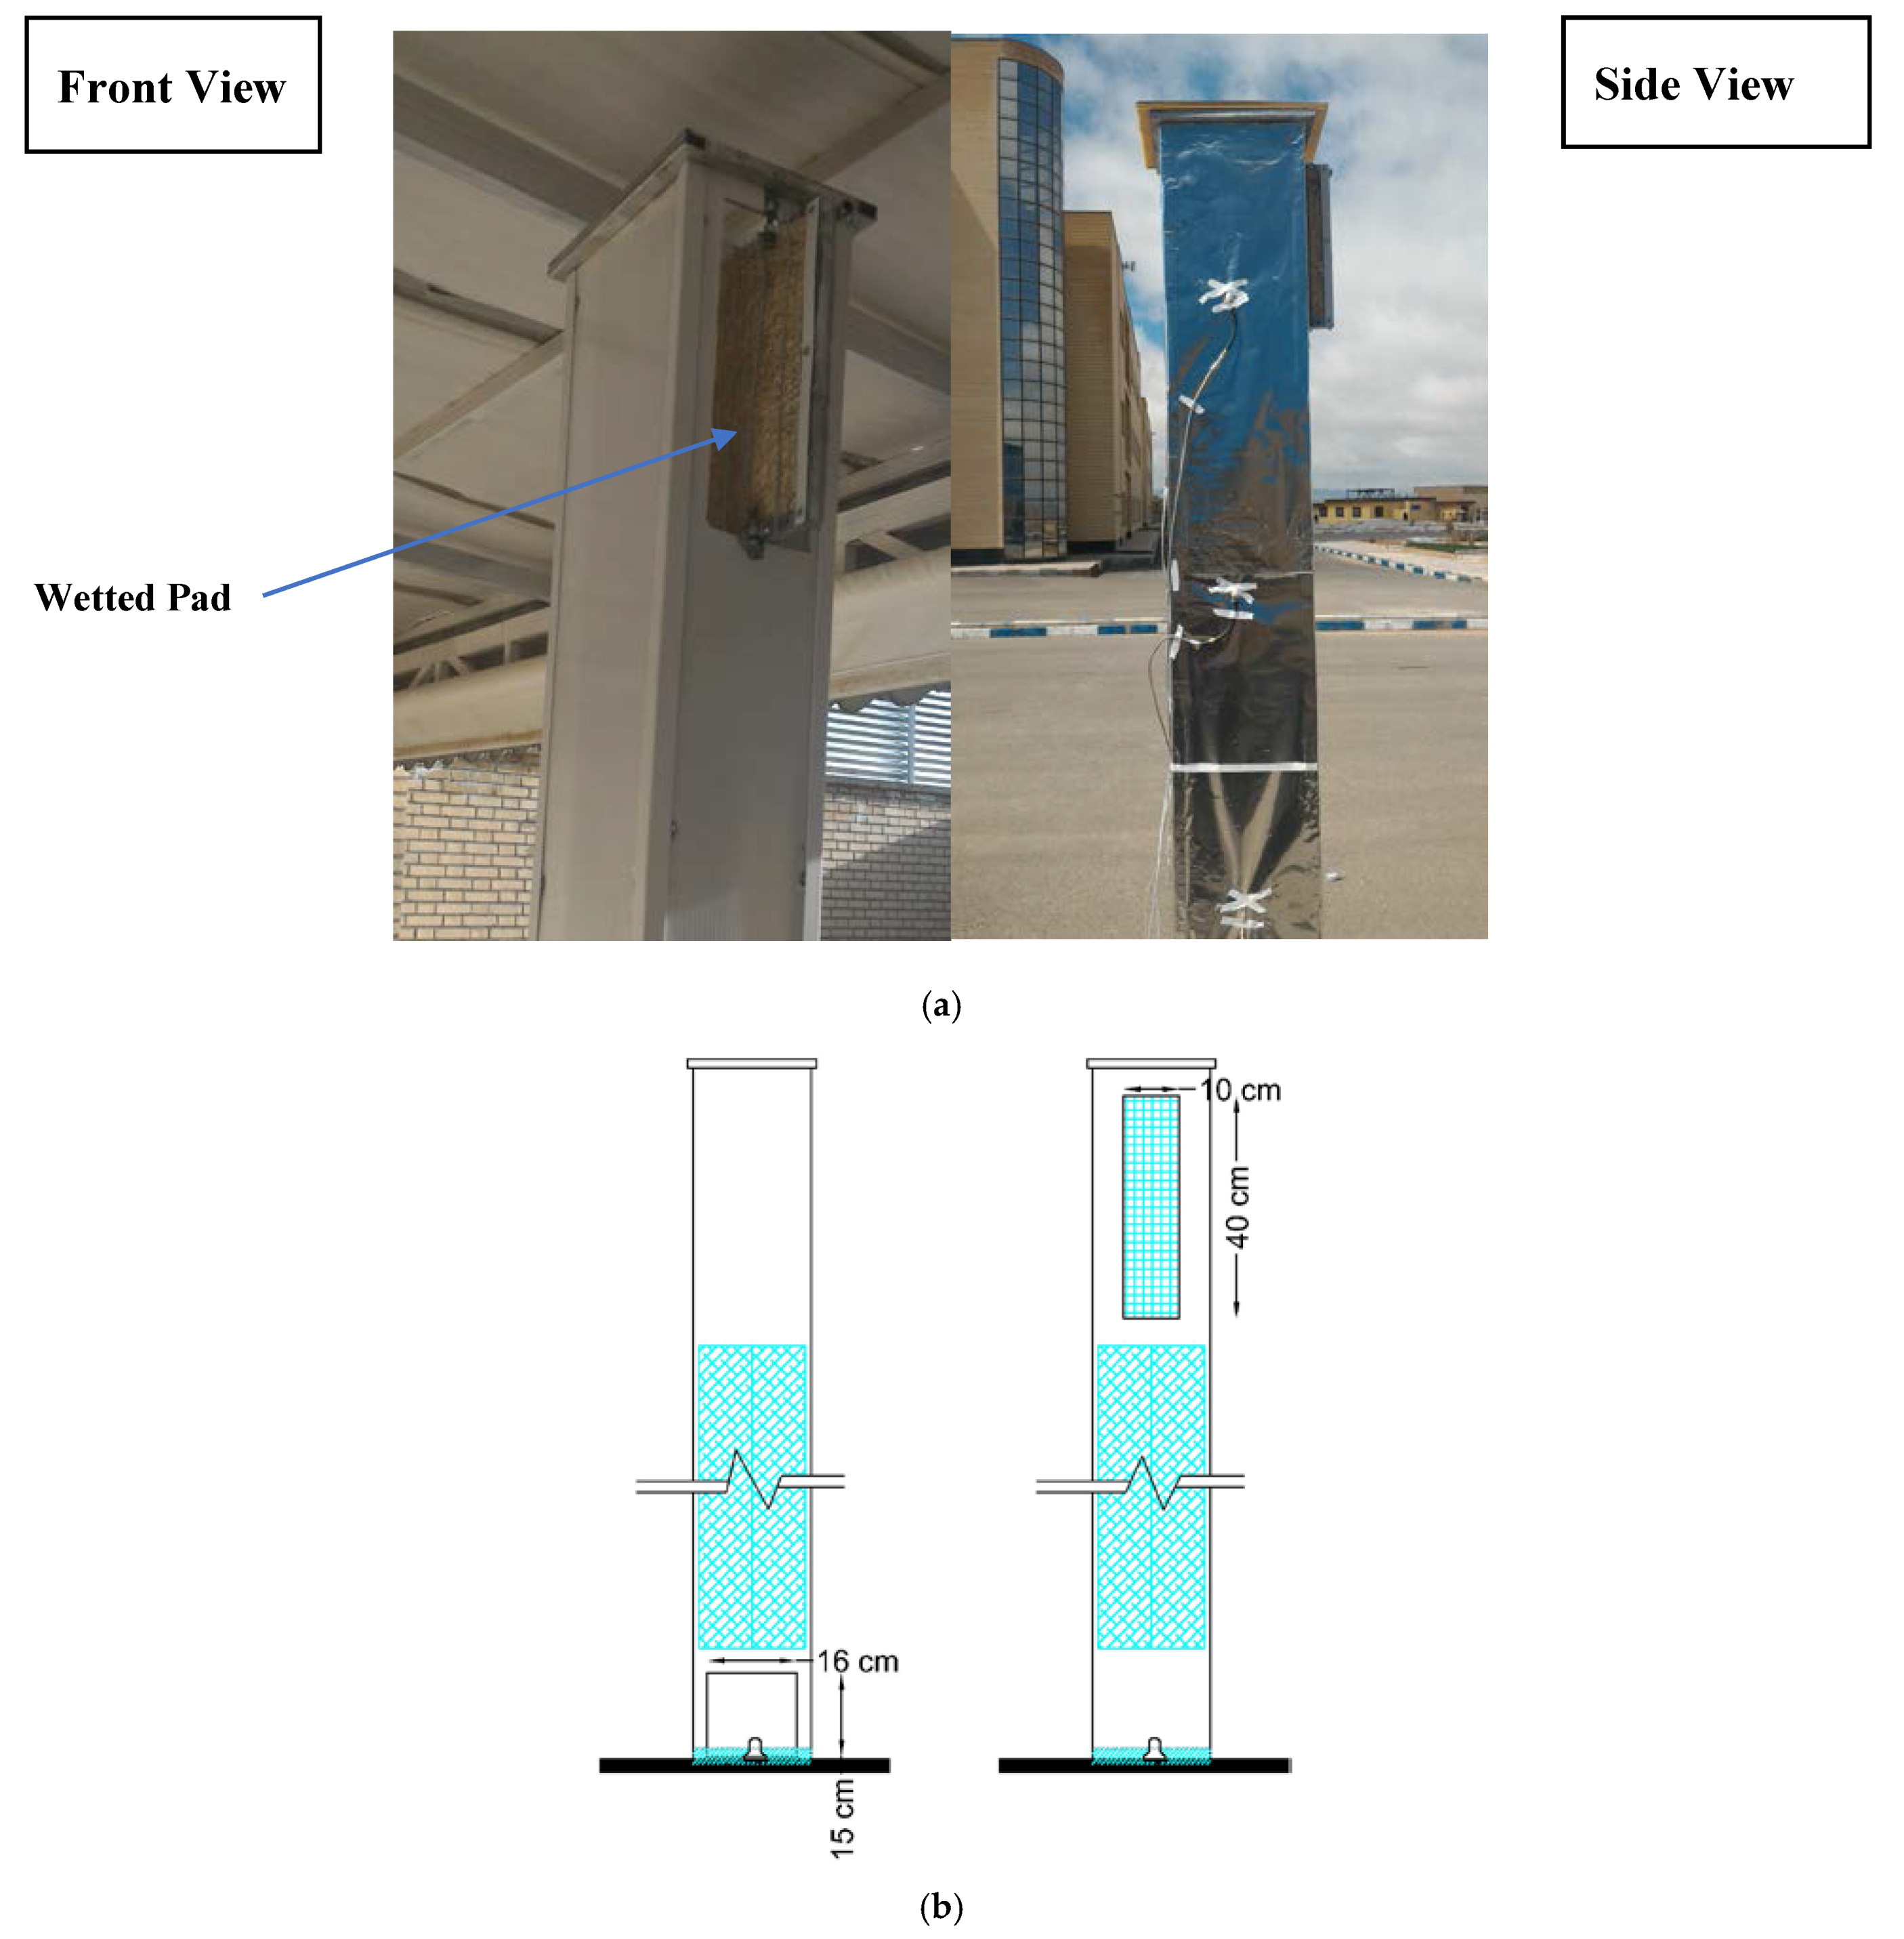
The prototype had a height of 2.5 m, cross-section of 0.20 × 0.20 m, and the air opening length of 0.40 m. Other dimensions of the wind catcher are depicted in Figure 2. The walls were constructed from polycarbonate with the thickness of 6 mm whose outer surfaces were covered by a shiny aluminum sheet to minimize solar radiation absorption. The blade section with a ‘plus shape’ configuration were made up of four gunny screens with width of 0.10 m and length of 1.80 m. The pad was installed in the air opening. A 1 cm thick straw layer was used in the construction of the pad. Drip tubing was employed to sprinkle water on the pad and the blades.
Since the wind speed was mostly changing during the test period, a blower (Pars200, Parskhazar Co., Tehran, Iran) with an adjustable rotary speed of the rotor was utilized to provide a constant air velocity inside the wind catcher’s conduit. The tests were conducted at three levels of wind velocity through the conduit (1, 1.5, 2.5 m/s) and the wetted pad remained close during the tests.
Five temperature sensors (SMT160, Tika Co., Tehran, Iran) were used to measure temperatures of the inlet, outlet, and outer surfaces of the walls of the wind catcher as well as ambient. The sensors were connected to a personal computer by means of a temperature transmitter (TM 1323, Tika Co., Tehran, Iran). A solar power meter (TES 1333, TES Co., Taipei, Taiwan) was utilized to measure solar radiation intensity on south and east walls. Relative humidity (RH) of ambient air, the inlet, and the outlet of the wind catcher were determined using RH sensors (SUN-25H, SUNWARD Co., Tehran, Iran). Each test was conducted from 9 a.m. to 3 p.m., and the useful data were recorded at 30 min time intervals of during the day.
5. Experimental Validation
To verify the obtained expressions, the results of the models were compared with those of experiments using the Pearson correlation coefficient (r), the root mean square deviation (e) and the mean absolute error (MAE) criteria which were determined as [25,26]
and
where , Xi and Yi are respectively the ith theoretical and empirical data; and N is the number of observations.
6. Result and Discussion
6.1. Model Verification
To verify the obtained models, the predicted data of outlet temperature and relative humidity were compared with those observed by the experiments. After that, the effect of some design parameters and operating conditions on the performance of the designed wind catcher was investigated using the validated models.
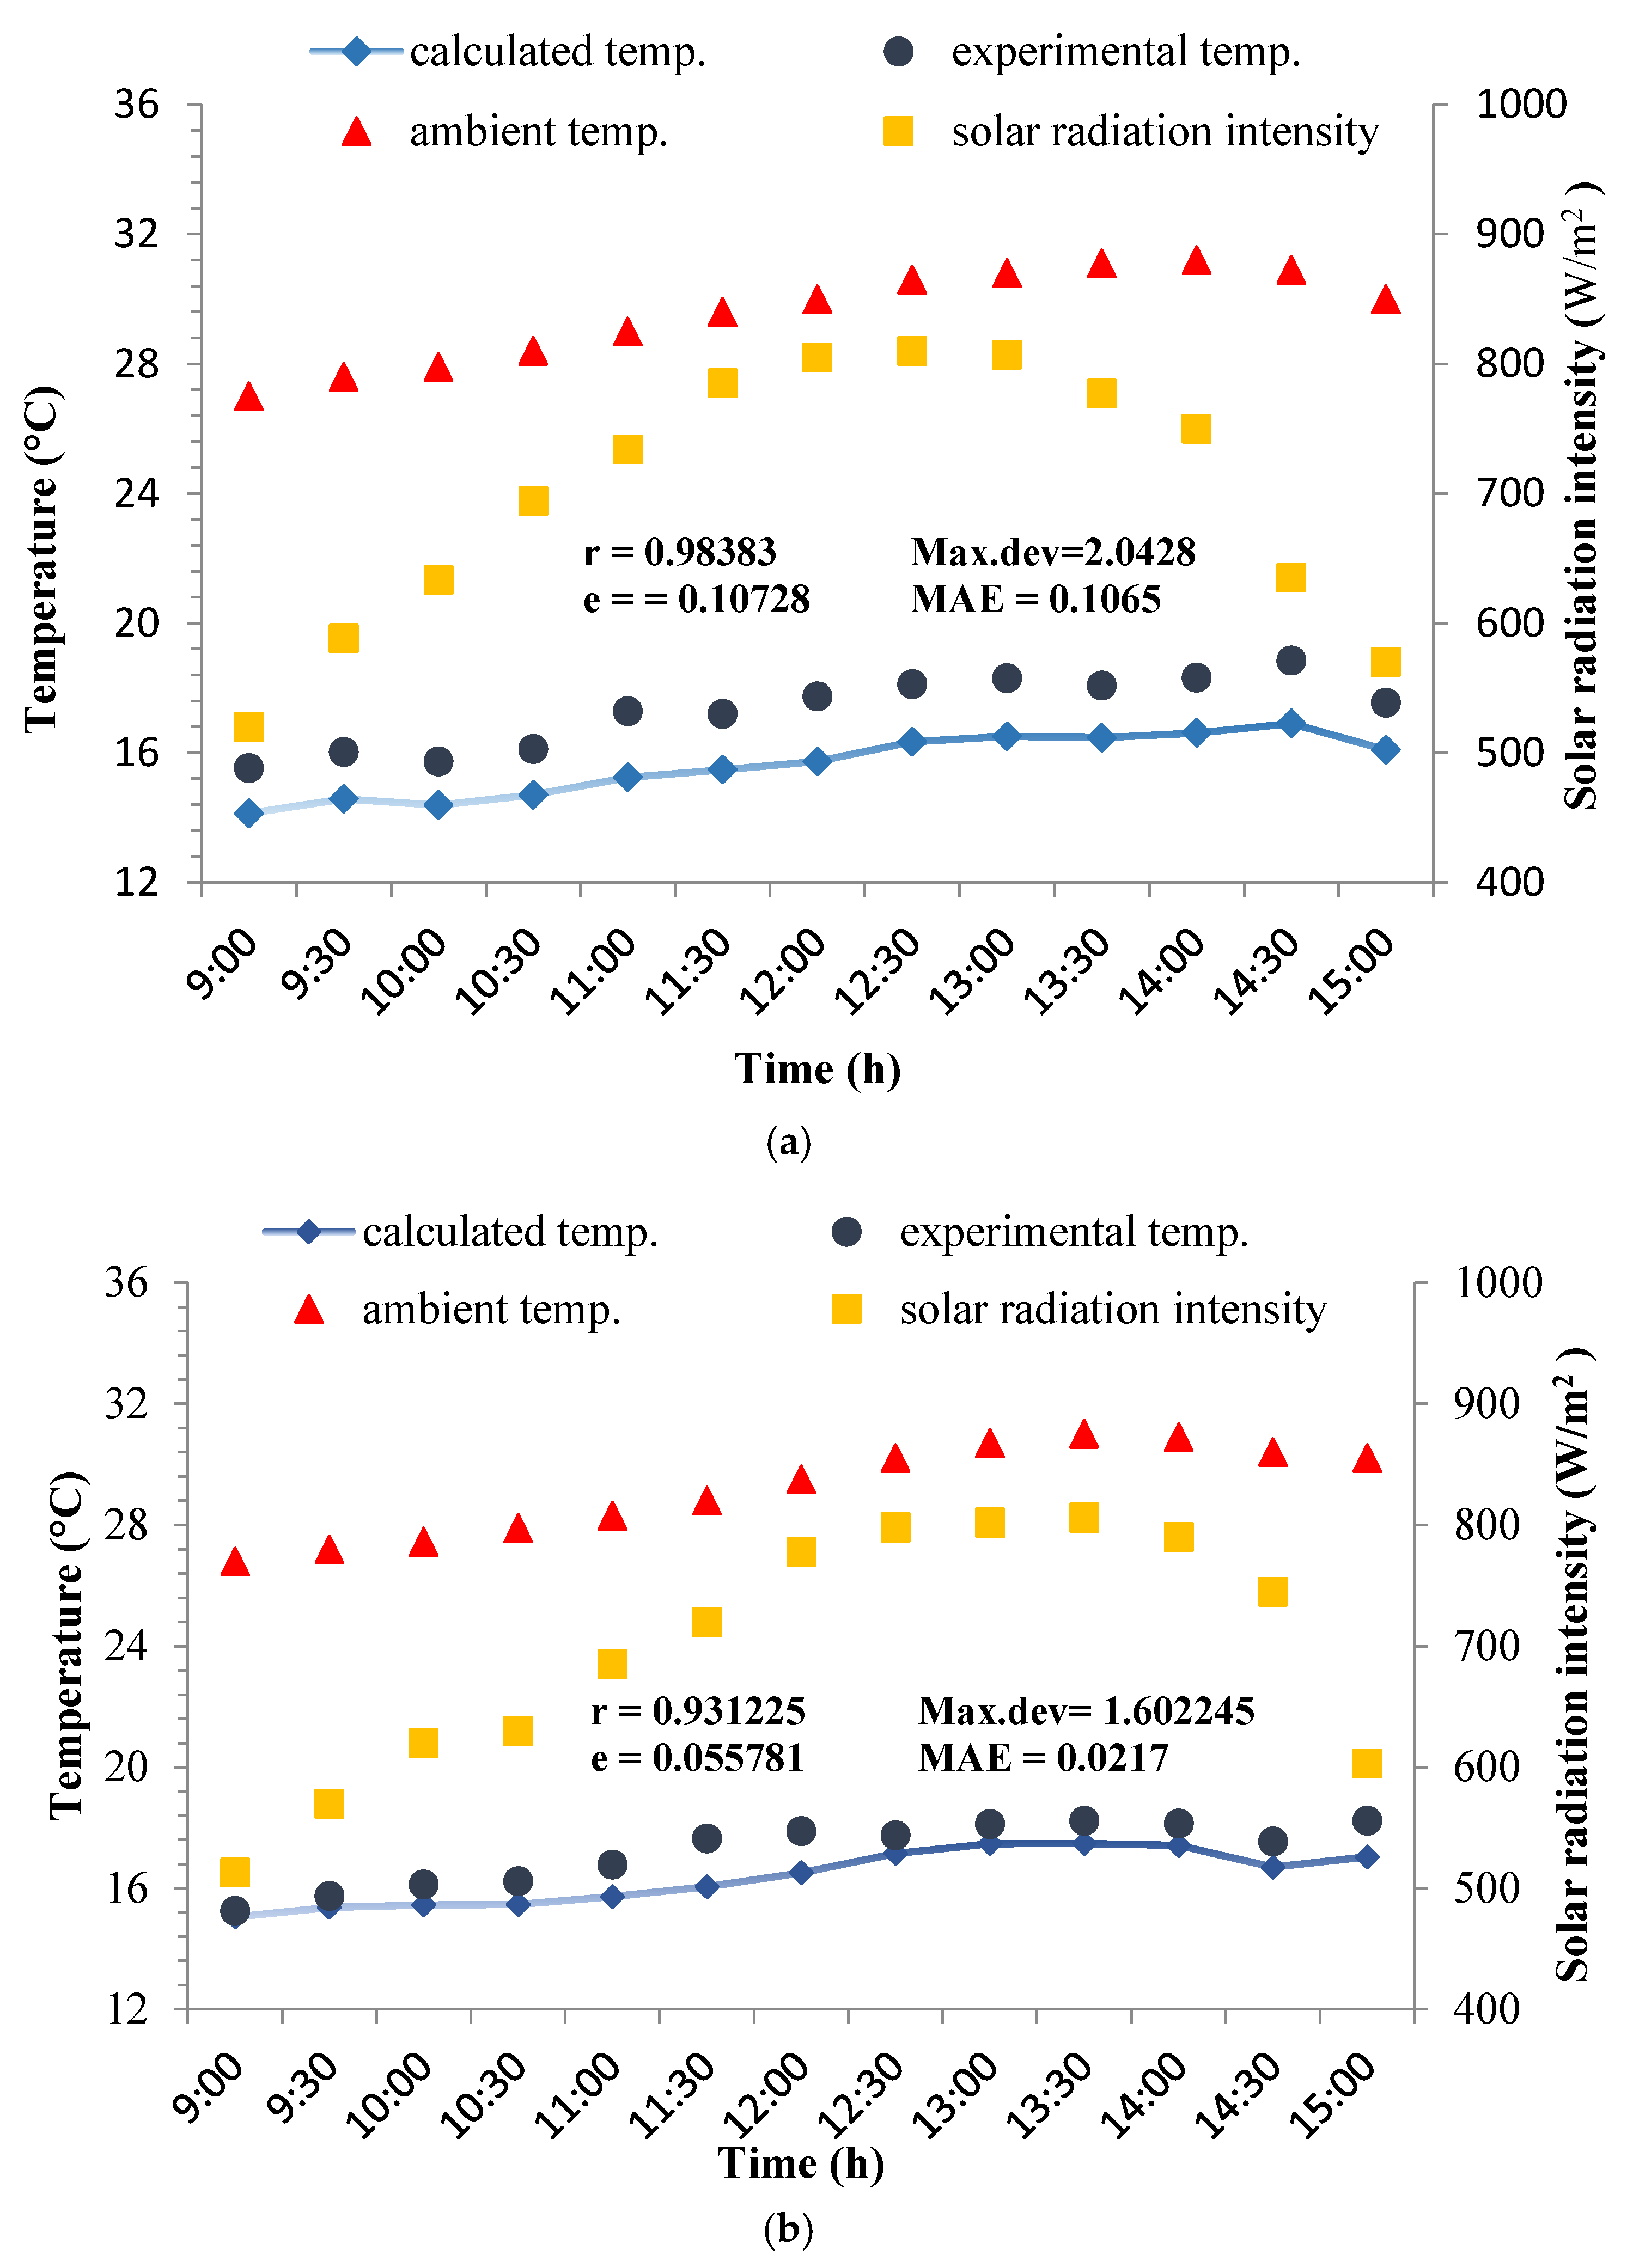
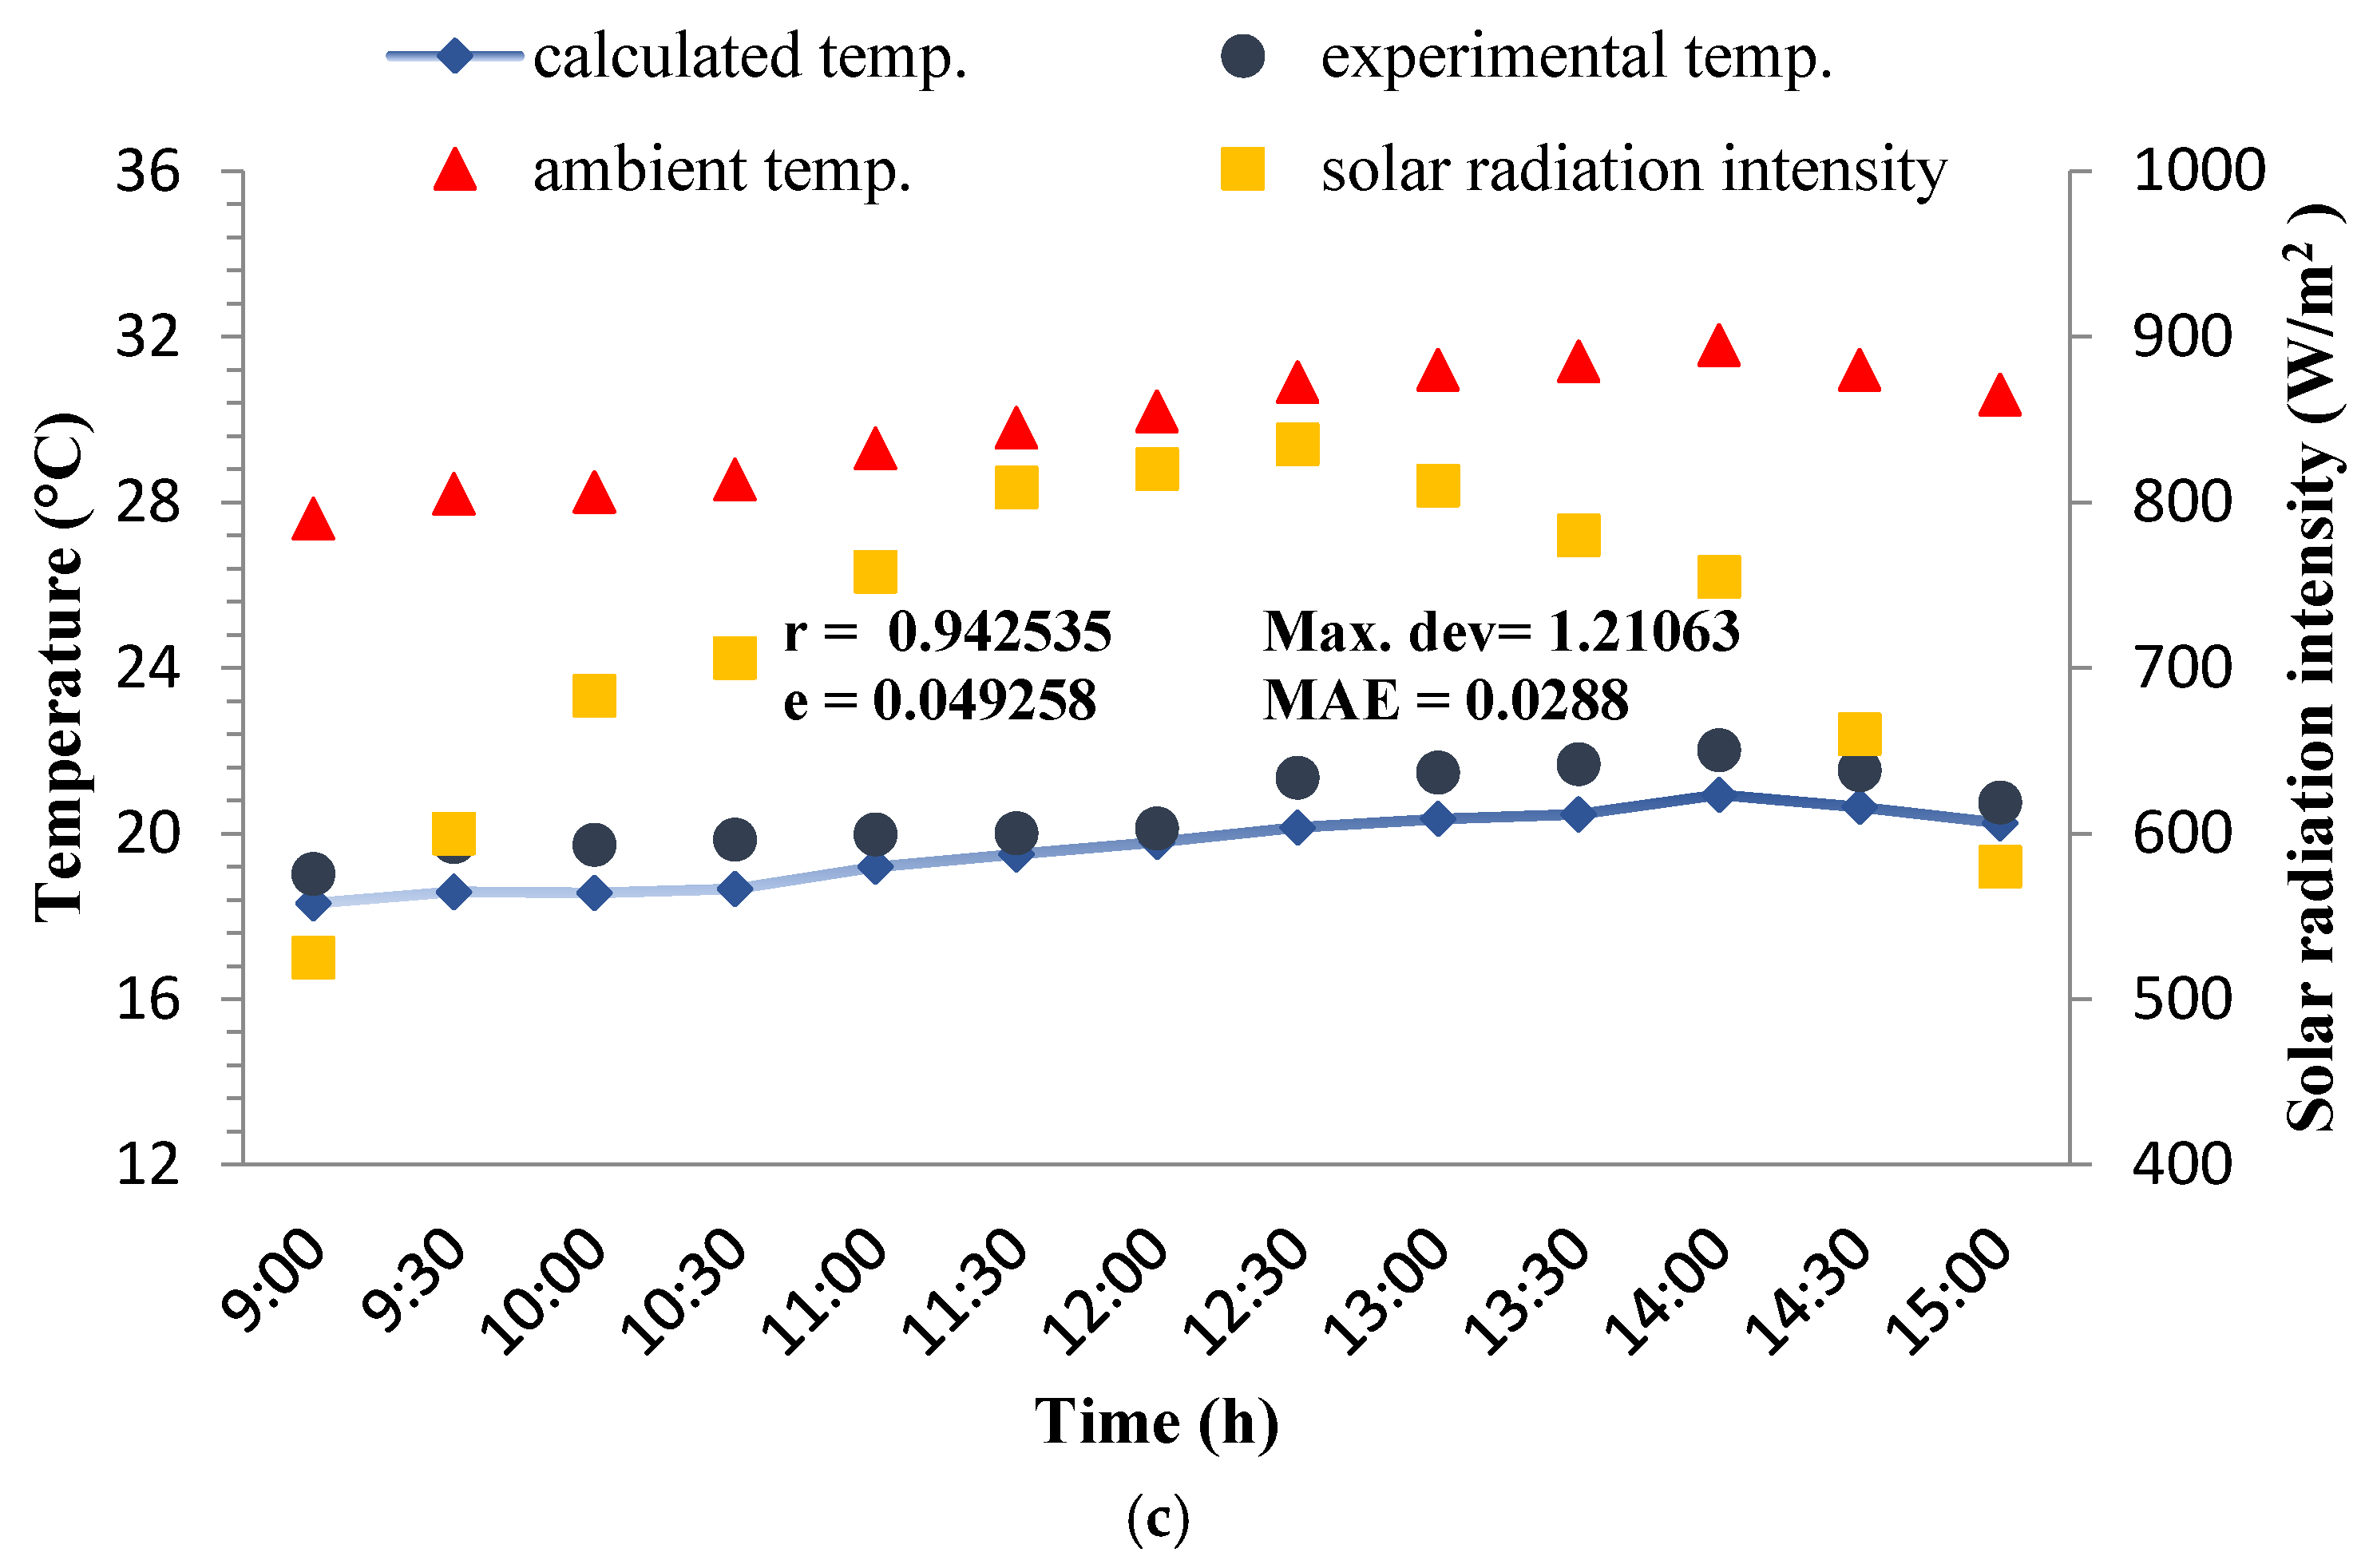
Figure 3 shows variations of solar radiation intensity, ambient temperature, and comparison between experimental and calculated outlet temperature of the wind catcher at the three inside air velocities of (a) 1, (b) 1.5, and (c) 2.5 m/s. The measurements indicate that the temperature drop inside the designed wind catcher has been between 9.29 and 14.63 °C. The temperature decrease in a modular wind catcher with wetted surfaces found to be in range of 9.2–13.6 °C [27]. The root mean square deviation (e) ranges from 0.04925 to 0.10728 while the observed correlation coefficient is between 0.9312 and 0.9438. The maximum deviations between the analytical and the experimental temperatures are 1.21, 1.60, and 2.04 °C at the air velocities of 1, 1.5, and 2.5 m/s, respectively. Also, the result indicates that min absolute error associated with the theoretical expressions has been lower than 10%. A study that had been conducted to simulate indoor temperature of a green house in Iraq based on thermo-physical properties of the green house components, showed that the predicted data had an absolute error of lower than 10% [28]. The results of similar research achieved an mean absolute deviation of lower than 20% between the predicted and the experimental temperatures of a greenhouse equipped with a heat-pump heating system [29]. Based on the observation, it can be said that there is a suitable agreement between the experimental and theoretical data.
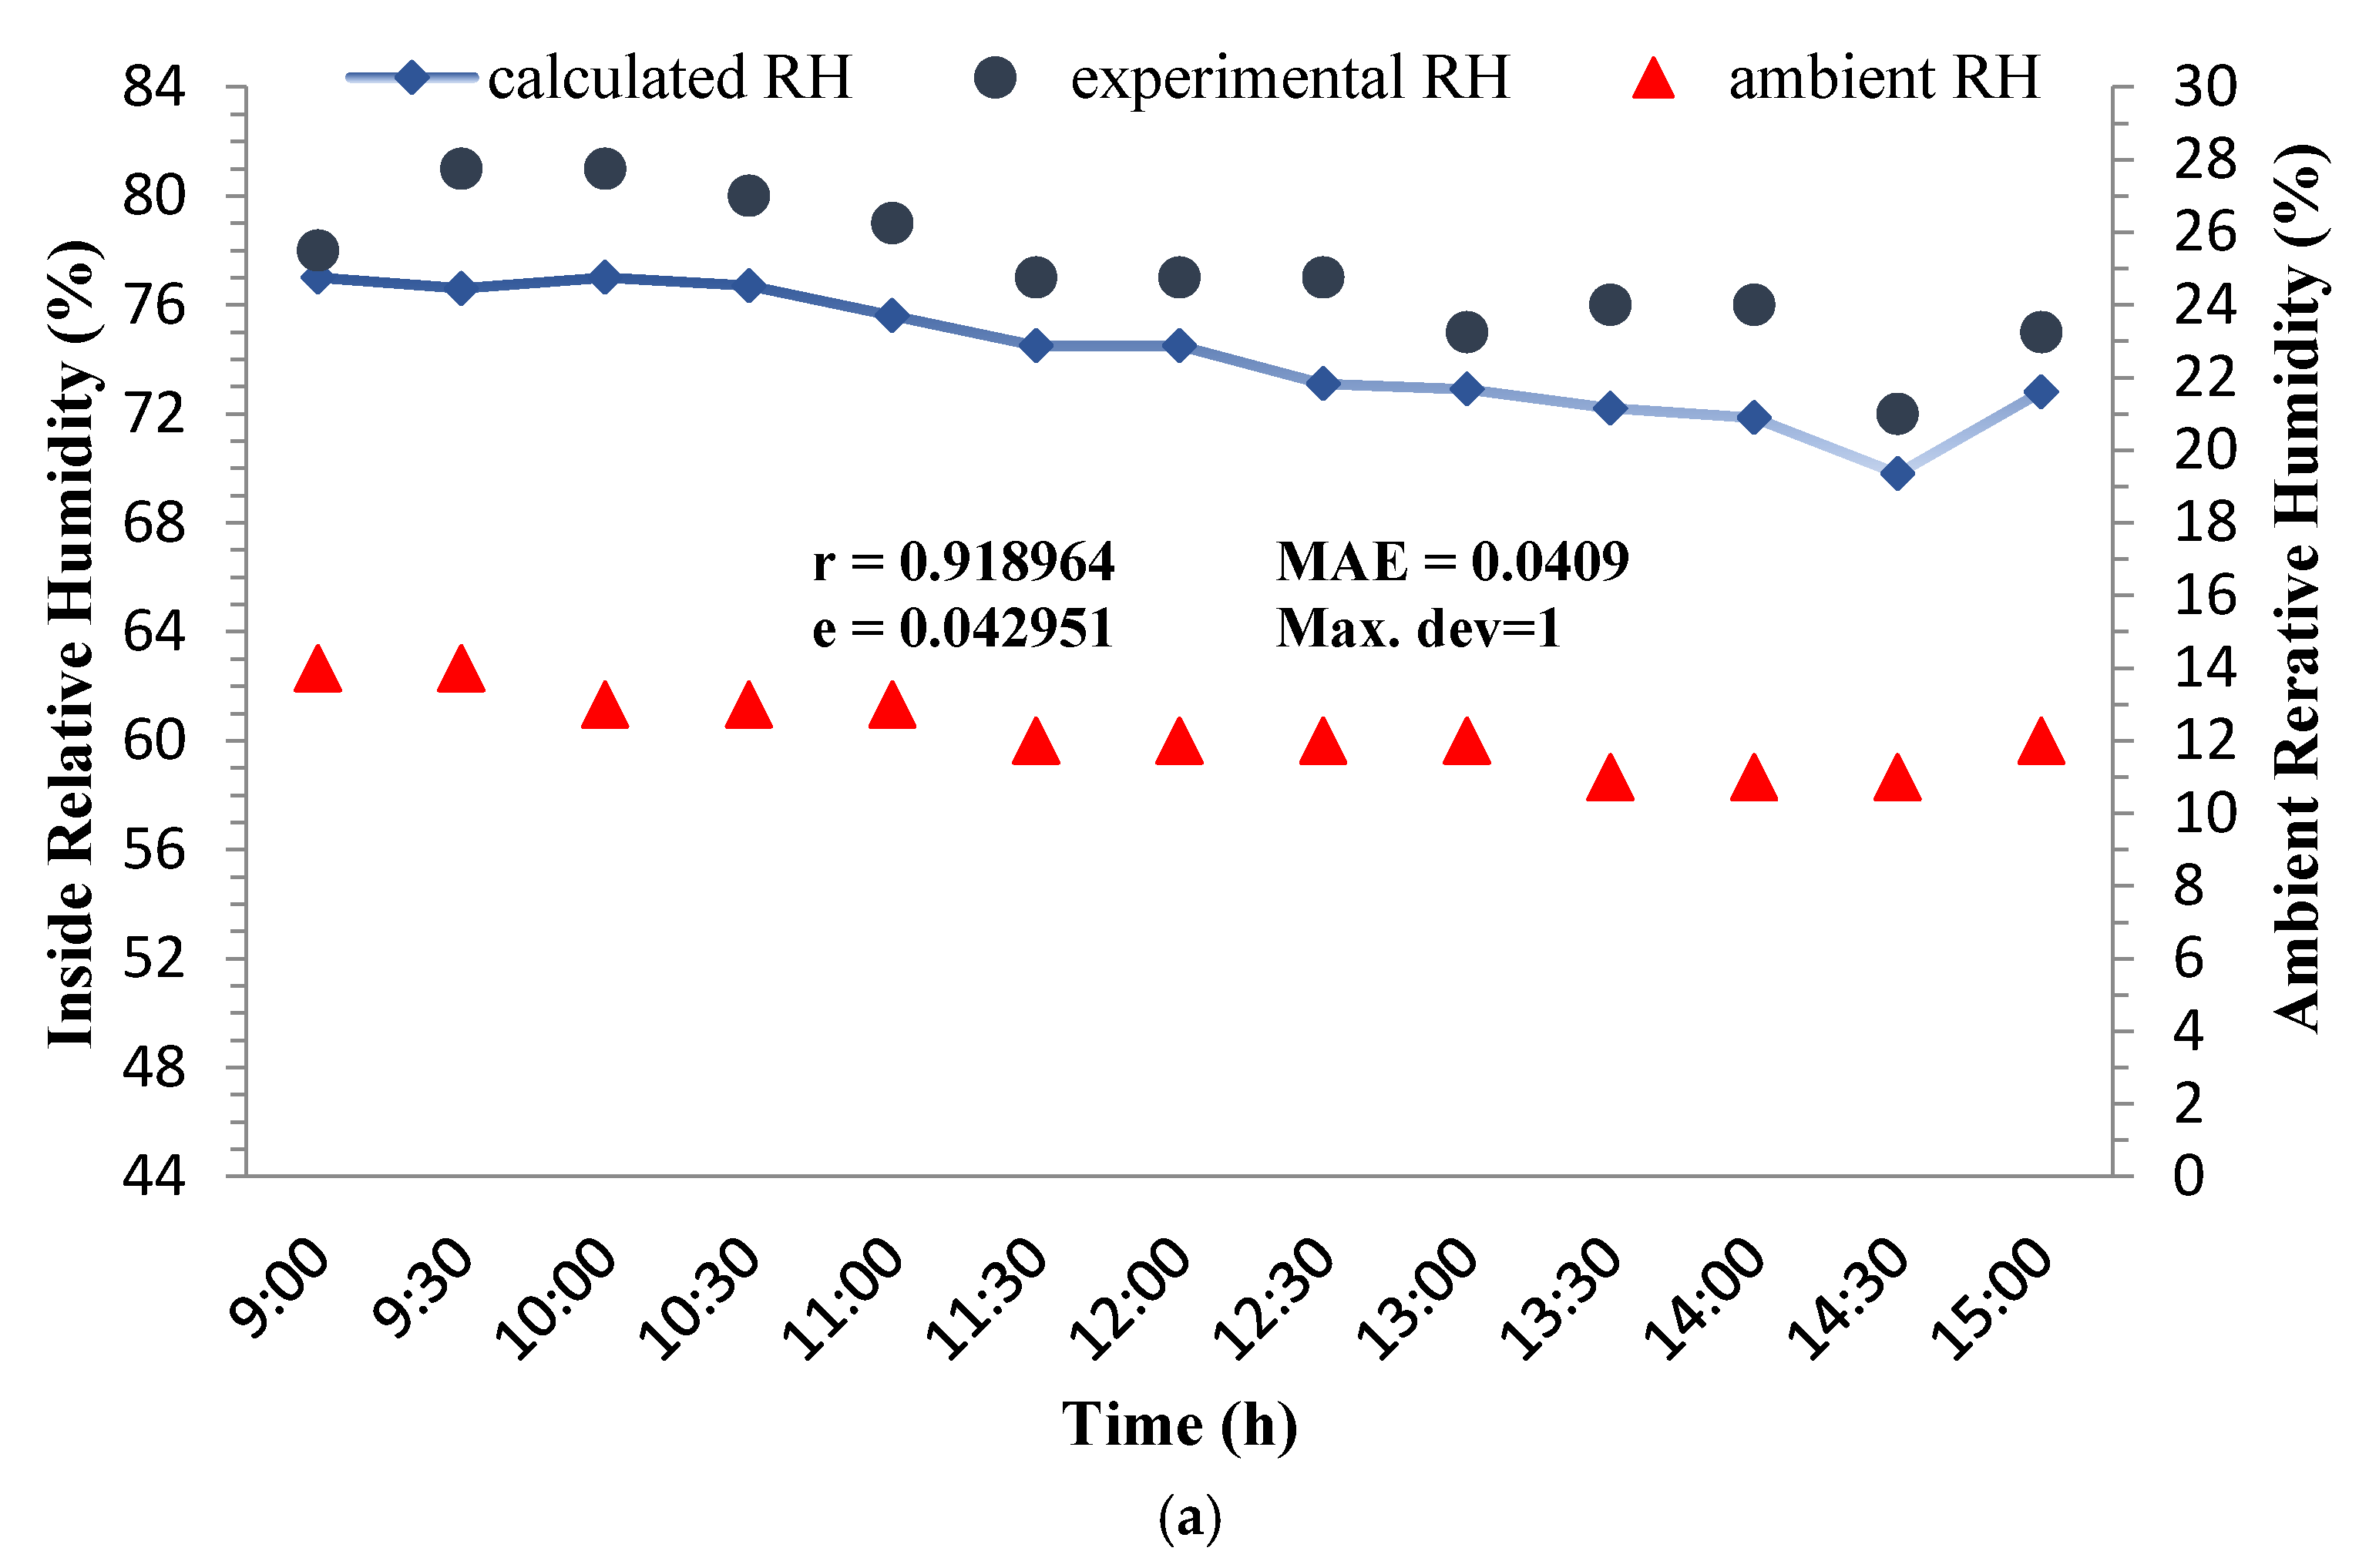
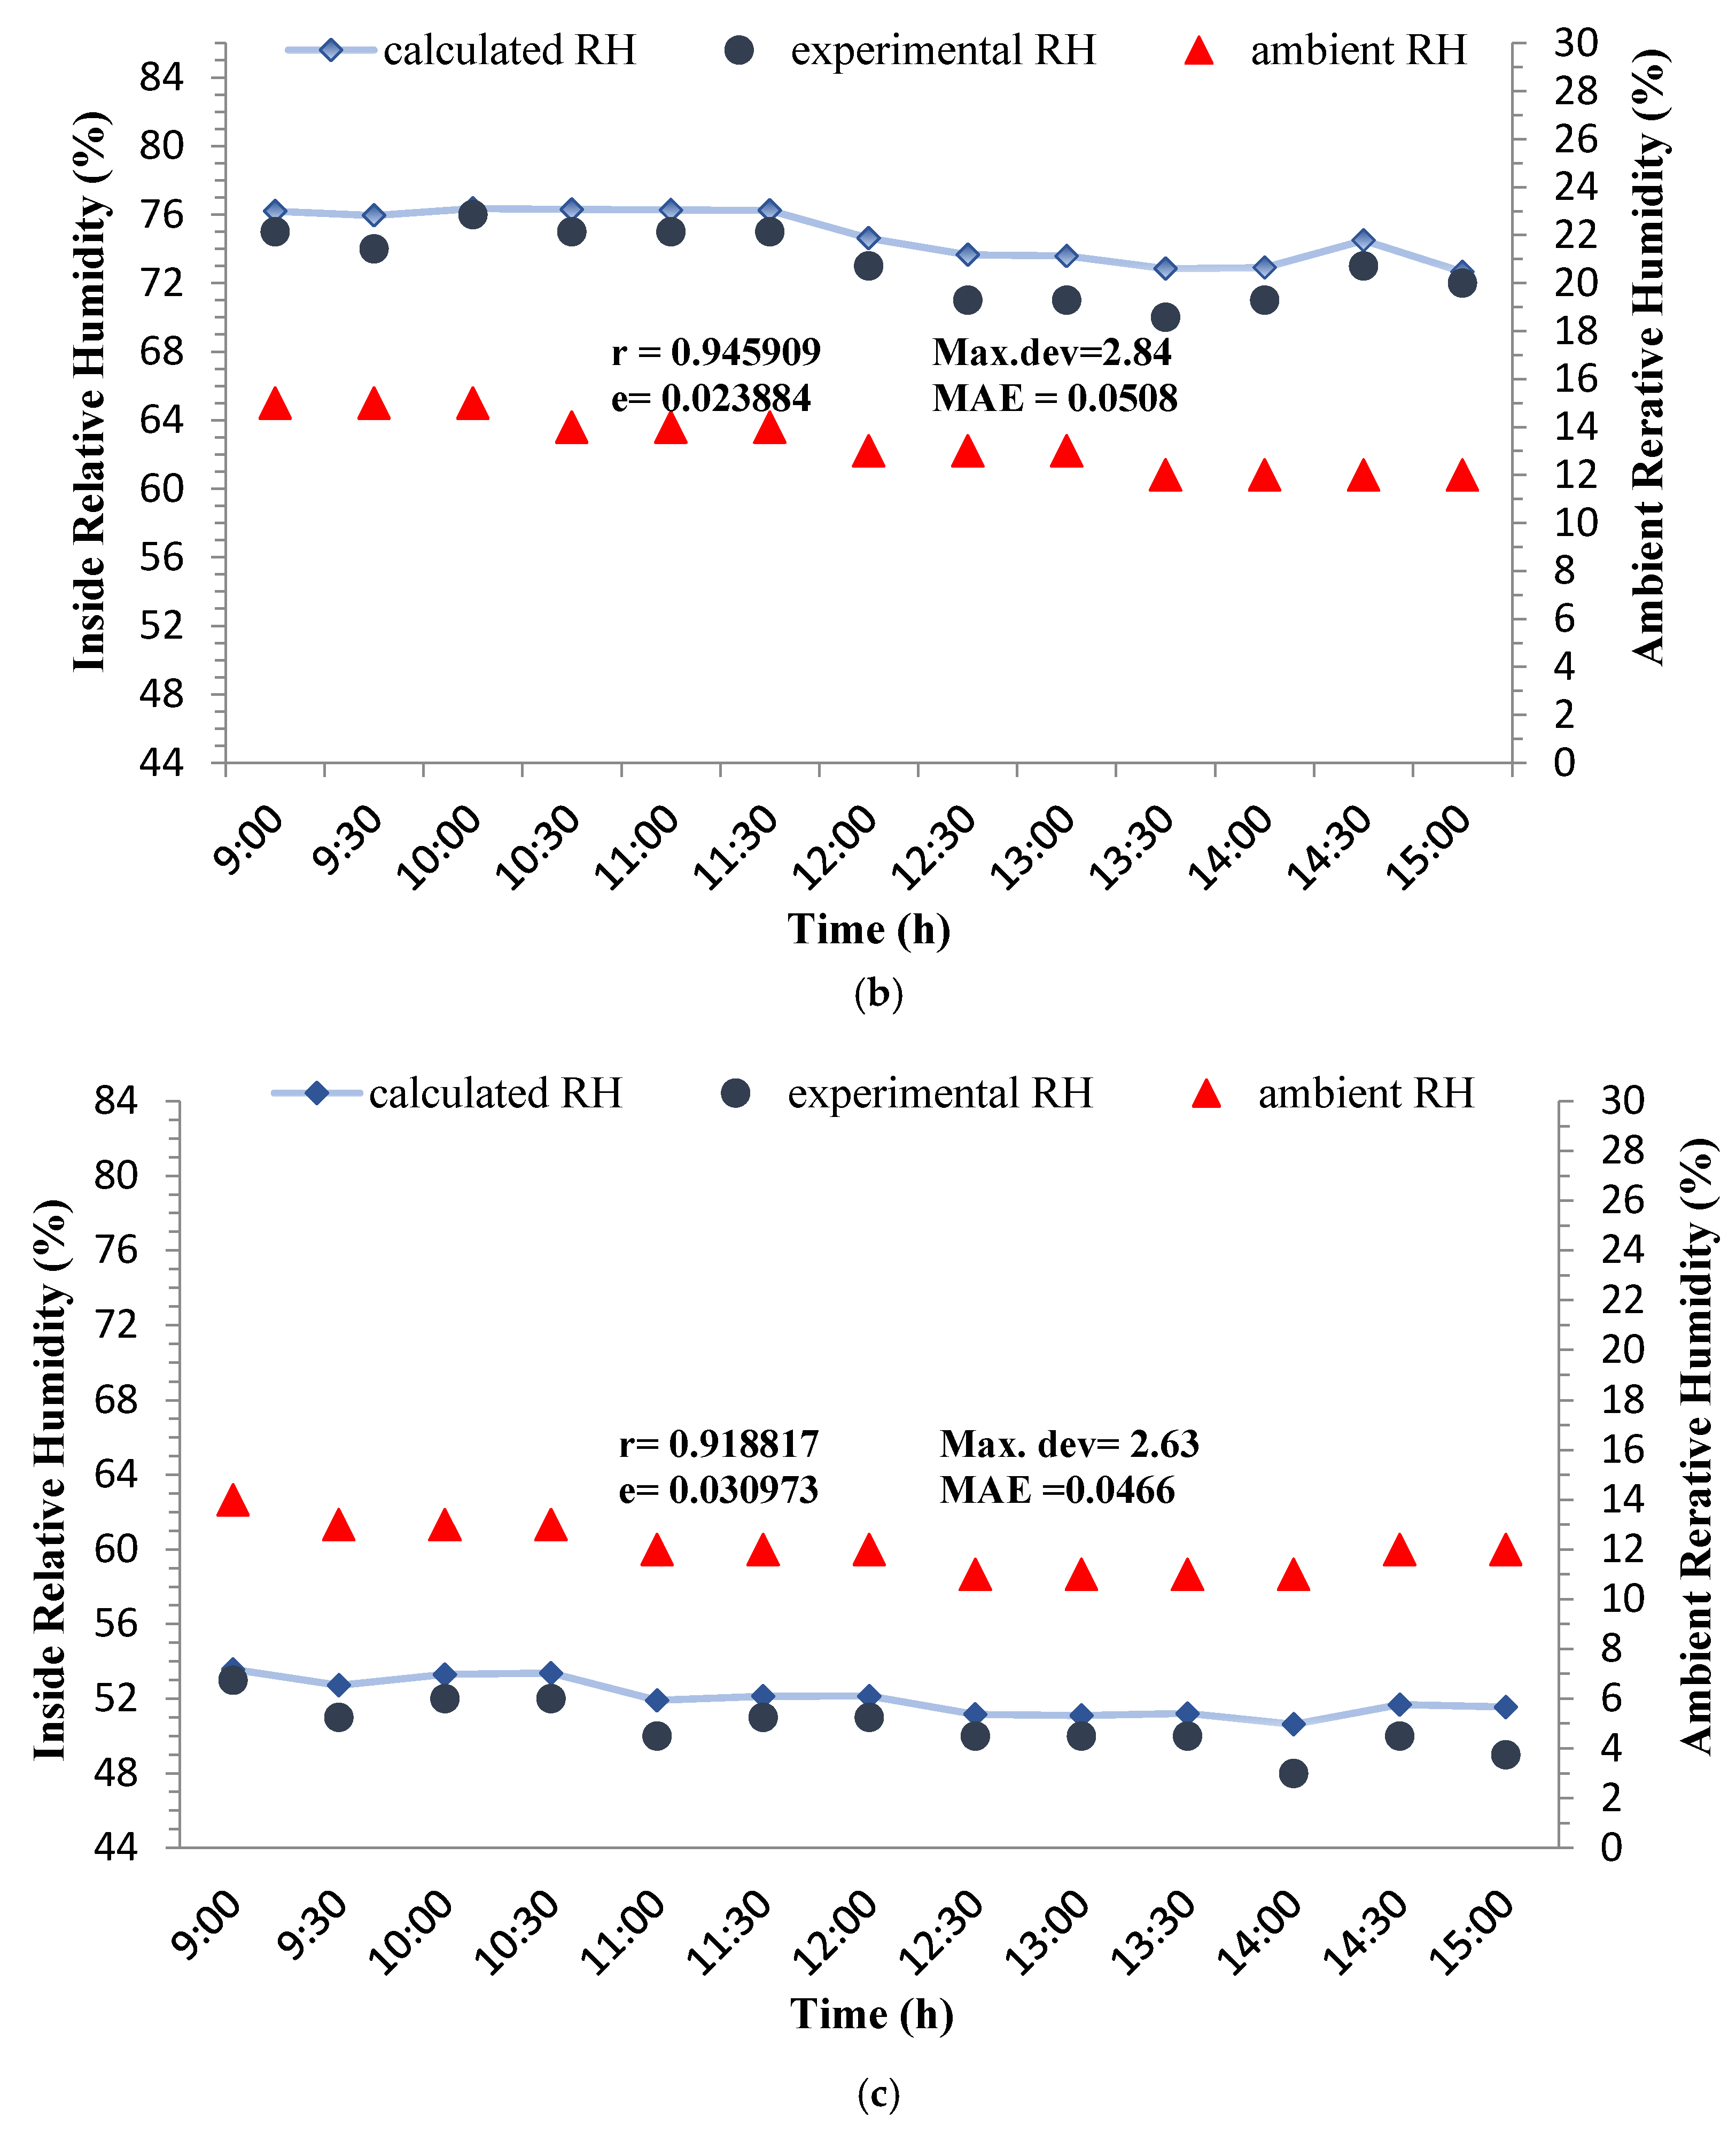
Variations of experimental and calculated RH of the outlet air during three days of the experiment were depicted in Figure 4. It can be seen from the figure that the designed wind catcher has been elevated RH of the moving air by 39.55 to 64%. The range of RH increase in the wind catcher designed by Khani et al. [27] was from 23–53%. The root mean square deviations are lower than 0.04586, the values of Pearson correlation coefficient are higher than 0.9188 and the difference between the experimental and analytical RH is lower than 5%. This means that the obtained expressions could satisfactorily predict the RH of the outlet air.
.
6.2. Effect of Wind Speed and Wind Catcher Height
The effect of wind speed and wind catcher height were analytically investigated on the air velocity inside the conduit, temperature and cooling load. Since the position of the inlet pad could influence the operating parameters of the wind catcher, the tests were carried out with both open and closed pads.
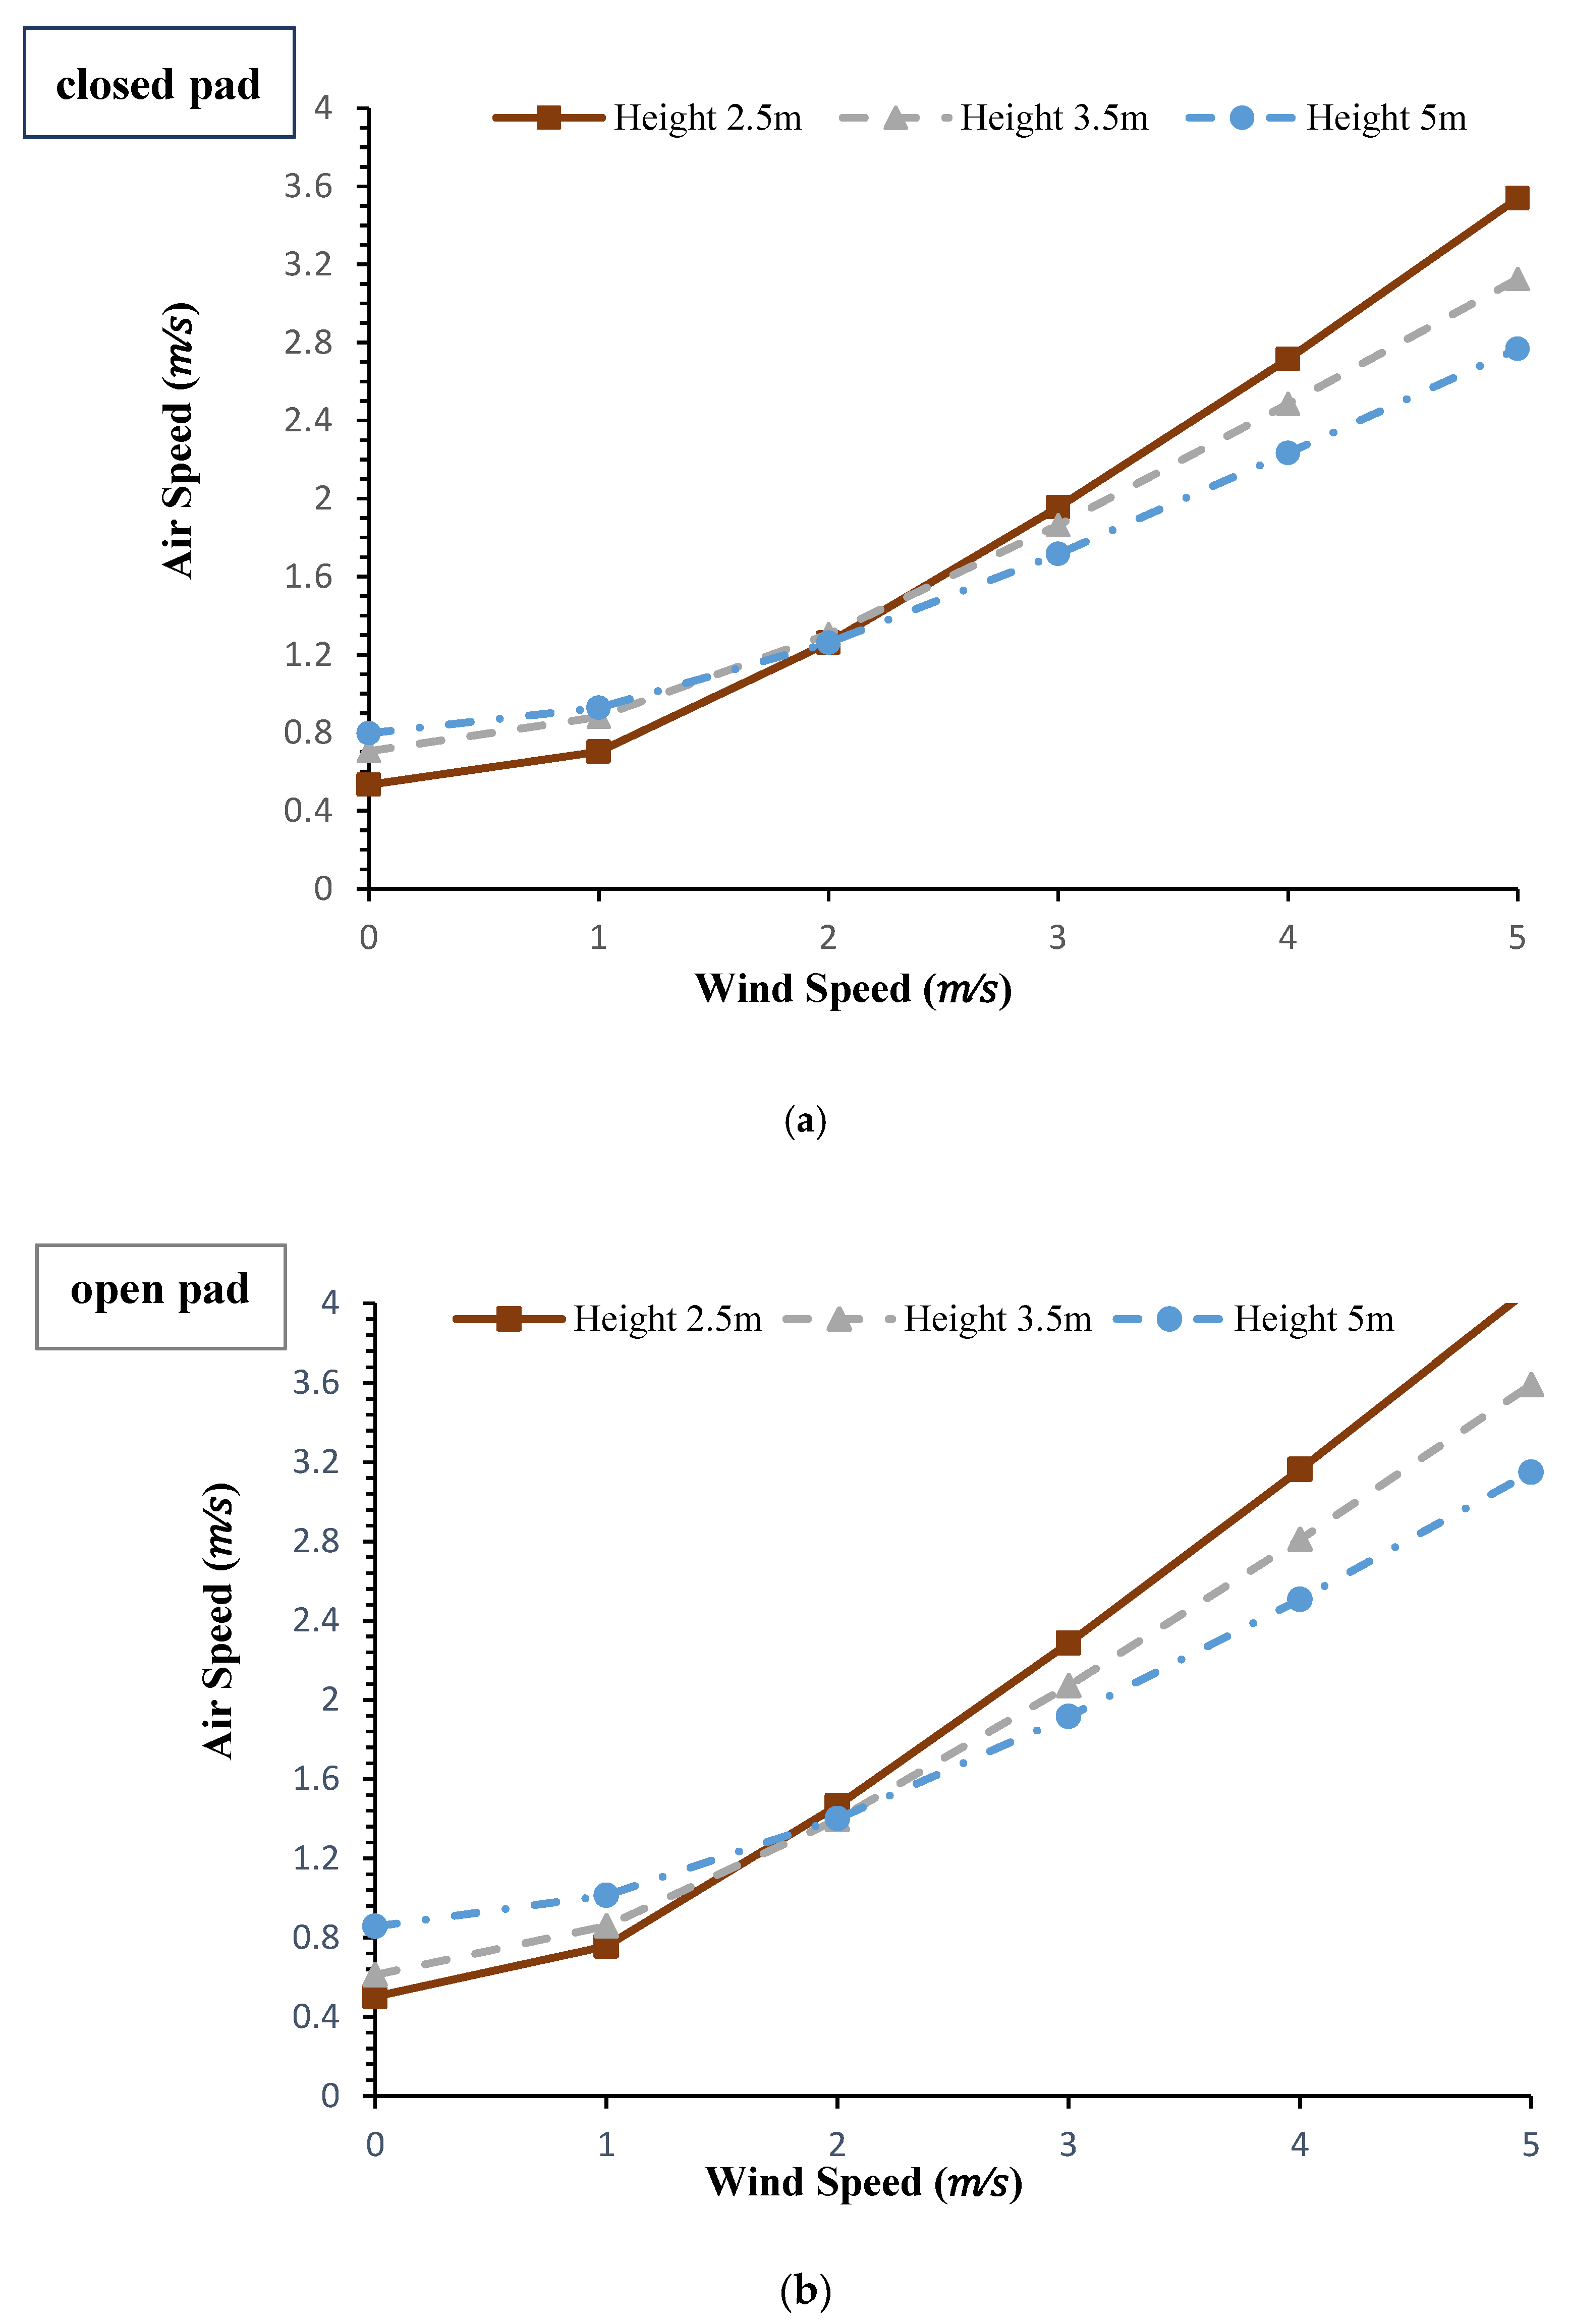
The effect of wind velocity and height of the wind catcher on air velocity inside the conduit at the two modes of the pad (open and closed) has been illustrated in Figure 5. Clearly, increasing the wind speed increase the air velocity in the column. In addition, the rate of changes is higher at the lower heights of the wind catcher. This is due to the fact that increasing the length of the wind catcher increases the pressure drop which results in a slower growth of air velocity in the column. Figure 5 also indicates that at the conditions of wind existence, inside air velocity is slightly higher when the pad was open. This is because of the air pressure drop occurred with passing through the pad. Vice versa, when the wind speed is zero, the closed pad results in a relatively higher air velocity inside the wind catcher. The air flow inside the wind catcher at the condition of no external wind is under the influence of the buoyancy effect (depends on the air temperature) and the pressure drop (because of the length of the duct). So, since the temperature drops at the closed-pad mode are higher, the air velocities were higher compared with the open-pad. However, it seems that the effect of pressure drop is considerable at the taller wind catchers which finally have been resulted in a decrease in air velocity at the height of 5 m.
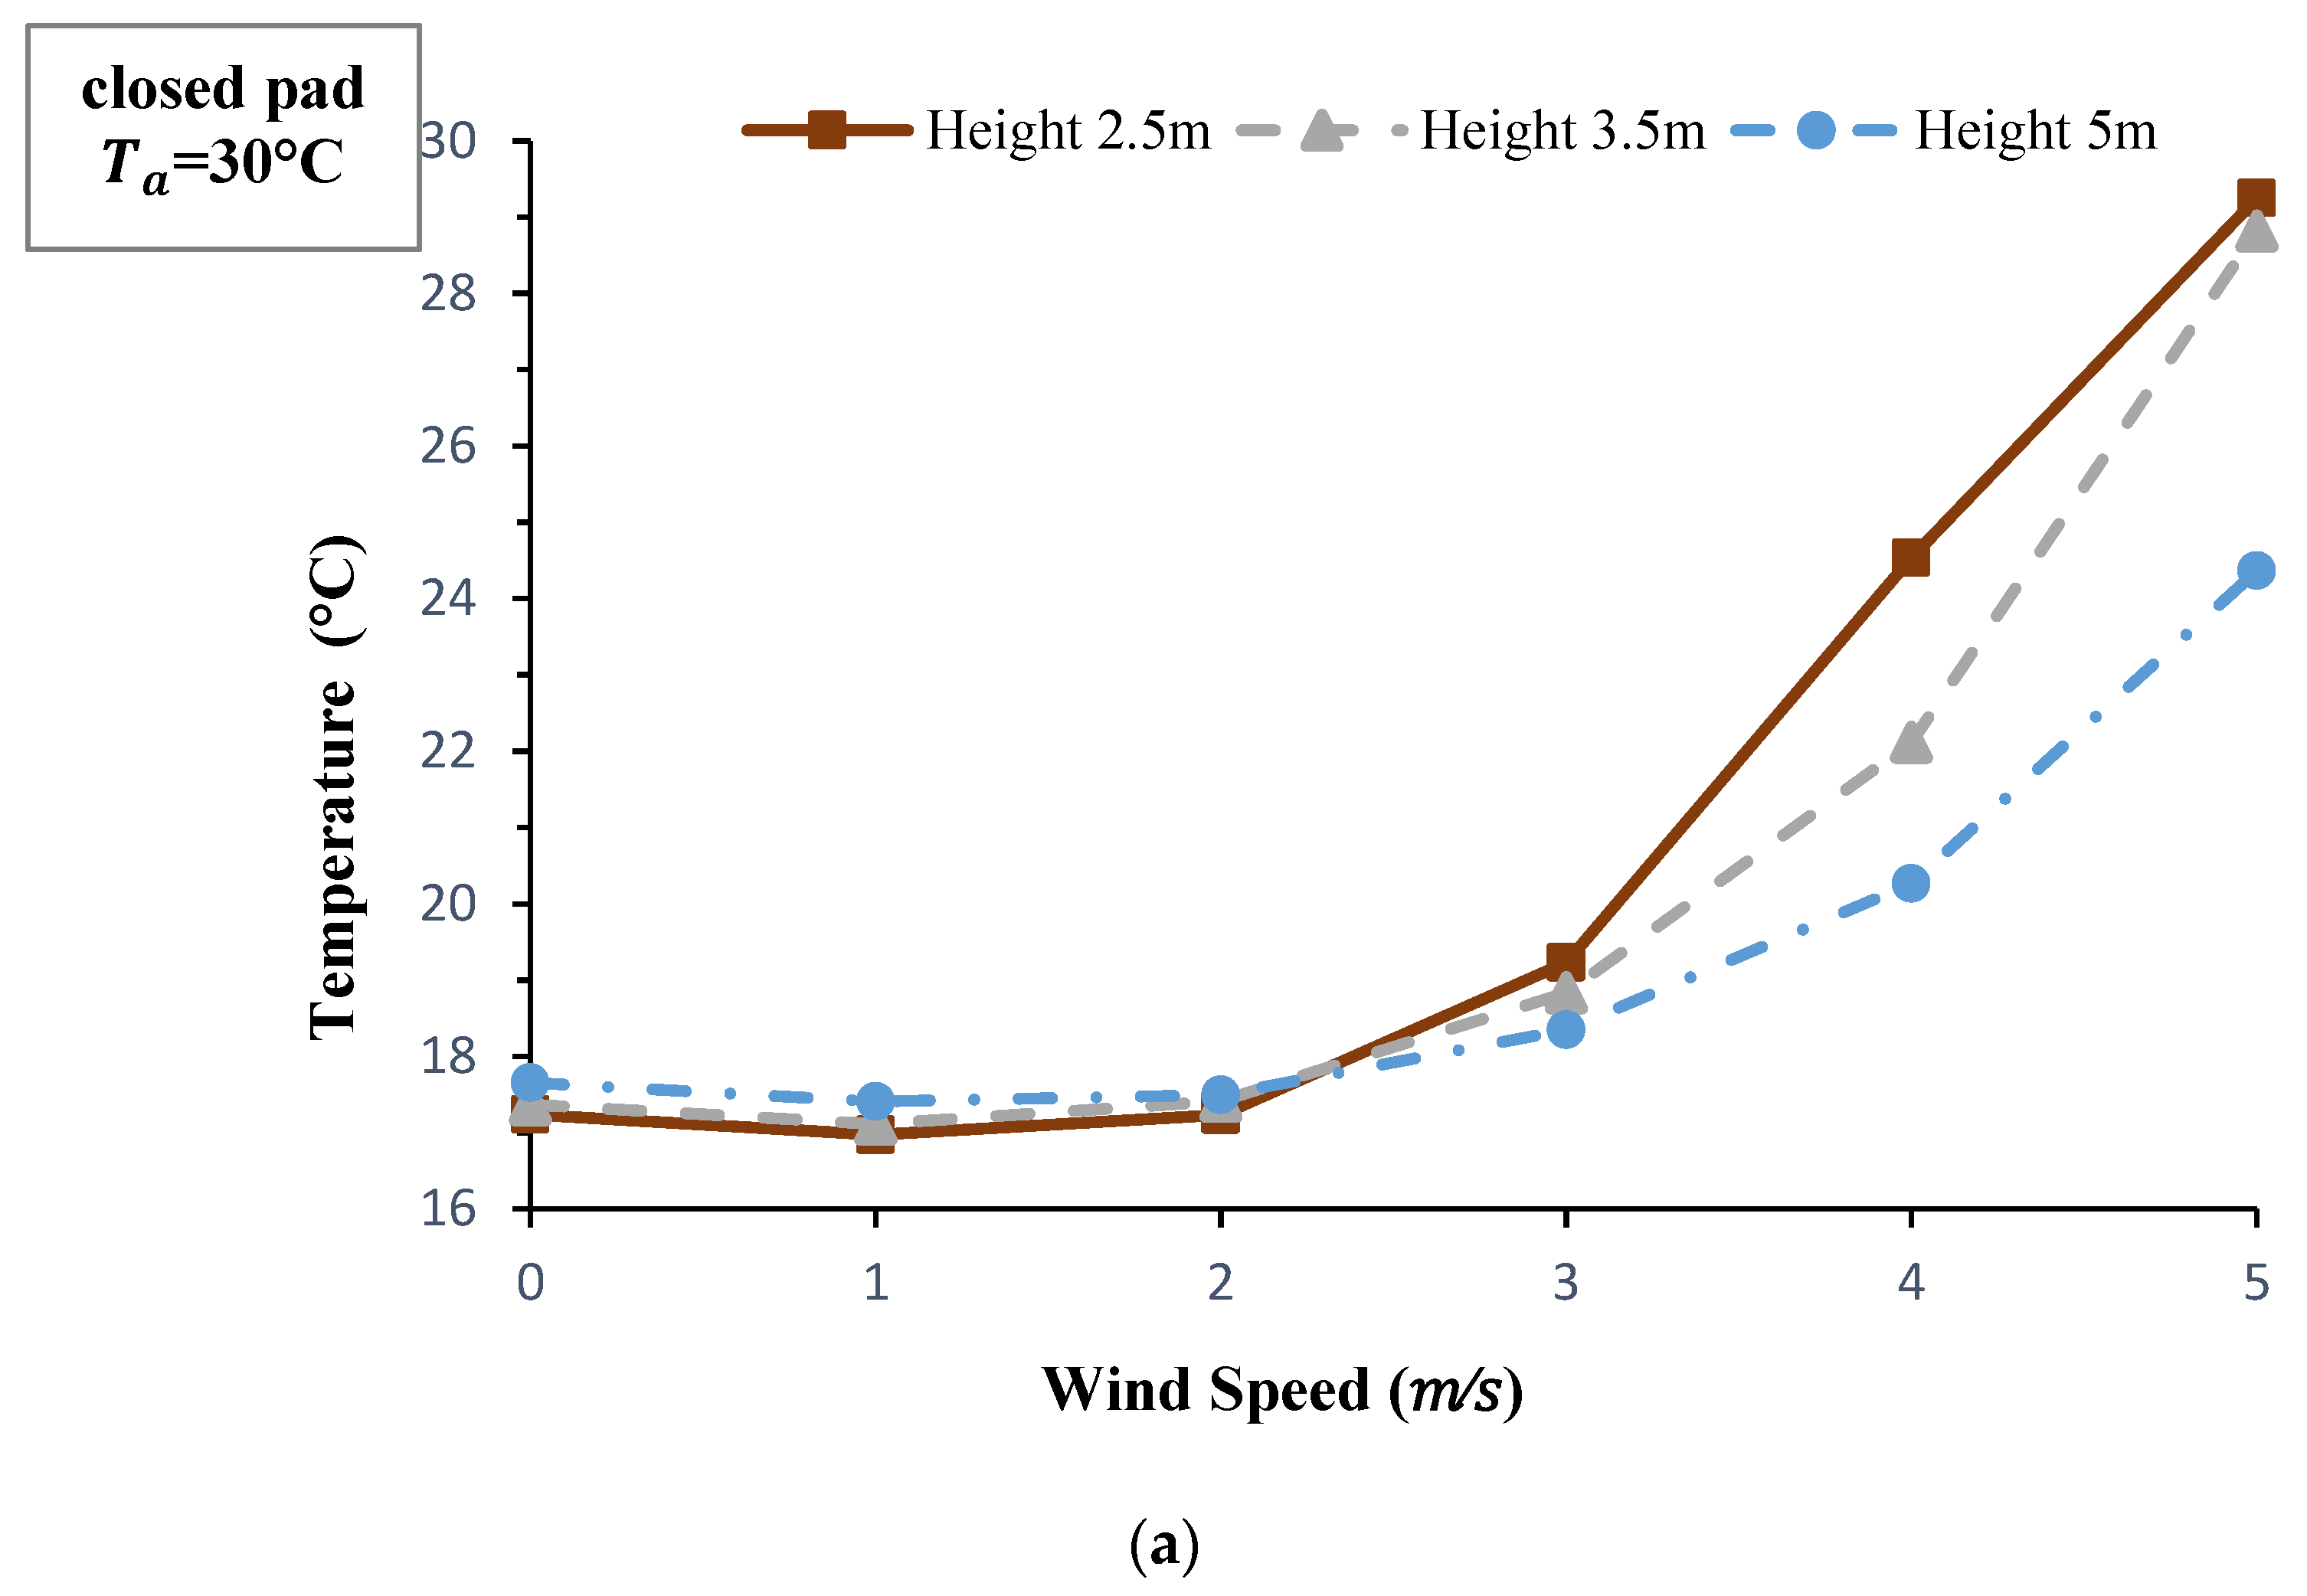
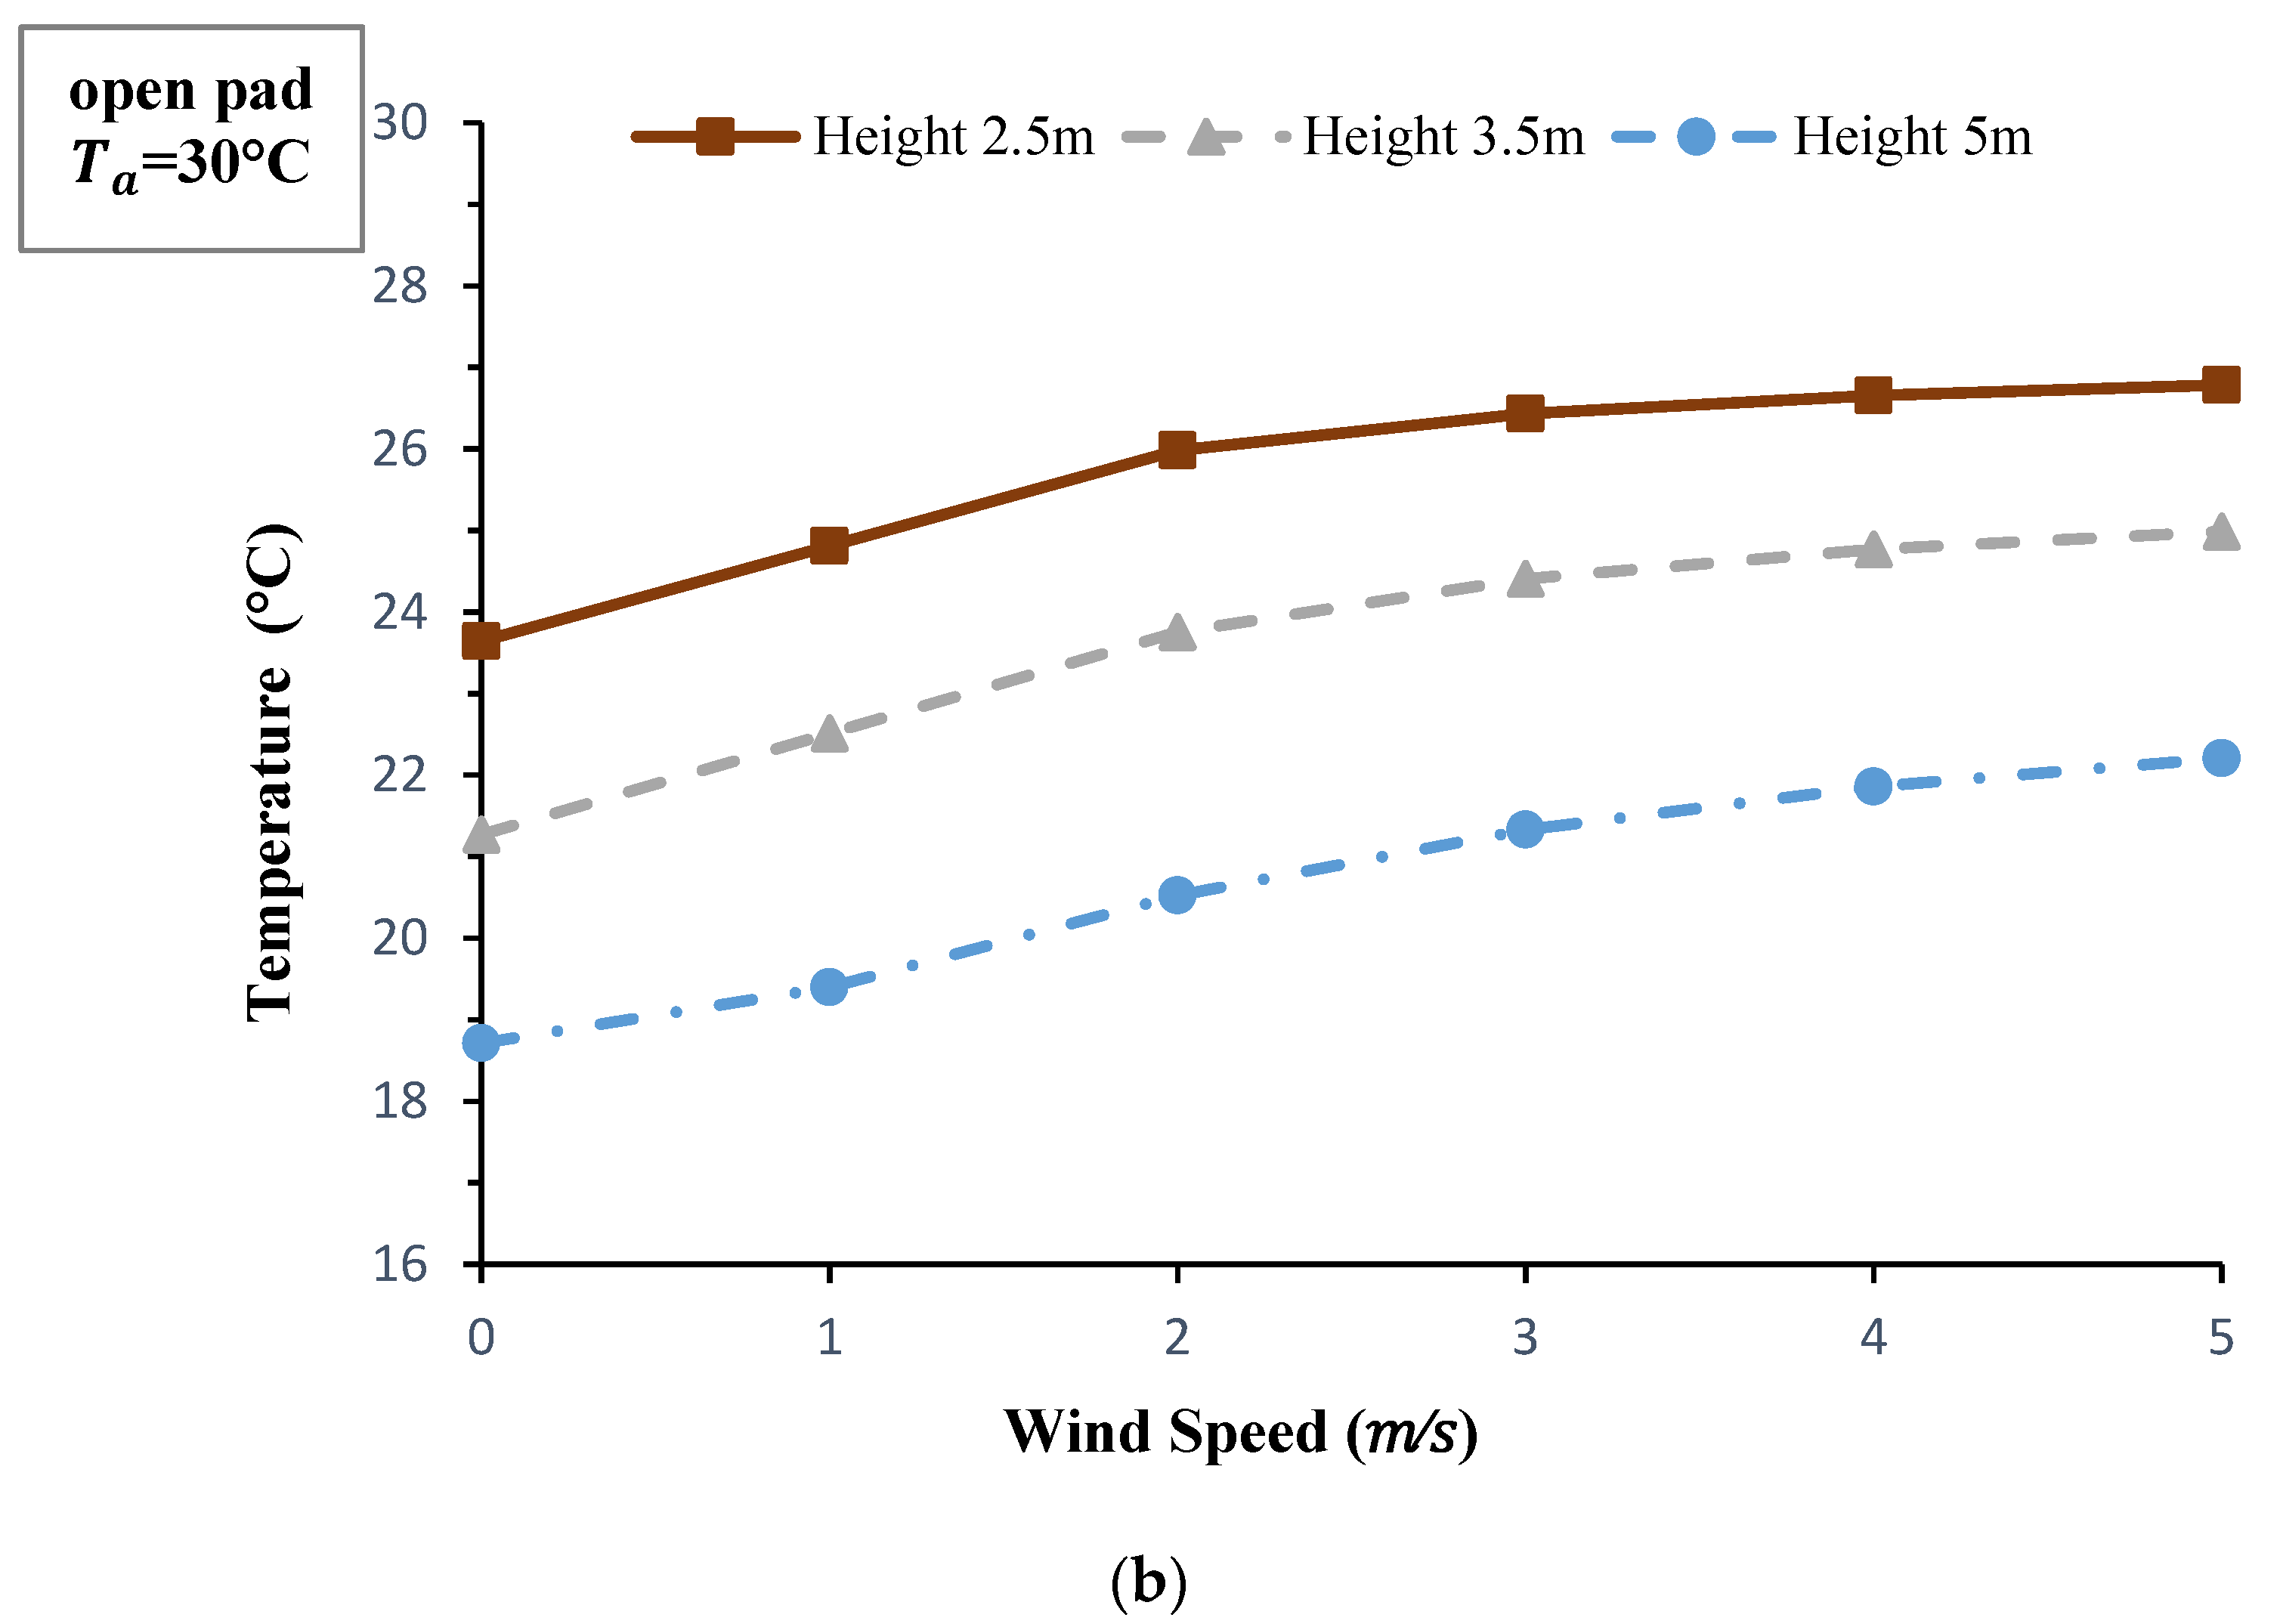
The effect of wind velocity and height of the wind catcher on the outlet temperature at the two modes of the open and closed pad are depicted in Figure 6. Changes in wind speed and the height has not a significant effect on the outlet temperature at low wind speeds (lower than 2 m/s) when the pad is closed. It seems that the slow passing of the air through the wetted pad makes it almost saturated and brings it to the lowest possible temperature. This means that the columns after the pad has no effect on temperature and RH of the moving air. However, at higher wind speeds, when the air velocity inside the wind catcher is significantly high, only a fraction of evaporative cooling can be accomplished by the pad while the process is supplemented by the wetted columns. Therefore, the height of the columns is a key factor on the amount of cooling load and the temperature drop of the moving air. When the pad is open, the outlet temperature increased with wind velocity which is mainly due to the increase in moving velocity of the air through the wetted blades. Furthermore, since increasing the height of the wind catcher has led to a decrease in air velocity and also provided a higher effective surface for the wetted screens (evaporation area), the outlet temperature is cooler at the higher wind catchers. On the open pad mode, the air temperature in the wind catchers with higher height are reduced more, which is in accordance with the results of the wetted columns wind catcher proposed by Bahadori et al. [12].
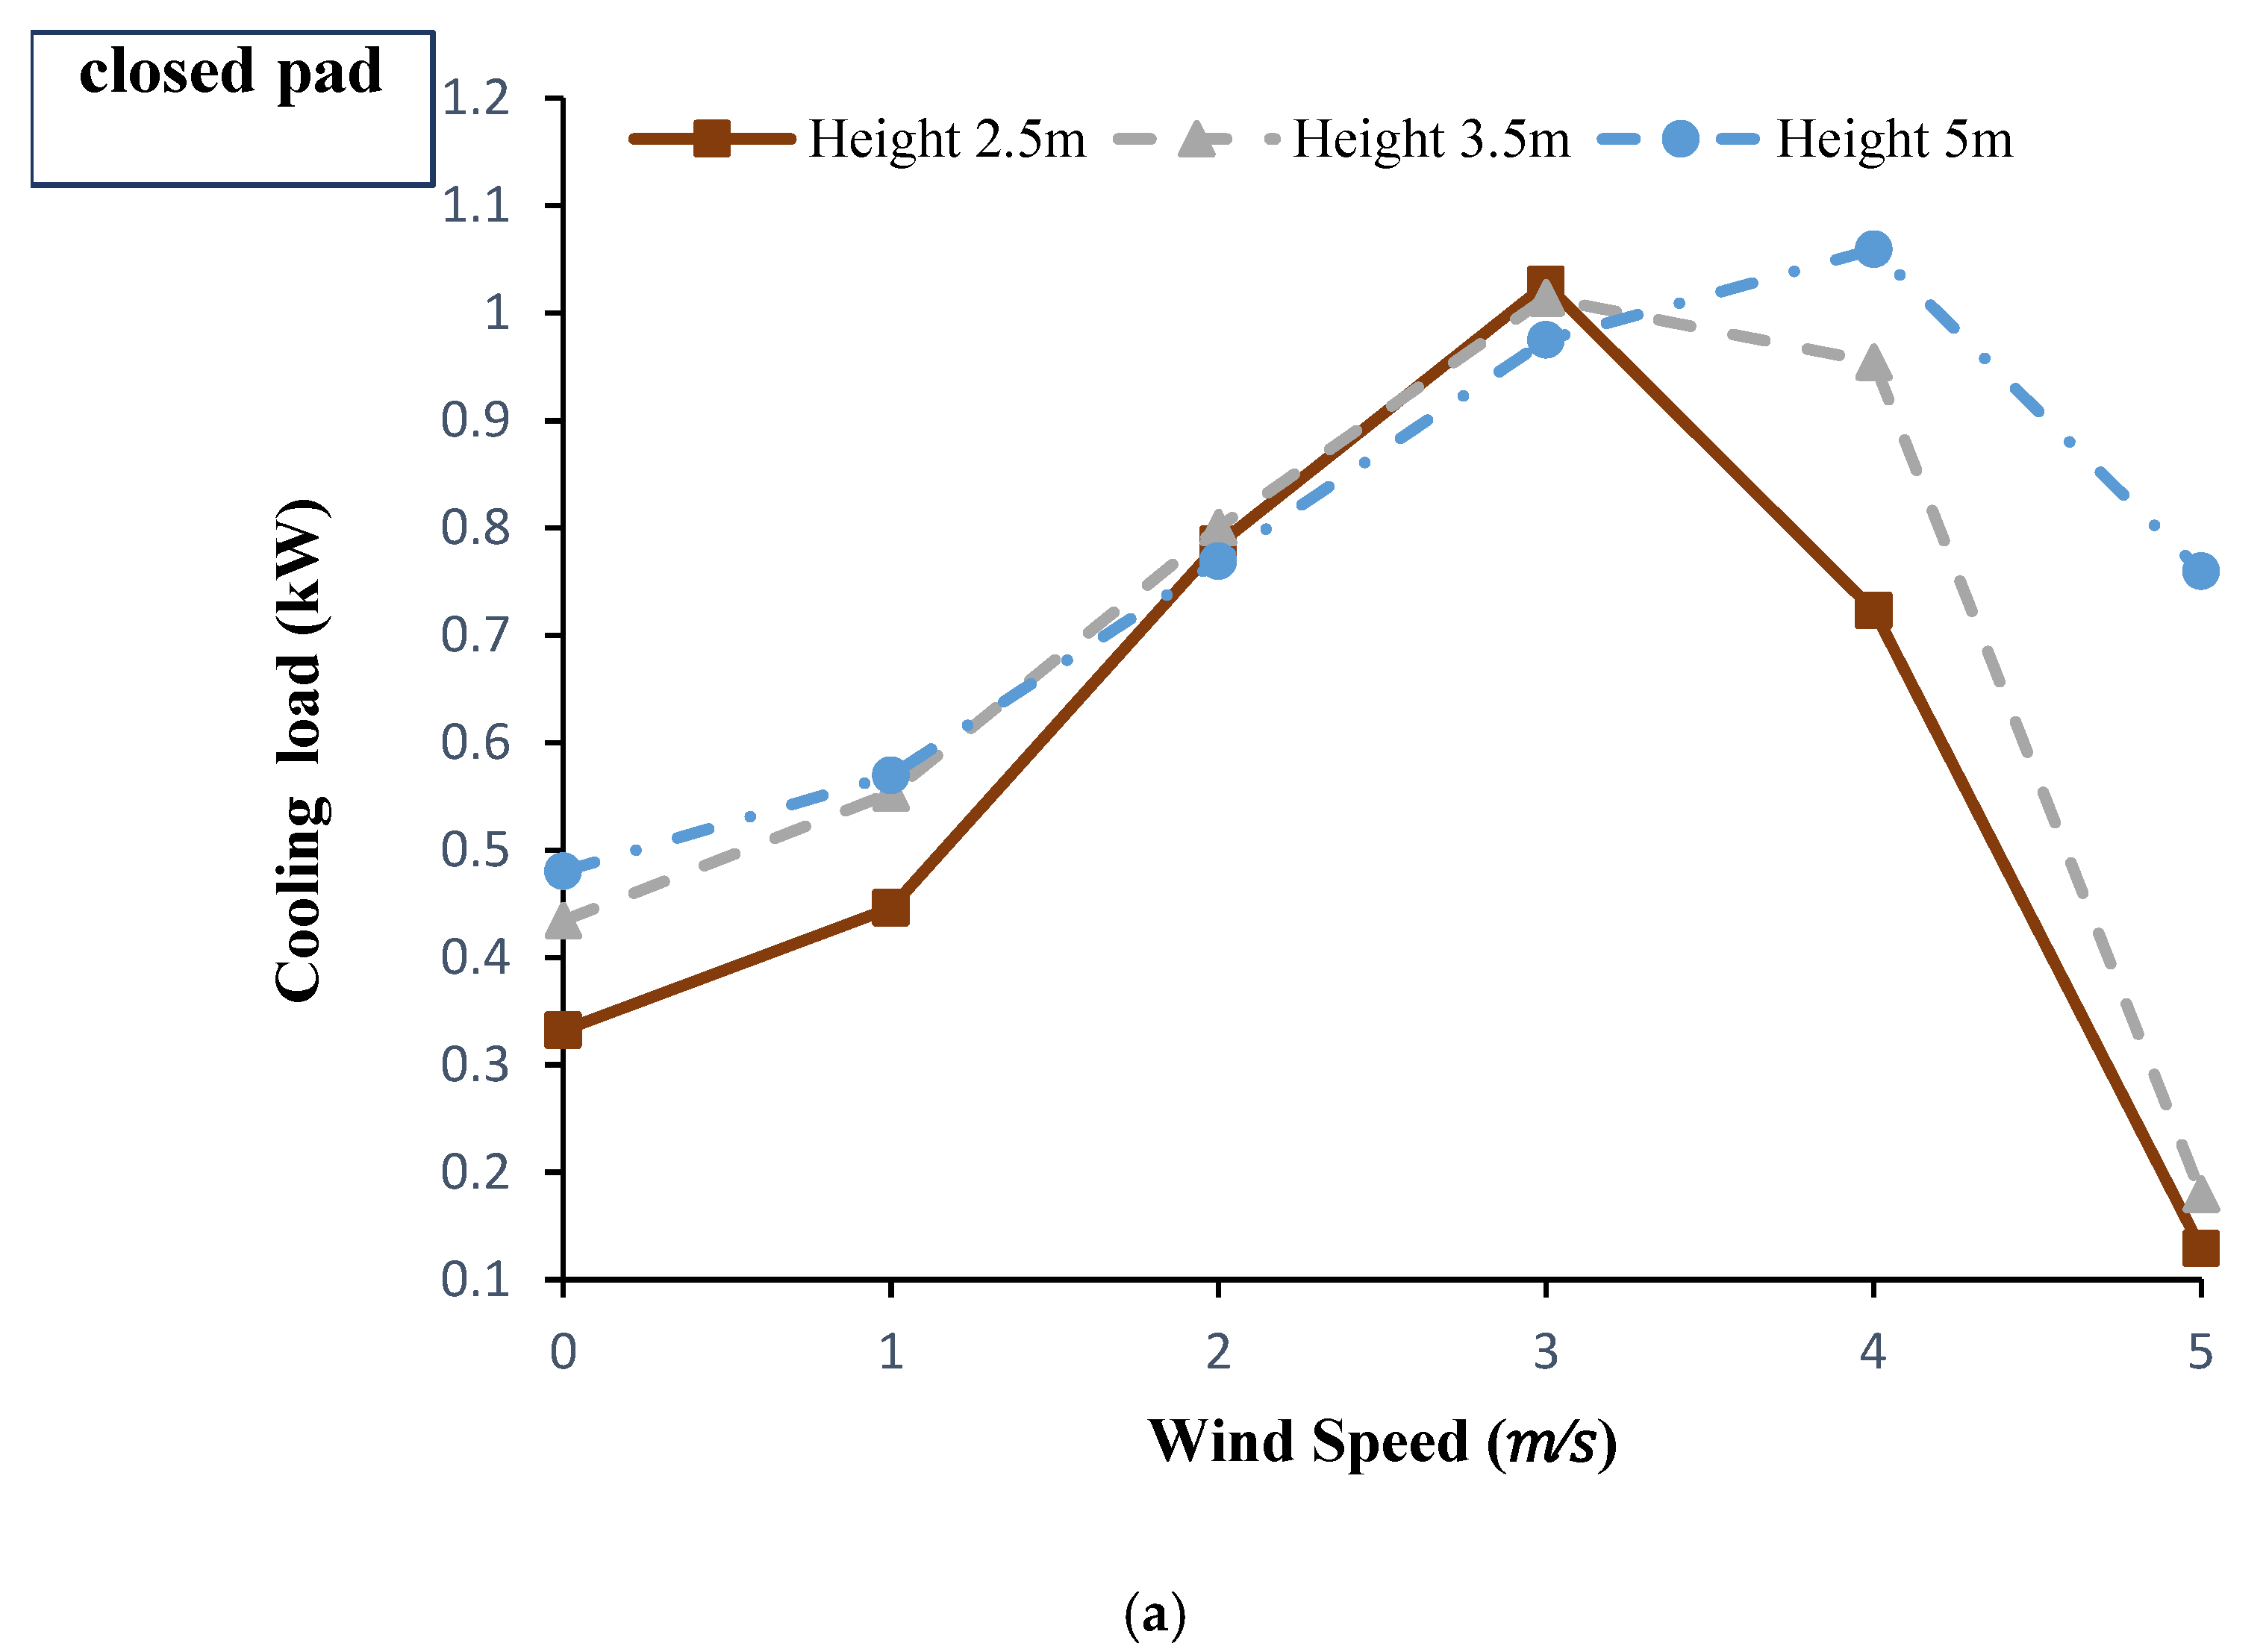
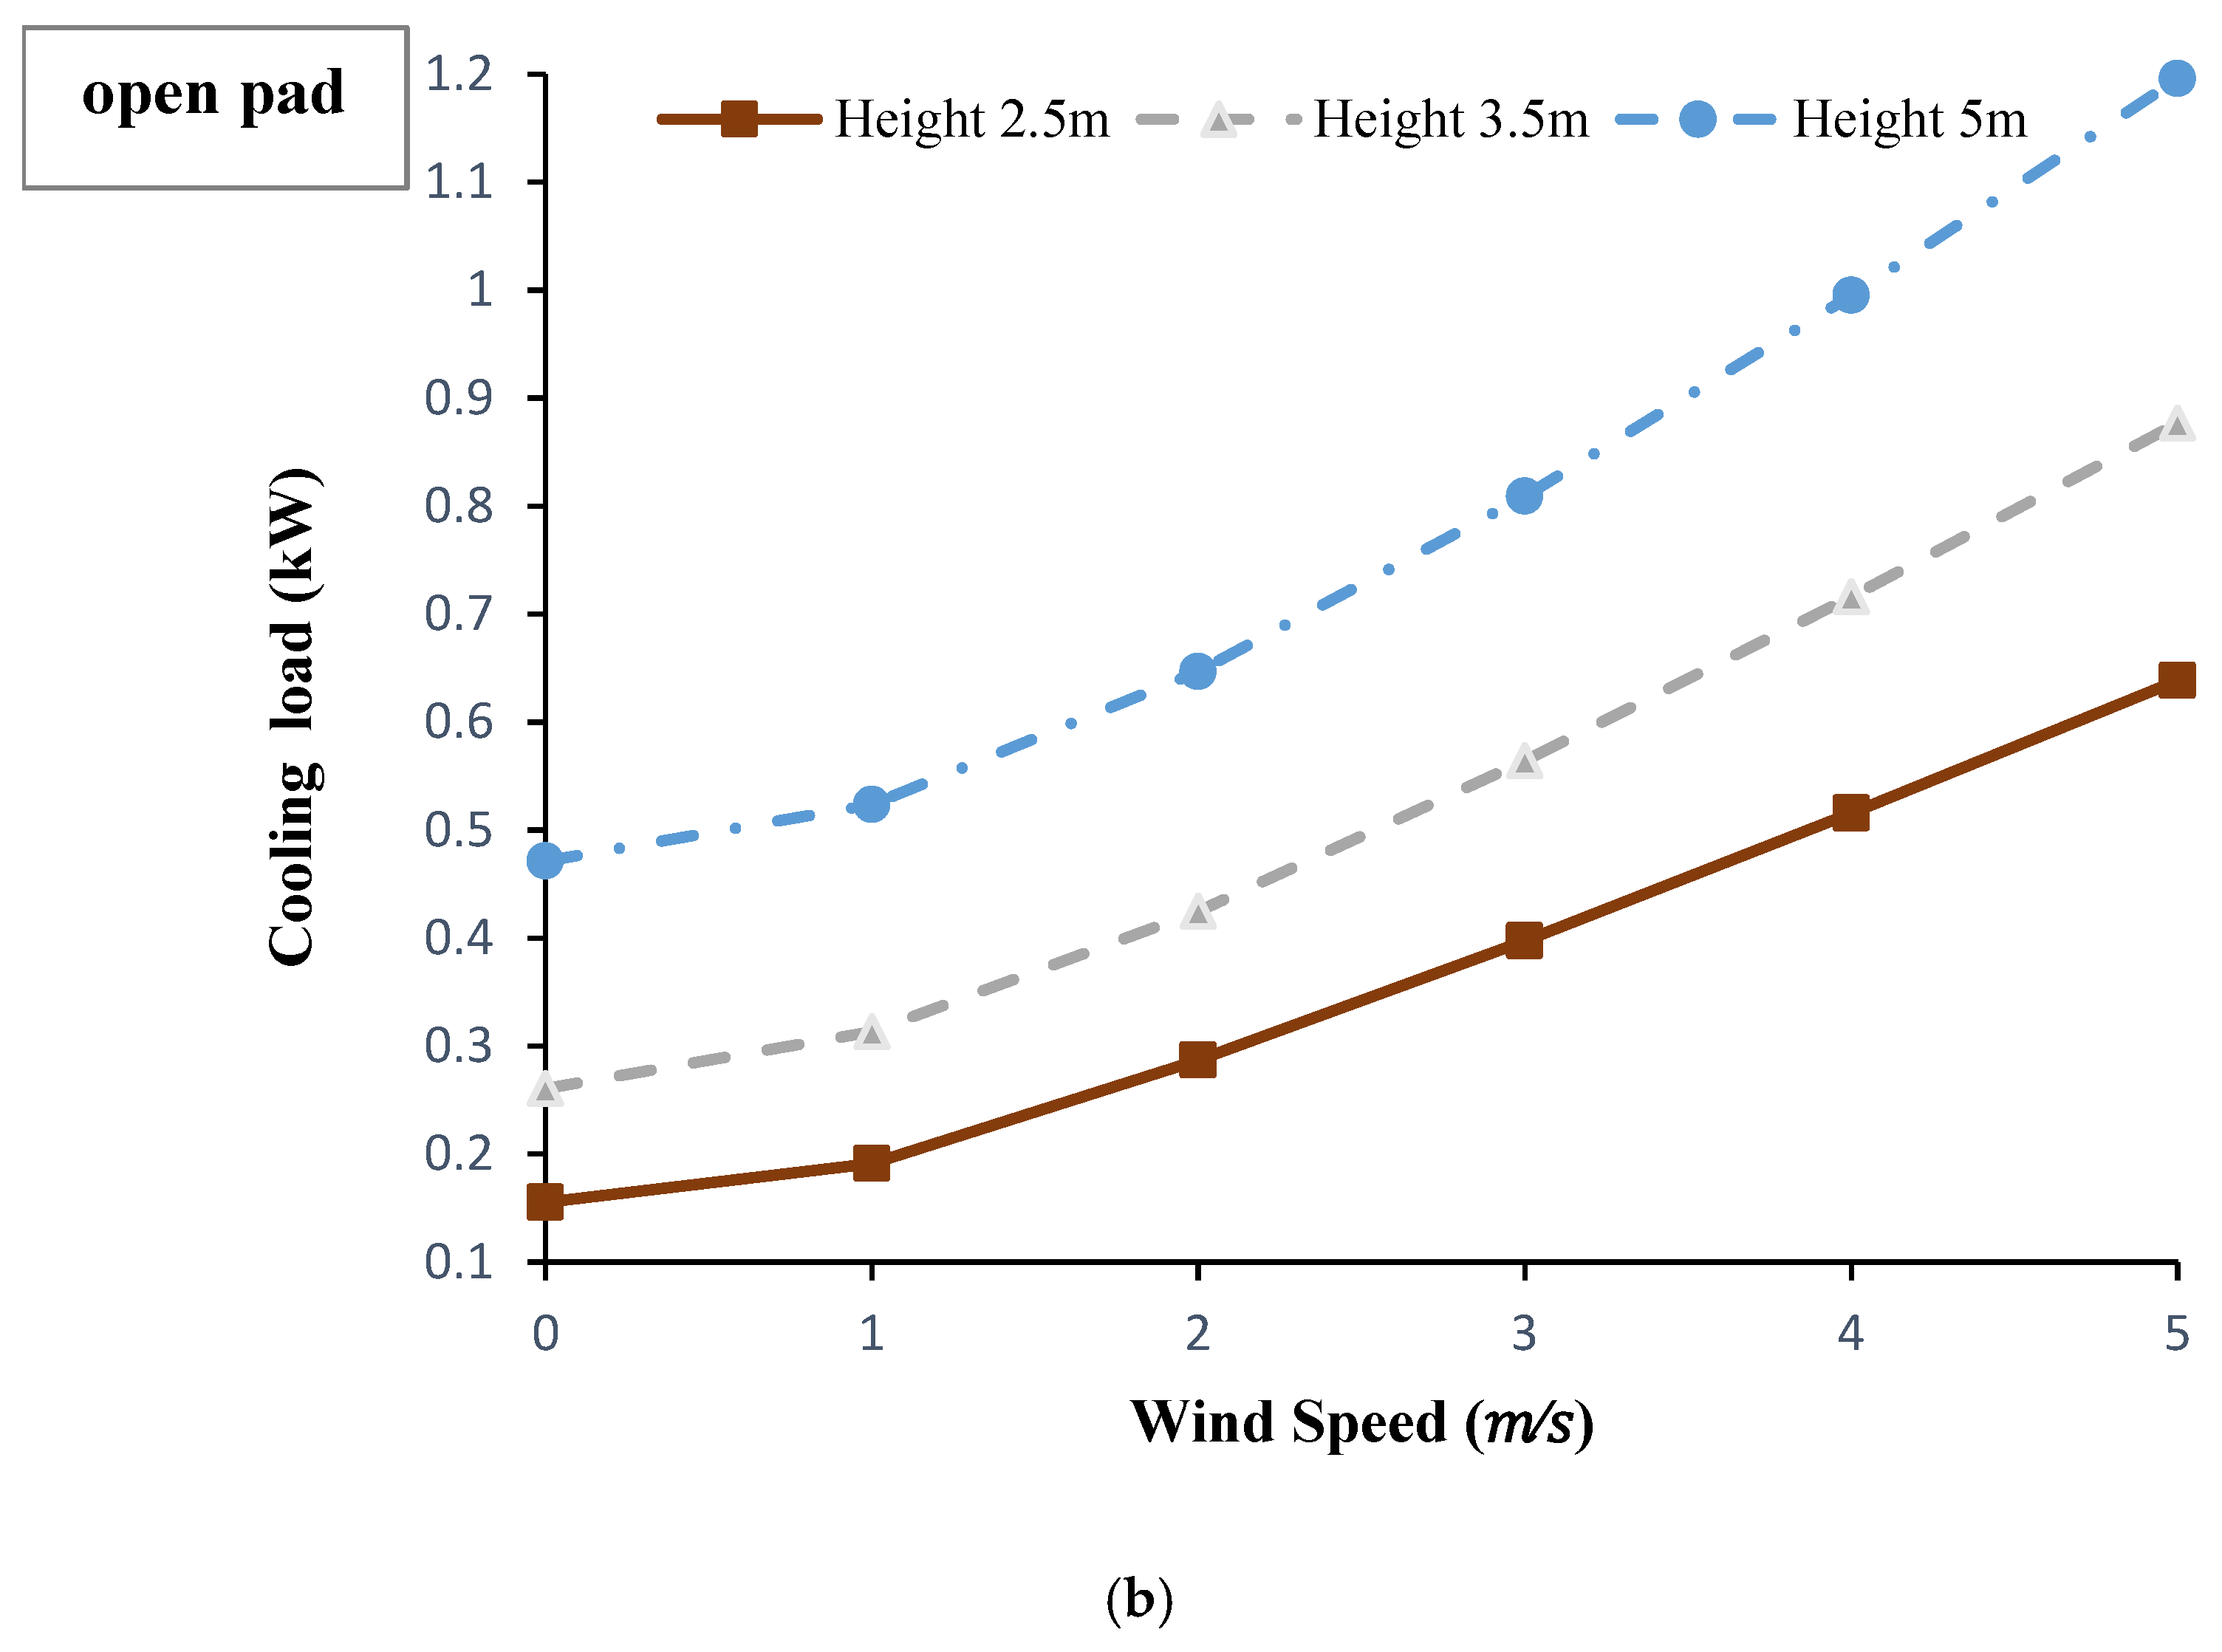
Cooling load is directly related to the air velocity and the temperature drop in the column. Figure 7a shows cooling load variations at the different conditions of the wind speed and wind catcher height applying the closed-pad mode. Clearly, increasing the wind speed up to 3 m/s improves the amount of sensible cooling load. While raising the wind speed more than that point, leads to a decreasing trend in cooling load. This is mainly due to the abruptly increase in the outlet temperature at the higher wind speeds without any considerable increase in the air velocity. On the other hand, the amount of cooling load has been continuously increased with the wind speed when the pad was open (see Figure 7b). Comparing the two modes of wind catcher (Figure 7a,b) indicates that at the wind catcher heights of 2.5 and 3.5 m and the wind speeds of lower than 3 m/s, cooling loads approximately double when applying closed-pad mode. While, at the height of 5 m, there is not a significant difference between the two modes. However, at the condition of no wind flow, a maximum sensible cooling load of 0.48 kW is achievable if the wind catcher height was 5 m.
7. Conclusions
Thermal performance of a laboratory scale unidirectional wind catcher equipped with a combined evaporative cooling system (moist blades section and wetted pad unit) was studied in the present paper. Theoretical assessment of the wind catcher was carried out and a set of experiments were organized to validate the results of the obtained models. The effect of wind speed and wind catcher height were considered at the two situations of the opening pad. The results revealed that:
- -
- Increasing the wind speed increases the velocity and the outlet temperature of the air in the column. The temperature rise was especially considerable at wind speeds more than 3 m/s when using the closed-pad mode which subsequently led to a significant decrease in sensible cooling load.
- -
- When the wind speed was zero, the closed pad resulted in a relatively higher air velocity inside the wind catcher compared with the open-pad mode. While, at the conditions of wind existence, inside air velocity was slightly higher when the pad was open.
- -
- Increasing the height of the wind catcher led to a decrease in air velocity especially at the higher wind speeds.
- -
- Cooling load continuously increased with the wind speed when the pad was open. Whereas when the pad was closed, the maximum value of cooling load was achieved at a wind speed of 3 m/s.
Author Contributions
Azam Noroozi contributed to the article with regards to writing, experiments, model development, analysis. Yannis S. Veneris contributed to the article with corrections and recommendations to the articles contents and relevance.
Conflicts of Interest
The authors declare no conflict of interest.
References
- Zarandi, M.M. Analysis on iranian wind catcher and its effect on natural ventilation as a solution towards sustainable architecture (case study: Yazd). Eng. Technol. 2009, 54, 574–579. [Google Scholar]
- Behbood, K.T.; Taleghani, M.; Heidari, S. Energy efficient architectural design strategies in hot-dry area of Iran: Kashan. Emir. J. Eng. Res. 2010, 15, 85–91. [Google Scholar]
- Maleki, B.A. Wind catcher: Passive and low energy cooling system in Iranian vernacular architecture. Int. J. Tech. Phys. Probl. Eng. (IJTPE) 2011, 3, 130–137. [Google Scholar]
- A’zami, A. Badgir in traditional Iranian architecture. In Proceedings of the International Conference “Passive and Low Energy Cooling for the Built Environment”, Santorini, Greece, 19–21 May 2005; pp. 1021–1026. [Google Scholar]
- Bouchahm, Y.; Bourbia, F.; Belhamri, A. Performance analysis and improvement of the use of wind tower in hot dry climate. Renew. Energy 2011, 36, 898–906. [Google Scholar] [CrossRef]
- Kamal, M.A. Assessment of passive downdraft evaporative cooling technique for environmental sustainability in buildings. Int. J. Res. Chem. Metall. Civ. Eng. 2016, 3, 326–330. [Google Scholar]
- Montazeri, H.; Montazeri, F.; Azizian, R.; Mostafavi, S. Two-sided wind catcher performance evaluation using experimental, numerical and analytical modeling. Renew. Energy 2010, 35, 1424–1435. [Google Scholar] [CrossRef]
- Awbi, H.; Elmualim, A. Full scale model windcatcher performance evaluation using a wind tunnel. In Proceedings of the World Renewable Energy Congress VII, Cologne, Germany, 29 June–5 July 2002. [Google Scholar]
- Dehnavi, M.; Ghadiri, M.H.; Mohammadi, H.; Ghadiri, M.H. Study of wind catchers with square plan: Influence of physical parameters. Int. J. Mod. Eng. Res. (IJMER) 2012, 2, 559–564. [Google Scholar]
- Ghadiri, M.H.; Ibrahim, N.L.N.; Mohamed, M.F. Applying computational fluid dynamic to evaluate the performance of four-sided rectangular wind catcher with different height. Res. J. Appl. Sci. Eng. Technol. 2014, 7, 502–509. [Google Scholar]
- Engelmann, P.; Kalz, D.; Salvalai, G. Cooling concepts for non-residential buildings: A comparison of cooling concepts in different climate zones. Energy Build. 2014, 82, 447–456. [Google Scholar] [CrossRef]
- Bahadori, M.N.; Dehghani-Sanij, A.; Sayigh, A. Wind Towers: Architecture, Climate and Sustainability; Springer: Heidelberg, NY, USA, 2014. [Google Scholar]
- Goudarzi, N.; Zhu, W.D.; Bahari, H. Wind energy conversion: The potential of a novel ducted turbine for residential and commercial applications. In Proceedings of the ASME International Mechanical Engineering Congress & Exposition, San Diego, CA, USA, 15–21 November 2013. [Google Scholar]
- Kalantar, V. Numerical simulation of cooling performance of wind tower (Baud-Geer) in hot and arid region. Renew. Energy 2009, 34, 246–254. [Google Scholar] [CrossRef]
- Poshtiri, A.H.; Mohabbati, S.M. Performance analysis of wind catcher integrated with shower cooling system to meet thermal comfort conditions in buildings. J. Clean. Prod. 2017, 148, 452–466. [Google Scholar] [CrossRef]
- Saffari, H.; Hosseinnia, S. Two-phase euler-lagrange CFD simulation of evaporative cooling in a wind tower. Energy Build. 2009, 41, 991–1000. [Google Scholar] [CrossRef]
- Elzaidabi, A.A.M. Low Energy, Wind Catcher Assisted Indirect-Evaporative Cooling System for Building Applications. Ph.D. Thesis, University of Nottingham, Nottingham, UK, 2009. [Google Scholar]
- Pearlmutter, D.; Erell, E.; Etzion, Y. A multi-stage down-draft evaporative cool tower for semi-enclosed spaces: Experiments with a water spraying system. Sol. Energy 2008, 82, 430–440. [Google Scholar] [CrossRef]
- Kazem Yavarinasab, E.A.M. Investigation the wind catchers of residential houses in Yazd province, Iran. J. Am. Sci. 2013, 9, 276–285. [Google Scholar]
- Ghariblou, M. Assessment of the Empirical Relations for the Pressure and Dry Temperature Drops in Water Coolers. B.S. Thesis, School of Mechanical Engineering, Sharif University of Technology, Tehran, Iran, 1991. [Google Scholar]
- Bergman, T.L.; Incropera, F.P. Fundamentals of Heat and Mass Transfer; John Wiley & Sons: New York, NY, USA, 2011. [Google Scholar]
- Duffie, J.A.; Beckman, W.A. Solar Engineering of Thermal Processes; John Wiley & Sons: New York, NY, USA, 2013. [Google Scholar]
- Handbook, ASHRAE Fundamentals; American Society of Heating, Refrigerating Air-Condition, Engineers Inc.: Atlanta, GA, USA, 2005.
- Jones, B.M.; Kirby, R. Quantifying the performance of a top–down natural ventilation windcatcher™. Build. Environ. 2009, 44, 1925–1934. [Google Scholar] [CrossRef]
- Mortezapour, H.; Ghobadian, B.; Khoshtaghaza, M.; Minaee, S. Performance analysis of a two-way hybrid photovoltaic/thermal solar collector. J. Agric. Sci. Technol. 2012, 14, 767–780. [Google Scholar]
- Taki, M.; Ajabshirchi, Y.; Ranjbar, S.F.; Rohani, A.; Matloobi, M. Heat transfer and mlp neural network models to predict inside environment variables and energy lost in a semi-solar greenhouse. Energy Build. 2016, 110, 314–329. [Google Scholar] [CrossRef]
- Khani, S.M.; Bahadori, M.N.; Dehghani-Sanij, A.; Nourbakhsh, A. Performance evaluation of a modular design of wind tower with wetted surfaces. Energies 2017, 10, 845. [Google Scholar] [CrossRef]
- Joudi, K.A.; Farhan, A.A. A dynamic model and an experimental study for the internal air and soil temperatures in an innovative greenhouse. Energy Convers. Manag. 2015, 91, 76–82. [Google Scholar] [CrossRef]
- Du, J.; Bansal, P.; Huang, B. Simulation model of a greenhouse with a heat-pipe heating system. Appl. Energy 2012, 93, 268–276. [Google Scholar] [CrossRef]
Figure 1.
The schematic view of the designed wind catcher with open and closed pad.

Figure 2.
(a) The photograph of the designed wind catcher, (b) The dimensions of the wind catcher.

Figure 3.
Hourly variations of experimental and calculated outlet air temperature under the conditions of Qaen city during 3–5 May 2017, at the air speeds of (a) 1, (b) 1.5, and (c) 2.5 m/s.
Figure 3.
Hourly variations of experimental and calculated outlet air temperature under the conditions of Qaen city during 3–5 May 2017, at the air speeds of (a) 1, (b) 1.5, and (c) 2.5 m/s.


Figure 4.
Hourly variations of experimental and calculated outlet air relative humidity under the conditions of Qaen city during 3–5 May 2017, at the air speeds of (a) 1, (b) 1.5, and 2.5 m/s.
Figure 4.
Hourly variations of experimental and calculated outlet air relative humidity under the conditions of Qaen city during 3–5 May 2017, at the air speeds of (a) 1, (b) 1.5, and 2.5 m/s.


Figure 5.
Effect of wind speed and wind catcher height on air speed under the conditions of Qaen city at 12:00 p.m. on 3 May 2017 and the modes of: (a) closed pad, (b) open pad.
Figure 5.
Effect of wind speed and wind catcher height on air speed under the conditions of Qaen city at 12:00 p.m. on 3 May 2017 and the modes of: (a) closed pad, (b) open pad.

Figure 6.
Effect of wind speed and wind catcher height on outlet temperature under the conditions of Qaen city at 12:00 p.m. on 3 May 2017 and the modes of: (a) closed pad, (b) open pad.
Figure 6.
Effect of wind speed and wind catcher height on outlet temperature under the conditions of Qaen city at 12:00 p.m. on 3 May 2017 and the modes of: (a) closed pad, (b) open pad.


Figure 7.
Effect of wind speed and wind catcher height on provided cooling load under the conditions of Qaen city at 12:00 p.m. on 3 May 2017 and the modes of: (a) closed pad, (b) open pad.
Figure 7.
Effect of wind speed and wind catcher height on provided cooling load under the conditions of Qaen city at 12:00 p.m. on 3 May 2017 and the modes of: (a) closed pad, (b) open pad.


© 2018 by the authors. Licensee MDPI, Basel, Switzerland. This article is an open access article distributed under the terms and conditions of the Creative Commons Attribution (CC BY) license (http://creativecommons.org/licenses/by/4.0/).
Share and Cite
MDPI and ACS Style
Noroozi, A.; Veneris, Y.S. Thermal Assessment of a Novel Combine Evaporative Cooling Wind Catcher. Energies 2018, 11, 442. https://doi.org/10.3390/en11020442
AMA Style
Noroozi A, Veneris YS. Thermal Assessment of a Novel Combine Evaporative Cooling Wind Catcher. Energies. 2018; 11(2):442. https://doi.org/10.3390/en11020442
Chicago/Turabian StyleNoroozi, Azam, and Yannis S. Veneris. 2018. "Thermal Assessment of a Novel Combine Evaporative Cooling Wind Catcher" Energies 11, no. 2: 442. https://doi.org/10.3390/en11020442
Note that from the first issue of 2016, this journal uses article numbers instead of page numbers. See further details here.