1. Introduction
After perceiving the rapid motorization in large Chinese cities and the economic, environmental, energy and safety issues going with it, the Ministry of Transportation (MoT) in China launched a “Transit Metropolis” program in 2011. There is a general consensus that a rapid and smooth adoption of technologies favoring low-carbon consumption in individual passenger transport is not to be expected, especially among the less developed cities in China. Promotion of urban sustainable transportation through public transit development is therefore believed to be the most feasible solution for saving energy consumption and securing clean air [
1,
2]. The aim of the MoT’s program is thus to select through a contest and fund at least 30 cities that have the greatest potential to become “Transit Metropolis” demonstration cities and whose experience and lessons with the construction of transit metropolis can be transferred to other cities in China. On the 26 October 2012, the MoT announced the first batch of demonstration transit metropolises including 15 large cities in China (Beijing, Shijiazhuang, Taiyuan, Dalian (our case), Harbin, Nanjing, Jinan, Zhengzhou, Wuhan, Changsha, Shenzhen, Chongqing, Kunming, Xi’an and Urumqi). To strengthen the implementation of the program, the MoT organized the National Urban Public Transport Working Conference in 29 October 2012, where the minister and the vice minister gave speeches to emphasize the importance of the transit metropolis program and to encourage the selected demonstration cities to adopt innovative and mixed transport approaches to ensure its implementation. In December 2012, the State Council (SC) reconfirmed this program by launching the Guidance on Cities Giving Priority to Public Transport Development. Given the SC’s policy support, the MoT published the Decision on Promoting the Construction of Transit Metropolis in July 2013 and called for more cities to apply for demonstration transit metropolis status. In 22 October 2013, other cities were included by the MoT in a second batch of demonstration transit metropolises (Tianjin, Baoding, Hohhot, Shenyang (our case), Changchun, Shanghai, Suzhou, Hangzhou, Ningbo, Hefei, Fuzhou, Nanchang, Qingdao, Xinxiang, Zhuzhou, Guangzhou, Liuzhou, Haikou, Guiyang, Lanzhou, Xining, Yinchuan).
For all 37 demonstration cities, the MoT introduced the Target System for the Evaluation of the Transit Metropolis in 2013. The target system consists of 30 indicators reflecting the quality of public transit service, among which 20 indicators (e.g., modal split of public transit; number of transit vehicles per 10 thousand people; punctuality rate of public transit; passenger satisfaction on transit service; etc.) are compulsory, and 10 indicators (salary level of transit employees; age of transit vehicles; etc.) are voluntary. The 37 cities have autonomy to set targets in 2017 on the compulsory indicators after comprehensively considering their practical local context. Then, the MoT will evaluate the achievements of the targets in the year 2017, and a Special Taskforce for Transit Metropolis Development was established to conduct surprise inspections in local areas.
Until 2016, the MoT has spent billions of RMB across the 37 demonstration cities as seed funds that incentivizes local efforts to implement the program. The “Transit Metropolis” program is therefore the largest ever government-led program for transit metropolis promotion worldwide. How has the program been implemented locally? Have the demonstration cities followed the same principle or taken comparable measures to implement their version of the transit metropolis? What is their performance? And what are the factors promoting and preventing good performance? This article attempts to answer the above questions through a comparative case study. We use Dalian and Shenyang as two cases; both cities are cities of millions and they are located in the Liaoning province and thus they share the same provincial level institutional background. They are different in terms of their economic vitality. Shenyang is an in-land old industrial city and is currently undergoing economic transformation. Dalian has a sea-location and is considered one of China’s more open and innovative harbor cities.
The article is organized as follows:
Section 2 introduces Cervero’s framework on demand-side and supply-side approaches to for transit metropolis development, with a literature review on world-wide experience with the adoption of these approaches.
Section 3 details sources of information and introduces the two case cities.
Section 4 depicts the implementation strategies of Shenyang and Dalian as well as their performance in achieving their targets.
Section 5 is a comparative case study based on our empirical findings.
Section 6 concludes the article and answers the research questions.
2. Cervero’s Demand-Side and Supply-Side Framework on Transit Metropolis Implementation
Cervero has published one of the most influential works on transit metropolis [
3]. According to Cervero and a few other influential scholars (Bertolini, Clercq and Kapoen [
4]; Calthorpe [
5]; Curtis, Renne, et al. [
6]; Mu and de Jong [
7,
8]; Cervero and Day [
9]; Cervero and Dai [
10]), the transit metropolis offers a paradigm for sustainable regional development. A transit metropolis is a region where a workable fit exists between transit services and urban form. In some cases, this means compact, mixed-used development well suited to rail services, and in others it means flexible, fleet footed bus services well suited to sprawled development. A key point in the concept is that transit and the city co-exist in harmony. Through a global inquiry of measures, instruments and strategies for the construction and development of the transit metropolis, Cervero establishes a demand-side and supply-side framework that consists of a variety of effective approaches for successful implementation [
3]. In this article, we adopt Cervero’s framework to examine the implementation of transit metropolis policies in Shenyang and Dalian.
In Cervero’s framework (
Table 1), there are demand-side and supply-side approaches for building a transit metropolis. The demand-side approaches include five main instruments. The first is called “Transportation demand management”. It aims at making more efficient use of transportation resources already in place by shifting demand (e.g., into carpools or outside the peak), or eliminating trips altogether (e.g., telecommuting). The second is “Restraints on automobile use”, which holds the rationale that local streets belong to their residents; the street is viewed as an extension of the livable space of one’s own home and yard; and thus reducing automobile speed is vital to creating a safe and livable neighborhood. The third is “Regulation of automobile performance”, which puts requirements on automobile manufacturers, not automobile users, to promote the design of fuel-efficient, low-emission cars. The fourth is “Setting the right prices”, which is a market-based instrument to discourage car use. Finally, Cervero proposes the role of regulation of land use and urban design in changing transport demand. It demonstrates that higher urban density, mixing land use and a high quality urban design has a positive effect on attracting people to trains and buses [
3].
The supply-side approaches contain three major instruments. One is “Advanced technologies”, which places the hope of building a transit metropolis partly on advanced technologies and information systems because these technologies may make the transport system much more intelligent and smarter. The second is “Telecommunications”, which aims to provide citizens with an “information superhighway” to promote video-conferencing, tele-shopping and working at home. The third is “Non-automobile transportation”, which aims at improving public transit infrastructures, and developing slow-mode (e.g., bicycle/walking) facilities. The increase in the attractiveness of public transit may trigger a modal shift from private car to public transit. Additionally, bicycles and walking can function valuably as feeders into transit lines.
Worldwide experience with developing transit metropolises shows that different cities and city-regions have adopted different configurations of the above listed approaches.
In the United States, the San Francisco Bay Area (SFBA) is a typical case where land use and transport are well coordinated. SFBA has taken on a distinct polycentric metropolitan form through land use regulations that promote thriving employment centers encircling downtown San Francisco located close to residential centers allowing comfortable commuting between downtown and suburban areas. Research by Cervero and Wu [
11,
12] reveal that the polycentric growth in the SFBA appears to have resulted in shorter commuting times, and generally higher shares of workers in the employment centers go to work by mass transit and ride-sharing. In Southern California, TDM from the demand-side has been most aggressively pursued, but its performance was hardly satisfactory. In the early 1990s, a “Regulation XV” was enacted and mandated the instrument of ride-sharing. The Regulation XV requires large employers to introduce measures to substantially reduce single-occupant automobile trips made by their employees, or to introduce company-sponsored vanpools. Due to the lack of government subsidy and rising costs for companies, these measures did not lead to high performance simply because the large employers showed little willingness to implement the policy [
13,
14]. With the failure of the ride-sharing policy, there was a growing consensus in the United States that parking management would be one TDM approach with high payoff potential. As a result, a few cities like Oakland in California introduced parking charges and eliminated free parking policies, which reduced automobile trips made by employees by roughly 19% [
15]. More recently, regulation of automobile performance has grown more popular with the introduction of the U.S. corporate average fuel efficiency (CAFE) standards [
16,
17]. Large automobile manufacturers in Detroit are required to produce fuel-efficient and low-carbon cars, and this approach has also relied heavily on government mandates. The manufacturers have to sell zero-emission and clean cars, or buy fuel-efficiency credits from other manufacturers. Otherwise, the manufacturers have to pay penalties amounting to 5000 US dollars per credit to the government. Apart from these mandate measures, many cities and city-regions in the United States now promote telecommunications from the supply-side approach. Companies are encouraged to allow their employees to work at home. The government is responsible for building neighborhood tele-work centers equipped with high speed data transmission devices [
18].
European countries have also adopted a combination of different measures. The European Union has enacted regulations on automobile performance, from initial voluntary agreements to the current mandated measures. Automobile manufacturers whose cars will discharge excessive levels of emissions have to pay fines. Apart from the regulation on automobile performance, many European countries (e.g., the Netherlands, France, Belgium, Germany, Sweden, Finland, Denmark) use “soft” measures to tame automobile traffic and ensure cycling and walking safety. The most widely observed measures include designing skinny, curvilinear residential streets, implanting street trees and furniture that force cars to a crawl, necking down intersections, installing speed tables and using bumpy road surfaces [
19]. Different from the United States, most Western European countries’ efforts in building transit metropolis lie in the adoption of supply-side approaches for public transit infrastructure, including the use of advanced technologies to make the transit system more intelligent and smarter, and the development of non-automobile transportation [
20]. The real-time transit information on operation schedule, degree of crowdedness and transit positions on the road are provided for potential transit users through smart apps, and information showing time for the next coming transit is displayed on the electronic monitor at station. Transit users may use one card to pass through different transit modes. The development of non-automobile transportation lies in building slow-mode transportation networks. The Netherlands, Germany, Sweden, Finland and Denmark, specifically, emphasize the role of bicycling and walking as feeders to transit services, and design special lanes for bicycling and street-networks for walking. Transit stations are also designed with large areas for bicycle parking [
21].
Different from the European countries where soft measures are used to restrict automobile usage, Asian countries tend to be more heavy-handed in imposing restraints on automobile usage [
22,
23]. Examples include license plate auctions (in Singapore and Shanghai [
24,
25]), car registration lotteries (in Beijing [
26]), and banning cars from operating on particular days of the week (also in Beijing [
27]). Heavy-handed measures are also reflected by setting the right prices. In the United States and the European countries, the true social-cost pricing of metropolitan travel has proven to be a theoretical ideal that so far has eluded real-world implementation (exceptions are Norway and United Kingdom that implement congestion fees in several of their cities). However, in Asia countries where there is a tradition in central planning (as in Singapore and China), congestion fees, car purchasing taxes, carbon taxes and oil taxes have been widely adopted [
28]. Like the European countries, many Asian countries, especially those developing ones whose transit construction has lagged behind, focus on supply-side approaches for building a transit metropolis. Singapore, South Korea, Japan and China are actively improving their transit systems with advanced technologies. Singapore, for instance, installs real-time data transmission devices on its public buses, in order to monitor the punctuality of transit service [
29]. In addition, most Asian countries are intensively implementing their transit construction plans including regular bus network expansion, and construction of new BRT and metro lines [
30].
In the following sections, we use Cervero’s demand-side and supply-side approaches as a basic framework to examine the practices of transit metropolis implementation in Chinese cities. Before that, in the next section, we briefly introduce our case areas and report our data sources.
3. Introduction of the Case and Data Collection Procedures
3.1. Introduction to Shenyang and Dalian
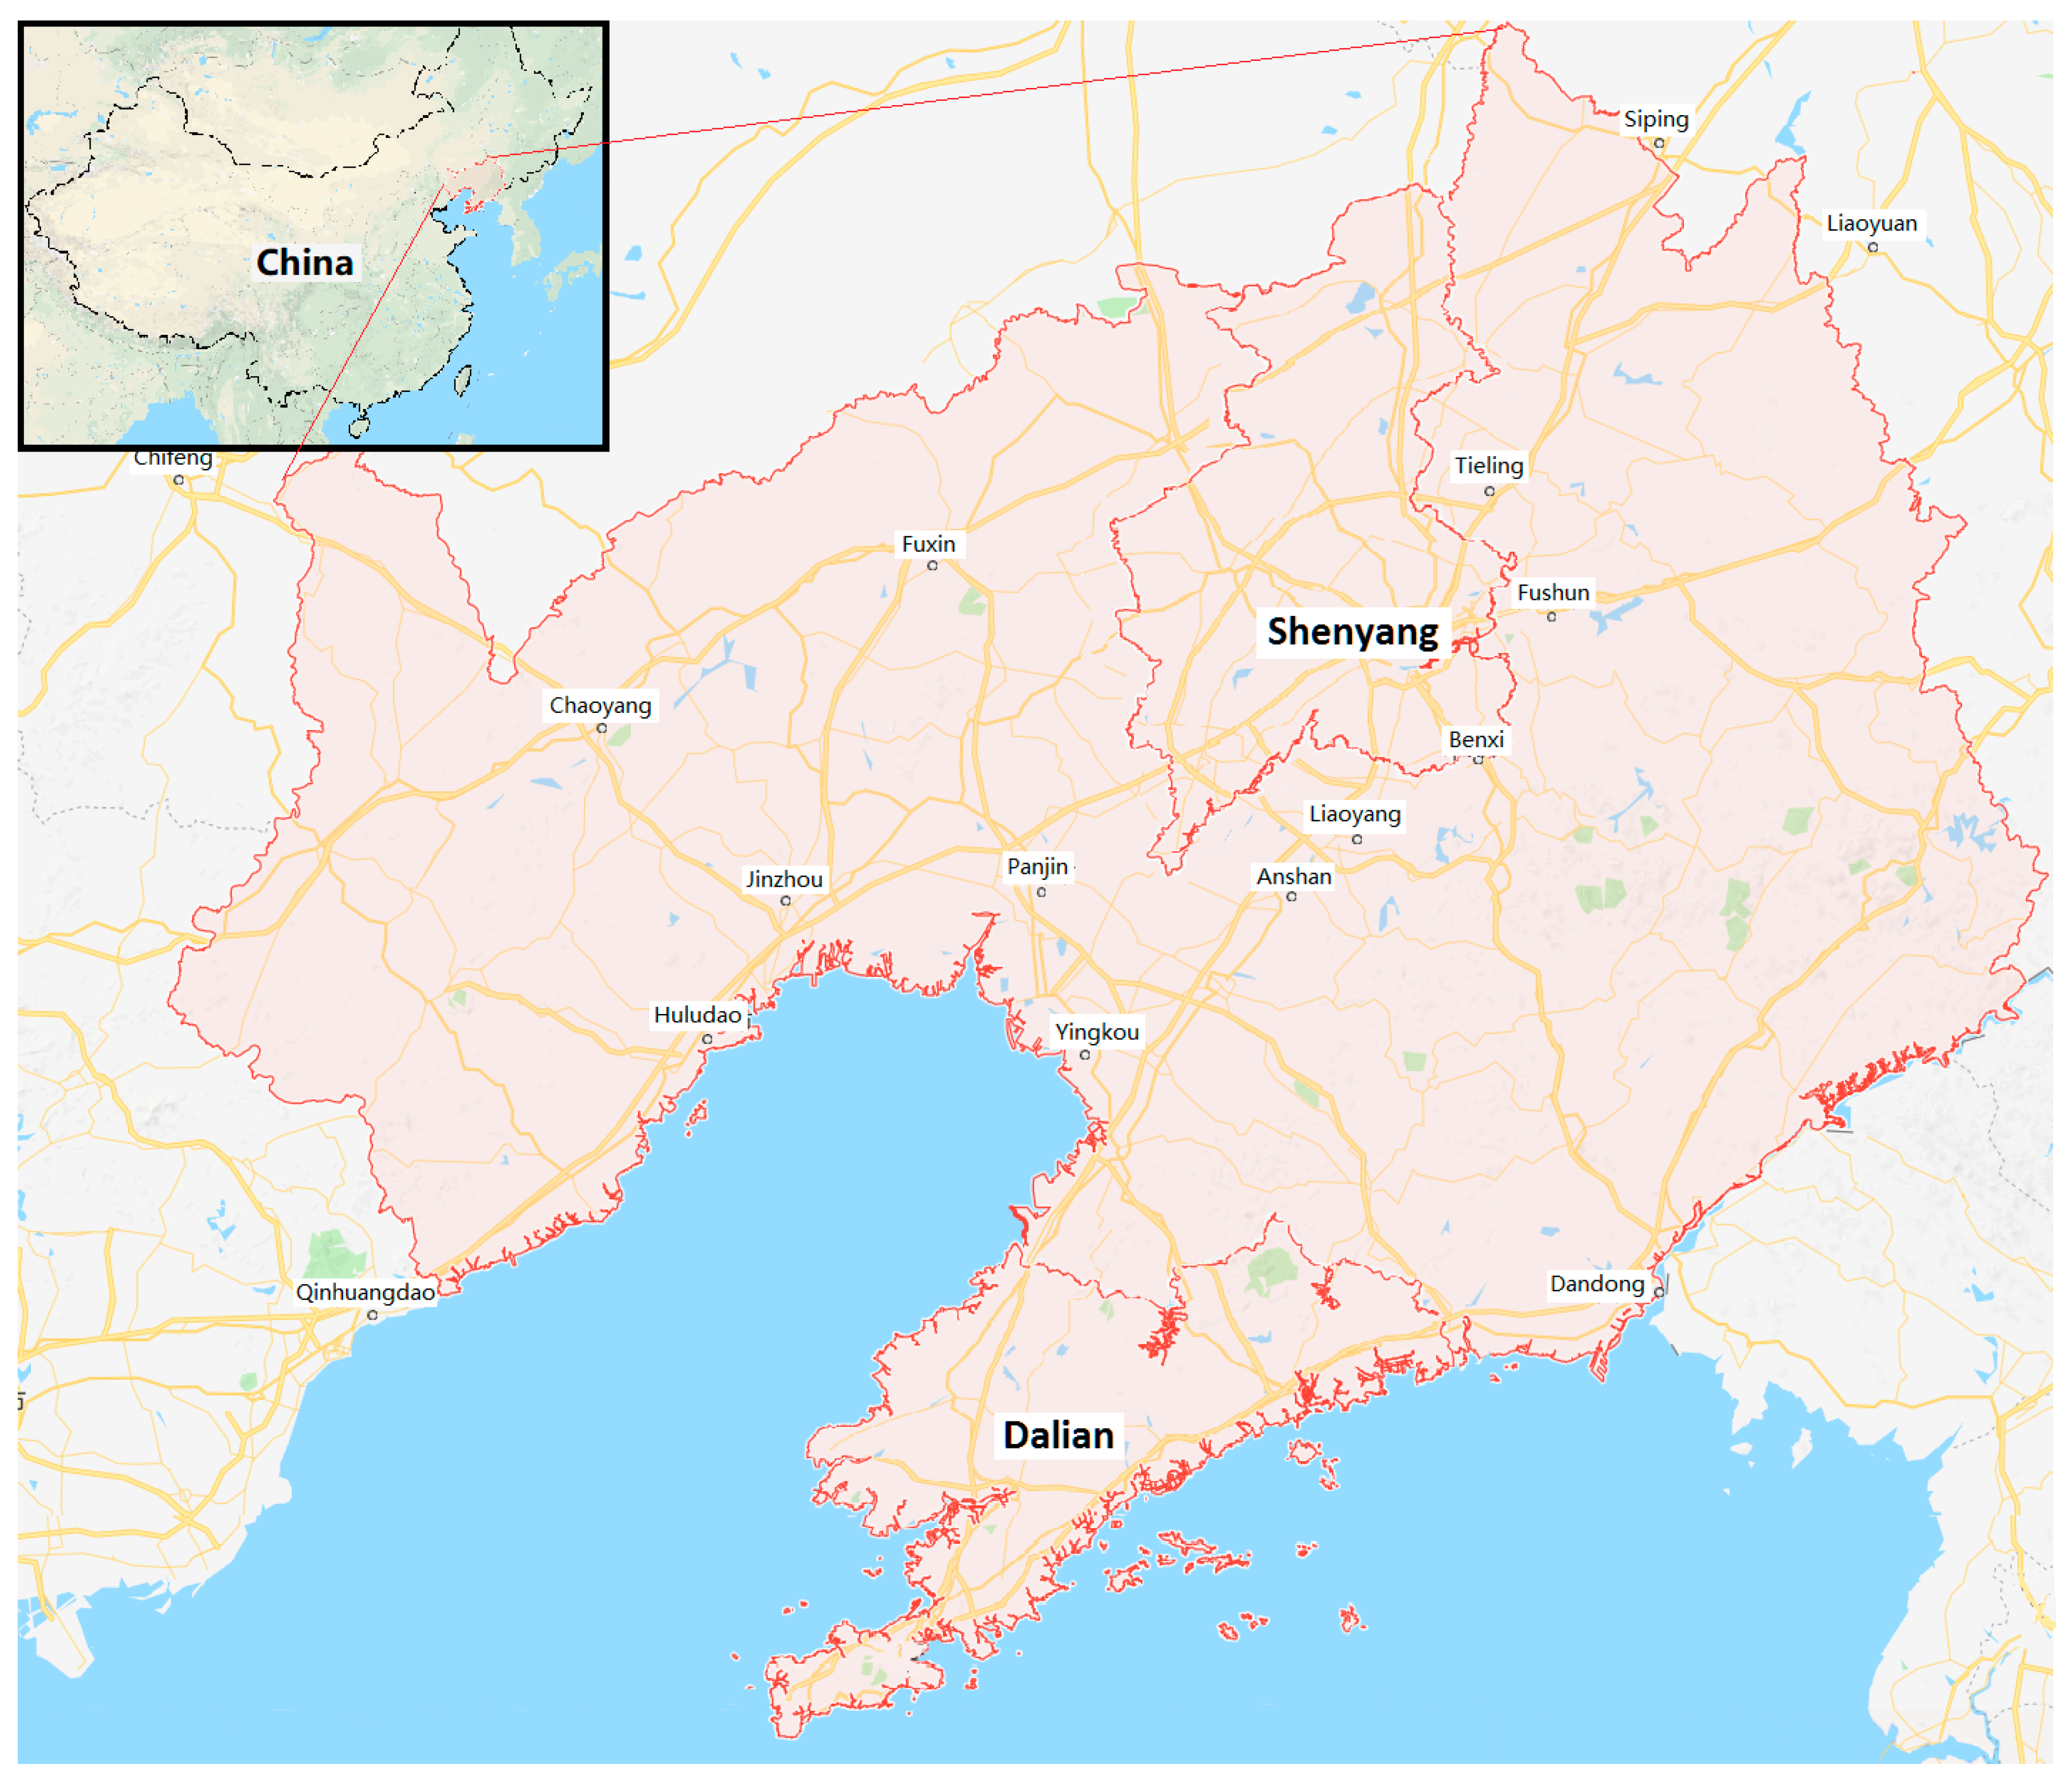
Our case studies consist of two cities located in Liaoning Province in Northeast China; one is the provincial capital city of Shenyang, and the other is the harbor city of Dalian (
Figure 1). Shenyang has a total administrative area of 12,948 km
2, with a permanent population of 8.29 million, making it the largest city in Northeast China and the 11th largest city in the whole country. It has a main urban area of 709 km
2 where some 4.33 million urban people resided in 2015. Shenyang is a typical old industrial city; it has been called the “Ruhr of the East”, and was deeply affected by the planned economy. The city has a large proportion of state-owned enterprises, industrial workers and danwei communities. Since 1980s, however, the city has suffered from a major economic depression because of its maladjustment to the market economy. Many enterprises went bankrupt and workers were laid off. Urban areas, especially those traditional industrial areas occupied by state-owned enterprises and danwei communities, became problematic areas and are currently under redevelopment.
Dalian is located in the southern tip of the Liaodong Peninsula in Northeast China, with the Yellow Sea to the east and the Bohai Sea to the west. The city has a total administrative area of 13,237 km2, with a permanent population of 6.98 million, making it the 13th largest in China. Dalian has a mountainous landform, with a main urban area of 621 km2 and a population of 2.66 million in 2015. Dalian is sub-provincial city, which means that it is ruled by the province but in some aspects such as economic policy, it has some discretion. Since the 1980s, Dalian actively embraced the economic reform policies and has enjoyed continuous high-level GDP growth. Dalian has evolved from a small fishing village to one of China’s most dynamic and modern industrialized economies. In addition, Dalian is also one of China’s most prosperous business areas, tourist destination, and a distribution center for goods and materials with the Dalian Container Port linking more than 20 international ocean-shipping routes.
3.2. Urban Growth and Motorization in Shenyang and Dalian
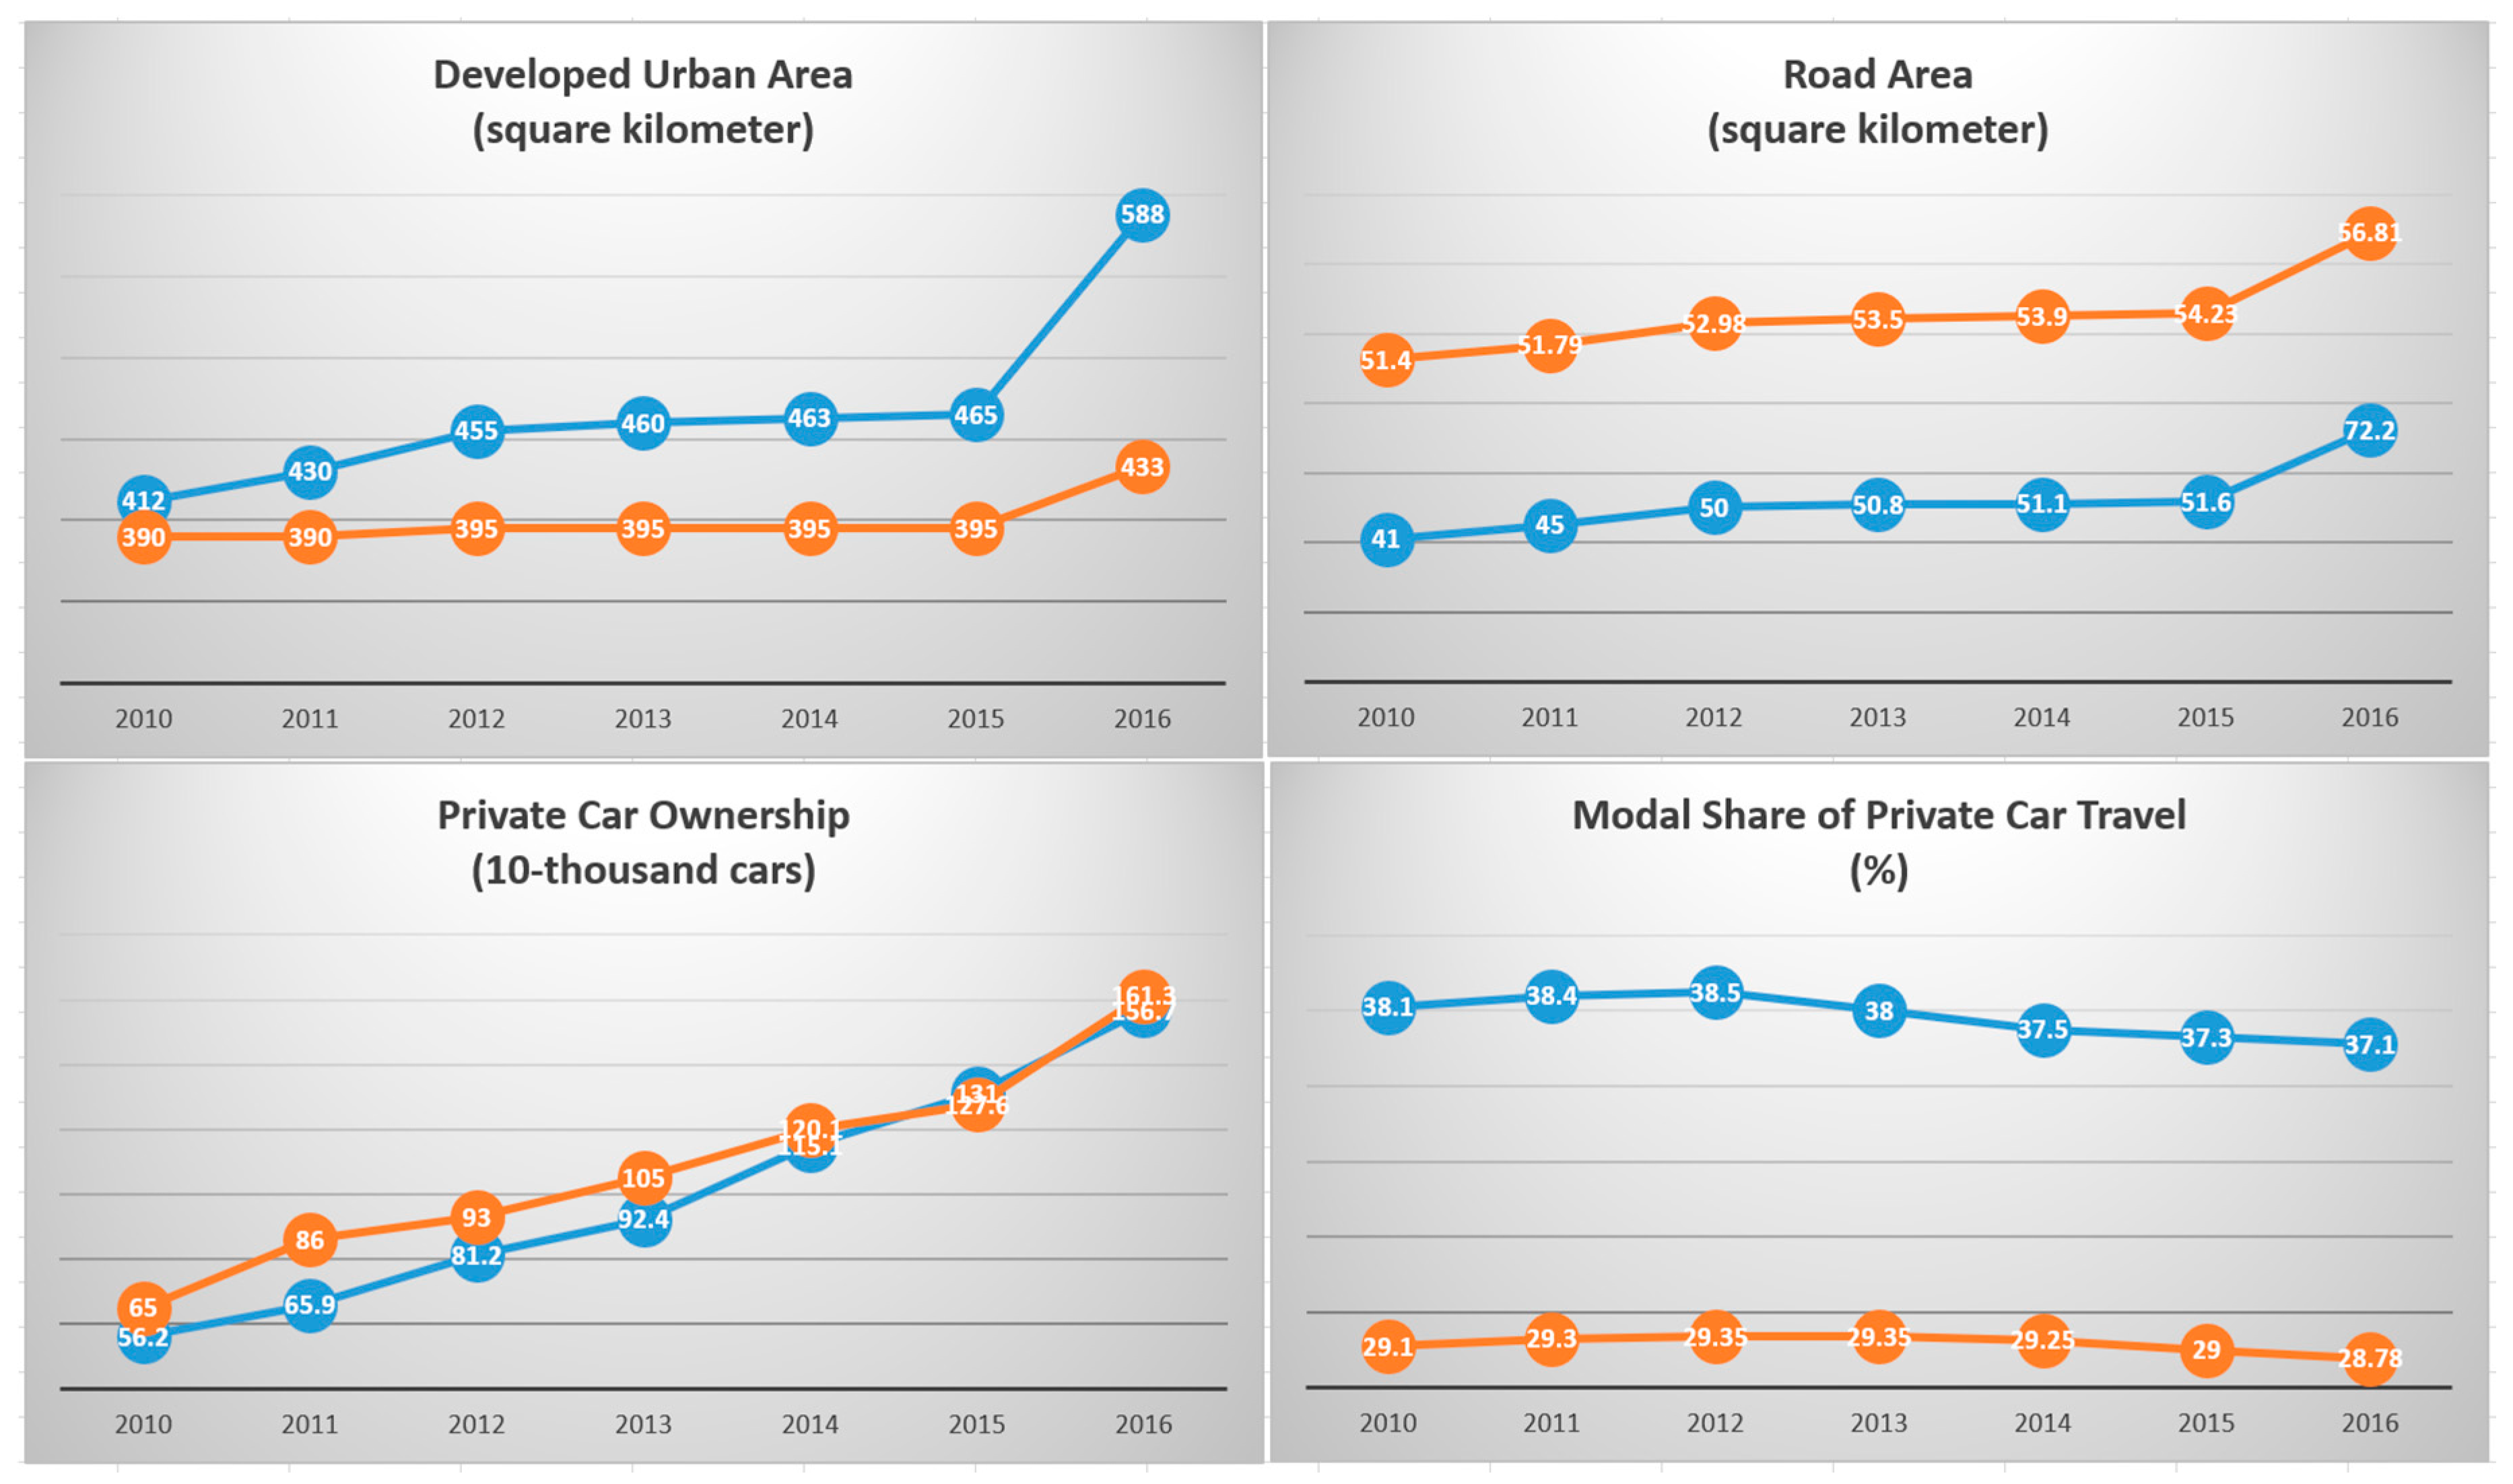
As
Figure 2 shows, the speed and the scale of urban growth in Shenyang has exceeded that in Dalian (top left corner), measured by the urban area that has been developed. However, the road area of Dalian is larger than that of Shenyang (top right corner), meaning that, given a relatively smaller developed urban area, Dalian invests more in road infrastructure construction than Shenyang. Another interesting statistic is that of private car ownership (lower left) and the modal share of private car travel (lower right). For the past several years Dalian has had higher private car ownership than Shenyang, although since 2014 Shenyang has been catching up. In spite of this fact, Dalian’s modal share of private car travel has remained lower than Shenyang. That being said, although Dalian has higher road density and private car ownership than Shenyang, Dalian’s residents are more inclined to choose public transit as their main transport mode.
Dalian and Shenyang’s rapidly growing private car ownership can be explained from the fact that Liaoning Province hosts a large-scale conglomeration of car manufacturers. At a time when Liaoning is facing economic crisis, the car industry has contributed significantly to continued economic growth. Liaoning’s provincial government has made the car industry one of its pillar industries to sustain economic growth. Since 2010, Liaoning has formed a large scale industrial agglomeration composed of 414 car manufacturers in Shenyang, Dalian, and their nearby cities including Dandong, Chaoyang, Jinzhou and Tieling.
3.3. Public Transit in Shenyang and Dalian Prior to the “Transit Metropolis” Program
Table 2 compares public transit in Shenyang and Dalian prior to the “transit metropolis” program. As can be seen, Shenyang’s overall situation before implementation of the transit metropolis was more vulnerable than that of Dalian. Although Shenyang has a larger absolute number of transit lines and a larger scale transit network than Dalian, its density of transit network is much lower (1.69) than Dalian (2.34). In addition, Shenyang has a shorter length of exclusive bus lanes than Dalian and a lower level of modal split for public transit. Its number of vehicles per 10 thousand people is also lower than that of Dalian. With less developed transit infrastructure, Shenyang has to carry more passengers than Dalian on a daily basis. This makes transit services in Shenyang much busier and more crowded.
3.4. Data Collection
The methods used to collect data included interviews, observations and documentation (academic articles, media news and government documents). From 11 December 2017 to 22 December 2017, we visited three places and conducted 12 semi-structured interviews with officials from the central, provincial and municipal governments. The sampling approach is mainly based on the snowball method, first interviewing our personal acquaintances who then introduced us to their peers in other governmental departments. First, through a transport planning expert from the Transportation Research Center at Tsinghua University we were introduced to the official in the Ministry of Transportation in charge of the “transit metropolis” program. We conducted a telephone interview with this official and asked him questions about the overall situation of the implementation of transit metropolis in China. Second, via a personal acquaintance we were introduced to the director of the Liaoning Department of Transportation (LDoT). On 11 and 12 December 2017, we visited LDoT and conducted seven interviews with the director of the department, a chief of the Urban Transportation Bureau under LDoT, a chief of the Passenger Transportation Section under DLoT, and four officials responsible for the transit metropolis program in Liaoning. On 13 and 14 December 2017, we visited the Shenyang Transportation Bureau (STB), and conducted three interviews with a director of the bureau and two section chiefs. 18–22 December 2017, we visited the Dalian Transportation Bureau (DTB) and conducted two interviews with section chiefs in charge of passenger transport and the transit metropolis program respectively.
In addition to the information from interviews, we obtained the following internal unpublished materials from the above-mentioned government agencies: (1) Liaoning Department of Transportation provided us with: Documents on Shenyang Applying for the Transit Metropolis; Shenyang Implementation Plan for the Transit Metropolis; Documents on Dalian Applying for the Transit Metropolis; Dalian Implementation Plan for the Transit Metropolis. (2) Shenyang Transportation Bureau provided us with: 2014 Report on Transit Metropolis Construction in Shenyang; 2015 Report on Transit Metropolis Construction in Shenyang; 2016 Report on Transit Metropolis Construction in Shenyang. (3) Dalian Transportation Bureau provided us with: 2014 Report on Transit Metropolis Construction in Dalian; 2015 Report on Transit Metropolis Construction in Dalian; 2016 Report on Transit Metropolis Construction in Dalian. Although literature on performance measurement reveals that the performance numbers are politically sensitive and significant for the elected officeholders, and thus it is highly possible for the numbers to be manipulated [
31], statistics on the development of the transit metropolis in the above mentioned reports can be regarded as reliable, because the numbers on performance are required to be verified by local audit offices, and additionally, the officers from the MoT conduct surprise inspections on the implementation of the program and contrast the inspection results with the reported performance data.
The interview data were combined with information from academic articles, media news and open government documents on transit metropolis development. This information helped in interpreting the respondent narratives and allowed us to obtain a better understanding of transit metropolis development in China.
4. Implementation of Transit Metropolis in Shenyang and Dalian
This section presents a review of measures and approaches used by Shenyang and Dalian to achieve the targets of the transit metropolis. This will contribute to our understanding of the two cities in terms of their performance in the implementation of the transit metropolis policy.
4.1. Implementation of the Transit Metropolis in Shenyang
To apply and implement the transit metropolis program, Shenyang established the Leading Group for Building Transit Metropolis (LGBTM) in 2012, which is a taskforce chaired by the mayor and constituted by various heads from the transportation, land use, environmental protection, urban construction and housing, law enforcement, development and reform departments. The LGBTM has periodic meetings to discuss and solve the cross-sector policy, planning and implementation problems during transit metropolis construction. The LGBTM first launched the Municipal Ordinance on Implementing Transit First Policies, and revised the Regulations on Rail Transit Operation, and the Regulations on Public Bus Operation. Afterwards, the LGBTM organized transport experts and urban planners at Tsinghua University and from the research institutes under the MoT to draw up the Key Action Plan for Transit Metropolis (KAPTM), which consists of six major measures for Shenyang to develop the transit metropolis. In the period 2014–2016, the KAPTM has been largely implemented, with a total investment of 3.13 billion RMB (excluding money input for metro construction).
4.1.1. City Ring Integrated Transit Hubs
Before the transit metropolis program, Shenyang had 19 bus operators that run 204 bus lines in total but in a fragmented way. Although different operators are coordinated by an umbrella organization, the Shenyang Passenger Transportation Corporation (SPTC), in terms of avoidance of competition, fare collection and distribution on the basis of the agreed-upon formula, different lines are insufficiently coordinated in terms of schedules and physical connections for efficient and convenient transfers at stations or terminals. This physical and operational disintegration constitutes a barrier to increasing transit ridership. To solve this problem, the KAPTM formulates the Plan of City Ring Integrated Transit Hubs. The plan consists of the construction of 17 new integrated transit hubs encircling the main urban area. The total investment is 1.371 billion RMB, and some 580 thousand km2 land resources are allocated to these hub projects. By 2016, the 17 projects had been almost finished, with 12 hubs already in operation. In the new integrated transit hubs, different lines from various operators are horizontally integrated to create a “seamless” transfer. To achieve this, different lines are also designed with a unified schedule system. With the new hub projects, when a passenger wants to travel by transit, he or she should be able to view transit as a single system rather than several different systems that require special knowledge about which lines to use, how to transfer and how to pay fares. In addition, four out of the 17 hubs are designed for vertical transit integration facilities that combine regular bus services with metro services.
4.1.2. Metro System with Feeder Buses
Before Shenyang was selected as a transit metropolis demonstration city, it had the Plan for Metro Construction, and two metro lines (line 1 and line 2) have opened to traffic in 2010 and 2012 respectively. Line 1 has a length of 27.8 km, running from west to east; line 2 has a length of 27.16 km, running from north to south; thus the two lines create a cross-shaped backbone for high-performance passenger transportation. The two lines have 44 stations and carry some 760 thousand passengers per day. In the years 2014–2016 (the period of the transit metropolis program), Shenyang continued to invest in four metro projects (line 9, line 10, line 2 extension and line 4). The construction of the four projects requires an investment of 61.2 billion RMB, and will extend the metro network with an extra length of 103 km and 70 stations. These four lines are planned to open for traffic in 2018, albeit after the evaluation of the transit metropolis program. With line 1 and line 2 in operation, Shenyang’s immediate efforts lie in the adjustments of regular buses to create feeder bus services to metros. During 2013–2017, Shenyang opened 22 new bus lines and adjusted 66 bus lines to transfer passenger from the bus system to the metro system, resulting in an increase in bus lines by 323.3 km and an increase of metro ridership by 120 thousand passengers per day. The metro system with feeder buses in Shenyang provides passengers with transit services that are reliable, high-speed and free of congestion, making it competitive with car traffic.
4.1.3. “Transit First”
As is common practice in several western European countries, “transit first”, and priority for transit vehicles is also used in Shenyang as one of the main measures for building a transit metropolis. A set of primarily low-investment cost measures are adopted to allow transit vehicles to travel faster and to experience fewer delays on their routes. First, transit vehicles are separated on some roads by exclusive rights-of-way (ROW). In 2014, Shenyang increased the length of exclusive ROW for buses by 27.3 km. In 2015, the increased length went up to 52 km, and in 2016 the length was increased by 111.8 km. Second, these exclusive ROWs for buses are installed with an electronic monitoring system. Until 2016, 56 monitoring devices have been installed and operated for preventing encroachment by cars. And in 2016, the Transportation Law Enforcement Corps (TLEC) punished 20,080 private drivers who illegally used the exclusive ROW for buses. Third, at signals public buses get a green light before other traffic; and at intersections public buses will be exempted from “no-left turns”.
4.1.4. Intelligent Transportation System (ITS)
ITS technology and programs are heavily funded by governments in many advanced countries. Although strongly oriented to highway traffic, ITS included a number of features that can benefit transit operations. In addition to the safety devices and increased reliability of traffic flows, which benefit all vehicles, ITS can provide significant improvements in the precise tracking of transit vehicles. This facilitates the operation of control centers that follow bus travel and intervene when delays occur, detours are needed, or other unusual events must be handled. Recognizing these benefits, the Shenyang Transportation Bureau (STB) has outsourced the development of ITS on transit vehicles to two private enterprises, one responsible for the design and installation of ITS on more than 7000 transit vehicles and another responsible for system maintenance and upgrading. The investment was 8 million RMB. Another measure is the development of a Passenger Travel Information System. In 2015, the STB formulated the Construction Plan for Easy Transport and collaborated with China Unicom, in which an app for cell phones was developed with integrated transport information on transit, taxi, and car parking facilities. The investment was 5 million RMB. Passengers may obtain information from the app on transit schedules, lines, fares and may book and pay transit tickets and taxi services online. In addition, passengers may also obtain information on retail services along the transit lines. After experiencing transit services, passengers are able to evaluate the service quality through the app. In 2016 the number of the app users had reached 1 million people. In 2016, the STU established and actively promoted the Plan for the Construction of Bus Free WIFI, and successfully completed the tendering process selecting a private partner for collaboration.
4.1.5. Blue-Sky Project
The Blue-Sky Project was established by the STB for the purpose of updating old transit vehicles with clean energy-powered vehicles. In 2014, the STB formulated the Plan for Updating Clean Energy-Powered Vehicles, and submitted it to Shenyang municipality for approval and subsidy. The municipality agreed on the plan and appropriated 63.79 million public budgets for updating transit vehicles. In 2015, the municipality invested 431 million RMB (125 million from national government subsidy) for the renewal. And in 2016, the investment went up to 398.1 million and was totally municipally funded. By 2016, Shenyang had 7499 transit vehicles in total, among which 4754 vehicles are LNG or electronic powered.
4.1.6. Bicycle Transportation
Shenyang has a tradition of bicycle transportation, given its flat geomorphology. In the 1980s, 1990s and even 2000s, the share of bicycle transportation accounted for more than 80%. In 2012, its share had dropped to 23%, largely due to the increase in private automobile ownership, and the loss of bicycle lanes. Bicycle transportation is the most economic mode of transportation. Although it is far less comfortable than the car, and it is vulnerable to inclement weather, it is attractive to those interested in physical exercise and in the bicycle’s convenience for short trips in communities and campuses. Considering this fact, the LGBTM decided to recover and promote bicycle transportation in Shenyang. The specific measures include giving bicycle transportation the exclusive ROW and introducing a bicycle-sharing system. First, in 2014, the STB made the city-wide scene investigation to collect data on the locations where bicycle lanes were occupied (by car parks) and where bicycle lanes could be created. In 2015 and 2016, the STB started to renovate and to construct exclusive ROW for bicycle lanes. In 2015, the STB cleaned away automobile parking on 85 km bicycle lanes. In 2016, the STB built new bicycle lanes with a total area of 152,896 km2. Second, Shenyang municipality introduced the PPP project for bicycle sharing in 2015, with an investment of 533.3 million RMB for 2058 spots of bicycle-sharing facilities. In 2016, 90,000 bicycles and 78,000 parking piles have been put into operation.
4.2. Implementation of the Transit Metropolis in Dalian
To organize and implement the transit metropolis program, Dalian also established a taskforce, the Leading Group for Creating the Transit Metropolis (LGCTM), with the vice-mayor as the head of the leading group and multiple department leaders from urban planning institutes, and financial, land use and transportation departments as members. The LGCTM has annual meetings to report and communicate the tasks associated with creating the transit metropolis, to set targets and to allocate responsibilities and resources. In the first meeting in 2011, the Annual Plan (2013–2017) for Creating Transit Metropolis was announced, in which seven major measures for achieving the targets of transit metropolis were introduced. By 2016, these plans had been largely implemented, with some total investment of 5.28 billion RMB (excluding money input for metro construction).
4.2.1. Transit Management Reforms
Dalian’s foremost strategy to realize the transit metropolis is to carry out transit management reforms. Although Dalian has the Public Transport Franchise Ordinance and the statutory procedures for the selection of public transport operator, both stipulating that the operator should be chosen through competitive and open tendering, it has in fact always appointed the Dalian Public Transport Operation Group (DPTOG) as the sole operator. The DPTOG is a large state-owned enterprise (SoE) that consists of 14 branching operating companies monopolistically delivering different kinds of transit services, ranging from light-rail, BRT, streetcars, regular buses, to smart cards and vehicle advertising. The DPTOG has long been criticized for its low efficiency in delivering transit services and for its poor performance in coordinating different transit modes. Little progress in route and timetable optimization has been made in recent years. A large proportion of the transit network remains fragmented. Therefore, prior to any actions associated with physical network improvements, Dalian determined to carry out transit management reforms first. The reforms consist of two measures. One is the introduction of the Budget-Based Appraisal System for Transit Services, which contains 27 indicators in relation to service quality. The head of DPTOG, who is appointed by the municipal government, is directly responsible for the performance on the indicators. Dalian municipal government evaluates the performance every year and, based on this performance information, formulates budget and subsidy for the DPTOG. Another measure is the enactment of the Cost Accounting System and Evaluation Method for Policy-Related Loss. The purpose is to increase the operational efficiency of the DPTOG and to improve the transparency of local budget transfer as well as increase the incentives for the DPTOG to implement transit policies.
4.2.2. Underground Transport Interchanges
Like Shenyang, Dalian also has a strategy to construct multi-modal transfer hubs. Different from Shenyang that built 17 bus-oriented surface hubs, Dalian built four rail-oriented hubs. The four hubs are all megaprojects located along the metro lines and become the main underground transport interchanges and transfer stations. All the four hubs are designed with vertical transfer facilities, at a total investment of 561 million RMB (excluding investment for metro/rail station construction). The first hub is located in Dalian North Railway Station. It connects high-speed rail and taxi on the ground floor to metro and private car parking underground, thus creating a seamless inter-modal transfer. This hub occupies 5000 km2 land area and has been put into operation. The second hub is located in the High-Tech Zone in the southern part of the city. It occupies 8127 km2 of land area to build two independent buildings. One building provides the park-and-ride facilities and the other building mainly serves for inter-modal transfers, combined with shopping malls and entertainment centers. The third hub is located in the Hualin Industrial Group in the western part of the city. It occupies 8006 km2 of land area for an interchange building that integrates metro services, regular buses, taxis and car parking services. This hub mainly serves for commuter traffic of the industrial workers. The fourth hub is located in Donggang Business Center in the eastern part of the city. It occupies 7809 km2 and costs 180 million RMB. This hub also vertically integrates metro, taxi, bus and car parking facilities and mainly provides services for business people traveling from the old business center to Donggang center.
4.2.3. Transit Network Optimization
Like Shenyang, one of Dalian’s fundamental measures is to optimize its transit network. However, Dalian’s plan of network optimization is more comprehensive, involving a metro construction plan, a bus (including BRT) network expansion project, a transit first plan, a plan for feeder services, and an ITS project for network optimization. In the years 2013–2016, Dalian newly opened three metro lines (line 1, line 2 and line 12) and one streetcar line with a total railway length of 161 km and 80 new rail/metro stations. In the same period, Dalian built 62 exclusive ROW for regular buses with a length of 259 km and an investment of 159 million RMB. Concurrently, 100 transit vehicles are installed with monitoring devices to prevent private car encroachment. In addition, in 2015, 38 bus lines have been extended; 77 new bus stops were constructed; and 226 bus stops were relocated. In 2016, the routes of 40 bus lines and the locations of 34 bus stops have been adjusted according to the need of feeder services for metros.
4.2.4. Customized Shuttle Bus (CSB)
In addition to the transit network optimization strategies, Dalian introduced the “customized shuttle bus” services. CSB is similar to the travel mode of Demand Responsive Transport (DRT) and Flexible Transport Service (FTS), which appeared in European and American cities between suburbs and downtown in the 1970s; along with the urbanization process and the increase of passenger flow, the DRT and FTS routes gradually became regular transit routes. CSB in Dalian, providing advanced, personalized and flexible demand-responsive transit services, is offered to specific clientele, especially commuters. Unlike conventional transit services, CSB users are actively involved in various operational planning activities through interactive and integrated information platforms, such as internet websites and smart phones. Community delegates and company managers may initiate CSB services from the DTPOG, making customized routes for commuter traffic. Up to 2016, there are already 19 CSB routes in Dalian, among which five routes connect residential communities to commercial centers, six routes provide commuting services for employees of six large companies, four routes connect communities to metro terminals, and four routes connect communities to the airport.
4.2.5. High Occupancy Vehicle (HOV) Lane with Expanded Road Network
Different from Shenyang that only focused on giving buses the exclusive ROW, Dalian introduced a rush-hour HOV policy to promote carpooling and vanpooling. According to an analysis by the Dalian Transportation Bureau (DTB), 70% cars on the Dongbei Expressway (a key fast road traversing the city north-south) during rush hours only have the drivers in them, which leads to serious traffic congestion. To solve this problem, the first HOV lane was introduced in September 2017 in Dalian on the Dongbei Expressway, with a length of 10 km and “2+(more than two persons)” cars to running on it during rush hours. Dalian transferred one existing general purpose lane to an HOV lane, i.e., the “convert-a-lane” method, thus leading to many single occupancy vehicle drivers complains about underused HOV lanes. Many transportation researchers also criticize HOV lanes for their poor effectiveness in easing congestion. As a result, Dalian is now reconsidering the expansion of its HOV lanes, and rather using the “add-a-lane” method. Dalian is now widening its main urban truck roads. After this, HOV lanes will be introduced by adding a new lane.
4.2.6. Pedestrian Traffic with Aesthetic Street Networks
Unlike Shenyang that is flat and suitable for bicycle transportation, Dalian is mountainous and it is hard to promote bicycle transportation. With regard to the development of slow mode traffic, Dalian promotes pedestrian traffic with a well-decorated street network. In 2015, the DTB published the Plan for Slow-Mode Transportation System, which aims to build up (and repair) 1180 km2 walking street networks in the main urban area. The plan states that every street that has automobile lanes will be equipped with walking pathways paved with colorful pastel blocks and isolated from automobile lanes via plants. In addition, as a complementary plan, the Dalian Urban Construction Bureau (DUCB) issued a Plan for Pedestrian Space Decoration in the same year, which aims to use green plants, sculpture, evening lighting and street facilities like bench and even fitness devices or small play yards to make the street landscape beautiful, livable, safe and attractive. The DTB also started to clean up on-street parking activities, returning the street space to pedestrians.
4.2.7. Transit Branding and Advertising
The last but not least strategy used by Dalian is a discursive method to promote the use of transit. Dalian municipal government determined to build up a transit brand for Dalian that is convenient, rapid and safe. In 2013, a team from the municipality conducted awareness-raising activities among twenty residential communities to promote the use of public transit. The team distributed more than 100,000 flyers that present public transit services including routes and transfers to citizens. In 2014, the municipality worked jointly with two large local media, Dalian Daily and Peninsula Morning, to promote the idea of “green” traffic. In the years 2015–2016, the municipality introduced the voluntary “no-car” day, which encourages drivers to shift traffic mode from car to transit. In addition, many local communities started to put up posters in their bulletin boards to promote the use of public transit.
4.3. Performance of Transit Metropolis in Shenyang and Dalian
As the introduction mentioned, to monitor the implementation of the transit metropolis in the selected demonstration cities, the MoT formulated 20 compulsory indicators and it will assess the performance of the indicators in 2017 relative to the targets set autonomously by the cities.
Table 3 shows the names of the indicators, the targets in 2017, and the performance during 2013–2016 in Shenyang and Dalian respectively. As can be seen, both Shenyang and Dalian have made significant progresses in the performance of the indicators. Shenyang has a relatively lower starting point than Dalian in terms of the status of the indicators in 2013. For this reason, Shenyang set lower target levels on some of the indicators in 2017 than Dalian. Some indicators, including ownership of transit vehicles per 10 thousand people, degree of crowdedness, ratio of public transit lines to total passenger lines connecting urban suburbs, and ratio of transferred subsidies to planning subsidies have reached the targets ahead of schedule in Shenyang and Dalian. By 2016, Shenyang also reached its target levels on punctuality rate, operating speed of transit during peak hours, ratio of exclusive ROW for transit, ratio of green transit vehicle, and usage rate of IC cards. Dalian, on the other hand, has higher target levels on most of the indicators than Shenyang, and also achieved its targets ahead of time on indicators for passenger satisfaction on transit service and death rate in public transit. With regard to the indicators where the target levels were not met, they are approaching the targets in 2017 and made gradual progresses every year from 2013 to 2016. Therefore, we can safely expect that these indicators will meet target levels with the implementation efforts in place in 2017.
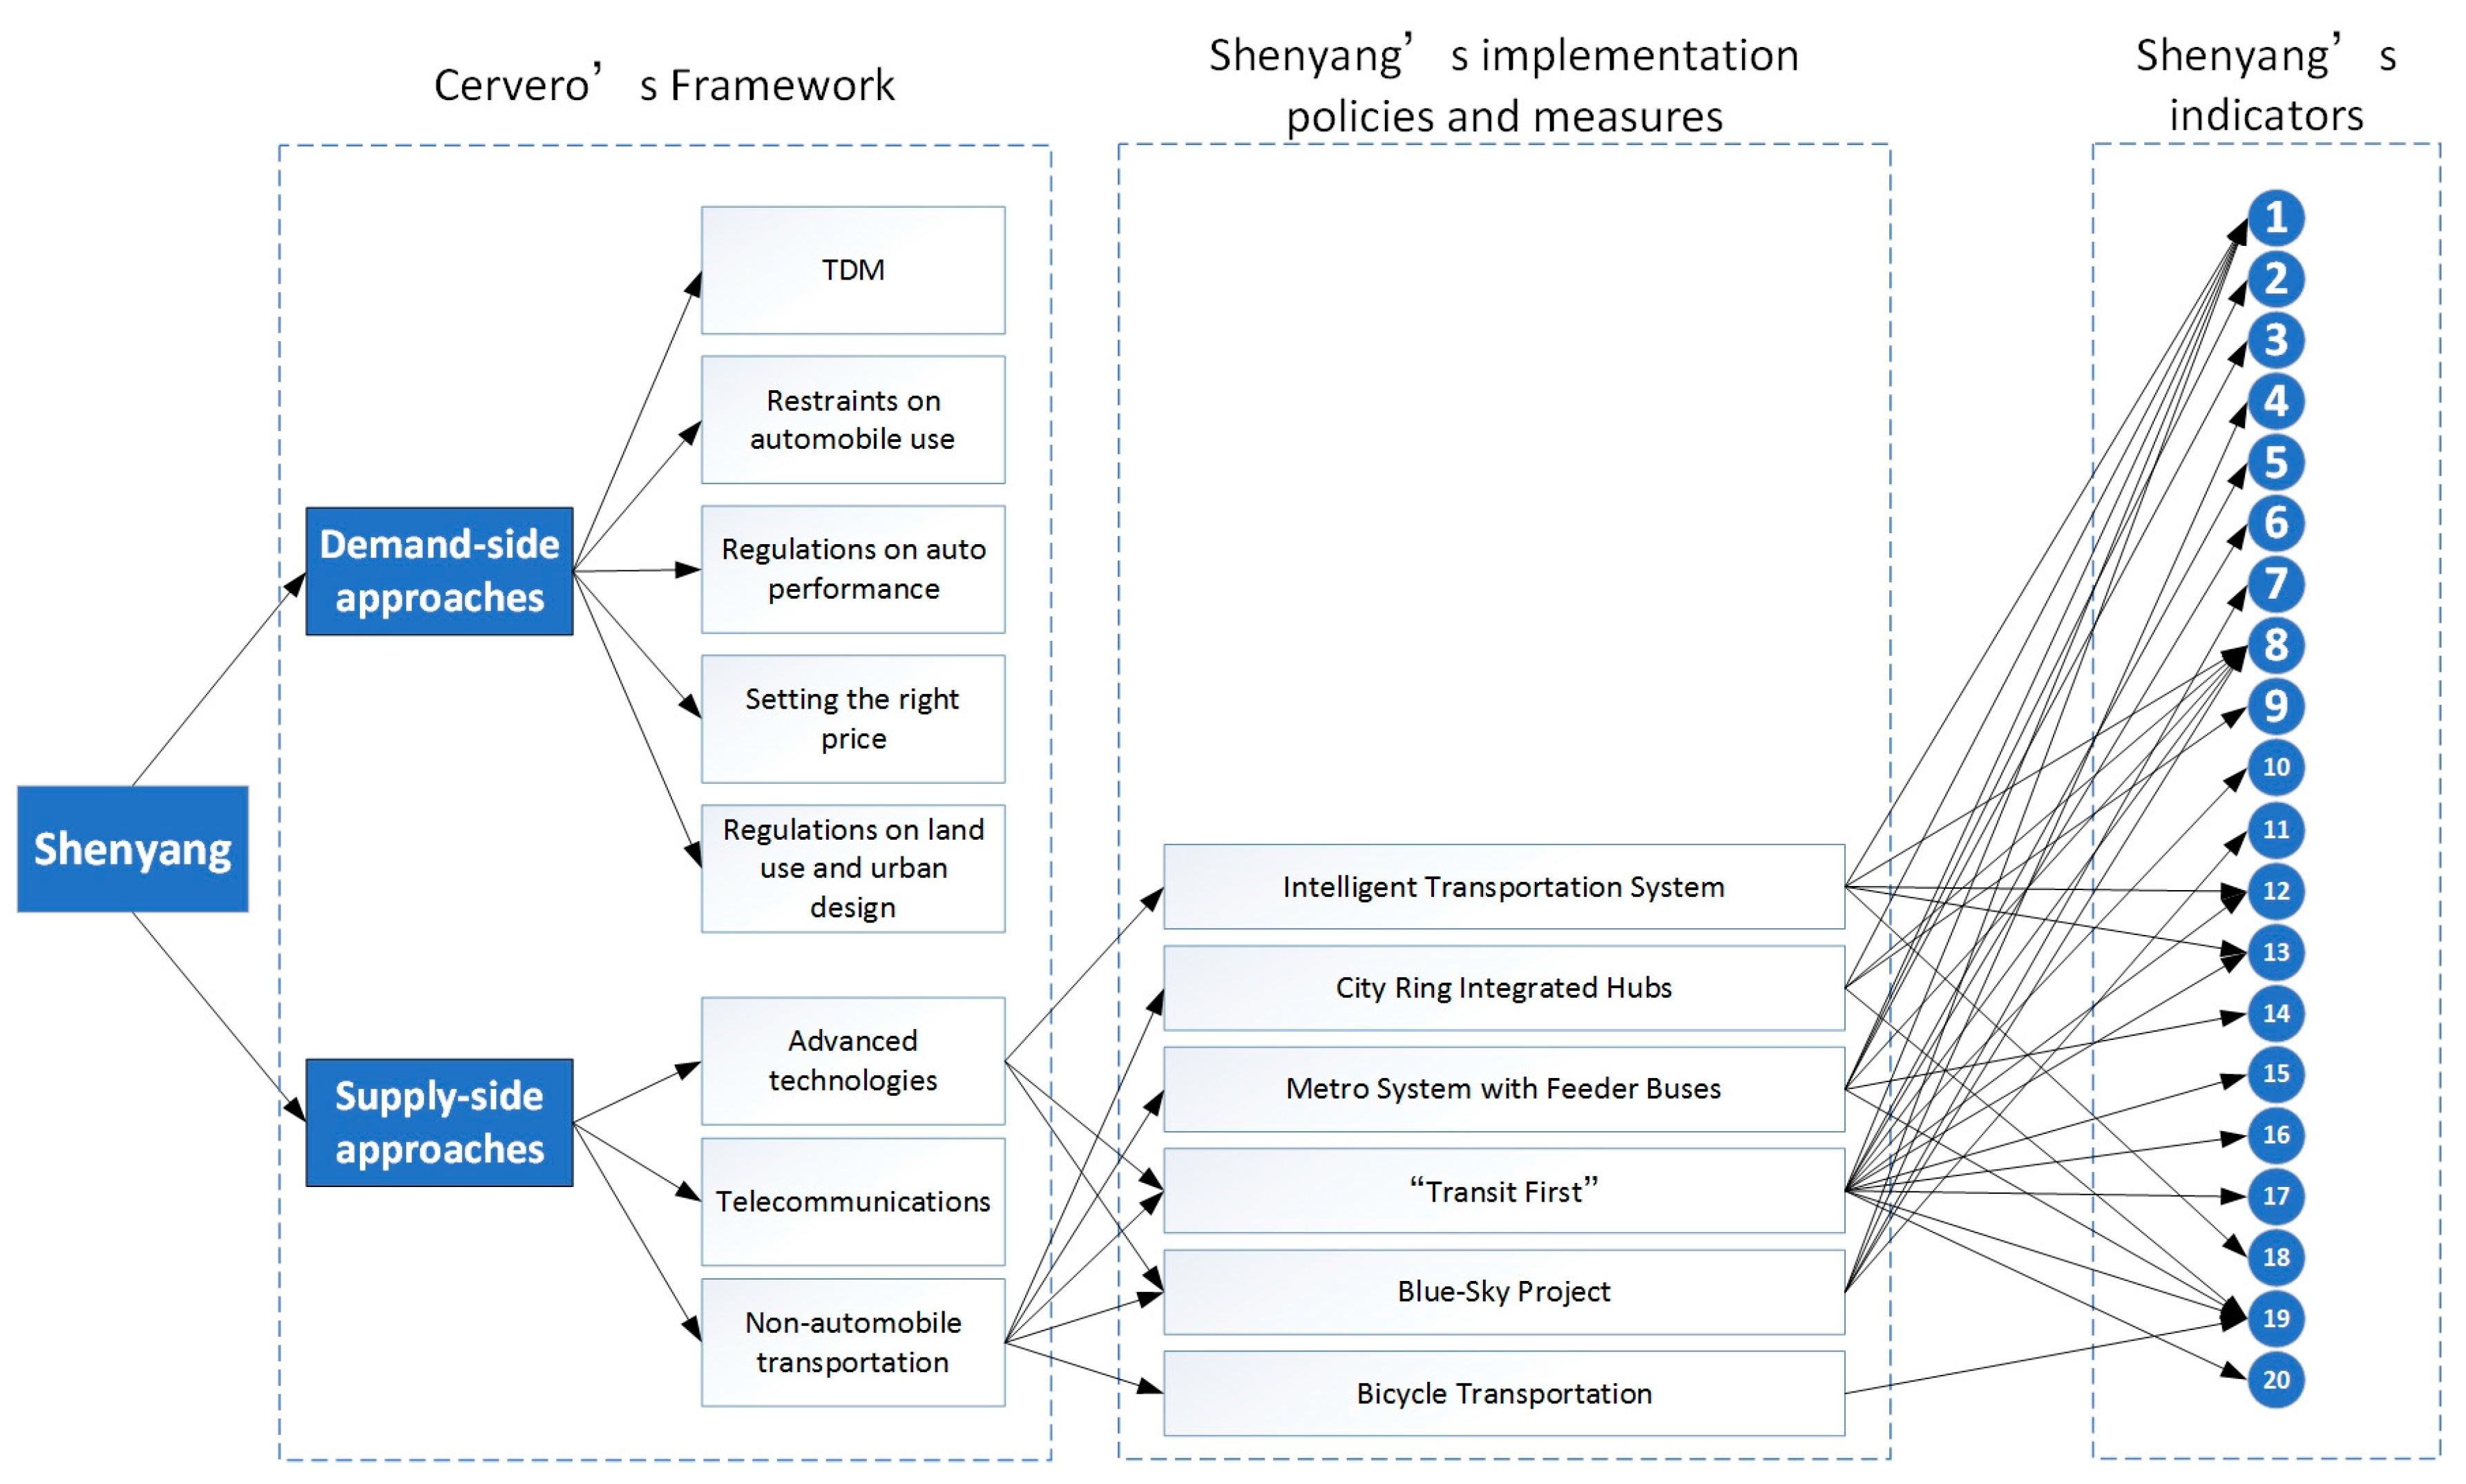
5. Case Comparison According to Cervero’s Framework
From the data showing the performance of transit metropolis indicators in Shenyang and Dalian, we can conclude that both cities have successfully implemented the transit metropolis program, albeit in different ways. Following Cervero’s framework, we compare the implementation policies in Shenyang and Dalian (
Figure 3 and
Figure 4).
The similarities for Shenyang and Dalian mainly lie in their absence of restraints on automobile traffic, absence of regulations on automobile performance, and absence of “setting the right price” for automobile purchases and usage. That is to say, any demand-side approaches related to restrictions that provide disincentives for travelers to use cars are missing in both cities. This can be partly explained by the flourishing car industry in Liaoning province. For this reason, both cities did not adopt any restricting policies on car purchases and usage, or policies on traffic calming.
Another similarity between the two cities is their extensive construction and optimization of transit networks. This includes the expansion of the metro system, the construction of integrated multi-mode transfer hubs, the expansion and adjustment of bus lines, the upgrading of transit vehicles, and the improvement of “intelligent” transit services. This investment on non-automobile transportation infrastructure becomes the underpinning supply-side approach that contributes to the realization of many performance indicators. Both cities’ focusing on the improvement of transit networks can be explained by the fact that transit infrastructure has long been underdeveloped. Although the transit networks in the two cities underwent gradual expansion every year before the transit metropolis program, they were far from optimized in terms of intermodal connections and lacked the adoption of advanced technologies to make the transit systems more intelligent.
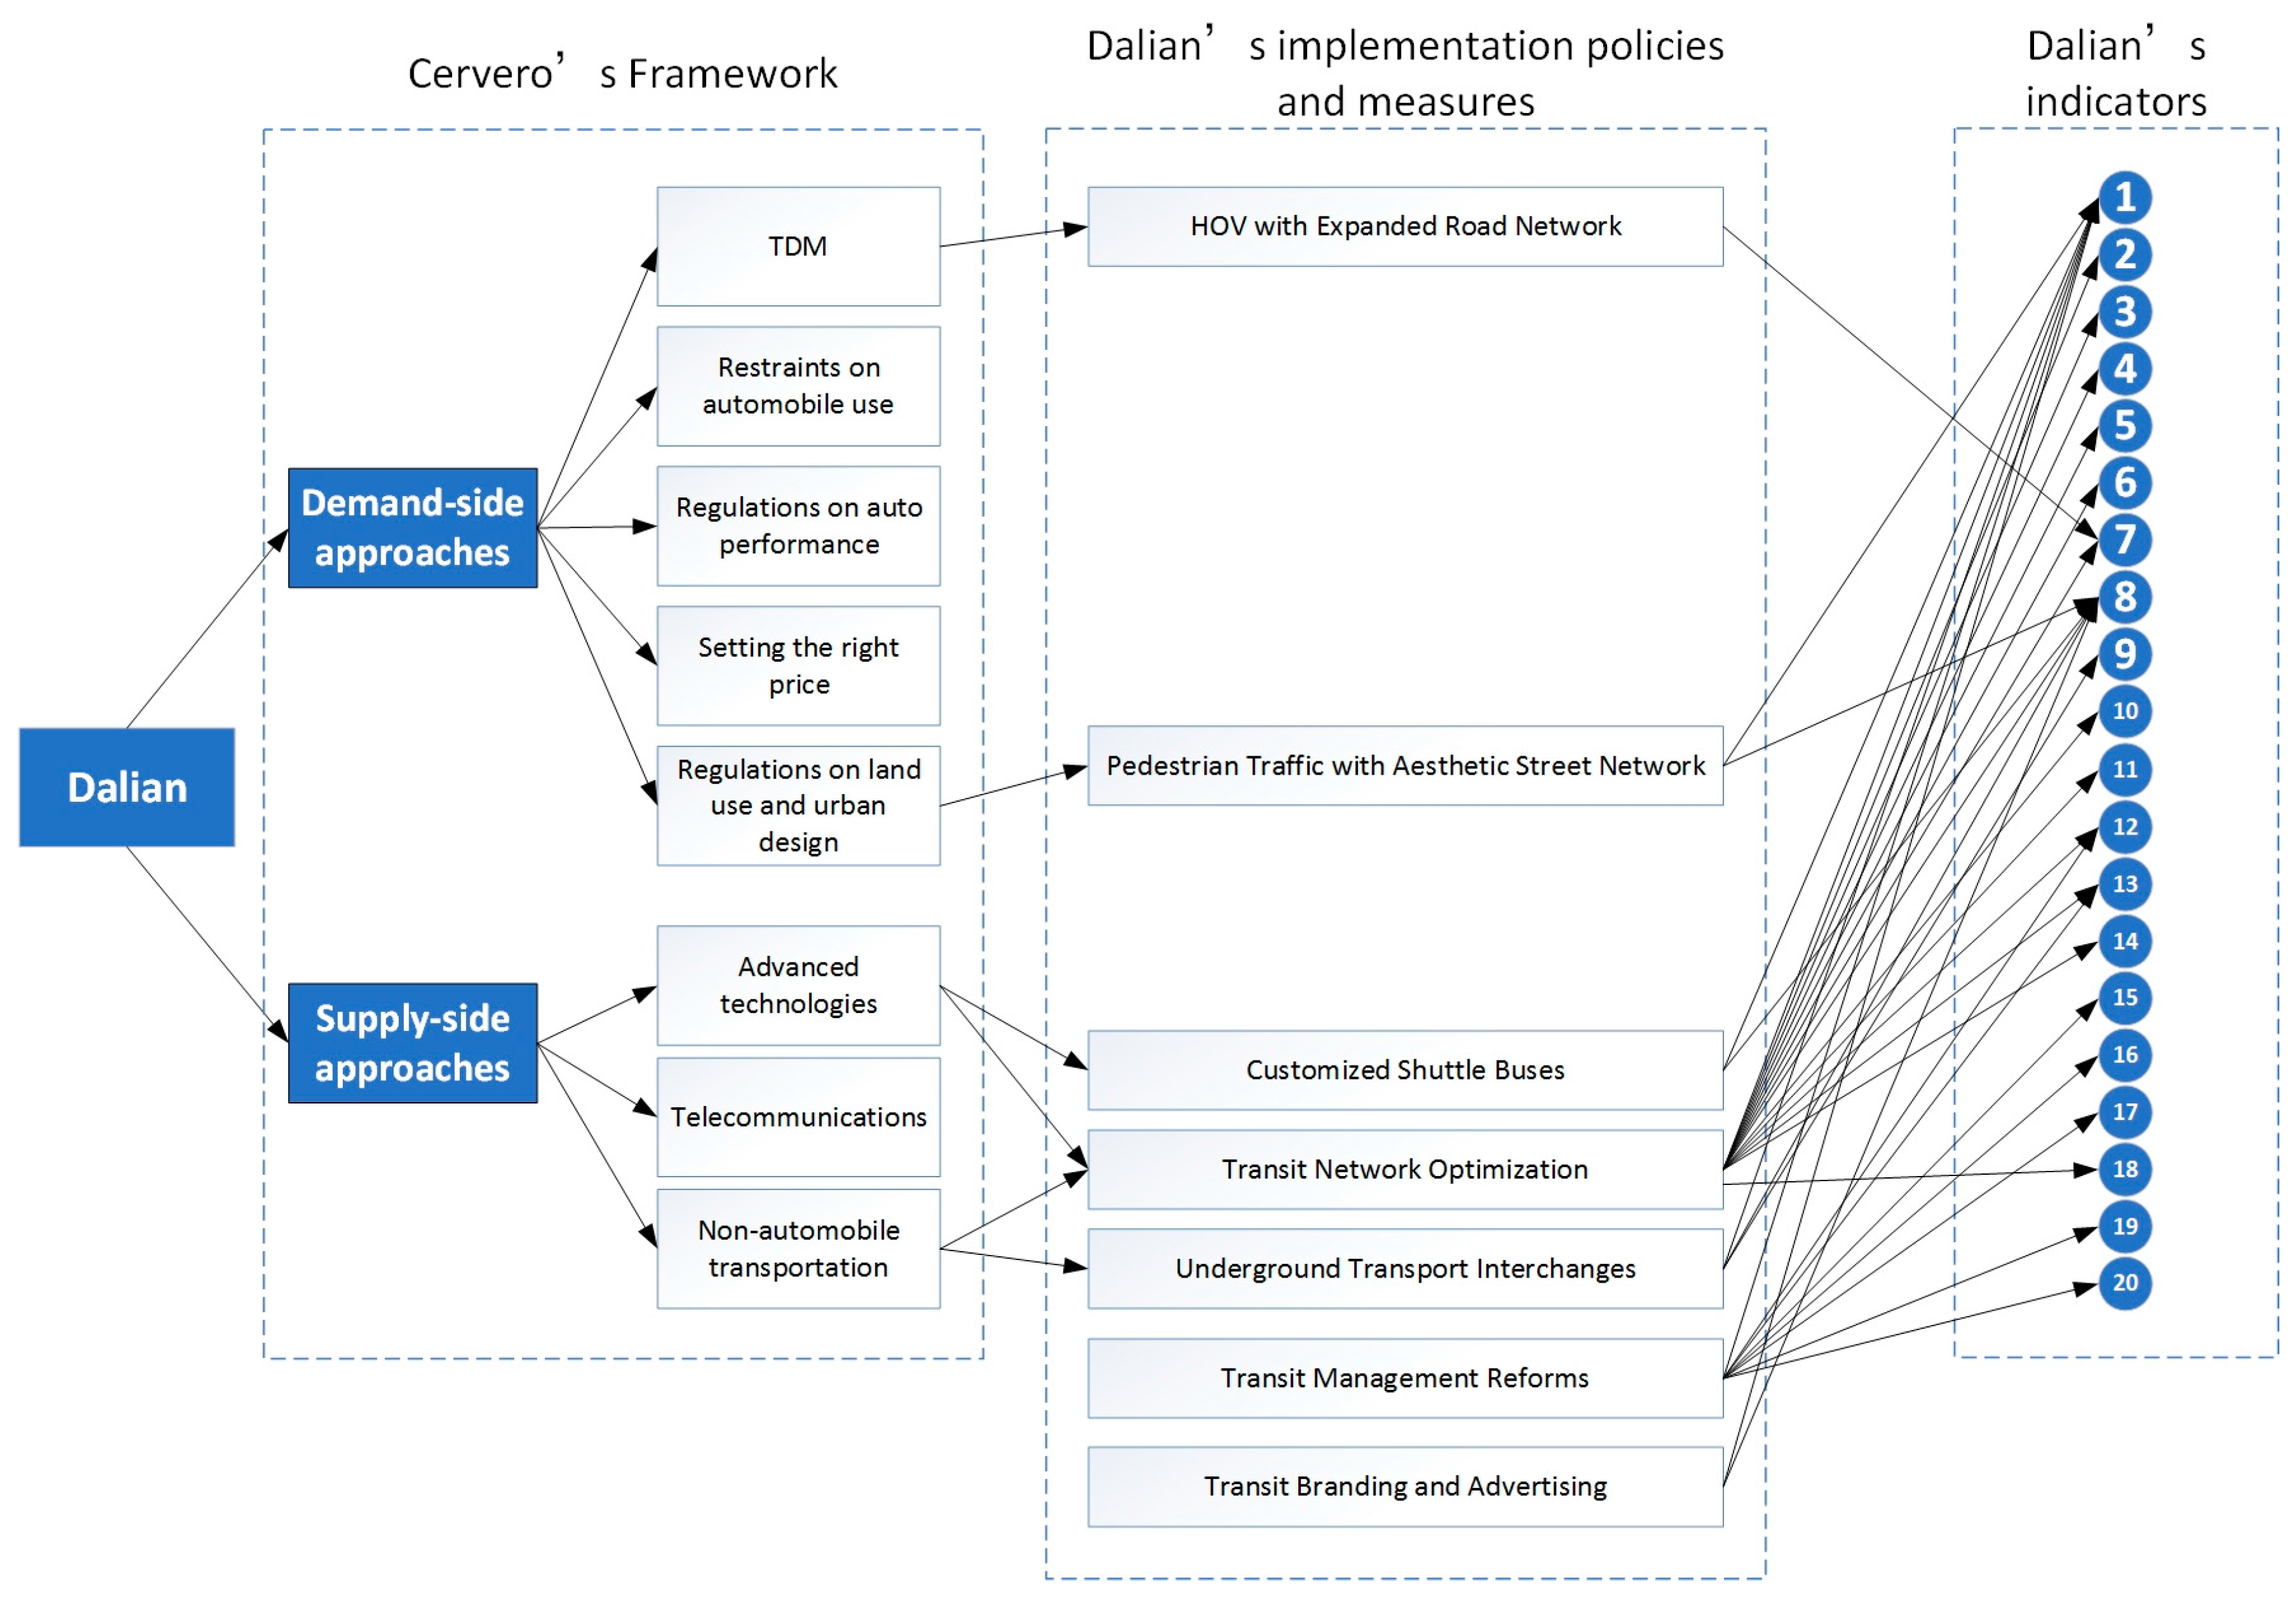
Interesting differences exist between Shenyang and Dalian. First, Shenyang only focused on supply-side approaches to develop into a transit metropolis. However, Dalian applied both demand-side and supply-side approaches. Dalian promotes carpooling by introducing HOV lanes. In addition, Dalian pays more attention to urban design conditions that create aesthetic street landscapes for pedestrians. This potentially increases the modal share for transit because any use of transit infrastructure necessarily requires a certain amount of walking. Second, on the supply side, Shenyang usually uses “conventional” approaches like “transit first” policies to promote transit ridership. However, Dalian often adopts more innovative and flexible approaches such as personalized CSB services.
Other important differences reside in Dalian’s transit management reforms prior to transit network optimization, and its use of a discursive approach to promote a modal shift from car to transit. The transit management reforms provide an institutional basis for better transit services. The introduction of an appraisal system for transit operators forces them to keep an eye on their service qualities. And the new method of cost accounting and evaluation of policy-related loss provide incentives for the service providers to implement transit policies. Transit branding, similar to city branding and place branding, involves transit image communication to targeted residents, and aims to increase the competitiveness of transit relative to other transport modes, promoting a modal shift toward public transit. Although both transit management reform measures and transit branding measures are “soft” and “invisible” approaches to promote transit use and they are hardly connected to the contribution of certain indicators, they reflect a long-term strategy encouraging fundamental changes in the institutional environment and perceptional changes residents have of transit.
6. Conclusions
This article aimed to compare and explain the implementation of the transit metropolis program brought forward by the MoT in Shenyang and Dalian, two large cities with millions of inhabitants located in Liaoning Province. Overall, we find that both cities have successfully implemented the program, considering that in 2016 most of the indicators have reached the target levels ahead of time and that in 2017 there are still considerable implementation efforts in place for the remaining indicators to meet the targets. Although different measures were adopted in the two cities, generally we can see that the “transit metropolis” concept has been well accepted by local governments in China, combined with the introduction of the target responsibility systems. Such acceptance has resulted in supportive policies and measures towards the transit metropolis. It also partially explains why China became the only county in the world adopting a mandated approach to transit metropolis development across the country. The experience of the two cases leads us to conclude the following.
First, the transit metropolis as defined/envisioned by MoT and implemented by local governments varies notably from that in Cervero [
3], even though the MoT and Cervero share the same reasons for initiating a transit metropolis. The transit metropolis in China (i.e., in MoT and in many Chinese local governments) is more about improving and optimizing the physical transit network and infrastructure, via the expansion and construction of hubs and lines, and the installation of advanced technologies on transit vehicles. However, Cervero focuses on the way land use and public transit can be well connected and coordinated. Therefore, China’s concept for the transit metropolis is more parochial, caring only about issues that fall in the concept’s purview. Cervero [
3] is more concerned with urban design and planning issues including housing options, daily activities, land use patterns, zoning regulations around transit stations and along transit corridors [
32]. Vuchic suggests that the construction of the transit metropolis that only focuses on transit issues can be classified as offering short-term incentives for residents to use transit, while long-term incentives have to include integration between transit network and land use layout [
18]. In line with this point, we thus suggest that further policy measures need to be taken in China to promote the shift of land use patterns that lean more towards influencing transit behavior.
Second, if we compare the experience of the two case cities with other Chinese cities (like Beijing, Shanghai and Guangzhou) that have implemented a transit metropolis, we can find that much more serious restrictions on car use have been adopted in these cities. Beijing’s and Guangzhou’s License-Plate Lottery and Shanghai’s Automobile Restriction Zones may help reducing automobile usage and congestion [
33,
34], but they are all absent from Shenyang and Dalian, partly due to the flourishing car industry in Liaoning. Although both Shenyang and Dalian witnessed remarkable progress in their records of building a transit metropolis, the modal shift is only set at a 2% reduction of car use, which is not ambitious. Therefore, Shenyang and Dalian implement a transit metropolis without excluding automobiles. Instead, their main efforts lie in improving the attractiveness of public transit services. In Liaoning where the car industry has become the main pillar of economic development, convenient intermodal transfers and giving transit vehicles priority are more practical at this moment. In addition, aesthetic and well-decorated street networks are critical in attracting transit passengers because transit riding unavoidably requires a certain amount of walking.
Along with the abovementioned conclusions, some limitations should be noted. Knowledge about the implementation practices of transit metropoles in Shenyang and Dalian and about the performance of the indicators was mainly based upon information gained from interviews with the officials who work in urban transport agencies and from the working reports they provide for us. We did not interview the residents in Shenyang and Dalian on their experience and satisfaction with the performance of the transit metropolis. So, the information is arguably biased towards the officials’ perceptions of the performance of transit metropolis.


