Development of Magnetostrictive Transducer Prototype for Blockage Detection on Molten Salt Pipes

 , ,
, ,  , ,
, , 
Abstract
:
1. Introduction
- Low temperature, below 200 °C, which can be found in household levels.
- Medium temperature, between 200 °C to 400 °C, as in Fresnel reflectors and parabolic troughs power plants.
- High temperature, above 400 °C, as in Stirling dishes and tower power plants.
2. Guided Wave Testing
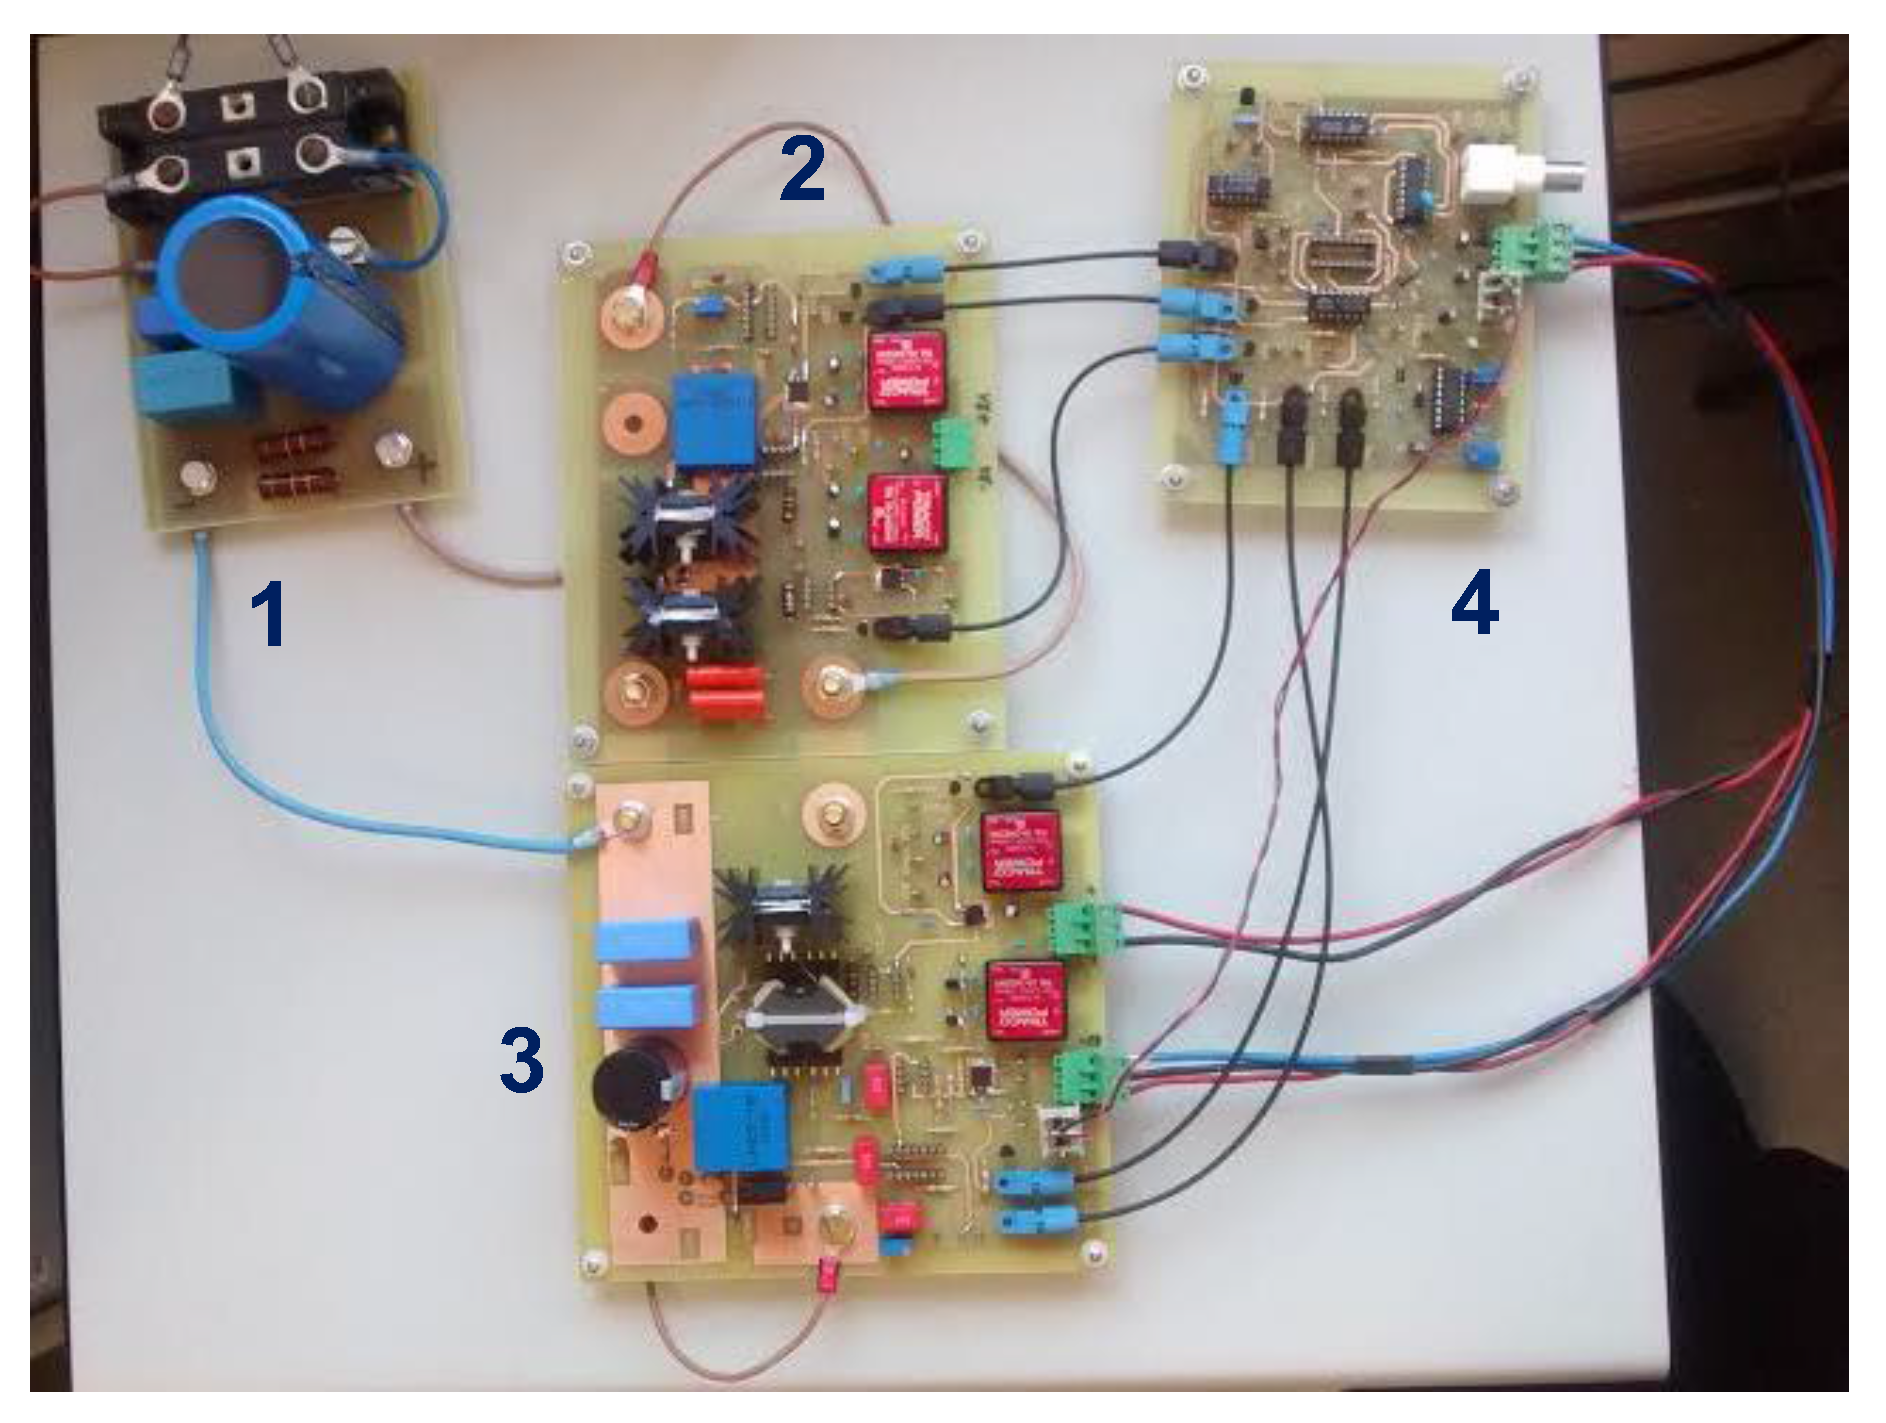
3. Test Equipment
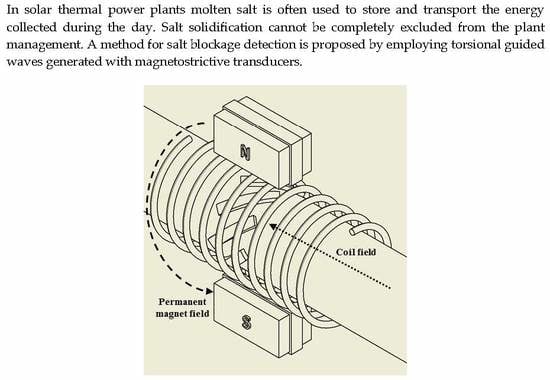
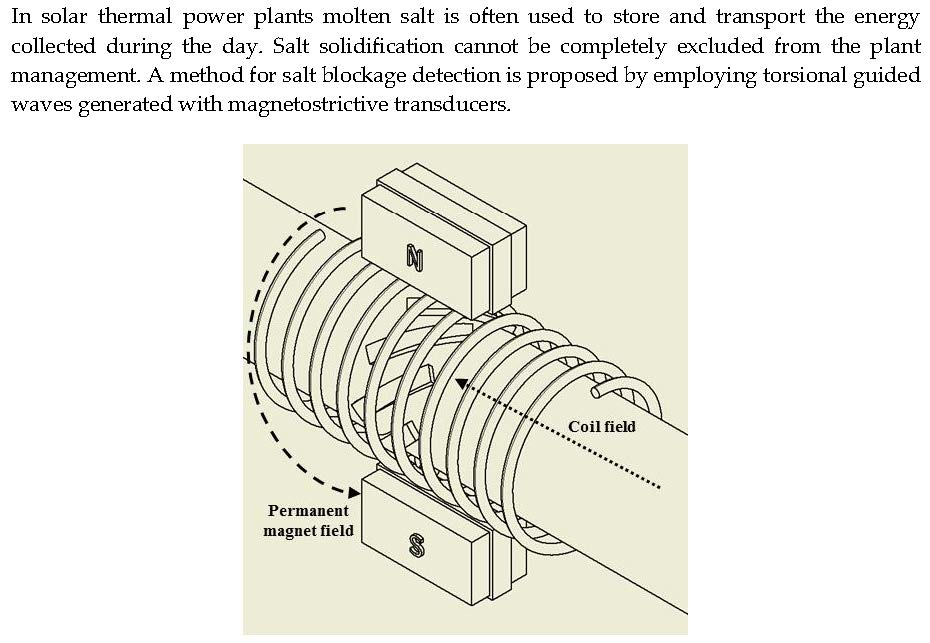
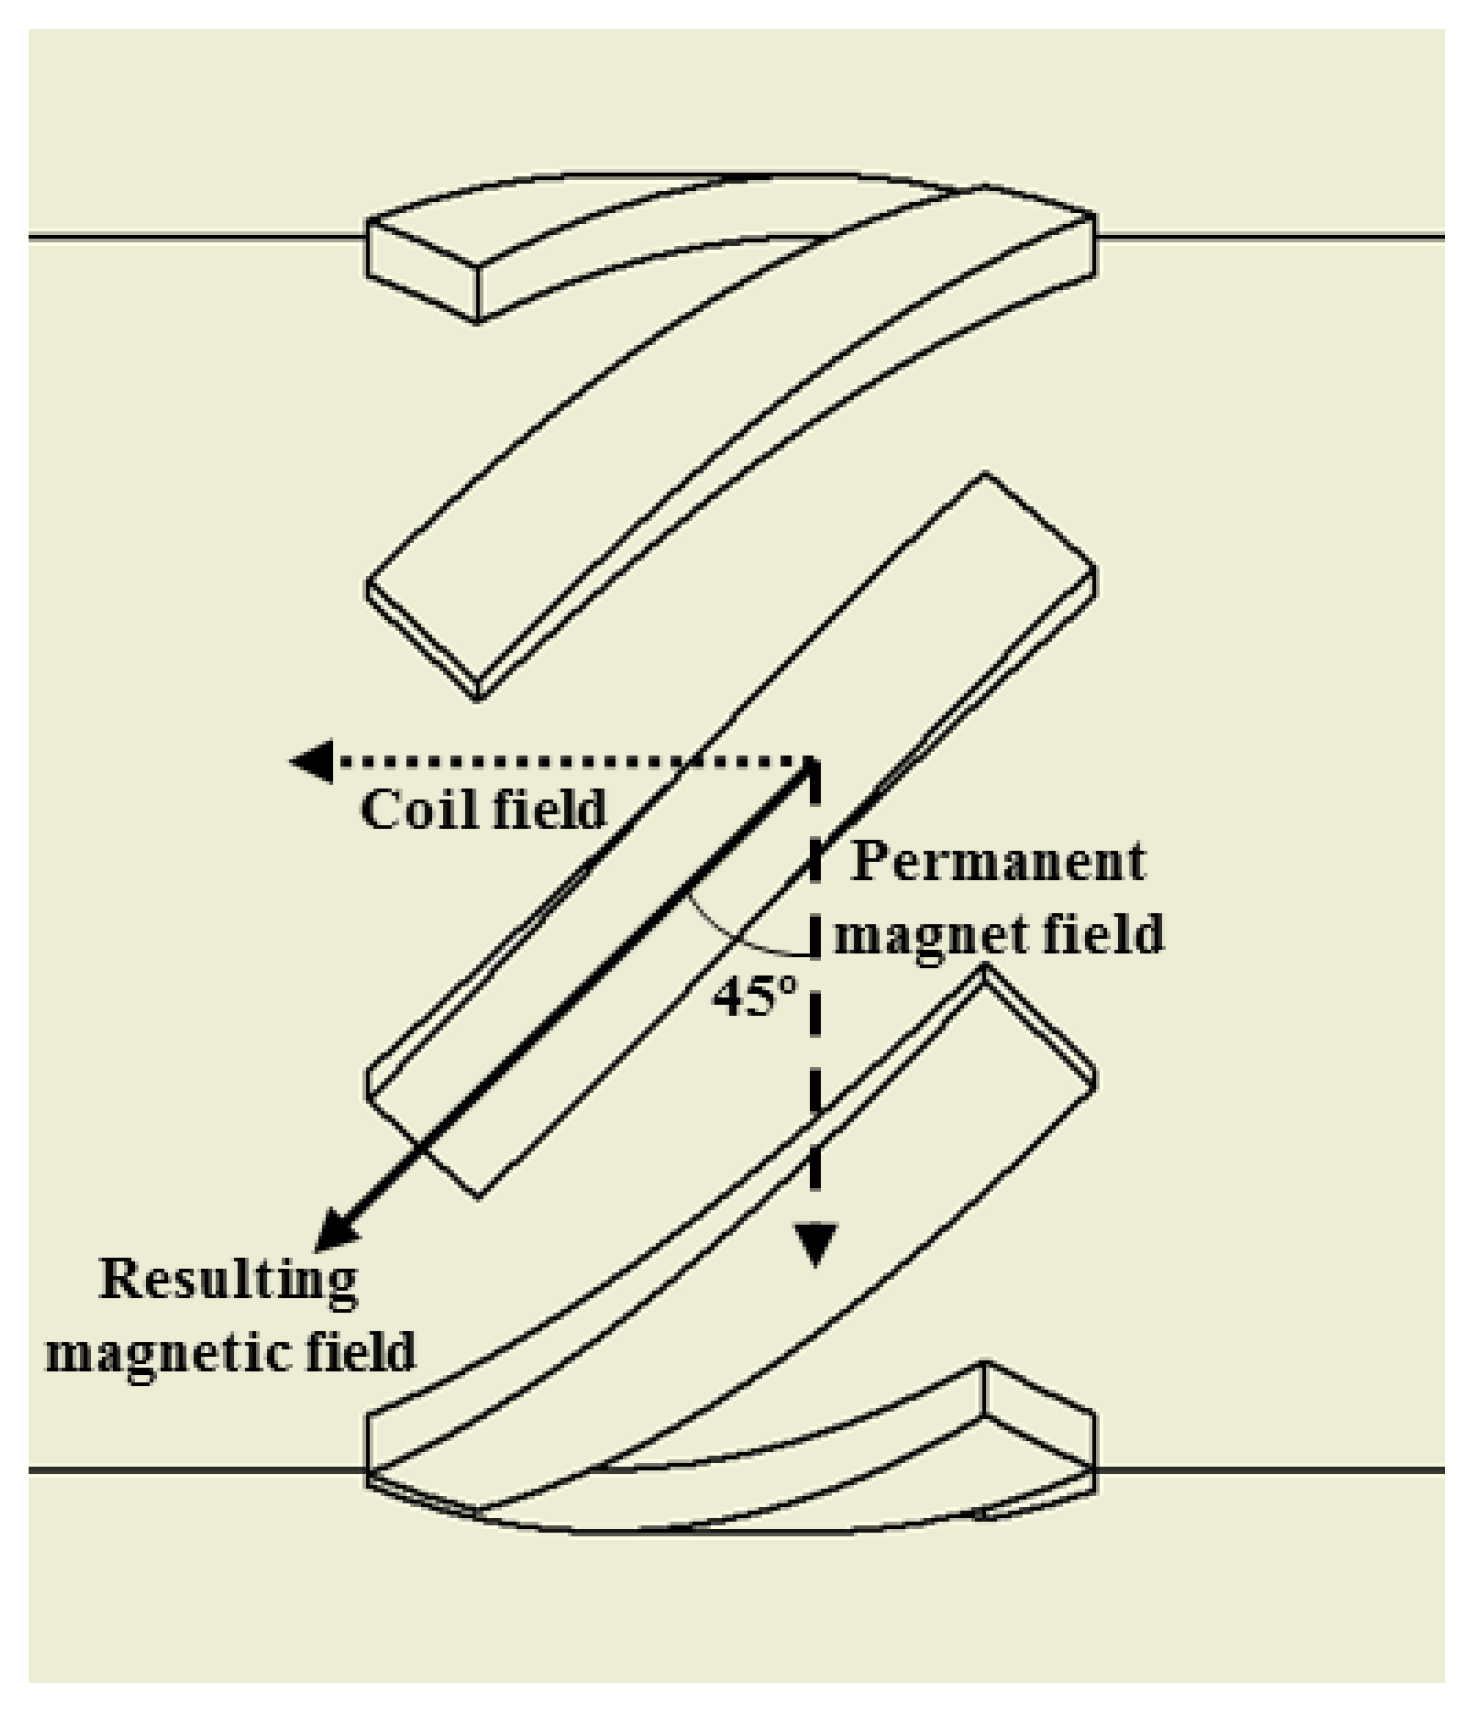
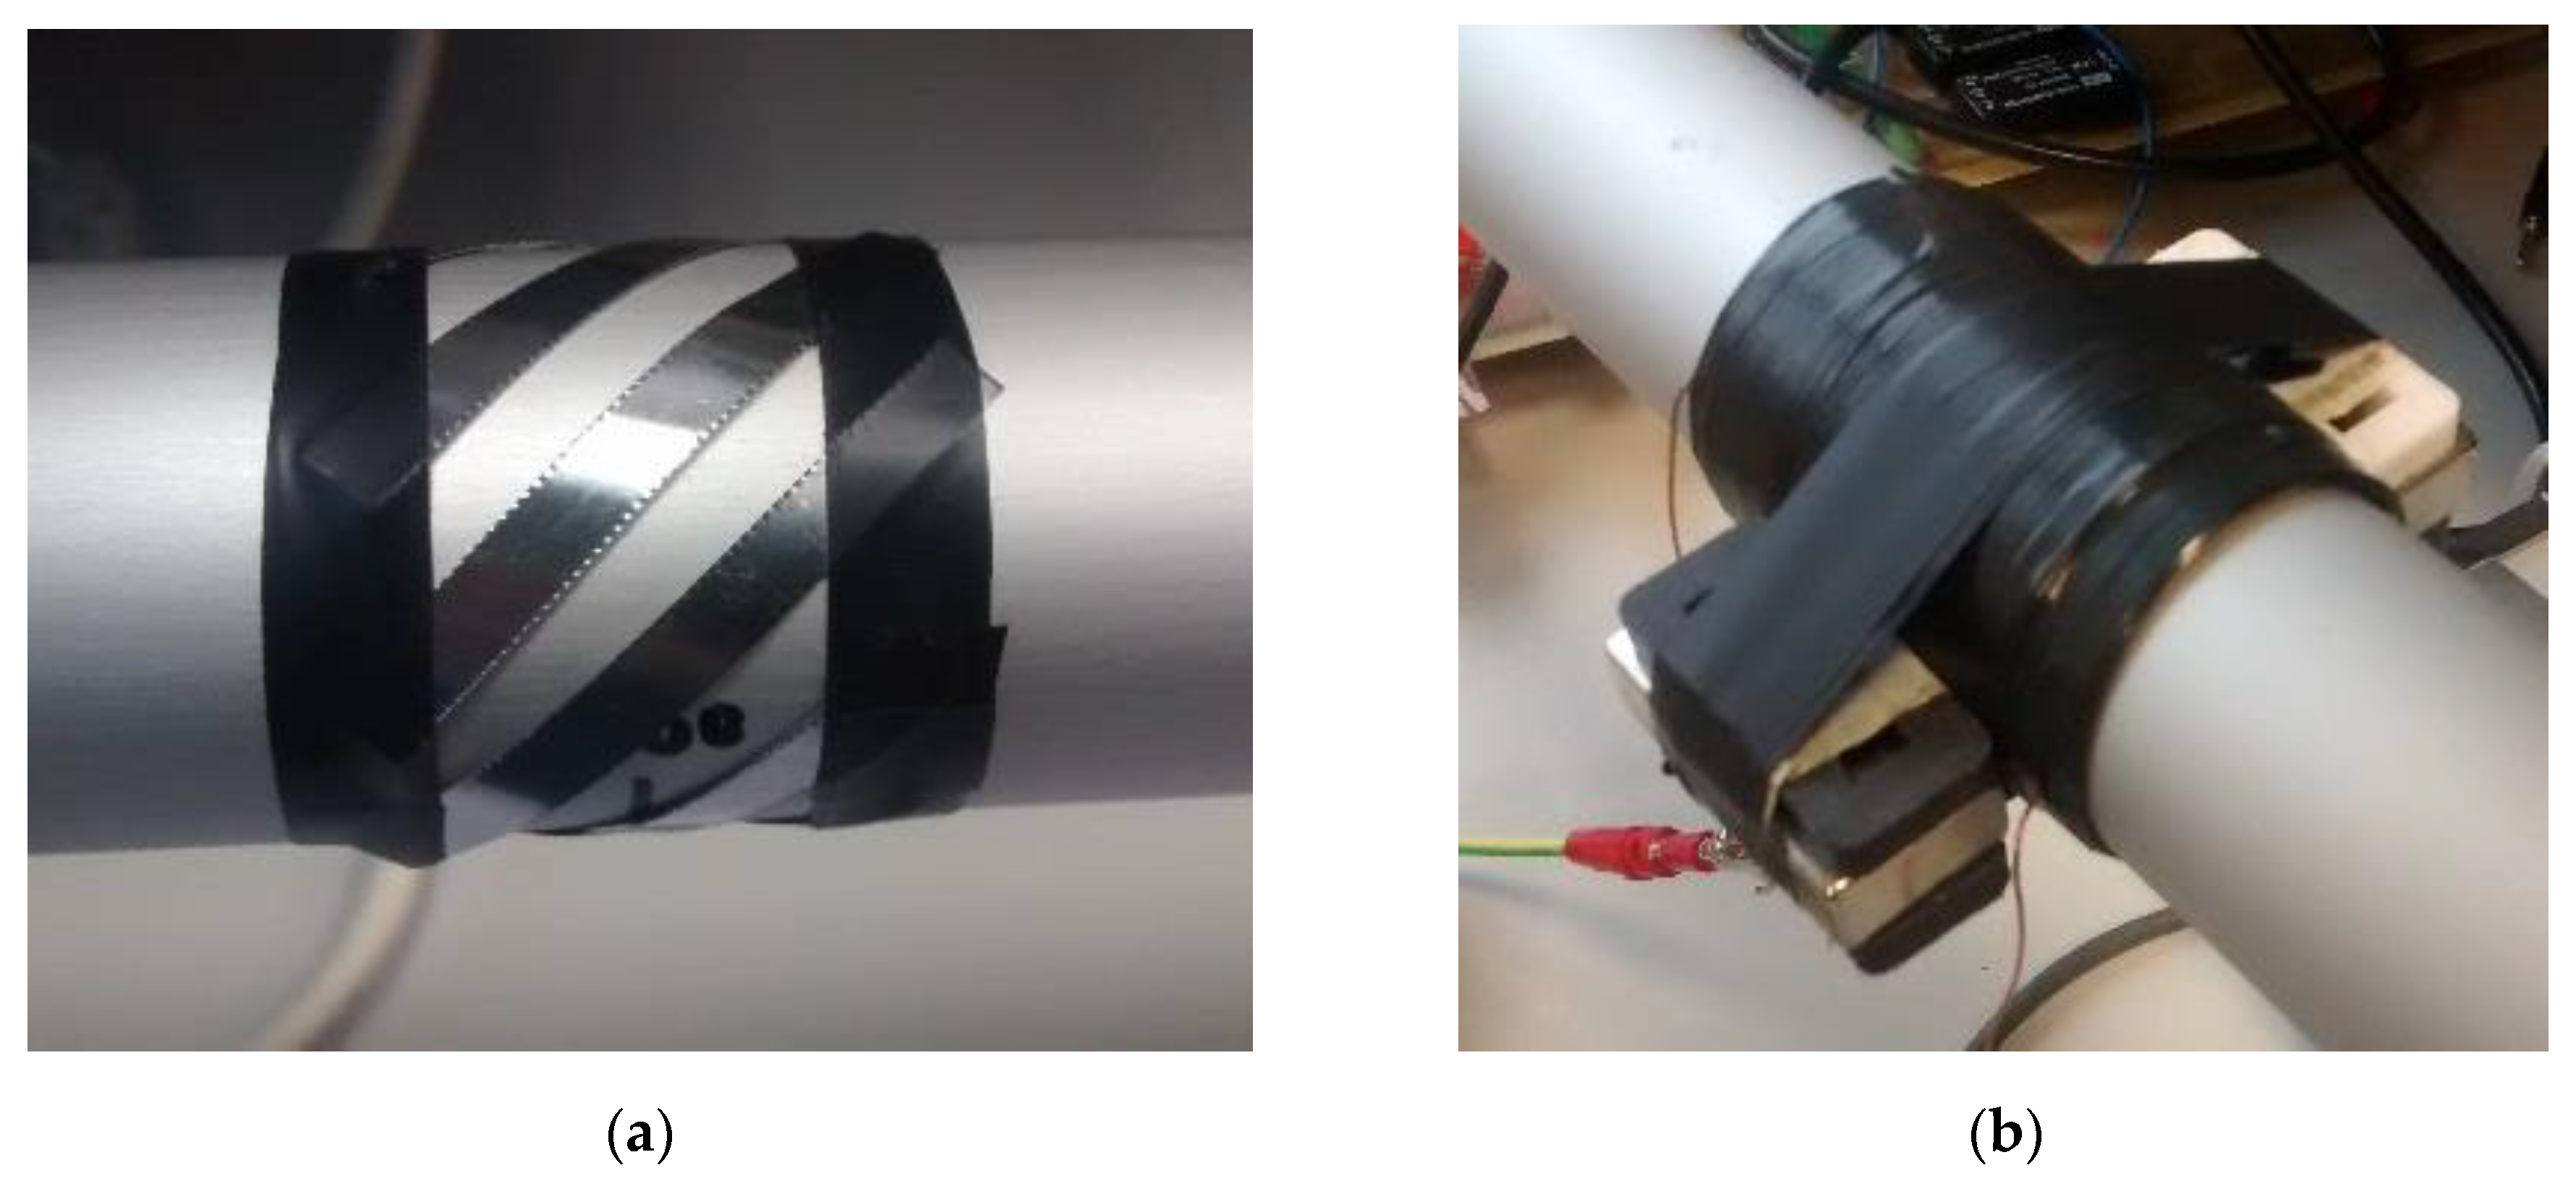
3.1. Magnetostrictive Transducer
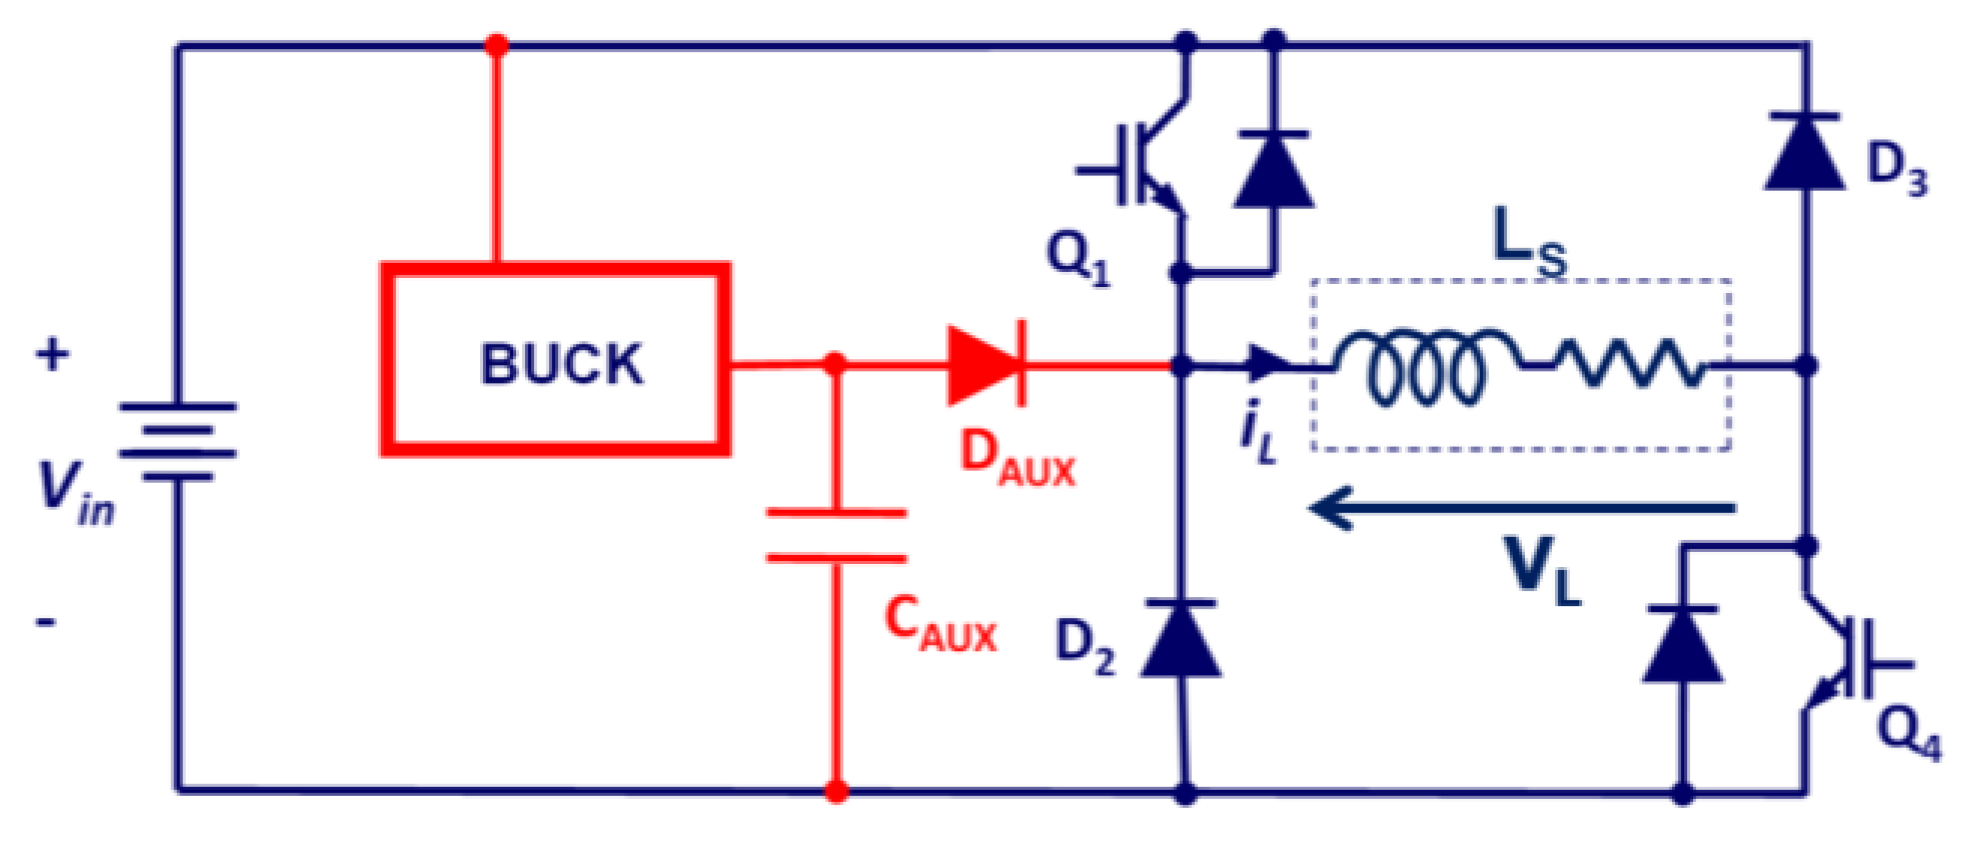
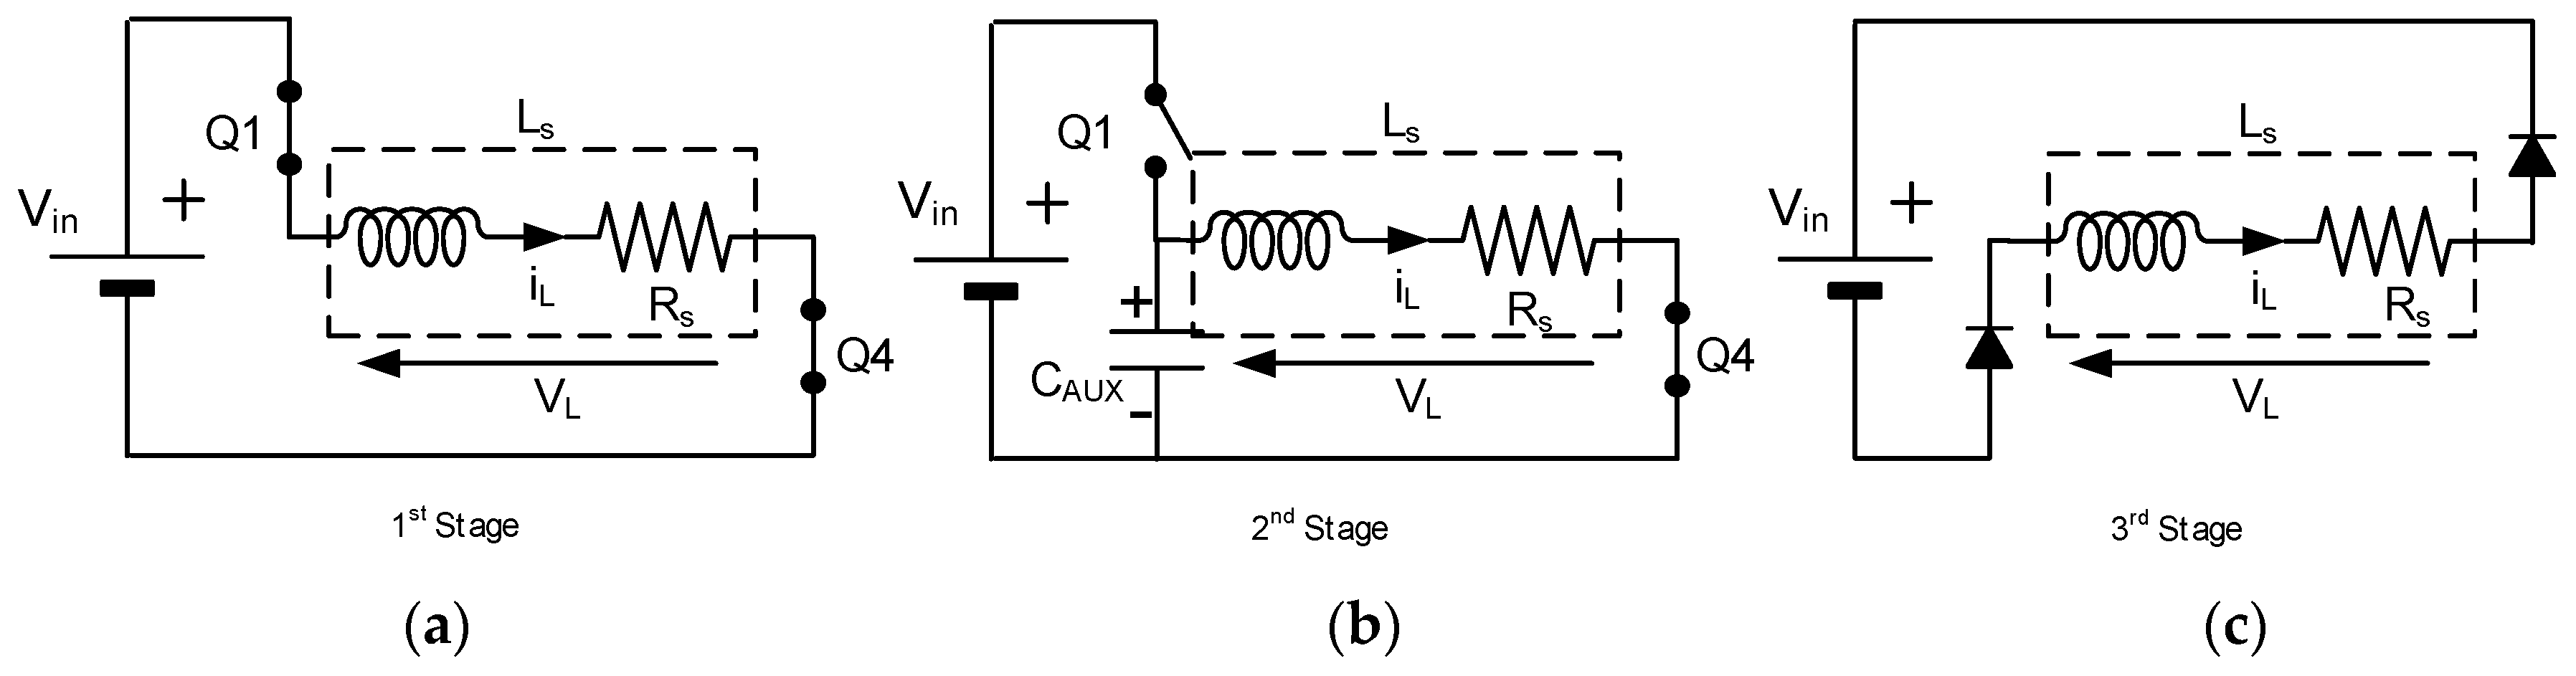
3.2. Power Supply and Instrumentation
4. Results and Discussion
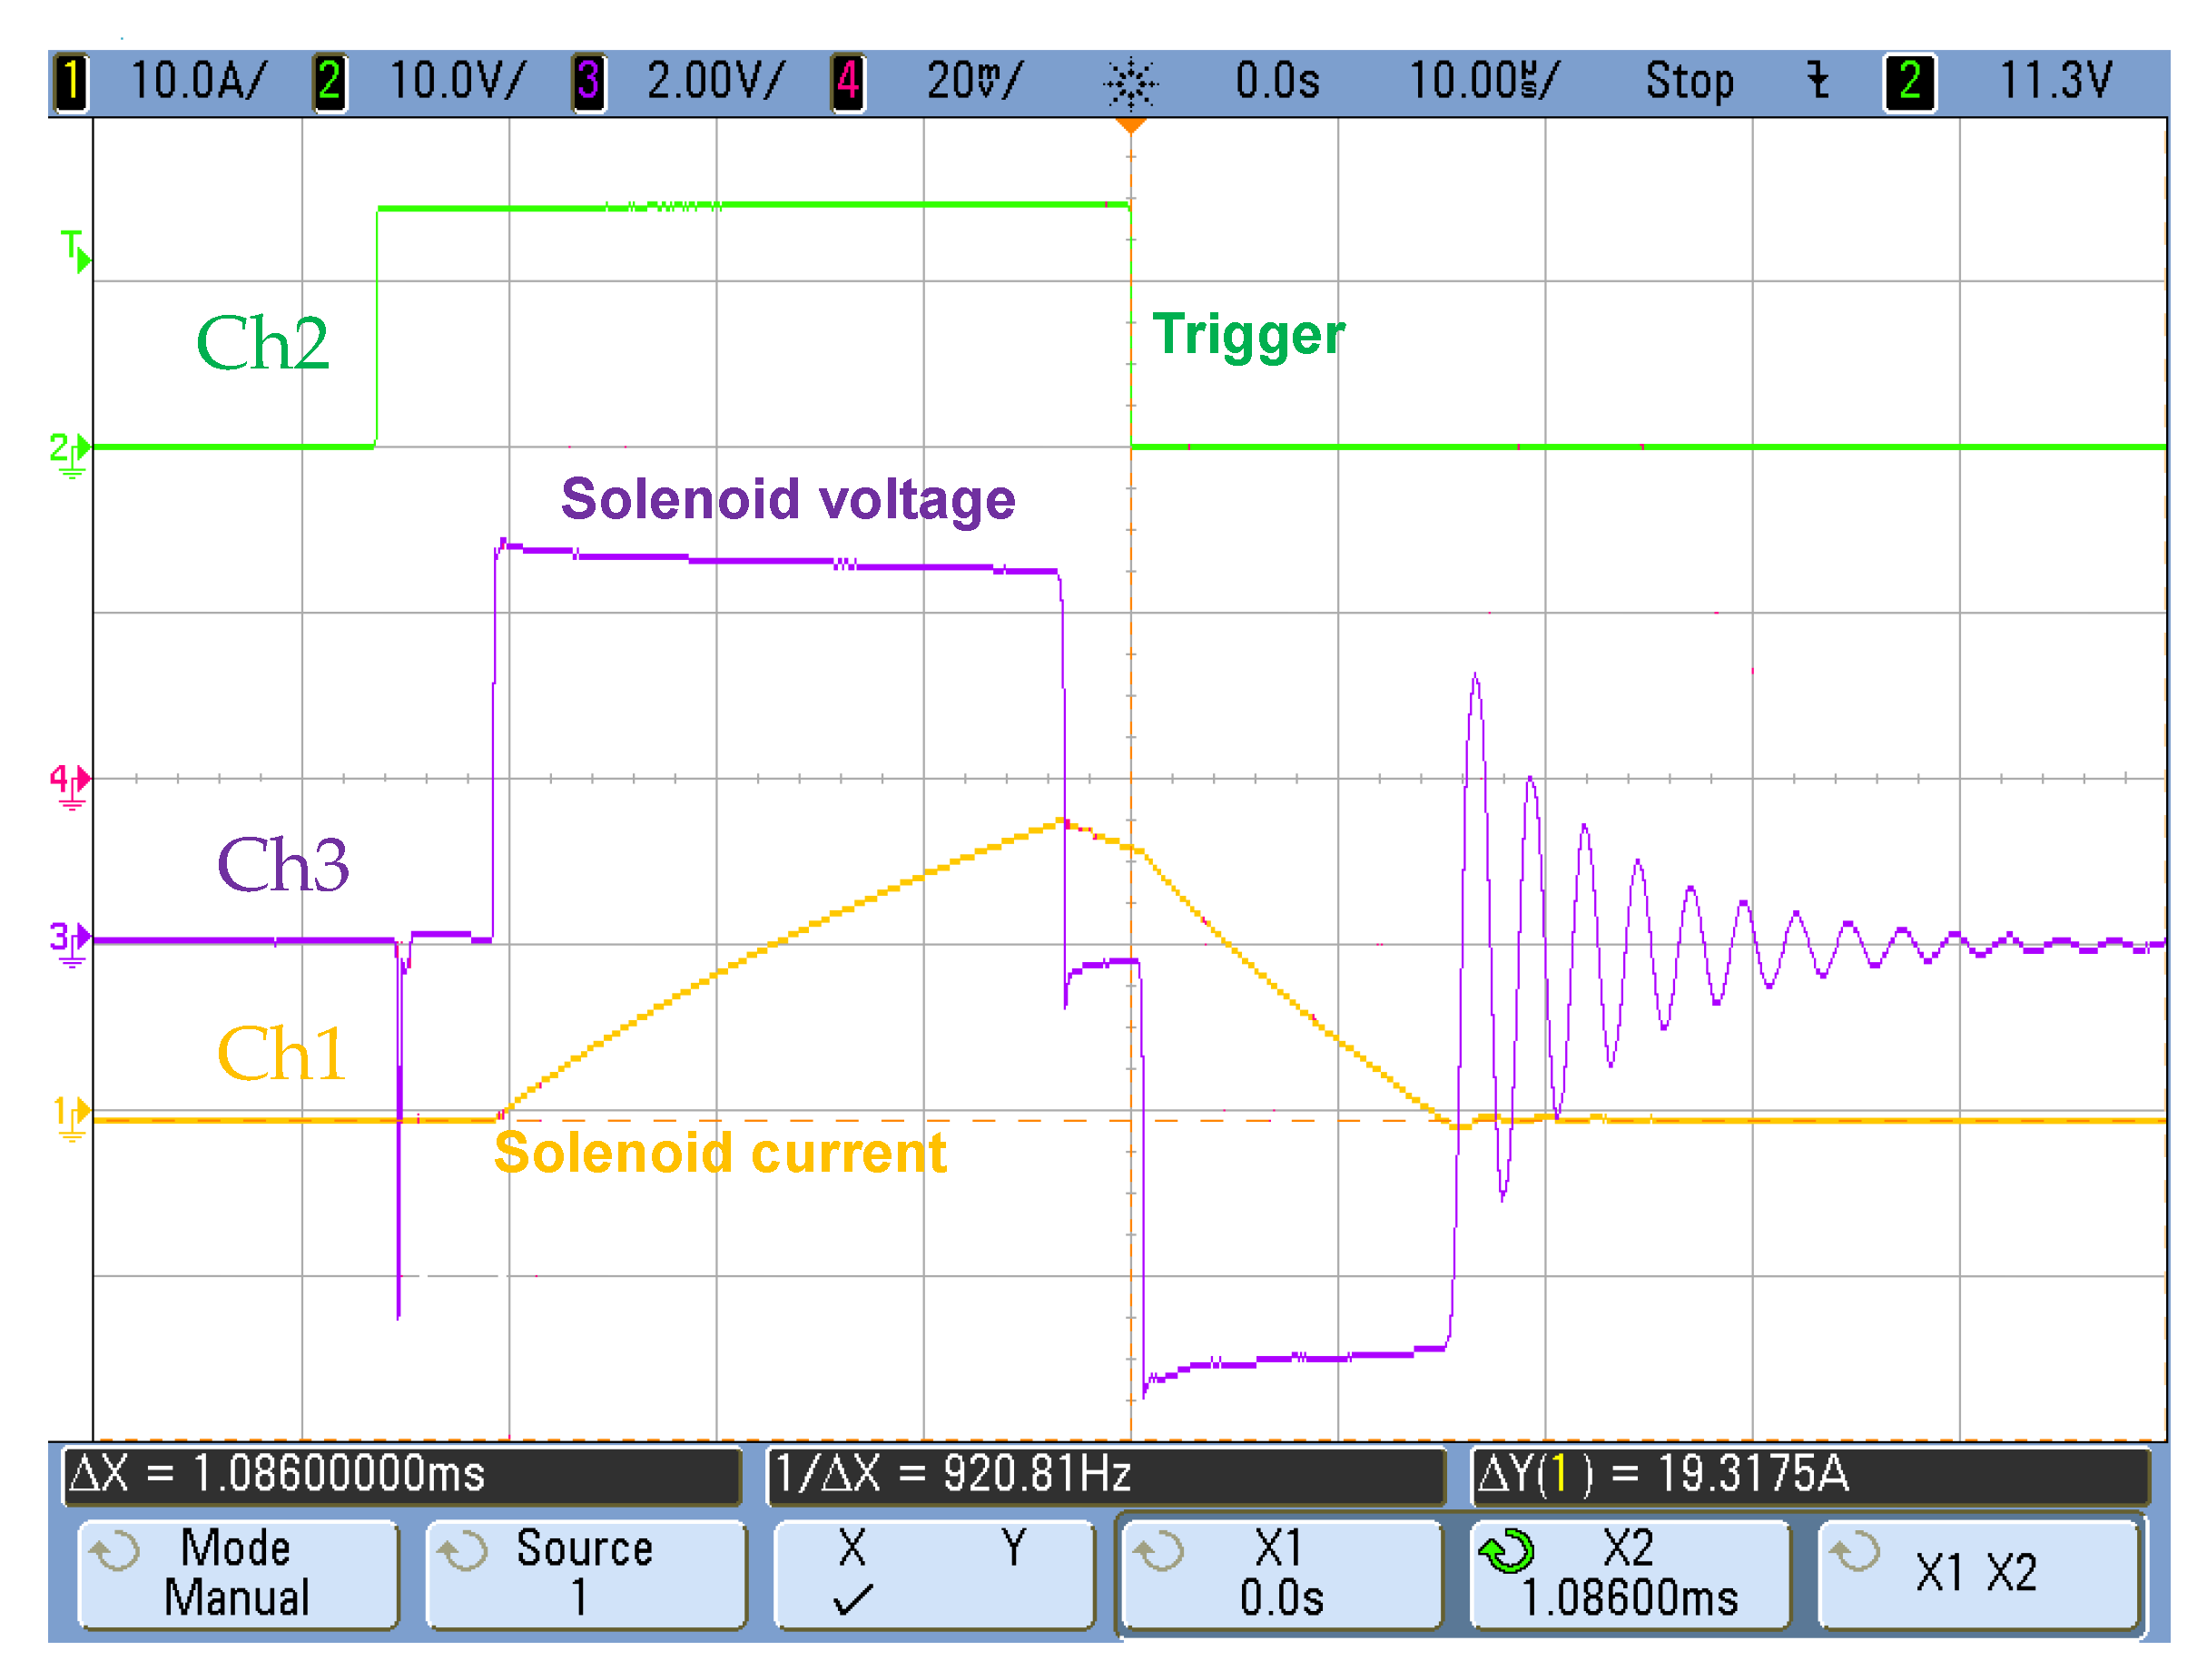
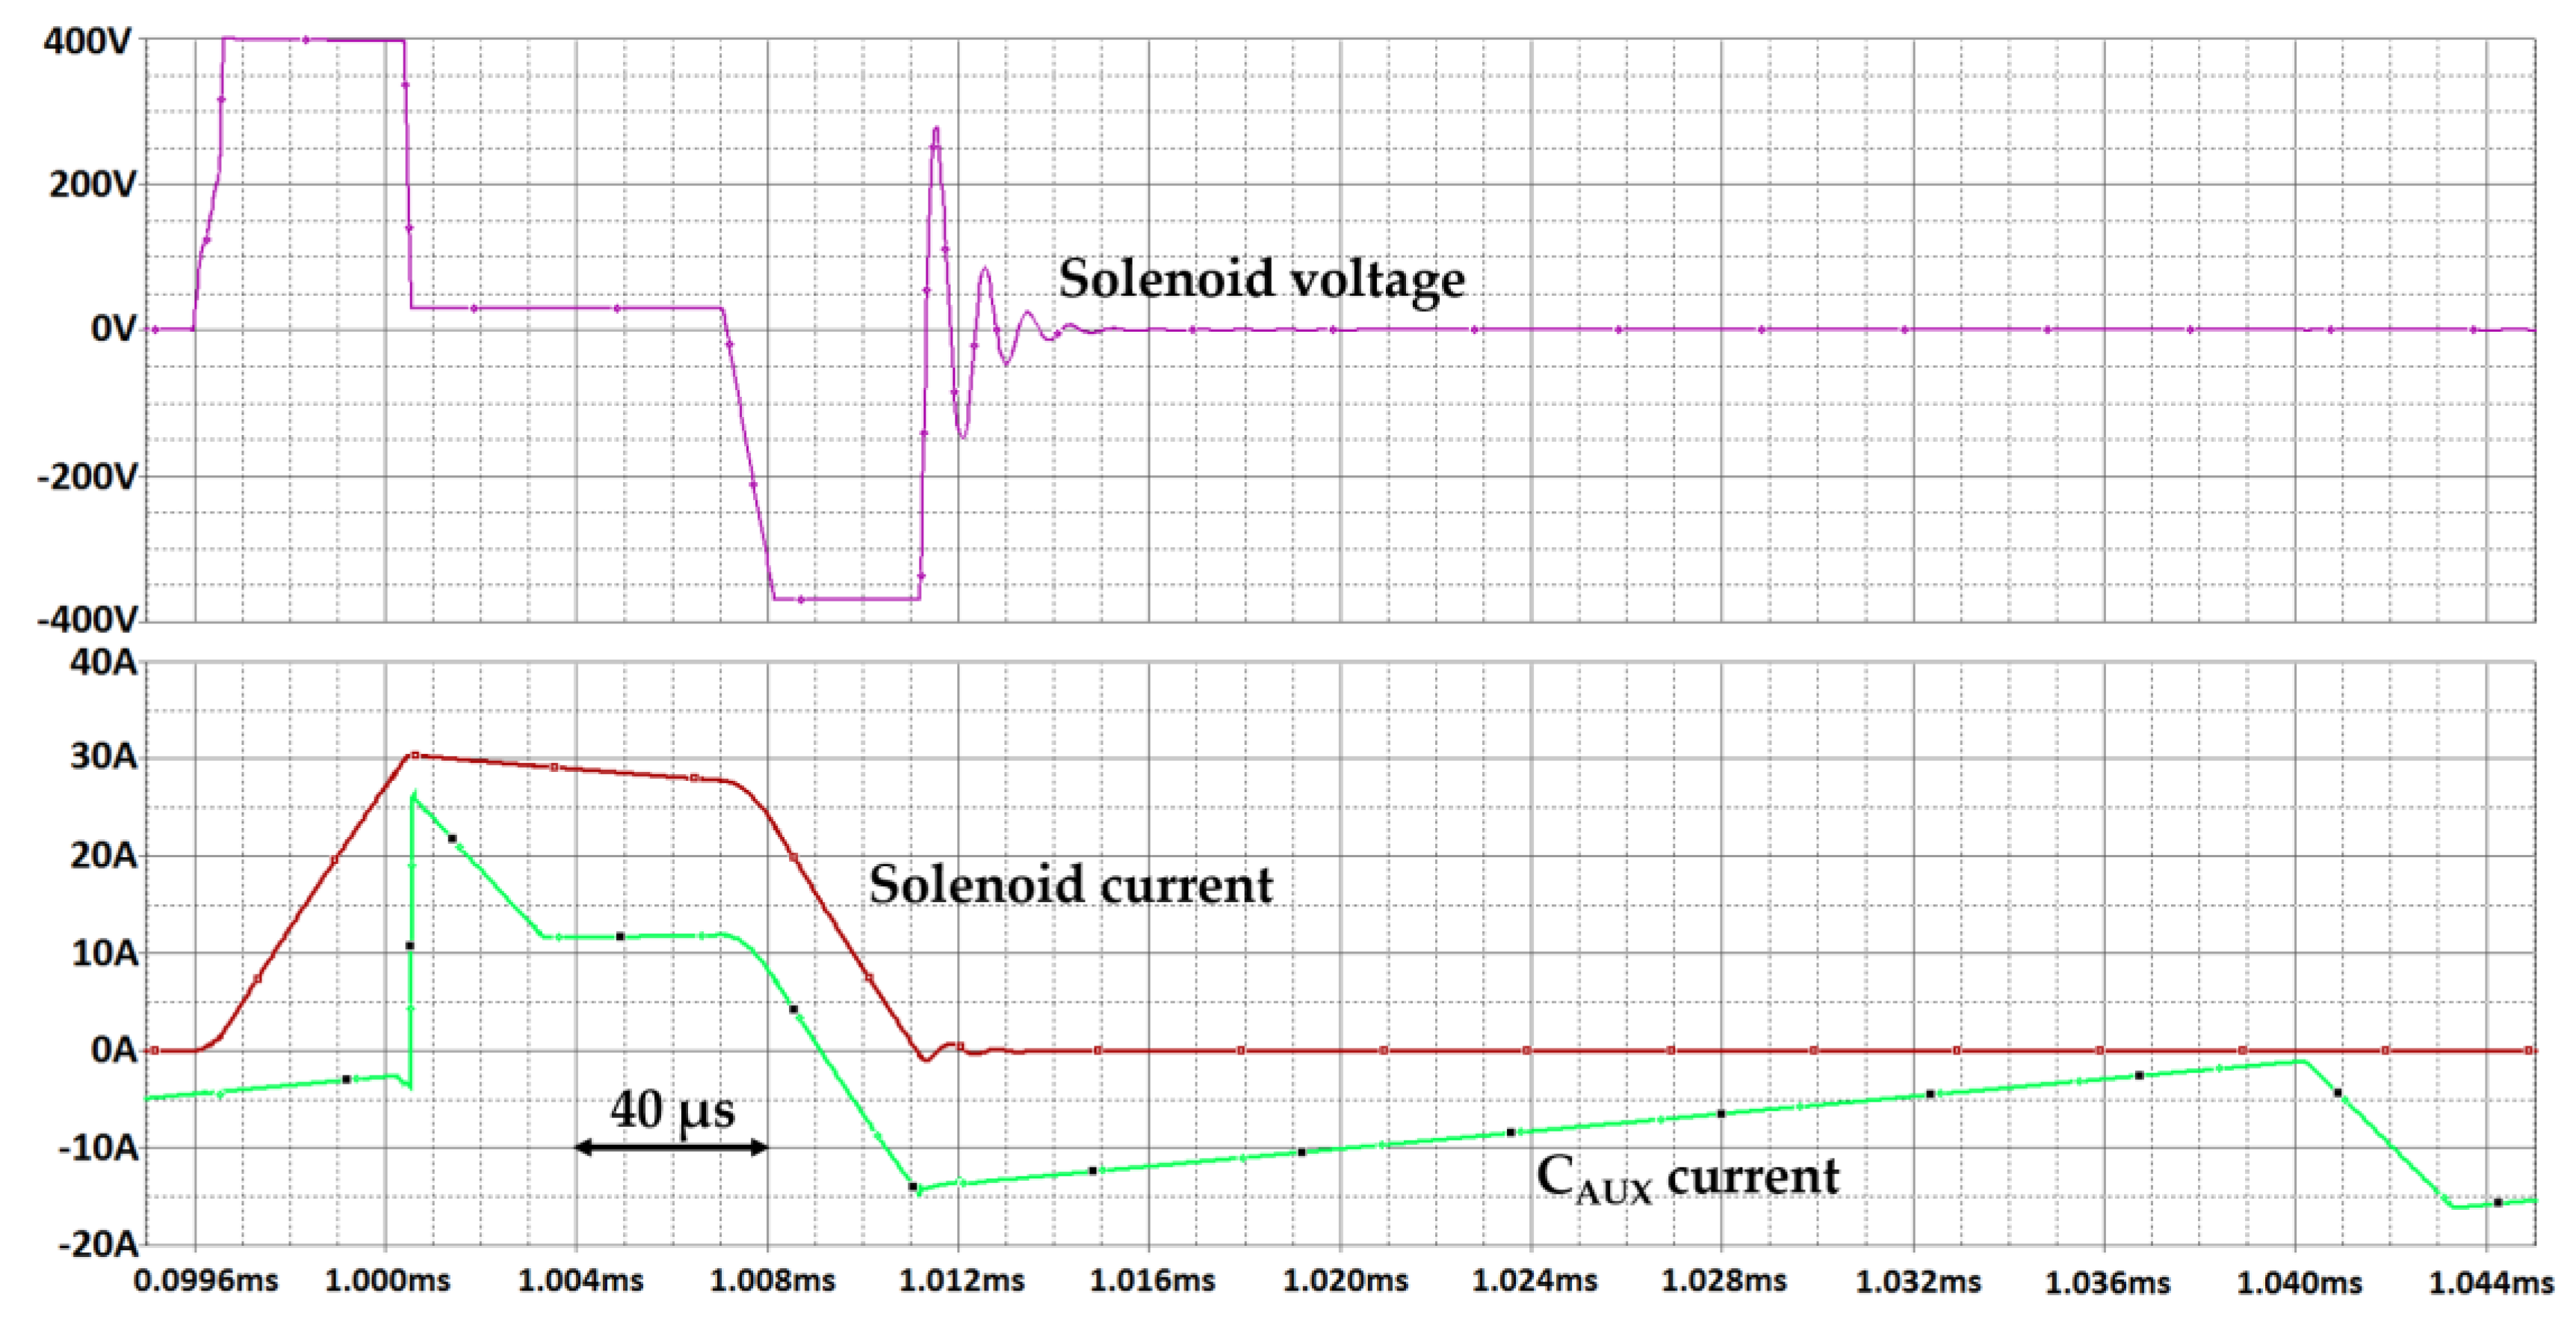
Operation Tests
5. Conclusions
Acknowledgments
Author Contributions
Conflicts of Interest
References
- Bauer, T.; Laing, D.; Tamme, R. Overview of PCMs for Concentrated Solar Power in the Temperature Range 200 to 350 °C. Adv. Sci. Technol. 2010, 74, 272–277. [Google Scholar] [CrossRef]
- Silk, M.G.; Bainton, K.F. The propagation in metal tubing of ultrasonic wave modes equivalent to Lamb waves. Ultrasonics 1979, 17, 11–19. [Google Scholar] [CrossRef]
- Seco, F.; Jiménez, A.R. Modelling the generation and propagation of ultrasonic signals in cylindrical waveguides. In Ultrasonic Waves; InTech: Rijeka, Croatia, 2012. [Google Scholar]
- Bertoncini, F.; De Lorenzo, G.; Giunta, G.; Raugi, M.; Turcu, F. Effect of Attenuation on Inspection Range and Sensitivity in Long-Range Guided Wave NDT of coated and Buried Pipes. 2010. Available online: http://www.ndt.net/article/ndtnet/2010/16_TurcuRev1.pdf (accessed on 6 March 2018).
- Rose, J.L.; Ditri, J.J.; Pilarski, A.; Rajana, K.; Carr, F. A guided wave inspection technique for nuclear steam generator tubing. NDT E Int. 1994, 27, 307–310. [Google Scholar] [CrossRef]
- Ditri, J.J.; Rose, J.L. Excitation of guided elastic wave modes in hollow cylinders by applied surface tractions. J. Appl. Phys. 1992, 72, 2589–2597. [Google Scholar] [CrossRef]
- Ma, J.; Lowe, M.J.S.; Simonetti, F. Feasibility study of sludge and blockage detection inside pipes using guided torsional waves. Meas. Sci. Technol. 2007, 18, 2629–2641. [Google Scholar] [CrossRef]
- Charchuk, R.; Werstiuk, C.; Evans, M.; Sjerve, E. High Temperature Guided Wave Pipe Inspection. In Proceedings of the 4th International CANDU In-service Inspection Workshop and NDT in Canada 2012 Conference, Toronto, ON, Canada, 18–21 June 2012; pp. 18–21. [Google Scholar]
- Hirao, M.; Ogi, H. Electromagnetic Acoustic Transducers: Noncontacting Ultrasonic Measurements Using EMATs; Springer: Tokyo, Japan, 2017. [Google Scholar]
- Nakamura, N.; Ogi, H.; Hirao, M. Mode Conversion and Total Reflection of Torsional Waves for Pipe Inspection. Jpn. J. Appl. Phys. 2013, 52, 07HC14. [Google Scholar] [CrossRef]
- William, R.C. Theory of Magnetostrictive Delay Lines for Pulse and Continuous Wave Transmission. IRE Trans. Ultrason. Eng. 1959, PGUE-7, 16–32. [Google Scholar] [CrossRef]
- Bertoncini, F.; Raugi, M.; Turcu, F. Application of Ultrasonic Guided Waves in the Field of Cryogenic Fluids. 2010. Available online: http://www.idspektr.ru/10_ECNDT/reports/1_13_12.pdf (accessed on 6 March 2018).
- Kim, Y.Y.; Kwon, Y.E. Review of magnetostrictive patch transducers and applications in ultrasonic nondestructive testing of waveguides. Ultrasonics 2015, 62, 3–19. [Google Scholar] [CrossRef] [PubMed]
- Kwun, H.; Sang-Young, K.; Crouch, A.E. Method and Apparatus Generating and Detecting Torsional Waves for Long Range Inspection of Pipes and Tubes. U.S. Patent 662,462,8B1, 23 September 2003. [Google Scholar]
- Bertoncini, F.; Giunta, G.; Raugi, M.; Turcu, F. Overview and Experimental Evaluation of Magnetostrictive Transducers for Guided Wave Inspection. 2012. Available online: http://www.ndt.net/article/ndtnet/2012/1_Turcu.pdf (accessed on 6 March 2018).
- Park, C.; Han, S.; Cho, S.; Kim, Y. The Generation of Torsional Waves and the Pipe Diagnosis Using Magnetostrictive Transducers; Transactions of the Korean Society for Noise and Vibration Engineering: Seoul, Korea, 2004; Volume 14, pp. 144–149. [Google Scholar]
- Vinogradov, S. Method and System for the Generation of Torsional Guided Waves Using a Ferromagnetic Strip Sensor. U.S. Patent 7,573,261, 11 August 2009. [Google Scholar]
- Kim, Y.-G.; Moon, H.-S.; Park, K.-J.; Lee, J.-K. Generating and detecting torsional guided waves using magnetostrictive sensors of crossed coils. NDT E Int. 2011, 44, 145–151. [Google Scholar] [CrossRef]


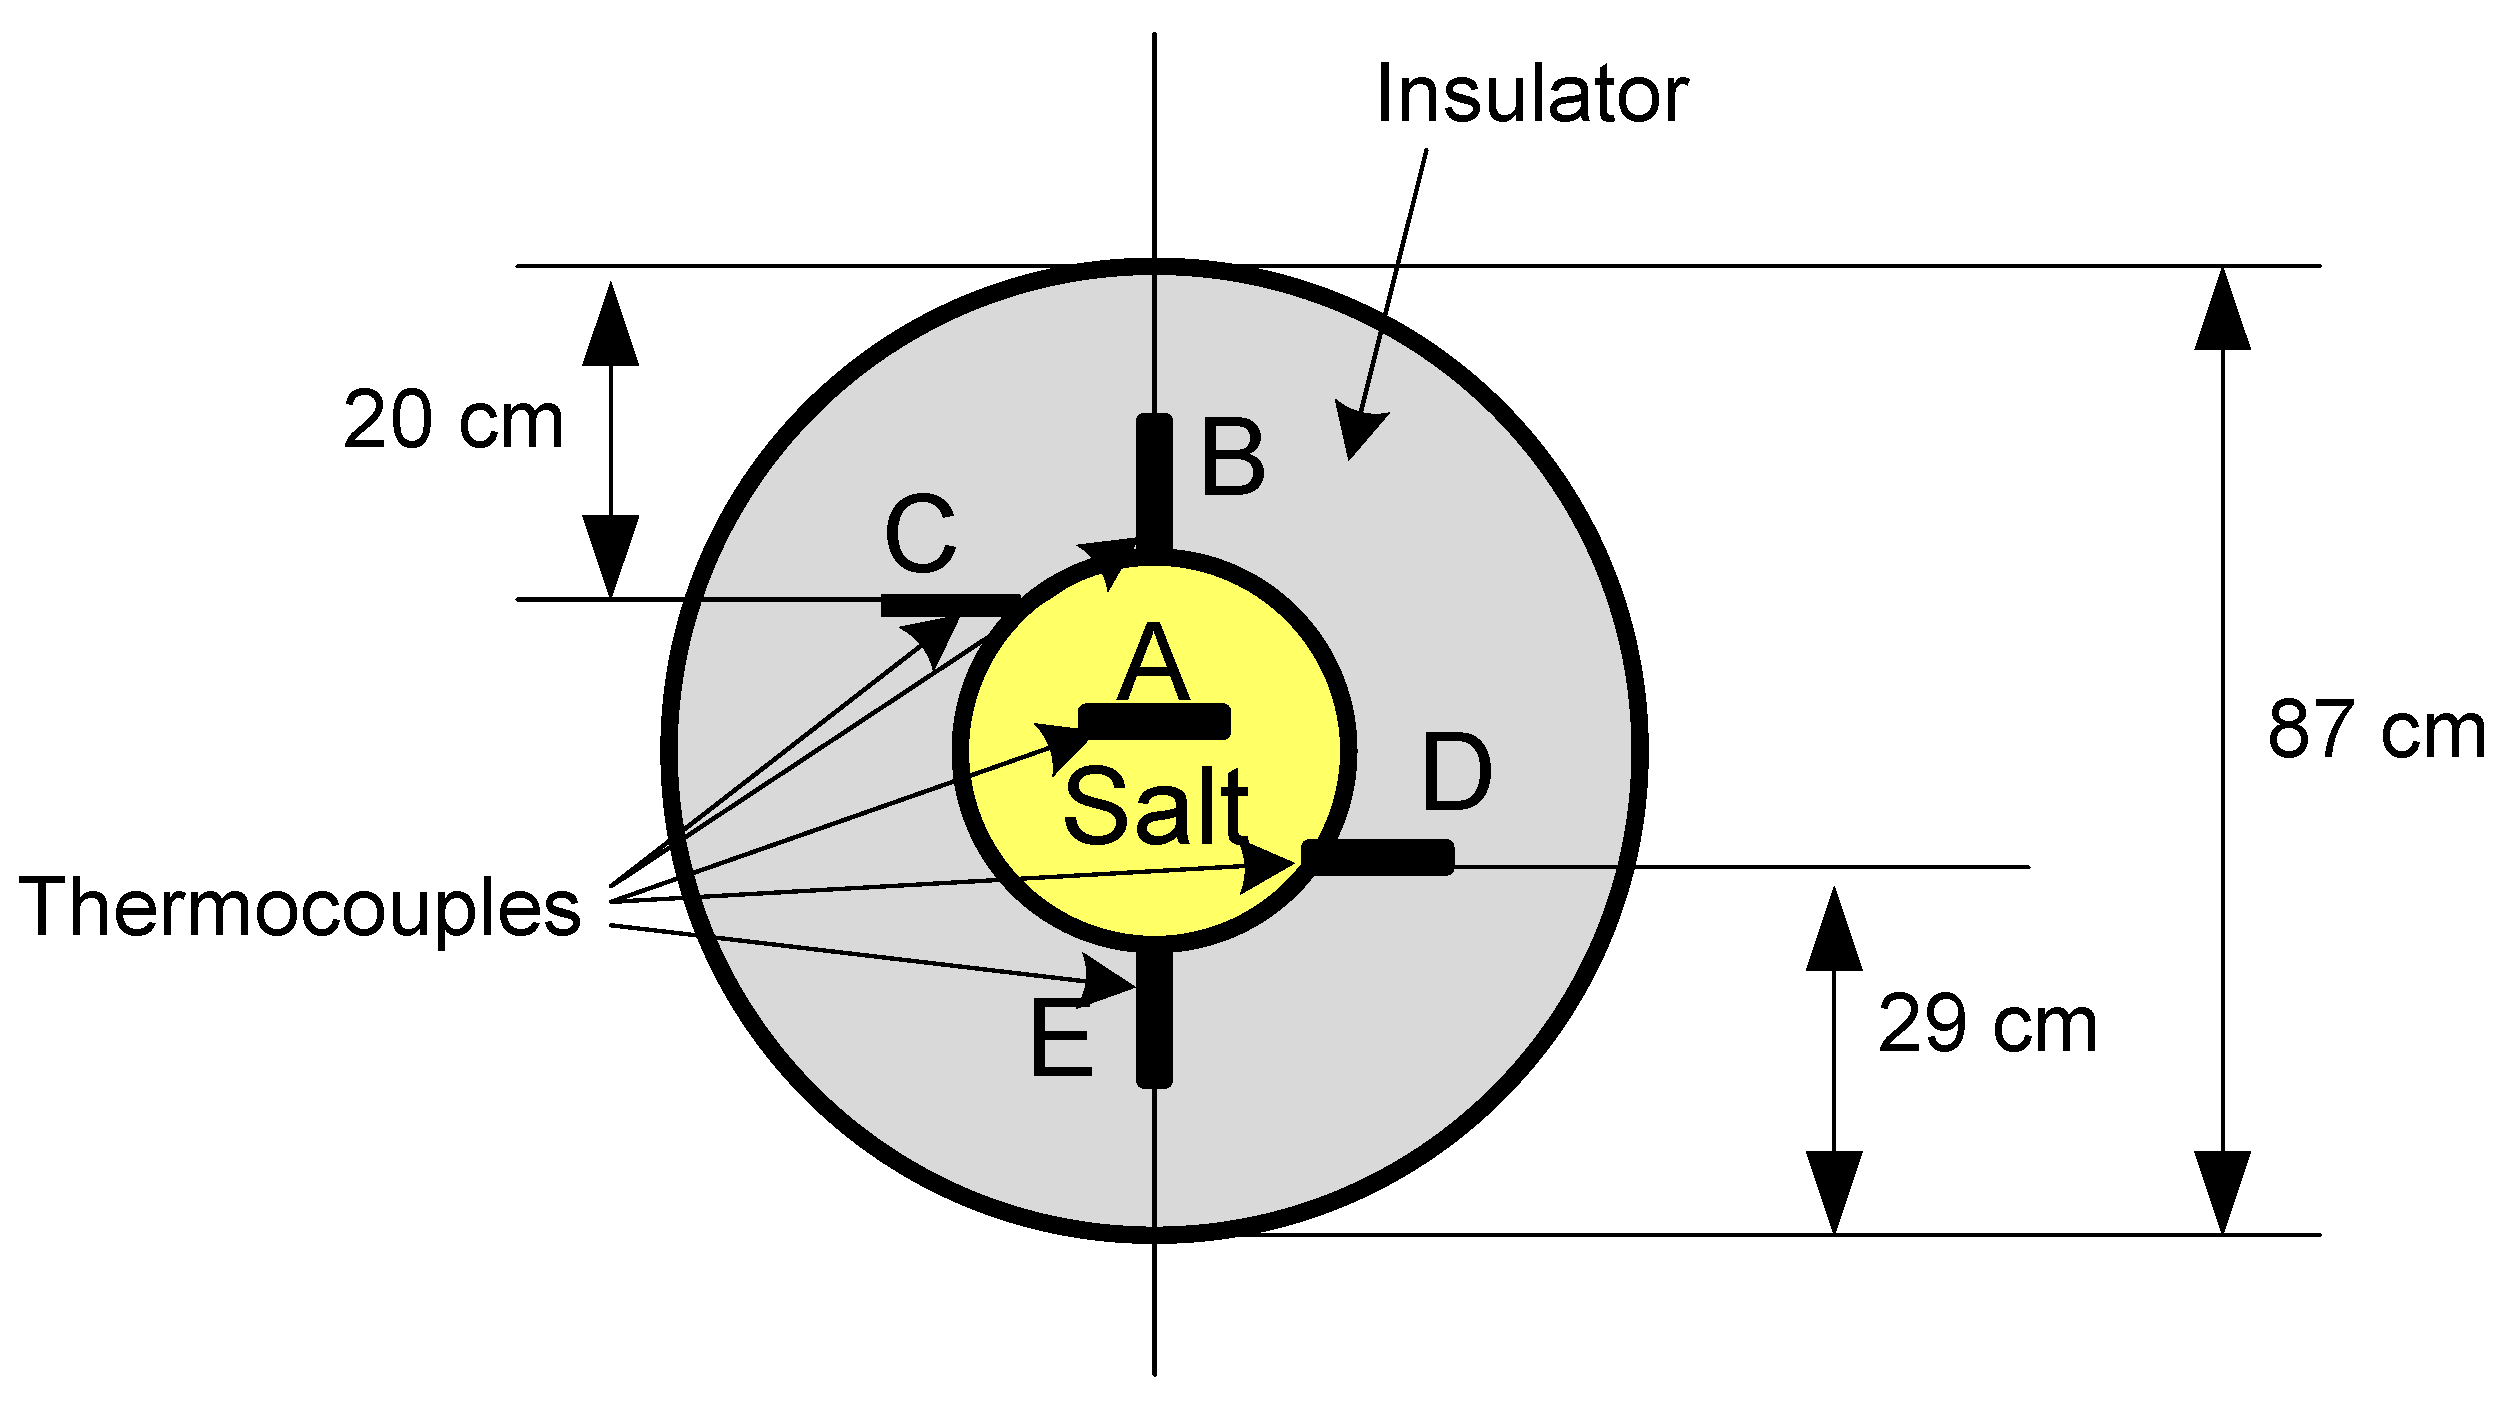
| Thermocouple Measure | Salt Temperature | External Temperature |
|---|---|---|
| TT-13WSX30CT001-JTC1position A | 312.25 °C | |
| Thermocouple position B | 294 °C | 286 °C |
| Thermocouple position C | 290 °C | 282 °C |
| Thermocouple position D | 285 °C | 277 °C |
| Thermocouple position E | 281 °C | 273 °C |
| A. Elongation Coefficients | |
|---|---|
| Material | ∆L/L |
| Nickel | −33 × 10−6 |
| 45 Permalloy | 27 × 10−6 |
| Vanadium Permendur | 70 × 10−6 |
| Steel | 21 × 10−6 |
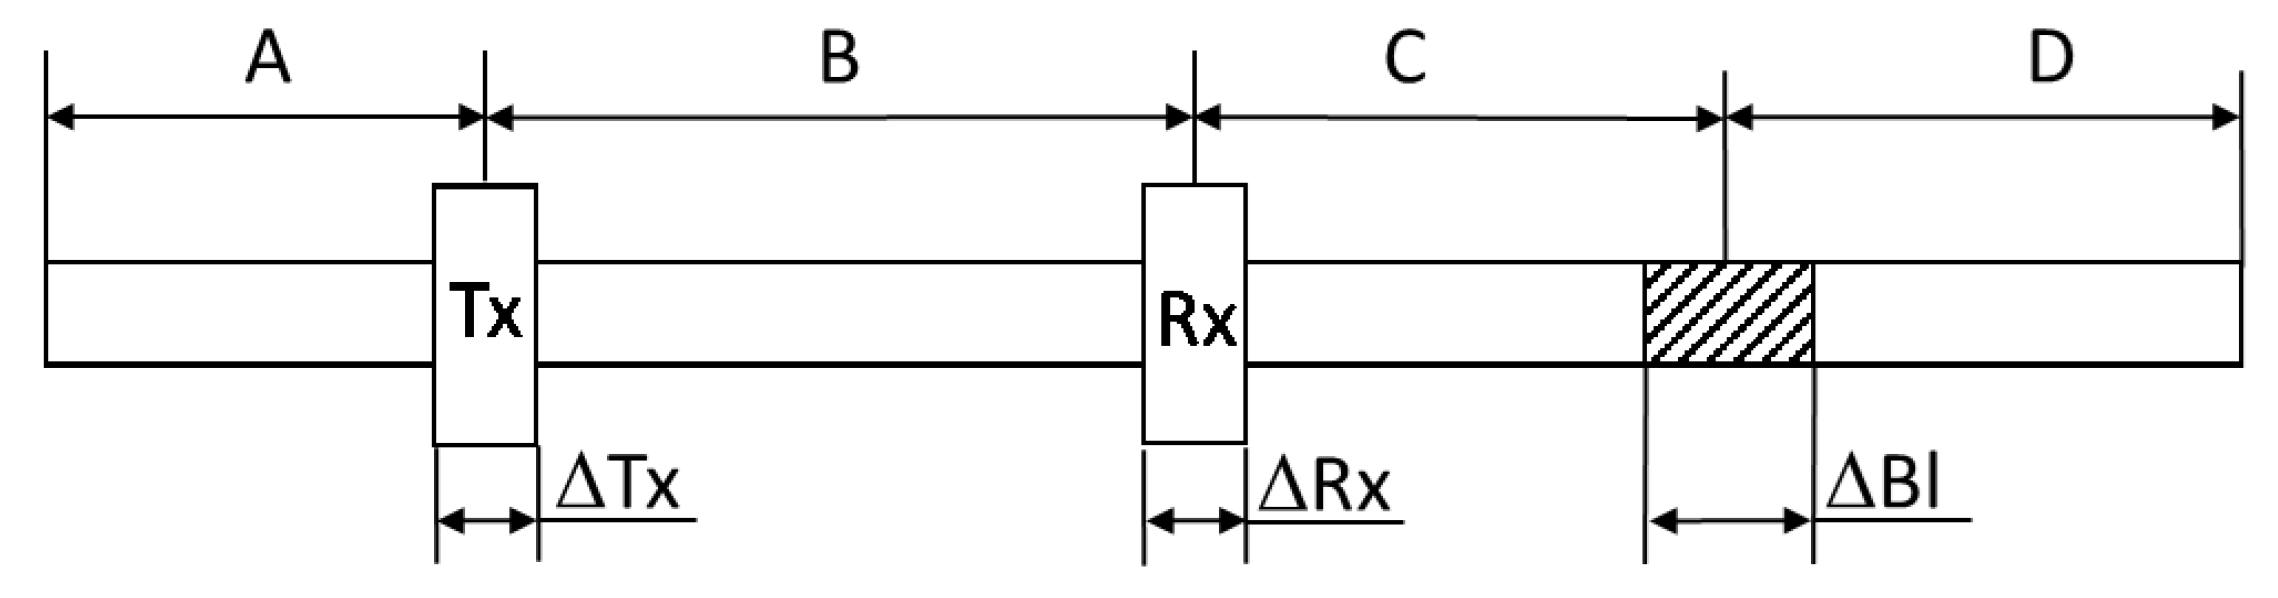
| Distance | Value | Unit |
|---|---|---|
| A | 1000 | mm |
| B | 1000 | |
| C | 1955 | |
| D | 1045 | |
| ΔTx | 50 | |
| ΔRx | 50 | |
| ΔBl | 110 |
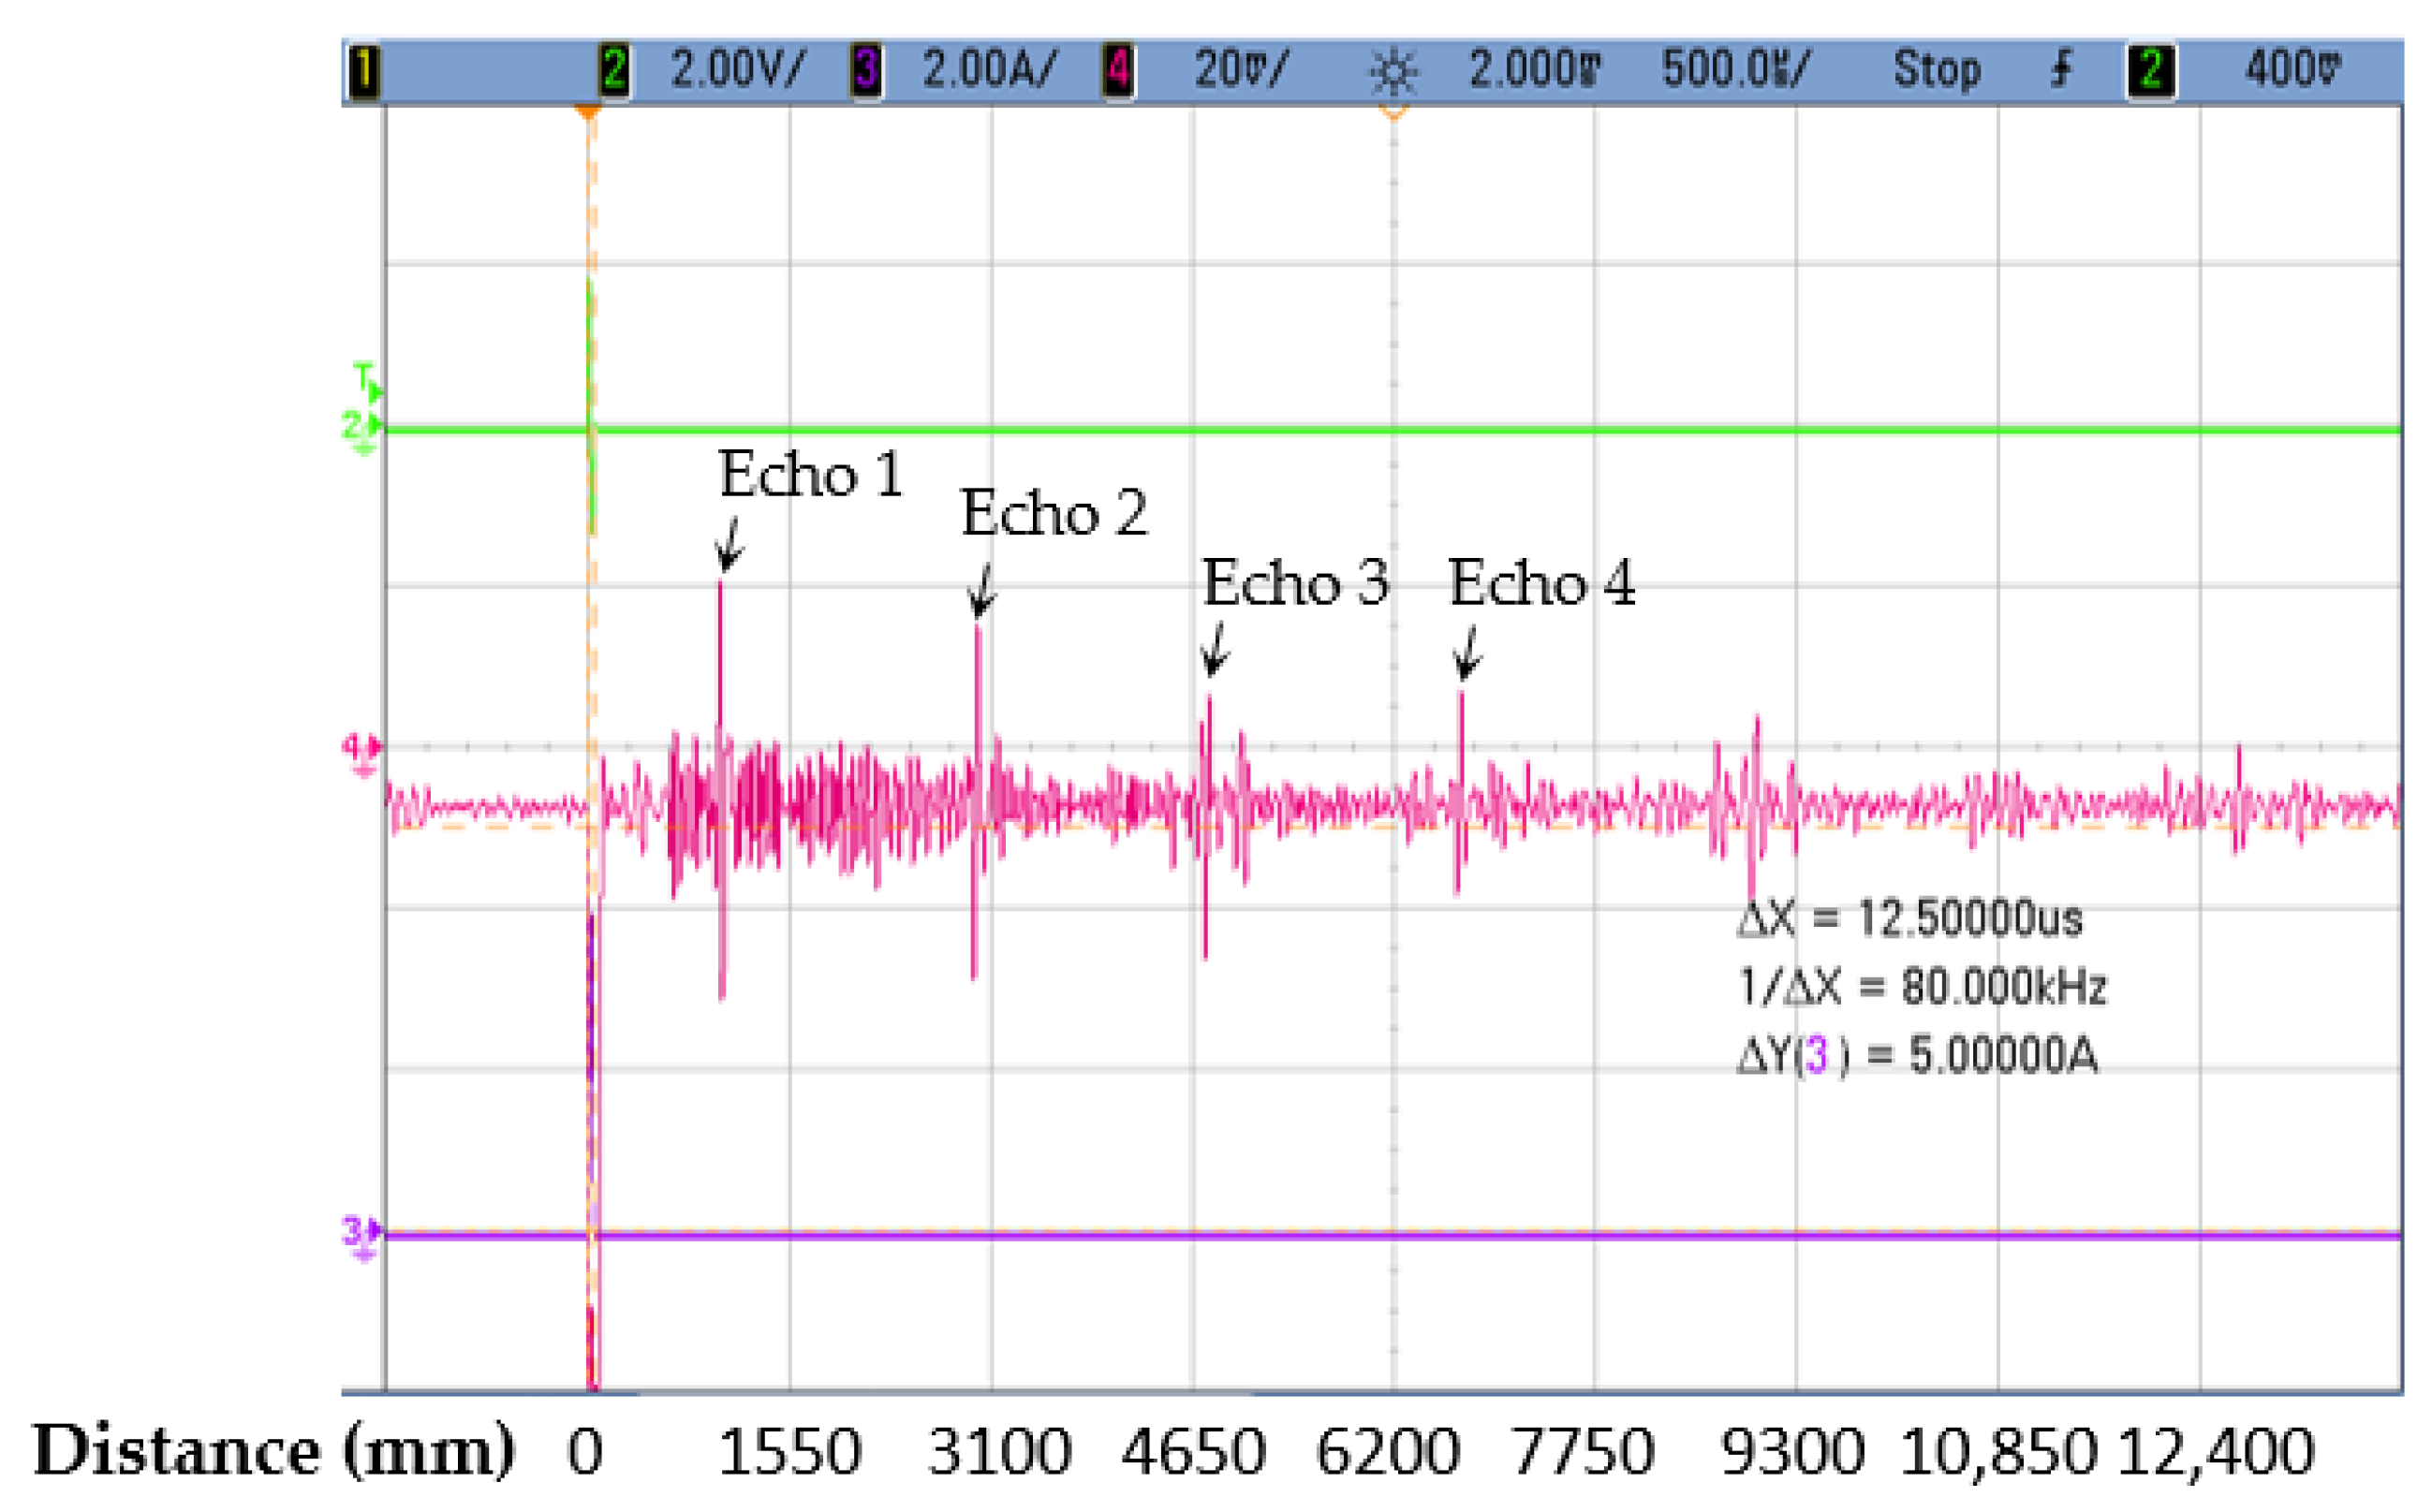
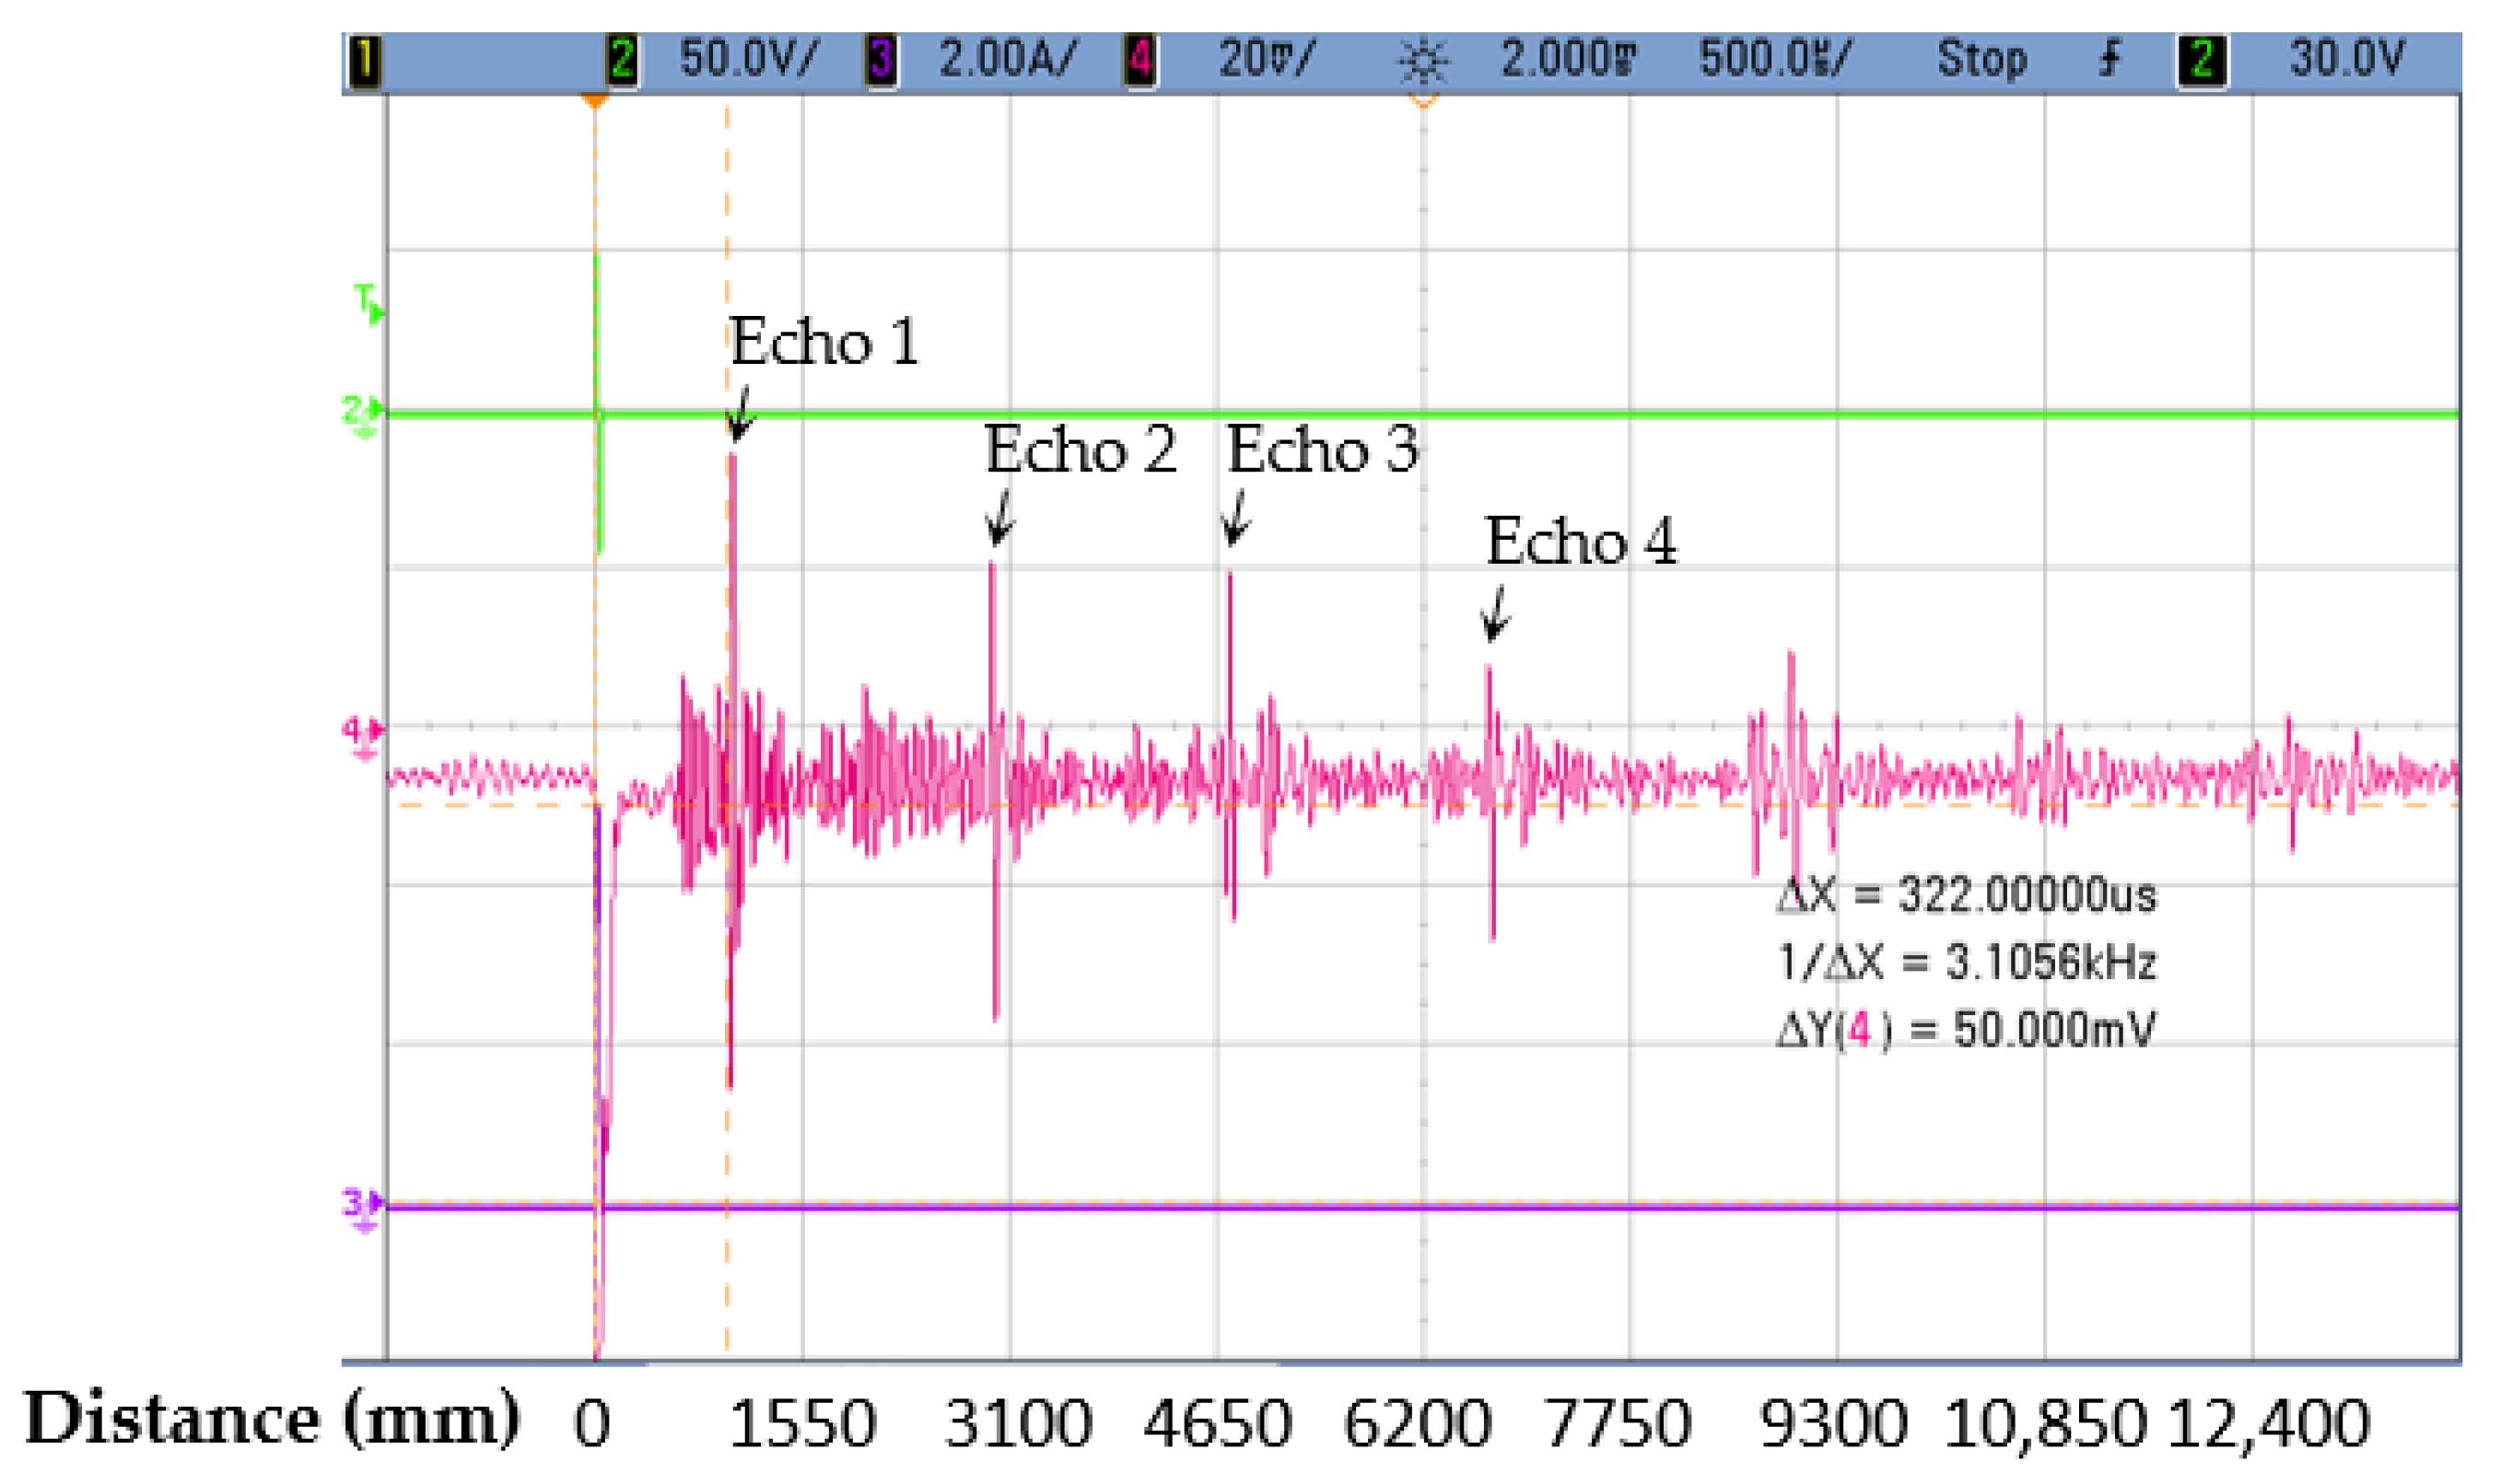
| Signal | Distance | |
|---|---|---|
| Echo 1 |  | |
| Echo 2 |  | |
| Echo 3 |  | |
| Echo 4 |  |
| Echo | Distance(mm) | Estimated Time (µs) | Measured Time (µs) | Error | ||
|---|---|---|---|---|---|---|
| FB | FB+buck | FB | FB+buck | |||
| Echo 1 | 1000 ± 50 | 320.5 ± 16 | 325 | 325 | 1.4% | 1.4% |
| Echo 2 | 3000 ± 50 | 961.5 ± 16 | 965 | 955 | 0.36% | 0.67% |
| Echo 3 | 4910 ± 105 | 1573 ± 34 | 1520 | 1530 | 3.36% | 2.73% |
| Echo 4 | 7000 ± 50 | 2243 ± 16 | 2170 | 2160 | 3.25% | 3.7% |
© 2018 by the authors. Licensee MDPI, Basel, Switzerland. This article is an open access article distributed under the terms and conditions of the Creative Commons Attribution (CC BY) license (http://creativecommons.org/licenses/by/4.0/).
Share and Cite
Andrés-Mayor, H.; Prieto, M.J.; Villegas, P.J.; Nuño, F.; Martín-Ramos, J.A.; Pernía, A.M. Development of Magnetostrictive Transducer Prototype for Blockage Detection on Molten Salt Pipes. Energies 2018, 11, 587. https://doi.org/10.3390/en11030587
Andrés-Mayor H, Prieto MJ, Villegas PJ, Nuño F, Martín-Ramos JA, Pernía AM. Development of Magnetostrictive Transducer Prototype for Blockage Detection on Molten Salt Pipes. Energies. 2018; 11(3):587. https://doi.org/10.3390/en11030587
Chicago/Turabian StyleAndrés-Mayor, Héctor, Miguel J. Prieto, Pedro J. Villegas, Fernado Nuño, Juan A. Martín-Ramos, and Alberto M. Pernía. 2018. "Development of Magnetostrictive Transducer Prototype for Blockage Detection on Molten Salt Pipes" Energies 11, no. 3: 587. https://doi.org/10.3390/en11030587