1. Introduction
Historically, environmental control policies have been based on the amount of pollution produced (allowances, permits, emission limits, etc.) versus the approach based on the imposition of a tax on pollution [
1]. In 1960 Coase [
2] proposed the explicit and transferable issue right, with the purpose that the market could establish an economic value to the emission rights and facilitate their transfer. The market was intended to generate an economic incentive to reduce emissions that traditional schemes did not provide.
In 1997, the signature of the Kyoto Protocol introduced the concept of international emissions trading. For the first time, 38 industrialised countries and economies in transition were committed in a binding manner to reduce greenhouse gas emissions (GHG) by an average of 5% against 1990 levels over the five-year period 2008–2012. The European Union (EU) set an even more exigent goal for itself, when it committed to reducing its emissions by 8% on average. To meet this commitment the EU implemented the Emission Trading System (EU-ETS), which has become the basic pillar of its climate policy. The fundamental reasons that led to use this market instrument are the following: it guarantees environmental effectiveness, since it allows achieving the emission reduction objectives with a high degree of certainty; it offers flexibility, being an instrument adaptable to the economic situation; it generates economic incentives that encourage the development and use of clean technologies; and it is effective in terms of cost reduction, since it uses the informational advantage of the market as a resource allocator to reduce emissions at the lowest cost [
3,
4].
The EU, although lacking experience in this regulatory instrument, had great institutional support. Both the OECD and UNCTAD supported the introduction of the EU-ETS. From the experiences of the United States (US), they had developed the requirements and administrative structures necessary for the operation of an international trading system of CO
2 emission rights [
5,
6]. In 2005 the EU-ETS was born, becoming the first and largest international trading regime of greenhouse gas permits in the world. The fundamental feature is to cap and trade emission rights among market participants. The EU-ETS has met its principal purpose. The EU-28 emissions have been reduced by 24.4% since 1990 while the overall target was 8% by 2012 [
7]. Nevertheless, one of the biggest obstacles it has faced since its beginning has been the significant mismatch between actual emissions and assigned permits. This has led to right prices that are too low to favour important emissions reductions in the short term, and too volatile to promote investments in suitable technologies in the long term [
8].
The causes of these low prices of rights are several. Among them is, on the one hand, the incorporation into the EU of Eastern countries, whose economic crisis caused the collapse of emissions in the years immediately after 1990, the reference year of the commitments of the Kyoto Protocol. Therefore, they received more rights than necessary, contributing the overabundance of rights in the EU-ETS [
9,
10]. On the other hand, the economic recession of 2008 has also contributed to the reduction of emissions not only in the EU, but worldwide [
11].
To this structural surplus we must add: (1) the positive results of EU policies in promoting renewable energies and energy efficiency, which have caused a significant fall in the demand for rights and (2) the volume of carbon credits generated by carbon projects through the Clean Development Mechanism (CDM) and the Joint Implementation (JI) [
8,
11,
12].
As a result, there are more emission permits than real emissions [
13]. The system has not been able to adapt to exogenous shocks or to cushion the volatility of the price [
14,
15].
Despite these difficulties, a growing number of countries and regions, including developing countries, have shown great interest in emissions trading. At the same time, many countries have already implemented an emissions trading system or have put in place pilot systems. There are regional markets in Canada, the US, Japan and China, and other national markets such as Korea or New Zealand. Regions such as Vietnam or Russia are also studying the creation of new ones [
16]. They are willing to share knowledge and experience on the subject. In fact, the EU has signed cooperation agreements with China and with Korea to share its pioneering experience in the Emissions Trading System [
17]. The interconnection of these markets will allow establishing a global carbon market, which would increase the profitable mitigation possibilities and increase market liquidity.
1.1. Motivation and Novelty of the Study
This is an opportune moment to evaluate how effective the EU-ETS has been as it was implemented more than 10 years ago and given the increasing interest of other regions in this market instrument. This analysis acquires special relevance taking into account the low prices of the right and the effective reduction of emissions, which makes us think that the efficiency of the system does not depend solely on this market signal. As [
18] point out, differentiating the effect of the prices of the right on emission from other factors is not an easy task.
Carbon markets are not natural markets, but they are created by political decisions to respond to climate externalities at the lowest possible cost. They are an institutional innovation in environmental regulation that requires a mandatory legal basis for its proper functioning. The essential factors for its success are the firmness in the institutional change it implies, and the efficient interaction between the institutions.
The novelty of this work lies in considering the institutional change that the EU-ETS implies as a fundamental variable in reducing emissions. This approach supposes a methodological change with respect to most of the literature, centred fundamentally on the prices of the right. We use dummy variables to include each of the phases of the EU-ETS since its inception in 2005. The inclusion of the price of the right as an additional explanatory variable of the evolution of emissions presents problems of multicollinearity with the dichotomous variables, considering both fixed and random effects. If the model does not include dummy variables, the price of the right is not a significant variable [
19].
Therefore, this work contributes to the scientific acquis on the effectiveness of emission right markets as an instrument of climate policy. Furthermore, there is a gap to be filled: the assessment of the effectiveness of ETSs taking into account the impact of complementary policies. These policies can contribute to a significant emission reduction on their own and call into question the effectiveness of trade in rights. This study also contributes to filling this gap in knowledge, as we analyse the effects of two variables on emissions simultaneously: changes in the EU energy mix, such as the promotion of renewables, and the trade of rights.
1.2. Objectives of the Study
The objective of this paper is to analyse to what extent the EU-ETS a rights-offering “regulatory institution” functions as an effective carbon market instrument in the reduction of emissions.
Specifically, this study will determine if the emissions trading is being effective for a panel of the 28 EU countries, despite the limitations of its design and the simultaneous application of energy policies encouraging the use of cleaner energies. Thus:
- (a)
This work will verify the causal relationship between economic growth and GHG emissions in the 28 EU countries and will investigate the EU-ETS’s reducing effect on GHG emissions through its different phases.
- (b)
Also, we will analyse whether overlapping policies (specifically the promotion of renewables) diminish market effectiveness, or on the contrary, if they are an adequate complement to enhance its emissions-reducing effect.
To achieve these objectives, we estimate two econometric models for the period 1990–2014 and conduct a comparative analysis of the results obtained. In both cases, we use fixed effects with panel data. The model 1 is used to determine the effects on CO2 emissions per capita of real GDP per capita and of the different phases of the EU-ETS (using dummy variables). In model 2, the estimate includes the participation of renewable sources in the production of electric energy. The comparison of both models will allow us to determine whether the measures of promotion of renewable energies, simultaneous to trade, decrease the effectiveness of the EU-ETS in the reduction of CO2 emissions per capita.
1.3. Organization of the Study
After this introduction,
Section 2 introduces the theoretical framework of this paper (the New Institutional Economy) and the key concepts that allow analysing the EU-ETS as an institution. The next part, taking into account the evolution of the price of the emission right, is devoted to describing the possible instruments that can be used to improve the role of the market as an incentive.
Section 4 and
Section 5 describe the methodology, the econometric models and data sources used in the analysis.
Section 6 shows the empirical outcomes, and finally, in
Section 7, we will draw conclusions.
2. The EU-ETS and the New Institutional Economy
The European emission rights market is particularly attractive for study from an institutional approach because it allows observing two important issues:
- (a)
The difference between a natural market and the real market, with its limitations and frictions derived from its operation.
- (b)
The creation of an international market from its inception, including cost-benefit calculations to know if it is the most efficient measure in the reduction of emissions at the minimum cost (even regardless of the method of assignment of permits [
2]).
According to [
20], we believe that the New Institutional Economics can provide some powerful tools and useful knowledge to analyse environmental problems and evaluate possible answers. The starting point are some key concepts about property rights and transaction costs which help to understand the relevant role of the institutional framework.
In particular, due to the difficulties that economists observe in the operation of EU emissions trading, transaction costs are becoming increasingly relevant in research. The reason is because emissions trading reduces the costs of mitigating climate change, but transaction costs, in turn, can reduce its cost-effectiveness [
21].
Following [
22], ‘‘transaction costs’’ include the ex-ante costs of establishing the use or quasi-ownership rights, and the ex-post costs of administering, monitoring, and enforcing the new rights arrangement. We consider that there is a correspondence with the classification established by [
23], who differentiates between the political transaction costs (ex-ante) and the market transaction costs (ex-post).
The ex-ante costs are the costs generated by the implementation of the tool itself which, in this case, is the ETS. These costs fall on public administration since they consist mainly of developing the necessary legal framework for the creation of the market and the property rights [
24]. When evaluating several policies, ex-ante quantification is feasible and useful in deciding which one to apply. In fact, political transaction costs can lead to an institutional blockade [
23]. Once the decision is made, its measurement is possible only for the chosen alternative, in this case the ETS [
25]. It would be then a sunk cost.
The market transaction costs (ex-post), are the costs of exchanging property rights among market participants after politicians have devised the market. The data must be monitored, reported and verified (MRV), key issues in the design of any emissions trading. This process involves high transaction costs that depend on the type and size of the companies [
26]. Information costs and searching costs in EU-ETS influence companies with fewer facilities and less commercial experience [
27].
Jaraite et al. [
28] showed that initial implementation costs of the market tended to be high and significant, while market transaction costs were not. In any case, transaction costs decrease when the institutional framework improves and as a response to the learning process. Thus, authors are used to considering that transaction costs are higher in the initial stages of a market [
29] and can be reduced over time, due precisely to the experience gained by their participants [
25]. These two issues are important when comparing the costs of a new program with one that has existed for some time.
Based on experience, it is possible to detect the need to introduce changes that improve the functioning of the market, despite the transaction costs involved in these changes. In this way, it is intended that the market, as an institution, improve its design and generate adequate signals to modify the behaviour of the agents.
In this sense, the operation of the EU-ETS has revealed some of its limitations [
30,
31]. Among them, it is worth noting the excess of existing rights, which has caused rights prices that are too low [
8,
11,
12] This is a consequence of both the initial over-allocation, increased through banking and the economic crisis that began in 2008 [
32], as well as the complementary policies of the EU on renewable energies and energy efficiency.
3. The Price of the Rights
The emission rights were negotiated below €10 as of 2013 [
33]. The price is below most estimates of the social cost of carbon [
34,
35] and is also low in relation to the implicit price used internally by many companies when making their investment decisions [
36].
There are different measures to increase the price of rights and provide market participants with a relative certainty about its development. These measures can influence the number of rights available in the market, either at a specific price or at a certain amount.
For example, as established in California, Quebec or the Regional Greenhouse Gases Initiative (RGGI) [
16], a minimum price could be established for newly issued allowances in auctions [
37,
38,
39,
40]. This would reduce the supply of additional rights once the demand, and therefore the price falls below a certain limit. Similarly, the so-called “cost containment reserves” can help cushion sudden price changes by increasing the supply of CO
2 allowances in times of scarcity [
41,
42]. However, these measures should be designed in a way that allows the market the necessary flexibility to determine an efficient price to reduce emissions.
Another, easier way to raise the prices of emission rights would be to diminish the total number of allowances in the market. The 2030 policy framework for climate and energy [
43] established that the annual linear reduction of trade in allowances will increase from 1.74% to 2.2% in 2021–2030. They expect that the reduction of the rights issued in future years will lead to an increase in long-term prices and also that it will influence current prices.
To address the imbalance in the provision of CO
2 allowances, the European Commission proposed two structural measures to reform the emission trading system. In the first place, the European Parliament and the Council approved in December 2013 the proposal called “back-loading”, consisting in reducing the issuance of 900 million emission rights in the auctions of 2014, 2015 and 2016 and reintroducing the amount withdrawn in the year 2019 and 2020 [
44]. This measure, however, did not raise the price of the rights. It was considered a way to reduce the supply of allowances in the short-term while allowing for more time to take tougher measures before the previously withdrawn amounts were reintroduced into the system.
The second measure proposed by the European Commission in January 2014, consisted in the creation of the so-called “Market Stability Reserve” (MSR) [
45]. According to this measure, the rights are withdrawn or injected into the market by adjusting the offer in each auction depending on the changes in the inventories of unused permits (the optimal oversupply band proposed by the Commission is 400–833 million allowances. These limits are the thresholds that activate the transfer of rights from the auction to the reserve and vice versa when the number of rights in circulation is beyond this range). However, since, by design, the limits cannot be modified, the “Market Stability Reserve” will not be able to make the system fully respond to external disturbances.
For this reserve mechanism to be successful it must be sufficiently flexible, effective and reviewable to avoid situations of an excess of permits and allow quick adjustments, both in the limits that activate the mechanism and in the number of allowances that are transferred. Hepburn et al. [
46] showed that the main lesson for future emissions trading systems is that they must have a stabilisation mechanism from the start.
As established by [
47] an ideal instrument of control would be capable of giving instructions depending on the specific situation. Now, given the difficulty of implementing these instruments in practice, his analysis focused on the so-called “pure” instruments. In recent years and within the framework of climate policy, contributions focused on the analysis and improvement of carbon pricing instruments have gained special interest [
48]. Thus, some studies raise intensity objectives, so that the policy decisions are conditioned to observable economic indicators [
49,
50,
51,
52,
53]. Others propose the use of hybrid tools against the use of pure instruments of quantity or price. These instruments combine carbon taxation and emissions trading [
42,
54,
55,
56,
57,
58,
59].
Therefore, the price of the right has not played its corresponding role until now, thus questioning the efficiency and versatility of the system. Hence, the responsible administration has been forced to carry out reforms in the system aimed at influencing the price and avoiding the excess of rights. But, until the effects of these reforms are effective, what we must take into account is what has been achieved by the EU-ETS up to now and it is unquestionably its importance as an international market institution intended to persist over time. Analysing the effectiveness that the market has had to date with tools other than price will occupy the following sections.
4. Methodology
This section presents the methodology used to determine the relationship between CO2 emissions GDP level and the ETS. In particular, we present the effects of GDP per capita and the different phases of ETS on CO2 emissions per capita. In addition, since the trade is combined with other policies aimed at achieving a more sustainable energy mix, the model also explains the effects that the use of renewable energies has on CO2 emissions.
According to the literature on environmental economics [
60,
61], the empirical relationship between income and emissions can be based on a general model of the following type:
where
GHGi,t are CO
2 emissions per capita, the subscript “
i” points to the country, “
t” indicates the moment of time;
β represents the relative importance of the exogenous variables;
GDP is real production per capita, the variable
G allows incorporating other elements of influence on the environmental pressure, and the binary variable
Z is a proxy variable that represents regulatory changes. This relationship is completed with a constant,
γ, which includes other exogenous effects not included in the rest of the variables, and
u which is the error term, normally distributed. Thus, the previous expression allows for the classification of the relationship between the environment and the level of production, the behaviours induced by incorporating other variables and the institutional innovation that may directly affect environmental quality.
In particular, in this paper we consider whether emissions trading, as a quantitative instrument that limits the supply of rights, has contributed to the reduction of total CO2 emissions. This work belongs to the New Institutional Economy since it considers that the costs of putting that market into operation have already taken place and are therefore sunk costs. They, at this moment, should not be taken into account.
In this line of argument and to take into account the regulatory effect of trade, following [
19,
62] we use three dummy variables, to independently include each phase of the trade. These variables take value 1 in the years of application of each of the phases and value 0 for the rest of the cases.
We estimate two models to verify whether the emissions trading system, by itself and together with other environmental policy tools, is an adequate instrument to abate polluting emissions. We take the series in logarithms, which allows us to interpret the coefficients in terms of elasticities. The coefficient of each of the independent variables indicates approximately the percentage in which the dependent variable would vary with a 1% variation in the independent variable. We carry out this analysis using panel data. The objective of using this methodology is to capture the unobservable heterogeneity, either between the study agents (in our case countries) or over time, since this heterogeneity cannot be detected either with time series studies or with those of cross-section. This technique allows for a more dynamic analysis by incorporating the temporal dimension of the data, which enriches the study, particularly in periods of great changes.
Considering the above, the equation estimated in model 1 is as follows:
where:
GHGi,t are CO
2 emissions per capita for country “
i” in year “
t”.
GDPi,t is real production per capita for country “
i” in year “
t” and represents the scale of production.
PH are dummy variables which takes the value of 1 in the following periods:
for the test phase (2005–2007),
for the period 2008–2012 and
for the available years of the third phase (2013–2014). We include these three variables as a proxy variable to regulation.
: Coefficients to be estimated. As usual, the equation is completed with a constant,
α, which collects other effects, and the error,
ε.
The parameters of the equation can be interpreted as follows:
β1 is a quantitative indicator that shows the relationship between real per capita GDP growth and the variation of per capita CO2 emissions.
β2, β3 and β4 are coefficients whose sign explains whether the different phases of trade have favoured or not the reduction of emissions. If their value were zero, the different phases of the EU-ETS would have no influence on CO2 emissions. Negative coefficients would mean that the EU-ETS would reduce CO2 emissions. If the modifications carried out in the EU-ETS over time had improved the institution, we could expect that its efficiency would increase. Hence, the absolute value of these coefficients should be greater in each of the phases.
Although the EU-ETS has been the key piece of EU climate policy, it has not been the only instrument. In fact, at this moment, the EU’s comprehensive climate policy is “20-20-20 by 2020” [
63], which refers to the three 2020 targets: a 20% reduction in GHG emissions from 1990 levels, 20% of total energy consumption from renewable energy and a 20% improvement in energy efficiency. Member States have adopted different measures to achieve the objectives of renewable energy use and energy efficiency. In particular, Spain and Germany have provided important incentives for the electric generation from renewable sources. In fact, in 2014 the generation of electricity from wind and solar energy accounted for 24% and 16% of total generation in Spain and Germany, respectively [
64]. These measures taken by the Member States at the same time as the functioning of the emission trade may affect the effective performance of the system [
8]. The promotion of renewables favours the reduction of emissions; what is not clear is the effect it will have on the price of the right, and, consequently, it calls into question the efficiency of the ETS.
Then the question arises as to whether the implementation of these climate policy measures eliminates the possible regulatory effect of the emissions trade system. We present a new model to study the above question. The equation estimated in model 2 is as follows:
where:
: It is the weight of the production of renewables energies (green energy) on the total electric energy produced in country
i in year
t. It includes hydro, geothermal, solar PV, thermal solar, wind and tide. They contribute to lower CO
2 emissions per capita because they are clean energies.
The coefficient β5 is a quantitative indicator that shows the relationship between the growth of the proportion of renewable energies in electricity production and the variation of CO2 emissions per capita. If, as expected, its value is negative, it indicates an inverse relationship: greater use of renewable energy leads to lower emissions.
In the end, it is a question of verifying whether the commitment to a tool such as the emissions trading is effective and should be maintained in the long term together with complementary or overlapping climate policies.
5. Source of Data and Statistics
The statistical information of the variables considered for EU-28 is presented in
Table 1.
The values of standard deviation of total GDP, CO2 emissions and electric generation show the great variations between the maximum and minimum values of these variables.
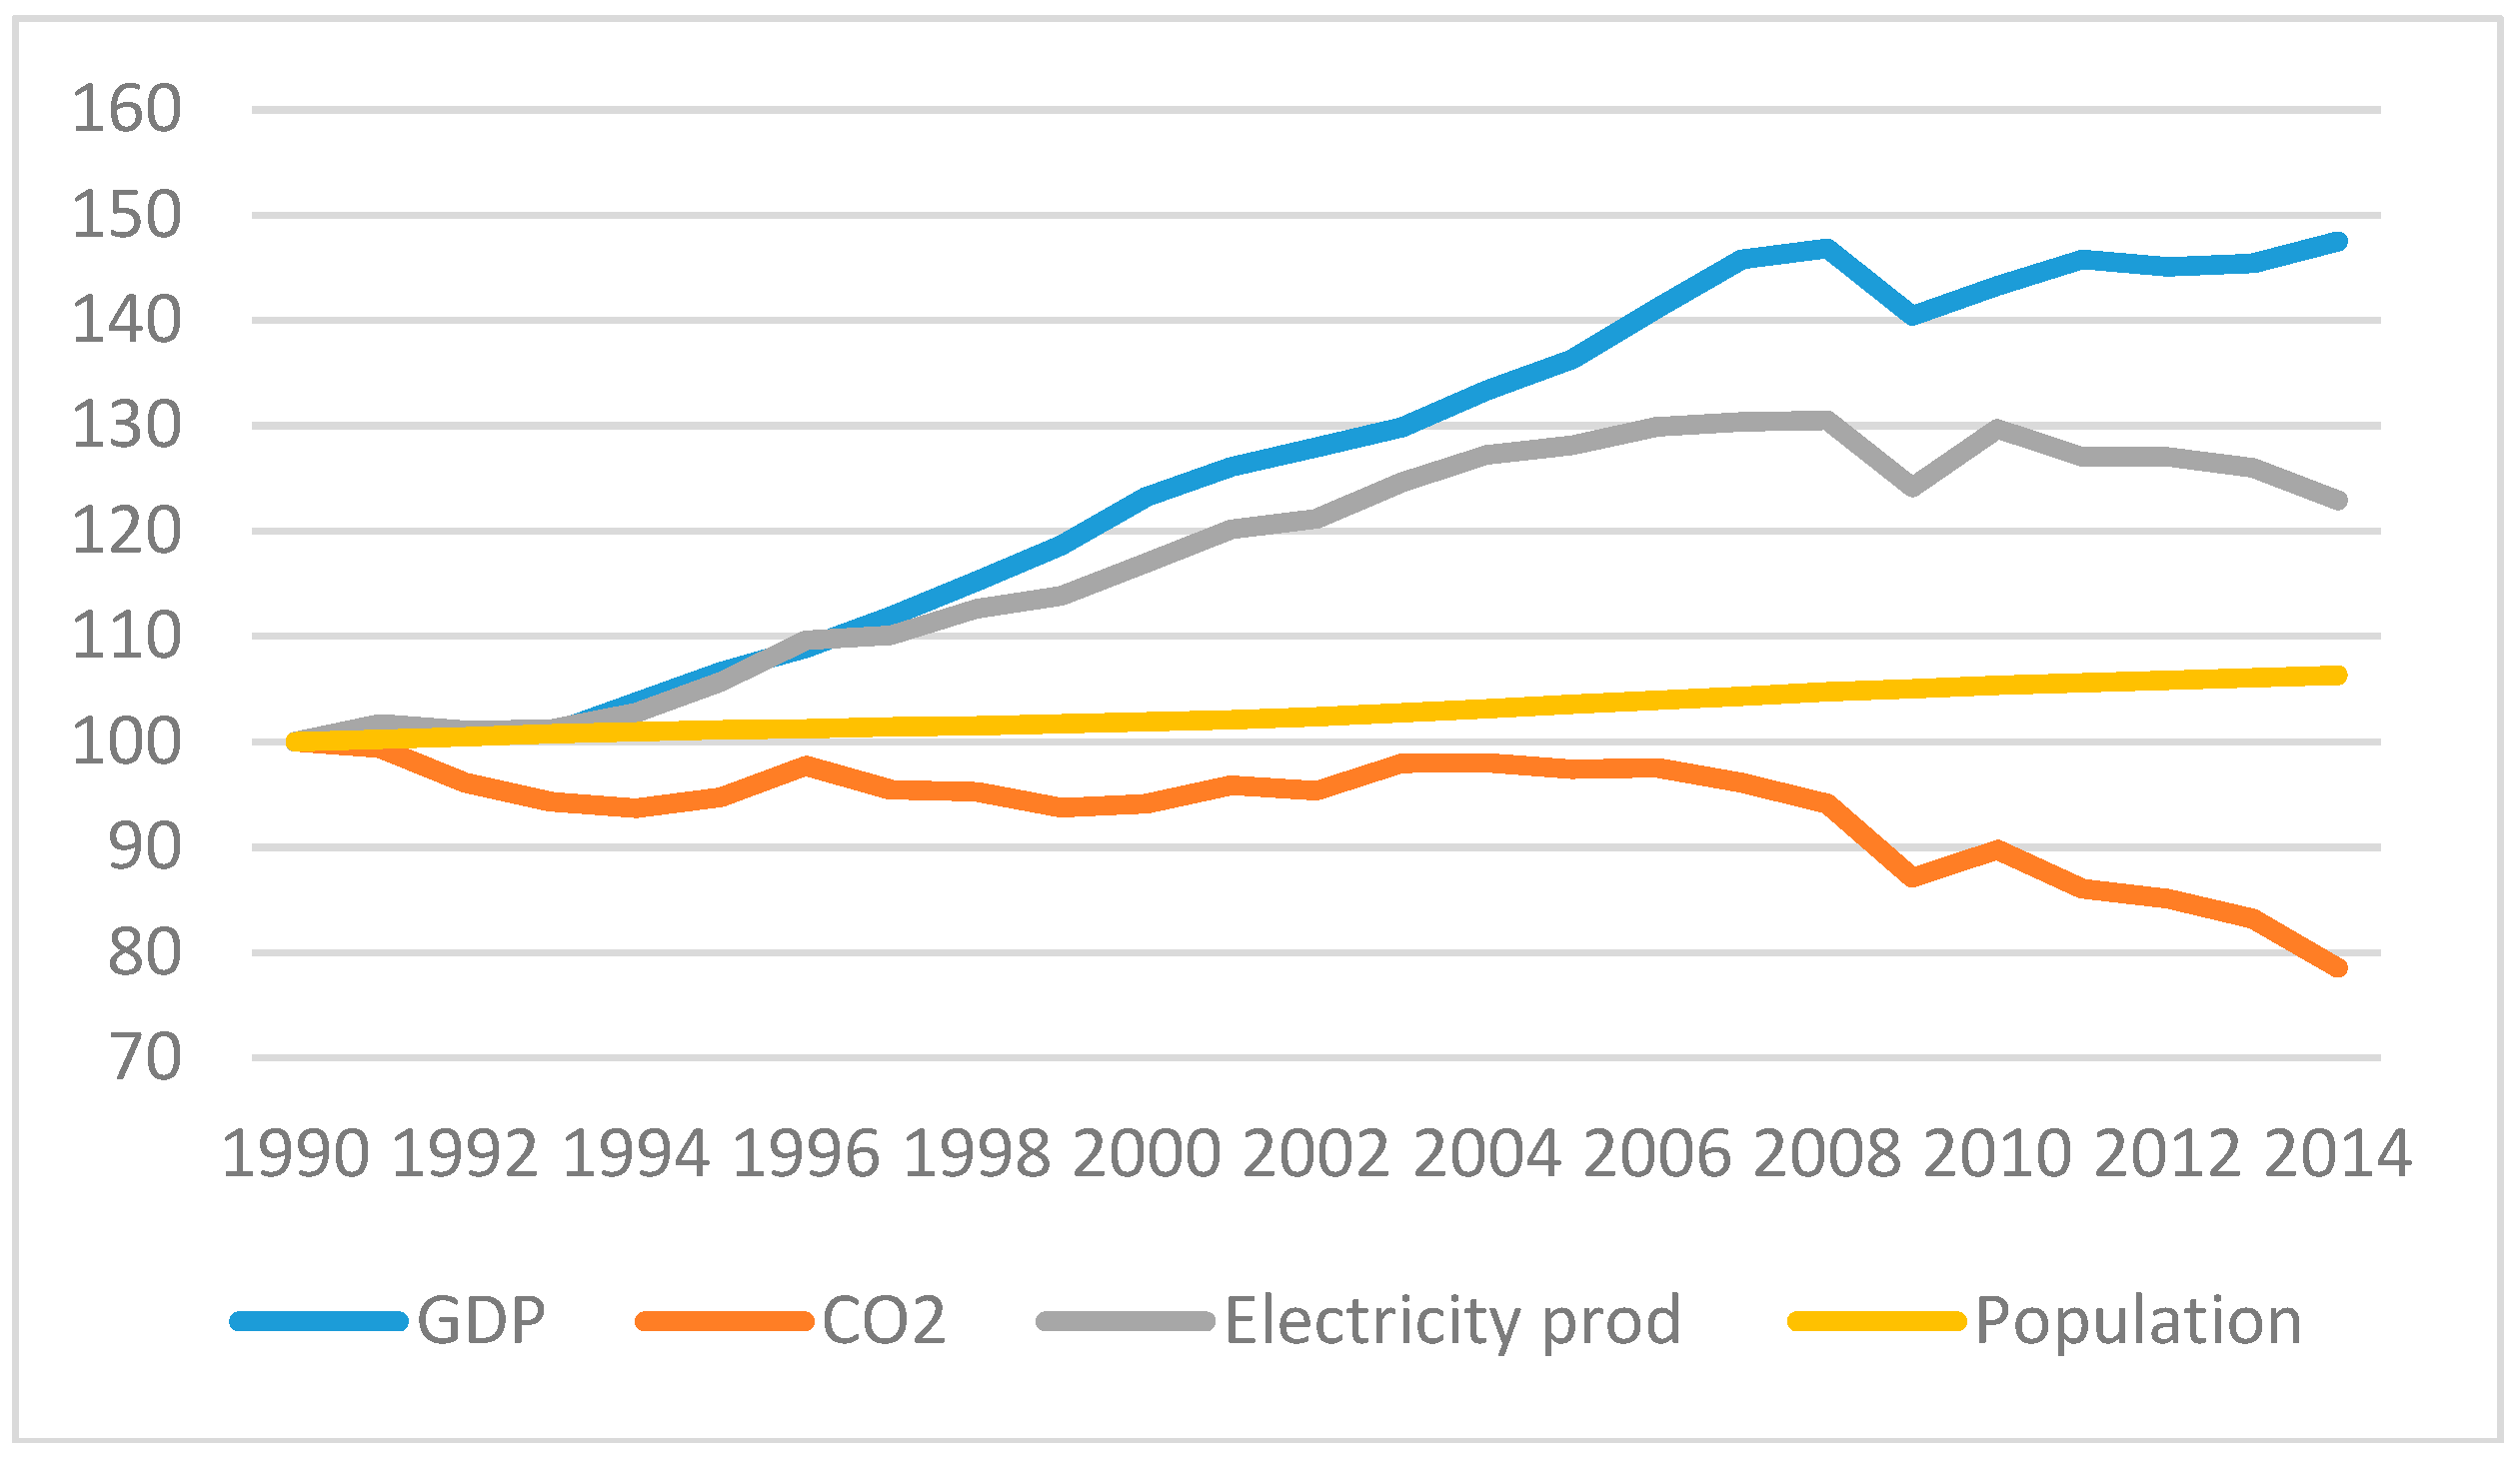
In order to present an overview of the data collected in
Table 1, as well as its evolution, these variables are represented in
Figure 1 considering 1990 as the base year, that is, with a value of 100.
Figure 1 shows the reduction of CO
2 emissions in particular as of 2005, the year in which European emission trading started to operate. You can see that the variables (except that of population) evolve in parallel, reflecting the same exogenous shocks (2008–2012) when the effects of the economic recession caused decreases in all three variables. As of 2012, GDP starts to grow while electricity production and emissions decrease, evidencing the decoupling between GDP and CO
2 emissions.
The evolution of the variable for population in Europe shows a stable trend with a slight growth since 2002. In aggregate terms, the population average annual growth of rate between 1990 and 2014 is 0.26. This growth is accompanied by reductions in total emissions, possibly due to the combination of two circumstances: at the microeconomic level, the region’s higher level of income and development allows its inhabitants to care about the environment, at a macroeconomic level, through the policy decisions aimed at achieving emissions abatement.
In relation to the electricity production, the electric sector was the most affected by the reductions in emissions (i.e., suffered the highest requirements) since the beginning of the ETS. Among the reasons for choosing this sector are: (1) electricity production is one of the largest sources of pollution, (2) emissions are concentrated in a relatively small number of production units (compared to other more widely distributed sectors), which facilitates control and verification of emissions and, (3) is a relatively isolated sector of international competition [
68,
69].
Additionally, the EU implemented large packages of environmental protection measures focused on boosting the production of electricity from renewable sources. These measures are aimed at achieving 20% of EU energy from renewable sources by 2020 (European 20-20-20 Targets) [
63]. For these reasons, it seems coherent to consider in the analysis the production of electrical energy from renewable sources. The inclusion of this variable shows the role of the energy mix when explaining the evolution of CO
2 emissions in the period analysed.
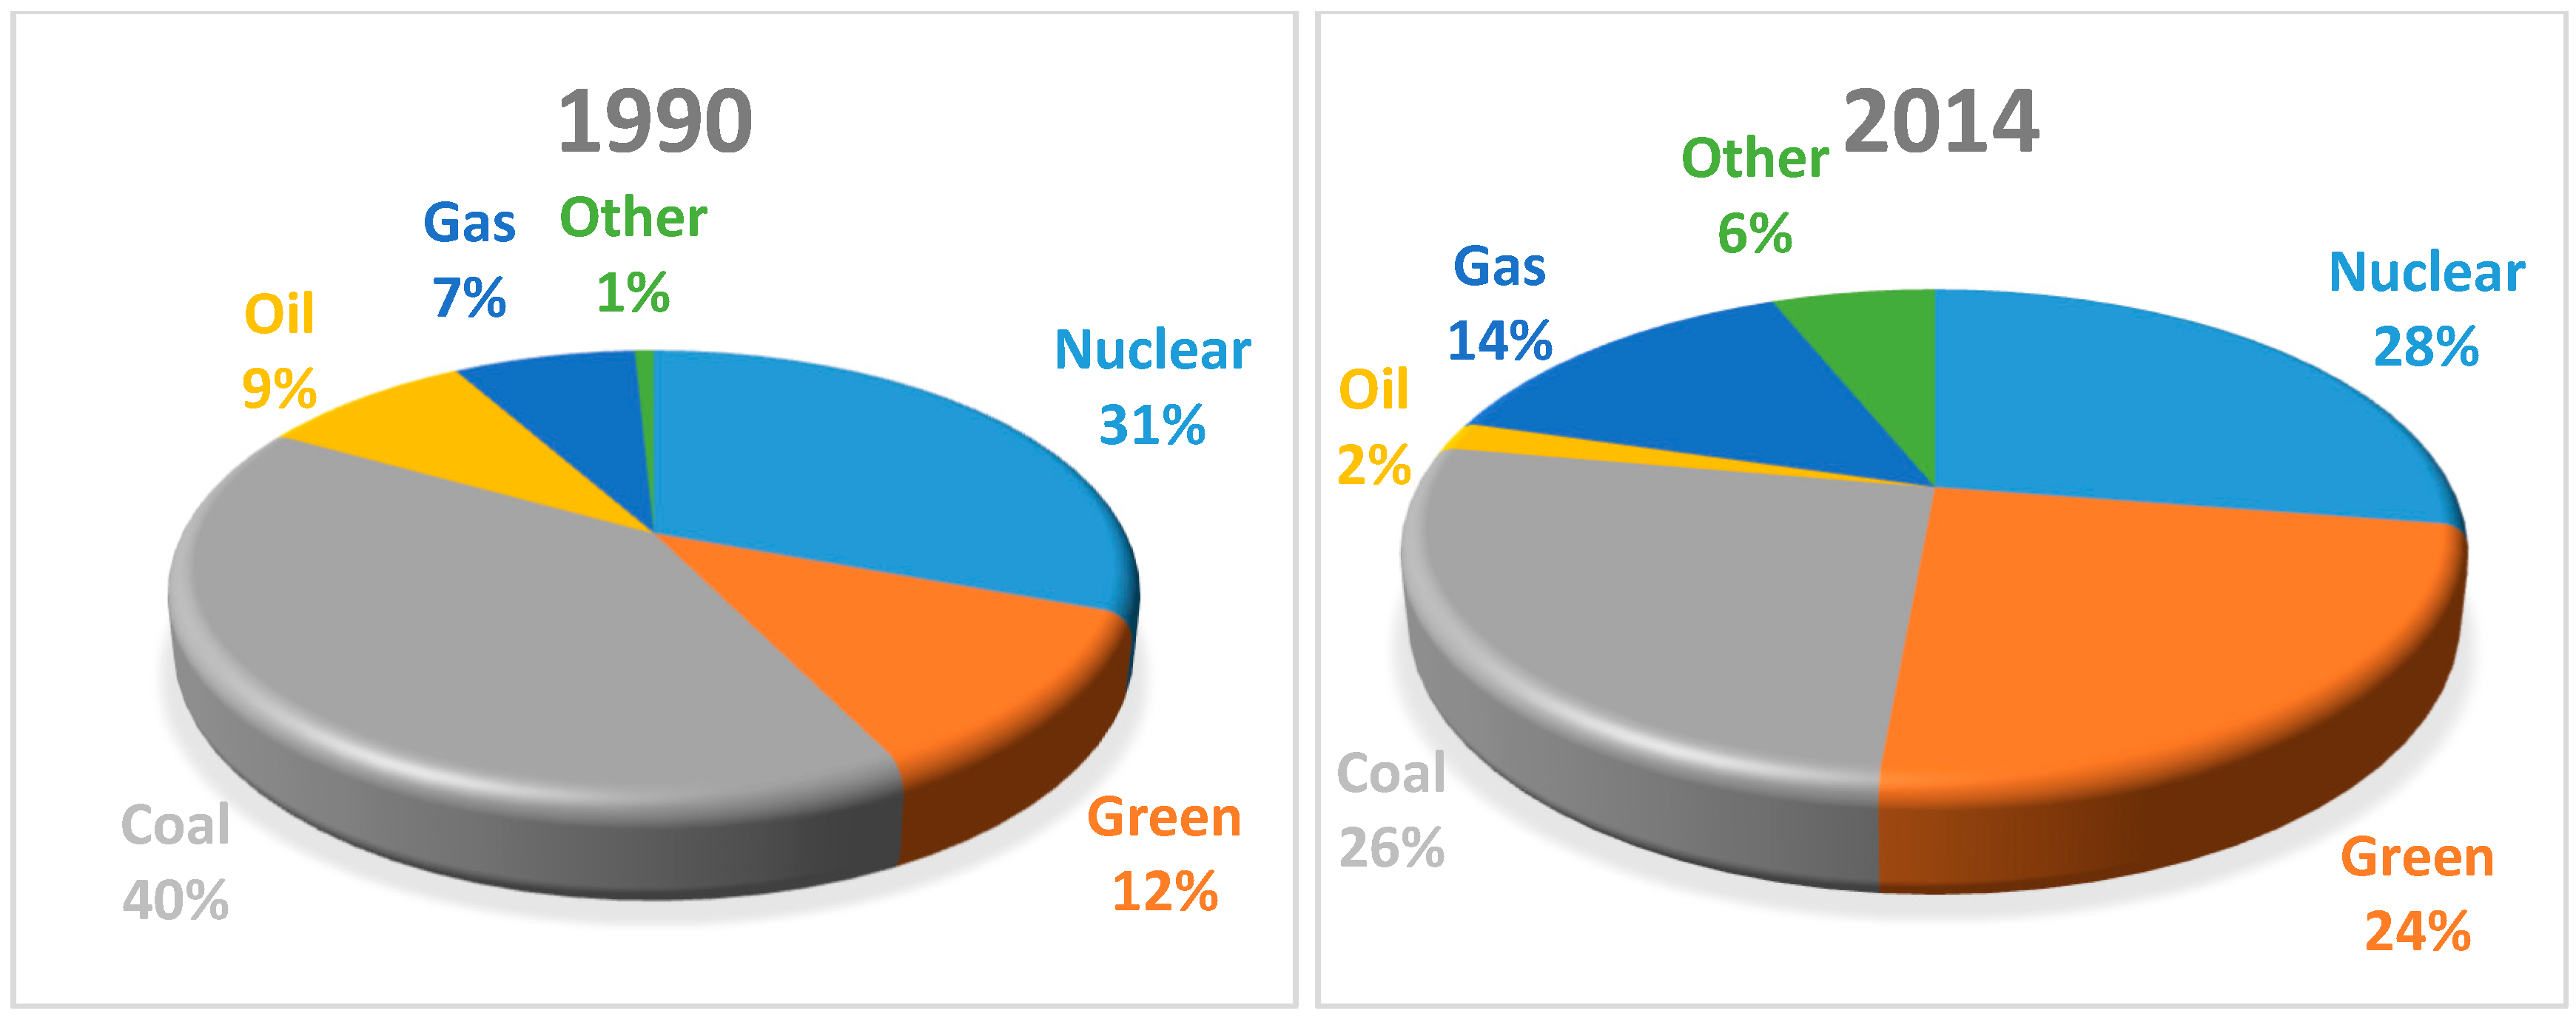
The
Figure 2 shows the change in the energy mix that has taken place in the EU. It presents the share of each energy source in the total electricity production of the region in 1990 and 2014. It shows the EU’s commitment to less polluting energy sources. In 25 years, the contribution of gas and green energies has doubled those of coal and oil.
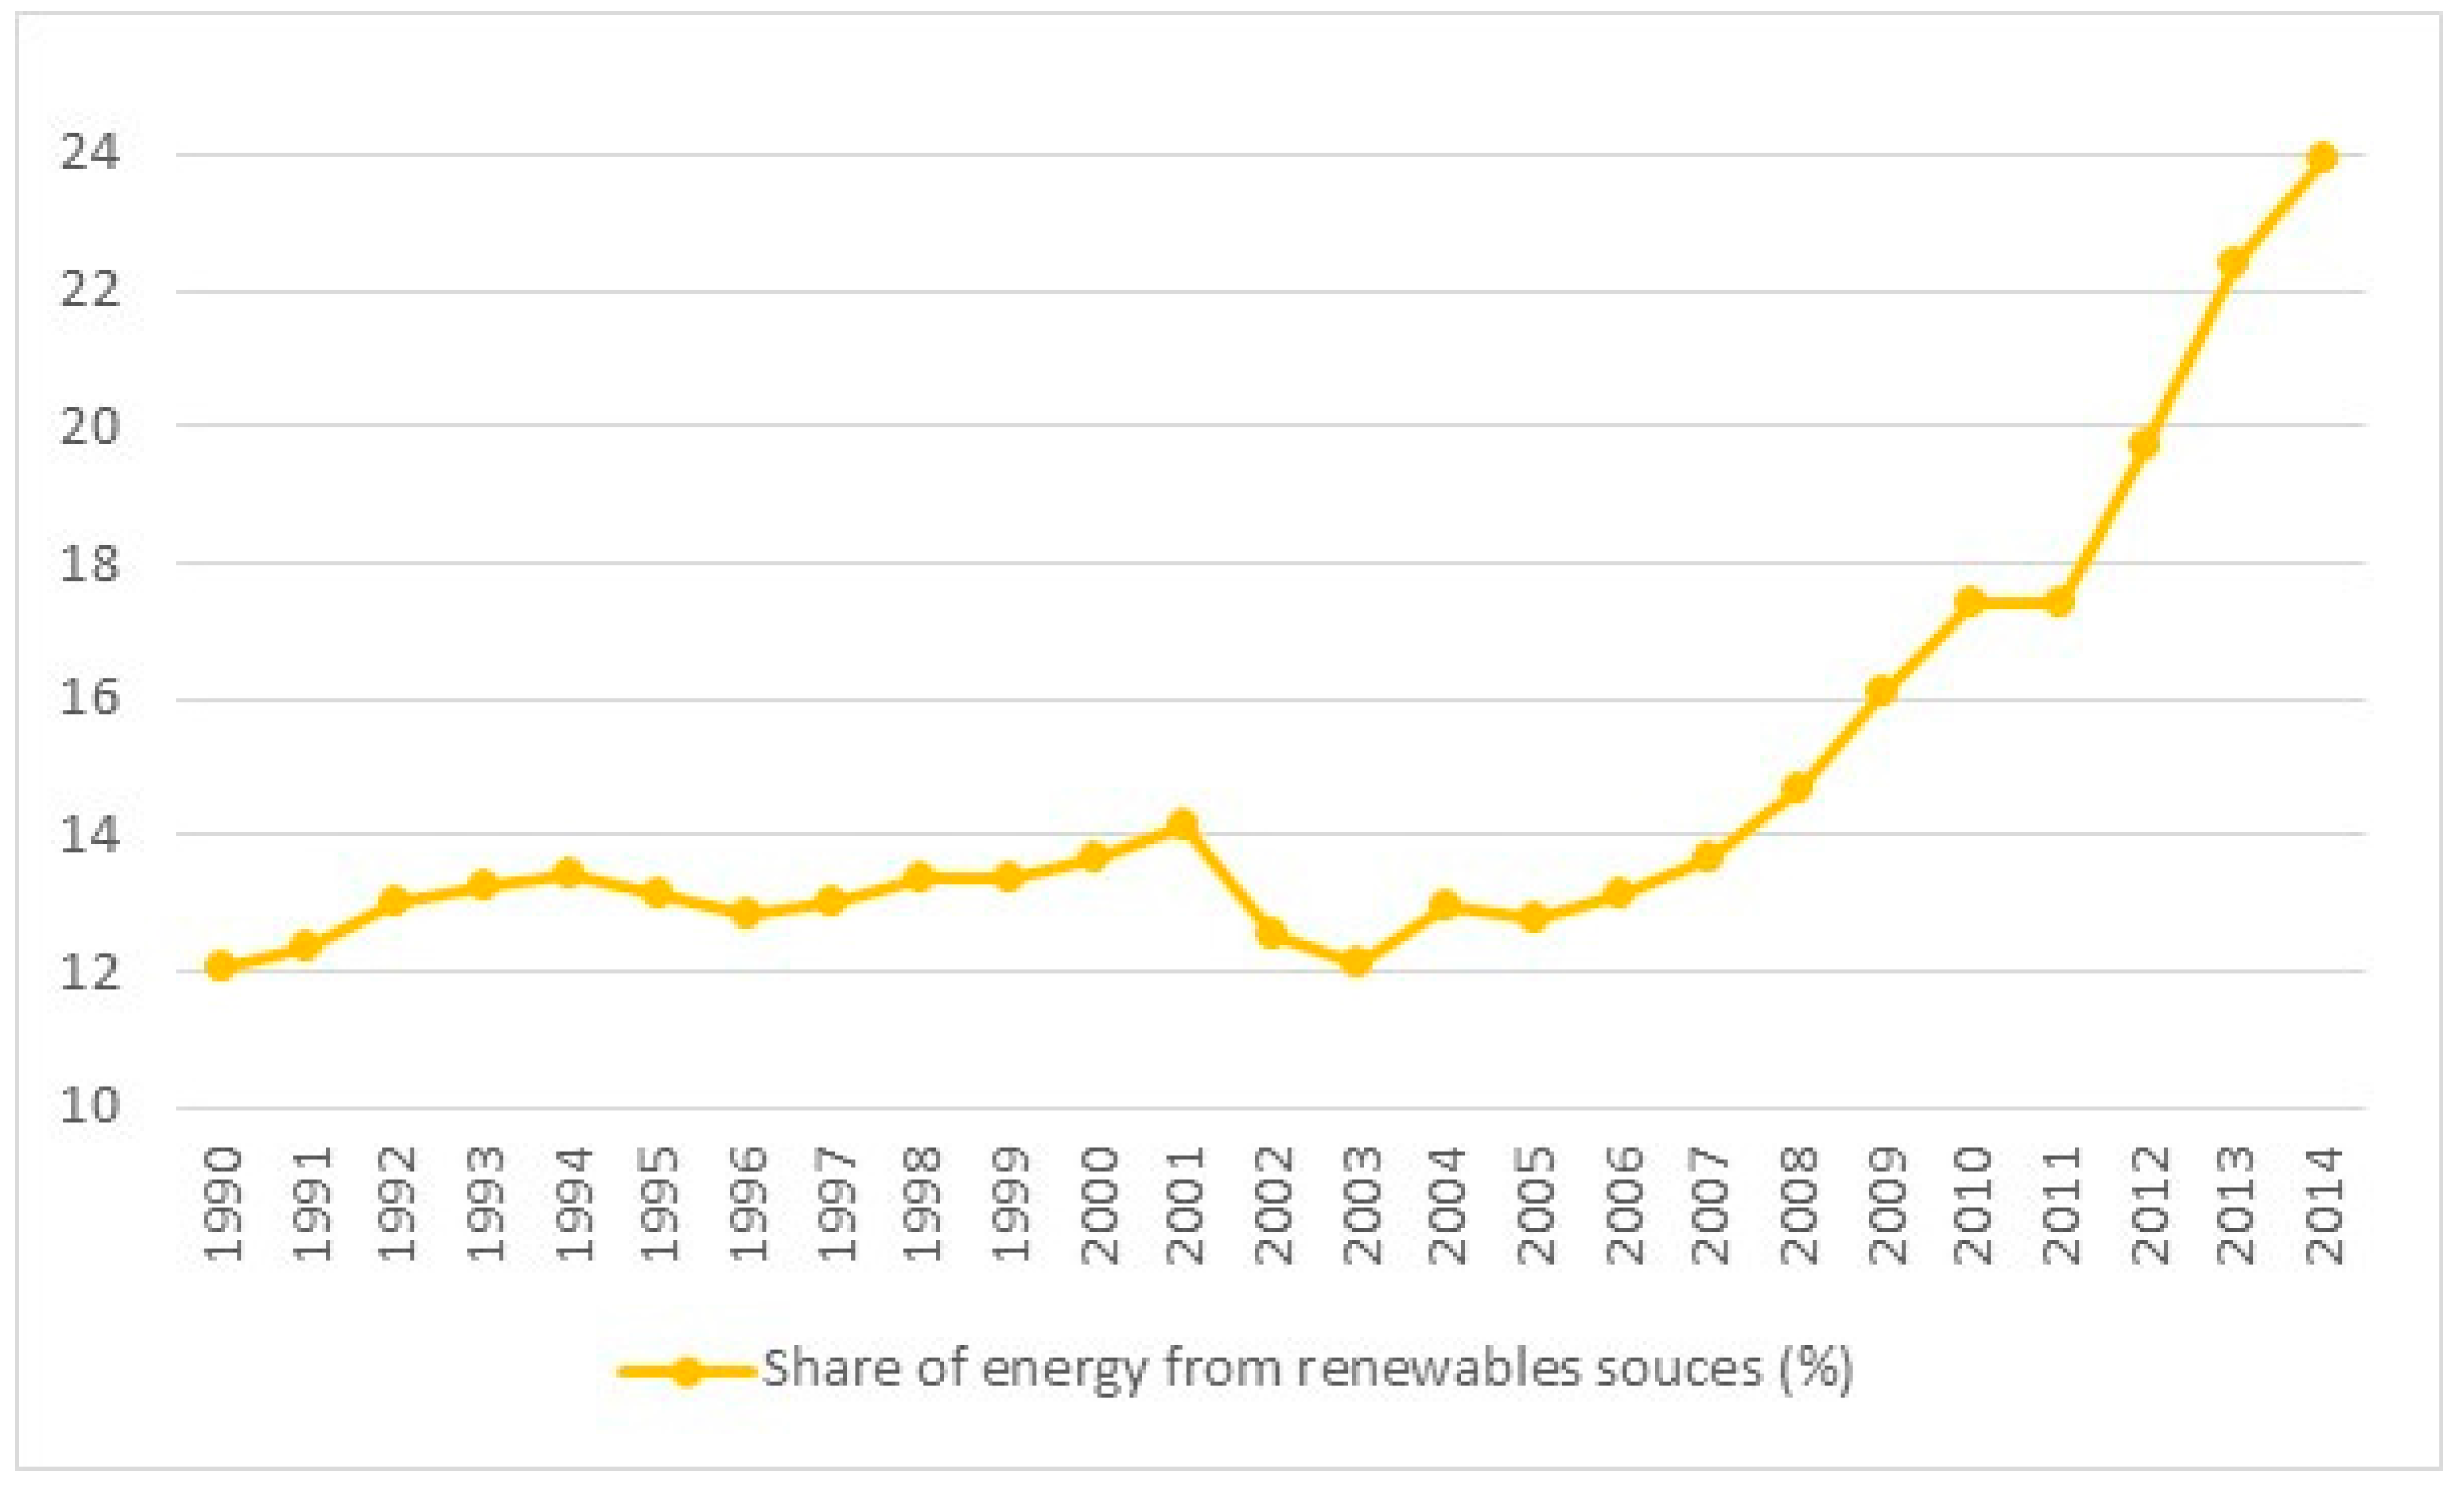
The following
Figure 3 shows the evolution of the share of renewable energy to the production of electricity. There is a clear change of trend as of 2005.
After showing the chosen variables of this analysis and the methodology used, the results obtained are presented below when estimating the two models specified in the previous section.
6. Results
For the realization of the econometric analyse and tests, we have used the Stata statistical software package (StataCorp, Lakeway, Texas, USA).
Model 1 shows the effects on CO2 emissions per capita of the different phases of the European emissions trading system and the GDP per capita. In the model 2, the estimation includes the participation of renewable energy in the electricity production. Then we compare their results.
From the Equation (1), several tests have been applied to improve the estimation of the model. The F test of significance of the fixed effects, F (27, 668) = 17,477 confirms the presence of these effects and indicates that the fixed-effect model is preferable to pooled data.
Also, we have estimated a random effects model. Using the Lagrange multiplier test for random effects developed by Breush and Pagan, we can reject the null hypothesis, the variance of the error is equal to 0, so there are differences between the random effects model and the estimate by ordinary least squares (OLS).
Considering the Hausman test results (value of the chi-square statistic (4) = 13.78 for Equation (1). Value of the chi-square statistic (5) = 21.58 for Equation (2)), we have chosen to use the fixed effects model to estimate Equations (1) and (2). However, the validity of the fixed effects model is limited by the problems of heteroscedasticity, autocorrelation and contemporaneous correlation (
Table 2). To correct these issues we have used a model of Panel Corrected Standard Errors (PCSE) with Fixed Effects. We have also estimated a Feasible Generalized Least Squares model (FGLS) for Equation (1). The results obtained are very similar to those presented in this work with the model of Corrected Standard Errors with Fixed Effects.
Table 3 shows the results of the models. All explanatory variables, in both models, are significant at 99%. We have estimated the same models using total data instead of per capita. The results obtained have been very similar in terms of the expected signs and the relative value of them, which shows that these models can also be used to confirm the effectiveness of trade in the reduction of total emissions.
When analysing the two estimated models, we can observe that coefficient β1 is significant and higher than 0, which confirms the positive relationship, although less than unity, between GDP and CO2 emissions (per capita). This means, on the one hand, that increases in GDP will led to increases in CO2 emissions, remaining the other variables unchanged. On the other hand, that CO2 emissions are not very sensitive to changes in economic activity, since an increase in GDP per capita of 1% leads to increases in emissions per capita of 0.185% in model 1 and 0.221% in model 2, for a period of 25 years. This result addresses a weak decoupling between economic growth and CO2 emissions, although not strong or strict decoupling (in which β1 is less than zero).
Furthermore, the coefficients of the dummy variables, associated to the different phases of EU-ETS are significant and with the expected negative sign (β2 < 0; β3 < 0; β4 < 0). This indicates that the new institution, the market, has had a favourable impact on the conservation of the environment according to the two estimated models. In addition, each phase has been more relevant in the reduction of emissions than the previous one since the associated coefficients increase in absolute value. This could be considered a sign of the market strengthen. This may be due to the conjunction of several factors to which we have referred throughout this work: (a) the trade is considered, to an increasing extent, an institutional innovation in environmental regulation irreversible, (b) economic agents have learned to use it to optimize their decisions, reducing ex-post transaction cost and promoting its use (c) despite the existence of transaction costs associated with the regulatory changes, the modifications introduced have been improving the system and correcting detected errors, and (d) the number of sectors and gases involved have been increasing.
Model 2 includes the participation of renewable energies in the production of electricity. The estimation of this model increases the goodness of fit measured by the R-squared (up to 0.923). The results obtained show that the elasticity of the share of renewable energies in electricity production (β5) is significant, with the expected sign and a figure of −0.065, showing a favourable impact on the environment. It should be noted that the inclusion of this variable does not eliminate the role of the EU-ETS as an instrument to fight climate change. The coefficients maintain the expected signs, although their values are slightly lower than those of model 1 because part of their explanatory power can be picked up by the new variables included in the functional relationship.
As an additional comment, note that the model 2 has also been estimated by adding as an explanatory variable the participation of nuclear energy in electricity production. The coefficient obtained is significant at 90% and with the expected sign (−0.0379). The above indicates that an increase of nuclear energy in electricity production would favour the reduction of emissions. However, it is worth noting that many governments maintain a policy of phasing out nuclear energy (for example, Germany after the Fukushima accident in March 2011). The question to consider, then, is how much of nuclear generation can be replaced by renewable energy. Since nuclear phasing out is likely to cause greater dependence on fossil generation, this could lead to an increase in emissions and in the demand for allowances. As the number of EU-28 countries that do not produce nuclear energy is high, the observations in the estimate are reduced by almost half, which is why this estimation has not been taken into account explicitly in this work.
The results obtained allow us to affirm that EU-ETS has a reducing impact on GHG emissions which increases over time. Moreover, this effect remains, although the EU state implements other climate policy proposals such as the actions on the energy mix. Therefore, the trading of emission rights can be complemented by the governments with other energy and technological measures without its effects being compromised.
7. Conclusions
The European Union has lead the global environmental action since the seventies of the last century, with the EU-ETS playing a central role in climate policy.
After more than ten years of operation, the goal of this work is to evaluate to what extent the EU-ETS as a “regulatory institution” of the supply of rights is responsible for the reduction of emissions, even when overlapping policies are introduced, particularly the support policy to renewable energies.
To do this, we estimate two econometric models for a data panel of the 28 EU countries over a period of 25 years (1990–2014). The models explain CO2 emissions per capita as a function of per capita production and trade, as a regulatory instrument through three dummy variables (one for each phase of trade). Model 2 adds the share of renewable energies in total electricity production as an additional explanatory variable. This incorporation makes it possible to analyse the extent to which the introduction of the renewable energy support policy affects per capita emissions and the effectiveness of emission rights trading in the reduction of polluting emissions. The research carried out has shown the following conclusions:
Firstly, the EU-ETS is an institutional innovation in environmental regulation that is effective in reducing emissions, as the estimated negative coefficients for each stage of trade showed. These results corroborate the idea that the firm implantation of a market is a sign strong enough for agents to modify their behaviour.
Second, each phase had a greater impact on reducing emissions than the previous one, verifying the strengthening of the market. Among other reasons, it is due to:
The number of participants having increased, increasing competition and market liquidity, which is inversely related to transaction costs.
The use of the system allows to become familiar with it, which reduces the transaction costs through the learning process and increases its use.
The own process of operation of the market has made it possible to detect problems. The modification and improvement of the regulations have solved them.
Third, the results obtained confirm that the change in the energy mix, consisting of the substitution of fossil fuels for green energies, contributes to the reduction of polluting emissions. In addition, the estimated coefficients (negative and increasing with the phases) show that the efficiency of the emission rights remains. In other words, despite the overlapping of policies, the EU-ETS fulfils its objective.
Because of its effectiveness and because it is a market tool, other economies, including developing countries, are implementing emissions trading to fight climate change. In this process of implementation, it is important to take into account the lessons that can be drawn from the operation of the EU-ETS, which are multiple and varied.
In particular, it is convenient that every emissions trading system has automatic adjustment tools that improve its operation, which will affect both the transaction costs and the price of the right. Concerning the former, it will avoid the political transaction costs of agreeing on regulatory changes or regulations (savings in time, negotiations, drafting of new rules, entry into force, etc.). In addition, the economic agents that intervene will have clear signals and rules of the response of the system, which will allow them to make investments and operations with the lowest possible level of uncertainty. Regarding the prices of the right, it would be desirable to avoid a very low price, which does not contribute to the effectiveness of the rule, and also an excessively high price, which could hinder the mitigation of emissions and the economic activity. The emission rights trade should adapt more quickly any exogenous disturbance, especially to economic cycles.
The implementation of emissions trading in other economies offers the opportunity for interconnection between different trading systems. This will allow achieving significant emission reductions in a more efficient way. A global system could lead to price convergence, reduce market volatility, avoid distortions of competition and increase the sources of emissions subject to trade.
Finally, it is important to take into account the EU-ETS achievements: the creation of the necessary regulations for its implementation, its successful adoption by economic agents; its expansion geographically as well as to other sectors and gases; and its capacity to reduce emissions. The market has been installed and the EU will not abandon the system. Nevertheless, it must become a more flexible instrument capable of creating constant shortages of allowances guaranteeing that its price would remain a permanent feature of the European economic scenery. The EU-ETS seems to be here to stay.

 ,
, 

