Determinants and Characteristics of Korean Companies’ Carbon Management under the Carbon Pricing Scheme

Institute for Global Environmental Strategies (IGES), Hayama 240-0115, Japan
Energies 2018, 11(4), 966; https://doi.org/10.3390/en11040966
Submission received: 1 March 2018
/
Revised: 5 April 2018
/
Accepted: 8 April 2018
/
Published: 18 April 2018
(This article belongs to the Special Issue Lessons from the Evaluation of Existing Emission Trading Schemes)
Abstract
:In response to the domestic emission trading scheme, Korean companies are required to shift their strategies from voluntary or regulation-driven management approaches to innovative carbon management utilizing their carbon option linked with economic value. Using a questionnaire survey targeting companies subjected to the emission trading scheme, this study explores the status of Korean companies’ carbon management in a series of five strategies and identifies the correlation between companies’ proactive carbon strategies and pre-listed determinant factors. This study found that Korean companies’ practices in accordance with carbon pricing deviate little from conventional energy and environmental management in this phase. They are likely to be affected by the need to appear socially responsible or to make a social contribution, without having to exceed this mandate in terms activities outside of this remit. Yet, only a small proportion of companies have advanced to the stage of proactive carbon management. For them, top managers’ support and understanding are essential factors together with government pressure to factor-in issues related to carbon with their business strategies. This study provides implications for policy and corporate in promoting carbon-oriented management under the carbon policy.
1. Introduction
Greenhouse gas (GHG) emission trading schemes (ETSs) using market mechanisms have been focused on as a key measure for addressing climate change and the need to reduce GHG emissions in the sense of using the cheapest options currently available and steering innovation and investment towards lower-carbon technologies.
Industrial companies, due to their consumption of large amounts of energy and materials in their processing flows, are necessarily accountable for their GHG emissions. This, as well as their ability to technologically innovate, places them at the forefront of efforts aimed at tackling climate change [1]. The carbon strategies and carbon management practices found in such business circles are thus of paramount importance.
Carbon management, in the broader sense, actually refers to management of pollutants, and in turn environmental management. However, based on the fact that carbon is not only a pollutant but also has asset value under carbon pricing policy, which can be utilized to optimize a company’s management of GHG, the carbon strategy as used by a company should be made distinct and separate from the present form of environment management, and refer more specifically to a systematic plan of action rolled out over a company’s entire business operations based on its own capabilities or through proactive carbon management.
Several studies on corporate carbon management have been made, which cover definitions thereof [2]; carbon strategies and management practices [3,4,5,6]; carbon disclosure and accounting [7,8,9]; drivers and challenges [5,10,11,12]; stakeholder pressures [1,13,14]; outputs of low-carbon operations on economic performance [10,15]; and GHG emissions [16] and energy efficiency [17].
In 2015, Korea became the first country in northeast Asia to initiate domestic nationwide ETS (K-ETS) and currently implements the world’s second largest nationwide carbon market as of 2018. Its compliance period, the scheme’s first phase, has now ended (2015–2017), and through K-ETS as a key measure, 70% of national GHG emissions are now covered, through which Korea’s government anticipates realizing its national GHG mitigation goal by 2030, as pledged in its Nationally Determined Contributions (NDC), and transforming its economy into a green one.
Under these circumstances, industry, the major GHG emitter in Korea, is required to shift its strategy and focus from a voluntary or regulation-driven management approach to innovative carbon management that complies with the transition in policy, as well as increase its competitiveness, in order to combat climate change. With the advent of the forthcoming phase—the introduction of auction—further steps towards proactive carbon management in response to carbon pricing and market trading are anticipated. Meanwhile, experiences on the part of industry in the initial stages of K-ETS are believed to act as a good point of reference and be increasingly relevant during the introduction of carbon pricing throughout many national and sub-national jurisdictions.
However, there is a surprising lack of contemporary studies in these fields [2,18,19]. Further, studies on the case of Korea have generally discussed company energy savings as well as the GHG mitigation activities and determinants that influence such strategies. Notwithstanding these findings, less empirical attention has been paid to the study of monetary value of carbon and related corporate activities.
With the aim of expanding on previous studies in terms of substantiating the corporates’ carbon strategy distinguished from conventional energy and environmental management, this study demonstrates the measures involved in Korean carbon management at the company level through consideration of the features of K-ETS in two areas: providing an overview of the state of Korean companies’ carbon management, and categorizing the strategic stages and related activities in each strategy of carbon management. It also discusses, through regression analysis based on an analytical framework set up in this study, the factors determining proactive carbon management at the company level. It uses data collected from an original questionnaire survey formulated for individual companies and an analytical framework designed in this study.
Gill and Dolan (2015) [20] provides definitions of originality of a research some of which are quoted here to validate the originality of this study such as new information and additional knowledge on the Korean corporate carbon management, original techniques and observations using firm-level date collected an original questionnaire survey implementing in Korea, and adding to previously original works studying Korean companies’ energy saving and GHG mitigation [18]. The remainder of this paper is structured as follows: Section 2 provides a literature review of carbon management. Section 3 explains the research method and materials, including the analytical framework, models for analysis, and questionnaire survey and samples used in the study. Section 4 presents and discusses the research results. Section 5 summarizes the research findings.
2. Corporate Carbon Management
2.1. Environmental Management and Carbon Management
In line with the increased emphasis on the ‘Polluter Pays’ principle, which argues that business pollution is due to the inefficient use of resources [21], the government drew up environmental legislation and bolstered policy implementation over wide fields, which required environmental problems and concerns to be incorporated into business strategies. This environmental policy formally laid down in law a company’s commitments to environmental management as well as reductions in waste and pollution, reductions in energy and resource use, the setting of objectives and targets, and reviews of company environmental performance [22].
Meanwhile, besides responding to regulations and increasing demands from various stakeholders and society at large concerning the environmental performance of their products and processes, some leading companies have begun to regard environmental management as a strategic tool for gaining competitive advantage [23], i.e., in the form of so-called Corporate Social Responsibility (CSR).
However, fundamentally, companies see financial returns from the adoption of environment management in the form of cost savings, risk aversion and reduced business interruptions [24]. If the economic benefits of environmental management are not guaranteed, companies will not be willing to invest in it [25], as the core motivation underpinning its adoption is economic benefit [26]. Part of the problem lay in the fact that environmental activities were conventionally viewed as merely part of existing energy and environmental management and were not considered high priority in terms of company business strategy [27].
This context is perceived as the reason for conventional environmental management not managing to penetrate all the spheres of corporate management, i.e., production, distribution, procurement, supply chain management, innovation, communication, and marketing, which is why the subject of carbon management needs to be distinguished from environmental management and dealt with separately.
Henceforth, companies are now being required to incorporate carbon management into their overall strategy amidst the broad but converging requirements under a policy transition as well as growing awareness of financial consequences of the longer term, as a result of the carbon market placing a price on what until very recently came for free [7].
Some studies differentiate carbon management from environment management [28]. As [2] summarized, various terms are used to express such carbon strategies and management practices, such as CO2 strategies, carbon performance and carbon management practices.
Carbon management partially overlaps with energy saving and GHG reduction activities in terms of pollutant reduction, since GHG emissions are closely related to the consumption of energy, thus measures related to energy efficiency and energy saving management taken by companies to rationalize energy use and minimize pollutants are regarded as the preliminary strategy to mitigating GHG. Going forward, by applying the concept of carbon assets, the remit of carbon management now needs to be extended to include the value of carbon. The cost of doing business today should also include having to pay for carbon emissions as a commodity in the market, therefore carbon management needs to be considered in its own right, and accordingly, granted more attention and coverage, including through use of carbon pricing and carbon markets, such that companies have to rely on their cost effectiveness by maximizing their incentives in abating CO2 emissions. In other words, companies need to integrate their sustainability goals across entire business platforms rather than cloistering such strategies in isolated departments [29].
In this study, the term ‘proactive carbon management’ refers to the implementation of business strategies that utilize a company’s carbon assets, as well as linking the economic (monetary) value with potentially radical activities.
2.2. Strategic Approaches to Carbon Management
To date, many studies have been made on the various aspects of corporate carbon management, and below is a summary of relatively recent literature on the subject.
In general, the framework used for analyzing a company’s carbon management and its influencing factors is based on institutional theory [3,30] and stakeholder theory [13]. Carbon strategies and management practices have been clarified [31], some focusing on small and medium size companies [6] or large companies [4]; some focusing on CO2 reduction strategies [5,32]; governance practices [3]; and others on environmental and carbon information disclosure [33]. The development of reporting mechanisms for GHG is related to a company’s accounting system, since a numerical approach helps firms disclose more credible information. In this connection, Stechemesser and Guenther (2012) [8] provided a systematic literature review of carbon accounting, while Evangelinos et al., (2015) [9] studied accounting methods used; Schaltegger and Csutora (2012) [34] studies applications and methods; and Bebbington and Larrinaga-González (2008) [7] studies problems with the valuation of pollution allowances and their identification as assets.
Some studies have contributed to the outcome of low-carbon operations on economic performance [10], the impact of corporate carbon management practices on corporate GHG emissions [16], significant and steady improvements in energy efficiency [17], and the benefits of environmental management accumulate over time [35].
There are several drivers and determinants of corporate carbon management: regional affiliations [5], company size [5,10,36], absolute amount of CO2 emissions [5], industries across different sectors [11], energy prices [12], stakeholder pressures [1,13], governmental pressures through regulations [37], competitors’ performance in carbon management [10] and the role of top management [38].
Another offshoot on this topic is the diagnosis and classification of company carbon management (Table 1), which most studies approach through use of a methodology for determining company behaviors in conventional energy and environmental management.
In this regard the OECD overviewed corporate environmental management practices and defined them as comprising three steps: first, a corporation forms a framework of basic principles and norms of environmental management; second, it takes control over the environmental impacts of its operations; and third, it commits to environmental performance reporting [39]. Green business literature makes a distinction between companies that are mainly compliance-driven, in which they merely aim to meet legal requirements, and those that adopt more proactive environmental strategies [40], such practices being defined as intangible managerial innovations and routines that require organizational commitments towards improving the natural environmental and which are not required by law [41]. To reach the proactive level, previous studies noted that several further stages are involved: five stage (resistance, observe & comply, accommodate, seize & preempt, and transcend) and 10 strategies (ostrich, resistant, why mes, indifference, thinkers, offensive, defensive, compliance-plus, and innovative) [42]; passive attention to legislation, to stakeholders and to total environmental quality (the highest level of proactivity) [43]; and adoption of reactive, defensive, accommodative and proactive strategies [44]. This linear classification is based on the assumption that a firm generally improves its environmental performance and takes steps towards the higher goal of environmental excellence.
On the other hand, several studies have conducted cluster analyses of the types of adaptation behaviour related to the environment or carbon management. Lee (2012) [2] conducted a cluster analysis of 241 Korean companies and indicated six types of corporate carbon strategy: Wait-and see observer, Cautious reducer, Product enhancer, All-round enhancer, Emergent explorer, and All-round explorer. Based on an empirical analysis, Gasbarro and Pinkse (2016) [45] derived four types of adaptation strategy related to climate-induced physical change corresponding to different degrees of awareness and vulnerability. Abreu et al. (2017) [30] showed that companies undertake one of four different strategies, ranging from a minimalist approach to becoming a regulation shaper, pressure manager or greenhouse gas emission avoider.
3. Research Method and Materials
3.1. Theories for Analysis
3.1.1. Analytical Framework
As analyzed in Section 2.2, businesses become motivated to pursue carbon management based on different factors. Institutional theory provides an explanation for institutional decisions and activities. In these theories, organizations are influenced by coercive institutions (e.g., legislation or regulation), normative-type institutions (i.e., socially acceptable values and norms), and cognitive institutions (e.g., mimicry for competitive reasons) [30]. Meanwhile, for the organizational management, rigid requirements from key stakeholders are the most pressing issue in deciding the business direction [13]. Adopting and modifying institutional theory and stakeholder theory, a theoretical framework was constructed that includes internal, external and control variables, as depicted in Figure 1.
This model states the importance of external pressures from government, competition, stakeholders, and energy price as recognized for enhancing a company’s carbon management. The adoption of carbon management activities initiates many changes within a company, therefore attitudes within the company towards these activities may vary depending on its internal makeup as well as individual interpretations of the objective external pressures. Therefore, internal factors—top manager’s policy understanding and support, the technology level of each company possesses, and company’s internal carbon pricing—were added to the model.
Companies’ internal carbon pricing is defined as a value that companies voluntarily set for themselves in order to internalize the economic cost of their GHG emissions in response to climate risk and climate change policy, such as carbon pricing [46]. Companies incorporate assumptions of carbon price into their business decisions, into emissions across the value chain, and into operational as well as capital spending [47]. Some use carbon pricing to test and assess the profitability of projects under different scenarios in order to make better decisions to ‘future-proof’ their business, and also bring innovative ideas to the table on how to best allocate capital to deliver higher returns in a low-carbon economy [48]. Thus, this study assumed that the level of internal carbon value in a company influenced its strategy of carbon management.
Companies of different industries and sizes may react differently to climate change issues. To analyze the differences in proactive carbon management of companies with various characteristics, the control variables of company size, sector belongings and type of product produced were selected in this study. The variables described in details and reference in Table 2.
3.1.2. Strategic STAGEs of Carbon Management
With reference to the previous studies, this study uses cluster analyses of company activity and set up five strategic stages of carbon management, as depicted in Figure 2. It assumed that each strategic step does not necessarily follow in sequence but is in fact involved in more complex interactions, with one step being more advanced than another.
Passive strategy STAGE 1 is the basic level at which companies may recognize or become aware of the necessity of energy management, which is limited to energy saving and management. Such companies may start collecting information and focus on internal operations to reduce energy consumption and waste, starting with the basics of educating employees on the importance of related issues, such as training in policy via in-house seminars and training, daily energy saving activities, as well as taking part in government organized training.
Reactive strategy STAGE 2 involves measuring an organization’s energy and carbon footprint and implementing an emission reduction strategy based on international standards. Companies at this stage may set up inventory GHG emissions to establish baseline footprints, identify their carbon footprints and saving potentials, short- or long-term targets for energy management as well as consider investments.
The defensive strategy of STAGE 3 is the process level in which companies assess internal opportunities to reduce GHG emissions and respond to governmental regulations by establishing units or departments. Capital investment in high efficiency equipment, alternative energy sources, improved logistics are considered in core business strategies.
In STAGE 4, as defined by the accommodative strategy, companies look for ways to optimize their carbon options from the raw materials stage through to consumption and disposal. They set out a strategy for carbon management in detail, e.g., through plan-do-check-act and implement more innovative carbon management, e.g., by disclosing carbon emissions reports. The rationale of corporate carbon reporting is financial [33] and to distinguish themselves from competitors and gain recognition [49] in [33]. The strategies in this stage are more concerned with stakeholders, investors, and consumers.
The proactive level of STAGE 5 is an additional step aimed at optimizing the trade-offs between cost, time and carbon based on the information amassed and solutions, in order to integrate carbon and financial data to drive financially optimized sustainable business improvements. Through strategy development and implementation that go beyond regulations, companies also identify opportunities with the greatest return on investment.
With reference to the literature review, consultations on the business side and consulting companies, findings and results from our previous studies, as well as expert judgment, the carbon management activities are listed and grouped as STAGE 1, STAGE 2, STAGE 3, STAGE 4 and STAGE 5 as explained in the following Section 3.2.1.1.
3.2. Econometric Approach
3.2.1. Valuation of the Variables
Dependent Variables
For the dependent variables, 20 representative carbon management activities (CMAs) are given in Table 3.
As a company’s extent of carbon management cannot be easily quantified since it does not necessarily equal the sum of carbon management plans and practices, the number of CMAs under implementation was used as a proxy indicating a company’s CMA. Further, since the relative importance of each activity for a company is difficult to score, each carbon management activity is assumed to equally contribute to a company’s total carbon management. A value of ‘1’ is given to an activity if the company has adopted it, otherwise a score of ‘0’ is assigned, thus each CMA obtains a score of ‘1’ or ‘0’, and the sum of the scores for all CMAs is used to indicate a company’s Total CMA, abbreviated as TCMA, in this study. Similarly, the sum of sub-categories of STAGE (1 to 5) is calculated and used as a dependent variable for multivariate regressions to observe respective relationships between different levels of CMAs and the predictive factors.
Independent Variables
The definitions of the independent variables were directly used as-is for the survey items in the questionnaire. A five-point scale was applied to evaluate the valuation of independent variables, the four external pressures, ‘GOVERNMENT’, ‘COMPETITOR’, ‘ENERGY PRICE’, and ‘STAKEHOLDER’, with ‘5’ = very high; ‘4’ = relatively high; ‘3’ = moderate; ‘2’ = relatively low; and ‘1’ = very low. A similar approach was used for the internal factors, ‘TOP MANAGER’S SUPPORT’, and ‘TOP MANAGER’S POLICY UNDERSTANDING’, with ‘5’ = ‘very high’; ‘4’ = ‘high’; ‘3’ = ‘moderate’; ‘2’ = ‘rather low’; and, ‘1’ = ‘low’. ‘TECHNOLOGY LEVEL’, the level of current technology companies possess, was divided into four categories as ‘4’ = ‘globally highly advanced’; ‘3’ = ‘more advanced than the domestic same sector’; ‘2’ = ‘domestic average’; and, ‘1’ = ‘lower than the average of domestic same sector.’ With regard to the internal carbon price level (‘INTERNAL CARBON PRICING’), studies are lacking on quantitative analysis of individual companies’ internal carbon value in Korea, and it is also not easy to obtain information on carbon pricing internalized in a company using a survey due to company reluctance to disclose the data. Therefore, this study uses the market price that a company decides on for the trade of carbon credits considering their marginal carbon reduction cost as a proxy for internal carbon price.
Control Variables
A company’s size, sector membership, and type of production are defined as controls and individually represented by SIZE, SECTOR, and PRODUCTION. For the valuation, the company’s size is divided into four categories: small, medium, large-medium, and large, individually named as SMALL, MEDIUM, LMEDIUM and LARGE. Company sector belongings, SECTOR, are indicated as CEMENT, IRON & STEEL, PETROCHEMICAL, PAPER & PULP, NON_FERROUS, MACHINERY, REFINING, ELECTRONIC and OTHER. Product types are divided into three: raw materials, intermediator and final goods, abbreviated as RAW, INTER and FINAL.
3.2.2. Empirical Models for Econometric Analysis
Quantitative Assessment of Internal Carbon Pricing
For estimation, the multiple-bounded discrete choice (MBDC) is used. The question format prepared for this survey, as well as an example response from a company, is shown in Table 4.
The MBDC format allows respondents to vote on a wide range of referendums and express voting certainty for each referendum, and therefore reinforces the quantity and quality of data [50]. A total of 13 thresholds for the emission allowance price are listed for the companies to indicate their likelihood of making a trading decision. The companies are provided with multiple choice options: ‘⑤ very high’, ‘④ high’, ‘③ moderate’, ‘② low’ and ‘① very low’ possibility.
A total of 13 thresholds for the emission allowance price are listed for the companies to indicate their likelihood of making a trading decision. The companies are provided with multiple choice options: ‘very high’, ‘high’, ‘moderate’, ‘low’ and ‘very low’ possibility.
Given a carbon price threshold of PBij, the probability for a company to buy the allowance will be:
Pij = Pr (Vi > PBij) = 1 − F (PBij)
Once Pij, the probability for company i to buy under the emission allowance price PBij, is known by assigning numerical values to the verbal MBDC answers, Equation (1) can be estimated for each company. Assuming a specific function for F (PBij), such as a normal accumulative distribution with a mean of μi and a standard variance of σi, the estimation model can be written as:
where Pij is the probability for company i to decide to trade, PBij is the threshold of emission allowance price, μi and σi are the mean and standard variance of the distribution, and λi is an error term. Each company’s mean internal carbon price was adopted as a dependent variable in a multivariate regression model to analyze the prelisted determinants and associated factors. The model is expressed as:
where Xi is a vector of associated factors, β is a vector of coefficients to be estimated and δ is the random error. The analytical framework for econometrics analysis, variables taken into account in the analytical framework, and models are introduced in the next section.
Model for Regression Analysis
The regression capturing the relationships between the company’s proactive carbon management and the classified determinants can be constructed as Equation (1), where ε represents the error term and β0 is the constant:
In this study, ordered logistic regression was employed as it is appropriate for ordinal dependent variables, and Stata 10 (StataCorp LLC, College Station, TX, USA) was used for statistical analysis.
3.3. Outline of Questionnaire Survey and Samples
A questionnaire was designed to fulfill this research purpose and consisted of three major components: general information on a company; status of company carbon management; and status of responding to and evaluation of the domestic emissions trading scheme. Data was collected via an emailed questionnaire survey sent to companies in over nine sectors including cement, iron & steel, petrochemicals, paper & pulp, non-ferrous, machinery, refining, electronic and others from January to February 2017. The questionnaire was directed at environmental and energy managers at mid-management level.
One hundred samples were collected and confirmed as valid, which included 16 petrochemical, six cement, 14 iron & steel, 11 paper & pulp, 10 non-ferrous, five machinery, two refining, seven electronics and 29 from other sectors. Of the above, 83 were targets of ETS, with non-ETS accounting for the remainder. In manufacturing, products are bought as raw materials, intermediate goods and finished goods. The shares of sampled companies in each type are 32%, 44% and 22%. According to the company size classification criteria of Korea’s ‘Minor Enterprises Act’, which is based on number of employees only, 35 were medium-sized companies having a staff of 50–300, 23 were small companies with less than 50 staff, and six were large companies with over 1000 staff. The remaining 36 were large medium-sized companies positioned in size between large and medium-sized ones.
The distribution of the samples by company size is summarized in Table 5.
The ETS samples (83 companies) analyzed in this study equate to 21% of the industrial portion (404 companies) of the total ETS subjects (525 entities) in Korea. By industry, the three industry types, i.e., petrochemicals, iron & steel, and paper & pulp in this study 16%, 26%, and 25% of the total number of entities in each sector under K-ETS. Representatives of these samples becomes more significant in terms of the proportion of their share of total CO2 emissions, which represents 42% of the ETS emissions of industries under K-ETS in 2015. The share of GHG emissions of the above three industry types to the total emissions of these industries under K-ETS are 21%, 72%, and 29%, respectively.
4. Results and Discussion
4.1. Korean Companies’ Carbon Management Status
Figure 3 provides a statistical summary of CMAs adopted by the surveyed companies. The reliability of construct of the 20 CMA items was tested by calculating Cronbach’s alpha. The scale coefficient of 0.78 confirmed the reliability of a company’s answers on their CMAs according to the criteria that the alpha should be larger than 0.7 [51].
A large portion of the companies implemented CMAs belonging to STAGE 1 and STAGE 2, but not CMA02 (In-house training program for energy saving and GHG emission reduction). Considering the activities in STAGE 1 and 2 are practices that companies used to perform under conventional environment management, this result is intuitively expected to some extent and also in the line with existing studies [18].
Among STAGE1, CMA01 (Collect information on energy saving and carbon mitigation policies) and CAM03 (Daily energy saving activities in office) are the most adopted CAM items, with a ratio of ‘YES’ answers of 91% and 85%, respectively. Meanwhile, companies display a relatively low frequency of internal training on energy saving (CAM02, 38%), with such training possibly including learning based around the key drivers of climate change, measurement, methodologies, and application and performance management. The reason for the low score of CAM02 is likely because only divisions responsible for such, i.e., Energy Managers, Facility Managers, Environment Managers and Environmental Representatives are involved in this matter. This result is supported by the result of CAM 04, which is related to participating in training programs for energy saving and GHG emission reduction held by the national or local government. The participants from companies are those persons in divisions of such responsibility. The overall average is about 69%. If CAM02 is ignored as an item that did not adequately reflect local circumstances, the average rises to 80%.
The average percentage of practices for CMS in STAGE 2 is 72%. Individually, CMA05 (Targets for energy savings and GHG emission reduction) is practiced by 73% of companies, CMA 06 (Analysis on potential areas for energy savings and emission reduction) by 82% of companies, CMA 07 (Monitoring equipment on energy consumed facilities) by 59% of them and CMA 08 (Daily facility maintenance for energy saving and GHG emission reduction) by 78%. Most of them have set up energy saving and GHG mitigation targets and monitor their energy consumption status and further saving potential. This is likely because most ETS targeted companies used to be subjected by the ‘Target Management Scheme’ (TMS), a mandatory measurement to limit the energy consumptions and GHGs emissions launched in 2011. As TMS required the target entities to establish their inventories of GHG emissions, a necessary basis for the actual implementation of inventory for GHG were implemented in a company in early time [27].
However, the activities in STAGE 2 were not likely to take place for companies’ capital allocation for low carbon investment. Thus moderate participation is scored for CMAs in STAGE 3, with an average of 55%: CMA09 (Internal guidance for energy GHG emission management, 52%), CMA11 (Purchase new production facilities to save energy and reduce GHG emissions, 60%) and CMA12 (investment to improve production process for energy savings and emission reduction, 71%). Yet, ‘established a team specialized for carbon pricing’ (CMA10) is relatively low, at 38%, most likely because most of the companies already have a division for environment and energy and merged the dual responsibilities of climate change and carbon pricing together without establishing a new team.
On the other hand, the participation rate of companies for more innovative and proactive CMS is poor. CMAs in STAGE 4, CMA13 (Optimization in transporting materials and goods, 43%), CMA14 (Energy mix to use more clean energy sources, 38%), CMA15 (Publication of sustainable reports, 21%) and CMA16 (Set up strategic carbon management (plan-do-check-act), 35%) achieved participation ratios in the range of 21–43%. Especially, carbon disclosing is one important factor of carbon performance companies are required to report regularly via publication, but only a few Korean companies, mainly large ones, published the report, which is consistent with the result, and which achieved the lowest score among those in STAGE 4.
Companies’ proactive carbon management categorized in STAGE 5 scored even less, with an average of 28%. The activity CMA20 (Green or carbon management accounting system, 11%) was implemented with the lowest ratio of ‘YES’ answers among activities of STAGE 5. In order to participate in emissions trading in the carbon market, it is a prerequisite for companies to conduct market analysis (CMA 19), set up an internal decision making process for emission trading (CMA 18), and allocate the necessary budget for emission trading (CMA 17). However, each activity has only been implemented in 22%, 36% and 42% of surveyed companies in this study, which explained the stagnant trading results of participation in the carbon market under K-ETS in the first and second compliance year (2015–2016) [52].
Overall, these results imply that the main activities involved in Korean companies’ practices in accordance with carbon pricing policy have not progressed to the next level from that of conventional energy saving and environmental management, and that a company’s response to carbon pricing is based on mere compliance, indicating carbon management has not penetrated into their business cycles, in utilizing carbon assets.
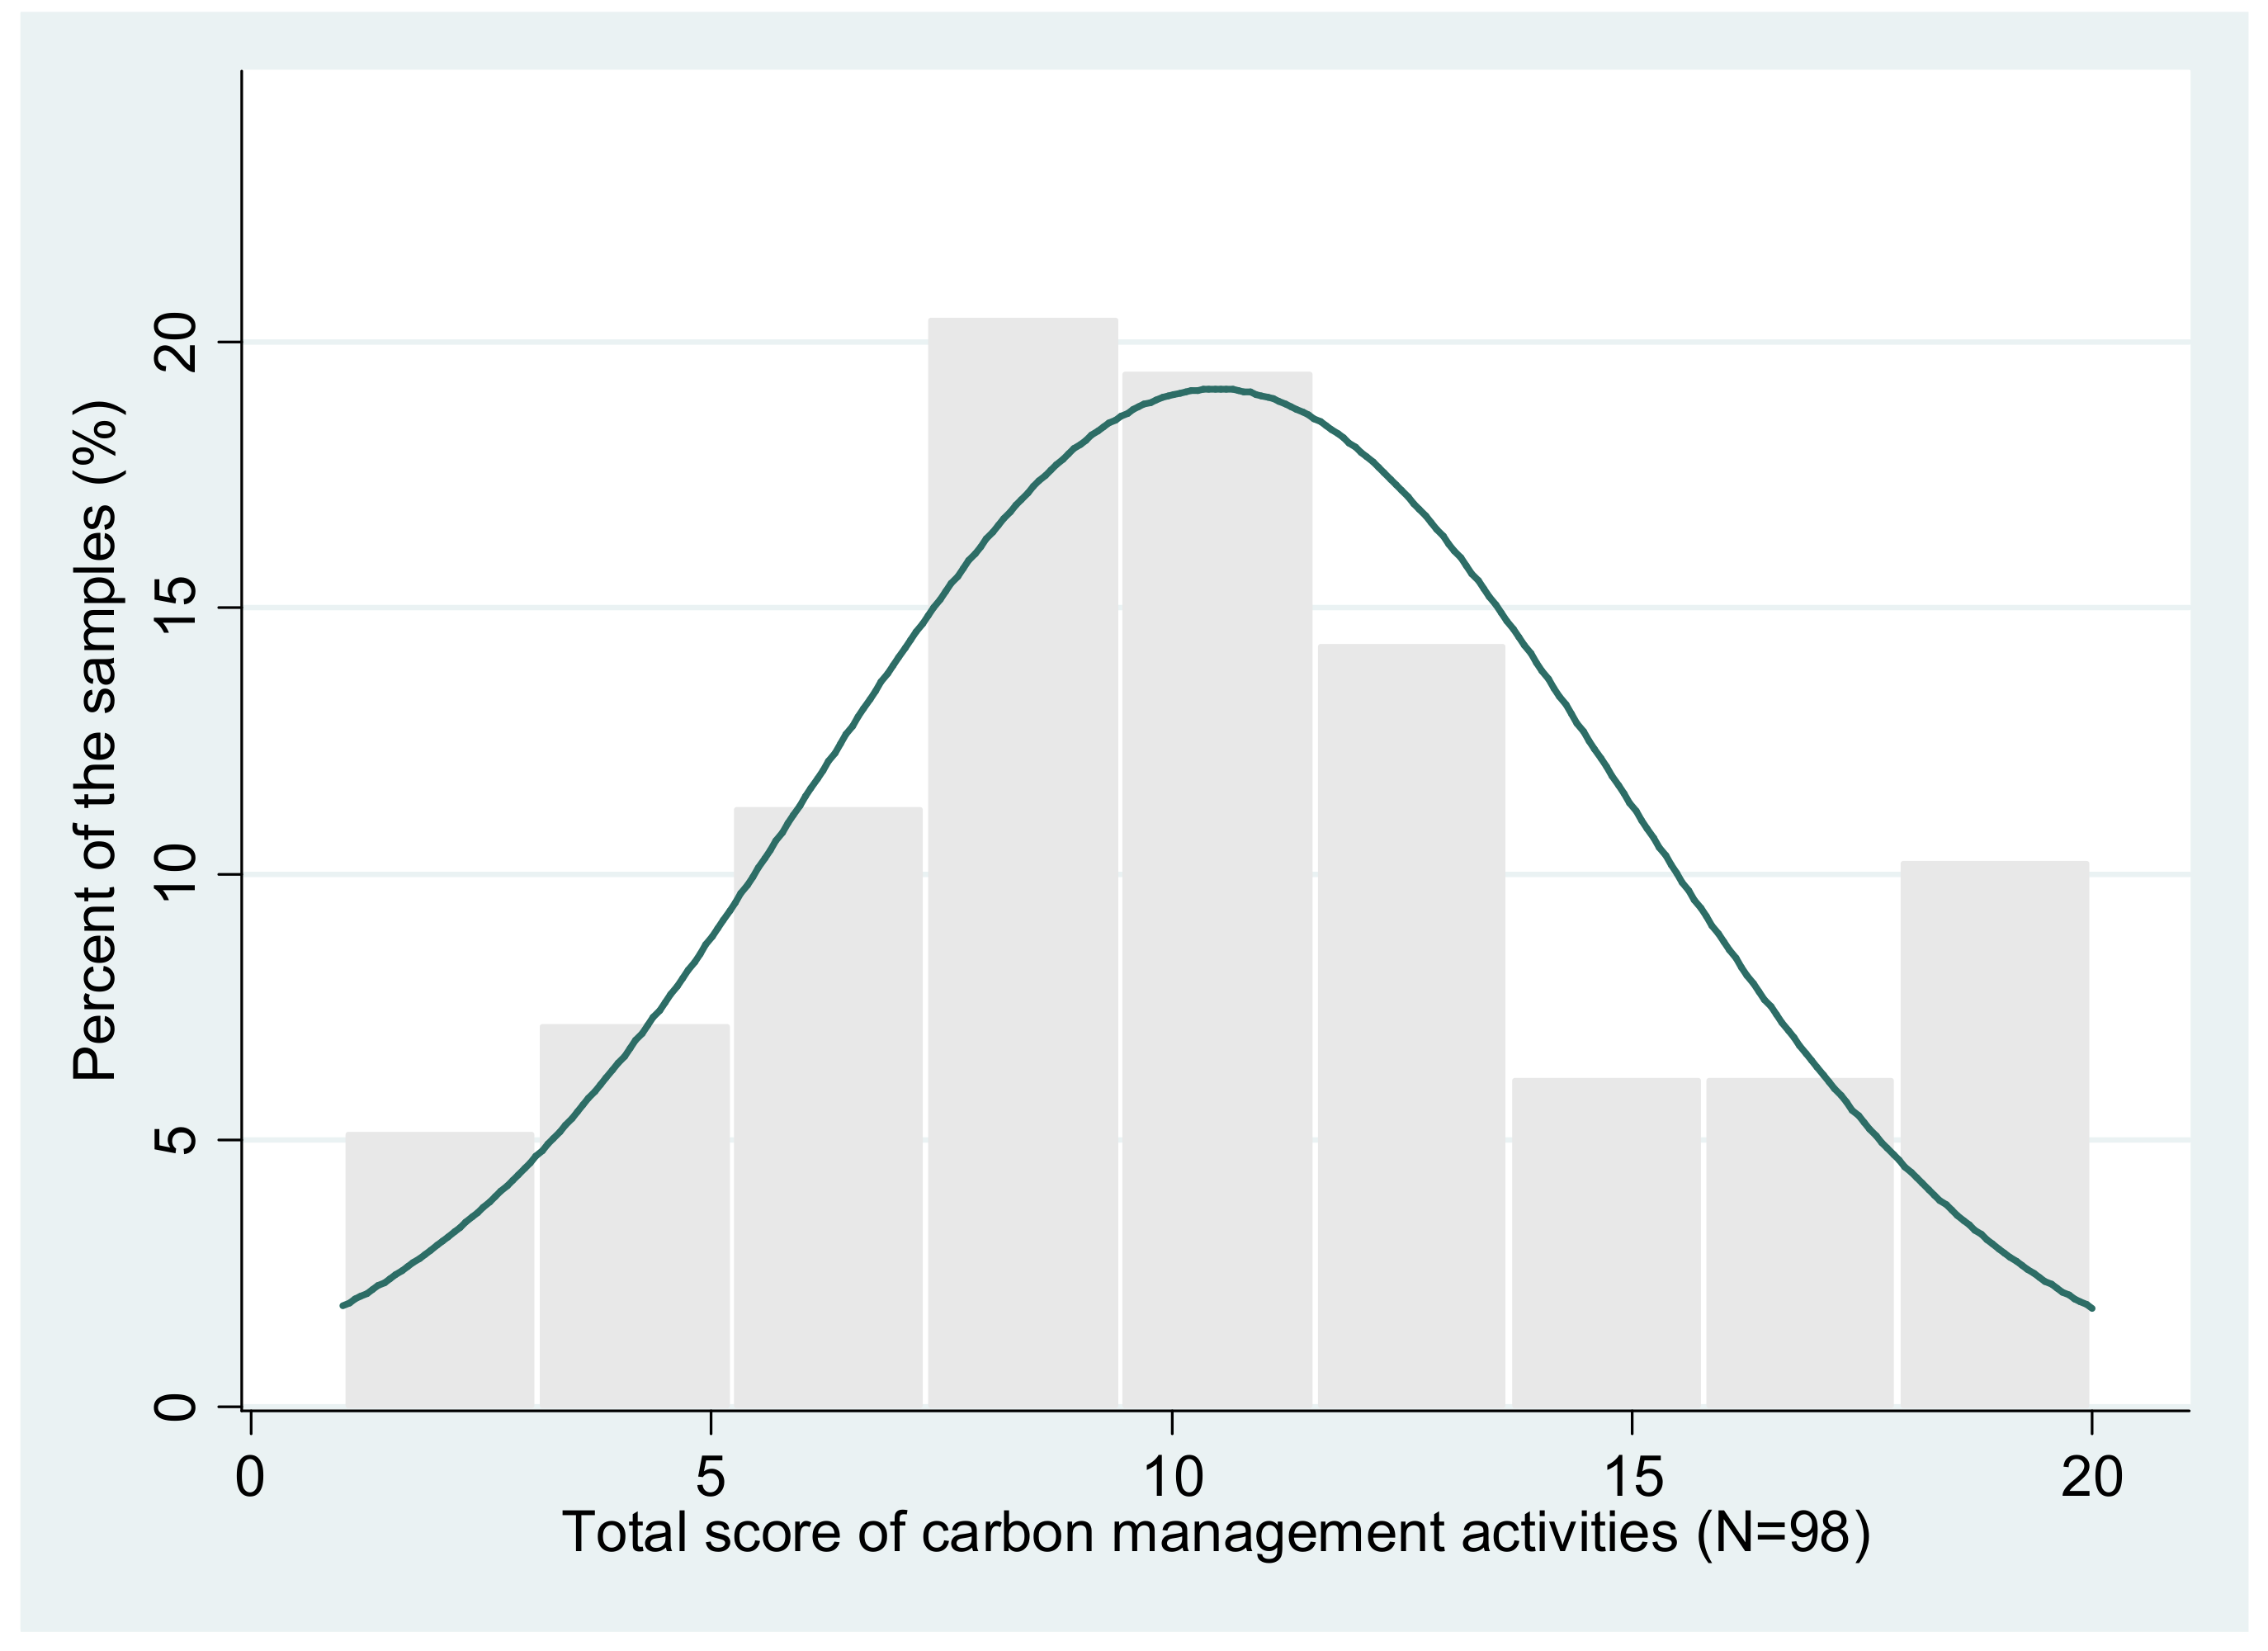
Figure 4 further shows the distribution of companies’ TCMA. The average TCMA is 10.5, indicating a moderate level in adopting CMAs overall, of the surveyed companies. The number of companies with less than five activities is about seven. Half of the samples practiced 8 to 12 items of CMAs and less than 20% of the companies implemented 13 to 17 items of ESAs. Only 10% of the respondents practiced 18–20 of the activities.
4.2. Statistics of the Independent Variables and Companies’ Internal Carbon Price
Table 6 summarizes the statistics of independent variables and the control. The skewness and kurtosis values are listed to show the shape of the distribution of scores achieved by these variables. The skewness of the variables ranges from −2.76 to 2.32, with absolute values less than 3, and their kurtosis ranges from 2.15 to 6.94, with the absolute values less than 10. This confirms that the skewness and kurtosis of the adopted variables is not significant [53].
Four external pressures ‘GOVERNMENT’, ‘COMPETITION’, ‘ENERGY PRICE’ and ‘STAKEHOLDER’ obtained relatively higher score over 3.50, indicating somewhat pressures of them. The influential of internal factors of ‘TOP SUPPORT’ and ‘’UNDERSTANDING’ are moderated, meaning that the executives of the companies surveyed understand the structure of the emission trading system, but that the same awareness might not extend throughout management. The statistical result for technology level based on the four-point scale was converted to a five-point scale, which indicated that the level of carbon reduction technology (‘TECH_LEVEL’) of samples is generally domestically average. A mean carbon price internalized by 73 companies for ‘IN_CARBON_PRICE’ corresponds to 16,906 KRW/t-CO2 (15.6 USD/t-CO2). While it varies according to sector, a price range that can be applied to the major sectors is 14.2–17.2 USD/t-CO2 [54].
4.3. Correlation Matrix and Bi-Variable Results
Pair-wise correlation was calculated to preliminarily explore relationships between TCMA, the independent variables. The results are listed in Table 7, which indicate no unacceptable multi-collinearity between these variables as the highest correlation coefficient is 0.565. Harmful levels of multi-collinearity occur at ±0.8 or ±0.9 [55]. The correlation matrix indicates that ‘STAKEHOLDER’, ‘TOPSUPPORT’, and ‘UNDERSTANDING’ are significantly and positively associated with TESA at p < 0.01.
4.4. Determinant Factors for Carbon Management in Korean Companies
As the TCMA and sub-categories of CMAs, STAGE 1, STAGE 2, STAGE 3, STAGE 4 and STAGE 5, are ordinal dependent variables, ordered logistic regressions were performed, with results given in Table 8 (STAGE 1 to 3) and Table 9 (STAGE 4 to 5 and TCAM). Results showed a significant association are shown in shade. The robustness of the results was tested by repeating regression with certain variables omitted. Three models were adopted: Model 1 includes external and internal factors but excludes controls; in Model 2, SECTOR is excluded; and Model 3 includes all the variables discussed earlier. The total observations of econometric analysis are 71 due to invalid data. The results indicate that top managers’ support (‘TOP_SUPPORT’) is a commonly significant determinant for all STAGEs of CMA and TCAM. Meanwhile, interestingly, different factors are significantly associated with each STAGE: technology level is associated with STAGE 1, government pressure negatively with STAGE 2, and energy price negatively with STAGE 3. The initial stages of carbon management, STAGE 1–3 are overall not related to the control variables, but are mainly influenced by external and internal factors.
For the higher level of CMA included in STAGE 4 and STAGE 5, together with top manager’s support, policy understanding on carbon pricing and carbon market is an essential factor leading to better performance of companies in carbon management. This result is consistent with several current studies. Noteworthy is that the internal carbon price of companies (‘IN_CARBON_PRICE’) is related to proactive carbon management. Companies that have higher internal carbon price are more concerned with carbon pricing policy and strategically respond to it.
On the other hand, this reveals to what extent government pressure (‘GOVERNMENT’) is effective in promoting corporate proactive carbon management as similarly appeared with the finding of positive coercive effects among firms in European Union (EU) addressing climate change [3,31]. Interestingly, contrary to this result, government pressure was not an important factor in the results of a study that analyzed the determinants of energy conservation activities in energy-consuming industries in 2012 [18]. At that time, we concluded that firms felt strong pressure on government regulation, nevertheless this did not act as a decisive factor in actual corporate energy activities. The survey was conducted at the end of 2011, and the introduction of ETS in Korea was discussed at that time. Based on these results of previous and current, it can be said that the Korean government policy, especially K-ETS, has become an important factor of corporate energy and carbon management.
At a high level of carbon management in STAGE 4 and 5, company characteristics, i.e., sector, size, and type of production, are positively or negatively related. No significant relationship could be found between the externally mimetic pressures of ‘COMPETITION’ and ‘STAKEHOLDER’ with a company’s carbon management at any practice level, which were confirmed in other studies as important determinant factors for existing energy and environmental management in energy intensive industries [10,36]. In effect, this means that participation in the carbon market, as well as concern over carbon pricing may not be considered issues as regards competition between companies or the relationship with stakeholders
4.5. Statistics of the Supplementary Survey Questions
4.5.1. Important Stakeholders for Carbon Management
Companies were asked to evaluate the degree to which the listed stakeholders affected their carbon performance, using a scale from one to five, with ‘1’ representing not important at all and ‘5’ being very important. Figure 5 summarizes the statistics of the responses.
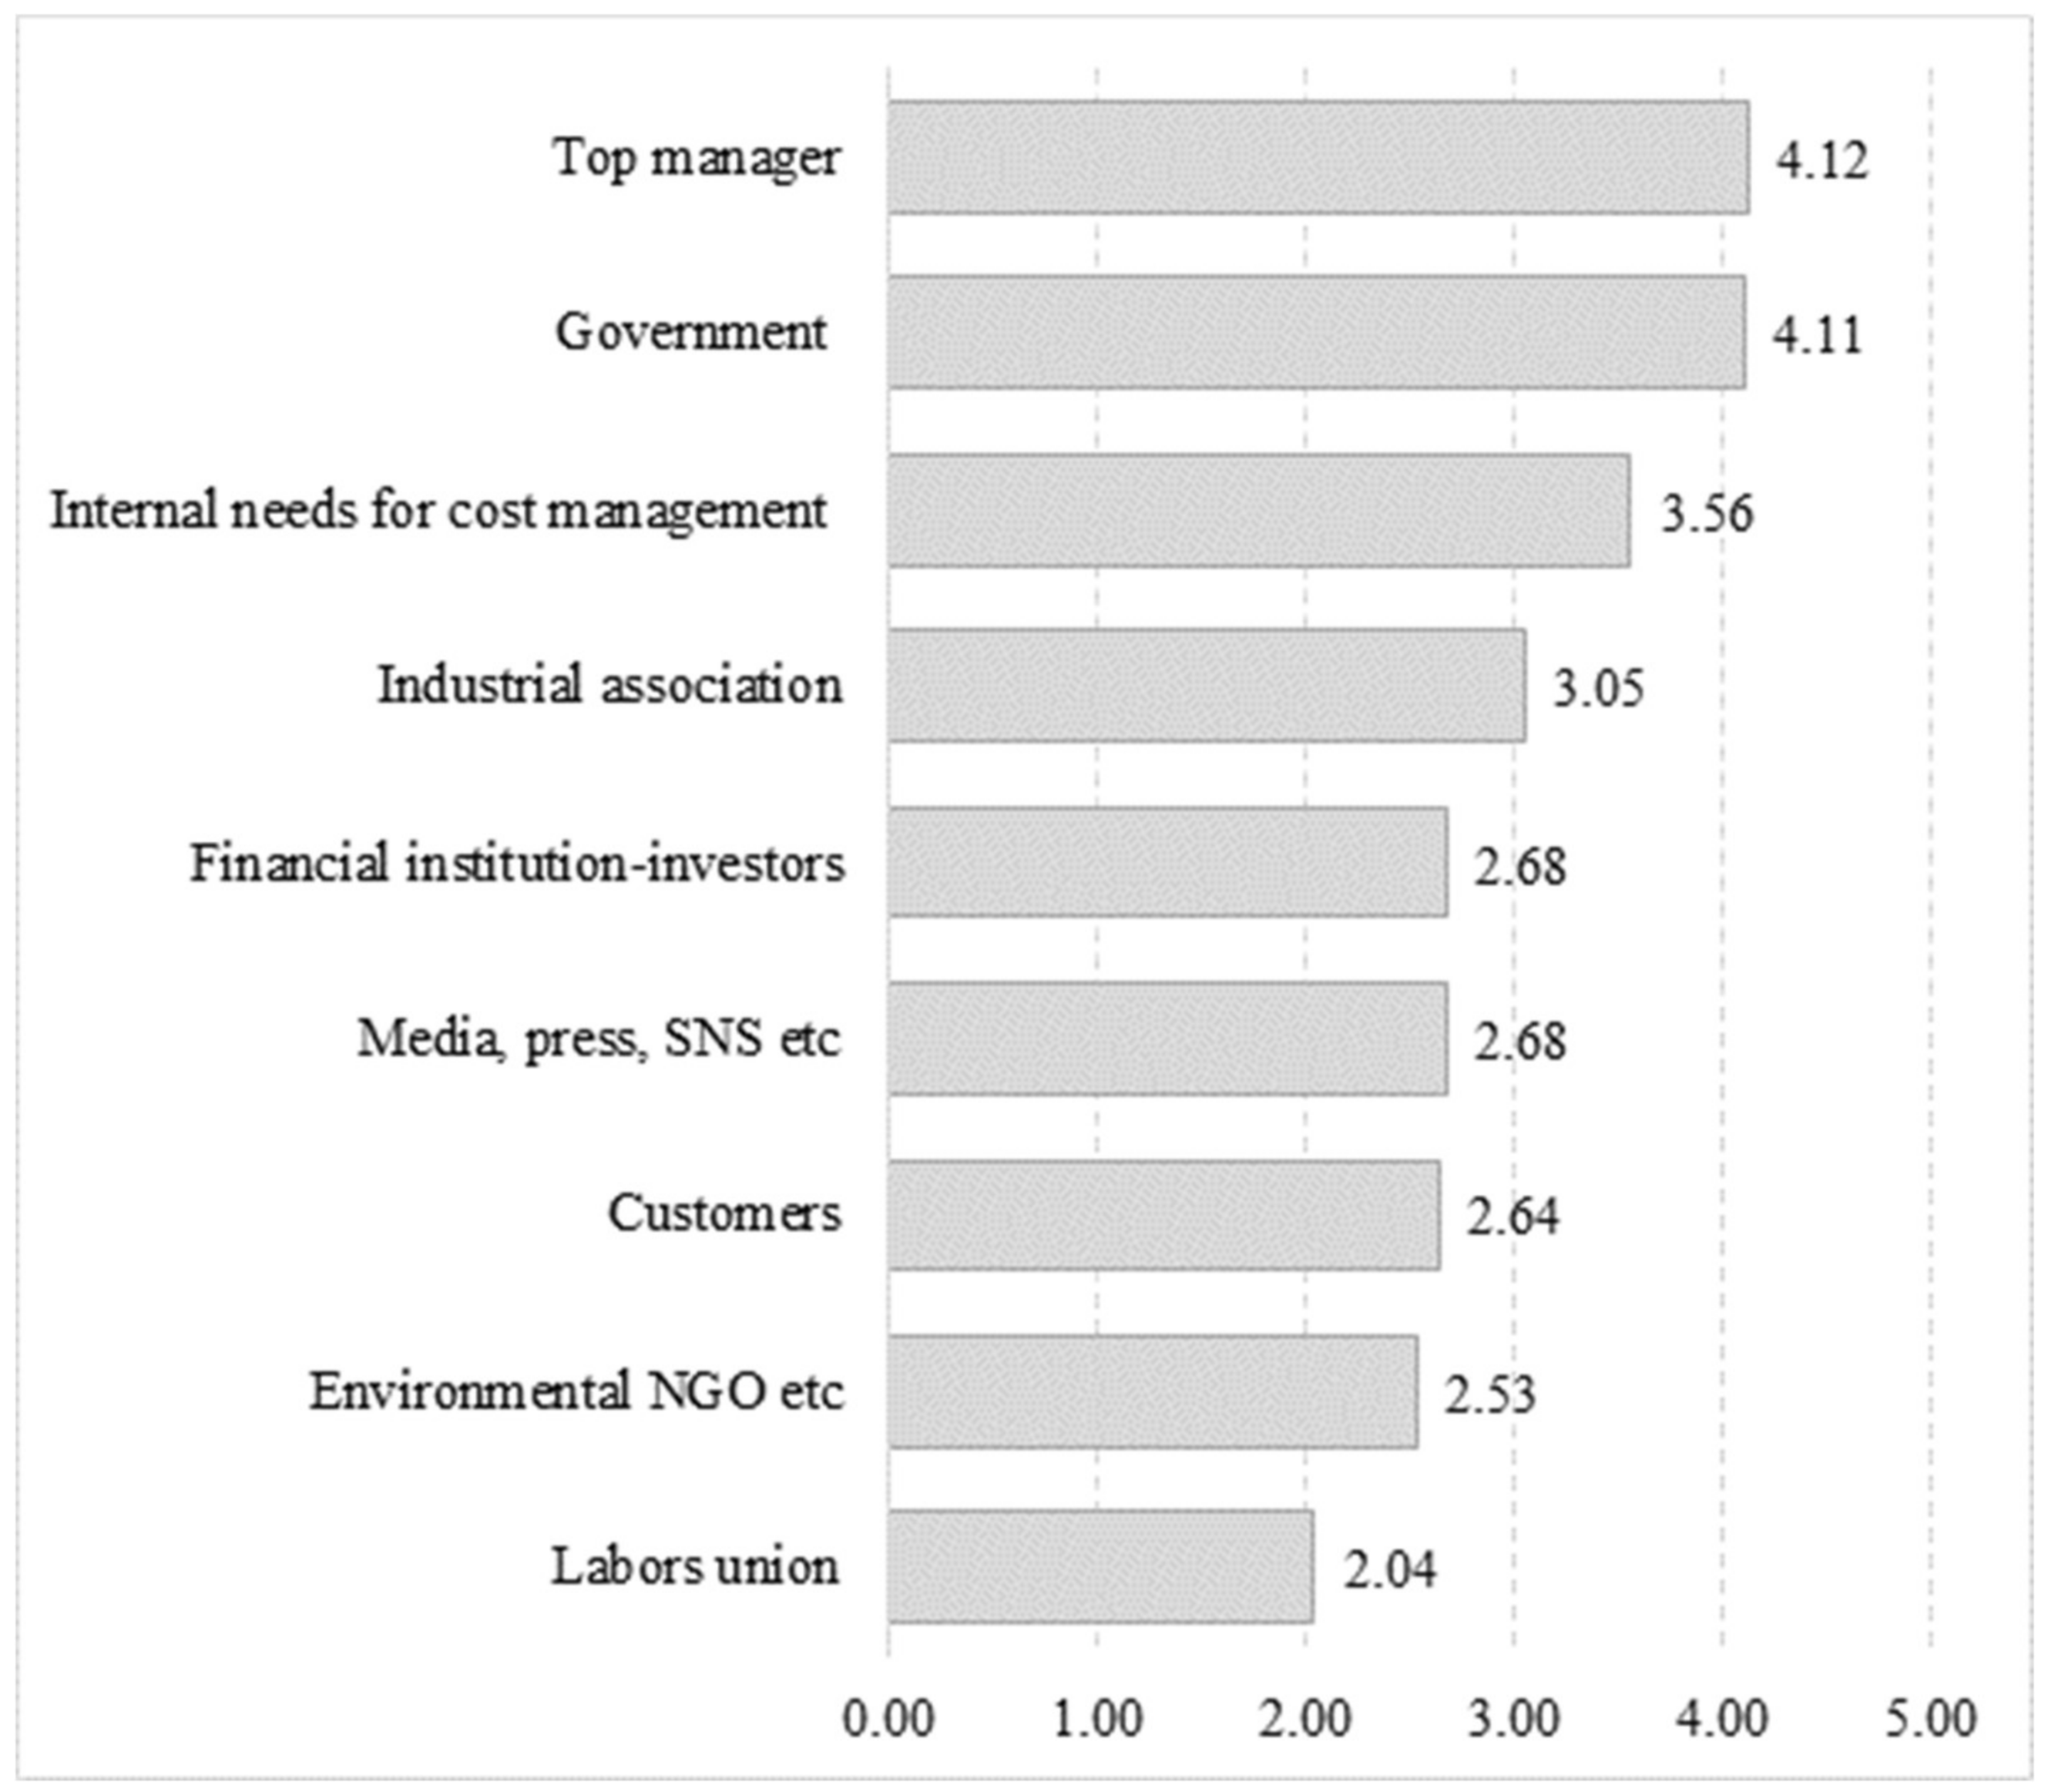
The stakeholders of ‘Top manager’ and ‘Government’ achieved the highest means of 4.12 and 4.11, which is consistent with the regression results and existing literatures [1]. ‘Internal needs for cost management’ achieved a relatively high score (averaged at 3.56). Seeking resources through loans, venture capital, etc., to commit to environmental stewardship policies, investors were thought to be important to spur changes in organizational practices [56]. However, the sampled companies in this study viewed financial institutions as having a low level of influence in their carbon management. Due to the higher use of the Internet and social networks of late, companies are more frequently exposure and judged on the basis of their environmental stewardship and business practices [57]. Companies with business activities that necessitate interaction with the end consumer tend to be most active [58]; however, together with other parties, including labor union and environmental NGO groups, media and social networks and customersy achieved a moderate score of 3 points or less due to probably small portion of samples companies with the product type of final goods, implying that these bodies had little effect on a company’s carbon strategy efforts.
4.5.2. Company Evaluation of Impact of Carbon Management on Business Factors
In order to assess how companies evaluated the influence of carbon management on their businesses, the samples were asked to give scores on a five-point scale for the pre-listed concerns regarding K-ETS, with 5 being ‘very significant’ and 1, ‘no issue at all’. The statistics are presented in Table 10.
The respondents present moderate evaluations for all the factors with a score of 3.29, which may have been influenced by their carbon management. Although companies have strongly and continuously asserted reduced competitiveness as the chief concern [59], the score for ‘Domestic and international competitiveness’ was actually relatively low (3.12).
Due to its highest score of 3.62, carbon management appears to be regarded as ‘a means to do something nice’ as a means to improve a company’s valuation. For ETS companies, meeting emissions allocation through carbon management may be a strategy that takes into account external impressions rather than being based on rationalization of the cost of greenhouse gas mitigation, due to the relatively lower scores given for production cost reduction (3.44), carbon reduction cost reduction (3.41), and cost effectiveness as means to increase profits (3.00) in this phase. In actuality, EU ETS companies are concerned that the allocation shortfalls are negatively associated with a firm’s valuation [9]. Meanwhile, given the statistical result of importance of stakeholders in company carbon management in the above Section 4.5.1, it is likely that the government is considered the chief determining body of a company’s external reputation, as opposed to the general public, environmental NGOs, and peers in the same sector that are implied by the question.
In terms of the integrated financial strategy of carbon management, consistent with other parts of this paper, this statistic endorses the view that Korean companies have yet to reach the stage of proactive management and remain within the bounds of existing environment management in order to meet pollutant reduction targets or as a part of CSR. Since this survey was conducted in the third period of the first phase, the results reflect how companies actually perceived and have responded to K-ETS, which is noteworthy.
4.5.3. Supportive Policy for Carbon Management
In the survey, companies allotted scores to policy measures anticipated to support company carbon management using a five-point scale, from 5, ‘very effective’, to 1, ‘no effect’. The results are shown in Table 11.
While other supportive policies suggested scored lower, around 2.40–2.60 points, ‘Consistency and transparency of policy’ was ranked as the most important aspect with a mean of 3.89. This reaffirms that Korean companies suffer from considerable uncertainty over the policy of carbon pricing in trading decisions [19] due to recent policy changes and re-organisation within the Ministry (June 2016). A similar finding was observed among EU ETS participants, in which such ‘market rationality’ was likely hindered by confusion over the design of current policy and stringency of future policy, which both influence carbon pricing [60]. This requires governmental intervention to clear up any policy uncertainty concurrently in order that companies can promote proactive carbon management and make short-term and longer-term decisions in innovation.
5. Conclusions
The ambitious goal statement under the Paris Agreement would not be possible without proactive actions of a group of countries and other stakeholders in particular industries. Given the increasing reliance of energy and climate change policy on market mechanisms in Korea, business leaders are facing challenges with new legislation, new institution implementation as well as increasing consumer and shareholder expectations. Correspondingly, proactive carbon management will form a vital part of their business strategy.
Emphasizing that carbon management, unlike existing energy and environmental management, should be considered and penetrated in the entire enterprise management process, this study explored the implementation status of Korean companies’ carbon management and its characteristics and determinants through an empirical study subjecting firm-level data for qualitative and quantitative analyses. An analytical framework was designed which employs domestic-specified variables that affect company carbon performance. Owing to the paucity of academic discussion on the compatibility between government policy and the actual response on the side of industry in the transition from existing voluntary or regulatory environmental policies to market mechanism in Korea, this study contributes to plug this knowledge gap of the literature on corporate carbon management in Korea and draw implications on policy and corporate through firm-level analysis.
Although K-ETS has now entered its third year, the majority of the surveyed companies are still in their infancy as far as adopting systematic and analytic approaches in response to the monetary concept of carbon pricing and the carbon market. However, they tend to adhere to existing environmental management practices, while that deviated only minimally from emission reduction-oriented activity as before ETS [2,18], and in fact only a few (10%) had managed to reach the level of proactive carbon management this study defined. This is consistent with the views of a previous study [2] for Korean companies. In promoting carbon management, the regression analysis reaffirmed the finding in [38] that top manager’s support is the most essential determinant factor of all the strategic stages of carbon management this study defined. Further, whether a company adopts proactive and strategic carbon management, the significance of to what extend top manager understand the policy takes on a higher level of importance.
It can be assumed, as a result, that for large part of Korean companies, carbon management activities are not fully merged into their entire business operation and strategies in relation to financial plan that provides measurable approach for business profits, but are instead seen as impacting more on their corporate image and social contribution as part of their environmental activities under the support of managers with a high awareness of carbon option.
The sluggish response of Korean companies to carbon management may be because it is still weak or uncertain about the business opportunities or competitive advantages that companies can achieve by responding to the carbon market. Some empirical studies of EU ETS [61,62] addressed the profits of carbon market and significant carbon premium in stock returns due to increased cash flow for ETS subjected companies, which may be a significant point of interest for Korean companies. With this regards, further researches on how the three year-carbon pricing policies in Korea provided the company with carbon options and how they are associated with market-based business opportunities are needed, and the results and implications of the studies will help improve relevant policies.
Meanwhile, this study confirmed that the pressure and stringency of government policies also affect the kind of carbon management actually practiced within a company. One noteworthy finding witnessed in this study is that the function of government pressure on corporate energy and carbon management has changed and become more of an important determinants compared to the results of previous studies in 2013 [18]. Hence, in order to encourage the private sector to establish carbon management strategies that look beyond existing standards and norms, the government will need to aim at provide ongoing policy support to improve market function and effectiveness. Moreover, as highlighted in this study, policy consistency and transparency of the related policies at the government level are key aspects to be jointly and simultaneously addressed in Korea, in order for companies to implement their own carbon pricing and strategies as well as make decisions in management and investment related to the introduction of carbon management.
This study also identifies that companies who set their internal carbon price higher elicited a higher level of carbon management, which is a key finding due to the growing attention-grabbing nature of the subject as well as potential doors it opens up for future relevant research.
This study admits some shortcomings and limitations that should be considered. Furthermore, some difficulty was experienced in collecting data and only limited amounts of data were actually usable due to reluctance on the part of companies for full disclosure. The small number of samples, approximately 44% of the required sample number to satisfy a 90% confidence level based on the 404 total population size, may weaken the policy relevance of the estimations and empirical analysis to generalize. Expanding the targets and sectors as well as conducting further studies may eliminate such limitations.
Acknowledgments
This research was supported by Hyogo Prefectural Government of Japan. The author would like to sincerely thank POSCO Research Institute in Korea, which contributed to implementing the survey research in Korea. The author would also like to express her deep gratitude to Taehan Kim in Korea, and the Sustainability Investing Forum in Korea for their valuable comments and for arranging the on-site interviews with Korean companies. The author is grateful to IGES colleagues Dr. Zhou Xin for valuable comments and Ms. Emma Fushimi for her contributions to English proofreading.
Author Contributions
Sunhee Suk, a single author, coordinated the whole process of the research implementation and paper writing; design the work, implementation of the questionnaire survey with helping local institute, t data analysis and interpretation, and drafting of the work.
Conflicts of Interest
The author declares no conflict of interest.
References
- Hoffmann, V.H.; Busch, T. Corporate Carbon Performance Indicators: Carbon intensity, dependency, exposure, and risk. J. Ind. Ecol. 2008, 12. [Google Scholar] [CrossRef]
- Lee, S.Y. Corporate Carbon Strategies in Responding to Climate Change. Bus. Strategy Environ. 2012, 21, 33–48. [Google Scholar] [CrossRef]
- Galbreath, J. Corporate governance practices that address climate change: An exploratory study. Bus. Strategy Environ. 2009, 19, 335–350. [Google Scholar] [CrossRef]
- Sullivan, R. An assessment of the climate change policies and performance of large European companies. Clim. Policy 2010, 10, 38–50. [Google Scholar] [CrossRef]
- Weinhofer, G.; Hoffmann, V.H. Mitigating Climate Change—How Do Corporate Strategies Differ? Bus. Strategy Environ. 2008, 19, 77–89. [Google Scholar] [CrossRef]
- Hendrics, H.; Busch, T. Carbon management as a strategic challenge for SMEs. Greenh. Gas Meas. Manag. 2012, 2, 61–72. [Google Scholar] [CrossRef]
- Bebbington, J.; Larrinaga-González, C. Carbon trading: Accounting and reporting issues. Eur. Account. Rev. 2008, 17, 697–717. [Google Scholar] [CrossRef]
- Stechemesser, K.; Guenther, E. Carbon accounting: A systematic literature review. J. Clean. Prod. 2012, 36, 17–38. [Google Scholar] [CrossRef]
- Evangelinos, K.; Nikolaou, I.; Filho, W.H. The effects of climate change policy on the business community: A corporate environmental accounting perspective. Corp. Soc. Responsib. Environ. Manag. 2015, 22, 257–270. [Google Scholar] [CrossRef]
- Böttcher, C.F.; Müller, M. Drivers, Practices and Outcomes of Low-carbon Operations: Approaches of German Automotive Suppliers to Cutting Carbon Emissions. Bus. Strategy Environ. 2013, 24, 477–498. [Google Scholar] [CrossRef]
- Jeswani, H.K.; Wehrmeyer, W.; Mulugetta, Y. How warm is the corporate response to climate change? Evidence from Pakistan and the UK. Bus. Strategy Environ. 2008, 17, 46–60. [Google Scholar] [CrossRef]
- Gouldson, A.; Sullivan, R. Long-term corporate climate change targets: What could they deliver? Environ. Sci. Policy 2013, 27, 1–10. [Google Scholar] [CrossRef]
- Sprengel, D.C.; Busch, T. Stakeholder engagement and environmental strategy-the case of climate change. Bus. Strategy Environ. 2010, 20, 351–364. [Google Scholar] [CrossRef]
- Pinkse, J.; Kolk, A. Challenges and trade-offs in corporate innovation for climate change. Bus. Strategy Environ. 2010, 19, 261–272. [Google Scholar] [CrossRef]
- Al-Tuwaijri, S.A.; Christensen, T.E.; Hughes, K.E. The relations among environmental disclosure, environmental performance, and economic performance: A simultaneous equations approach. Account. Organ. Soc. 2004, 29, 447–471. [Google Scholar] [CrossRef]
- Doda, B.; Gennaioli, C.; Grover, D. Are corporate carbon management practices reducing corporate carbon emissions. Corp. Soc. Responsib. Environ. Manag. 2016, 23, 257–270. [Google Scholar] [CrossRef] [Green Version]
- Sullivan, R.; Gouldson, A. Ten years of corporate action on climate change: What do we have to show for it? Energy Policy 2013, 60, 733–740. [Google Scholar] [CrossRef]
- Suk, S.H.; Liu, X.B.; Sudo, K. A survey study of energy saving activities of industrial companies in the Republic of Korea. J. Clean. Prod. 2013, 41, 301–311. [Google Scholar] [CrossRef]
- Suk, S.H.; Lee, S.; Jeong, Y. The Korean Emissions Trading Scheme: Business perspectives on the first year of operations. Clim. Policy 2017. [Google Scholar] [CrossRef]
- Gill, P.; Dolan, G. Originality and the PhD: What is it and how can it be demonstrated? Nurse Res. 2015, 22, 11–15. [Google Scholar] [CrossRef] [PubMed]
- Porter, M. America’s Green Strategy. Sci. Am. 1992, 264, 168. [Google Scholar] [CrossRef]
- Maier, S.; Vanstone, K. Do Good Environmental Management Systems Lead to Good Environmental Performance? Research Briefing; Ethical Investment Research Services: London, UK, 2005. [Google Scholar]
- Shrivastava, P.; Scott, H.I. Corporate Self-Greenewal: Strategic Responses to Environmentalism. Bus. Strategy Environ. 1992, 1, 9–20. [Google Scholar] [CrossRef]
- Sunderland, T.J. Environmental management standards and certification—Do they add value? In ISO 14001 and Beyond: Environmental Management System in the Real World; Sheldon, C., Ed.; Greenleaf Publishing: Yorkshire, UK, 1997. [Google Scholar]
- Epstein, M.J. Measuring Corporate Environmental Performance: Best Practices for Costing and Managing and Effective Environmental Strategy, 1st ed.; McGraw-Hill Education: Chicago, IL, USA, 1996. [Google Scholar]
- Boiral, O.; Henri, J.F.; Talbot, D. Modeling the impacts of corporate commitment on climate change. Bus. Strategy Environ. 2011, 21, 495–516. [Google Scholar] [CrossRef]
- Suk, S.H.; Liu, X.B. A Survey Analysis of Company Perspective to the GHG Emissions Trading Scheme in the Republic of Korea. In Environmental Taxation and Green Fiscal Reform: Theory and Impact; Kreiser, L., Lee, S., Ueta, K., Milne, J.E., Ashiabor, H., Eds.; Edward Elgar Publishing, Inc.: Northampton, MA, USA, 2014; pp. 289–306. [Google Scholar]
- Luo, L.; Tang, Q. Determinants of the quality of corporate carbon management systems: An international study. Int. J. Account. 2016, 51, 275–305. [Google Scholar] [CrossRef]
- Microsoft. The Microsoft Carbon Fee: THEORY & Practice: The What, Why and How of Microsoft’s Efforts to Drive Culture Change; Microsoft: Redmond, WA, USA, December 2013. [Google Scholar]
- Abreu, M.C.S.; Freitas, A.R.P.; Rebouças, S.M.D.R. Conceptual model for corporate climate change strategy development: Empirical evidence from the energy sector. J. Clean. Prod. 2017, 165, 382–392. [Google Scholar] [CrossRef]
- Cades, S.; Czerny, A. Climate change mitigation strategies in carbon-intensive firms. J. Clean. Prod. 2016, 112, 4132–4143. [Google Scholar] [CrossRef]
- Giacomo, N.D.; Guthrie, J.; Farneti, F. Environmental management control systems for carbon emissions. PSU Res. Rev. 2017, 1, 39–50. [Google Scholar] [CrossRef]
- Tang, S.; Demeritt, D. Climate change and mandatory carbon reporting: Impacts on business process and performance. Bus. Strategy Environ. 2017. [Google Scholar] [CrossRef]
- Schaltegger, S.; Csutora, M. Carbon accounting for sustainability and management. Status quo and challenges. J. Clean. Prod. 2012, 36, 1–16. [Google Scholar] [CrossRef]
- Teng, M.-J.; Wu, S.-Y.; Chou, S.J.-H. Environmental Commitment and Economic Performance- Short-Term Pain for Long-Term Gain. Environ. Policy Gov. 2014, 24, 16–27. [Google Scholar] [CrossRef]
- Luo, L.; Tang, Q. Corporate ecological transparency: Theories and empirical evidence. Asian Rev. Account. 2016, 24, 498–524. [Google Scholar] [CrossRef]
- Sullivan, R.; Gouldson, A. The Governance of Corporate Responses to Climate Change: An International Comparison. Bus. Strategy Environ. 2016, 26. [Google Scholar] [CrossRef]
- Katsikeas, C.S.; Leonidou, C.N.; Zeriti, A. Eco-friendly product development strategy: Antecedents, outcomes, and contingent effects. J. Acad. Mark. Sci. 2016, 44, 660–684. [Google Scholar] [CrossRef] [Green Version]
- OECD. An Overview of Corporate Environmental Management Practices: Joint Study by the OECD Secretariat and EIRIS; OECD: Paris, France, 2003. [Google Scholar]
- Schot, J.; Fischer, K. Introduction: The greening of the industrial firm. In Environmental Strategies for Industry; Fischer, K., Schot, J., Eds.; Island Press: Washington, DC, USA, 1993; pp. 3–33. [Google Scholar]
- Hart, S.L. A natural-resource-based view of the firm. Acad. Manag. Rev. 1995, 20, 986–1014. [Google Scholar]
- Bhargave, S.; Welford, R. Chapter 2 Corporate Strategy and the Environment: The theory. In Corporate Environmental Management: System and Strategies; Welford, R., Ed.; Eathscan Publications Ltd.: London, UK, 1996; ISBN 1853833088. [Google Scholar]
- Murillo-Luna, J.L.; Garcés-Ayerbe, C.; Rivera-Torres, P. Why do patterns of environmental response differ? A stakeholders’ pressure approach. Strateg. Manag. J. 2008, 29, 1225–1240. [Google Scholar] [CrossRef]
- Buysse, K.; Verbeke, A. Proactive environmental strategies: A stakeholder management perspective. Strateg. Manag. J. 2003, 24, 453–470. Available online: http://dx.doi.org/10.1002/smj.299 (accessed on 1 November 2017). [CrossRef]
- Gasbarro, F.; Pinkse, J. Corporate adaptation behavior to deal with climate change: The influence of firm-specific interpretations of physical climate impacts. Corp. Soc. Responsib. Environ. Manag. 2016, 23, 179–192. [Google Scholar] [CrossRef]
- I4CE (Institute for Climate Economics). Internal Carbon Pricing: A Growing Corporate Practice, November 2016. Available online: https://www.i4ce.org/download/internal-carbon-pricing-an-increasingly-widespread-corporate-practice/ (accessed on 1 January 2018).
- Cuff, M. Web Article. Carbon Pricing is Becoming the Norm for Big Companies, October 16, 2017. Available online: https://www.greenbiz.com/article/carbon-pricing-becoming-norm-big-companies (accessed on 1 January 2018).
- Goldstandard. Supply Report Q3 2016: Better Information for Better Decision-Making. Available online: https://www.goldstandard.org/sites/default/files/documents/gs_supply_report_q12016.pdf (accessed on 1 January 2018).
- Matisoff, D.C.; Noonan, D.S.; O’Brien, J.J. Convergence in environmental reporting: Assessing the Carbon Disclosure Project. Bus. Strategy Environ. 2013, 22, 285–305. [Google Scholar] [CrossRef] [Green Version]
- Liu, X.B.; Wang, C.; Zhang, W.S.; Suk, S.H.; Sudo, K. Company’s affordability of increased energy costs due to climate policies: A survey by sector in China. Energy Econ. 2013, 36, 419–430. [Google Scholar] [CrossRef]
- Nunnally, J.C.; Bernstein, I.H. Psychometric Theory, 3rd ed.; McGraw-Hill: New York, NY, USA, 1994. [Google Scholar]
- Korea Exchange. A Report of the Operating Result of the Korea Emissions Trading Market in 2015; KRX: Busan, Korea, 2016. (In Korean) [Google Scholar]
- Kline, R.B. Principles and Practice of Structural Equation Modeling; Guilford Press: New York, NY, USA, 1998. [Google Scholar]
- Suk, S.H. An Estimate of Internal Carbon Pricing of Korean Companies under the Emission Trading scheme. J. Clean. Prod. 2018. Under Review. [Google Scholar]
- Farrar, D.; Glauber, R. Multi-collinearity in regression analysis: The problem revisited. Rev. Econ. Stat. 1967, 49, 92–107. [Google Scholar] [CrossRef]
- Chrun, E.; Dolšak, N.; Prakash, A. Corporate environmentalism: Motivations and mechanisms. Annu. Rev. Environ. Resour. 2016, 41, 341–362. [Google Scholar] [CrossRef]
- Mazurikiewicz, P. Corporate Environmental Responsibility: Is a Common CSR Framework Possible? World Bank: Washington, DC, USA. Available online: http://documents.worldbank.org/curated/en/577051468339093024/pdf/421830csrframework01PUBLIC1.pdf (accessed on 1 November 2017).
- Damert, M.; Baumgartner, R.J. External pressures or internal governance- what determines the extent of corporate responses to climate change? Corp. Soc. Responsib. Environ. Manag. 2017. [Google Scholar] [CrossRef]
- Economic Circles Requests Lowered Greenhouse Gas Reduction Target; The Federation of Korean Industries (FKI): Seoul, Korea, 16 June 2015. (In Korean)
- Brewer, T.L. Business perspectives on the EU emissions trading scheme. Clim. Policy 2005, 5, 137–144. [Google Scholar] [CrossRef]
- Oestreich, A.M.; Tsiakas, I. Carbon emissions and stock returns: Evidence from the EU Emissions Trading Scheme. J. Bank. Financ. 2015, 58, 294–308. [Google Scholar] [CrossRef]
- Bushnell, J.B.; Chong, H.; Mansur, E.T. Profiting from Regulation: Evidence from the European Carbon Market. Am. Econ. J. Econ. Policy 2013, 5, 78–106. [Google Scholar] [CrossRef]
Figure 1.
Analytical framework for determinant factor of companies’ proactive carbon management.

Figure 2.
Strategic STAGEs of carbon management defined in this study. (Source: depicted by the author).
Figure 2.
Strategic STAGEs of carbon management defined in this study. (Source: depicted by the author).

Figure 3.
Statistic result of surveyed companies’ CMAs (n = 98).

Figure 4.
Distribution of overall scores of CMAs (n = 100).

Figure 5.
Influential stakeholders for Korean companies.


Table 1.
Literature on the classification of a company’s environment and carbon management.
| Reference | Techniques/Strategies/Step/Type | |
|---|---|---|
| Stepwise classification | Schot and Fischer (1993) [40] | Compliance-driven, merely attend to legal requirements, proactive environmental strategies |
| Buysse and Verbke (2003) [44] | Reactive strategy, defensive strategy, accommodative strategy, proactive strategy | |
| OECD (2003) [39] | First step: issuance of a policy statement Second step: formal management systems Third step: environmental performance reporting | |
| Murillo-Luna et al. (2008) [43] | Passive, attention to legislation, attention to stakeholders, total environmental quality (highest level of proactivity) | |
| Firm performance-based classification | Levy and Kolk (2002, in [2]) * | Avoidant, resistant, compliant, proactive |
| Kolk and Pinkse (2005, in [2]) * | Cautious planner, emerging planner, internal explorer, vertical explorer, horizontal explorer, emissions trader | |
| Jeswani et al. (2008) [11] | Indifferent, beginner, emerging, active | |
| Sprengel and Busch (2010) [13] | Minimalists, regulation shapers, pressure managers, emission avoiders | |
| Weinhofer and Hoffmann (2008) [5] | All-rounder, compensator, substituting compensator, reducer, substituting reducer, preserver | |
| Lee (2012) [2] | Wait-and see observer, cautious reducer, product enhancer, all-round enhancer, emergent explorer, all-round explorer | |
| Gasbarro and Pinkse (2016) [45] | Pre-emptive, reactive, continuous, and deferred adaptation | |
| Abreu et al. (2017) [30] | Minimalist approach, regulation shaper, pressure manager or greenhouse gas emission avoiders | |
Source: * are recited from [2].
Table 2.
Summary of variables.
| Variable | Description | Reference | |
|---|---|---|---|
| External | GOVERNMENT | Strictness of the government’s policy | Sullivan and Gouldson (2016) [37] |
| COMPETITOR | Degree of market competition of the same sector | Böttcher and Müller (2013) [10] | |
| ENERGY PRICE | Degree of pressure due to energy price | Gouldson and Sullivan (2013) [12] | |
| Stakeholder | Degree of importance of relevant stakeholder | Sprengel and Busch (2010) [13] | |
| Internal | TOPSUPPORT | Management support for carbon management | Katsikeas et al. (2016) [38] |
| TOPUNDERSTANDING | Management understanding on carbon management | ||
| INCARBONPRICE | Emission allowance price determining trading | - | |
| TECHNOLOGY LEVEL | Level of technology that companies currently have | - | |
| Control | SIZE | SMALL, MEDIUM, L-MEDIUM, LARGE | Weinhofer, and Hoffmann (2008) [5] Böttcher, and Müller (2013) [10] |
| SECTOR | CEMENT, IRON&STEEL, PETROCHEMICAL, PAPER&PULP, NON_FERROUS, and MACHINERY, REFINING, ELECTRONIC and OTHER. | Jeswani, et al. (2008) [11] | |
| PRODUCT TYPE | RAW, INTER and FINAL | - | |
Table 3.
Description of CMAs and valuation.
| Item | Carbon Management Activities | Valuation | ||
|---|---|---|---|---|
| 0 | 1 | |||
| STAGE 1 | CMA01 | Collecting information on policy related to energy savings and GHG emission reduction | ||
| CMA02 | Regular in-house training program for energy saving and GHG emission reduction | |||
| CMA03 | Encouraging daily energy saving activities in office (ex. turning off lights) | |||
| CMA04 | Participating in training programs for energy saving and GHG emission reduction held by the government/local government | |||
| STAGE 2 | CMA05 | Short & long-term targets for energy savings and GHG emission reduction in place | ||
| CMA06 | Conducting analysis on energy use and GHG emissions to identify potential areas for energy savings and emission reduction | |||
| CMA07 | Installing monitoring equipment on energy consuming facilities | |||
| CMA08 | Enhancing daily facility maintenance for energy saving and GHG emission reduction | |||
| STAGE 3 | CMA09 | Setting up an internal standard for energy savings and GHG emission reduction management | ||
| CMA10 | Establishing a unit or department for emission trading | |||
| CMA11 | Purchase new production facilities to save energy and reduce GHG emissions | |||
| CMA12 | Investing in R&D to improve production processes for energy savings and emission reduction | |||
| STAGE 4 | CMA13 | Enhancing optimization in transporting materials and goods | ||
| CMA14 | Making adjustments in energy mix to use more clean energy sources | |||
| CMA15 | Releasing sustainability reports regularly that contain data for energy consumption and GHG emissions | |||
| CMA16 | Set up a strategic carbon management (plan-do-check-act) | |||
| STAGE 5 | CMA17 | Setting up a plan and allocating budget for purchasing permits and trading | ||
| CMA18 | Establishing decision making process in relation to carbon trading (e.g., purchase, sell, price projection, etc.) | |||
| CMA19 | Establishing carbon management strategy based on regular analysis of carbon market | |||
| CMA20 | Adopting a green or carbon management accounting system | |||
Table 4.
Example response in the MBDC format.
| Price of Emission Allowance (KRW/tCO2) | Possibility for Purchasing Permits | ||||
|---|---|---|---|---|---|
| Very High | High | Modest | Low | Very Low | |
| 3000 | √ | ④ | ③ | ② | ① |
| 5000 | √ | ④ | ③ | ② | ① |
| 8000 | √ | ④ | ③ | ② | ① |
| 10,000 | ⑤ | √ | ③ | ② | ① |
| 12,000 | ⑤ | √ | ③ | ② | ① |
| 15,000 | ⑤ | √ | ③ | ② | ① |
| 18,000 | ⑤ | ④ | √ | ② | ① |
| 20,000 | ⑤ | ④ | √ | ② | ① |
| 23,000 | ⑤ | ④ | ③ | √ | ① |
| 26,000 | ⑤ | ④ | ③ | √ | ① |
| 30,000 | ⑤ | ④ | ③ | ② | √ |
| 33,000 | ⑤ | ④ | ③ | ② | √ |
| 37,000 | ⑤ | ④ | ③ | ② | √ |
Q. The following table shows the likelihood of your company’s decision to purchase an emission allowance in the Korea emission market. Please indicate the degree of possibility of a decision to purchase an emission allowance for each price, taking into account your company’s marginal cost of GHG emission reduction.
Table 5.
Distribution of valid respondents.
| Classification Criteria | Number of Respondents | Percentage (%) | |
|---|---|---|---|
| Sector | Petrochemical | 16 | 16 |
| Cement | 6 | 6 | |
| Steel & iron | 14 | 14 | |
| Paper | 11 | 11 | |
| Non-ferrous | 10 | 10 | |
| Machinery | 5 | 5 | |
| Refining | 2 | 2 | |
| Electronics | 7 | 7 | |
| Others | 29 | 29 | |
| In total | 100 | 100.0 | |
| ETS | Targeted | 83 | 83 |
| Non-targeted | 17 | 17 | |
| Size | Large | 6 | 6 |
| L-medium | 36 | 36 | |
| Medium | 35 | 35 | |
| Small | 23 | 23 | |
| Product type | Raw materials | 32 | 32 |
| Intermediate goods | 44 | 44 | |
| Finished goods. | 22 | 22 | |
Table 6.
Statistical summary of independent variables.
| Variable | Obs. | Mean | Std. Dev. | Min. | Max | Skewness Coefficient | Kurtosis Coefficient | |
|---|---|---|---|---|---|---|---|---|
| Independent | GOVERNMENT | 100 | 3.77 | 0.709 | 2 | 5 | −0.97 | 2.51 |
| COMPETITION | 100 | 3.86 | 0.853 | 2 | 5 | −0.49 | 2.23 | |
| ENERGY_PRICE | 99 | 3.71 | 0.693 | 2 | 5 | −1.26 | 2.79 | |
| STAKEHOLDER | 99 | 3.62 | 0.681 | 1 | 9 | 2.32 | 4.41 | |
| TOP_SUPPORT | 100 | 3.44 | 0.891 | 1 | 5 | −1.89 | 2.90 | |
| UNDERSTANDING | 100 | 3.52 | 0.915 | 2 | 5 | −1.57 | 2.15 | |
| TECHNOLOGY_LEVEL | 100 | 3.16 | 0.718 | 1 | 4 | −2.09 | 2.68 | |
| IN_CARBON_PRICE | 73 | 16,906 | 5908 | 3000 | 33,185 | −2.76 | 6.94 | |
Table 7.
Correlation matrix and bi-variable results.
| TCMA | GOVE. | COMP. | ENPR | STAK. | TOPS. | UNDE. | INCA. | |
|---|---|---|---|---|---|---|---|---|
| TCMA | 1.000 | |||||||
| GOVERNMENT | 0.115 | 1.000a | ||||||
| COMPETITION | 0.018 | 0.297 | 1.000 | |||||
| ENERGY_PRICE | −0.036 | 0.119 | 0.230 b | 1.000 | ||||
| STAKEHOLDER | 0.281 a | −0.026 | −0.118 | −0.165 | 1.000 | |||
| TOP_SUPPORT | 0.565 a | 0.098 | 0.055 | 0.072 | 0.269 a | 1.000 | ||
| UNDERSTANDING | 0.432 a | −0.001 | −0.113 | 0.051 | 0.066 | 0.299 a | 1.000 | |
| IN_CARBON_PRICE | 0.173 | 0.001 | −0.072 | −0.132 | −0.072 | 0.168 | 0.199 c | 1.000 |
a Significant < 1%, b Significant < 5%, c Significant < 10%.
Table 8.
Regression result with carbon management of STAGE 1 to 3.
| Variables | STAGE1 | STAGE 2 | STAGE 3 | ||||||||
|---|---|---|---|---|---|---|---|---|---|---|---|
| Model1 | Model2 | Model3 | Model1 | Model2 | Model3 | Model1 | Model2 | Model3 | |||
| External pressure | GOVERNMENT | −0.351 | −0.438 | −0.646 | −0.675 b | −0.713 b | −0.632 | −0.510 | −0.491 | −0.803 | |
| COMPETITION | 0.277 | 0.244 | 0.618 | 0.012 | −0.004 | −0.039 | 0.137 | 0.187 | −0.243 | ||
| ENERGY_PRICE | −0.094 | −0.091 | 0.177 | −0.442 | −0.451 | −0.422 | −1.012 a | −1.056 a | −1.160 | ||
| STAKEHOLDER | −0.050 | 0.013 | 0.166 | 0.202 | 0.148 | 0.165 | 0.135 | 0.098 | −0.828 | ||
| Internal factor | TOP_SUPPORT | 0.604 b | 0.667 b | 0.645 | 0.953 a | 0.959 a | 0.898 | 1.552 a | 1.623 a | 2.217 | |
| UNDERSTANDING | 0.433 | 0.387 | 0.588 | −0.051 | −0.027 | 0.146 | 0.123 | 0.166 | −0.214 | ||
| IN_CARBON_PRICE | 0.000 | 0.000 | 0.000 | 0.000 | 0.000 | 0.000 | 0.000 | 0.000 | 0.000 | ||
| TECH_LEVEL | 0.713 c | 0.723 c | 0.816 | 0.507 | 0.302 | 0.148 | 0.323 | 0.258 | 0.435 | ||
| Control | Production type | RAW | −0.458 | 0.699 | −0.281 | ||||||
| INTERMEDIARY | −0.380 | −0.226 | 0.706 | −0.572 | −0.424 | −0.316 | |||||
| FINAL | 0.168 | −1.245 | 0.543 | ||||||||
| Size | SMALL | −0.645 | −19.830 | 1.116 | 0.783 | 1.075 | 1.298 | ||||
| MEDIUM | −1.305 | −20.924 | 0.396 | 0.135 | 0.933 | 0.054 | |||||
| L_MEDIUM | −1.114 | −20.288 | 0.587 | 0.496 | 1.413 | −0.025 | |||||
| Sector | CHEMICAL | 20.439 | −20.163 | −25.505 | |||||||
| CEMENT | −1.197 | −21.524 | −25.306 | ||||||||
| STEEL | 20.179 | −20.911 | −21.889 | ||||||||
| PAPER | 21.424 | −19.752 | −20.705 | ||||||||
| NON-FERROUS | 20.906 | −20.826 | −22.505 | ||||||||
| MACHINERY | 21.150 | −18.518 | −23.179 | ||||||||
| ELECTRICS | 22.496 | −20.993 | −23.473 | ||||||||
| OTHERS | 20.798 | −19.666 | −23.235 | ||||||||
| Number of obs. | 71 | 71 | 71 | 71 | 71 | 71 | 71 | 71 | 71 | ||
| LR chi2(8) | 19.7 b | 22.66 c | 40.55 b | 23.17 a | 25.64 b | 32.56 | 38.73 a | 41.09 a | 65.14 a | ||
| Pseudo R2 | 0.108 | 0.124 | 0.223 | 0.128 | 0.142 | 0.180 | 0.178 | 0.189 | 0.299 | ||
a Significant < 1%, b Significant < 5%, c Significant < 10%.
Table 9.
Regression result with carbon management of STAGE 4, 5 and TCMA.
| Variables | STAGE 4 | STAGE 5 | TCMA | ||||||||
|---|---|---|---|---|---|---|---|---|---|---|---|
| Model1 | Model2 | Model3 | Model1 | Model2 | Model3 | Model1 | Model2 | Model3 | |||
| External pressure | GOVERNMENT | 0.199 | 0.308 | −0.127 | 0.761 b | 0.777 c | 0.070 | −0.261 | −0.291 | −0.677 c | |
| COMPETITION | 0.058 | −0.001 | 0.385 | −0.236 | −0.350 | 0.205 | 0.187 | 0.152 | 0.454 | ||
| ENERGY_PRICE | −0.100 | −0.036 | −0.045 | −0.068 | −0.006 | −0.025 | −0.447 | −0.449 | −0.391 | ||
| STAKEHOLDER | 0.237 | 0.030 | 0.537 | 0.784 c | 0.710 | 1.768 b | 0.518 | 0.430 | 0.658 | ||
| Internal factor | TOP_SUPPORT | 0.738 b | 0.780 b | 0.539 c | 0.648 b | 0.651 b | 0.386 | 1.281 a | 1.310 a | 1.220 a | |
| UNDERSTANDING | 0.465 c | 0.562 c | 0.532 | 1.040 a | 1.519 a | 1.414 a | 0.636 b | 0.707 b | 0.800 a | ||
| IN_CARBON_PRICE | 0.000 | 0.000 | 0.000 | 0.000 b | 0.000 b | 0.000 a | 0.000 | 0.000 | 0.000 | ||
| TECH_LEVEL | 0.123 | −0.067 | 0.007 | 0.114 | −0.314 | −0.532 | 0.556 c | 0.261 | 0.222 | ||
| Control | Production type | RAW | 0.231 | 0.881 | 0.463 | ||||||
| INTERMEDIARY | 0.756 | −0.012 | 1.165 | −0.157 | 0.759 | −0.411 | |||||
| FINAL | −0.879 | 2.238 | −1.876 b | −1.104 c | |||||||
| Size | SMALL | 2.611 c | 2.265 | 0.573 | 1.132 | 1.810 | 0.495 | ||||
| MEDIUM | 2.408 c | 1.813 | 0.906 | −1.709 | 0.565 | −1.279 | |||||
| L_MEDIUM | 2.478 c | 1.882 | −1.179 | 0.904 | −0.808 | ||||||
| Sector | CHEMICAL | −0.567 | −1.002 | −2.212 | |||||||
| CEMENT | −35.257 | −37.644 | −6.787 a | ||||||||
| STEEL | −3.321 | −4.813 b | −3.308 c | ||||||||
| PAPER | −0.143 | −1.508 | −0.569 | ||||||||
| NON-FERROUS | −2.467 | −1.517 | −2.331 | ||||||||
| MACHINERY | −3.755 c | −40.268 | −2.184 | ||||||||
| ELECTRICS | −2.833 | −2.715 | −2.446 | ||||||||
| OTHERS | −2.169 | −2.937 | −2.053 | ||||||||
| Number of obs. | 71 | 71 | 71 | 71 | 71 | 71 | 71 | 71 | 71 | ||
| LR chi2(8) | 17.55 b | 24.63 b | 43.71 a | 37.8 a | 45.56 a | 75.53 a | 46.66 a | 52.35 a | 69.00 a | ||
| Pseudo R2 | 0.085 | 0.119 | 0.211 | 0.187 | 0.226 | 0.374 | 0.122 | 0.137 | 0.180 | ||
a Significant < 1%, b Significant < 5%, c Significant < 10%.
Table 10.
Factors to be affected by CMAs (n = 99).
| Factors to be Affected by Carbon Management | Mean | Min | Max |
|---|---|---|---|
| Domestic and international competitiveness | 3.12 | 1 | 5 |
| Production cost savings | 3.44 | 1 | 5 |
| Profit increase | 3.00 | 1 | 5 |
| Corporate image improvement | 3.62 | 1 | 5 |
| Emission reduction cost savings | 3.41 | 1 | 5 |
| Overall | 3.29 | 1 | 5 |
Table 11.
Supportive policy and measures for implementing CMAs (n = 100).
| Supportive Policies | Mean | Min | Max |
|---|---|---|---|
| Consistency and transparency of policy | 3.89 | 2 | 5 |
| Financial support (tax incentives, lending with low interest, etc.) | 2.44 | 1 | 5 |
| Support mechanisms to expand low-carbon technology market | 2.62 | 1 | 5 |
| Training on tools for carbon management | 2.47 | 1 | 5 |
© 2018 by the author. Licensee MDPI, Basel, Switzerland. This article is an open access article distributed under the terms and conditions of the Creative Commons Attribution (CC BY) license (http://creativecommons.org/licenses/by/4.0/).
Share and Cite
MDPI and ACS Style
Suk, S. Determinants and Characteristics of Korean Companies’ Carbon Management under the Carbon Pricing Scheme. Energies 2018, 11, 966. https://doi.org/10.3390/en11040966
AMA Style
Suk S. Determinants and Characteristics of Korean Companies’ Carbon Management under the Carbon Pricing Scheme. Energies. 2018; 11(4):966. https://doi.org/10.3390/en11040966
Chicago/Turabian StyleSuk, Sunhee. 2018. "Determinants and Characteristics of Korean Companies’ Carbon Management under the Carbon Pricing Scheme" Energies 11, no. 4: 966. https://doi.org/10.3390/en11040966
Note that from the first issue of 2016, this journal uses article numbers instead of page numbers. See further details here.