Article

Power Management of the DC Bus Connected Converters in a Hybrid AC/DC Microgrid Tied to the Main Grid

by
Robert Antonio Salas-Puente
*,
Silvia Marzal
,
Raúl González-Medina
,
Emilio Figueres
and
Gabriel Garcera
Grupo de Sistemas Electrónicos Industriales del Departamento de Ingeniería Electrónica, Universitat Politècnica de València, Camino de Vera s/n, 46022 Valencia, Spain
*
Author to whom correspondence should be addressed.
Energies 2018, 11(4), 794; https://doi.org/10.3390/en11040794
Submission received: 14 February 2018 / Revised: 8 March 2018 / Accepted: 26 March 2018 / Published: 29 March 2018

Abstract

:
In this paper, a centralized control strategy for the efficient power management of power converters composing a hybrid AC/DC microgrid is explained. The study is focused on the converters connected to the DC bus. The proposed power management algorithm is implemented in a microgrid central processor which is based on assigning several operation functions to each of the generators, loads and energy storage systems in the microgrid. The power flows between the DC and AC buses are studied in several operational scenarios to verify the proposed control. Experimental and simulation results demonstrate that the algorithm allows control of the power dispatch inside the microgrid properly by performing the following tasks: communication among power converters, the grid operator and loads; connection and disconnection of loads; control of the power exchange between the distributed generators and the energy storage system and, finally, supervision of the power dispatch limit set by the grid operator.

1. Introduction

Most countries are dependent on fossil fuels and nuclear energy for electric power generation. However, due to the increasing energy demand and the proliferation of new forms of energy generation which are cheaper and environmentally-friendly, many distributed generation (DG) systems have been integrated into the power grid. Some DGs consist of Renewable Energy Sources (RES), such as Photovoltaic (PV), wind, biomass and geothermal [1]. The DGs are the basis of Microgrids (MGs), which can operate as a single power system that provides a safe and reliable operation at certain voltage and load levels. MGs may work in island-mode or in grid-connected mode, so that they can connect to DGs placed at various locations and inject their energy to the grid if it is needed [2]. The transition between these two operation modes is a process that can destabilize the voltage at the MG buses and damage the MG. In [3], a methodology to recover the MG operation during this transition was presented, along with the main technical problems which should be taken into account. There are three basic MG topologies that can be classified according to the nature of their voltage: DC microgrid (DC MG), AC microgrid (AC MG) and hybrid AC/DC microgrid [4], which is a microgrid with AC and DC buses. Hybrid AC/DC microgrids are currently of great interest to researchers and are considered the distribution and transmission systems of the future, because they enable the coexistence of both AC MGs and DC MGs. The main drawback of the hybrid AC/DC microgrid is the protection strategy because it is more complex than the traditional MG [5,6]. The large amount of required power converters may complicate the control, management, communication and power dispatch among devices.
Early proposals for the control of a hybrid AC/DC microgrid were presented in [7,8,9]. In [10] a decentralized control of a MG was proposed, based on using an interlinking converter (ILC) in order to coordinate the power flows among the power converters connected to the AC and DC buses. Droop methods [11] were used to share power among converters. In [10], droop was applied to the power converters connected both to the DC and AC buses. This control concept was extended in [12,13,14] to implement power interchange among sub-grids comprising a hybrid AC/DC microgrid. Several studies about power management in hybrid AC/DC microgrids using droop strategies for power dispatch have been recently presented [15]. In [16], the droop concept was extended in combination with a cost function defined for the power sharing. Overall, the droop control has a drawback for MGs that result from their small scale. The voltage and the frequency of these systems can fluctuate significantly under load variations or system failures. In order to solve this problem, a communication system between the power converters through a smart centralized system could be used [17,18,19]. Centralized systems allow optimization of power sharing and integrating different types of RES into the MG. The experimental results of an MG which integrates commercial generators to the distribution grid without any droop control was presented in [20]. In that work, power management of the MG was implemented through an energy management system (EMS). In [21] an EMS was proposed whose aim was to minimize the operational costs of an MG working in grid connected mode. However, local autonomous controllers are necessary in the case of communication failures with the central controller. Those local controllers have been explained in many previous works, such as [22,23]. In [23], a distributed control scheme for the MG was proposed, in which the local controllers were linked to a central controller through a low bandwidth communication device. The central controller managed an optimal EMS.
In this paper a centralized power management algorithm of the DC bus connected DC/DC converters in a hybrid AC/DC microgrid is presented. As shown in Figure 1, the AC bus of the MG is connected to the grid, and the DC bus is connected to the AC bus through an ILC. The ILC is an AC/DC bidirectional converter which regulates the DC bus voltage, managing the power flow between the DC bus and the AC bus. If the microgrid is in island-mode, the distributed generators connected to the AC bus can regulate the AC bus voltage using droop methods. In that case, the ILC can keep regulating the DC bus voltage. The use of centralized communications among all the microgrid elements makes that task feasible [19]. A centralized control decides the status of the DGs, the loads and the energy storage system (ESS) in the MG by applying a set of predefined operation functions. The power exchange with the grid is calculated by an algorithm implemented in the microgrid central processor (MGCP). The algorithm uses the information of the PV available power, the load connected to the DC bus, the battery state of charge (SOC) and the power exchange limits provided by the grid operator. The goal of this algorithm is to import the needed power from the grid, keeping it below the limits established by the grid operator, feeding the loads and keeping the SOC inside a safe range. If a surplus of energy is available from the PV generation, power is injected to the grid below another limit imposed by the grid operator. It is worth pointing out that this work is focused on the centralized control of the power flow in the MG. It is assumed that each power converter in the MG has a local controller for operating in case of communications failure. The proposed system has a load shedding functionality at the DC bus. This function is performed when the power imported by the microgrid from the grid tends to surpass its pre-defined limits. If there is not enough energy in the distributed generators and batteries, the load shedding functionality will be activated. In addition, in order to avoid the erratic connection/disconnection of loads, a hysteresis level is introduced through a set of power thresholds. The load shedding is used in industrial practice for preventing blackouts, cascading events and the collapse of the power system [24,25,26].
The main contributions of this manuscript are (i) the definition of twelve operation functions for the management of the DC bus connected converters of the hybrid AC/DC microgrid and (ii) the implementation of load-shedding hysteresis levels in cases where the aim is to keep the battery energy backup as high as possible without exceeding a certain power limit imported from the main grid. This strategy is usually the preferred one when the electricity tariff is low [27,28]. Moreover, the experimental validation of the centralized power management algorithm in a hybrid AC/DC microgrid is shown. The power management algorithm has been implemented in a MGCP based on TMS320F28335 DSC. Both, the control and the communications of each power converter have been implemented by means of TMS320F28335 DSCs.
This paper consists of five sections. In Section 2, a description of the hybrid AC/DC microgrid under study is provided. In Section 3, several concepts of the power management algorithm are explained. In Section 4, simulation and experimental results at different scenarios of the MG are presented. Section 5 contains the conclusions of the study.

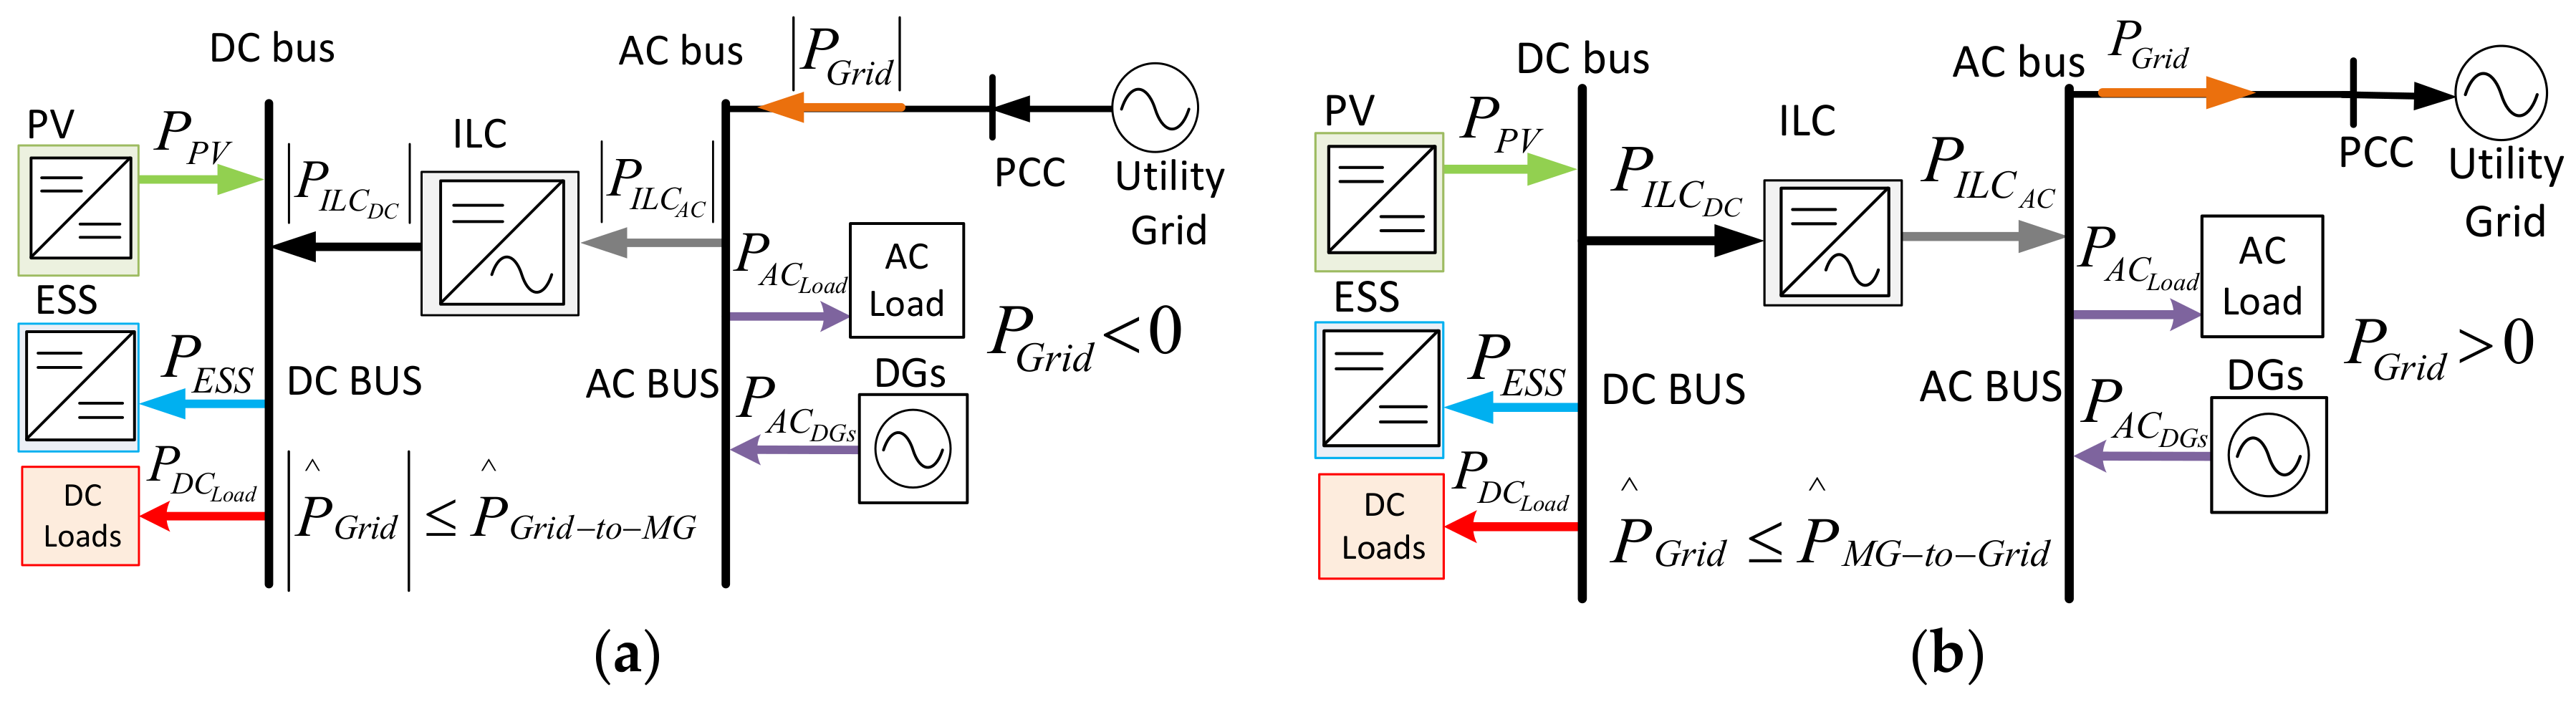
2. Description of the Hybrid AC/DC Microgrid under Study

The hybrid AC/DC microgrid is depicted in Figure 1. The parameters of the communication system inside the MG are shown in Table 1. The MG under study is based on a single DC bus and a single AC bus, connected to the Point of Common Coupling (PCC) of the public grid by means of a static switch. The connection between the DC and AC buses is performed by the ILC, allowing a bidirectional power flow. In grid connected mode, the ILC may work as a current source that injects power to the grid synchronously with the AC bus voltage. An anti-islanding protection, based on [29], has been performed on the DSP of the MGCP. In that case, the operation of the distributed generators connected to the AC bus changes to droop mode so that they can regulate the voltage at the AC bus. The ILC keeps controlling the voltage at the DC bus.
The MGCP sets the operation functions of the power converters, loads and the ESS, depending on the MG scenarios. These scenarios depend on the internal and external changes that affect the power dispatch, such as changes in the solar irradiation, the load, the ESS and the power limit established by the public grid operator.
The MGCP optimizes power sharing by applying several control actions to the microgrid devices: (i) to connect/disconnect the loads as a function of the generated power and the available energy in the batteries; (ii) to share the available power between the priority loads [30] and the ESS; (iii) to adjust the hysteresis levels for avoiding oscillation in the DC bus due the connection-disconnection of loads and (iv) to accomplish the power limits established by the grid operator. Note that the grid operator can establish different power exchange limits at any moment by means of serial communication. In fact, the power generated by the energy sources connected to the DC bus must be limited by the MGCP, in order to prevent an excessive power injection to the public grid beyond the limit set by the grid operator.
The MGCP defines the internal functionality depending on the possible scenarios of the MG. The communications allow control of the PV DGs, the ESS and the load connection/disconnection. In Figure 1, a 10 kW ILC, which connects the AC bus and the DC bus, can be observed. The AC bus is single phase and works in grid-connected mode with a grid voltage: VGrid = 230 Vrms and FGrid = 50 Hz ± 1 Hz. In the MG under study, two additional elements are connected to the AC bus: a 5 kW AC DG, and a 4 kW AC load. The nominal DC bus voltage is VDC = 420 V, being regulated by the ILC. Three elements are connected to the DC bus: a 3 kW bidirectional DC/DC converter connected to a battery bank and two 5 kW DC/DC converters connected each one to one PV array. The voltage at the battery bank (VBat) ranges from 192 V to 252 V, whereas the voltages at the PV arrays (VPV1 and VPV2) vary from 306 V to 378 V. Additionally four ‘shed-able’ 2 kW DC loads are connected to the DC bus. The loads can be connected or disconnected to/from the DC-bus by means of individual switches controlled by the MGCP (Sw1 to Sw4).

3. Management and Control of the MG

3.1. Parameters of the MGCP

In this section, several concepts and parameters of the MGCP are explained in order to define the features and control functionalities of the proposed algorithm.

3.1.1. High-Level Control Limits

The grid operator establishes a tertiary high-level control strategy which controls the power flow between the MG and the main grid. That power flow imposes a limit of the power injected from the MG to the main grid or vice versa. The limits established from the high-level control are:

Energy Dispatch Limit (EDL)

The EDL is a digital flag that is inside the MGCP which indicates that there is an energy dispatch limit in the MG, set by the grid operator. The EDL allows the MGCP to set a suitable control strategy by taking into account the values of the maximum power extracted/injected from/to the grid to/from the MG. When EDL = Off, there is no energy dispatch limit, and the MGCP can inject or extract unlimited power to/from the grid. In the opposite case (EDL = On), the MGCP establishes a set of power management criteria which depends on the load connected to the AC or DC buses, the power available in the MG and the SOC of the batteries.

Maximum Power Extracted from the Grid

The power flow scenarios between the grid and the MG are shown in Figure 2. Two general cases are possible: PGrid < 0 and PGrid > 0, being the power flow from the main grid to the microgrid or vice versa. Parameter P ^ Grid - to - MG is established by the grid operator and represents the maximum power that can be extracted from the main grid to the MG, | P Grid | P ^ Grid - to - MG .

Maximum Power Injected to the Grid

Parameter P ^ MG - to - Grid stands for the maximum power that can be injected from the MG to the main grid. This parameter is established by the grid operator, imposing the condition, P Grid P ^ MG - to - Grid .

3.1.2. Parameters of the MGCP

The MGCP establishes some parameters for the secondary control strategy, which is responsible for the power flow between the AC bus and the DC bus of the MG. The MGCP must limit the power generated by the RESs, if the available power is higher than that necessary at the MG buses.

Maximum Power Extracted from the AC Bus to the DC Bus Measured at the AC Side of the ILC

The power that flows from the grid to the MG is depicted in Figure 2a. In that case (PGrid < 0 and PILC_AC < 0), the value of PILC_AC can be calculated by Equation (1). The parameter P ^ ILC AC | Grid - to - MG stands for the maximum power which can be extracted from the AC bus to the DC bus. This power is measured at the AC side of the ILC (2). The value of P ^ ILC AC | Grid - to - MG depends on the MGCP, because the value of P ^ Grid - to - MG is set by the MGCP. The absolute value of PILC_AC must meet the condition expressed by Equation (3) at any time, taking into account the rated power of the ILC.
P ILC AC = P AC DGs + | P Grid | P AC Load
P ^ ILC AC | Grid - to - MG = P AC DGs + P ^ Grid - to - MG P AC Load
| P ILC AC | MIN ( P I L C R a t e d ,   P ^ I L C A C | G r i d t o M G )

Maximum Power Injected from the DC Bus to the AC Bus Measured at the AC Side of the ILC

The power that flows from the MG to the grid is depicted in Figure 2b. In that case (PGrid > 0 and PILC_AC > 0), the value of PILC_AC can be calculated by Equation (4). Parameter P ^ ILC AC | MG - to - Grid stands for the maximum power which can be injected from the DC bus to the AC bus, measured at the AC side of the ILC (5). The maximum power injected from the DC bus to the AC bus by the ILC must meet the conditions of Equation (6).
P ILC AC = P Grid + P AC Load P AC DGs
P ^ ILC AC | MG - to - Grid = P ^ MG - to - Grid + P AC Load P AC DGs
P ^ ILC AC MIN ( P I L C R a t e d ,   P ^ I L C A C | M G t o G r i d )

PV Power Generated in the DC Bus

The power outputs generated by the PV DGs connected to the DC bus are measured individually. Parameter PPV is the overall PV power generated in the DC bus of the MG. The total power generated by two PV DC/DC converters connected to the DC bus is shown in Equation (7).
P PV = P PV 1 · η PV 1 + P PV 2 · η PV 2

Power Consumed by the Loads Connected to the DC and AC Buses

The power consumed by the loads connected to the DC bus is P DC Load = I DC Load · V DC and to the AC bus is P AC Load = I AC Load rms · V Grid rms .

Maximum Power Consumed by the Loads Connected to the DC Bus

Parameter P ^ DC Load stands for the maximum overall power which the DC loads are allowed to consume. The load shedding functionality at the DC bus performed by the MGCP depends on this parameter. P ^ DC Load P ILC Rated establishes an upper limit for the maximum power as a function of the ILC power rating.

PV Power Limit

Parameter PPV_Lim is the maximum power that should be extracted from the PV sources at any time, so that it can be consumed by the DC loads and by the batteries (PESS > 0) and/or it injected into the grid. PPV_Lim is represented by Equation (8), where PESS = (VBat·IBat)/ηESS.
P PV Lim = P ^ ILC AC | MG - to - Grid + P DC Load + P ESS

PV Generation Power Available in the DC Bus

Parameter PAvailableDC_MG is the extra power available from the PV DGs of the DC bus after feeding the load connected in the DC bus. The available PV generation power is defined by Equation (9).
P Available DC _ MG = P PV P DC Load

DC Load Switch

The flag of DC load switch takes two possible states, SwLoad = On and SwLoad = Off, depending on the connection or disconnection of loads to the DC bus, respectively.

DC Load Hysteresis

Parameter DCLoad_hyst is calculated as 10% of the overall power consumed by the DC loads, DC Load hyst = 0.1 · P DC Load . DCLoad_hyst is the hysteresis level which has been established for avoiding erratic connection/disconnection of the loads.

Power Consumed for the Batteries to C10

Parameter PESSC10 is the maximum power consumption for the charge of the batteries of the ESS, PESSC10 = (VBat·IC10)/ηESS. It has been established that the batteries are charged with a current equal to IC10 = C10/10, where C10 the specified battery capacity (measured in A·h) for a discharge time of 10 h.

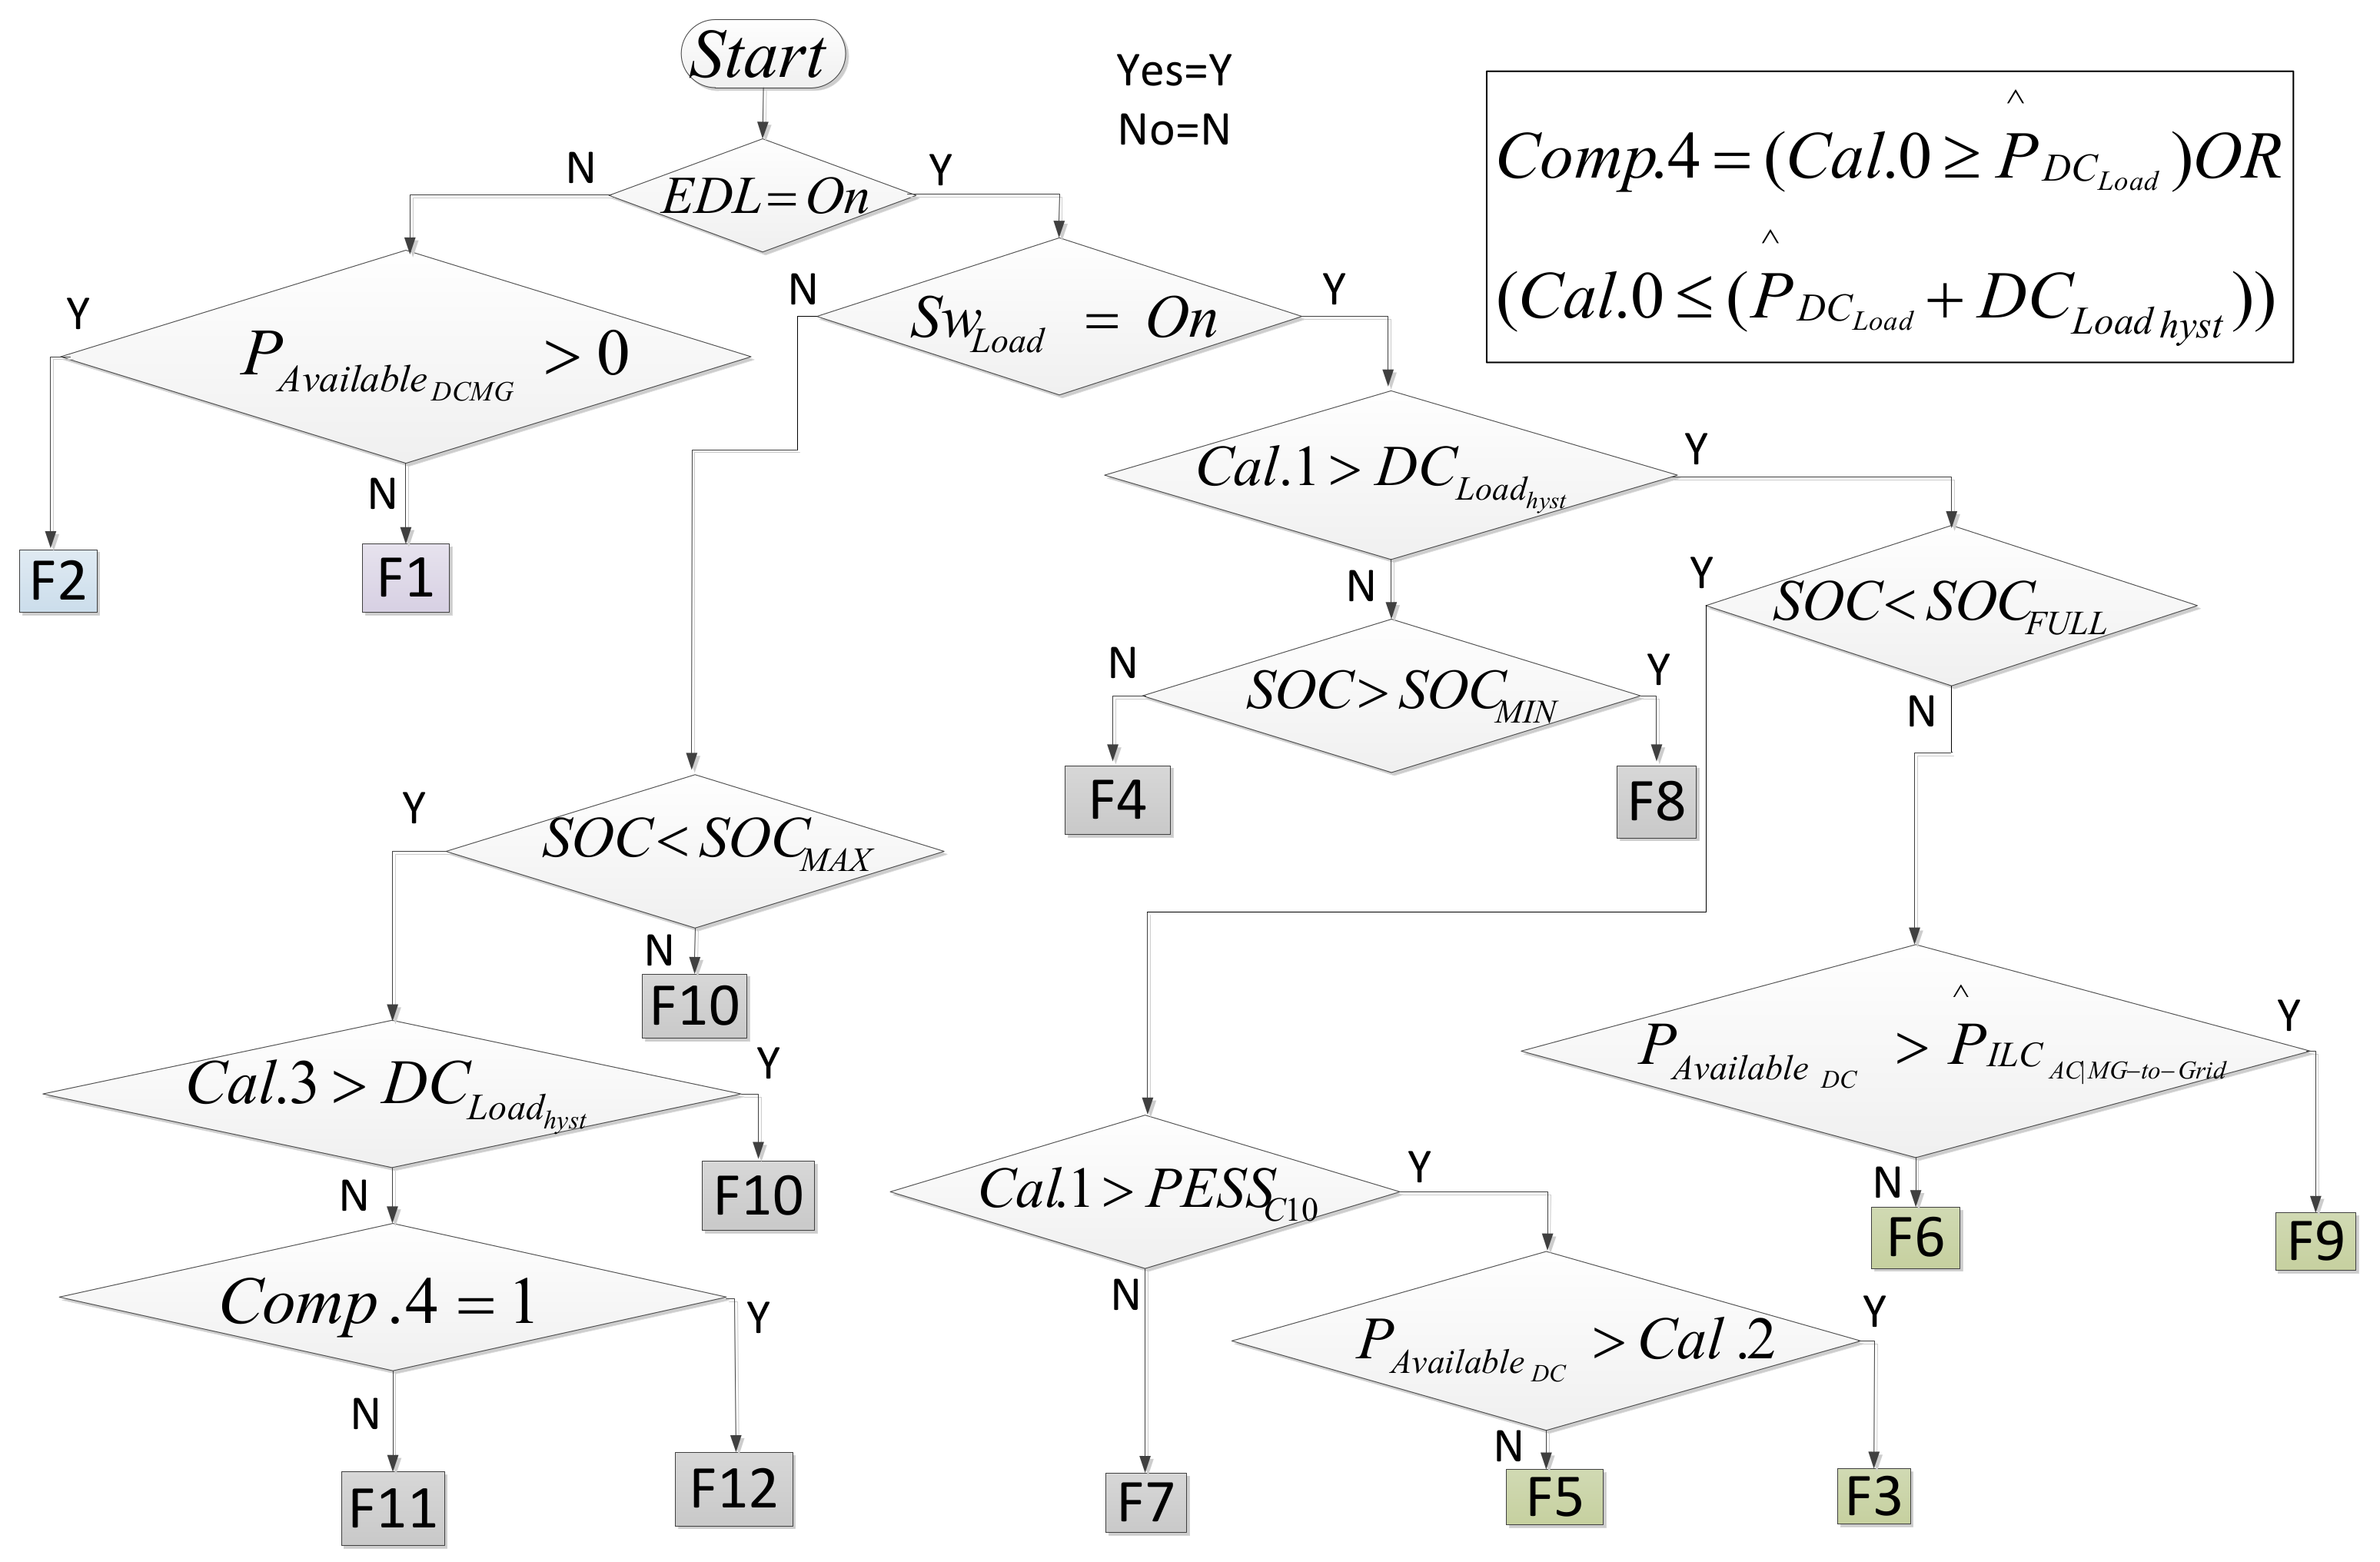
3.2. Power Management Algorithm

Several calculations and functions are necessary for the suitable power management of the MG control algorithm. These calculations and functions depend on the SOC of the battery, the availability of power in the buses, the limits set by the grid operator and the status of SwLoad.

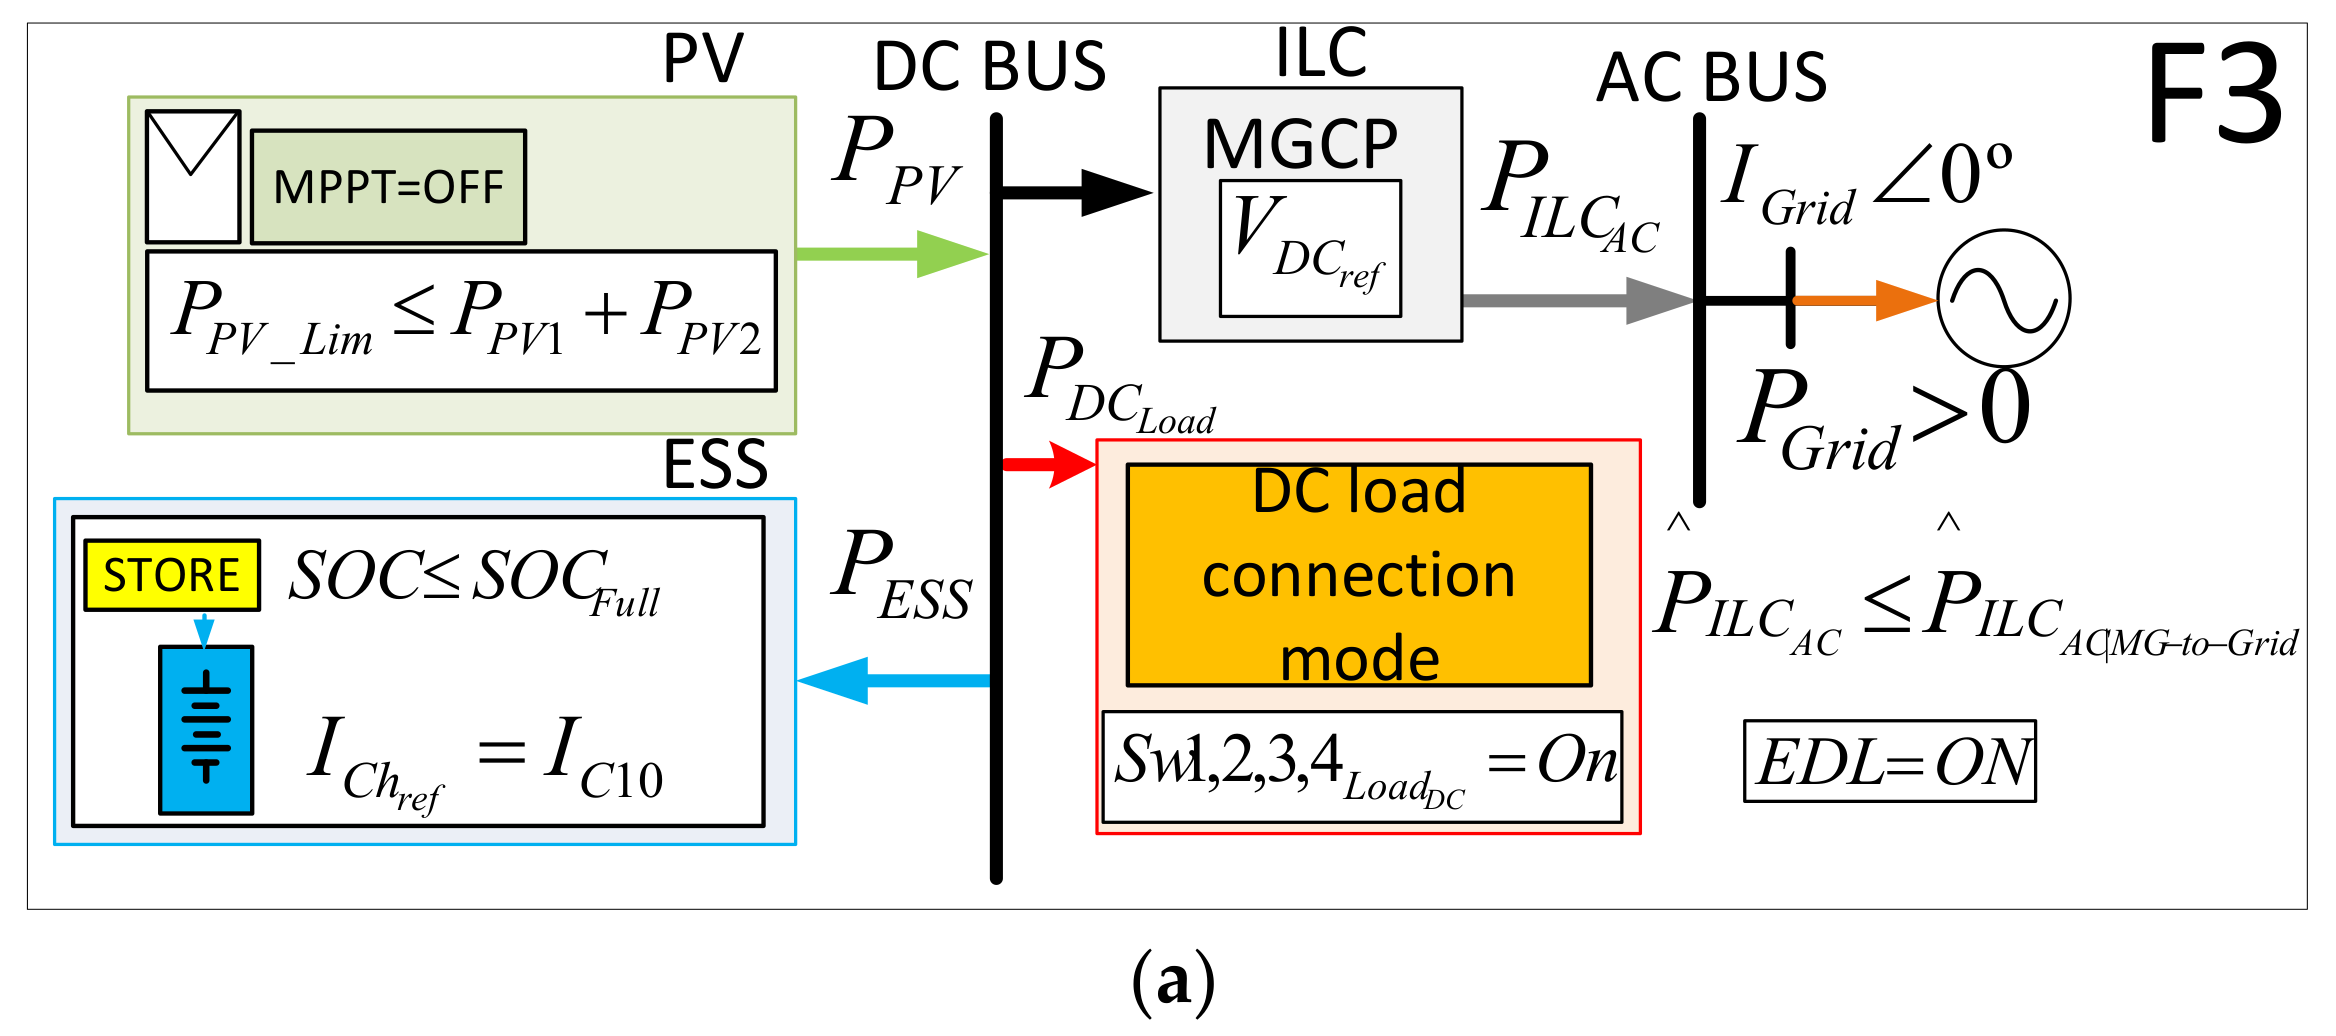
3.2.1. Operation Functions of the MGCP

The power management algorithm embedded in the MGCP executes 12 operation functions according to the various operating scenarios. The operation functions of the MGCP and their interactions with the power converters of the MG are described in the following paragraphs.

Operation Functions in DC Load Connection Mode (SwLoad = On)

Function 1 (F1): All DC loads are fed. When SOCSOCFull (SOCFull = 100%), the DC/DC converter of the ESS charges the batteries from the DC bus with a current (IC10). The PV DGs work at their maximum power point (MPP), so that MPPT = On. If there is not enough power available from the PV DGs connected to the DC bus, the ILC can extract the rest of the power from the AC bus with the only restriction being | P ^ ILC AC | P ILC Rated , taking into account that EDL = Off.
Function 2 (F2): All DC loads are fed. When SOCSOCFull; the DC/DC converter of the ESS charges the batteries from the DC bus with a current equal to IC10. The PV DGs work at their MPP (MPPT = On). In this case, the PV DGs connected to the DC bus may produce excess power which can be injected into the AC bus by the ILC if necessary, with the only limitation being its rated power: P ^ ILC AC P ILC Rated .
Function 3 (F3): All DC loads are fed. When SOCSOCFull; the DC/DC converter of the ESS charges the batteries from the DC bus with a current equal to IC10. The PV DGs do not work at their MPP (MPPT = Off). In this case the PV DGs connected to the DC bus produce a limited amount of power, because the power which can be injected to the AC bus by the ILC is limited by the grid operator. The power injected from the DC to AC bus by the ILC is given by: P ILC AC P ^ ILC AC | MG - to - Grid . Figure 3 depicts the power dispatch inside the MG after applying the operation functions: F3, F8, F10 and F11.
Function 4 (F4): All DC loads are disconnected. When SOCSOCMIN (SOCMIN = 20%), the ESS is in standby mode. The flag SwLoad changes from On to Off, entering the DC load disconnection mode. The PV DGs work at their MPP (MPPT = On).
Function 5 (F5): All DC loads are fed. While SOCSOCFull, the DC/DC converter of the ESS charges the batteries from the DC bus with a current equal to IC10. The PV DGs work at their maximum power point (MPPT = On). The ILC injects the excess power at the DC bus to the AC bus. The power injected to the AC bus must comply with the following conditions: P ILC AC P ^ ILC AC | MG - to - Grid .
Function 6 (F6): All DC loads are fed. As the SOC has reached SOCFulll, the DC/DC converter of the ESS stops charging the batteries, putting the ESS in standby mode. The PV DGs work at their MPP (MPPT = On), producing an excess of power which can be injected to the AC bus by the ILC.
Function 7 (F7): All DC loads are fed. While SOCSOCFull, the DC/DC converter of the ESS charges the batteries from the DC bus with a current whose value is shown by Equation (10) which is smaller than IC10. The PV DGs work at their MPP (MPPT = On). If there is not enough power available from the PV DGs, the ILC can extract the rest of power from the AC bus subject to the following limit: | P ILC AC | P ^ ILC AC | Grid - to - MG .
I Ch ref = MIN ( I C 10 ,   P A v a i l a b l e D C _ M G + P ^ I L C A C | G r i d t o M G V D C )
Function 8 (F8): All DC loads are fed. When SOCSOCMIN, the DC/DC converter of the ESS operates as a controlled current source discharging the batteries to the DC bus. In F8, the PV DGs work at their MPP (MPPT = On). The sum of the power coming from the ESS and from the PV DGs is not enough to energize the DC loads, so that the required extra power can be transferred from the AC bus to the DC bus through the ILC. That extra power is limited in order not to override the power which can be absorbed by the DC loads. Equation (11) shows the expression of the discharge current. In this case, the extra available power is negative (PAvailableDC_MG < 0), because the power coming from the PV DGs is not enough to energize the DC loads. The power flows in the MG when F8 is active are shown in Figure 3b.
I Dis ref = MIN ( I C 10 ,   | P Available DC _ MG + P ^ ILC AC | Grid - to - MG V bat | )
Function 9 (F9): All DC loads are fed. As the SOC has reached SOCFull, the DC/DC converter of the ESS stops charging the batteries and enters standby mode. The PV DGs do not work at their maximum power point (MPPT = Off), because the DC loads cannot absorb the sum of MPP powers. The ILC injects a limited amount of power from the DC to the AC bus which is the required extra power to feed the DC loads.

Operation Functions in DC Load Disconnection Mode (SwLoad = Off)

Function 10 (F10): In F10, the flag SwLoad switches from Off to On. All DC loads are fed. The ESS is in standby mode. The PV DGs work at their MPP (MPPT = On). The power flows in the MG when F10 is active are shown in Figure 3c.
Function 11 (F11): Some DC loads are fed by the load shedding functionality, as is shown in Figure 4. This function each of the DC loads on and off automatically. While SOCSOCMAX (SOCMAX = 80%), the DC/DC converter of the ESS charges the batteries with a current smaller than IC10, given by Equation (10). The power flows in the MG when F11 is active are shown in Figure 3d. Cal.0 is the calculation of the available PV power plus the maximum power that can be transferred from the AC bus to the DC bus by the ILC. This expression is shown in Equation (12). A decision tree can be observed in Figure 4, which depicts how 1 to 4 DC loads are connected–disconnected as a function of the value of Cal.0. If Cal.0 is not enough to energize all the DC loads, F11 begins their disconnection depending on the values of Cal.0 and the state (1 or 0) of the logic variables, Comp.1 to Comp.3, which are calculated as AND functions. Note that a 10% hysteresis band of the power of one DC load has been chosen for establishing the comparison: DCLoad_hyst = 0.1·2 kW = 0.2 kW.
Cal . 0 = P PV + P ^ ILC AC | Grid - to - MG
Function 12 (F12): All DC loads are fed. When SOCSOCMAX, the DC/DC converter of the ESS charges the batteries with a current smaller than IC10, given by Equation (10). The PV DGs work at their MPP (MPPT = On). If the power coming from the PV DGs is not enough to energize the DC loads, the required extra power can be transferred from the AC to the DC bus through the ILC.

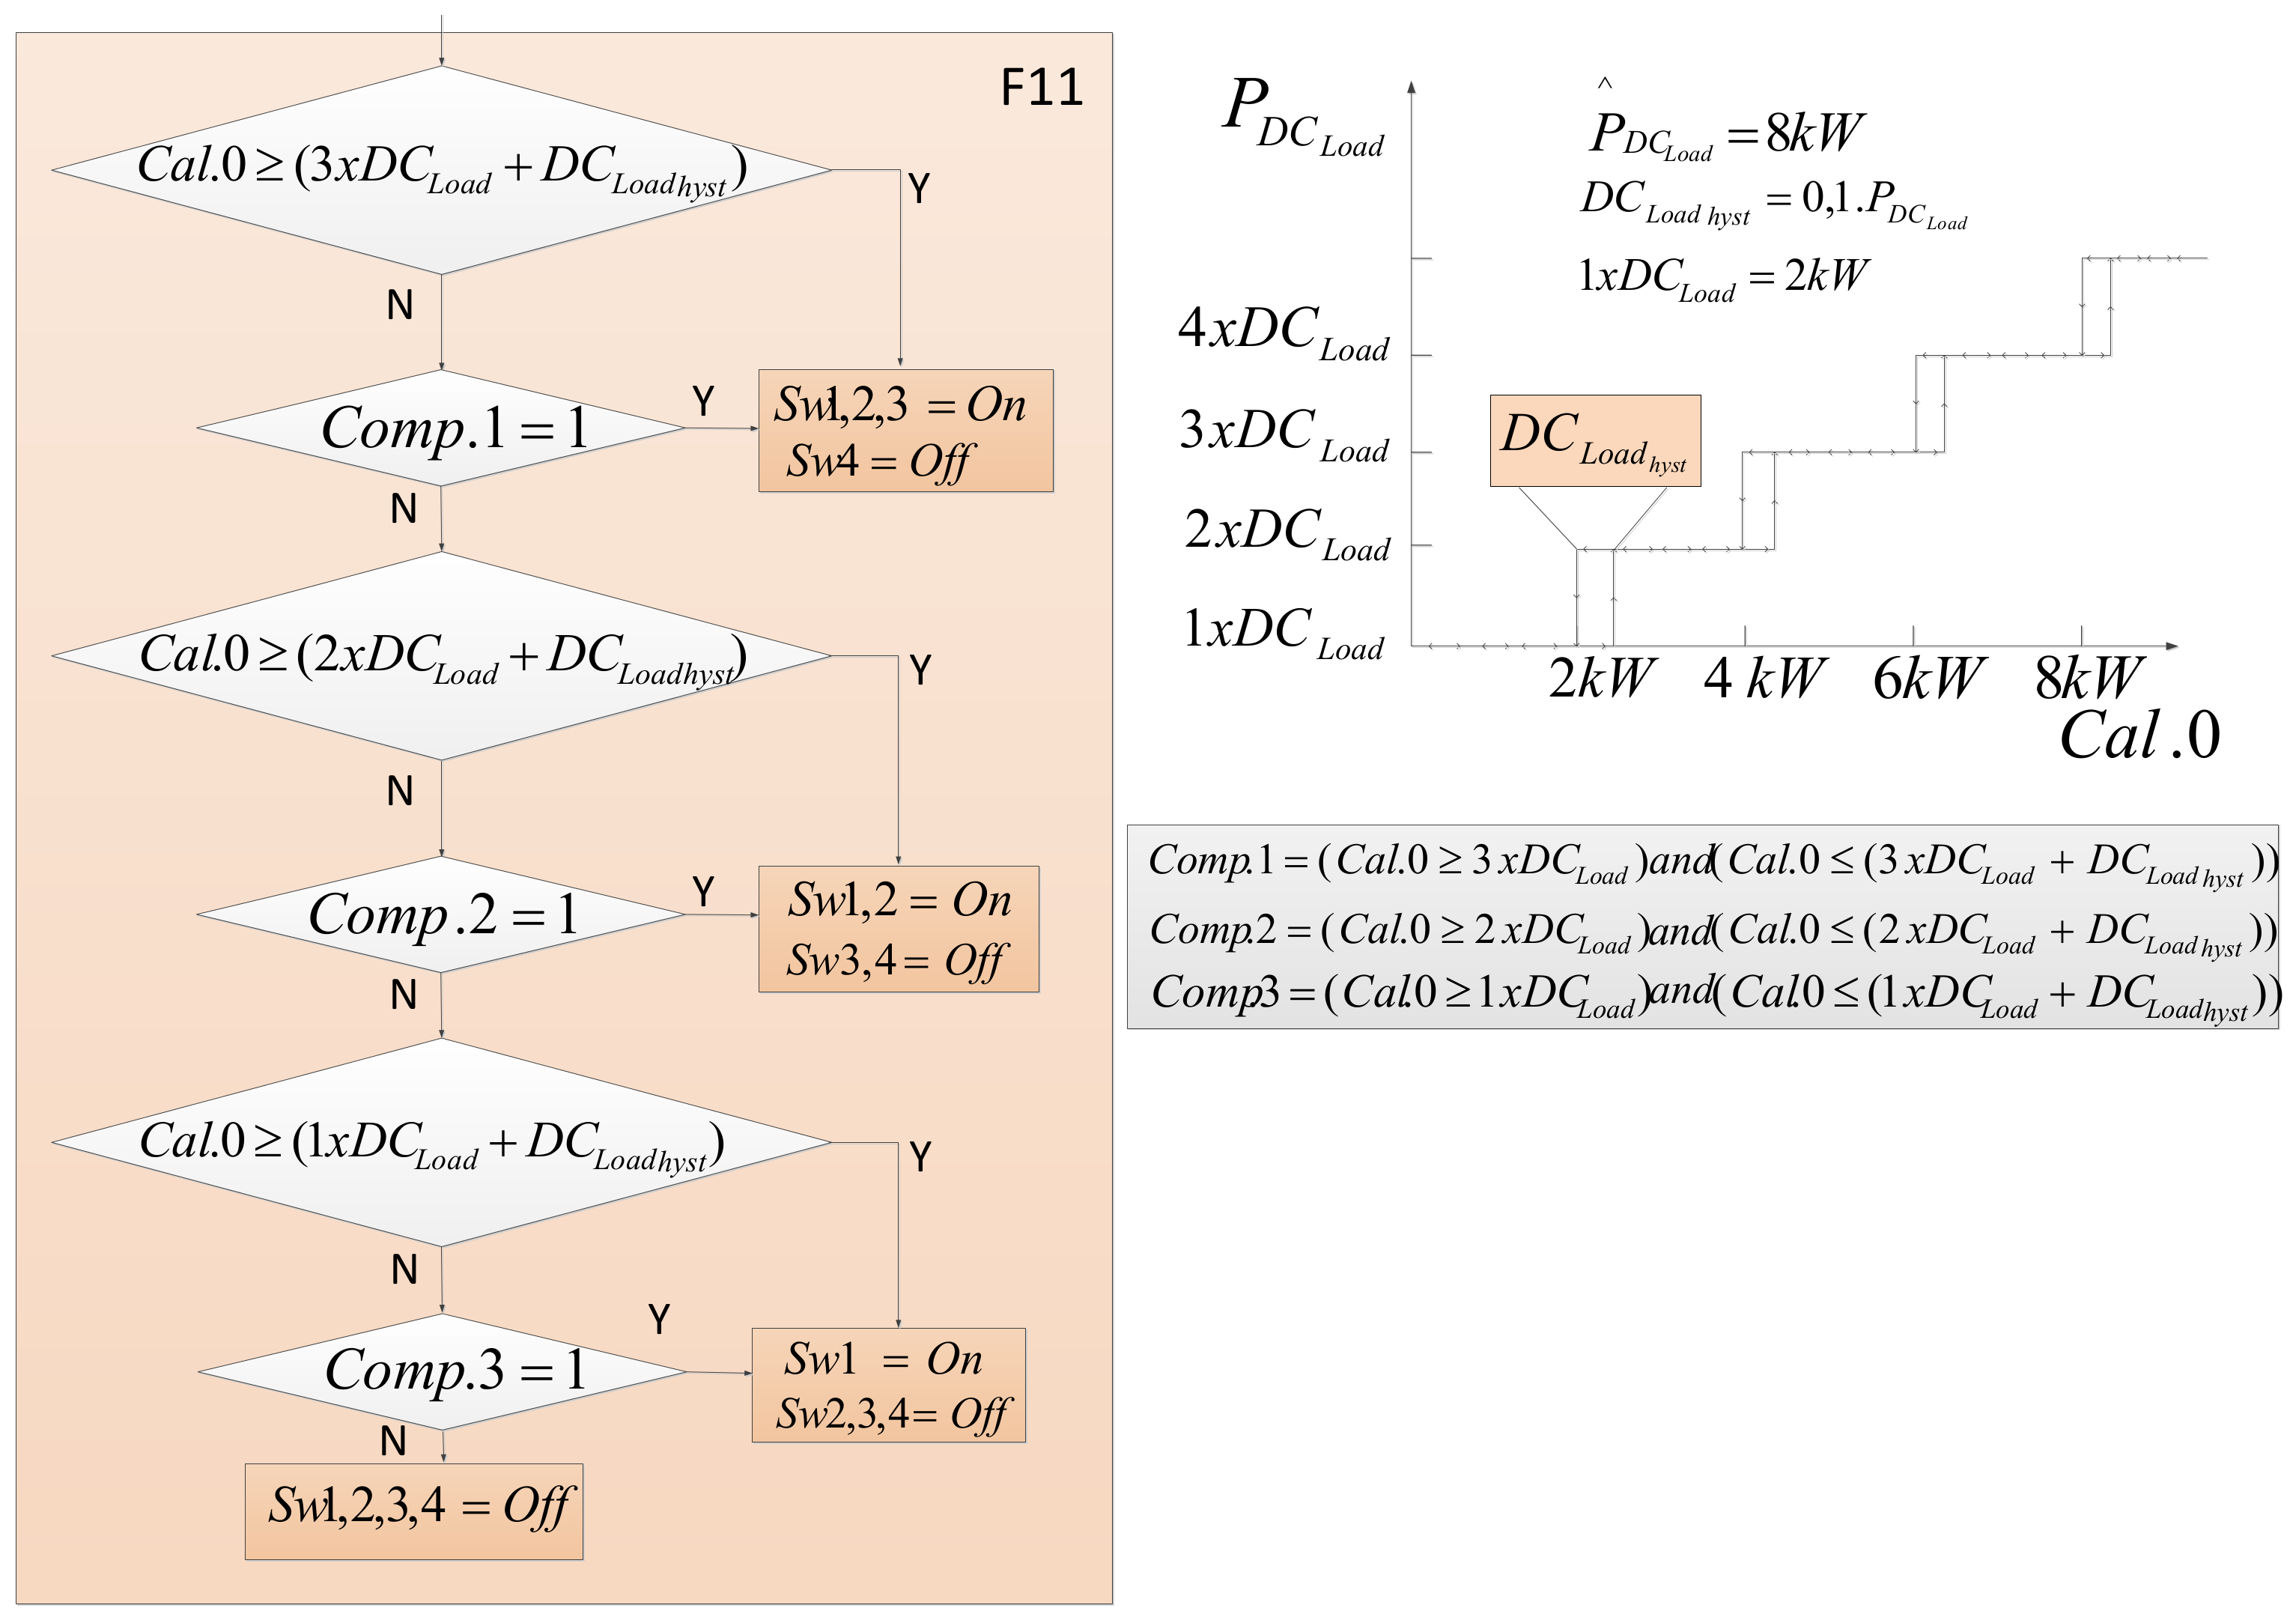
3.2.2. Power Management Algorithm of the MG

The flow diagram of the power management algorithm is shown in Figure 5. Comp.4 is a logic variable calculated as an OR function. The flags, SwLoad and EDL, are fundamental parameters for the power dispatch in the MG. When EDL = Off, there is no energy dispatch limit, so that functions F1 or F2 can be applied. When EDL = On and SwLoad = On, the MGCP applies functions F3 to F9. The flag SwLoad can be turned Off by F4; after that, the MGCP can apply functions F10 to F12. The functions are implemented so that the power transfer limits between both buses are not exceeded. The calculations performed by the power management algorithm, Cal.0 to Cal.4, are shown in Equations (12)–(15) and allow the power availability of both buses to be checked, taking into account their power dispatch limits.
Equation (13) stands for the power availability in the DC bus coming from DGs and batteries plus the maximum power which can be extracted from the AC bus to the DC bus.
Cal . 1 = P Available DCMG + P ^ ILC AC | Grid - to - MG
Equation (14) stands for the maximum power that can be injected from the DC to the AC bus plus the power consumed for charging the batteries at a current (IC10).
Cal . 2 = P ^ ILC AC | MG - to - Grid + P ESS C 10
Equation (15) stands for the power available in the DC bus plus the maximum power which can be extracted from the AC bus to the DC bus.
Cal . 3 = P PV + P ^ ILC AC | Grid - to - MG P ^ DC Load

4. Simulation and Experimental Results

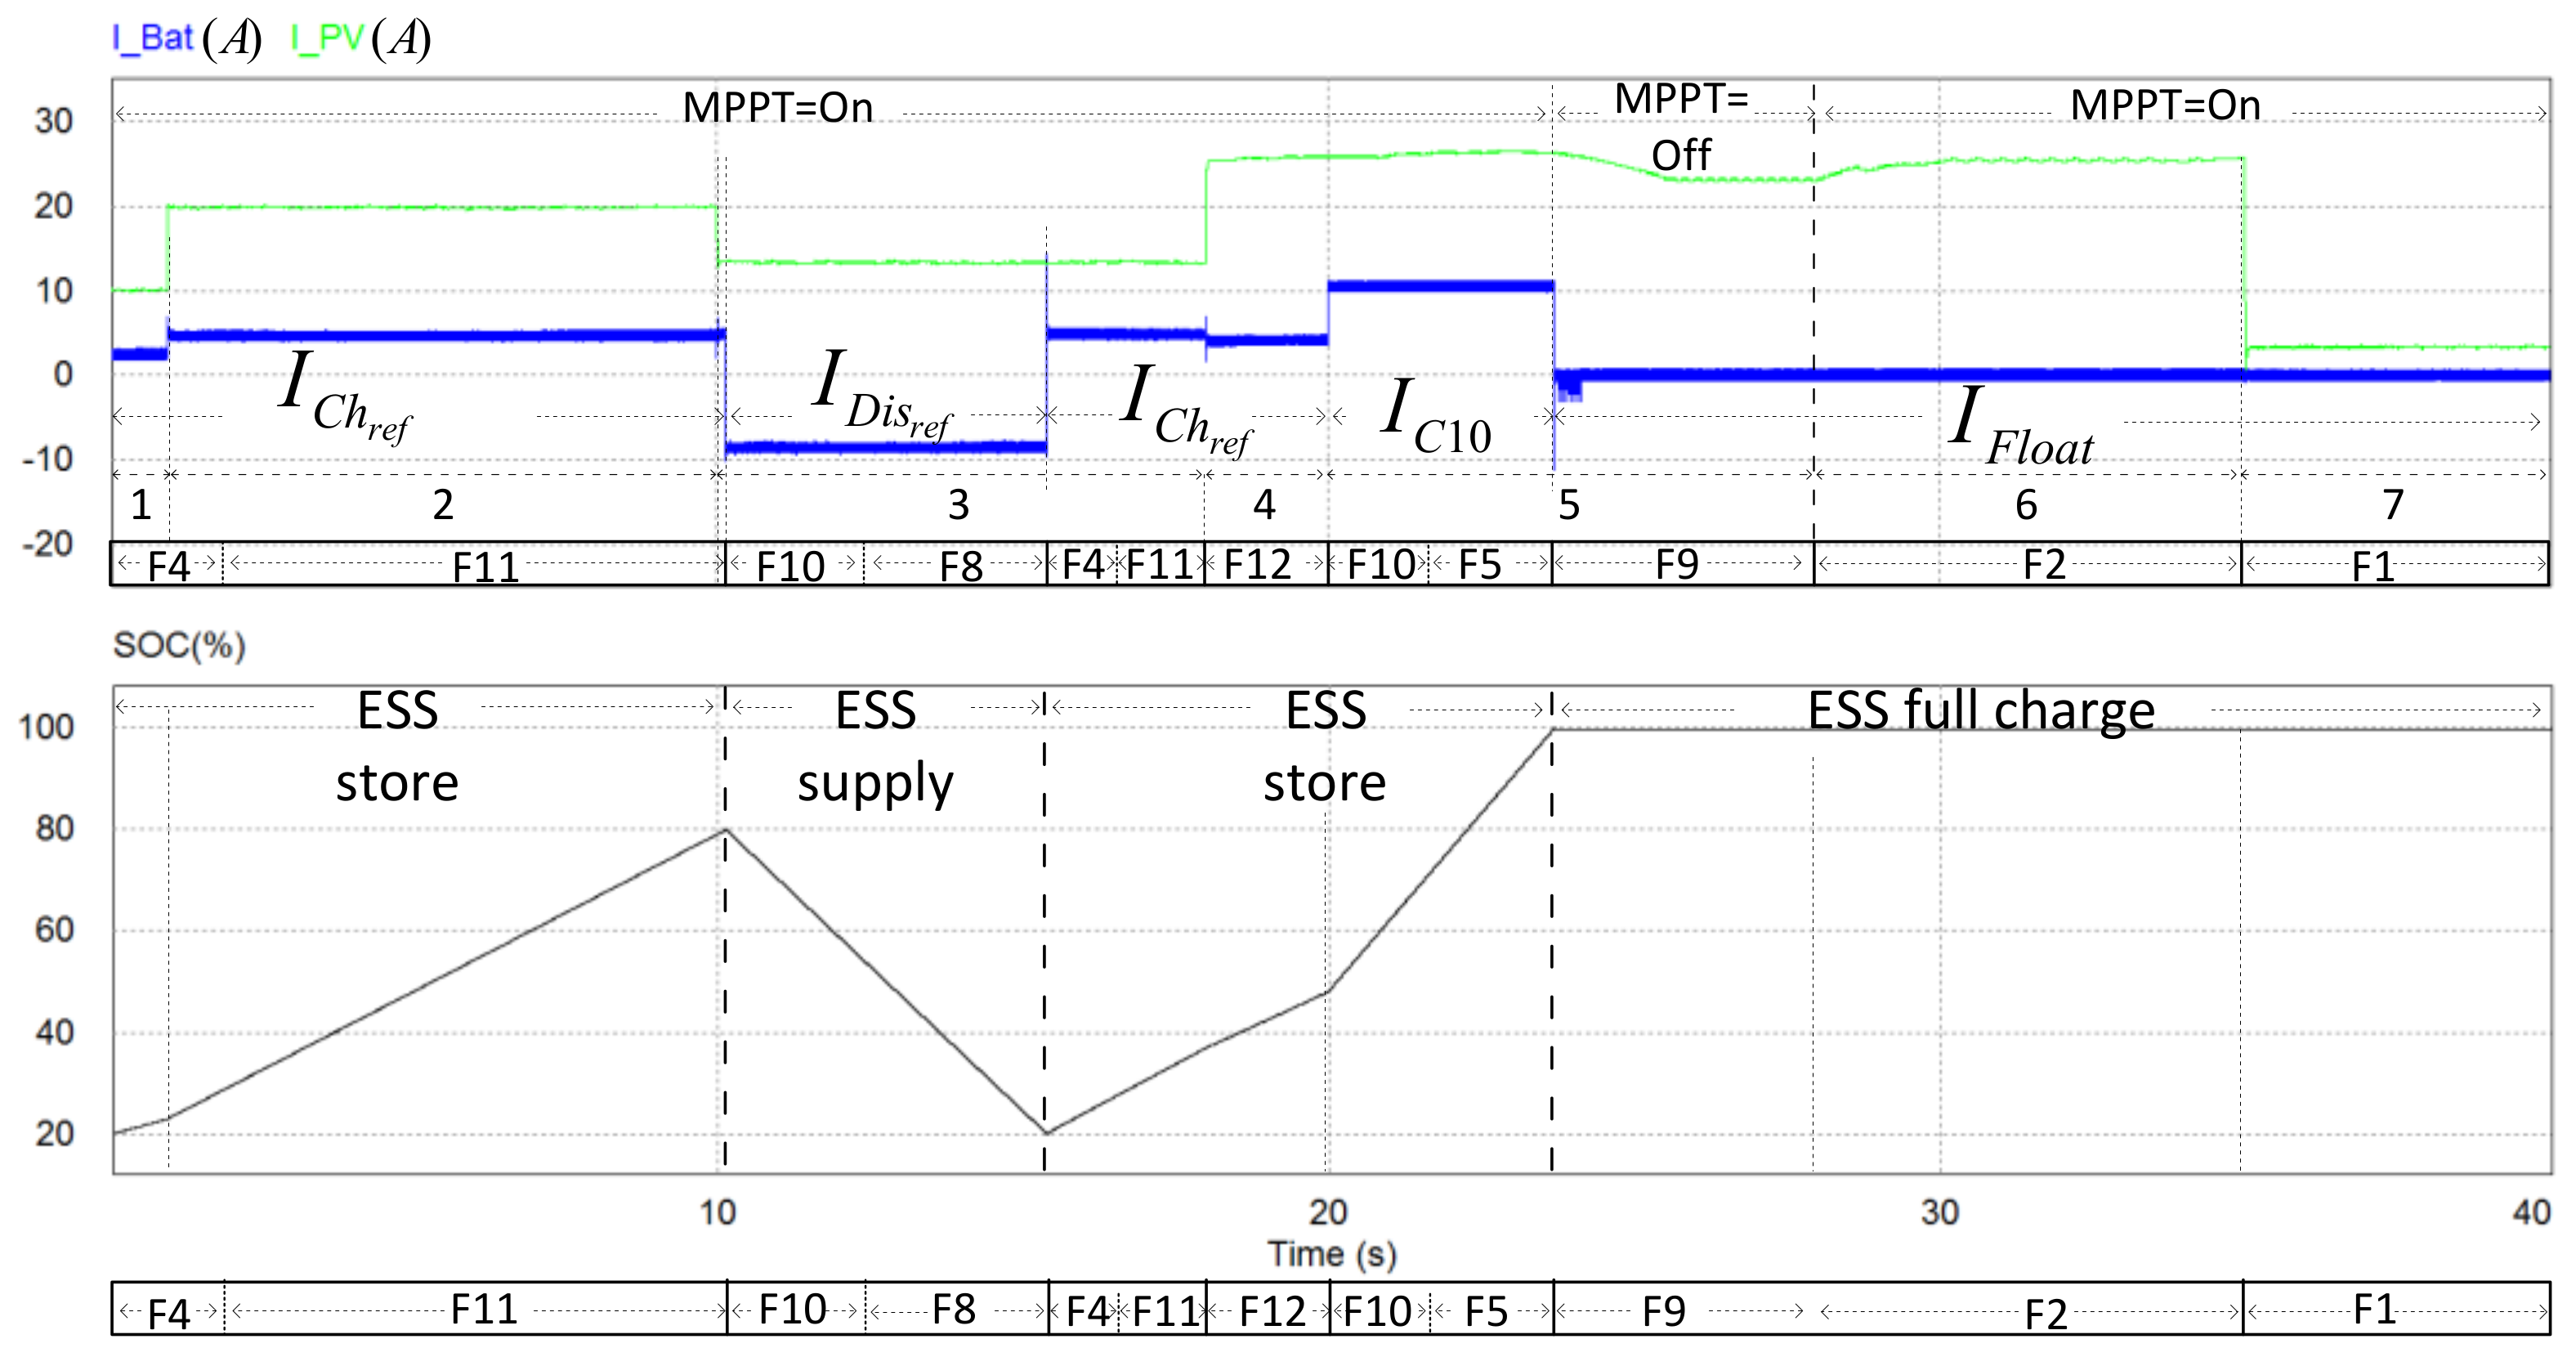
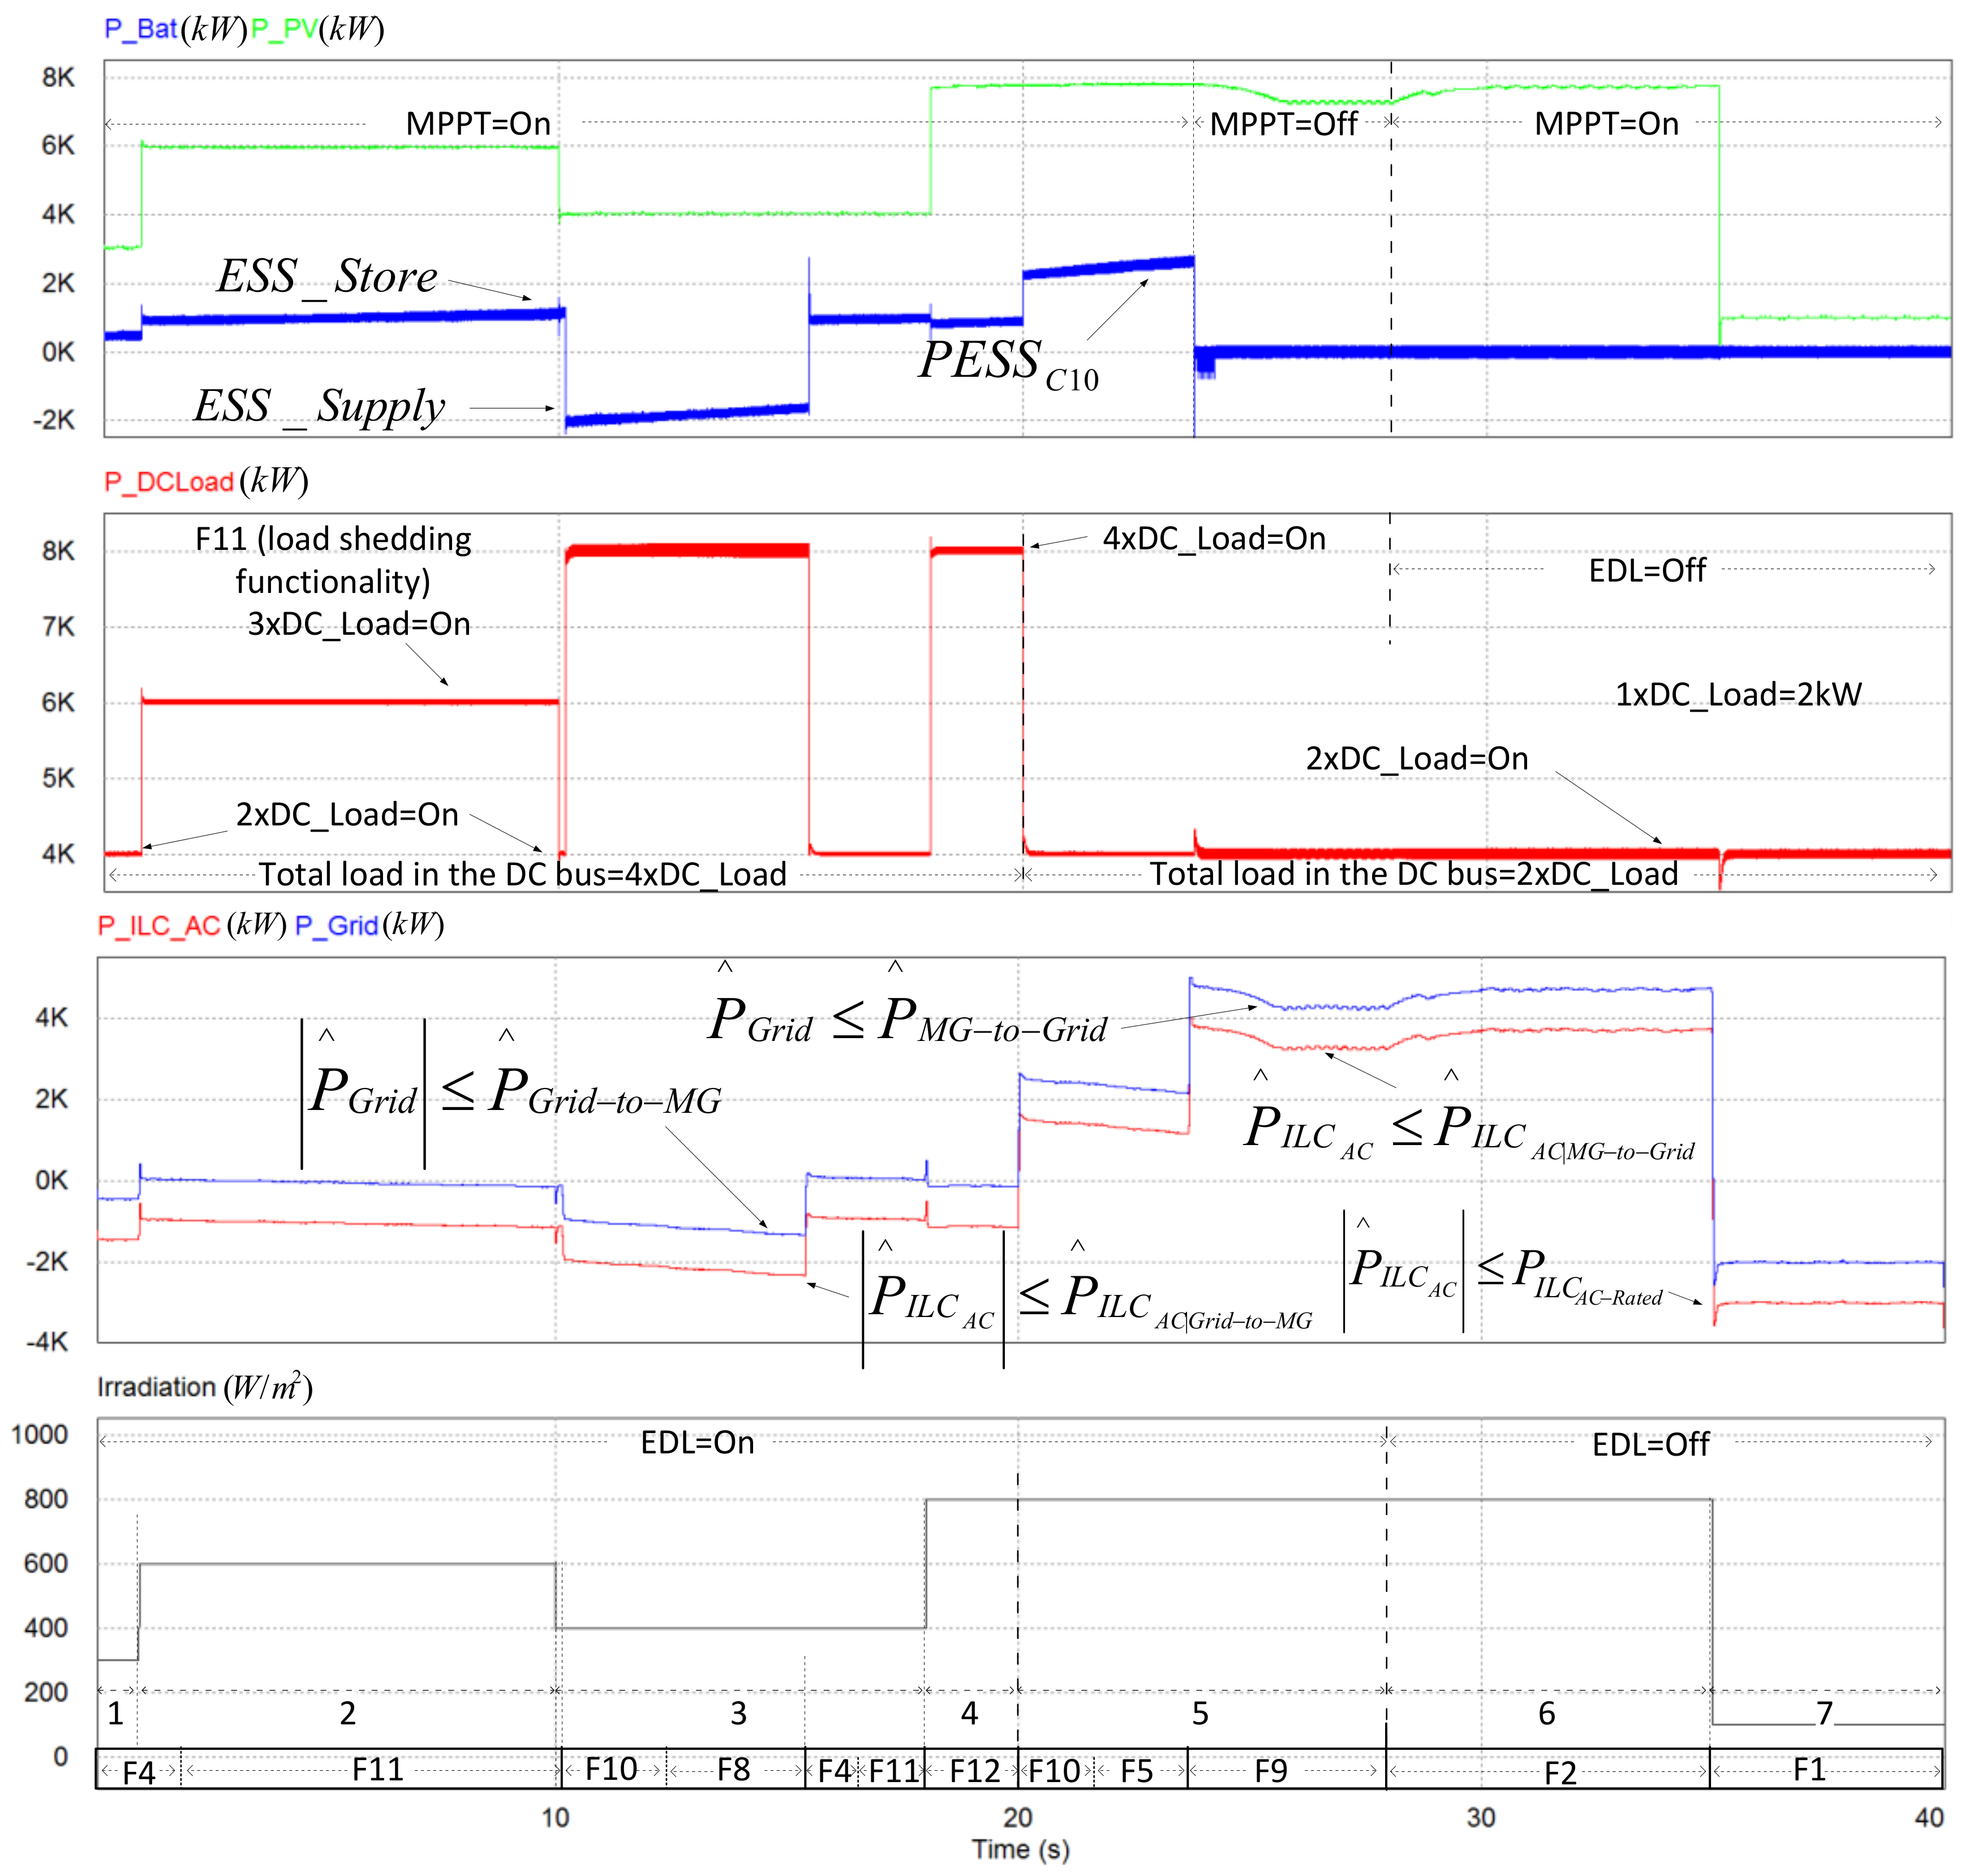
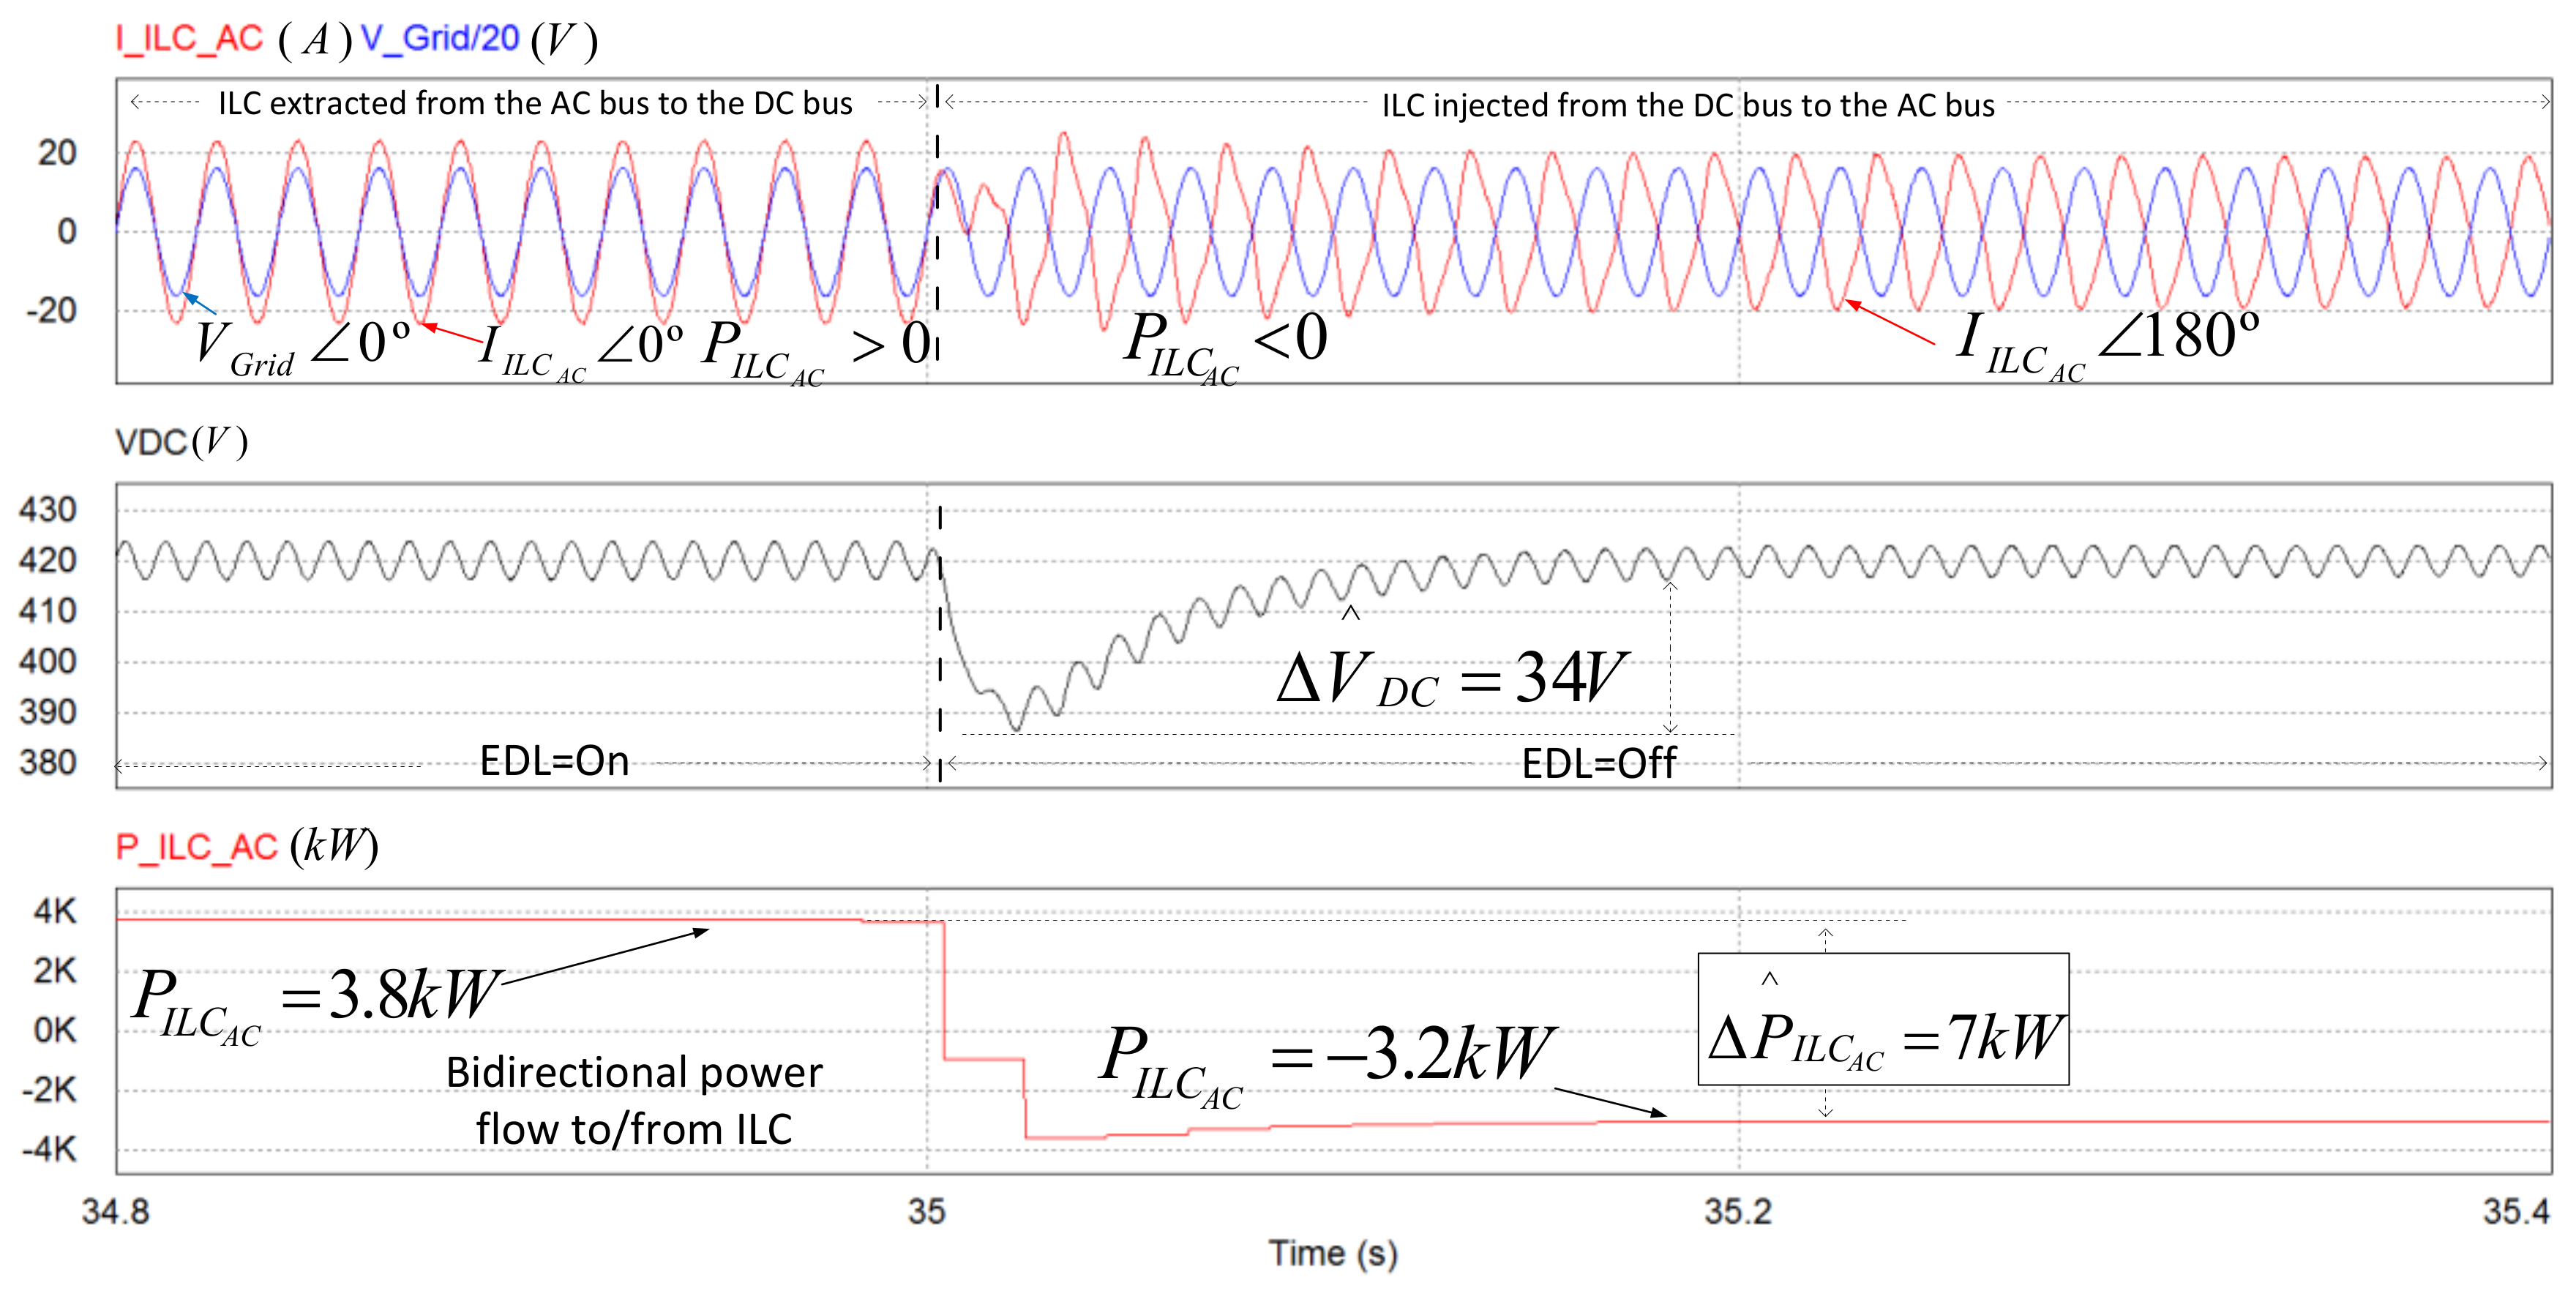
4.1. Simulation Results

The proposed power management algorithm has been simulated by means of PSIM™ [31] under various scenarios. This study is focused on the particular case in which the MG is operating in grid connected mode. The characteristics of the power electronic converters comprising the MG are listed in Table 2. The simulation scenarios of the MG are explained in Table 3. It is worth pointing out that step changes of irradiation shown in Table 3 do not correspond to reality, but they allow us to study the behavior of the MG and the stability of the buses in very extreme cases. In order to check of the proposed algorithm in different situations with a short simulation time, the algorithm was run in simulations at 25 Hz. The duration of the operation functions F4 and F10 is one clock cycle (40 ms), because their main function is to change the load shedding functionality. It is assumed that the ESS is initially discharged (SOCSOCMIN). A selected number of possible scenarios have been studied in order to demonstrate the suitable behavior of the MG in its most common and critical situations. In the scenarios under study, step changes of the irradiation, the DC load and the EDL were considered, as can be observed in Table 3. The behavior of the proposed algorithm and the application of particular functions F1 to F12 by the MGCP can be observed from the following graphs: Figure 6 depicts the behavior of the currents, IBat, IPV = IPV1 + IPV2, and of the SOC versus time. The evolution of the powers, PBat, PPV, PDCLoad, PILC_AC and PGrid, can be observed in Figure 7. Figure 8 provides detail about the most sudden transients of IILC_AC, VDC and PILC_AC, which take place throughout the whole simulation, corresponding to the time span, 34.8 s to 35.4 s. The analysis is performed according to the following time intervals:
Interval 1 (0 ≤ t < 1 s): This interval is divided into two subintervals.
0 ≤ t < 40 ms: At t = 0 s, the ESS is initially discharged (SOCSOCMIN). The irradiation is 300 W/m2 and the overall DC load absorbs 8 kW. Due to the fact that the PV available power, PPV, at that low irradiation level is not enough to feed the loads, the MGCP applies function F4, internally activating flag SwLoad = Off.
40 ms ≤ t < 1 s: After to F4, F11 is applied to disconnect two DC loads (overall DC load = 4 kW), and the batteries are charged with a current given by Equation (10).
Interval 2 (1 s ≤ t < 10 s): At t = 1 s, the irradiation undergoes a change from 300 W/m2 to 600 W/m2, whereas the SOC keeps growing below SOCMAX. The MGCP goes on applying F11. The PV generation is increased and F11 connects an additional 2 kW DC load (overall DC load = 6 kW) to the DC bus. The MGCP makes both PV DC/DC converters operate at their MPP, whereas the DC bus voltage is regulated to 420 V by the ILC.
Interval 3 (10 s ≤ t ≤ 18 s): This interval is divided into five subintervals.
10 ≤ t < 10.2 s: At t = 10 s, the irradiation decreases from 600 W/m2 to 400 W/m2, whereas the SOC keeps growing below SOCMAX. The MGCP maintains F11. The power generated by the panels, PPV, with this irradiation is insufficient to feed three loads, and F11 disconnects one load (DC load = 4 kW) in the DC bus.
10.2 s ≤ t < 10.24 s: At t = 10.2 s the SOC surpasses SOCMAX, whereas the irradiation stays at a constant value of 400 W/m2. The MGCP applies F10 after detection of SOCMAX, which internally activates the flag, SwLoad = On.
10.24 s ≤ t < 15.4 s: At t = 10.24 s, the generated PV power at the current irradiation level is not enough to feed all the DC loads, so that the MGCP applies F8 in order to get additional power from the ESS, and the battery bank is discharged at a current given by (11). F8 connects all DC loads (8 kW) to the DC bus and extracts power from the AC bus taking into account the limit that the maximum power that can be extracted of the same ( | P ILC AC | ( P ^ ILC AC | Grid - to - MG ) , and the ESS injects the current required by the DC bus to feed the DC loads.
15.4 s ≤ t < 15.44 s: At t = 15.4 s the SOC goes below SOCMIN, so that the MGCP applies F4, internally activating flag SwLoad = Off.
15.44 s ≤ t < 18 s: At t = 15.44 s, the MGCP applies F11. F11 disconnects two DC loads (overall DC load = 4 kW), so that the batteries are charged with a current given by (10).
Interval 4 (18 s ≤ t < 20 s): At t = 18 s, the irradiation undergoes a linear change of 400 W/m2 to 800 W/m2, being SOC < SOCMAX. The generated PV power and the extracted power from the AC bus are enough to feed all DC loads. Due to limitations on the amount of power that can be interchanged between the buses, the MGCP applies F12, and the batteries are charged with a current given by Equation (10). F12 connects all the DC loads and also sets the PV sources at their MPP.
Interval 5 (20 s ≤ t < 28 s): This interval is divided into three subintervals.
20 ≤ t < 20.04 s: The irradiation keeps a constant 800 W/m2 value, whereas SOC remains below SOCFull. At t = 20 s, the load connected to the DC bus decreases from 8 kW to 4 kW. The PV-generated power (PPV) at the current irradiation is enough to feed all DC loads. The MGCP applies F10 which internally activates the flag, SwLoad = On.
20.04 ≤ t < 23.7 s: At t = 20.04 s, MGCP applies F5. F5 sets the charge the batteries with a current (IC10). The PV sources work at their MPP. The ILC injects the power excess to the AC bus.
23.7 s ≤ t < 28 s: Both the irradiation (800 W/m2) and the DC load (4 kW) remain constant, whereas the SOC has reached 100%. The power generated by the panels is higher than that necessary for feeding the DC loads: PPV > 4 kW. The MGCP applies F9 to stop charging the batteries and to set the PV generators outside their MPP (MPPT = Off). In this case, ( P ILC AC P ^ ILC AC | MG - to - Grid ).
Interval 6 (28 s ≤ t < 35 s): The irradiation and the SOC remain constant: 800 W/m2 and 100%, respectively. EDL switches from On to Off. The MGCP applies F2, and the ILC injects power into the grid to its rated power, if necessary ( P ILC AC P ILC Rated ). At t = 30 s, MPPT switches from Off to On.
Interval 7 (35 s ≤ t < 40 s): The irradiation undergoes a change from 800 W/m2 to 100 W/m2. The MGCP applies F1, so that the ILC can extract power from the grid ( | P ILC AC | P ILC Rated ) when MPPT = On.

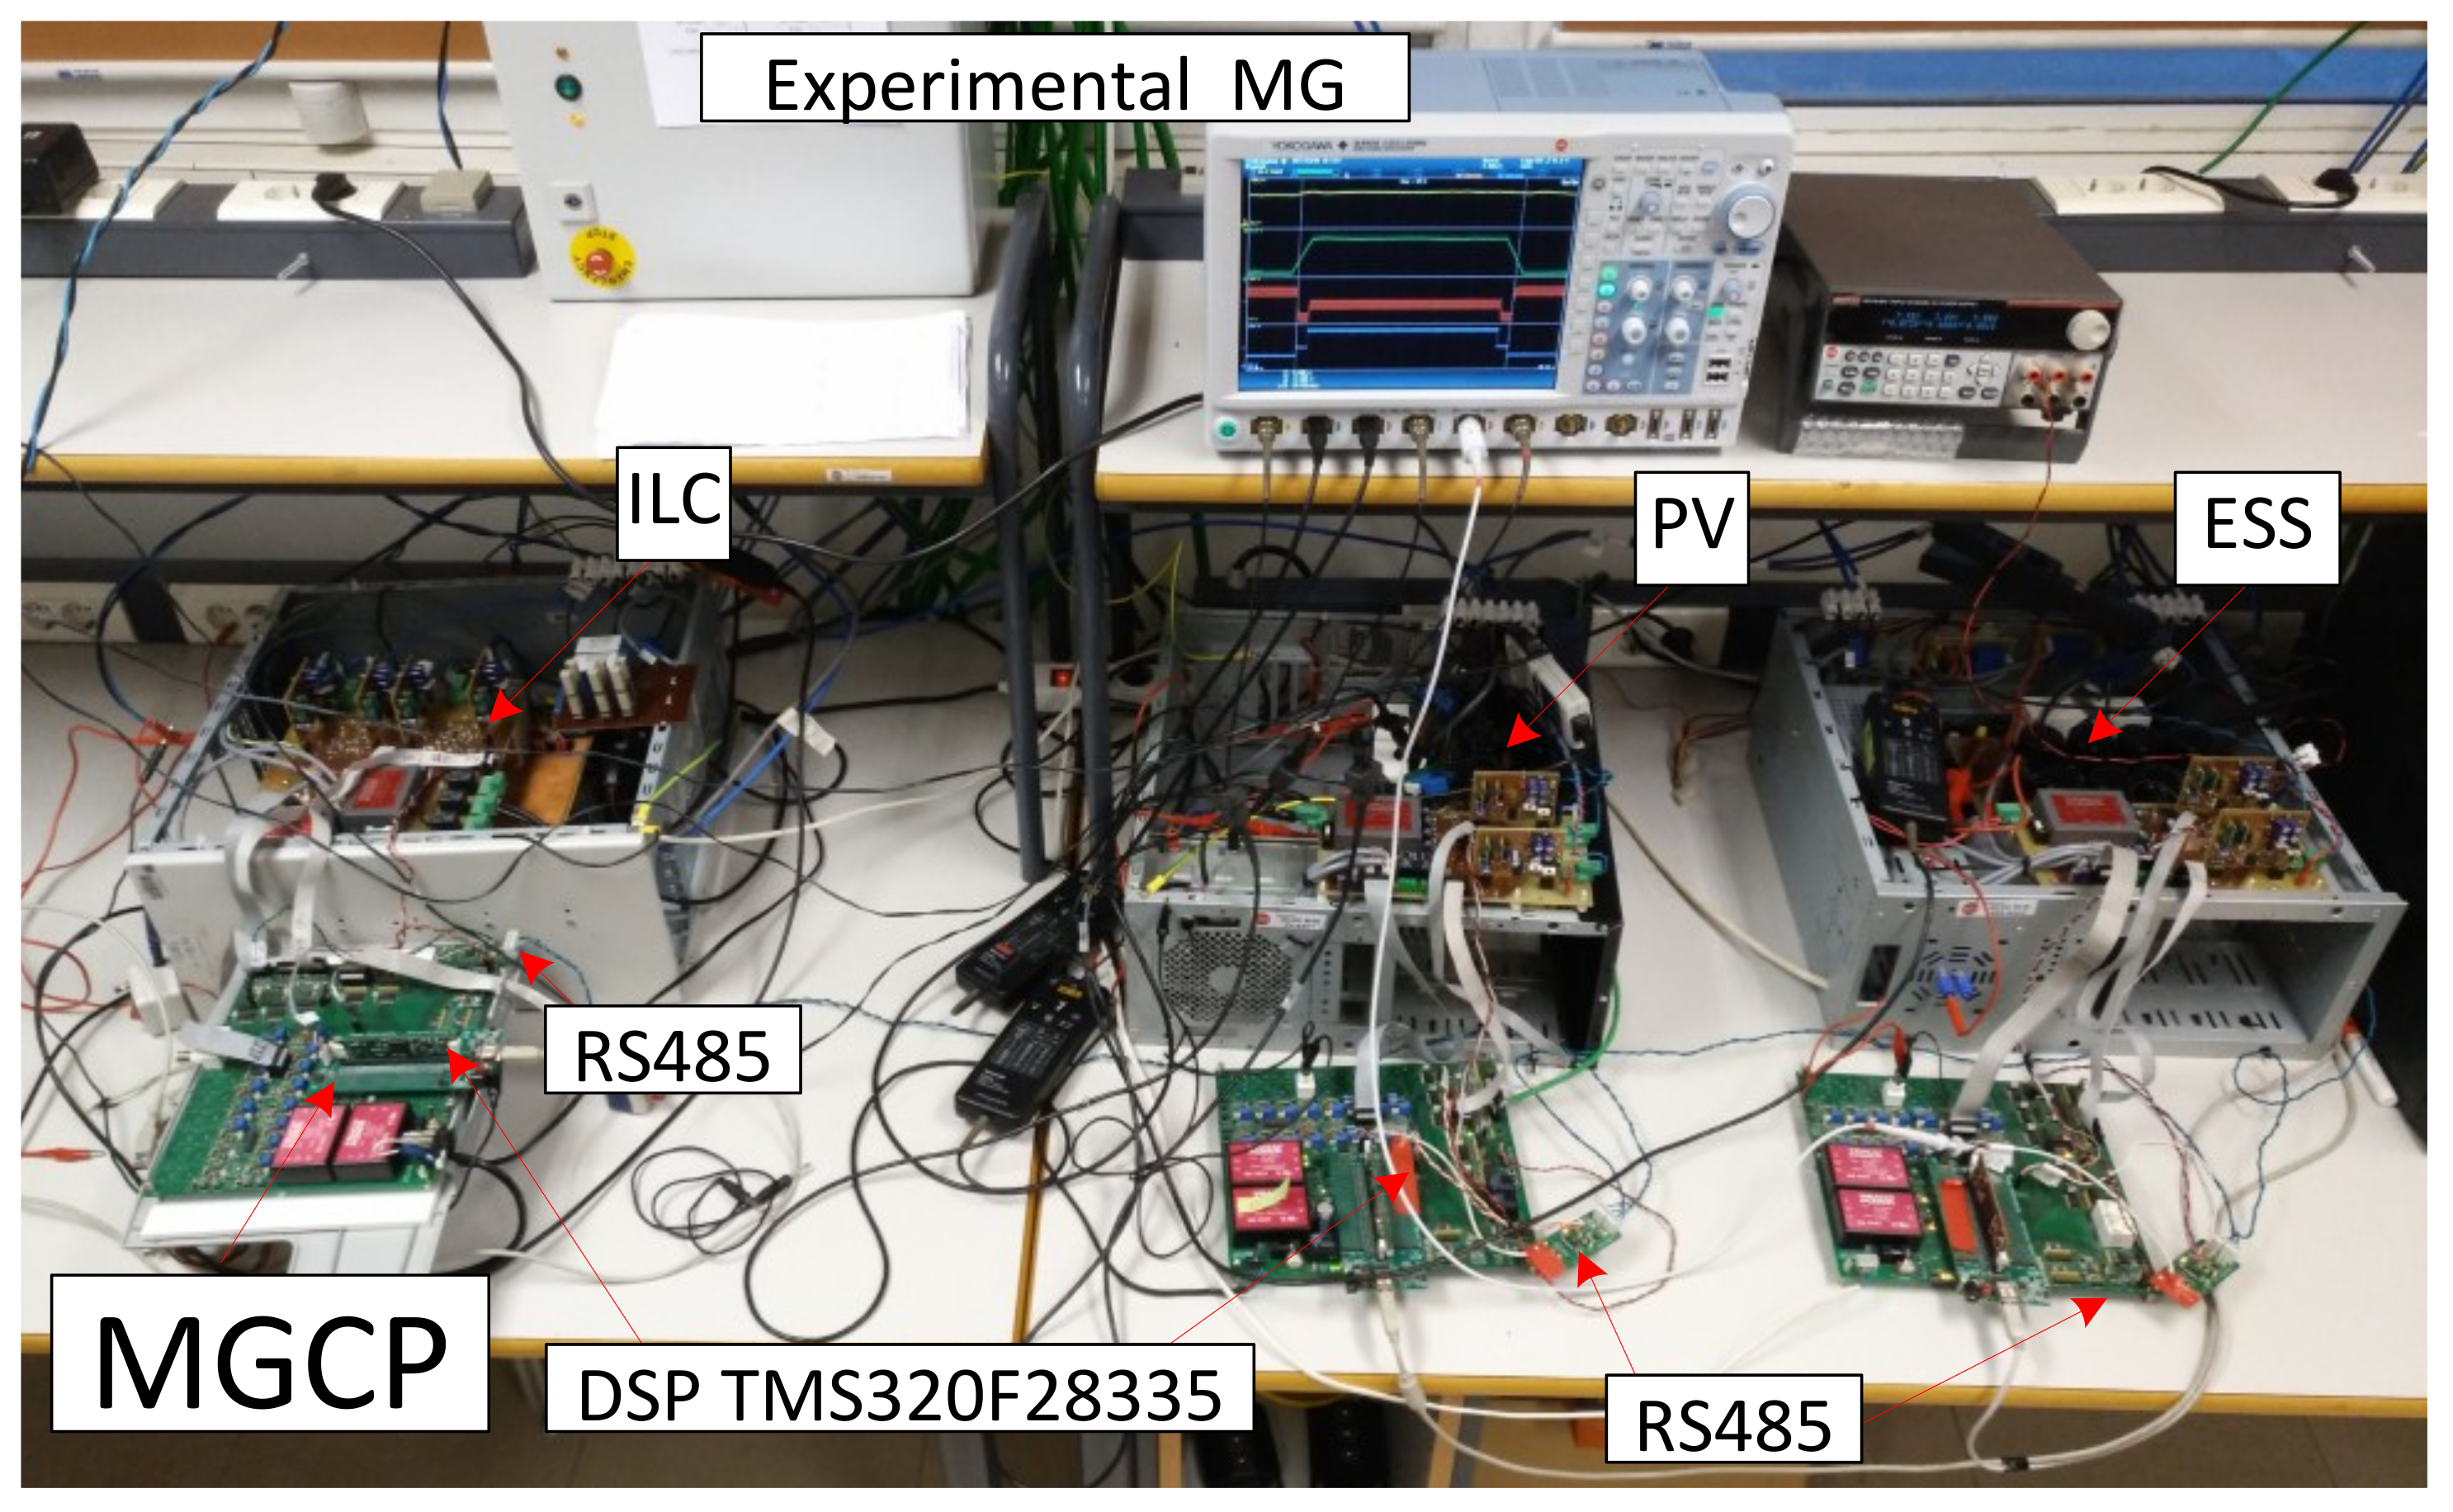
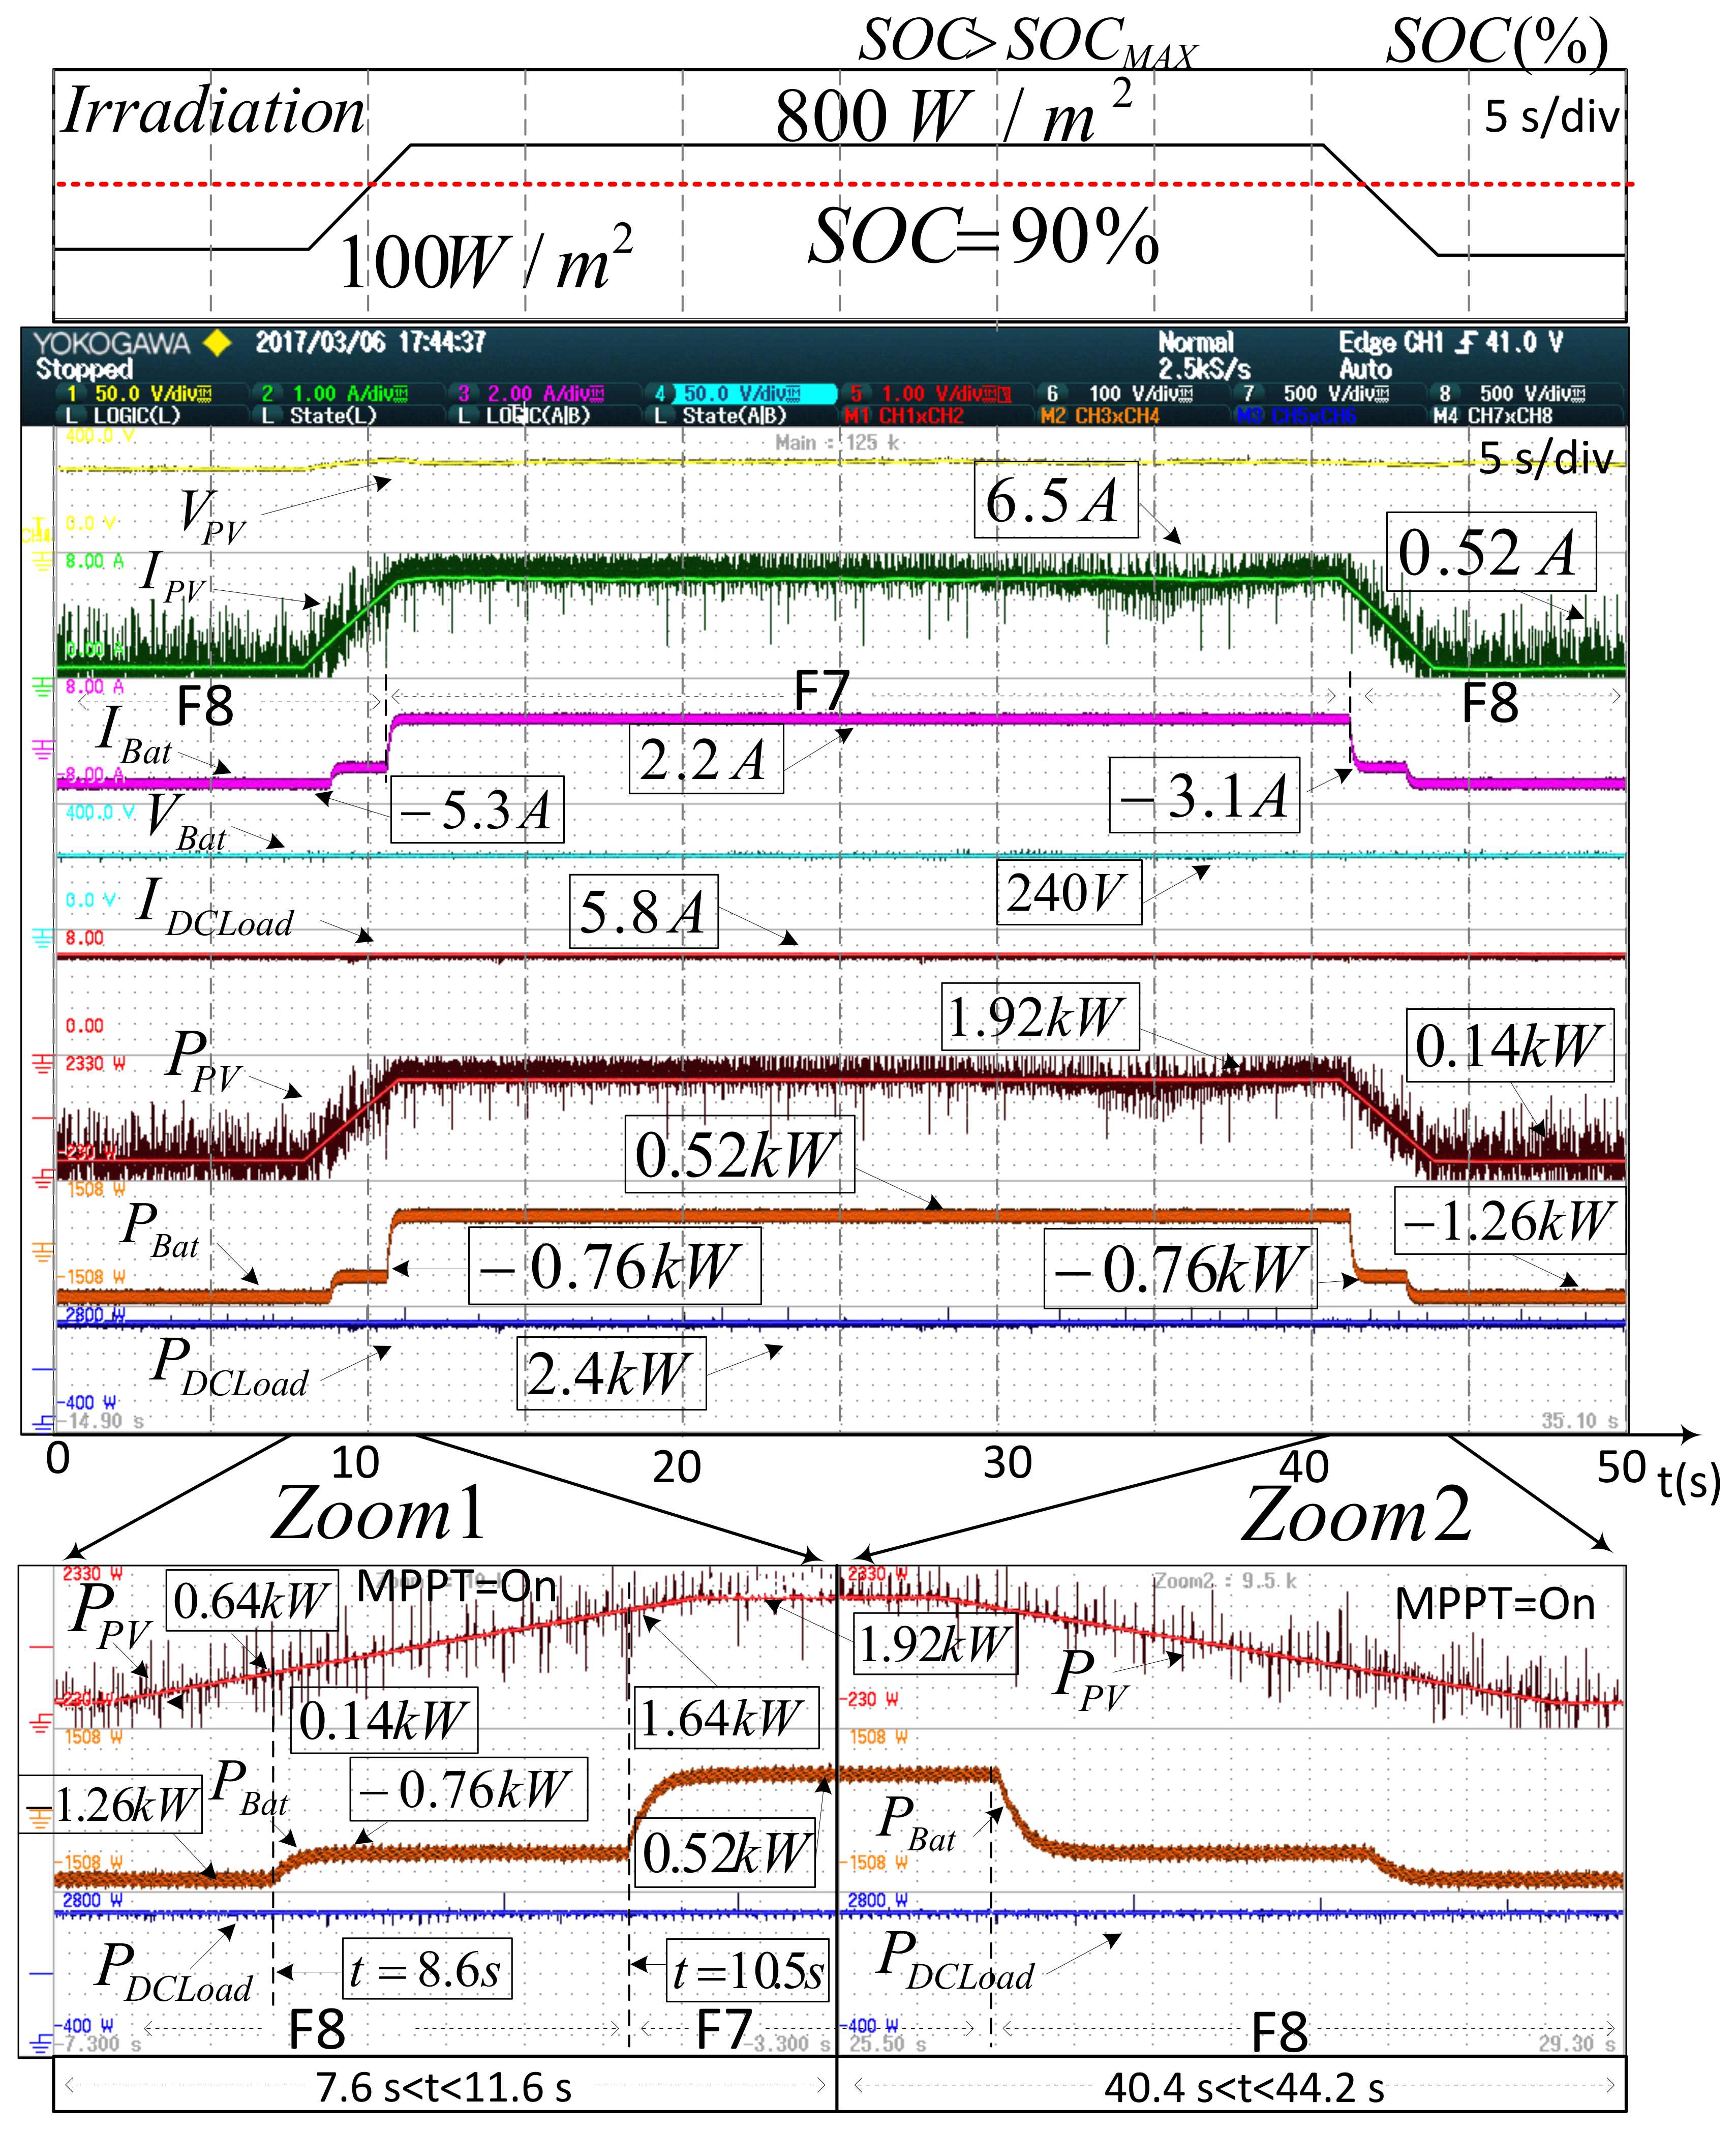
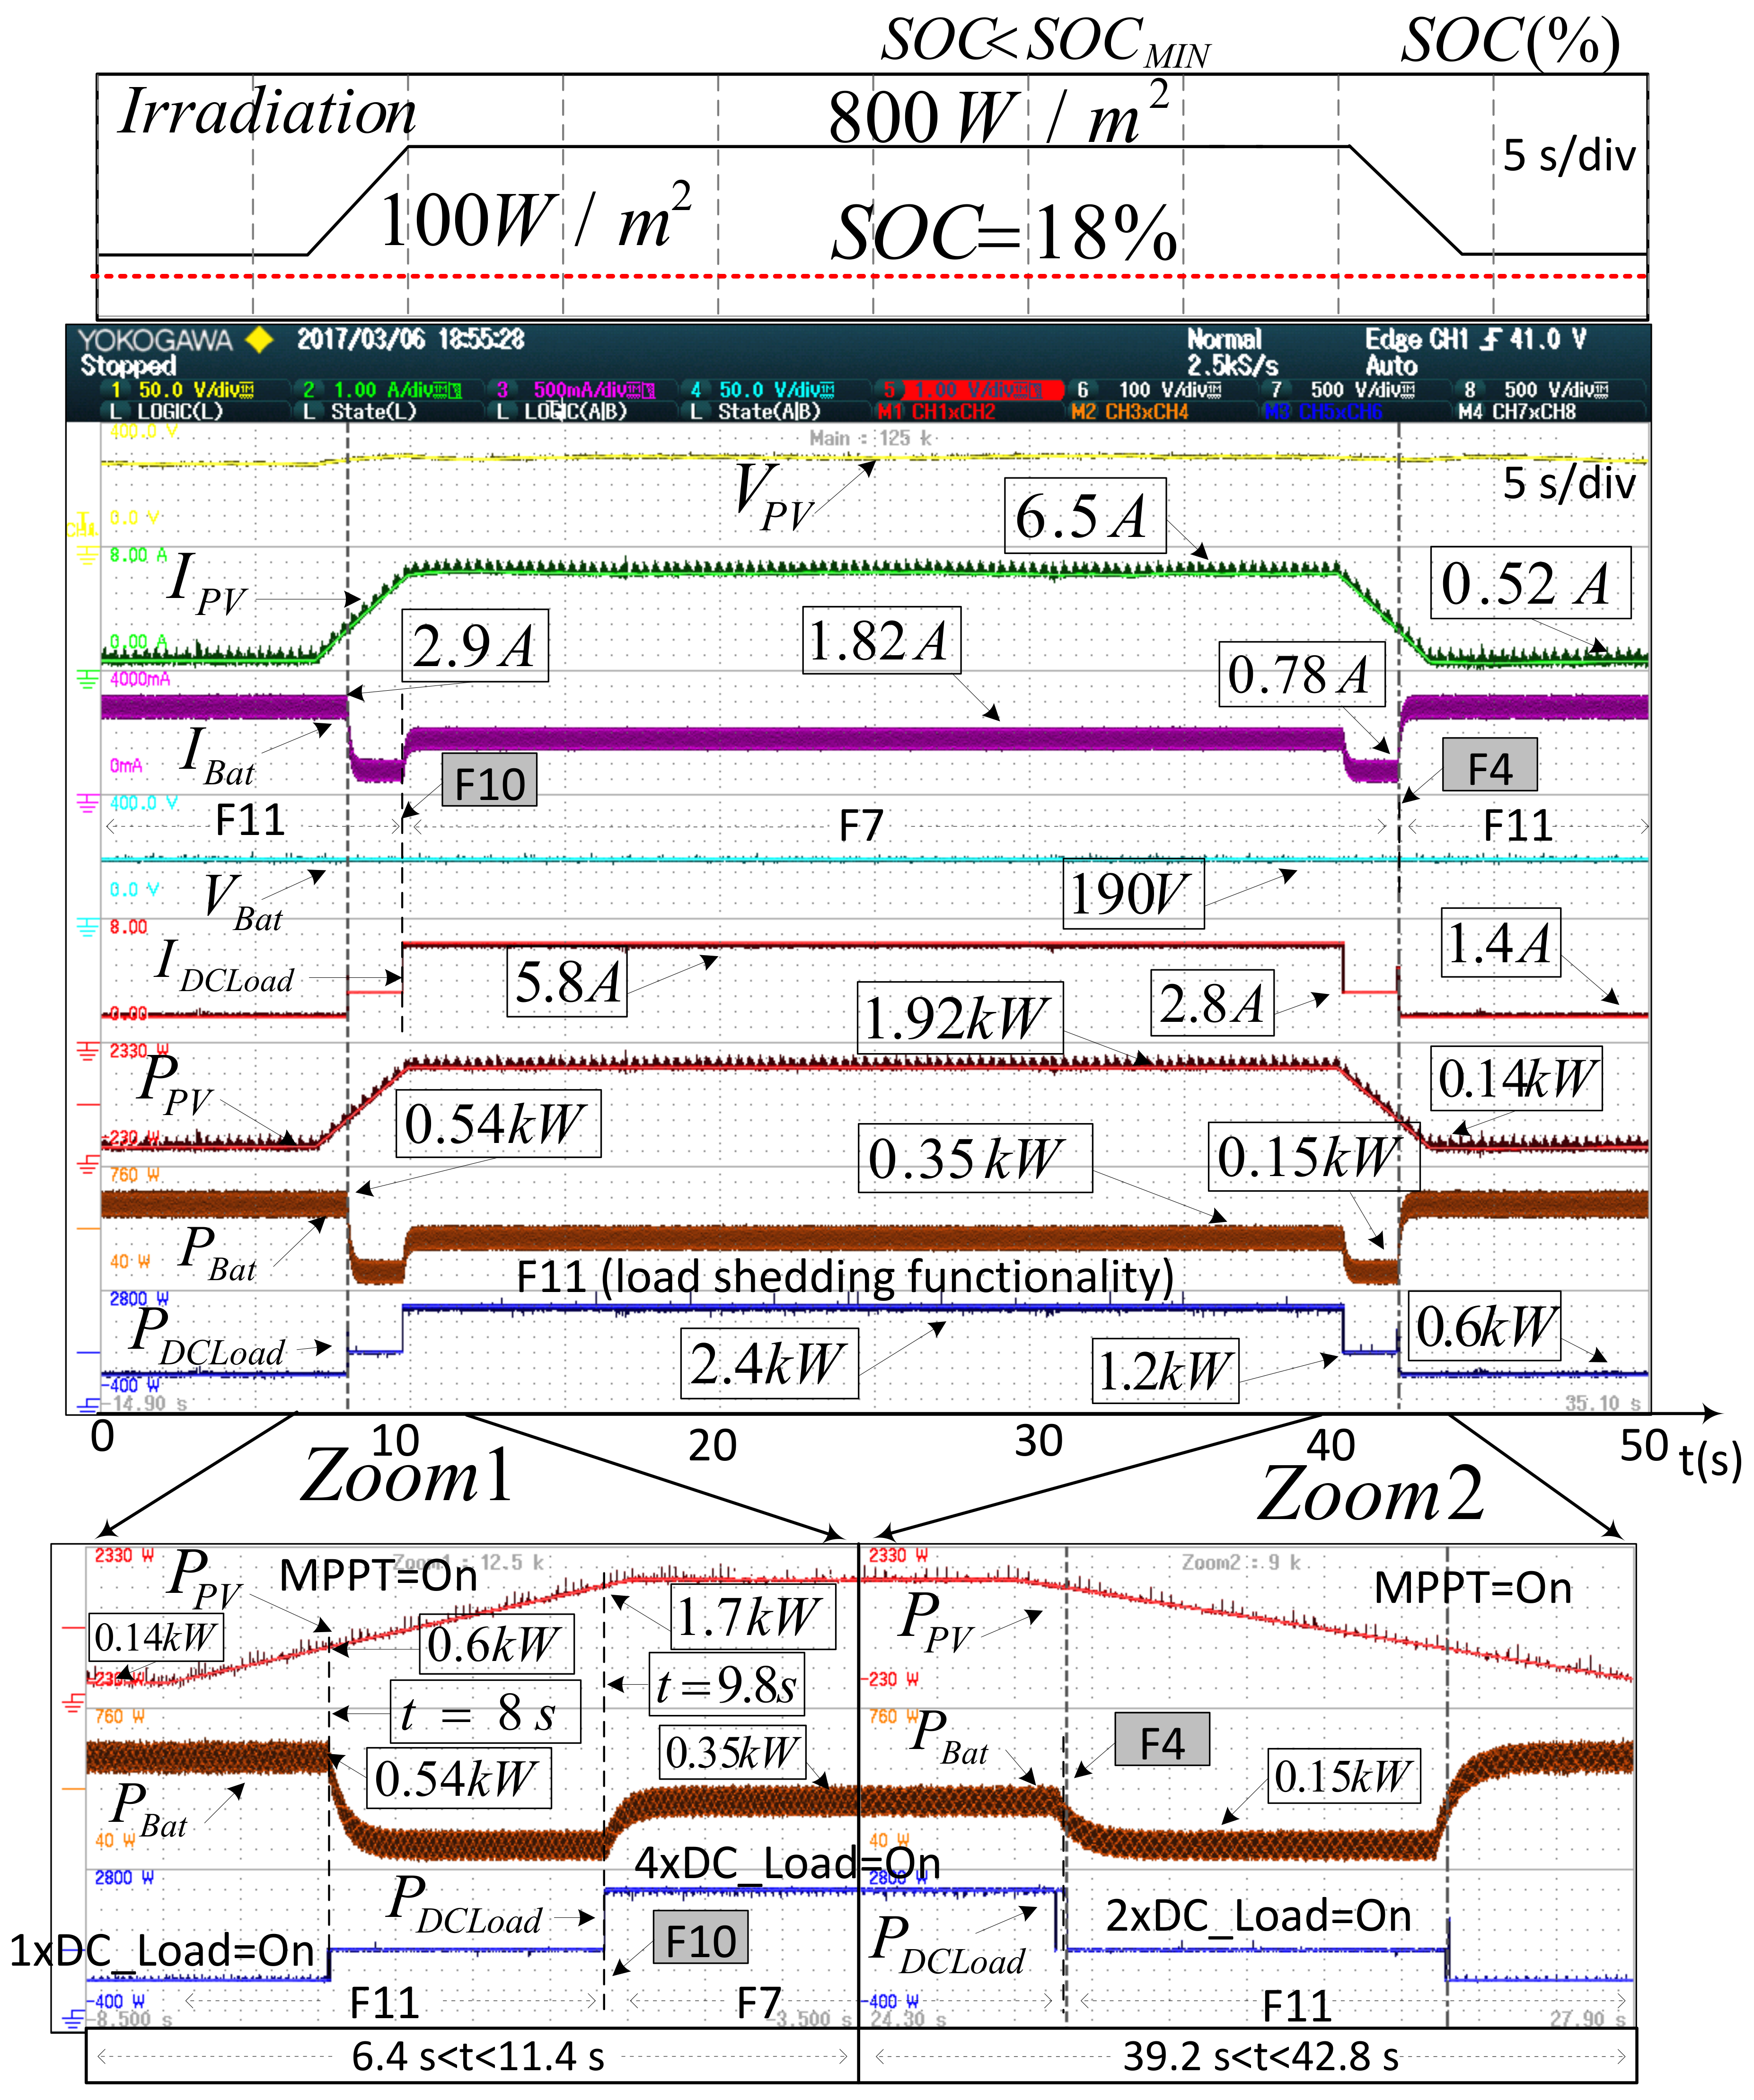
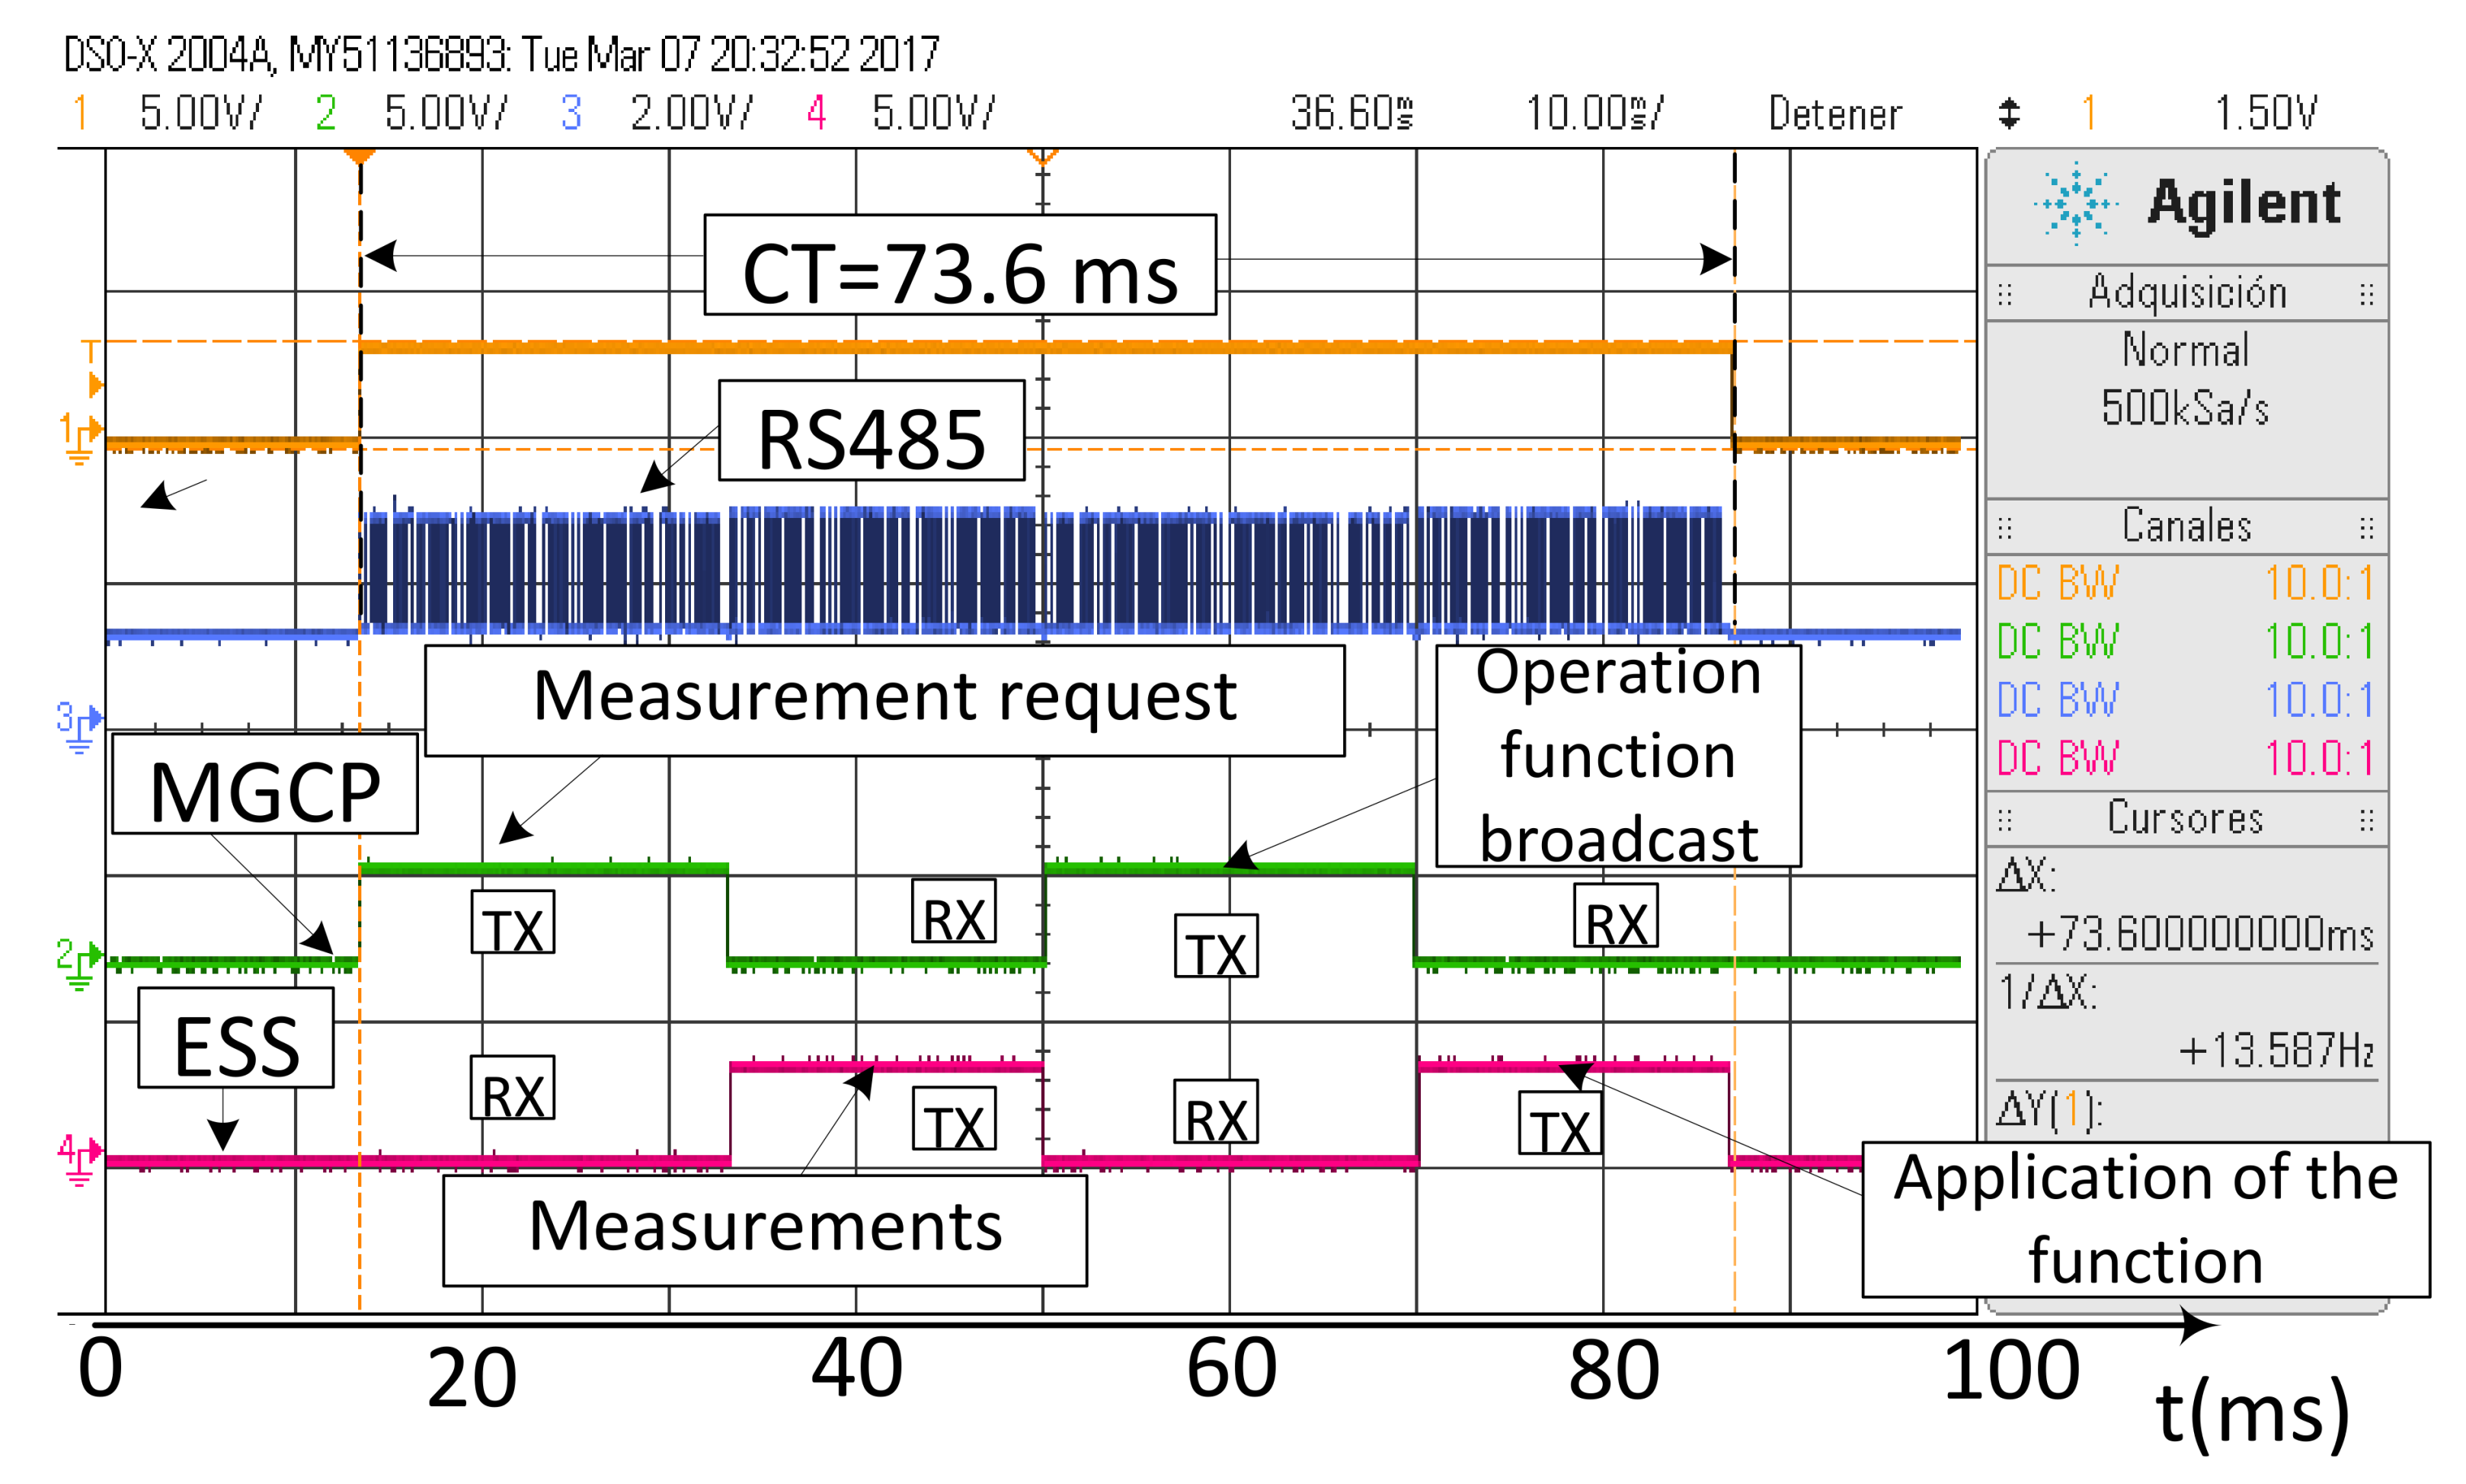
4.2. Experimental Results

The experimental power electronic converters, whose characteristics are summarized in Table 2, were built to validate the proposed power management algorithm. The following devices have been connected to the DC bus of the MG available in the lab: a 3 kW battery ESS, a 2.5 kW PV source and four electronic switches to connect/disconnect four DC loads of 0.6 kW ( P ^ D C L o a d = 2.4 kW). Figure 9 shows a picture of the experimental setup. The batteries were emulated by a bidirectional DC source/battery emulator, model TC.GSS-Bidirectional-DC-PSU, from Regatron. The PV array was emulated by means of a 10 kW PV array simulator, TerraSAS ETS1000/10, from Ametek (Berwyn, PA, USA). Three experiments were carried out. The experimental scenarios are summarized by Table 4. Figure 10 and Figure 11 depict the waveforms of the currents, voltages and powers of the power converters that form the DC bus of the MG, with Figure 10 corresponding to Experiment 1 and Figure 11 corresponding to Experiment 2. Figure 12 corresponds to Experiment 3.
Experiment 1 and Experiment 2 show the behavior of the system with the same change in the irradiation level at the PV source, but with a different SOC of the ESS. The available power injected from the AC bus to the DC bus by the ILC is PILC_DC = −1 kW.
Experiment 1: The ESS is initially at an SOC ≥ 80% (charged). The four loads remain connected throughout the whole experiment, as can be seen in Figure 10. (PDC_Load = 2.4 kW). The hysteresis level for comparisons with power thresholds is DCLoad_hyst = 0.24 kW.
Interval1 1 (0 s < t < 8 s): The irradiation level is 100 W/m2 and the PV source works at its maximum power point (MPP), providing PPV = 0.14 kW to the DC bus. That irradiation is not enough to feed all of the loads. Taking into account that the ESS is charged (SOC ≥ 80%), the MGCP transfers the maximum possible power from the AC bus (PILC_DC = −1 kW) to the DC bus through the ILC and applies F8. This keeps all the DC loads connected and orders the ESS supplying all the power required by the DC bus, PBat = −1.26 kW.
Interval 2 (8 s < t < 11 s): The irradiation increases from 100 W/m2 to 800 W/m2 in 3 s. The MGCP keeps F8 activated and the power delivered by the ESS can be reduced.
At t = 8.6 s, MGCP detects increasing generation, and the PV source works at its MPP, delivering PPV = 0.64 kW. The MGCP keeps F8 activated and transfers the maximum possible power from the AC bus (PILC_DC = −1 kW) and keeps all of the DC loads connected. The ESS supplies the power required by the DC bus; the power delivered by the ESS is reduced to PBat = −0.76 kW.
At t = 10.5 s, the PV source works at its MPP delivering PPV = 1.64 kW, with PILC_DC = −1 kW. At this moment, the MGCP detects that the available power at the DC bus to fed all the DC loads is higher than the hysteresis level (Cal.1 > DCLoad_hyst). The MGCP changes from F8 to F7. F7 forces the ESS to change its operation to energy storage mode; the batteries are charged with a current given by Equation (10). The MGCP changes the setpoint of the ESS charge current, ICh_ref, until the available power generation is stable (At t = 11.6 s, PBat = 0.5 kW). The power flows in the MG when the MGCP changes from F8 to F7 are shown in Zoom 1 of Figure 10.
Interval 3 (40.4 s < t < 44.2 s): The irradiation decreases from 800 W/m2 to 100 W/m2 in 3 s. The MGCP keeps F8 activated and the power delivered by the ESS can be reduced. The power flows in the MG when F8 is active are shown in Zoom 2 of Figure 10.
Experiment 2: The ESS is initially at an SOC ≤ 20% (discharged).
Interval 1 (0 s < t < 7 s): The irradiation level is 100 W/m2, and the PV source works at its maximum power point (MPP), providing PPV = 0.14 kW to the DC bus. That irradiation is not enough to feed all of the loads. Considering that the ESS is discharged (SOC < 20%), the MGCP transfers the maximum possible power from the AC bus (PILC_DC = −1 kW) to the DC bus through the ILC and applies the load shedding functionality, F11. Taking into account that the available power at the DC bus (1.14 kW) is not enough to feed two loads, F11 connects only one DC load (0.6 kW). The rest of the available power is used for charging the batteries at PBat = 0.54 kW. The power flows in the MG when F11 is active are shown in Zoom 1 of Figure 11.
Interval 2 (7 s < t < 10 s): The irradiation increases from 100 W/m2 to 800 W/m2 in 3 s. The MGCP keeps function F11 activated.
At t = 8 s, the PV source works at its MPP, delivering PPV = 0.6 kW, whereas PILC_DC = −1 kW. At this moment, the MGCP detects that the available power at the DC bus, taking into account the hysteresis level is enough to feed two of the loads. F11 connects two loads and changes the setpoint ICh_ref of the ESS from 2.9 A to 0.78 A, where PBat = 0.15 kW. Note that at t = 8 s, after the connection of the two loads, only |PILC_DC| ≤ 0.75 kW is taken from the AC bus. This ensures a minimum level of power is available in the DC bus.
At t = 9.8 s, the PV source works at its MPP, delivering PPV = 1.7 kW, where PILC_DC = −1 kW. At this moment, the MGCP detects that the available power at the DC bus to feed all the DC loads is greater than the hysteresis level (DCLoad_hyst). The MGCP applies function F10 which internally activates the flag, SwLoad = On. After that, the MGCP starts a transition from F10 to F7. F7 connects all the DC loads and changes the setpoint of the ESS to ICh_ref = 1.82 A until the available power generation is stable at the instant t = 11.4 s, where PBat = 0.35 kW. At t = 9.8 s, the MGCP applies function F10 during an execution cycle of the algorithm, i.e., for 73 ms. After that, function F7 is applied.
Interval 3 (39.2 s < t < 42.8 s): The irradiation decreases from 800 W/m2 to 100 W/m2 in 3 s. Note that at t = 40 s, the MGCP applies function F4 which internally activates the flag, SwLoad = Off. Then, the MGCP starts a transition from F4 to F11. The MGCP keeps F11 activated and the power delivered by the ESS can be reduced. The power flows in the MG when the MGCP starts a transition from F4 to F11 are shown in Zoom 2 of Figure 11.
Experiment 3: The operation functions broadcasted by the MGCP to the MG elements have a communication delay which depends on the RS485 communication system. In the experimental MG, the computing time of one operation function and its delay to be broadcasted and processed by one of the elements is lower than 74 ms, as can be observed in Figure 12.

4.3. Discussion

In Figure 7, the power exchange between devices of the MG is shown. In the first part of interval 5 (20 < t < 23.7 s), the MGCP causes the battery system to be charged to its maximum capacity, PESSC10, using the power available from the PV DGs. In the second part of interval 5 (23.7 s ≤ t < 28 s), the MGCP limits the generation from the PV DGs, setting their operation points out of the MPP (MPPT = Off).
The ILC controls the DC bus voltage, because the AC bus works in grid connection mode. The ILC also carries out the synchronization of the AC bus with the grid, causing the current, IILC_AC, flowing through the ILC to/from the AC bus to have low distortion and to be synchronized with the grid voltage, VGrid, when the MG exports/imports power to the grid. Figure 8 shows the waveforms of IILC_AC and of VGrid in both situations, where a smooth transient, a good synchronization and a low distortion of IILC_AC can be observed in the transition from exporting to importing power to/from the AC bus. A smooth transient of the DC bus voltage, VDC, is also observed in that transition at t = 35 s, which is the most sudden transient during the whole study, producing a transient undervoltage of ∆ v ^ D C = 34 V, i.e., less than 10% of the DC bus voltage. It should be considered that the power, PILC_AC, interchanged between the ILC and the AC bus, undergoes an abrupt change from 3.8 kW to −3.2 kW (7 kW step) at t = 35 s, provoked by a fast irradiation decrease.
Figure 10 shows the power exchange among the MG devices in Experiment 1. In time intervals 1 and 3, the MGCP applies the operation function F8. In this case, the demand of the DC bus is higher than the sum of the available PV power and the power import limit established by the grid operator. In that case, the MGCP requests the ESS to extract energy from the batteries to temporary feed the DC bus. This functionality reduces the cost of the electric bill.
The power flow in the MG after the application of the load shedding functionality can be observed in the zoom areas of Figure 11. No oscillations during those transients are observed.
In Experiment 3, the overall computing + transmission + processing delay of one operation function is 74 ms, where the ESS is at a distance of 2 m from the MGCP. According to the TIA/EIA-485-A standard, the maximum bandwidth at a 1.2 km distance is 100 kbps, which is much higher than the 9600 bps used in the experimental microgrid. The delay of a CAT5e twisted pair wire is less than 10 μs/km [32]. Therefore, if the distance between the ESS and the MGCP increases to 1 km, taking into account that the messages between the MGCP and the ESS run through the twisted pair four times (see the green and pink waveforms of Figure 12), the overall delay would increase to about 40 µs, i.e., about 0.05% of the total delays considered in the tests (73.6 ms). Further, the proposed algorithm is executed every second in the microgrid under study, so that the communication delays produced by moderate distances up to a few kilometers are not critical.

5. Conclusions

A new algorithm for the efficient management of the power converters of the hybrid AC/DC microgrid working in grid-connected mode has been presented. The algorithm is based on categorizing the devices according to their type: generation, storage, interlinking converter and load. Twelve operations functions have been defined and programmed in a Microgrid Central Processor for managing the power flow in the MG. The choice of the active operation function depends on the status of the distributed generators, the loads, the energy storage system and the energy dispatch limits between the AC and DC buses established by the grid operator. The MGCP broadcasts the set points of each converter through a RS485 communications system. The experimental and simulation results confirm that the proposed power management algorithm allows a suitable power balance among the MG devices when changes in PV generation, load demand and state of charge of the ESS occur. At any time, the power dispatch limits set by the public grid operator can be accomplished.

Acknowledgments

This work has been cofinanced by the Spanish Ministry of Economy and Competitiveness (MINECO) and by the European Regional Development Fund (ERDF) under Grant ENE2015-64087-C2-2.

Author Contributions

Robert Antonio Salas-Puente, Emilio Figueres and Gabriel Garcerá proposed the main idea, conceived and designed the experiments; Robert Salas-Puente and Raúl González-Medina performed the experiments; Silvia Marzal designed the communication; Silvia Marzal and Raúl González-Medina reviewed the article; Robert Salas-Puente, Emilio Figueres and Gabriel Garcerá wrote this paper.

Conflicts of Interest

The authors declare no conflict of interest.

Nomenclature

PPV1, PPV2Power supplied by the PV arrays 1 and 2
PPVTotal PV power generated by the DC MG
PDCLoadTotal power consumed by the DC loads
PGridPower injected from the hybrid AC/DC microgrid to the main grid
PILC_ACPower injected from the DC bus to the AC bus by the ILC, measured at the AC side of the ILC
PILC_DCPower injected from the DC bus to the AC bus by the ILC, measured at the DC side of the ILC
PESSPower absorbed by ESS from the DC bus
PBatBattery bank charge power
PACLoadTotal power consumed by the AC loads
PAC_DGsPower supplied by the AC DGs
ηEESEfficiency of the ESS
ηPV1, ηPV2Efficiency of the PV DC/DC converters 1 and 2
ηILCEfficiency of the ILC
IGridRMS Current injected from the hybrid AC/DC microgrid to the main grid
VGridRMS value of the grid voltage
ωGrid angular frequency
φGrid phase
IACLoadTotal RMS current consumed by the AC loads
IDCLoadTotal current consumed by the DC loads
VDCDC bus voltage
IILC_ACRMS current injected from the ILC to the AC bus
SOCState of charge of the battery bank
IBatCharge current of the battery bank
VBatVoltage of the battery bank
ICh_refReference of the charge current of the battery bank
IDis_refReference of the discharge current of the battery bank
IPV1, IPV2Current supplied by the PV arrays 1 and 2
PPV_LimLimit of the PV power generation
IDCLoadTotal current consumed by the DC loads
SW1,2,3,4DC_LoadSwitches of the DC loads (loads 1 to 4)
EDLEnergy dispatch limit
P ^ G r i d t o M G Maximum power drawn from the grid to the hybrid AC/DC microgrid
P ^ M G t o G r i d Maximum power injected to the grid from the hybrid AC/DC microgrid
P ^ I L C A C | G r i d t o M G Maximum power drawn from the AC bus to the DC bus measured at the AC side of the ILC
P ^ I L C A C | M G t o G r i d Maximum power injected from the DC bus to the AC bus, measured at the AC side of the ILC
P I L C R a t e d Rated power of the ILC
P ^ D C L o a d Maximum power consumed by the DC loads
PAvailableDC_MGPower available at the DC bus of the MG
DCLoad_hystPower hysteresis level used by the load shedding functionality
PESSC10Power drawn by the ESS from the DC bus at a charge current of the battery bank equal to IC10

References

  1. Olivares, D.E.; Mehrizi-Sani, A.; Etemadi, A.H.; Cañizares, C.A.; Iravani, R.; Kazerani, M.; Hajimiragha, A.H.; Gomis-Bellmunt, O.; Saeedifard, M.; Palma-Behnke, R.; et al. Trends in Microgrid Control. IEEE Trans. Smart Grid 2014, 5, 1905–1919. [Google Scholar] [CrossRef]
  2. Dragičević, T.; Lu, X.; Vasquez, J.C.; Guerrero, J.M. DC Microgrids—Part I: A Review of Control Strategies and Stabilization Techniques. IEEE Trans. Power Electron. 2016, 31, 4876–4891. [Google Scholar]
  3. Cagnano, A.; de Tuglie, E.; Cicognani, L. Prince—Electrical Energy Systems Lab: A pilot project for smart microgrids. Electr. Power Syst. Res. 2017, 148, 10–17. [Google Scholar] [CrossRef]
  4. Unamuno, E.; Barrena, J.A. Hybrid AC/DC microgrids—Part II: Review and classification of control strategies. Renew. Sustain. Energy Rev. 2015, 52, 1123–1134. [Google Scholar] [CrossRef]
  5. Liu, X.; Wang, P.; Loh, P.C. A Hybrid AC/DC Microgrid and Coordination Control. IEEE Trans. Smart Grid 2013, 2, 278–286. [Google Scholar]
  6. Nejabatkhah, F.; Li, Y.W. Overview of Power Management Strategies of Hybrid AC/DC Microgrid. IEEE Trans. Power Electron. 2015, 30, 7072–7089. [Google Scholar] [CrossRef]
  7. Liu, X.; Wang, P.; Loh, P.C. A hybrid AC/DC micro-grid. In Proceedings of the IPEC Conference Proceedings, Singapore, 27–29 October 2010; pp. 746–751. [Google Scholar]
  8. Wang, P.; Liu, X.; Jin, C.; Loh, P.; Choo, F. A hybrid AC/DC micro-grid architecture, operation and control. In Proceedings of the IEEE Power and Energy Society General Meeting, Detroit, MI, USA, 24–29 July 2011; pp. 1–8. [Google Scholar]
  9. Josep Guerrero, J.V. Hierarchical Control of Droop-Controlled AC and DC Microgrids. A General Approach toward Standardization. IEEE Trans. Ind. Electron. 2011, 58, 158–172. [Google Scholar] [CrossRef]
  10. Poh Chiang Loh, S.M. Autonomous Control of Interlinking Converter with Energy Storage in Hybrid AC-DC Microgrid. IEEE Trans. Ind. Appl. 2013, 49, 1374–1376. [Google Scholar]
  11. De Brabandere, K.; Bolsens, B.; van den Keybus, J.; Woyte, A.; Driesen, J.; Belmans, R. A Voltage and Frequency Droop Control Method for Parallel Inverters. IEEE Trans. Power Electron. 2007, 22, 1107–1115. [Google Scholar] [CrossRef]
  12. Loh, P.C.; Li, D.; Chai, Y.K.; Blaabjerg, F. Autonomous Operation of Hybrid Microgrid with AC and DC Subgrids. IEEE Trans. Power Electron. 2013, 28, 2214–2223. [Google Scholar] [CrossRef]
  13. Aryani, D.R.; Kim, J.-S.; Song, H. Interlink Converter with Linear Quadratic Regulator Based Current Control for Hybrid AC/DC Microgrid. Energies 2017, 10, 1799. [Google Scholar] [CrossRef]
  14. Luo, F.; Loo, K.H.; Lai, Y.M. A hybrid AC/DC microgrid control scheme with voltage-source inverter-controlled interlinking converters. In Proceedings of the 2016 18th European Conference on Power Electronics and Applications (EPE’16 ECCE Europe), Karlsruhe, Germany, 5–8 September 2016; pp. 1–8. [Google Scholar]
  15. Karimi, Y.; Guerrero, J.M.; Oraee, H. Decentralized method for load sharing and power management in a hybrid single/three-phase islanded microgrid consisting of hybrid source PV/battery units. In Proceedings of the 2016 IEEE Energy Conversion Congress and Exposition (ECCE), Milwaukee, WI, USA, 18–22 September 2016; pp. 1–8. [Google Scholar]
  16. Hasan, M.A.; Vemula, N.K.; Parida, S.K. Cost based dynamic load dispatch for an autonomous parallel converter hybrid AC-DC microgrid. In Proceedings of the National Power Systems Conference (NPSC), Bhubaneswar, India, 19–21 December 2016; pp. 1–5. [Google Scholar]
  17. Yue, J.; Hu, Z.; Li, C.; Vasquez, J.C.; Guerrero, J.M. Economic Power Schedule and Transactive Energy through an Intelligent Centralized Energy Management System for a DC Residential Distribution System. Energies 2017, 10, 916. [Google Scholar] [CrossRef]
  18. Gao, L.; Liu, Y.; Ren, H.; Guerrero, J.M. A DC Microgrid Coordinated Control Strategy Based on Integrator Current-Sharing. Energies 2017, 10, 1116. [Google Scholar] [CrossRef]
  19. Kaur, A.; Kaushal, J.; Basak, P. A review on microgrid central controller. Renew. Sustain. Energy Rev. 2016, 55, 338–345. [Google Scholar] [CrossRef]
  20. Aluisio, B.; Cagnano, A.; de Tuglie, E.; Dicorato, M.; Forte, G.; Trovato, M. PrInCE lab microgrid: Early experimental results. In Proceedings of the 2016 AEIT International Annual Conference (AEIT), Capri, Italy, 5–7 October 2016; pp. 1–6. [Google Scholar]
  21. El-Hendawi, M.; Gabbar, H.A.; El-Saady, G.; Ibrahim, E.-N.A. Control and EMS of a Grid-Connected Microgrid with Economical Analysis. Energies 2018, 11, 129. [Google Scholar] [CrossRef]
  22. Dou, C.; Zhang, Z.; Yue, D.; Zheng, Y. MAS-Based Hierarchical Distributed Coordinate Control Strategy of Virtual Power Source Voltage in Low-Voltage Microgrid. IEEE Access 2017, 5, 11381–11390. [Google Scholar] [CrossRef]
  23. Baek, J.; Choi, W.; Chae, S. Distributed Control Strategy for Autonomous Operation of Hybrid AC/DC Microgrid. Energies 2017, 10, 373. [Google Scholar] [CrossRef]
  24. Tofis, Y.; Timotheou, S.; Kyriakides, E. Minimal Load Shedding Using the Swing Equation. IEEE Trans. Power Syst. 2017, 32, 2466–2467. [Google Scholar] [CrossRef]
  25. Choi, Y.; Lim, Y.; Kim, H.-M. Optimal Load Shedding for Maximizing Satisfaction in an Islanded Microgrid. Energies 2017, 10, 45. [Google Scholar] [CrossRef]
  26. Zhou, H.; Qiu, Y.; Lin, Y.; Wang, Z.; Ma, J. Remote automatic switching and load shedding linkage control scheme. In Proceedings of the 2016 IEEE International Conference on Power and Renewable Energy (ICPRE), Shanghai, China, 21–23 October 2016; pp. 260–263. [Google Scholar]
  27. Grantham, A.; Pudney, P.; Ward, L.A.; Whaley, D.; Boland, J. The viability of electrical energy storage for low-energy households. Sol. Energy 2017, 155, 1216–1224. [Google Scholar] [CrossRef]
  28. Leadbetter, J.; Swan, L. Battery storage system for residential electricity peak demand shaving. Energy Build. 2012, 55, 685–692. [Google Scholar] [CrossRef]
  29. Ciobotaru, M.; Agelidis, V.G.; Teodorescu, R.; Blaabjerg, F. Accurate and less-disturbing active antiislanding method based on PLL for gridconnected converters. IEEE Trans. Power Electron. 2010, 25, 1576–1584. [Google Scholar] [CrossRef]
  30. Faxas-Guzmán, J.; García-Valverde, R.; Serrano-Luján, L.; Urbina, A. Priority load control algorithm for optimal energy management in stand-alone photovoltaic systems. Renew. Energy 2014, 68, 156–162. [Google Scholar] [CrossRef]
  31. PSIM10.0, PowerSim: Rockville, MD, USA, 2016.
  32. Patrao, I.; González-Medina, R.; Marzal, S.; Garcerá, G.; Figueres, E. Synchronization of Power Inverters in Islanded Microgrids Using an FM-Modulated Signal. IEEE Trans. Smart Grid 2017, 8, 503–510. [Google Scholar] [CrossRef]
Figure 1. Conceptual scheme of the hybrid AC/DC microgrid under study.
Energies 11 00794 g001
Figure 2. Power flow scenarios between the grid and the MG: (a) power flow from the grid to the MG, PGrid < 0; (b) power flow from the MG to the grid, PGrid > 0.
Energies 11 00794 g002
Figure 3. Power dispatch inside the MG after applying the operation functions: (a) F3; (b) F8; (c) F10 and (d) F11.
Energies 11 00794 g003aEnergies 11 00794 g003b
Figure 4. Load shedding functionality.
Energies 11 00794 g004
Figure 5. Power management algorithm of the MG.
Energies 11 00794 g005
Figure 6. Simulation waveforms, IBat, IPV = IPV1 + IPV2 the SOC over time.
Energies 11 00794 g006
Figure 7. Simulation waveforms of the powers, PBat, PPV, PDCLoad, PILC_AC and PGrid.
Energies 11 00794 g007
Figure 8. Simulation waveforms of the most sudden transients of IILC_AC, VDC and PILC_AC.
Energies 11 00794 g008
Figure 9. Experimental setup picture.
Energies 11 00794 g009
Figure 10. Experiment 1.
Energies 11 00794 g010
Figure 11. Experiment 2.
Energies 11 00794 g011
Figure 12. Experiment 3.
Energies 11 00794 g012
Table 1. Communication parameters of the system.
Communication Parameters between the Devices of the Microgrid (MG) and the Microgrid Central Processor (MGCP)
DC MGAC MG
Operations functionsESSILCPVDC LoadDGsAC Load
VDC_ref
IDis_ref
ICh_ref
VC
φ
ω
VDC_ref
PPV_LimSw1
Sw2
Sw3
Sw4
MeasurementsIBat
VDC
VBat
SOC
IILC_AC
VDC
VGrid
IPV1
VPV1
IPV2
VPV2
IDC_LoadIAC_DGs
VGrid
IAC_Load
VGrid
Communication Parameters between the MGCP and the Grid Operator
High-level controlEDL, P ^ Grid - to - MG , P ^ MG - to - Grid
Table 2. Characteristics of the power converters of the MG.
ILC2 PV DC/DC Converters (DGs)ESS
PILC_Rated = 10 kW
VGrid = 230 V
FGrid = 50 Hz
VDC = 420 V
FswILC = 12.8 kHz
PPV1,2_Boost = 5 kW
VPV = 306 V
Fsw_PV = 16 kHz
PV Panel: Atersa A-250P GSE
VPV_oc = 37.61 V
IPV_MAX = 8.18 A
VPV_MAX = 30.58 V
IPV_CC = 8.71 A
PESS_HB = 3 kW
VBat = 216 V
Fsw_ESS = 16 kHz
Battery Bank: 18 batteries type SUN POWER VRM 12V105 connected in series
VBat_Nom = 216 V
VBat_MIN = 185 V
VBat_MAX = 259.2 V
C10 ≅ 105 A·h
IC10 = 10.5 A
Table 3. The simulation scenarios of the MG.
SIMULATION Scenarios
Time Intervals (s)
Time interval number1234567
Time span (s)0 < t < 11 < t < 1010 < t < 1818 < t < 2020 < t < 2828 < t < 3535 < t < 40
Irradiation (W/m2)300600400800800800100
Load connected to the DC bus4 loads
(8 kW)
4 loads
(8 kW)
4 loads
(8 kW)
4 loads
(8 kW)
2 loads
(4 kW)
2 loads
(4 kW)
2 loads
(4 kW)
EDL (1)OnOnOnOnOnOffOff
ILCThe MG is operating in grid-connection mode
ESSThe batteries of the ESS are initially discharged. SOCSOCMIN
Power limits P ^ M G t o G r i d = 4 kW, P ^ G r i d t o M G = 1 kW, P ^ D C L o a d = 8 kW
AC bus P A C L o a d = 4   kW , P A C D G s = 5   kW
1 Energy dispatch limit.
Table 4. The experimental scenarios of the MG.
Experimental Scenarios 1
ESSExperiment 1: The batteries of the ESS are initially charged. SOC = SOCMAX
Time span (s)0 < t < 88 < t < 1111 < t < 4141 < t < 4444 < t < 50
Irradiation (W/m2)100100–800800800–100100
ESSExperiment 2: The batteries of the ESS are initially discharged. SOCSOCMIN
Time span (s)0 < t < 77 < t < 1010 < t < 4040 < t < 4343 < t < 50
Irradiation (W/m2)100100–800800800–100100
Load connected to the DC bus4 loads (2.4 kW)
EDLOn
ILCThe MG is operating in grid-connection mode
Power limits P ^ M G t o G r i d = 4 kW, P ^ G r i d t o M G = 1 kW, P ^ D C L o a d = 2.4 kW
AC bus P A C L o a d   =   4   kW , P A C D G s = 5   kW
1 The algorithm is running in the experiments at 1 Hz.

