Infrared Spectroscopic Analysis of the Inorganic Deposits from Water in Domestic and Technical Heat Exchangers


1
Technische Thermodynamik, Universität Bremen, Badgasteiner Str. 1, 28359 Bremen, Germany
2
School of Engineering, University of Aberdeen, Aberdeen AB24 3UE, UK
3
Erlangen Graduate School in Advanced Optical Technologies, Friedrich-Alexander-Universität Erlangen-Nürnberg, 91052 Erlangen, Germany
4
MAPEX Center for Materials and Processes, Universität Bremen, Bibliothekstr. 1, 28359 Bremen, Germany
*
Author to whom correspondence should be addressed.
Energies 2018, 11(4), 798; https://doi.org/10.3390/en11040798
Submission received: 16 March 2018
/
Revised: 22 March 2018
/
Accepted: 26 March 2018
/
Published: 30 March 2018
(This article belongs to the Section I: Energy Fundamentals and Conversion)
Abstract
:The deposition of insoluble inorganic substances on heat exchanger surfaces has a strong negative influence on the heat transfer and thus on the performance of the apparatus and the process. The analysis of the deposits is a crucial step towards the development of suitable technologies for scaling mitigation and prevention. Such analysis, however, is challenging and often requires advanced instrumentation and sample preparation. To overcome this problem, we present a straightforward analytical approach based on Fourier-transform infrared (FTIR) spectroscopy. We demonstrate that FTIR spectroscopy is a powerful tool for the chemical analysis of inorganic deposits. For example, it can identify the common anions in scales such as sulfates and carbonates. It can even distinguish between salts with the same anion but different cations such as calcium and sodium. Test measurements are performed on the deposits from a domestic water cooker and from the evaporator of a seawater desalination pilot plant.
1. Introduction
Heat exchangers are commonly operated with water that carries dissolved substances such as inorganic ions. This is true for domestic boilers and water cookers that are used to heat tap water but also for industrial devices such as evaporators in seawater desalination plants. The heating and partial evaporation of the water leads to an increase in the salinity of the water and, in addition, the solubility of the salts decreases with increasing temperature [1,2]. As a consequence, precipitation and co-precipitation of some salts, in particular of carbonates and sulfates, can take place. The precipitated solids deposit on the surface and form a layer. This phenomenon is known as crystallization fouling [3,4].
The deposition of insoluble inorganic substances on the surface of heat exchangers has a strong negative influence on the heat transfer and thus on the performance of the apparatus and the process [5,6]. The specific effects depend on the deposited material in terms of its chemical composition, crystal structure, and layer morphology. The analysis of deposits from heat exchanger surfaces is therefore a crucial step towards the development of suitable technologies for the mitigation and prevention of scaling. Such analysis, however, is challenging and often requires advanced instrumentation such as electron microscopes, X-ray diffraction, and wet chemistry [7,8]. In addition to the need for expensive equipment and expert personnel, these analytical methods are time consuming, require sampling and sample preparation, and hence they can only be applied ex situ.
Optical spectroscopic methods can be a solution to this problem and represent a potentially powerful alternative tool for the analysis of inorganic debris in heat exchangers and evaporators. In this work, a straightforward analytical approach based on Fourier-transform infrared (FTIR) spectroscopy is demonstrated. In the first step, it is shown that different sulfate and carbonate salts can be unambiguously distinguished. In the second step, FTIR spectroscopy is applied to the inorganic deposits from a domestic water cooker and from the evaporator of a seawater desalination pilot plant. The Conclusions section discusses the opportunities and limitations of the method. Moreover, it lays out the steps that need to be undertaken in order to make FTIR spectroscopy an in situ tool for scaling analysis and monitoring. Nevertheless, it should be noted that this is, of course, not the first study of inorganic materials using FTIR spectroscopy. Quite the contrary, FTIR is frequently used to characterize inorganic substances such as carbonates and silicates [9,10], metal-impregnated charcoal [11], minerals [12], and even functionalized ceramic membranes [13]. The novelty of the present work is the application of an FTIR method to the deposits from boilers and heat exchangers.
2. Materials and Methods
Infrared (IR) spectra were recorded on an Agilent Cary 630 instrument equipped with a unit for attenuated total reflection (ATR) exhibiting a single-reflection (45°) diamond crystal. Spectra were obtained over the range 650–4000 cm−1 with a nominal resolution of 2 cm−1. Details about the ATR-FTIR method can be found in the literature, see e.g., [14,15]. Before each measurement, the crystal was carefully cleaned with ethanol and a background spectrum was recorded. Then a small amount of sample was added and the metal clamp of the instrument was used to press the sample onto the crystal in order to have sufficient contact. Thirty-two scans were averaged for each sample in order to obtain spectra with good signal-to-noise ratio.
A series of reference salts (purity > 98%) were analyzed in the first step. For this purpose, anhydrous calcium sulfate, calcium sulfate with 0.5 H2O, calcium sulfate with 2 H2O, anhydrous calcium carbonate, anhydrous sodium sulfate, anhydrous sodium carbonate, sodium carbonate with 1 H2O, and sodium carbonate with 10 H2O were purchased from VWR International GmbH, Germany and used as received.
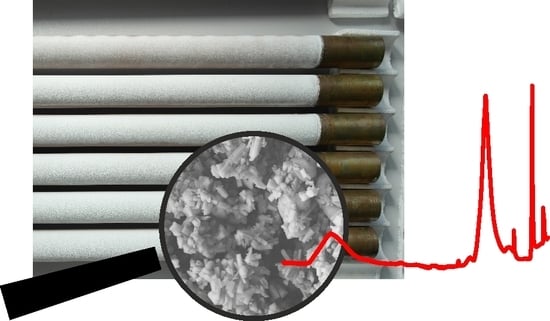
For the proof-of-concept, debris samples were taken from an ordinary domestic water cooker, which was operated with tap water for an extended period of time. After decanting the remaining water, two apparently different deposited materials were found in this device, namely a gray powder and small greenish disks as shown in Figure 1A. These materials were analyzed by IR separately. Furthermore, the debris deposited on the horizontal tubes of a falling film evaporator in a pilot plant scale seawater desalination facility were studied. The facility was operated with artificial seawater, which was based on the formulation suggested by Kester et al. [16]. Details about the test rig and the seawater preparation can be found in a previous article [8]. The pH value of the artificial seawater after aeration was about 8.2. The evaporator was equipped with tubes made from a copper-nickel alloy (CuNi10Fe1Mn; abbrev.: CuNi 90/10). The CuNi 90/10 tubes were exposed to seawater for the first time. Thus, corrosion fouling leading to a thin protective corrosion product layer and crystallization fouling occurred simultaneously. A photograph of the tubes removed from the heat exchanger is shown in Figure 1B. On the left side of the image, the part of the tubes that was not exposed to the seawater can be seen, and the right hand part shows the white/gray layer of scale. For the analysis, the deposit layer was scratched off one tube and the infrared (IR) spectrum of the resulting powder was recorded.
3. Results and Discussion
3.1. Reference Materials
Initially, the FTIR spectra of the reference materials were analyzed. The main purpose of this step was to test and verify the specificity of the spectroscopic method. One question to be answered concerns whether or not salts sharing the same anion but exhibiting different cations can be distinguished. Another question concerns the influence of water molecules in the samples as a certain water content can hardly be avoided in practical applications. This is particularly true for potential measurements in situ.
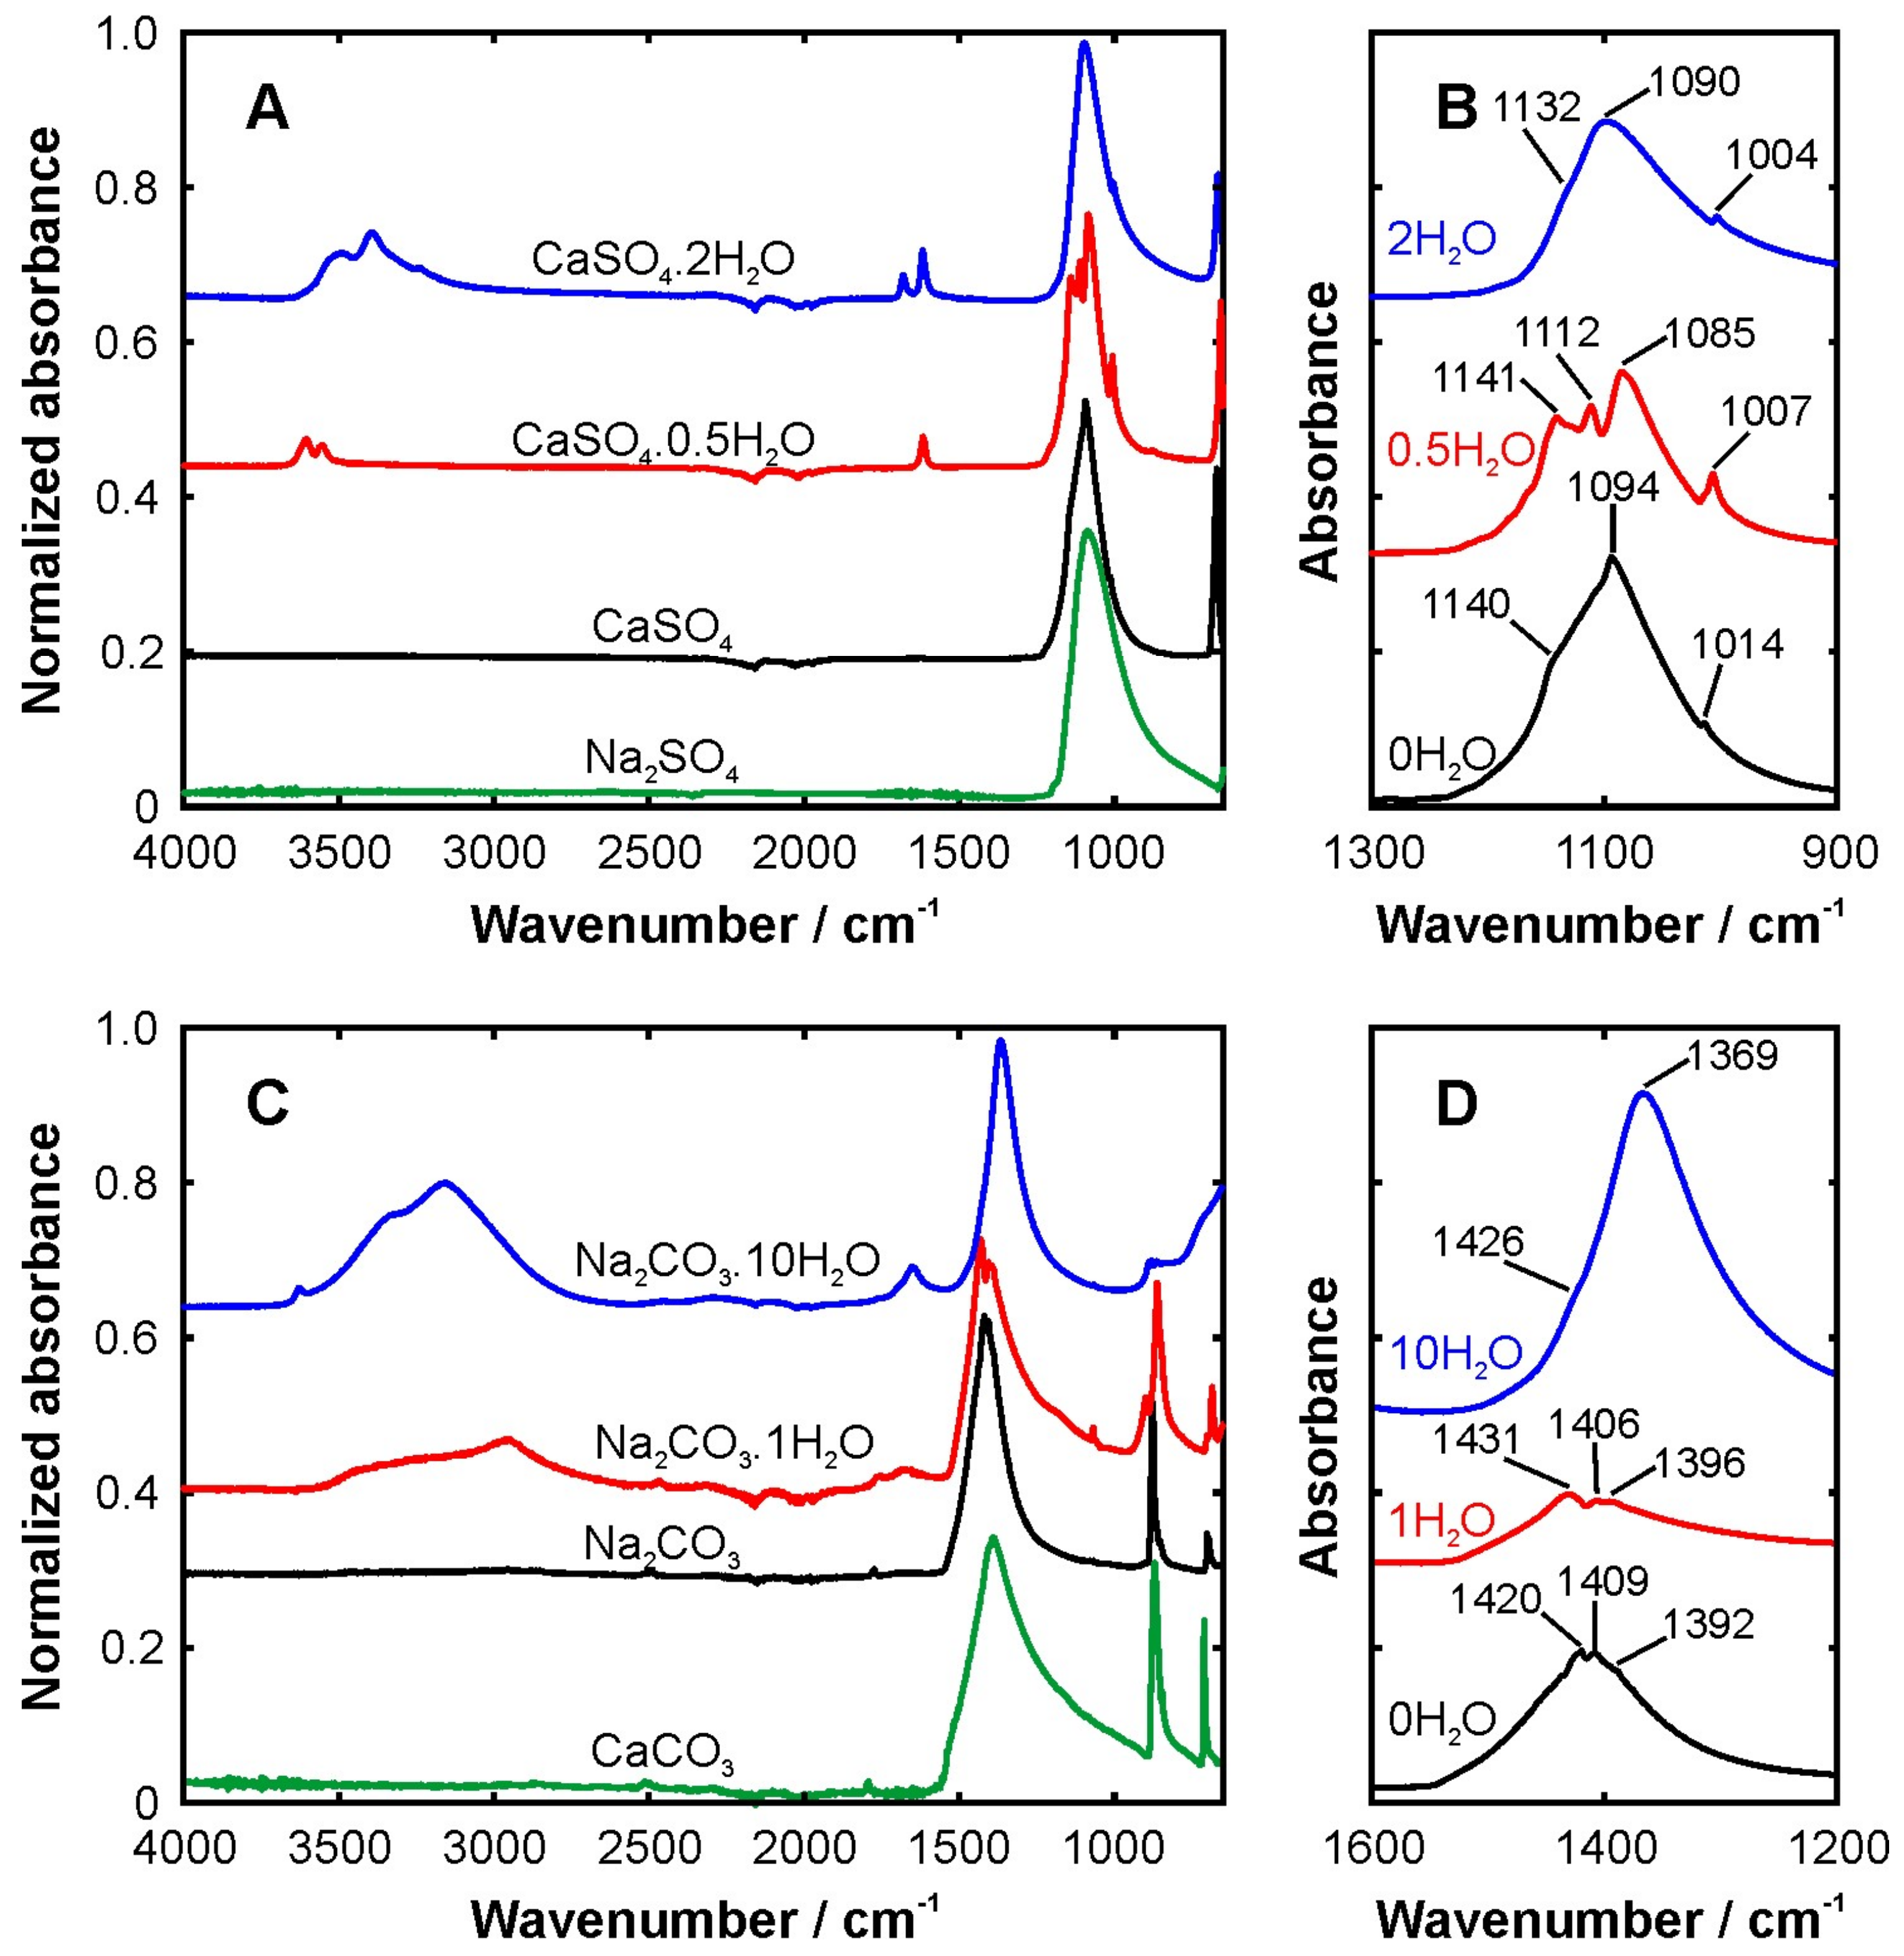
Four carbonates and four sulfates were analyzed. The resulting spectra are displayed in Figure 2. The data are normalized with respect to their maximum values for improved comparability. This normalization is also useful when spectra are recorded in practice, as it is difficult to ensure perfect reproducibility with powder samples. Figure 2A shows the sulfate salts. The sodium sulfate spectrum exhibits a single broad band peaking at 1085 cm−1, while the corresponding anhydrous calcium salt shows a broad peak at 1094 cm−1 and a sharp feature at 671 cm−1. The region around 1100 cm−1 is shown enlarged and without normalization in Figure 2B. This plot highlights the spectral complexity of this band, which obviously consists of multiple sub-peaks. They can be attributed to sulfate groups in different bonding states with their molecular neighborhood. The signal amplitude and peak area, on the other hand, remain rather constant.
The spectra of the water containing calcium sulfates have additional signatures due to the OH vibrations. In the region beyond 3000 cm−1, the OH stretching modes can be observed and the corresponding bending modes are present between 1600 and 1700 cm−1. A detailed discussion of the IR spectrum of water can be found in the literature, see e.g., references [17,18].
Figure 2C illustrates the FTIR spectra of the carbonate salts. The calcium carbonate spectrum exhibits a broad band peaking at 1390 cm−1 as well as sharp peaks at 871 and 712 cm−1. Similar spectral features can be found at 1420, 878, and 702 cm−1, respectively, for the corresponding anhydrous sodium salt. Panel D of Figure 2 shows the region around 1400 cm−1 enlarged and without normalization. From the presentation in panel C there seems to be a rather linear shift of the strong carbonate band with the number of water molecules. Panel D, however, reveals a rather complex behavior. Like for the sulfate band discussed above, the carbonate band exhibits a number of sub-peaks, which again correspond to different bonding states. The change in signal amplitude is another interesting feature. Compared to the anhydrous salt, the absorbance of the carbonate with 1 water is moderately reduced, while the absorbance of sodium carbonate with 10 H2O is significantly stronger. It needs to be kept in mind that this band is not caused by vibrations of water. However, the presence of larger amounts of water molecules in the crystal lattice seems to enhance the IR activity, which goes along with a change in the dipole moment of the carbonate groups.
Again, the presence of water molecules leads to additional bands due to OH stretching and bending vibrations. The spectral positions of the main peaks are summarized in Table 1. From the analysis of the reference materials we can conclude that FTIR spectroscopy is capable of distinguishing the different salts that are typically found in inorganic deposits in heat exchangers. For a detailed spectroscopic analysis and vibrational assignments, which is not the scope of the present work, we refer to the literature: calcium carbonate [19,20], calcium sulfate [21], sodium carbonate [22], and sodium sulfate [23].
3.2. Domestic Water Cooker
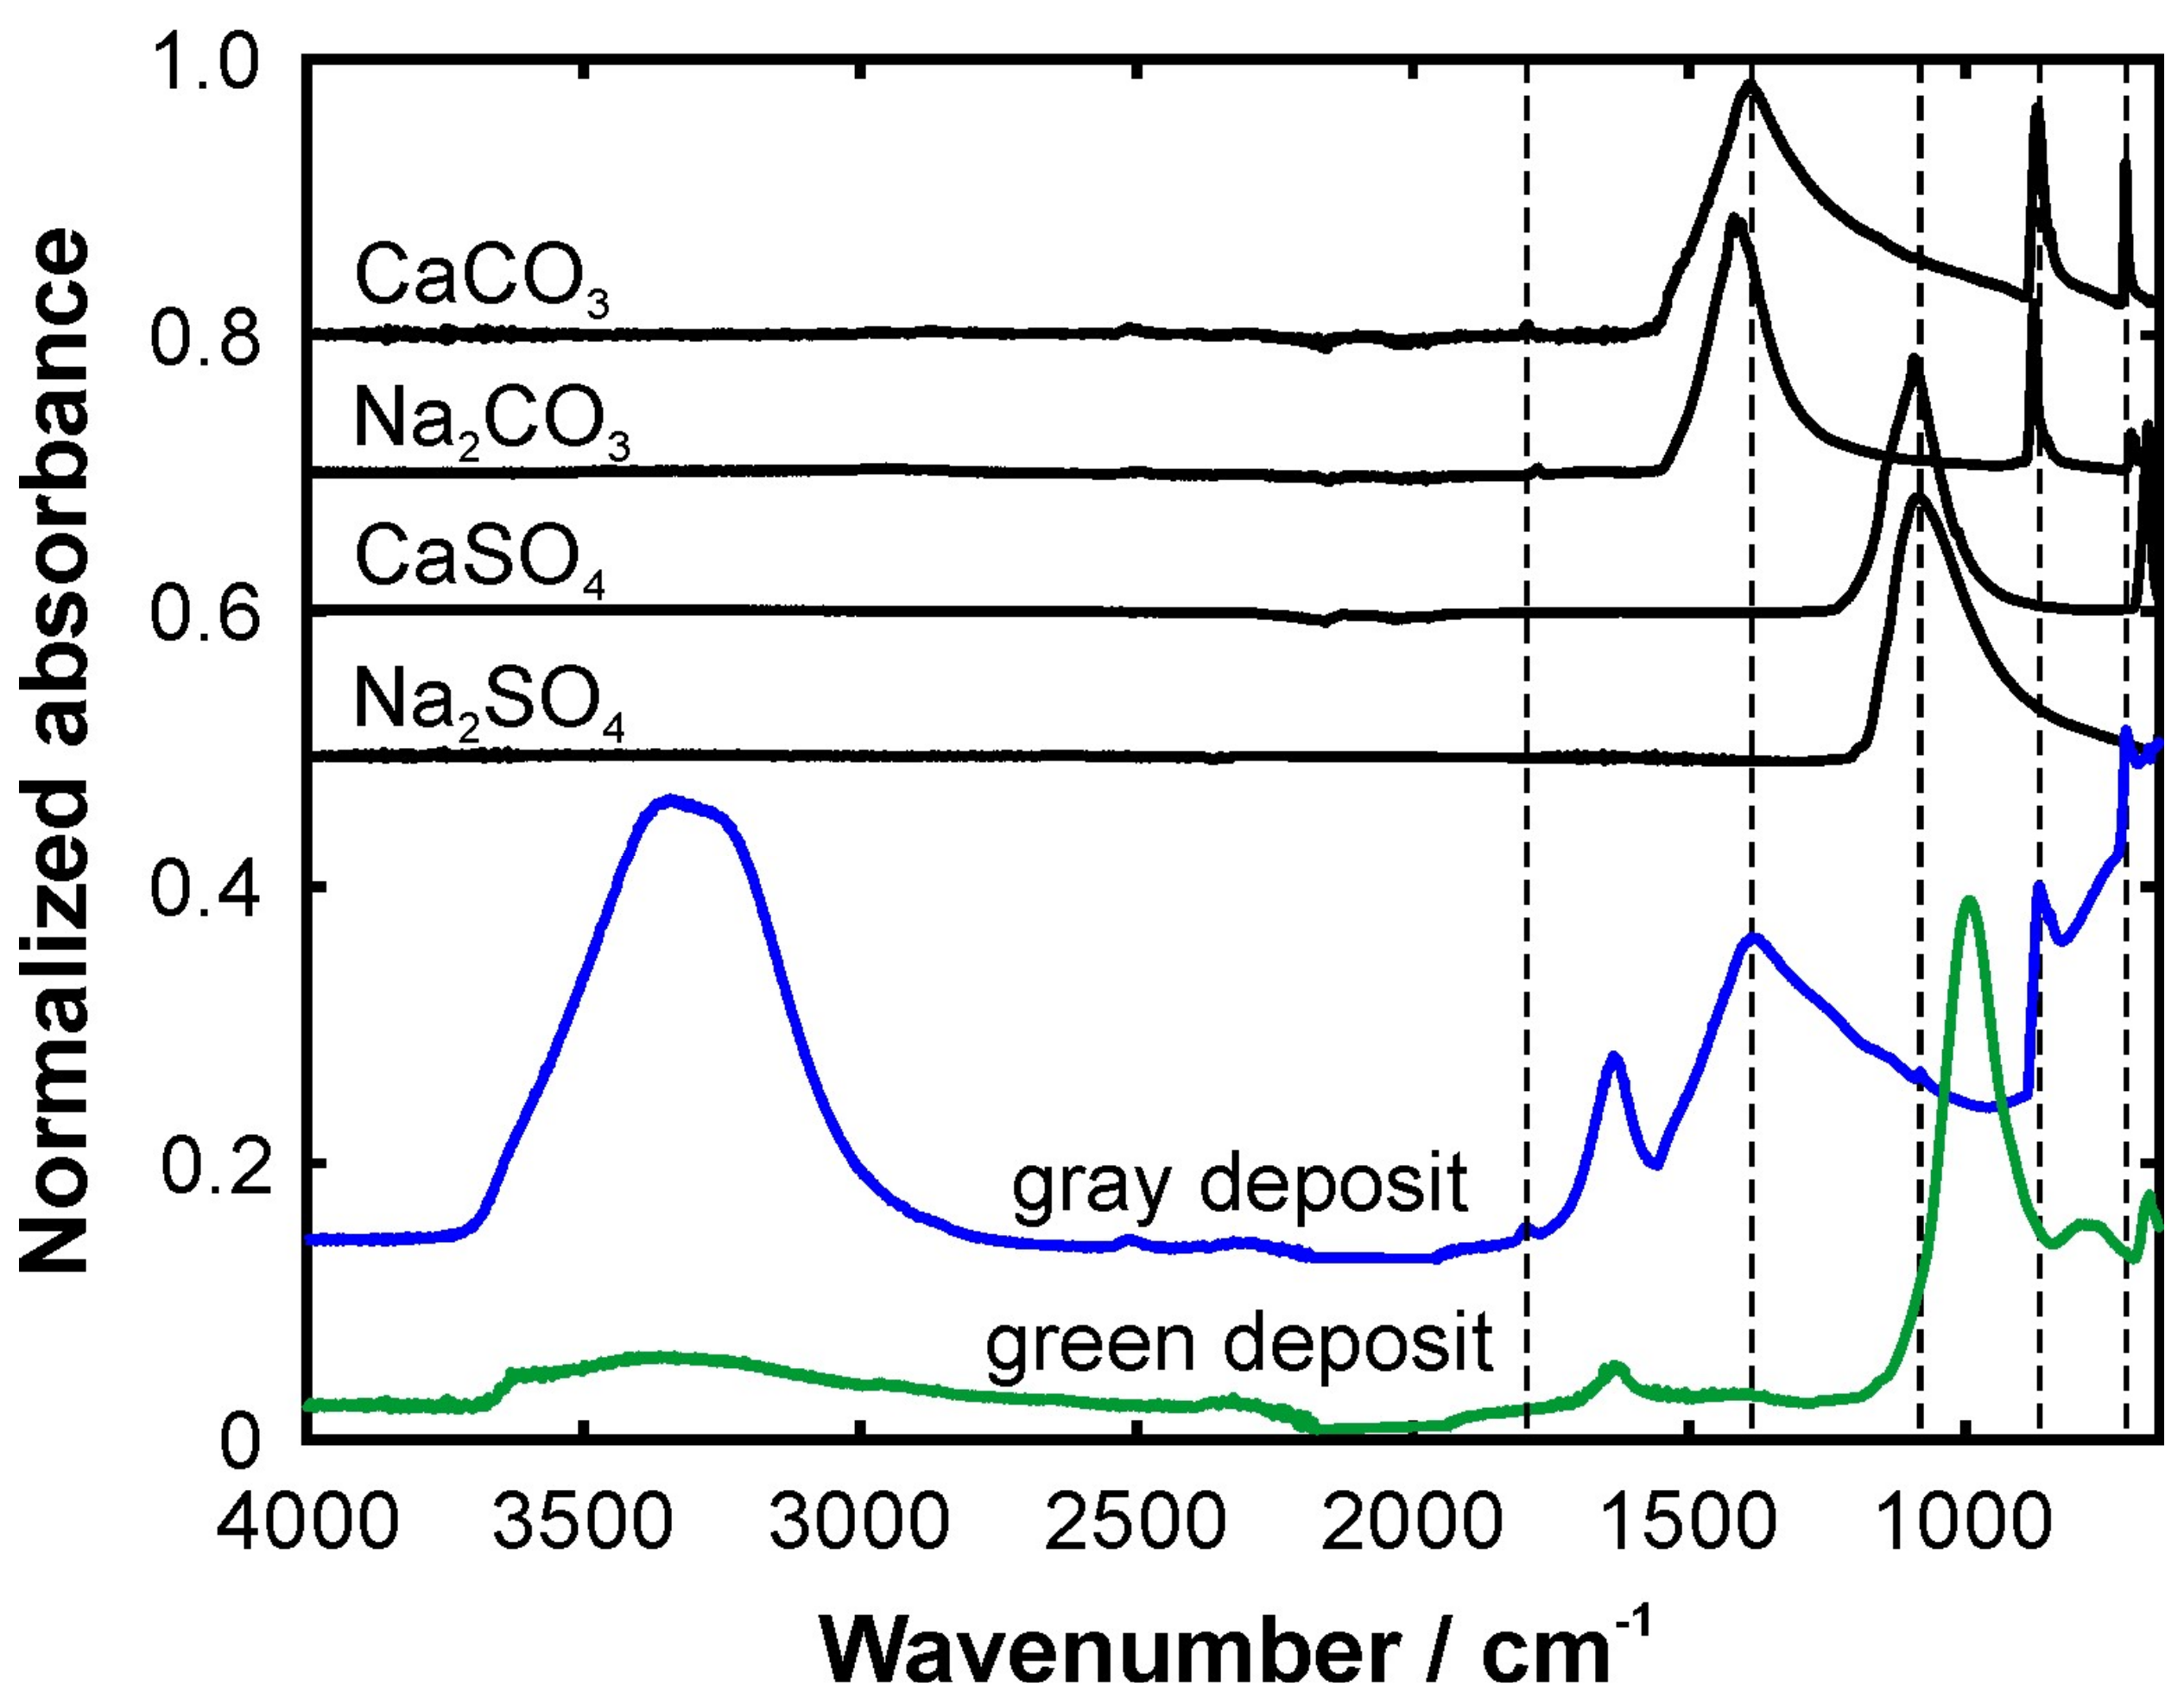
The FTIR spectra of the two different samples from the water cooker are shown in Figure 3 together with the spectra of the anhydrous reference materials. The green deposit exhibits bands at 671, 764, 791, 992, and 1633 cm−1 as well as a broad feature with rather low absorbance around 3400 cm−1. The latter two are a result of water residuals. The strong band at 992 cm−1, in particular, indicates that the major part of the sample consists of a sulfate salt. However, the peak is significantly shifted towards lower wavenumber compared to the sulfate reference materials. The green color of the sample suggests that the cation is copper. This speculation has been verified by the presence of characteristic copper lines (e.g., at 522 nm) in the laser-induced breakdown spectrum of the deposit. Hence, the green deposit likely contains copper sulfate. However, it should be noted that CuSO4 usually appears as a blue powder, while the green color observed is characteristic of hydrous copper chloride. Therefore, it can be concluded that the green deposit consists of a mixture of the chloride and sulfate salts of copper.
On the other hand, the spectrum of the gray deposit shows bands at 711, 868, 1084, 1388, 1637, 1794, and 3310 cm−1. This means a very good agreement with the reference spectrum of CaCO3. However, the small peak at 1084 cm−1 and the high absorbance between 650 and 700 cm−1 indicate the additional presence of a sulfate salt, most likely a mixture of calcium sulfates with different degrees of hydration. The solubility data of the salts corroborate these conclusions. The calcium salts hardly dissolve in water: a few mg/L for the carbonate and a few g/L for the sulfate. Therefore, it is reasonable that the main contribution to the gray deposit is calcium carbonate followed by calcium sulfate. The sodium carbonates and sulfates, on the other hand, exhibit significantly higher solubility (10–120 g/L); hence, they likely end up dissolved in the boiled water rather than precipitating and remaining in the boiler.
3.3. Seawater Desalination Plant
Figure 4 displays the FTIR spectrum of the deposit from the evaporator of the seawater desalination test rig. Distinct peaks can be found at 700, 713, 843, 852, 1083, 1140, 1441, 1637, and 1784 cm−1. Additionally, a broad band around 3400 cm−1 is observed as a result of OH stretching vibrations from water molecules. The overall spectrum indicates that the debris is a mix of different salts. For example, the peaks at 700, 852, 1441, and 1784 cm−1 are signs of sodium carbonate and calcium carbonate in their different hydration forms. The main constituent is calcium carbonate. The peaks at 713 and 1083 cm−1, on the other hand, show that there is also a small amount of a sulfate salt. The weak absorbance at wavenumbers below 700 cm−1 suggests that this is mainly sodium sulfate. The latter may have been deposited after the desalination process was stopped and the test rig was opened. At this point, the remaining water evaporated leaving small amounts of sodium salts on the tubes.
The deposits are identified as predominantly carbonate and sulfate salts, while the main constituent of seawater is sodium chloride. However, NaCl exhibits a very high solubility (on the order of several hundred g/L). Consequently, the sodium chloride remains dissolved and leaves the evaporator with the brine instead of depositing on the tubes.
4. Conclusions
In conclusion, we have demonstrated that FTIR spectroscopy is capable of analyzing the inorganic deposits from domestic and industrial heat exchangers, boilers, and evaporators. The measurements presented have been conducted ex situ using the attenuated total reflection (ATR) approach. This method is in principle suitable for in situ measurements as well, since ATR immersion probes are commercially available. In principle, such an ATR probe can even be deployed in the running apparatus. Another possibility to apply FTIR spectroscopy to the deposits on the surface directly inside the apparatus is to detect diffusely reflected IR radiation. This method is often referred to as diffuse reflectance Fourier-transform spectroscopy (DRIFTS). In such an arrangement, however, it must be kept in mind that the IR radiation has to travel a given distance through the atmosphere, where water vapor may lead to significant absorption and thus limit the sensitivity of the method. A solution to this problem can be to flush the apparatus with dry air or nitrogen after operation and before the analysis. Homonuclear diatomic molecules such as nitrogen and oxygen are not IR active and therefore do not absorb in the spectral range of interest. Flushing the apparatus and a subsequent IR analysis may still be advantageous over the existing standard approaches, for which disassembling the device and/or mechanically removing a sample is required.
Overall, FTIR spectroscopy is a very powerful tool for analyzing inorganic debris in heat exchangers. It allows both a qualitative analysis as well as quantitative measurements. For the latter, the data evaluation via multivariate techniques seems the most suitable option. The future activities in our lab will focus on this aspect in order to make FTIR spectroscopy a truly competitive tool for the comprehensive characterization of inorganic scale in heat and chemical engineering processes.
Acknowledgments
The authors thank Sabine Wagenfeld for technical assistance.
Author Contributions
Johannes Kiefer and Heike Glade conceived and designed the experiments; Alexander Stärk and Agnita Lynda Kiefer performed the experiments; Johannes Kiefer analyzed the data; all authors contributed to writing the manuscript with Johannes Kiefer preparing the first draft.
Conflicts of Interest
The authors declare no conflict of interest.
References
- Zhu, L.; Granda, C.B.; Holtzapple, M.T. Prevention of calcium sulfate formation in seawater desalination by ion exchange. Desalin. Water Treat. 2011, 36, 57–64. [Google Scholar] [CrossRef]
- Koutsoukos, P.G.; Kofina, A.N.; Kanellopoulou, D.G. Solubility of salts in water: Key issue for crystal growth and dissolution processes. Pure Appl. Chem. 2007, 79, 825–850. [Google Scholar] [CrossRef]
- Helalizadeh, A.; Müller-Steinhagen, H.; Jamialahmadi, M. Mixed salt crystallization fouling. Chem. Eng. Process. 2000, 39, 29–43. [Google Scholar] [CrossRef]
- Zhao, X.; Chen, X.D. A Critical Review of Basic Crystallography to Salt Crystallization Fouling in Heat Exchangers. Heat Transf. Eng. 2013, 34, 719–732. [Google Scholar] [CrossRef]
- Mayer, M.; Bucko, J.; Benzinger, W.; Dittmeyer, R.; Augustin, W.; Scholl, S. The impact of crystallization fouling on a microscale heat exchanger. Exp. Therm. Fluid Sci. 2012, 40, 126–131. [Google Scholar] [CrossRef]
- Bansal, B.; Müller-Steinhagen, H.; Chen, X.D. Comparison of crystallization fouling in plate and double-pipe heat exchangers. Heat Transf. Eng. 2001, 22, 13–25. [Google Scholar] [CrossRef]
- Helalizadeh, A.; Müller-Steinhagen, H.; Jamialahmadi, M. Application of fractal theory for characterisation of crystalline deposits. Chem. Eng. Sci. 2006, 61, 2069–2078. [Google Scholar] [CrossRef]
- Stärk, A.; Loisel, K.; Odiot, K.; Feßenbecker, A.; Kempter, A.; Nied, S.; Glade, H. Wetting behaviour of different tube materials and its influence on scale formation in multiple-effect distillers. Desalin. Water Treat. 2015, 55, 2502–2514. [Google Scholar] [CrossRef]
- Atchudan, R.; Lone, N.; Joo, J. Preparation of CaCO3 and CaO Nanoparticles via Solid-State Conversion of Calcium Oleate Precursor. J. Nanosci. Nanotechnol. 2018, 18, 1958–1964. [Google Scholar] [CrossRef] [PubMed]
- Pezzolo, A.D.; Valotto, G.; Quaranta, A. Carbonate and Silicate Abundance Indexing in Coarse-Grained River Sediments Using Diffuse Reflection Infrared Spectroscopy (DRIFTS) and Ion-Beam-Induced Luminescence (IBIL) Spectroscopies. Appl. Spectrosc. 2017, 71, 1222–1230. [Google Scholar] [CrossRef] [PubMed]
- Li, H.; Yang, Y.; Yang, S.; Chen, A.; Yang, D. Infrared Spectroscopic Study on the Modified Mechanism of Aluminum-Impregnated Bone Charcoal. J. Spectrosc. 2014, 2014, 671956. [Google Scholar] [CrossRef]
- Udvardi, B.; Kovacs, I.J.; Fancsik, T.; Konya, P.; Batori, M.; Stercel, F.; Falus, G.; Szalai, Z. Effects of Particle Size on the Attenuated Total Reflection Spectrum of Minerals. Appl. Spectrosc. 2017, 71, 1157–1168. [Google Scholar] [CrossRef] [PubMed]
- Kiefer, J.; Bartels, J.; Kroll, S.; Rezwan, K. Vibrational spectroscopy as a promising toolbox for analyzing functionalized ceramic membranes. Appl. Spectrosc. 2018. in print. [Google Scholar]
- Griffiths, P.R.; De Haseth, J.A. Fourier Transform Infrared Spectrometry, 2nd ed.; Wiley: Hoboken, NJ, USA, 2007. [Google Scholar]
- Kiefer, J.; Grabow, J.; Kurland, H.-D.; Müller, F.A. Characterization of Nanoparticles by Solvent Infrared Spectroscopy. Anal. Chem. 2015, 87, 12313–12317. [Google Scholar] [CrossRef] [PubMed]
- Kester, D.R.; Duedall, I.W.; Connors, D.N.; Pytkowicz, R.M. Preparation of artificial seawater. Limnol. Oceanogr. 1967, 12, 176–179. [Google Scholar] [CrossRef]
- Schmidt, D.A.; Miki, K. Structural correlations in liquid water: A new interpretation of IR spectroscopy. J. Phys. Chem. A 2007, 111, 10119–10122. [Google Scholar] [CrossRef] [PubMed]
- Kiefer, J.; Frank, K.; Schuchmann, H.P. Attenuated total reflection infrared (ATR-IR) spectroscopy of a water-in-oil emulsion. Appl. Spectrosc. 2011, 65, 1024–1028. [Google Scholar] [CrossRef] [PubMed]
- Xyla, A.G.; Koutsoukos, P.G. Quantitative analysis of calcium carbonate polymorphs by infrared spectroscopy. J. Chem. Soc. Faraday Trans. 1989, 85, 3165–3172. [Google Scholar] [CrossRef]
- Andersen, F.E.; Brecevic, L. Infrared spectra of amorphous and crystalline calcium carbonate. Acta Chem. Scand. 1991, 45, 1018–1024. [Google Scholar] [CrossRef]
- Bensted, J.; Prakash, S. Investigation of calcium sulphate—Water system by infrared spectroscopy. Nature 1968, 219, 60–61. [Google Scholar] [CrossRef]
- Joshi, S.; Kalyanasundaram, S.; Balasubramanian, V. Quantitative Analysis of Sodium Carbonate and Sodium Bicarbonate in Solid Mixtures Using Fourier Transform Infrared Spectroscopy (FT-IR). Appl. Spectrosc. 2013, 67, 841–845. [Google Scholar] [CrossRef] [PubMed]
- Gamo, I. Infrared absorption spectra of water of crystallization in sodium sulfate decahydrate crystals. Bull. Chem. Sci. Jpn. 1962, 35, 1058–1059. [Google Scholar] [CrossRef]
Figure 1.
Photographs of the deposits in the domestic water cooker (A) and on the tubes of the CuNi alloy tubes from the seawater desalination test rig (B). The arrows in panel A indicate the two different types of scale.
Figure 1.
Photographs of the deposits in the domestic water cooker (A) and on the tubes of the CuNi alloy tubes from the seawater desalination test rig (B). The arrows in panel A indicate the two different types of scale.

Figure 2.
Fourier-transform infrared (FTIR) spectra (650–4000 cm−1) of the pure reference materials. Panel (A) shows the different sulfates and panel (C) shows the different carbonates. In panel (B), the strong sulfate peak around 1100 cm−1 is shown enlarged and without amplitude normalization for the calcium salts. In panel (D), the strong carbonate peak around 1400 cm−1 is shown enlarged and without amplitude normalization for the sodium salts.

Figure 3.
FTIR spectra of the two different deposits from the water cooker in comparison with selected reference spectra. The dashed vertical lines are a guide to the eye.
Figure 3.
FTIR spectra of the two different deposits from the water cooker in comparison with selected reference spectra. The dashed vertical lines are a guide to the eye.

Figure 4.
FTIR spectrum of the deposit from the seawater desalination facility in comparison with selected reference spectra. The dashed vertical lines are a guide to the eye. The arrow at the enlarged part indicates the peak at 700 cm−1.
Figure 4.
FTIR spectrum of the deposit from the seawater desalination facility in comparison with selected reference spectra. The dashed vertical lines are a guide to the eye. The arrow at the enlarged part indicates the peak at 700 cm−1.


Table 1.
Characteristic peak positions in the Fourier-transform infrared (FTIR) spectra of the reference materials in cm−1.
Table 1.
Characteristic peak positions in the Fourier-transform infrared (FTIR) spectra of the reference materials in cm−1.
| Na2SO4 | CaSO4 | CaSO4·0.5 H2O | CaSO4·2 H2O | Na2CO3 | Na2CO3·1 H2O | Na2CO3·10 H2O | CaCO3 |
|---|---|---|---|---|---|---|---|
| 671 | 658 | 668 | 702 | 686 | 712 | ||
| 1007 | 878 | 862 | 866 | 871 | |||
| 1085 | 1094 | 1084 | 1098 | 1420 | 1431 | 1369 | 1390 |
| 1619 | 1620 | 1681 | 1655 | ||||
| 1682 | 1775 | 1763 | 1796 | ||||
| 3553 | 3393 | 2962 | 3164 | ||||
| 3603 | 3494 | 3630 |
© 2018 by the authors. Licensee MDPI, Basel, Switzerland. This article is an open access article distributed under the terms and conditions of the Creative Commons Attribution (CC BY) license (http://creativecommons.org/licenses/by/4.0/).
Share and Cite
MDPI and ACS Style
Kiefer, J.; Stärk, A.; Kiefer, A.L.; Glade, H. Infrared Spectroscopic Analysis of the Inorganic Deposits from Water in Domestic and Technical Heat Exchangers. Energies 2018, 11, 798. https://doi.org/10.3390/en11040798
AMA Style
Kiefer J, Stärk A, Kiefer AL, Glade H. Infrared Spectroscopic Analysis of the Inorganic Deposits from Water in Domestic and Technical Heat Exchangers. Energies. 2018; 11(4):798. https://doi.org/10.3390/en11040798
Chicago/Turabian StyleKiefer, Johannes, Alexander Stärk, Agnita Lynda Kiefer, and Heike Glade. 2018. "Infrared Spectroscopic Analysis of the Inorganic Deposits from Water in Domestic and Technical Heat Exchangers" Energies 11, no. 4: 798. https://doi.org/10.3390/en11040798
Note that from the first issue of 2016, this journal uses article numbers instead of page numbers. See further details here.